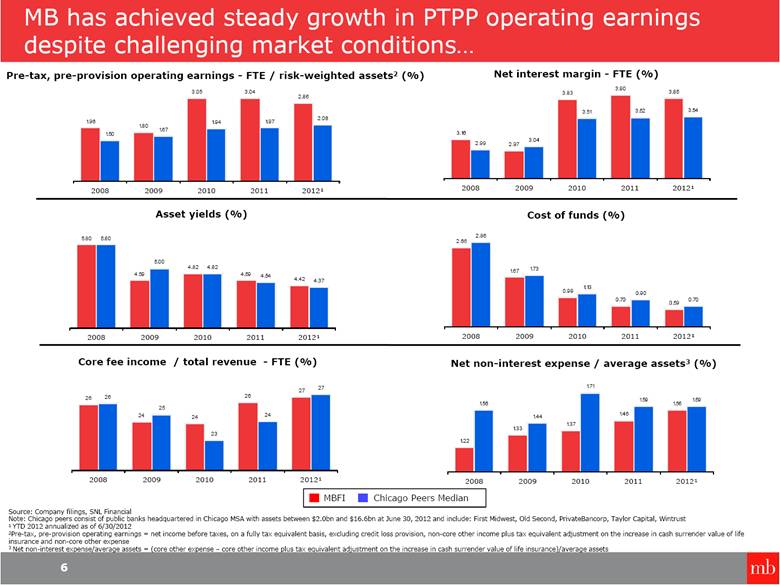
| Non-GAAP Disclosure Reconciliations (continued) 18 Pre-Tax, Pre-Provision Operating Earnings (in thousands) Three Months Six Months Ended Ended June 30, June 30, 2008 2009 2010 2011 2012 2012 (Loss) income before income taxes (7,830) $ (77,844) $ 20,552 $ 43,996 $ 31,177 $ 60,693 $ Provision for credit losses 125,721 231,800 246,200 120,750 - 3,100 Pre-tax, pre-provision earnings 117,891 153,956 266,752 164,746 31,177 63,793 Tax equivalent adjustment on tax-exempt interest income 9,890 10,625 10,458 13,188 5,057 9,813 2,853 1,324 1,893 2,357 468 962 Pre-tax, pre-provision earnings on a fully tax equivalent basis 130,634 165,905 279,103 180,291 36,702 74,568 Non-core other income Net gains (losses) on other real estate owned 455 (429) (9,284) (13,613) (5,441) (12,030) Net gains (losses) on securities available for sale 1,130 14,029 18,648 640 (34) (37) Net (loss) gain on sale of other assets (1,104) (13) 630 283 (8) (25) Net gain on sale of loans held for sale - - - 1,790 - - Acquisition related gains - 28,547 62,649 - - - (Decrease) increase in market value of assets held in trust for deferred compensation (1,657) 710 562 (40) (149) 352 Total non-core other income (1,176) 42,844 73,205 (10,940) (5,632) (11,740) Non-core other expense FDIC special assessment - 3,850 - - - - Impairment charges - 4,000 - 1,594 - - (Decrease) increase in market value of assets held in trust for deferred compensation (1,657) 710 562 (40) (149) 352 Total non-core other expense (1,657) 8,560 562 1,554 (149) 352 Pre-tax, pre-provision operating earnings 130,153 $ 131,621 $ 206,460 $ 192,785 $ 42,185 $ 86,660 $ Risk-weighted assets 6,649,603 $ 7,315,255 $ 6,772,762 $ 6,345,357 $ 6,096,732 $ 6,096,732 $ Annualized pre-tax, pre-provision operating earnings to risk-weighted assets 1.96% 1.80% 3.05% 3.04% 2.78% 2.86% Tax equivalent adjustment on the increase in cash surrender value of life insurance |