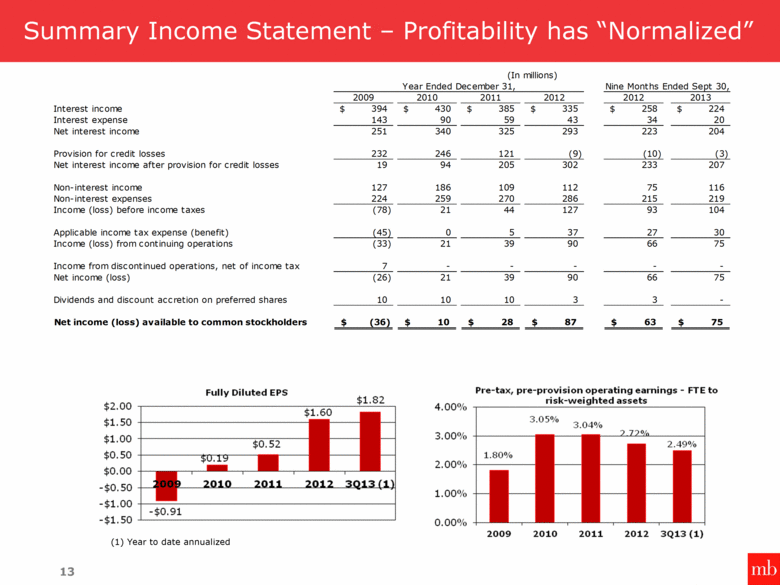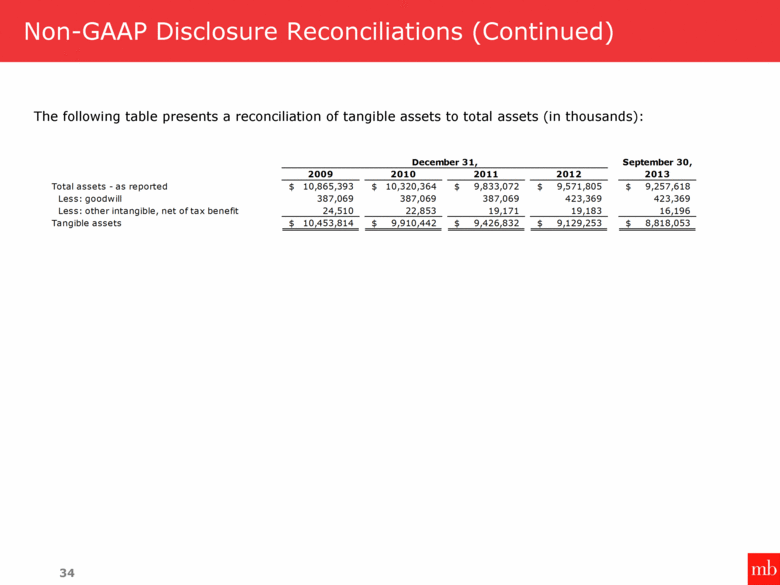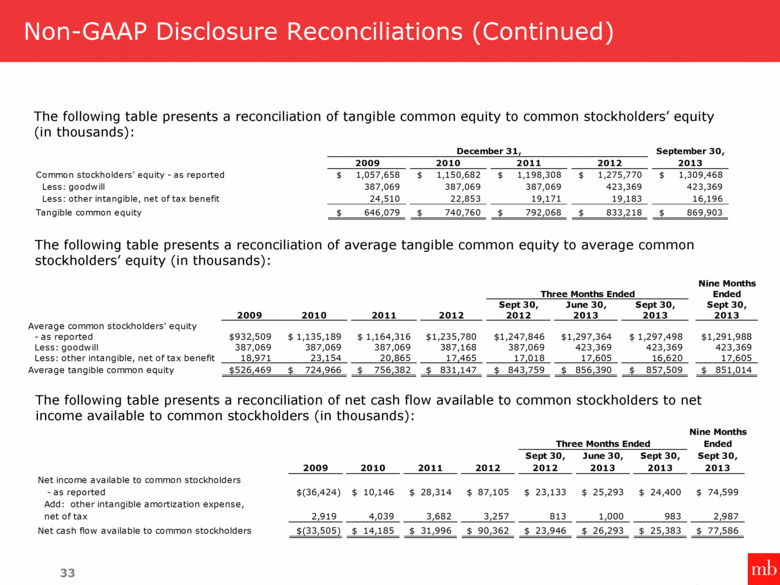
| Non-GAAP Disclosure Reconciliations (Continued) The following table presents a reconciliation of tangible common equity to common stockholders’ equity (in thousands): 33 The following table presents a reconciliation of average tangible common equity to average common stockholders’ equity (in thousands): The following table presents a reconciliation of net cash flow available to common stockholders to net income available to common stockholders (in thousands): $ 869,903 $ 833,218 $ 792,068 $ 740,760 $ 646,079 Tangible common equity 16,196 19,183 19,171 22,853 24,510 Less: other intangible, net of tax benefit 423,369 423,369 387,069 387,069 387,069 Less: goodwill $ 1,309,468 $ 1,275,770 $ 1,198,308 $ 1,150,682 $ 1,057,658 Common stockholders' equity - as reported 2013 2012 2011 2010 2009 September 30, December 31, $ 77,586 $ 25,383 $ 26,293 $ 23,946 $ 90,362 $ 31,996 $ 14,185 $ (33,505) Net cash flow available to common stockholders 2,987 983 1,000 813 3,257 3,682 4,039 2,919 net of tax Add: other intangible amortization expense, $ 74,599 $ 24,400 $ 25,293 $ 23,133 $ 87,105 $ 28,314 $ 10,146 $ (36,424) - as reported Net income available to common stockholders 2013 2013 2013 2012 2012 2011 2010 2009 Sept 30, Sept 30, June 30, Sept 30, Ended Three Months Ended Nine Months $ 851,014 $ 857,509 $ 856,390 $ 843,759 $ 831,147 $ 756,382 $ 724,966 $ 526,469 Average tangible common equity 17,605 16,620 17,605 17,018 17,465 20,865 23,154 18,971 Less: other intangible, net of tax benefit 423,369 423,369 423,369 387,069 387,168 387,069 387,069 387,069 Less: goodwill $1,291,988 $ 1,297,498 $ 1,297,364 $ 1,247,846 $1,235,780 $ 1,164,316 $ 1,135,189 $ 932,509 - as reported Average common stockholders' equity 2013 2013 2013 2012 2012 2011 2010 2009 Sept 30, Sept 30, June 30, Sept 30, Ended Three Months Ended Nine Months |