visit us: www.amundipioneer.com/us
Pioneer Global High Yield Fund | Annual Report | 10/31/20 1
President’s LetterDear Shareholders,
The new decade has arrived delivering a calendar year that will go down in the history books. The beginning of 2020 seemed to extend the positive market environment of 2019. Then, March roared in like a lion and the COVID-19 pandemic became a global crisis impacting lives and life as we know it. As the fourth quarter of 2020 got underway, it appeared that the long-anticipated “second wave” of COVID-19 cases was occurring, both in some U.S. states and in Europe. In response, some governments began retightening restrictions on both business and personal activities.
However, as the fourth quarter continued, we began to read some encouraging news on the vaccine front, as multiple pharmaceutical companies announced successful clinical trials for their COVID-19 vaccinations and applied for emergency-use approval for the drugs with the Food and Drug Administration. Government officials followed up on the positive news by announcing that deployment of at least one of the vaccines to frontline workers could begin even before the end of this calendar year, with the potential for widespread distribution by mid-2021.
While there may finally be a light visible at the end of the pandemic tunnel as 2020 comes to a close, the long-term impact on the global economy from COVID-19, while currently unknown, is likely to be considerable. It is clear that several industries have already felt greater effects than others, and the markets, which do not thrive on uncertainty, have been volatile, delivering significantly negative performance in the first quarter, and then recovering most of those losses throughout the following quarters. Despite the rebound, volatility has remained elevated, with momentum rising and falling on seemingly every bit of positive or negative news about the virus, from vaccines to spikes in the number of cases as well as rising hospitalization rates in some areas. In addition, the U.S. Presidential Election was in high gear as we entered the fourth quarter. This election contributed to the market volatility as investors pondered the possible outcomes and their potential effects on the economic outlook.
With the advent of COVID-19 last winter, we implemented our business continuity plan according to the new COVID-19 guidelines, and most of our employees have been working remotely since March. To date, our operating environment has faced no interruption. I am proud of the careful planning that has taken place and confident we can maintain this environment for as long as is prudent. History in the making for a company that first opened its doors way back in 1928.
2 Pioneer Global High Yield Fund | Annual Report | 10/31/20
Since 1928, Amundi’s investment process has been built on a foundation of fundamental research and active management, principles which have guided our investment decisions for more than 90 years. We believe active management – that is, making active investment decisions – can help mitigate the risks during periods of market volatility. As 2020 has reminded us, investment risk can arise from a number of factors in today’s global economy, including slower or stagnating growth, changing U.S. Federal Reserve policy, oil price shocks, political and geopolitical factors and, unfortunately, major public health concerns such as a viral pandemic.
At Amundi, active management begins with our own fundamental, bottom-up research process. Our team of dedicated research analysts and portfolio managers analyzes each security under consideration, communicating directly with the management teams of the companies issuing the securities and working together to identify those securities that best meet our investment criteria for our family of funds. Our risk management approach begins with each and every security, as we strive to carefully understand the potential opportunity, while considering any and all risk factors.
Today, as investors, we have many options. It is our view that active management can serve shareholders well, not only when markets are thriving, but also during periods of market stress.
As you consider your long-term investment goals, we encourage you to work with your financial professional to develop an investment plan that paves the way for you to pursue both your short-term and long-term goals.
We remain confident that the current crisis, like others in human history, will pass, and we greatly appreciate the trust you have placed in us and look forward to continuing to serve you in the future.
Sincerely,
Lisa M. Jones
Head of the Americas, President and CEO of U.S.
Amundi Pioneer Asset Management USA, Inc.
December 18, 2020
Any information in this shareowner report regarding market or economic trends or the factors influencing the Fund’s historical or future performance are statements of opinion as of the date of this report. Past performance is no guarantee of future results.
Pioneer Global High Yield Fund | Annual Report | 10/31/20 3
Portfolio Management Discussion |
10/31/20 In the following interview, Andrew Feltus, Ken Monaghan and Matt Shulkin discuss the factors that influenced the performance of Pioneer Global High Yield Fund during the 12-month period ended October 31, 2020. Mr. Feltus, Managing Director, Co-Director of High Yield, and a portfolio manager at Amundi Pioneer Asset Management, Inc. (Amundi)*, is responsible for the day-to-day management of the Fund, along with Mr. Monaghan, Managing Director, Co-Director of High Yield, and a portfolio manager at Amundi, and Mr. Shulkin, a senior vice president and a portfolio manager at Amundi.
Q How did the Fund perform during the 12-month period ended October 31, 2020?
A Pioneer Global High Yield Fund’s Class A shares returned -2.57% at net asset value during the 12-month period ended October 31, 2020, while the Fund’s benchmarks, the Bloomberg Barclays Global High Yield Index (the Bloomberg Barclays Index) and the ICE Bank of America (ICE BofA) U.S. High Yield Index, returned 2.15% and 2.54%, respectively. During the same period, the average return of the 677 mutual funds in Morningstar’s High Yield Bond Funds category was 1.43%.
Q Could you please describe the market environment for global high-yield investors during the 12-month period ended October 31, 2020?
A Entering the period in November of 2019, positive market sentiment prevailed, supported by an accommodative Federal Reserve (Fed), which had cut the target range of its benchmark overnight lending rate by a quarter-point at three successive meetings earlier in 2019. The investment backdrop for riskier assets received a further boost from news in December that the U.S. and China had moved towards a “phase one” trade deal, which the parties formally signed in January of 2020. The trade deal was accompanied by signs of accelerating growth in the major global economies, which provided further support to the markets.
However, beginning in mid-February of 2020, performance in the financial markets began to deteriorate, driven by the effects of the COVID-19 virus, which originated in China, but quickly became a global pandemic. Economies around the world ground to a near halt during March, as public health concerns led to the rapid implementation by governments and businesses of extreme lockdown measures focused on virus containment. In addition, oil prices plummeted to 20-year lows,
* See Notes to Financial Statements Note 8.
4 Pioneer Global High Yield Fund | Annual Report | 10/31/20
responding to slumping global demand resulting from the spread of COVID-19, as well as a supply shock spurred by a price war between Saudi Arabia and Russia.
In the financial markets, uncertainty over the scope and duration of the pandemic crisis as well as investors’ need for cash drove wholesale liquidations across most asset classes and a flight-to-safety trade that drove U.S. Treasury yields to historic lows. Significant selling in U.S. dollar (USD) fixed-income markets eventually stressed market functionality and led to price dislocations in all segments, even Treasury bonds. Performance of U.S. high-yield bonds declined sharply, as the outlook shifted from growth to recession, and investors anticipated the high-yield default rate moving well into double digits. The European high-yield market sold off strongly, despite that market’s overall higher-quality profile and lower exposure to energy credits. In the emerging markets, high-yield corporates declined significantly, although valuations in Latin America were already depressed prior to the COVID-19 crisis. Emerging markets sovereign debt experienced steep declines as well, particularly energy-linked issues and issues in less developed, less liquid markets.
The unprecedented shutting down of much of the economy due to COVID-19 spurred extraordinary monetary and fiscal policy responses. The Fed jumped into action by dusting off its 2008/2009 policy “playbook” and rapidly rolling out a raft of programs aimed at restoring market liquidity, facilitating credit availability, and bolstering investors’ confidence. The measures included reducing the benchmark federal funds rate target range to near zero and committing to a broad range of fixed-income asset purchases. The Fed also entered uncharted waters with the announcement on March 23 of purchasing programs in support of corporate bonds in both the new-issue and secondary markets. On the fiscal side, Congress and the White House agreed upon a $2.2 trillion stimulus bill at the end of March, and then provided further support a few weeks later with another package worth nearly $500 billion, including aid to small businesses. In Europe, national governments launched wage-support programs and began working on a European Union-wide recovery plan. Meanwhile, the Chinese economy continued to bounce back from the pandemic situation, with the country’s central bank providing credit to support the rebound.
The result of the unprecedented scope and speed of the responses from policymakers was a rebound in the markets for riskier assets, including global high-yield corporates, over the second quarter of 2020, and a
Pioneer Global High Yield Fund | Annual Report | 10/31/20 5
subsequent stabilization in valuations. Over the last few months of the 12-month period, uncertainties over the November U.S. election, renewed tensions over the Brexit deal in the United Kingdom, and the continued spread of COVID-19 affected the markets, but continued support from central banks and progress towards a possible vaccine for the virus offset those concerns and caused credit spreads within the high-yield market to grind tighter. (Credit spreads are commonly defined as the differences in yield between Treasuries and other types of fixed-income securities with similar maturities.)
Q What were the principal factors that influenced the Fund’s performance relative to its benchmark over the 12-month period ended October 31, 2020?
A The Fund’s asset allocations, security selection results, and interest-rate positioning detracted from relative performance over the 12-month period. In broad terms, entering the period, we had positioned the Fund with the aim of potentially benefiting from continued U.S. consumer strength, given generally sound household balance sheets against a backdrop of nearly full employment and rising wages. That stance worked out well for the Fund early in the period but ultimately weighed on performance over the full 12 months as the COVID-19 crisis began shuttering the global economy.
In terms of credit quality, the portfolio’s underweight versus the benchmark to higher-quality issues in the “BB” ratings range of the high-yield market acted as a constraint on the Fund’s relative performance, as that segment held up better than other ratings tiers during the 12-month period. In sector terms, an overweight to energy issues had a negative effect on relative returns, as energy credits struggled more than the rest of the market during the 12-month period, given the severe weakness in oil prices.
When the COVID-19-related lockdowns started, sectors with higher levels of exposure to consumer activity suffered the most, including energy, restaurants, casinos, leisure, and travel, with other downstream sectors, such as aircraft lessors, also feeling the negative effects. Some sectors, such as food & drug retailers, were relatively insulated from the crisis and performed well. The Fund’s exposures to the sectors more affected by the pandemic crisis led to relative underperformance in March and April, with much, though not all, recaptured in subsequent months.
Individual positions that lagged and detracted from the Fund’s benchmark-relative returns during the 12-month period included AMC Entertainment, Transocean, Chesapeake Energy, and LATAM. AMC
6 Pioneer Global High Yield Fund | Annual Report | 10/31/20
Entertainment, one of the world’s largest theater chains, suffered from plunging movie attendance in the wake of the COVID-19 lockdowns. Transocean, an ultra-deep oil driller, struggled during the 12-month period due to low equipment-rental rates and falling utilization. Chesapeake Energy, the U.S. gas-focused exploration-and-production company, filed for bankruptcy protection in June, while South American airline LATAM filed for bankruptcy protection in May.
Leading positive contributors to the Fund’s performance relative to the benchmark during the 12-month period included a lack of portfolio exposure to issues from Ecuador and Lebanon, both of which underperformed. In Ecuador, economic fallout from the COVID-19 crisis, including declining oil prices, led to a large drop in economic output, which resulted in a debt restructuring. Lebanon defaulted on its debt in February, leading to a restructuring of its bonds as well. The Fund’s holdings of wireless company Sprint contributed strongly to relative performance, as T-Mobile’s acquisition of the company closed in early 2020. (T-Mobile is not a Fund holding.) Positions in Freedom Mortgage also performed well for the Fund during the 12-month period, as high levels of mortgage originations driven by low interest rates enhanced the company’s profitability.
Q Did the Fund have any exposure to derivatives during the 12-month period ended October 31, 2020? If so, did the use of derivatives have an effect on the Fund’s performance?
A Yes, we invested the Fund in some index-based credit-default swaps in an attempt to manage the portfolio’s exposure to the high-yield corporate sector during periods of asset flows into or out of the Fund. The investments performed essentially in line with the high-yield market over the 12-month period. We also utilized forward foreign currency contracts (currency forwards) and foreign exchange options during the period. Those investments had a negative effect on the Fund’s returns as the euro gained ground versus the USD over the 12 months.
Q Did the Fund’s distributions** to shareholders change during the 12-month period ended October 31, 2020?
A The Fund’s distributions remained relatively stable during the 12-month period, despite volatility in both Treasury yields and credit spreads.
** Distributions are not guaranteed.
Pioneer Global High Yield Fund | Annual Report | 10/31/20 7
Q What is your investment outlook?
A Global economic activity rebounded during the third quarter. Although we would expect continued or renewed COVID-19-related shutdowns to slow the pace of the recovery on a localized basis during the fourth quarter, we view the general trajectory of economic activity to be positive. History has typically shown that expansions have tended to be self-sustaining, unless derailed by an exogenous shock. While another injection of fiscal stimulus from governments could accelerate economic activity, we anticipate that growth may continue even without additional help, as personal savings balances have remained above historical norms. Although a continued increase in COVID-19 infections seems likely to occur during the winter months, we do not expect that sustained, widespread lockdowns will be necessary, given improved treatment methods.
We appreciate the near-term risks arising from U.S. political uncertainty, particularly with control of the U.S. Senate still to be determined in Georgia’s run-off elections in January; a seasonal increase in COVID-19 infections; and an unexpected delay in the approval and deployment of a vaccine (or vaccines) for the virus. At the same time, we have framed those risks against asset-class spreads that, as of period-end, had generally resided above the levels seen at the beginning of 2020, which we believe leaves room for future spread tightening. In addition, we believe the medium-term fundamental outlook has remained positive, given continued improvement in COVID-19 treatments, the possibility for vaccine approvals sooner than originally expected, and accommodative financial conditions that seem unlikely to be reversed by tighter monetary policy.
With high-yield corporate spreads above their long-term average, we believe investors have been receiving fair compensation for taking on added credit risk. While default rates could remain elevated over the near term, any improvement as we enter 2021 could support further spread tightening. Historically, spread tightening has begun well before the default rate has peaked. In the meantime, we believe the below-investment-grade market may continue to benefit from investors’ search for better yields.
On a regional basis, we see COVID-19 exerting increased pressure on high-yield sovereigns, particularly the debt of lower-rated nations with higher commodity exposure. As a result, we have been very selective regarding the Fund’s sovereign-debt investments, which has resulted in an underweight versus the benchmark. Our cautious outlook for emerging
8 Pioneer Global High Yield Fund | Annual Report | 10/31/20
markets extends to high-yield corporates. While we view European issues in the “BB” quality range as expensive compared to BB-rated U.S. issues, we have found value in B-rated European issues. On a currency basis, we have become more constructive on the euro and hence have reduced the Fund’s benchmark-relative underweight.
In response to the new economic environment, we have categorized all of the Fund’s holdings based on their relative exposure to the COVID-19 crisis. Sectors we view as “unimpaired” are those that have experienced minimal negative effects from the crisis, such as food and drug retailers. The “wounded” category includes companies that have experienced temporary disruptions due to COVID-19, but that we believe have good long-term business models, such as ambulatory surgery centers. In the “impaired” category are sectors where we expect to see lasting negative effects caused by the pandemic, such as movie theaters. We have found most unimpaired bonds to be expensive, and so we are interested in purchasing the debt of only the strongest issuers within the impaired sectors noted above.
We believe the Fund has the potential to generate the most alpha (incremental performance) within the wounded sectors, where diligent research could help us to identify the potential “survivors” once the COVID-19 situation has largely abated, whenever that may occur.
Please refer to the Schedule of Investments on pages 18–39 for a full listing of Fund securities.
All investments are subject to risk, including the possible loss of principal. In the past several years, financial markets have experienced increased volatility and heightened uncertainty. The market prices of securities may go up or down, sometimes rapidly or unpredictably, due to general market conditions, such as real or perceived adverse economic, political, or regulatory conditions, recessions, inflation, changes in interest or currency rates, lack of liquidity in the bond markets, the spread of infectious illness or other public health issues or adverse investor sentiment. These conditions may continue, recur, worsen or spread.
Investments in high-yield or lower-rated securities are subject to greater-than-average price volatility, illiquidity and possibility of default.
When interest rates rise, the prices of fixed-income securities held by the Fund will generally fall. Conversely, when interest rates fall, the prices of fixed-income securities held by the Fund will generally rise.
Investments in the Fund are subject to possible loss due to the financial failure of issuers of underlying securities and their inability to meet their debt obligations.
Pioneer Global High Yield Fund | Annual Report | 10/31/20 9
Investing in foreign and/or emerging markets securities involves risks relating to interest rates, currency exchange rates, and economic and political conditions.
Prepayment risk is the chance that an issuer may exercise its right to repay its security, if falling interest rates prompt the issuer to do so. Forced to reinvest the unanticipated proceeds at lower interest rates, the Fund would experience a decline in income and lose the opportunity for additional price appreciation.
The Fund may invest in mortgage-backed securities, which during times of fluctuating interest rates may increase or decrease more than other fixed-income securities. Mortgage-backed securities are also subject to pre-payments.
The Fund may use derivatives, such as options, futures, inverse floating rate obligations, swaps, and others, which can be illiquid, may disproportionately increase losses, and have a potentially large impact on Fund performance. Derivatives may have a leveraging effect on the Fund.
At times, the Fund’s investments may represent industries or industry sectors that are interrelated or have common risks, making the Fund more susceptible to any economic, political, or regulatory developments or other risks affecting those industries and sectors.
These risks may increase share price volatility.
Before investing, consider the product’s investment objectives, risks, charges and expenses. Contact your advisor or Amundi for a prospectus or summary prospectus containing this information. Read it carefully.
Any information in this shareholder report regarding market or economic trends or the factors influencing the Fund’s historical or future performance are statements of opinion as of the date of this report. Past performance is no guarantee of future results.
10 Pioneer Global High Yield Fund | Annual Report | 10/31/20
Portfolio Summary |
10/31/20
| | | |
| 10 Largest Holdings | |
(As a percentage of total investments)* | |
| 1. | U.S. Treasury Bills, 11/17/20 | 3.80% |
| 2. | Ford Motor Credit Co. LLC, 4.125%, 8/17/27 | 1.19 |
| 3. | Garda World Security Corp., 9.5%, 11/1/27 (144A) | 1.17 |
| 4. | Metinvest BV, 7.75%, 10/17/29 (144A) | 0.98 |
| 5. | MDC Partners, Inc., 6.5%, 5/1/24 (144A) | 0.95 |
| 6. | Kenbourne Invest SA, 6.875%, 11/26/24 (144A) | 0.90 |
| 7. | Teva Pharmaceutical Finance Netherlands II BV, 1.625%, 10/15/28 | 0.81 |
| 8. | PowerTeam Services LLC, 9.033%, 12/4/25 (144A) | 0.80 |
| 9. | Minerva Luxembourg SA, 5.875%, 1/19/28 (144A) | 0.80 |
| 10. | Avantor Funding, Inc., 2.625%, 11/1/25 (144A) | 0.80 |
* | Excludes temporary cash investments and all derivative contracts except for options purchased. The Fund is actively managed, and current holdings may be different. The holdings listed should not be considered recommendations to buy or sell any securities. |
Pioneer Global High Yield Fund | Annual Report | 10/31/20 11
Prices and Distributions |
10/31/20 Net Asset Value per Share
| Class | | 10/31/20 | | 10/31/19 |
A | | $7.88 | | $8.57 |
C | | $7.87 | | $8.55 |
Y | | $7.73 | | $8.41 |
| Distributions per Share: 11/1/19–10/31/20 | |
|
| Net Investment | Short-Term | Long-Term | Tax Return |
| Class | Income | Capital Gains | Capital Gains | of Capital |
A | $0.4357 | $ — | $ — | $0.0245 |
C | $0.3594 | $ — | $ — | $0.0245 |
| Y | $0.4465 | $ — | $ — | $0.0245 |
Index Definitions
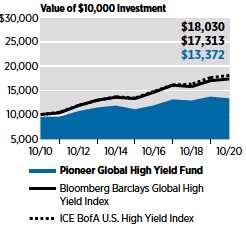
The Bloomberg Barclays Global High Yield Index is an unmanaged index that provides a broad-based measure of the global high-yield fixed-income markets. The index represents the union of the Barclays U.S. High-Yield, Barclays Pan-European High-Yield, Barclays U.S. Emerging Markets High-Yield, and Barclays Pan-European Emerging Markets High-Yield Indices. The ICE BofA U.S. High Yield Index is an unmanaged, commonly accepted measure of the performance of high-yield securities. Index returns are calculated monthly, assume reinvestment of dividends and, unlike Fund returns, do not reflect any fees, expenses or sales charges. It is not possible to invest directly in an index.
The indices defined here pertain to the “Value of $10,000 Investment” and “Value of $5 Million Investment” charts appearing on pages 13–15.
12 Pioneer Global High Yield Fund | Annual Report | 10/31/20
| | |
Performance Update | 10/31/20 | Class A Shares |
Investment Returns
The mountain chart on the right shows the change in value of a $10,000 investment made in Class A shares of Pioneer Global High Yield Fund at public offering price during the periods shown, compared to that of the Bloomberg Barclays Global High Yield Index and the ICE Bank of America (BofA) U.S. High Yield Index.
| | | | | |
| Average Annual Total Returns | |
(As of October 31, 2020) | | |
| | | BBG | ICE |
| | | Barclays | BofA
|
| Net | Public | Global | U.S. |
| Asset | Offering | High
| High |
| Value | Price | Yield | Yield |
| Period | (NAV) | (POP) | Index | Index |
10 years
| 3.42%
| 2.95% | 5.64% | 6.07% |
5 years | 3.75 | 2.80 | 5.47 | 6.14 |
1 year | -2.57 | -6.96 | 2.15 | 2.54 |
|
| Expense Ratio | | | |
(Per prospectus dated March 1, 2020) |
| Gross | | Net | | |
1.26% | | 1.14% | | |
Call 1-800-225-6292 or visit www.amundipioneer.com/us for the most recent month-end performance results. Current performance may be lower or higher than the performance data quoted.
The performance data quoted represents past performance, which is no guarantee of future results. Investment return and principal value will fluctuate, and shares, when redeemed, may be worth more or less than their original cost.
NAV results represent the percent change in net asset value per share. POP returns reflect deduction of maximum 4.50% sales charge. NAV returns would have been lower had sales charge been reflected. All results are historical and assume the reinvestment of dividends and capital gains. Other share classes are available for which performance and expenses will differ.
Performance results reflect any applicable expense waivers in effect during the periods shown. Without such waivers Fund performance would be lower. Waivers may not be in effect for all funds. Certain fee waivers are contractual through a specified period. Otherwise, fee waivers can be rescinded at any time. See the prospectus and financial statements for more information.
The net expense ratio reflects the contractual expense limitation in effect through March 1, 2021, for Class A shares. There can be no assurance that Amundi will extend the expense limitation beyond such time. Please see the prospectus and financial statements for more information.
The performance table and graph do not reflect the deduction of fees and taxes that a shareowner would pay on Fund distributions or the redemption of Fund shares.
Please refer to the financial highlights for more current expense ratios.
Pioneer Global High Yield Fund | Annual Report | 10/31/20 13
| | |
Performance Update | 10/31/20 | Class C Shares |
Investment Returns
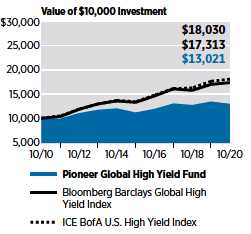
The mountain chart on the right shows the change in value of a $10,000 investment made in Class C shares of Pioneer Global High Yield Fund during the periods shown, compared to that of the Bloomberg Barclays Global High Yield Index and the ICE Bank of America (BofA) U.S. High Yield Index.
| | | | | |
| Average Annual Total Returns | |
(As of October 31, 2020) | | |
| | | BBG | ICE |
| | | Barclays | BofA
|
| | | Global | U.S. |
| | | High | High |
| If | If | Yield | Yield |
| Period | Held | Redeemed
| Index | Index |
10 years | 2.68% | 2.68% | 5.64% | 6.07% |
5 years | 2.98 | 2.98 | 5.47 | 6.14 |
1 year | -3.39 | -3.39 | 2.15 | 2.54 |
|
| Expense Ratio | | | |
(Per prospectus dated March 1, 2020) |
| Gross | | | | |
1.97% | | | | |
Call 1-800-225-6292 or visit www.amundipioneer.com/us for the most recent month-end performance results. Current performance may be lower or higher than the performance data quoted.
The performance data quoted represents past performance, which is no guarantee of future results. Investment return and principal value will fluctuate, and shares, when redeemed, may be worth more or less than their original cost.
Class C shares held for less than one year are also subject to a 1% contingent deferred sales charge (CDSC). “If Held” results represent the percent change in net asset value per share. NAV returns would have been lower had sales charges been reflected. All results are historical and assume the reinvestment of dividends and capital gains. Other share classes are available for which performance and expenses will differ.
Performance results reflect any applicable expense waivers in effect during the periods shown. Without such waivers Fund performance would be lower. Waivers may not be in effect for all funds. Certain fee waivers are contractual through a specified period. Otherwise, fee waivers can be rescinded at any time. See the prospectus and financial statements for more information.
The performance table and graph do not reflect the deduction of fees and taxes that a shareowner would pay on Fund distributions or the redemption of Fund shares.
Please refer to the financial highlights for more current expense ratios.
14 Pioneer Global High Yield Fund | Annual Report | 10/31/20
| | |
Performance Update | 10/31/20 | Class Y Shares |
Investment Returns
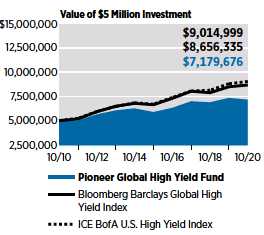
The mountain chart on the right shows the change in value of a $5 million investment made in Class Y shares of Pioneer Global High Yield Fund during the periods shown, compared to that of the Bloomberg Barclays Global High Yield Index and the ICE Bank of America (BofA) U.S. High Yield Index.
| | | | |
| Average Annual Total Returns |
(As of October 31, 2020) | |
| | BBG | ICE |
| | Barclays | BofA
|
| Net | Global | U.S. |
| Asset | High | High |
| Value | Yield | Yield |
| Period | (NAV) | Index | Index |
10 years | 3.68% | 5.64% | 6.07% |
5 years | 3.99 | 5.47 | 6.14 |
1 year | -2.37 | 2.15 | 2.54 |
|
| Expense Ratio | | |
(Per prospectus dated March 1, 2020) |
| Gross | | Net | |
0.96% | | 0.90% | |
Call 1-800-225-6292 or visit www.amundipioneer.com/us for the most recent month-end performance results. Current performance may be lower or higher than the performance data quoted.
The performance data quoted represents past performance, which is no guarantee of future results. Investment return and principal value will fluctuate, and shares, when redeemed, may be worth more or less than their original cost.
Class Y shares are not subject to sales charges and are available for limited groups of eligible investors, including institutional investors. All results are historical and assume the reinvestment of dividends and capital gains. Other share classes are available for which performance and expenses will differ.
Performance results reflect any applicable expense waivers in effect during the periods shown. Without such waivers Fund performance would be lower. Waivers may not be in effect for all funds. Certain fee waivers are contractual through a specified period. Otherwise, fee waivers can be rescinded at any time. See the prospectus and financial statements for more information.
The net expense ratio reflects the contractual expense limitation in effect through March 1, 2021, for Class Y shares. There can be no assurance that Amundi will extend the expense limitation beyond such time. Please see the prospectus and financial statements for more information.
The performance table and graph do not reflect the deduction of fees and taxes that a shareowner would pay on Fund distributions or the redemption of Fund shares.
Please refer to the financial highlights for more current expense ratios.
Pioneer Global High Yield Fund | Annual Report | 10/31/20 15
Comparing Ongoing Fund Expenses
As a shareowner in the Fund, you incur two types of costs:
(1) | ongoing costs, including management fees, distribution and/or service (12b-1) fees, and other Fund expenses; and |
(2) | transaction costs, including sales charges (loads) on purchase payments. |
This example is intended to help you understand your ongoing expenses (in dollars) of investing in the Fund and to compare these costs with the ongoing costs of investing in other mutual funds. The example is based on an investment of $1,000 at the beginning of the Fund’s latest six-month period and held throughout the six months.
Using the Tables
Actual Expenses
The first table below provides information about actual account values and actual expenses. You may use the information in this table, together with the amount you invested, to estimate the expenses that you paid over the period as follows:
(1) | Divide your account value by $1,000 |
| Example: an $8,600 account value ÷ $1,000 = 8.6 |
(2) | Multiply the result in (1) above by the corresponding share class’s number in the third row under the heading entitled “Expenses Paid During Period” to estimate the expenses you paid on your account during this period. |
Expenses Paid on a $1,000 Investment in Pioneer Global High Yield Fund
Based on actual returns from May 1, 2020 through October 31, 2020.
| | | | |
| Share Class | A | C | Y |
Beginning Account | $1,000.00 | $1,000.00 | $1,000.00 |
Value on 5/1/20 | | | |
Ending Account Value (after expenses) | $1,154.11 | $1,149.16 | $1,154.70 |
on 10/31/20 | | | |
Expenses Paid | $6.17 | $10.91 | $4.87 |
During Period* | | | |
* | Expenses are equal to the Fund’s annualized expense ratio of 1.14%, 2.02%, and 0.90% for Class A, Class C and Class Y shares, respectively, multiplied by the average account value over the period, multiplied by 182/366 (to reflect the partial year period). |
16 Pioneer Global High Yield Fund | Annual Report | 10/31/20
Hypothetical Example for Comparison Purposes
The table below provides information about hypothetical account values and hypothetical expenses based on the Fund’s actual expense ratio and an assumed rate of return of 5% per year before expenses, which is not the Fund’s actual return. The hypothetical account values and expenses may not be used to estimate the actual ending account balance or expenses you paid for the period.
You may use this information to compare the ongoing costs of investing in the Fund and other funds. To do so, compare this 5% hypothetical example with the 5% hypothetical examples that appear in the shareholder reports of the other funds.
Please note that the expenses shown in the tables are meant to highlight your ongoing costs only and do not reflect any transaction costs, such as sales charges (loads) that are charged at the time of the transaction. Therefore, the table below is useful in comparing ongoing costs only and will not help you determine the relative total costs of owning different funds. In addition, if these transaction costs were included, your costs would have been higher.
Expenses Paid on a $1,000 Investment in Pioneer Global High Yield Fund
Based on a hypothetical 5% return per year before expenses, reflecting the period from May 1, 2020 through October 31, 2020.
| | | | |
| Share Class | A | C | Y |
Beginning Account | $1,000.00 | $1,000.00 | $1,000.00 |
Value on 5/1/20 | | | |
Ending Account Value (after expenses) | $1,019.41 | $1,014.98 | $1,020.61 |
on 10/31/20 | | | |
Expenses Paid | $5.79 | $10.23 | $4.57 |
During Period* | | | |
* | Expenses are equal to the Fund’s annualized expense ratio of 1.14%, 2.02%, and 0.90% for Class A, Class C and Class Y shares, respectively, multiplied by the average account value over the period, multiplied by 182/366 (to reflect the partial year period). |
Pioneer Global High Yield Fund | Annual Report | 10/31/20 17
Schedule of Investments | 10/31/20
| | | | | |
| | |
| | Shares | | | Value |
| | | | UNAFFILIATED ISSUERS — 95.7% | |
| |
| | COMMON STOCKS — 0.1% of Net Assets | |
| | | | Entertainment — 0.0%† | |
| | 4,925 | | AMC Entertainment Holdings, Inc. | $ 11,623 |
| | | | Total Entertainment | $ 11,623 |
| | | | Household Durables — 0.0%† | |
| | 1,443,476(a) | | Desarrolladora Homex SAB de CV | $ 3,058 |
| | | | Total Household Durables | $ 3,058 |
| | | | Oil, Gas & Consumable Fuels — 0.1% | |
| | 25 | | Amplify Energy Corp. | $ 16 |
| | 5,735,146+^(a) | | Ascent CNR Corp. | 172,055 |
| | | | Total Oil, Gas & Consumable Fuels | $ 172,071 |
| | | | Paper & Forest Products — 0.0%† | |
| | 459,481(a) | | Emerald Plantation Holdings, Ltd. | $ 18,839 |
| | | | Total Paper & Forest Products | $ 18,839 |
| | | | TOTAL COMMON STOCKS | |
| | | | (Cost $726,730) | $ 205,591 |
| | |
| | Principal | | | |
| | Amount | | | |
| | USD ($) | | | |
| | | | ASSET BACKED SECURITY — 0.2% | |
| | | | of Net Assets | |
| | 450,000 | | InSite Issuer LLC, Series 2016-1A, Class C, 6.414%, | |
| | | | 11/15/46 (144A) | $ 482,046 |
| | | | TOTAL ASSET BACKED SECURITY | |
| | | | (Cost $450,000) | $ 482,046 |
| | | | COMMERCIAL MORTGAGE-BACKED SECURITY — | |
| | | | 0.3% of Net Assets | |
| | 827,870(b) | | Banc of America Commercial Mortgage Trust, | |
| | | | Series 2007-4, Class H, 5.866%, 2/10/51 (144A) | $ 753,643 |
| | | | TOTAL COMMERCIAL MORTGAGE-BACKED SECURITY | |
| | | | (Cost $814,976) | $ 753,643 |
| | | | CONVERTIBLE CORPORATE BONDS — 2.6% | |
| | | | of Net Assets | |
| | | | Airlines — 0.7% | |
| | 652,000 | | Air Canada, 4.0%, 7/1/25 (144A) | $ 710,295 |
| | 210,000 | | GOL Equity Finance SA, 3.75%, 7/15/24 (144A) | 134,597 |
| | 426,000 | | Southwest Airlines Co., 1.25%, 5/1/25 | 572,970 |
| | | | Total Airlines | $ 1,417,862 |
| | | | Banks — 0.0%† | |
| IDR | 11,178,198,000+^ | | PT Bakrie & Brothers Tbk, 0.0%, 12/22/22 | $ 38,216 |
| | | | Total Banks | $ 38,216 |
The accompanying notes are an integral part of these financial statements.
18 Pioneer Global High Yield Fund | Annual Report | 10/31/20
| | | | | |
| | Principal | | | |
| | Amount | | | |
| | USD ($) | | | Value |
| | | | Biotechnology — 0.6% | |
| | 410,000 | | Exact Sciences Corp., 0.375%, 3/1/28 | $ 502,762 |
| | 893,000 | | Insmed, Inc., 1.75%, 1/15/25 | 982,696 |
| | | | Total Biotechnology | $ 1,485,458 |
| | | | Computers — 0.2% | |
| | 473,000 | | Pure Storage, Inc., 0.125%, 4/15/23 | $ 461,403 |
| | | | Total Computers | $ 461,403 |
| | | | Healthcare-Products — 0.2% | |
| | 425,000 | | Integra LifeSciences Holdings Corp., 0.5%, | |
| | | | 8/15/25 (144A) | $ 387,813 |
| | | | Total Healthcare-Products | $ 387,813 |
| | | | Leisure Time — 0.2% | |
| | 315,000 | | Royal Caribbean Cruises, Ltd., 4.25%, 6/15/23 (144A) | $ 326,323 |
| | | | Total Leisure Time | $ 326,323 |
| | | | Media — 0.1% | |
| | 347,000 | | DISH Network Corp., 3.375%, 8/15/26 | $ 306,717 |
| | | | Total Media | $ 306,717 |
| | | | Pharmaceuticals — 0.3% | |
| | 455,000 | | Revance Therapeutics, Inc., 1.75%, 2/15/27 (144A) | $ 483,980 |
| | 523,000 | | Tricida, Inc., 3.5%, 5/15/27 (144A) | 223,194 |
| | | | Total Pharmaceuticals | $ 707,174 |
| | | | Transportation — 0.3% | |
| | 875,000 | | Golar LNG, Ltd., 2.75%, 2/15/22 | $ 691,797 |
| | | | Total Transportation | $ 691,797 |
| | | | TOTAL CONVERTIBLE CORPORATE BONDS | |
| | | | (Cost $6,675,522) | $ 5,822,763 |
| | | | CORPORATE BONDS — 80.3% of Net Assets | |
| | | | Advertising — 1.4% | |
| | 200,000 | | Clear Channel International BV, 6.625%, 8/1/25 (144A) | $ 203,000 |
| | 220,000 | | Lamar Media Corp., 4.875%, 1/15/29 | 228,800 |
| | 2,082,000 | | MDC Partners, Inc., 6.5%, 5/1/24 (144A) | 1,992,099 |
| | 720,000 | | Outfront Media Capital LLC/Outfront Media Capital | |
| | | | Corp., 6.25%, 6/15/25 (144A) | 734,850 |
| | | | Total Advertising | $ 3,158,749 |
| | | | Agriculture — 0.6% | |
| | 1,295,000 | | Kernel Holding SA, 6.5%, 10/17/24 (144A) | $ 1,300,180 |
| | | | Total Agriculture | $ 1,300,180 |
| | | | Airlines — 1.4% | |
| | 765,000 | | Aerovias de Mexico SA de CV, 7.0%, 2/5/25 (144A) | $ 181,687 |
| | 955,000 | | Delta Air Lines, Inc., 3.75%, 10/28/29 | 798,001 |
| | 220,000 | | Delta Air Lines, Inc., 7.375%, 1/15/26 | 227,700 |
The accompanying notes are an integral part of these financial statements.
Pioneer Global High Yield Fund | Annual Report | 10/31/20 19
Schedule of Investments | 10/31/20 (continued)
| | | | | |
| Principal
| | | |
| Amount
| | | |
| USD ($)
| | | Value |
| | | Airlines — (continued) | |
| 310,000 | | Delta Air Lines, Inc./SkyMiles IP, Ltd., 4.75%, | |
| | | 10/20/28 (144A) | $ 316,886 |
| 875,000 | | Mileage Plus Holdings LLC/Mileage Plus Intellectual | |
| | | Property Assets, Ltd., 6.5%, 6/20/27 (144A) | 911,094 |
EUR | 1,000,000 | | Transportes Aereos Portugueses SA, 5.625%, | |
| | | 12/2/24 (144A) | 663,773 |
| | | Total Airlines | $ 3,099,141 |
| | | Auto Manufacturers — 2.5% | |
| 870,000 | | Ford Motor Credit Co. LLC, 3.815%, 11/2/27 | $ 846,075 |
| 2,545,000 | | Ford Motor Credit Co. LLC, 4.125%, 8/17/27 | 2,506,825 |
| 375,000 | | Ford Motor Credit Co. LLC, 4.542%, 8/1/26 | 381,562 |
| 240,000 | | Ford Motor Credit Co. LLC, 5.113%, 5/3/29 | 249,300 |
| 1,545,000 | | JB Poindexter & Co., Inc., 7.125%, 4/15/26 (144A) | 1,642,041 |
| | | Total Auto Manufacturers | $ 5,625,803 |
| | | Auto Parts & Equipment — 1.0% | |
| 809,000 | | American Axle & Manufacturing, Inc., 6.25%, 3/15/26 | $ 810,780 |
| 1,193,000 | | Dealer Tire LLC/DT Issuer LLC, 8.0%, 2/1/28 (144A) | 1,219,842 |
| | | Total Auto Parts & Equipment | $ 2,030,622 |
| | | Banks — 4.6% | |
| 1,150,000 | | Akbank T.A.S., 5.125%, 3/31/25 | $ 1,060,162 |
| 420,000 | | Akbank T.A.S., 6.8%, 2/6/26 (144A) | 406,055 |
| 1,300,000(b)(c) | | Alfa Bank AO Via Alfa Bond Issuance Plc, 8.0% | |
| | | (5 Year USD Swap Rate + 666 bps) | 1,319,110 |
ARS | 8,000,000(d) | | Banco de la Ciudad de Buenos Aires, 34.442% | |
| | | (BADLARPP + 399 bps), 12/5/22 | 108,267 |
| 1,026,000(b)(c) | | Banco Mercantil del Norte SA, 6.75% (5 Year CMT | |
| | | Index + 497 bps) (144A) | 1,031,130 |
| 380,000(b)(c) | | Banco Mercantil del Norte SA, 8.375% (5 Year CMT | |
| | | Index + 776 bps) (144A) | 403,279 |
| 625,000(b)(c) | | Citigroup, Inc., 4.7% (SOFRRATE + 323 bps) | 611,328 |
| 643,000 | | Freedom Mortgage Corp., 8.125%, 11/15/24 (144A) | 647,823 |
| 1,392,000 | | Freedom Mortgage Corp., 8.25%, 4/15/25 (144A) | 1,406,755 |
| 750,000(b)(c) | | Intesa Sanpaolo S.p.A., 7.7% (5 Year USD Swap | |
| | | Rate + 546 ps) (144A) | 791,250 |
| 562,000(b)(c) | | JPMorgan Chase & Co., 4.6% (SOFRRATE + 313 bps) | 554,132 |
| 1,122,000 | | Provident Funding Associates LP/PFG Finance Corp., | |
| | | 6.375%, 6/15/25 (144A) | 1,102,225 |
| 750,000(b)(c) | | Sovcombank Via SovCom Capital DAC, 7.75% (5 Year | |
| | | CMT Index + 638 bps) (144A) | 716,250 |
| 9,000(b) | | Turkiye Vakiflar Bankasi TAO, 8.0% (5 Year USD | |
| | | Swap Rate + 585 bps), 11/1/27 (144A) | 8,201 |
| | | Total Banks | $ 10,165,967 |
The accompanying notes are an integral part of these financial statements.
20 Pioneer Global High Yield Fund | Annual Report | 10/31/20
| | | | | |
| Principal
| | | |
| Amount
| | | |
| USD ($)
| | | Value |
| | | Beverages — 0.3% | |
EUR | 550,000 | | Primo Water Corp., 3.875%, 10/31/28 (144A) | $ 632,640 |
| | | Total Beverages | $ 632,640 |
| | | Building Materials — 1.7% | |
| 295,000 | | Cornerstone Building Brands, Inc., 6.125%, | |
| | | 1/15/29 (144A) | $ 301,357 |
| 150,000 | | Forterra Finance LLC/FRTA Finance Corp., 6.5%, | |
| | | 7/15/25 (144A) | 158,437 |
| 575,000 | | JELD-WEN, Inc., 6.25%, 5/15/25 (144A) | 613,813 |
| 1,090,000 | | Patrick Industries, Inc., 7.5%, 10/15/27 (144A) | 1,180,939 |
| 520,000 | | Standard Industries, Inc., 4.375%, 7/15/30 (144A) | 535,600 |
| 1,173,000 | | Summit Materials LLC/Summit Materials Finance | |
| | | Corp., 5.125%, 6/1/25 (144A) | 1,187,663 |
| 45,000 | | Summit Materials LLC/Summit Materials Finance | |
| | | Corp., 5.25%, 1/15/29 (144A) | 46,350 |
| | | Total Building Materials | $ 4,024,159 |
| | | Chemicals — 3.3% | |
| 1,020,000 | | Element Solutions, Inc., 3.875%, 9/1/28 (144A) | $ 1,007,250 |
| 230,000 | | Hexion, Inc., 7.875%, 7/15/27 (144A) | 238,625 |
| 625,000 | | Ingevity Corp., 3.875%, 11/1/28 (144A) | 634,500 |
| 880,000 | | OCI NV, 4.625%, 10/15/25 (144A) | 891,176 |
| 500,000 | | Olin Corp., 9.5%, 6/1/25 (144A) | 591,310 |
| 1,218,000 | | Rain CII Carbon LLC/CII Carbon Corp., 7.25%, | |
| | | 4/1/25 (144A) | 1,201,265 |
EUR | 430,000 | | Synthomer Plc, 3.875%, 7/1/25 (144A) | 509,521 |
| 800,000 | | Tronox, Inc., 6.5%, 5/1/25 (144A) | 844,000 |
| 1,100,000 | | Tronox, Inc., 6.5%, 4/15/26 (144A) | 1,115,686 |
| | | Total Chemicals | $ 7,033,333 |
| | | Coal — 0.6% | |
| 1,420,000 | | SunCoke Energy Partners LP/SunCoke Energy | |
| | | Partners Finance Corp., 7.5%, 6/15/25 (144A) | $ 1,270,900 |
| | | Total Coal | $ 1,270,900 |
| | | Commercial Services — 4.7% | |
| 505,000 | | Allied Universal Holdco LLC/Allied Universal | |
| | | Finance Corp., 6.625%, 7/15/26 (144A) | $ 529,005 |
| 1,345,000 | | Allied Universal Holdco LLC/Allied Universal | |
| | | Finance Corp., 9.75%, 7/15/27 (144A) | 1,434,469 |
| 680,000 | | APX Group, Inc., 6.75%, 2/15/27 (144A) | 708,900 |
| 735,000 | | Brink’s Co., 5.5%, 7/15/25 (144A) | 764,554 |
| 2,308,000 | | Garda World Security Corp., 9.5%, 11/1/27 (144A) | 2,463,790 |
EUR | 325,000 | | Kapla Holding SAS, 3.375%, 12/15/26 (144A) | 344,840 |
EUR | 705,000 | | Loxam SAS, 6.0%, 4/15/25 (144A) | 759,385 |
| 335,000 | | Prime Security Services Borrower LLC/Prime | |
| | | Finance, Inc., 5.25%, 4/15/24 (144A) | 350,433 |
The accompanying notes are an integral part of these financial statements.
Pioneer Global High Yield Fund | Annual Report | 10/31/20 21
Schedule of Investments | 10/31/20 (continued)
| | | | | |
| Principal
| | | |
| Amount
| | | |
| USD ($)
| | | Value |
| | | Commercial Services — (continued) | |
| 915,000 | | Prime Security Services Borrower LLC/Prime | |
| | | Finance, Inc., 5.75%, 4/15/26 (144A) | $ 974,475 |
| 1,480,000 | | Prime Security Services Borrower LLC/Prime | |
| | | Finance, Inc., 6.25%, 1/15/28 (144A) | 1,495,510 |
| 725,000 | | Sotheby’s, 7.375%, 10/15/27 (144A) | 739,500 |
| | | Total Commercial Services | $ 10,564,861 |
| | | Computers — 0.7% | |
| 400,000 | | Booz Allen Hamilton, Inc., 3.875%, 9/1/28 (144A) | $ 406,000 |
| 110,000 | | Diebold Nixdorf, Inc., 9.375%, 7/15/25 (144A) | 116,737 |
| 455,000 | | NCR Corp., 5.0%, 10/1/28 (144A) | 450,450 |
| 225,000 | | NCR Corp., 5.25%, 10/1/30 (144A) | 222,750 |
| 110,000 | | NCR Corp., 8.125%, 4/15/25 (144A) | 121,000 |
| | | Total Computers | $ 1,316,937 |
| | | Diversified Financial Services — 3.9% | |
| 1,440,000 | | Alliance Data Systems Corp., 7.0%, 1/15/26 (144A) | $ 1,444,032 |
| 1,765,000 | | ASG Finance Designated Activity Co., 7.875%, | |
| | | 12/3/24 (144A) | 1,217,850 |
| 2,315,000 | | Financiera Independencia SAB de CV SOFOM ENR, | |
| | | 8.0%, 7/19/24 (144A) | 1,608,948 |
| EUR | 300,000 | | Garfunkelux Holdco 3 SA, 6.75%, 11/1/25 (144A) | 342,348 |
| GBP | 510,000 | | Garfunkelux Holdco 3 SA, 7.75%, 11/1/25 (144A) | 648,366 |
| 1,326,400(e) | | Global Aircraft Leasing Co., Ltd., 6.5% (7.25% PIK 6.5% | |
| | | cash), 9/15/24 (144A) | 888,688 |
| 990,000 | | Nationstar Mortgage Holdings, Inc., 5.5%, | |
| | | 8/15/28 (144A) | 987,525 |
| 308,000 | | Quicken Loans LLC/Quicken Loans Co.-Issuer, Inc., | |
| | | 3.625%, 3/1/29 (144A) | 303,380 |
| 1,416,000 | | Unifin Financiera SAB de CV, 8.375%, 1/27/28 (144A) | 1,121,472 |
| | | Total Diversified Financial Services | $ 8,562,609 |
| | | Electric — 1.9% | |
| 470,000 | | Calpine Corp., 4.625%, 2/1/29 (144A) | $ 474,564 |
| 470,000 | | Calpine Corp., 5.0%, 2/1/31 (144A) | 479,846 |
| 1,150,000 | | Cemig Geracao e Transmissao SA, 9.25%, | |
| | | 12/5/24 (144A) | 1,293,750 |
| 1,120,000 | | Pampa Energia SA, 7.5%, 1/24/27 (144A) | 778,400 |
| 140,000 | | Pattern Energy Operations LP/Pattern Energy | |
| | | Operations, Inc., 4.5%, 8/15/28 (144A) | 145,968 |
| 970,000 | | Talen Energy Supply LLC, 7.625%, 6/1/28 (144A) | 949,388 |
| | | Total Electric | $ 4,121,916 |
| | Electrical Components & Equipment — 1.0% | |
| EUR | 395,000 | | Belden, Inc., 3.375%, 7/15/27 (144A) | $ 448,882 |
| EUR | 1,052,000 | | Belden, Inc., 3.875%, 3/15/28 (144A) | 1,215,446 |
| 335,000 | | WESCO Distribution, Inc., 7.25%, 6/15/28 (144A) | 366,825 |
| | | Total Electrical Components & Equipment | $ 2,031,153 |
|
The accompanying notes are an integral part of these financial statements. |
22 Pioneer Global High Yield Fund | Annual Report | 10/31/20
| | | | | |
| Principal
| | | |
| Amount
| | | |
| USD ($)
| | | Value |
| | | Electronics — 0.1% | |
| 285,000 | | Sensata Technologies, Inc., 3.75%, 2/15/31 (144A) | $ 282,150 |
| | | Total Electronics | $ 282,150 |
| | | Engineering & Construction — 1.9% | |
| 445,000 | | IHS Netherlands Holdco BV, 7.125%, 3/18/25 (144A) | $ 448,338 |
| 800,000 | | IHS Netherlands Holdco BV, 8.0%, 9/18/27 (144A) | 812,000 |
| 750,000 | | KBR, Inc., 4.75%, 9/30/28 (144A) | 759,533 |
| 1,595,000 | | PowerTeam Services LLC, 9.033%, 12/4/25 (144A) | 1,688,706 |
| 1,000,709(f) | | Stoneway Capital Corp., 10.0%, 3/1/27 (144A) | 342,743 |
| | | Total Engineering & Construction | $ 4,051,320 |
| | | Entertainment — 2.7% | |
| 609,000 | | AMC Entertainment Holdings, Inc., 10.5%, | |
| | | 4/24/26 (144A) | $ 310,590 |
| 1,643,000(e) | | AMC Entertainment Holdings, Inc., 12.0% (12.0% | |
| | | PIK 10.0% cash), 6/15/26 (144A) | 90,365 |
| 690,000 | | Caesars Entertainment, Inc., 8.125%, 7/1/27 (144A) | 720,150 |
| 830,000 | | Codere Finance 2 Luxembourg SA, 7.625%, | |
| | | 11/1/21 (144A) | 403,380 |
| 1,373,000 | | Enterprise Development Authority, 12.0%, | |
| | | 7/15/24 (144A) | 1,520,597 |
EUR | 516,000 | | International Game Technology Plc, 2.375%, | |
| | | 4/15/28 (144A) | 525,749 |
EUR | 524,000 | | Scientific Games International, Inc., 3.375%, | |
| | | 2/15/26 (144A) | 570,511 |
EUR | 712,000 | | Scientific Games International, Inc., 5.5%, | |
| | | 2/15/26 (144A) | 764,834 |
| 955,000 | | Scientific Games International, Inc., 7.25%, | |
| | | 11/15/29 (144A) | 947,284 |
| 344,000 | | Scientific Games International, Inc., 8.25%, | |
| | | 3/15/26 (144A) | 348,950 |
| | | Total Entertainment | $ 6,202,410 |
| | | Environmental Control — 1.3% | |
| 615,000 | | Covanta Holding Corp., 5.0%, 9/1/30 | $ 625,762 |
| 957,000 | | Covanta Holding Corp., 6.0%, 1/1/27 | 996,658 |
| 1,081,000 | | Tervita Corp., 7.625%, 12/1/21 (144A) | 1,037,760 |
| | | Total Environmental Control | $ 2,660,180 |
| | | Food — 2.0% | |
| 875,000 | | FAGE International SA/FAGE USA Dairy Industry, | |
| | | Inc., 5.625%, 8/15/26 (144A) | $ 838,145 |
| 500,000 | | JBS USA LUX SA/JBS USA Finance, Inc., 6.75%, | |
| | | 2/15/28 (144A) | 549,915 |
| 1,616,000 | | Minerva Luxembourg SA, 5.875%, 1/19/28 (144A) | 1,678,636 |
EUR | 655,000 | | Quatrim SASU, 5.875%, 1/15/24 (144A) | 737,901 |
| 555,000 | | Simmons Foods, Inc., 5.75%, 11/1/24 (144A) | 548,756 |
| 280,000 | | United Natural Foods, Inc., 6.75%, 10/15/28 (144A) | 283,500 |
| | | Total Food | $ 4,636,853 |
The accompanying notes are an integral part of these financial statements.
Pioneer Global High Yield Fund | Annual Report | 10/31/20 23
Schedule of Investments | 10/31/20 (continued)
| | | | | |
| Principal
| | | |
| Amount
| | | |
| USD ($)
| | | Value |
| | | Forest Products & Paper — 0.9% | |
| 725,000 | | Clearwater Paper Corp., 4.75%, 8/15/28 (144A) | $ 728,625 |
| 675,000 | | Mercer International, Inc., 7.375%, 1/15/25 | 686,394 |
| 609,000 | | Schweitzer-Mauduit International, Inc., 6.875%, | |
| | | 10/1/26 (144A) | 642,495 |
| | | Total Forest Products & Paper | $ 2,057,514 |
| | | Healthcare-Products — 1.0% | |
EUR | 1,440,000 | | Avantor Funding, Inc., 2.625%, 11/1/25 (144A) | $ 1,676,808 |
| 375,000 | | Varex Imaging Corp., 7.875%, 10/15/27 (144A) | 381,563 |
| | | Total Healthcare-Products | $ 2,058,371 |
| | | Healthcare-Services — 1.9% | |
| 550,000 | | Prime Healthcare Services, Inc., 7.25%, 11/1/25 (144A) | $ 554,290 |
| 170,000 | | Providence Service Corp., 5.875%, 11/15/25 (144A) | 172,975 |
| 1,484,000 | | Surgery Center Holdings, Inc., 10.0%, 4/15/27 (144A) | 1,584,170 |
| 786,000 | | US Renal Care, Inc., 10.625%, 7/15/27 (144A) | 837,090 |
| 850,000 | | West Street Merger Sub, Inc., 6.375%, 9/1/25 (144A) | 862,750 |
| | | Total Healthcare-Services | $ 4,011,275 |
| | | Holding Companies-Diversified — 0.7% | |
| 1,680,000 | | VistaJet Malta Finance Plc/XO Management | |
| | | Holding, Inc., 10.5%, 6/1/24 (144A) | $ 1,596,000 |
| | | Total Holding Companies-Diversified | $ 1,596,000 |
| | | Home Builders — 2.4% | |
| 575,000 | | Beazer Homes USA, Inc., 5.875%, 10/15/27 | $ 583,625 |
| 579,000 | | Beazer Homes USA, Inc., 6.75%, 3/15/25 | 594,922 |
| 155,000 | | Beazer Homes USA, Inc., 7.25%, 10/15/29 | 166,578 |
| 300,000 | | Brookfield Residential Properties, Inc./Brookfield | |
| | | Residential US Corp., 4.875%, 2/15/30 (144A) | 285,000 |
| 659,000 | | Brookfield Residential Properties, Inc./Brookfield | |
| | | Residential US Corp., 6.25%, 9/15/27 (144A) | 675,277 |
| 550,000 | | M/I Homes, Inc., 4.95%, 2/1/28 | 569,250 |
| 1,259,000 | | Taylor Morrison Communities, Inc., 5.875%, | |
| | | 6/15/27 (144A) | 1,391,195 |
| 630,000 | | TRI Pointe Group, Inc., 5.7%, 6/15/28 | 699,300 |
| 265,000 | | Williams Scotsman International, Inc., 4.625%, | |
| | | 8/15/28 (144A) | 266,656 |
| 150,000 | | Winnebago Industries, Inc., 6.25%, 7/15/28 (144A) | 158,625 |
| | | Total Home Builders | $ 5,390,428 |
| | | Home Furnishings — 0.6% | |
EUR | 1,235,000 | | International Design Group S.p.A., 6.5%, 11/15/25 (144A) $ | 1,368,478 |
| | | Total Home Furnishings | $ 1,368,478 |
| | | Housewares — 0.1% | |
| 160,000 | | CD&R Smokey Buyer, Inc., 6.75%, 7/15/25 (144A) | $ 168,800 |
| | | Total Housewares | $ 168,800 |
The accompanying notes are an integral part of these financial statements.
24 Pioneer Global High Yield Fund | Annual Report | 10/31/20
| | | | | |
| Principal
| | | |
| Amount
| | | |
| USD ($)
| | | Value |
| | | Insurance — 0.4% | |
GBP | 585,000 | | Galaxy Bidco, Ltd., 6.5%, 7/31/26 (144A) | $ 774,997 |
| | | Total Insurance | $ 774,997 |
| | | Internet — 0.5% | |
EUR | 840,000 | | Netflix, Inc., 3.875%, 11/15/29 (144A) | $ 1,084,266 |
| | | Total Internet | $ 1,084,266 |
| | | Iron & Steel — 2.3% | |
| 1,050,000 | | Carpenter Technology Corp., 6.375%, 7/15/28 | $ 1,101,412 |
| 1,397,000 | | Cleveland-Cliffs, Inc., 6.75%, 3/15/26 (144A) | 1,466,850 |
| 160,000 | | Cleveland-Cliffs, Inc., 9.875%, 10/17/25 (144A) | 183,000 |
| 223,000 | | Metinvest BV, 7.75%, 4/23/23 (144A) | 227,460 |
| 2,165,000 | | Metinvest BV, 7.75%, 10/17/29 (144A) | 2,069,740 |
| | | Total Iron & Steel | $ 5,048,462 |
| | | Leisure Time — 0.7% | |
| 180,000 | | Carnival Corp., 10.5%, 2/1/26 (144A) | $ 194,850 |
| 175,000 | | Royal Caribbean Cruises, Ltd., 9.125%, 6/15/23 (144A) | 182,219 |
| 407,000 | | Royal Caribbean Cruises, Ltd., 11.5%, 6/1/25 (144A) | 465,506 |
| 817,000 | | Viking Cruises, Ltd., 5.875%, 9/15/27 (144A) | 637,260 |
| | | Total Leisure Time | $ 1,479,835 |
| | | Lodging — 1.1% | |
| 560,000 | | Boyd Gaming Corp., 8.625%, 6/1/25 (144A) | $ 613,032 |
| 590,000 | | Grupo Posadas SAB de CV, 7.875%, 6/30/22 (144A) | 212,400 |
| 1,231,000 | | Station Casinos LLC, 4.5%, 2/15/28 (144A) | 1,166,373 |
| 455,000 | | Wyndham Destinations, Inc., 6.625%, 7/31/26 (144A) | 484,097 |
| | | Total Lodging | $ 2,475,902 |
| | | Machinery-Diversified — 0.7% | |
EUR | 1,317,000 | | Platin 1426 GmbH, 5.375%, 6/15/23 (144A) | $ 1,435,432 |
| | | Total Machinery-Diversified | $ 1,435,432 |
| | | Media — 2.6% | |
| 650,000 | | CCO Holdings LLC/CCO Holdings Capital Corp., | |
| | | 5.125%, 5/1/27 (144A) | $ 682,500 |
| 1,000,000 | | CSC Holdings LLC, 4.625%, 12/1/30 (144A) | 999,980 |
| 2,233,000 | | Diamond Sports Group LLC/Diamond Sports Finance | |
| | | Co., 6.625%, 8/15/27 (144A) | 891,302 |
| 597,000 | | Gray Television, Inc., 5.875%, 7/15/26 (144A) | 621,381 |
EUR | 575,000 | | Virgin Media Finance Plc, 3.75%, 7/15/30 (144A) | 635,753 |
GBP | 750,000 | | Virgin Media Vendor Financing Notes III DAC, | |
| | | 4.875%, 7/15/28 (144A) | 967,417 |
EUR | 855,000 | | Ziggo Bond Co. BV, 3.375%, 2/28/30 (144A) | 945,576 |
| | | Total Media | $ 5,743,909 |
The accompanying notes are an integral part of these financial statements.
Pioneer Global High Yield Fund | Annual Report | 10/31/20 25
Schedule of Investments | 10/31/20 (continued)
| | | | | |
| | Principal | | | |
| | Amount | | | |
| | USD ($) | | | Value |
| | | | Mining — 2.0% | |
| | 705,000 | | First Quantum Minerals, Ltd., 6.875%, 3/1/26 (144A) | $ 699,712 |
| | 665,000 | | First Quantum Minerals, Ltd., 6.875%, 10/15/27 (144A) | 663,331 |
| | 200,000 | | First Quantum Minerals, Ltd., 7.5%, 4/1/25 (144A) | 201,000 |
| | 825,000 | | Hudbay Minerals, Inc., 6.125%, 4/1/29 (144A) | 843,562 |
| | 1,215,000 | | IAMGOLD Corp., 5.75%, 10/15/28 (144A) | 1,215,972 |
| | 643,000 | | Joseph T Ryerson & Son, Inc., 8.5%, 8/1/28 (144A) | 689,007 |
| | | | Total Mining | $ 4,312,584 |
| | | | Miscellaneous Manufacturers — 0.2% | |
| | 426,000 | | Koppers, Inc., 6.0%, 2/15/25 (144A) | $ 435,585 |
| | | | Total Miscellaneous Manufacturers | $ 435,585 |
| | | | Oil & Gas — 5.4% | |
| | 1,430,000 | | Baytex Energy Corp., 8.75%, 4/1/27 (144A) | $ 629,200 |
| | 770,000 | | Cenovus Energy, Inc., 5.375%, 7/15/25 | 811,863 |
| | 905,000 | | Cenovus Energy, Inc., 6.75%, 11/15/39 | 1,006,283 |
| | 210,000 | | EQT Corp., 5.0%, 1/15/29 | 210,000 |
| | 901,000 | | Indigo Natural Resources LLC, 6.875%, 2/15/26 (144A) | 885,233 |
| | 645,000 | | Medco Oak Tree Pte, Ltd., 7.375%, 5/14/26 (144A) | 622,336 |
| | 588,000 | | MEG Energy Corp., 7.0%, 3/31/24 (144A) | 558,600 |
| | 1,100,000 | | MEG Energy Corp., 7.125%, 2/1/27 (144A) | 989,703 |
| | 1,260,000 | | Neptune Energy Bondco Plc, 6.625%, 5/15/25 (144A) | 1,096,200 |
| | 1,405,000 | | PBF Holding Co. LLC/PBF Finance Corp., 6.0%, | |
| | | | 2/15/28 (144A) | 540,855 |
| | 241,000 | | PBF Holding Co. LLC/PBF Finance Corp., 9.25%, | |
| | | | 5/15/25 (144A) | 213,888 |
| | 760,000 | | Petroleos Mexicanos, 6.875%, 10/16/25 (144A) | 751,260 |
| | 1,523,000 | | SEPLAT Petroleum Development Co. Plc, 9.25%, | |
| | | | 4/1/23 (144A) | 1,526,807 |
| | 1,820,000 | | Shelf Drilling Holdings, Ltd., 8.25%, 2/15/25 (144A) | 600,600 |
| | 230,000 | | Transocean Sentry, Ltd., 5.375%, 5/15/23 (144A) | 147,775 |
| | 472,000 | | Transocean, Inc., 8.0%, 2/1/27 (144A) | 128,620 |
| | 1,800,000 | | YPF SA, 6.95%, 7/21/27 (144A) | 963,000 |
| ARS | 22,125,000 | | YPF SA, 16.5%, 5/9/22 (144A) | 179,373 |
| | | | Total Oil & Gas | $ 11,861,596 |
| | | | Oil & Gas Services — 1.2% | |
| | 555,000 | | Archrock Partners LP/Archrock Partners Finance | |
| | | | Corp., 6.25%, 4/1/28 (144A) | $ 535,575 |
| | 875,000 | | Archrock Partners LP/Archrock Partners Finance Corp., | |
| | | | 6.875%, 4/1/27 (144A) | 857,500 |
| | 788,000 | | Exterran Energy Solutions LP/EES Finance Corp., | |
| | | | 8.125%, 5/1/25 | 661,920 |
| | 1,558,000 | | FTS International, Inc., 6.25%, 5/1/22 | 436,240 |
| | 770,000 | | SESI LLC, 7.75%, 9/15/24 | 177,100 |
| | | | Total Oil & Gas Services | $ 2,668,335 |
The accompanying notes are an integral part of these financial statements.
26 Pioneer Global High Yield Fund | Annual Report | 10/31/20
| | | | | |
| Principal
| | | |
| Amount
| | | |
| USD ($)
| | | Value |
| | | Packaging & Containers — 0.7% | |
EUR | 340,000 | | Ardagh Packaging Finance Plc/Ardagh Holdings | |
| | | USA, Inc., 2.125%, 8/15/26 (144A) | $ 386,687 |
EUR | 170,000 | | CANPACK SA/Eastern PA Land Investment Holding | |
| | | LLC, 2.375%, 11/1/27 (144A) | 198,451 |
| 200,000 | | CANPACK SA/Eastern PA Land Investment Holding | |
| | | LLC, 3.125%, 11/1/25 (144A) | 202,500 |
| 619,000 | | Greif, Inc., 6.5%, 3/1/27 (144A) | 649,176 |
| 71,000 | | Plastipak Holdings, Inc., 6.25%, 10/15/25 (144A) | 71,089 |
| | | Total Packaging & Containers | $ 1,507,903 |
| | | Pharmaceuticals — 2.7% | |
| 368,000 | | Endo Dac/Endo Finance LLC/Endo Finco, Inc., | |
| | | 6.0%, 6/30/28 (144A) | $ 284,280 |
| 241,000 | | Endo Dac/Endo Finance LLC/Endo Finco, Inc., | |
| | | 9.5%, 7/31/27 (144A) | 258,523 |
| 600,000 | | P&L Development LLC/PLD Finance Corp., 7.75%, | |
| | | 11/15/25 (144A) | 611,250 |
| 1,008,000 | | Par Pharmaceutical, Inc., 7.5%, 4/1/27 (144A) | 1,068,480 |
EUR | 1,315,000 | | Rossini S.a.r.l., 6.75%, 10/30/25 (144A) | 1,594,260 |
EUR | 1,820,000 | | Teva Pharmaceutical Finance Netherlands II BV, | |
| | | 1.625%, 10/15/28 | 1,706,036 |
EUR | 255,000 | | Teva Pharmaceutical Finance Netherlands II BV, | |
| | | 6.0%, 1/31/25 | 307,936 |
| 190,000 | | Teva Pharmaceutical Finance Netherlands III BV, | |
| | | 2.8%, 7/21/23 | 180,200 |
| | | Total Pharmaceuticals | $ 6,010,965 |
| | | Pipelines — 4.4% | |
| 1,690,000 | | American Midstream Partners LP/American | |
| | | Midstream Finance Corp., 9.5%, 12/15/21 (144A) | $ 1,639,300 |
| 1,107,000 | | Cheniere Energy, Inc., 4.625%, 10/15/28 (144A) | 1,142,977 |
| 783,000 | | DCP Midstream Operating LP, 5.6%, 4/1/44 | 681,210 |
| 1,500,000 | | Delek Logistics Partners LP/Delek Logistics | |
| | | Finance Corp., 6.75%, 5/15/25 | 1,338,750 |
| 1,415,000(b)(c) | | Energy Transfer Operating LP, 7.125% (5 Year CMT | |
| | | Index + 531 bps) | 1,156,564 |
| 810,000 | | EnLink Midstream Partners LP, 4.15%, 6/1/25 | 696,770 |
| 327,000 | | Global Partners LP/GLP Finance Corp., 7.0%, 8/1/27 | 336,624 |
| 660,000 | | Harvest Midstream I LP, 7.5%, 9/1/28 (144A) | 655,050 |
| 1,530,000 | | Northriver Midstream Finance LP, 5.625%, | |
| | | 2/15/26 (144A) | 1,515,465 |
| 715,000 | | NuStar Logistics LP, 6.375%, 10/1/30 | 719,469 |
| | | Total Pipelines | $ 9,882,179 |
| | | REITs — 1.5% | |
| 735,000 | | iStar, Inc., 4.25%, 8/1/25 | $ 674,363 |
| 1,325,000 | | iStar, Inc., 4.75%, 10/1/24 | 1,265,375 |
The accompanying notes are an integral part of these financial statements.
Pioneer Global High Yield Fund | Annual Report | 10/31/20 27
Schedule of Investments | 10/31/20 (continued)
| | | | | |
| Principal
| | | |
| Amount
| | | |
| USD ($)
| | | Value |
| | | REITs — (continued) | |
| 531,000 | | Uniti Group LP/Uniti Fiber Holdings, Inc./CSL | |
| | | Capital LLC, 7.875%, 2/15/25 (144A) | $ 563,374 |
| 590,000 | | Uniti Group LP/Uniti Group Finance, Inc./CSL | |
| | | Capital LLC, 8.25%, 10/15/23 | 581,150 |
| | | Total REITs | $ 3,084,262 |
| | | Retail — 2.6% | |
| 970,000 | | AAG FH LP/AAG FH Finco, Inc., 9.75%, 7/15/24 (144A) | $ 911,800 |
| 180,000 | | Asbury Automotive Group, Inc., 4.75%, 3/1/30 (144A) | 185,850 |
| 568,000 | | Beacon Roofing Supply, Inc., 4.875%, 11/1/25 (144A) | 557,208 |
| 165,000 | | Group 1 Automotive, Inc., 4.0%, 8/15/28 (144A) | 165,206 |
| 310,000 | | Ken Garff Automotive LLC, 4.875%, 9/15/28 (144A) | 307,156 |
| 325,000 | | L Brands, Inc., 6.625%, 10/1/30 (144A) | 341,250 |
| 1,493,000 | | Michaels Stores, Inc., 8.0%, 7/15/27 (144A) | 1,537,790 |
| 460,000 | | Penske Automotive Group, Inc., 3.5%, 9/1/25 | 461,150 |
| 730,000 | | QVC, Inc., 4.375%, 9/1/28 | 730,548 |
| 230,000 | | QVC, Inc., 4.75%, 2/15/27 | 234,672 |
| 557,000 | | Staples, Inc., 7.5%, 4/15/26 (144A) | 520,795 |
| | | Total Retail | $ 5,953,425 |
| | | Software — 0.3% | |
| 670,000 | | Logan Merger Sub, Inc., 5.5%, 9/1/27 (144A) | $ 679,213 |
| | | Total Software | $ 679,213 |
| | | Telecommunications — 3.7% | |
| 1,065,000 | | Altice France Holding SA, 6.0%, 2/15/28 (144A) | $ 1,025,062 |
| 280,000 | | Altice France SA, 5.125%, 1/15/29 (144A) | 279,559 |
| 775,000 | | CenturyLink, Inc., 4.0%, 2/15/27 (144A) | 792,344 |
| 346,000 | | CommScope Technologies LLC, 6.0%, 6/15/25 (144A) | 343,018 |
| 691,796(e) | | Digicel International Finance, Ltd./Digicel Holdings | |
| | Bermuda, Ltd., 13.0% (7.0% PIK 6.0% cash), | |
| | | 12/31/25 (144A) | 644,235 |
| 1,810,000 | | Kenbourne Invest SA, 6.875%, 11/26/24 (144A) | 1,889,188 |
EUR | 700,000 | | Lorca Telecom Bondco SAU, 4.0%, 9/18/27 (144A) | 827,366 |
| 200,000 | | Millicom International Cellular SA, 4.5%, | |
| | | 4/27/31 (144A) | 203,000 |
| 1,033,000 | | Millicom International Cellular SA, 6.25%, | |
| | | 3/25/29 (144A) | 1,141,982 |
| 970,000 | | Windstream Escrow LLC/Windstream Escrow Finance | |
| | | Corp., 7.75%, 8/15/28 (144A) | 936,050 |
| | | Total Telecommunications | $ 8,081,804 |
The accompanying notes are an integral part of these financial statements.
28 Pioneer Global High Yield Fund | Annual Report | 10/31/20
| | | | | |
| | Principal | | | |
| | Amount | | | |
| | USD ($) | | | Value |
| | | | Transportation — 1.9% | |
| | 979,952(d) | | Golar LNG Partners LP, 8.38% (3 Month USD LIBOR + | |
| | | | 810 bps), 11/15/22 (144A) | $ 803,561 |
| | 1,470,000 | | Hidrovias International Finance S.a.r.l., 5.95%, | |
| | | | 1/24/25 (144A) | 1,479,570 |
| | 365,000 | | Watco Cos., LLC/Watco Finance Corp., 6.5%, | |
| | | | 6/15/27 (144A) | 378,688 |
| | 1,285,000 | | Western Global Airlines LLC, 10.375%, 8/15/25 (144A) | 1,329,949 |
| | | | Total Transportation | $ 3,991,768 |
| | | | Trucking & Leasing — 0.2% | |
| | 435,000 | | Fortress Transportation & Infrastructure Investors LLC, | |
| | | | 9.75%, 8/1/27 (144A) | $ 462,731 |
| | | | Total Trucking & Leasing | $ 462,731 |
| | | | TOTAL CORPORATE BONDS | |
| | | | (Cost $188,273,965) | $176,397,902 |
| |
| | FOREIGN GOVERNMENT BONDS — 4.9% | |
| | | | of Net Assets | |
| | | | Angola — 0.4% | |
| | 1,132,000 | | Angolan Government International Bond, 8.25%, | |
| | | | 5/9/28 (144A) | $ 889,639 |
| | | | Total Angola | $ 889,639 |
| | | | Argentina — 1.1% | |
| | 1,794,500(h) | | Argentine Republic Government International Bond, | |
| | | | 0.125%, 7/9/35 | $ 586,801 |
| | 118,980 | | Argentine Republic Government International Bond, | |
| | | | 1.0%, 7/9/29 | 48,782 |
| | 2,000,000 | | Ciudad Autonoma De Buenos Aires, 7.5%, | |
| | | | 6/1/27 (144A) | 1,480,020 |
| | 251,056 | | Province of Salta Argentina, 9.5%, 3/16/22 (144A) | 222,185 |
| | | | Total Argentina | $ 2,337,788 |
| | | | Bahrain — 0.5% | |
| | 335,000 | | Bahrain Government International Bond, 5.625%, | |
| | | | 9/30/31 (144A) | $ 331,230 |
| | 780,000 | | Bahrain Government International Bond, 7.0%, | |
| | | | 10/12/28 (144A) | 859,927 |
| | | | Total Bahrain | $ 1,191,157 |
| | | | Dominican Republic — 0.3% | |
| | 685,000 | | Dominican Republic International Bond, 4.875%, | |
| | | | 9/23/32 (144A) | $ 695,282 |
| | | | Total Dominican Republic | $ 695,282 |
| | | | Ecuador — 0.1% | |
| | 313,568(g) | | Ecuador Social Bond S.a.r.l, 1/30/35 (144A) | $ 217,930 |
| | | | Total Ecuador | $ 217,930 |
The accompanying notes are an integral part of these financial statements.
Pioneer Global High Yield Fund | Annual Report | 10/31/20 29
Schedule of Investments | 10/31/20 (continued)
| | | | | |
| Principal
| | | |
| Amount
| | | |
| USD ($)
| | | Value |
| | | Egypt — 0.4% | |
| 908,000 | | Egypt Government International Bond, 7.6%, | |
| | | 3/1/29 (144A) | $ 943,684 |
| | | Total Egypt | $ 943,684 |
| | | Ghana — 0.6% | |
| 385,000 | | Ghana Government International Bond, 7.875%, | |
| | | 2/11/35 (144A) | $ 341,206 |
| 1,000,000 | | Ghana Government International Bond, | |
| | | 8.627%, 6/16/49 | 877,500 |
| | | Total Ghana | $ 1,218,706 |
| | | Ivory Coast — 0.3% | |
EUR | 495,000 | | Ivory Coast Government International Bond, | |
| | | 5.875%, 10/17/31 (144A) | $ 563,555 |
| | | Total Ivory Coast | $ 563,555 |
| | | Tunisia — 0.4% | |
EUR | 997,000 | | Banque Centrale de Tunisie International Bond, 6.375%, | |
| | | 7/15/26 (144A) | $ 986,813 |
| | | Total Tunisia | $ 986,813 |
| | | Ukraine — 0.8% | |
EUR | 855,000 | | Ukraine Government International Bond, 4.375%, | |
| | | 1/27/30 (144A) | $ 829,353 |
| 875,000 | | Ukraine Government International Bond, 8.994%, | |
| | | 2/1/24 (144A) | 930,296 |
| | | Total Ukraine | $ 1,759,649 |
| | | TOTAL FOREIGN GOVERNMENT BONDS | |
| | | (Cost $12,132,814) | $ 10,804,203 |
| | | INSURANCE-LINKED SECURITIES — 1.4% | |
| | | of Net Assets# | |
| | | Event Linked Bonds — 0.3% | |
| | | Earthquakes – Peru — 0.1% | |
| 175,000(d) | | International Bank for Reconstruction & Development, | |
| | | 6.08% (3 Month USD LIBOR + 600 bps), 2/15/21 (144A) | $ 175,350 |
| | | Multiperil – U.S. — 0.2% | |
| 500,000+(d) | | Caelus Re V, 0.586% (1 Month U.S. Treasury Bill + | |
| | | 50 bps), 6/5/24 (144A) | $ 44 |
| 250,000(d) | | Caelus Re V, 7.24% (3 Month U.S. Treasury Bill + | |
| | | 724 bps), 6/7/21 (144A) | 100,000 |
| 250,000(d) | | Tailwind Re 2017-1, 11.146% (3 Month U.S. Treasury | |
| | | Bill + 1,106 bps), 1/8/22 (144A) | 253,775 |
| | | | $ 353,819 |
| | | Total Event Linked Bonds | $ 529,169 |
The accompanying notes are an integral part of these financial statements.
30 Pioneer Global High Yield Fund | Annual Report | 10/31/20
| | | | | |
| | Face | | | |
| | Amount | | | |
| | USD ($) | | | Value |
| | | | Collateralized Reinsurance — 0.4% | |
| | | | Multiperil – U.S. — 0.0%† | |
| | 250,000+(i) | | Dingle Re 2019, 2/1/21 | $ 5,131 |
| | | | Multiperil – Worldwide — 0.3% | |
| | 600,000+(a)(i) | | Cypress Re 2017, 1/10/21 | $ 10,920 |
| | 462,359+(a)(i) | | Dartmouth Re 2018, 1/15/21 | 99,869 |
| | 389,876+(a)(i) | | Gloucester Re 2018, 2/28/21 | 68,618 |
| | 12,000+(i) | | Limestone Re, 8/31/21 | 196 |
| | 12,000+(i) | | Limestone Re 2016-1, 8/31/21 | 196 |
| | 277,770+(a)(i) | | Oyster Bay Re 2018, 1/15/21 | 252,104 |
| | 400,000+(a)(i) | | Resilience Re, 4/6/21 | 40 |
| | 283,700+(a)(i) | | Seminole Re 2018, 1/15/21 | 8,420 |
| | 276,582+(a)(i) | | Walton Health Re 2018, 6/15/21 | 131,376 |
| | | | | $ 571,739 |
| | | | Windstorm – Florida — 0.1% | |
| | 250,000+(a)(i) | | Formby Re 2018, 2/28/21 | $ 44,229 |
| | 300,000+(a)(i) | | Portrush Re 2017, 6/15/21 | 191,430 |
| | | | | $ 235,659 |
| | | | Windstorm – U.S. Regional — 0.0%† | |
| | 250,000+(a)(i) | | Oakmont Re 2017, 4/30/21 | $ 7,350 |
| | | | Total Collateralized Reinsurance | $ 819,879 |
| | | | Reinsurance Sidecars — 0.7% | |
| | | | Multiperil – U.S. — 0.1% | |
| | 800,000+(a)(i) | | Carnoustie Re 2017, 11/30/21 | $ 105,440 |
| | 1,000,000+(a)(j) | | Harambee Re 2018, 12/31/21 | 8,200 |
| | 695,349+(j) | | Harambee Re 2019, 12/31/22 | 7,997 |
| | | | | $ 121,637 |
| | | | Multiperil – Worldwide — 0.6% | |
| | 3,037+(i)(j) | | Alturas Re 2019-2, 3/10/22 | $ 16,206 |
| | 300,000+(a)(i) | | Bantry Re 2017, 3/31/21 | 70,830 |
| | 250,000+(a)(i) | | Bantry Re 2018, 12/31/21 | 2,850 |
| | 250,000+(i) | | Bantry Re 2019, 12/31/22 | 8,491 |
| | 490,000+(a)(i) | | Bantry Re, 2016, 3/31/21 | 39,494 |
| | 1,422,258+(a)(i) | | Berwick Re 2018-1, 12/31/21 | 173,089 |
| | 556,791+(a)(i) | | Berwick Re 2019-1, 12/31/22 | 66,537 |
| | 250,000+(j) | | Blue Lotus Re 2018, 12/31/21 | 10,925 |
| | 22,500+(i) | | Eden Re II, 3/22/22 (144A) | 14,945 |
| | 12,500+(i) | | Eden Re II, 3/22/22 (144A) | 8,606 |
| | 1,600,000+(a)(i) | | Gleneagles Re 2016, 11/30/20 | 49,920 |
| | 250,000+(a)(i) | | Gleneagles Re 2018, 12/31/21 | 29,575 |
| | 450,000+(a)(j) | | Lorenz Re 2018, 7/1/21 | 12,330 |
| | 231,508+(a)(j) | | Lorenz Re 2019, 6/30/22 | 22,387 |
The accompanying notes are an integral part of these financial statements.
Pioneer Global High Yield Fund | Annual Report | 10/31/20 31
Schedule of Investments | 10/31/20 (continued)
| | | | | |
| | Face | | | |
| | Amount | | | |
| | USD ($) | | | Value |
| | | | Multiperil – Worldwide — (continued) | |
| | 600,000+(a)(i) | | Merion Re 2018-2, 12/31/21 | $ 666,371 |
| | 1,000,000+(i) | | Pangaea Re 2016-2, 11/30/20 | 1,783 |
| | 300,000+(a)(i) | | Pangaea Re 2018-1, 12/31/21 | 6,316 |
| | 300,000+(a)(i) | | Pangaea Re 2018-3, 7/1/22 | 6,223 |
| | 245,774+(a)(i) | | Pangaea Re 2019-1, 2/1/23 | 5,121 |
| | 220,594+(a)(i) | | Pangaea Re 2019-3, 7/1/23 | 7,935 |
| | 500,000+(a)(i) | | St. Andrews Re 2017-1, 2/1/21 | 33,900 |
| | 521,395+(a)(i) | | St. Andrews Re 2017-4, 6/1/21 | 51,305 |
| | 250,000+(a)(j) | | Thopas Re 2018, 12/31/21 | 6,100 |
| | 250,000+(a)(j) | | Thopas Re 2019, 12/31/22 | 46,250 |
| | 600,000+(a)(i) | | Versutus Re 2017, 11/30/21 | — |
| | 300,000+(a)(i) | | Versutus Re 2018, 12/31/21 | 5,700 |
| | 264,763+(i) | | Versutus Re 2019-A, 12/31/21 | 11,835 |
| | 35,236+(i) | | Versutus Re 2019-B, 12/31/21 | 1,575 |
| | 250,000+(a)(j) | | Viribus Re 2018, 12/31/21 | 9,100 |
| | 106,153+(j) | | Viribus Re 2019, 12/31/22 | 4,289 |
| | 253,645+(a)(i) | | Woburn Re 2018, 12/31/21 | 23,370 |
| | 244,914+(a)(i) | | Woburn Re 2019, 12/31/22 | 83,452 |
| | | | | $ 1,496,810 |
| | | | Total Reinsurance Sidecars | $ 1,618,447 |
| | | | TOTAL INSURANCE-LINKED SECURITIES | |
| | | | (Cost $4,212,032) | $ 2,967,495 |
| | |
| | Principal | | | |
| | Amount | | | |
| | USD ($) | | | |
| | | | SENIOR SECURED FLOATING RATE LOAN | |
| |
| | INTERESTS — 2.3% of Net Assets*(d) | |
| | | | Automobile — 0.2% | |
| | 526,688 | | First Brands Group LLC, First Lien Tranche B-3 Term | |
| | | | Loan, 8.5% (LIBOR + 750 bps), 2/2/24 | $ 519,445 |
| | | | Total Automobile | $ 519,445 |
| |
| | Diversified & Conglomerate Service — 0.7% | |
| | 689,444 | | DynCorp International, Inc., Term Loan, 7.0% (LIBOR + | |
| | | | 600 bps), 8/18/25 | $ 685,997 |
| | 1,075,640 | | Team Health Holdings, Inc., Initial Term Loan, 3.75% | |
| | | | (LIBOR + 275 bps), 2/6/24 | 879,336 |
| | | | Total Diversified & Conglomerate Service | $ 1,565,333 |
| |
| | Healthcare, Education & Childcare — 0.5% | |
| | 631,182 | | Alliance HealthCare Services, Inc., First Lien Initial Term | |
| | | | Loan, 5.5% (LIBOR + 450 bps), 10/24/23 | $ 577,531 |
| | 318,400 | | Surgery Center Holdings, Inc., 2020 Incremental Term | |
| | | | Loan, 9.0% (LIBOR + 800 bps), 9/3/24 | 324,768 |
| | | | Total Healthcare, Education & Childcare | $ 902,299 |
The accompanying notes are an integral part of these financial statements.
32 Pioneer Global High Yield Fund | Annual Report | 10/31/20
| | | | | |
| | Principal | | | |
| | Amount | | | |
| | USD ($) | | | Value |
| | | | Machinery — 0.3% | |
| | 860,469 | | Shape Technologies Group, Inc., Initial Term Loan, | |
| | | | 3.149% (LIBOR + 300 bps), 4/21/25 | $ 658,976 |
| | | | Total Machinery | $ 658,976 |
| | | | Media — 0.1% | |
| | 189,762 | | Diamond Sports Group LLC, Term Loan, 3.4% (LIBOR + | |
| | | | 325 bps), 8/24/26 | $ 118,779 |
| | | | Total Media | $ 118,779 |
| | | | Securities & Trusts — 0.4% | |
| | 1,030,100 | | Spectacle Gary Holdings LLC, Closing Date Term Loan, | |
| | | | 11.0% (LIBOR + 900 bps), 12/23/25 | $ 976,664 |
| | | | Total Securities & Trusts | $ 976,664 |
| | | | Utilities — 0.1% | |
| | 314,213 | | PG&E Corp., Term Loan, 5.5% (LIBOR + | |
| | | | 450 bps), 6/23/25 | $ 312,445 |
| | | | Total Utilities | $ 312,445 |
| | | | TOTAL SENIOR SECURED FLOATING RATE LOAN INTERESTS | |
| | | | (Cost $5,332,050) | $ 5,053,941 |
| | | | U.S. GOVERNMENT AND AGENCY OBLIGATION — | |
| | | | 3.6% of Net Assets | |
| | 8,000,000(g) | | U.S. Treasury Bills, 11/17/20 | $ 7,999,761 |
| | | | TOTAL U.S. GOVERNMENT AND AGENCY OBLIGATION | |
| | | | (Cost $7,999,696) | $ 7,999,761 |
| | |
| | Shares | | | |
| | | | RIGHTS/WARRANTS — 0.0%† of Net Assets | |
| | | | Metals & Mining — 0.0%† | |
| | 318,254(k) | | ANR, Inc., 3/31/23 | $ 955 |
| | | | Total Metals & Mining | $ 955 |
| | | | Oil, Gas & Consumable Fuels — 0.0%† | |
| | 61(a)(l) | | Contura Energy, Inc., 7/25/23 | $ 39 |
| | | | Total Oil, Gas & Consumable Fuels | $ 39 |
| | | | TOTAL RIGHTS/WARRANTS | |
| | | | (Cost $36,831) | $ 994 |
The accompanying notes are an integral part of these financial statements.
Pioneer Global High Yield Fund | Annual Report | 10/31/20 33
Schedule of Investments | 10/31/20 (continued)
| | | | | | | | | |
| | Number of | | | | | Strike | Expiration | |
| | Contracts | | Description | Counterparty | Amount
| Price | Date | Value |
| | | | OVER THE COUNTER (OTC) CALL OPTIONS | |
| | | | PURCHASED — 0.0%† | | | |
| | 297,012^(m) | | Desarrolladora Bank of | | | | |
| | | | Homex | New York | | | | |
| | | | SAB de CV | Mellon Corp. | MXN — | MXN —(o)
| 10/23/22
| $ — |
| | 297,012^(n) | | Desarrolladora
| Bank of
| | | | |
| | | | Homex | New York | | | | |
| | | | SAB de CV | Mellon Corp. | MXN — | MXN —(o)
| 10/23/22
| — |
| | | | | | | | | $ — |
| | | | TOTAL OVER THE COUNTER (OTC) CALL | | |
| | | | OPTIONS PURCHASED | | | | |
| | | | (Premiums paid $0) | | | | $ — |
| | | | OVER THE COUNTER (OTC) CURRENCY PUT | |
| | | | OPTIONS PURCHASED — 0.0%† | | |
| | 3,910,000 | | Put EUR | Bank of | | | | |
| | | | Call USD | America NA | USD 60,901 | USD 1.11 | 3/8/21 | $ 12,618 |
| | 1,973,500 | | Put EUR | Bank of | | | | |
| | | | Call USD | America NA | EUR 32,660 | EUR 1.11 | 6/4/21 | 13,078 |
| | 3,850,000 | | Put EUR | Goldman Sachs | | | | |
| | | | Call USD | International | EUR 31,009 | EUR 1.13 | 12/18/20 | 8,948 |
| | | | | | | | | $ 34,644 |
| | | | TOTAL OVER THE COUNTER (OTC) CURRENCY PUT | |
| | | | OPTIONS PURCHASED | | | | |
| | | | (Premiums paid $124,570) | | | $ 34,644 |
| | | | TOTAL OPTIONS PURCHASED | | | |
| | | | (Premiums paid $124,570) | | | $ 34,644 |
| | | | TOTAL INVESTMENTS IN UNAFFILIATED ISSUERS — 95.7% | |
| | | | (Cost $226,779,186) | | | | $210,522,983 |
| | |
| | Number of | | | | | Strike | Expiration | |
| | Contracts | | Description | Counterparty | Amount
| Price | Date | Value |
| | | | OVER THE COUNTER (OTC) CURRENCY CALL | |
| | | | OPTIONS WRITTEN — (0.0)%† | | | |
| | (3,910,000) | | Call EUR | Bank of | | | | |
| | | | Put USD | America NA | USD 60,901 | USD 1.20 | 3/8/21 | $ (28,844) |
| | (1,973,500) | | Call EUR | Bank of | | | | |
| | | | Put USD | America NA | EUR 32,660 | EUR 1.17 | 6/4/21 | (47,939) |
| | (3,850,000) | | Call EUR | Goldman Sachs | | | | |
| | | | Put USD | International | EUR 31,009 | EUR 1.20 | 12/18/20 | (14,750) |
| | | | | | | | | $ (91,533) |
| | | | TOTAL OVER THE COUNTER (OTC) CURRENCY CALL | |
| | | | OPTIONS WRITTEN | | | | |
| | | | (Premiums received $(124,570)) | | | $ (91,533) |
| | | | OTHER ASSETS AND LIABILITIES — 4.3% | | $ 9,416,299 |
| | | | NET ASSETS — 100.0% | | | | $219,847,749 |
The accompanying notes are an integral part of these financial statements.
34 Pioneer Global High Yield Fund | Annual Report | 10/31/20
| | |
BADLARPP
| Argentine Deposit Rate Badlar Private Banks 30 – 35 Days.
|
| bps | Basis Points. |
| CMT | Constant Maturity Treasury Index. |
| LIBOR | London Interbank Offered Rate. |
| REIT | Real Estate Investment Trust. |
| SOFRRATE | Secured Overnight Financing Rate. |
| (144A) | Security is exempt from registration under Rule 144A of the Securities Act of 1933. Such securities may be resold normally to qualified institutional buyers in a transaction exempt from registration. At October 31, 2020, the value of these securities amounted to $159,643,467, or 72.6% of net assets. |
† | Amount rounds to less than 0.1%. |
* | Senior secured floating rate loan interests in which the Fund invests generally pay interest at rates that are periodically redetermined by reference to a base lending rate plus a premium. These base lending rates are generally (i) the lending rate offered by one or more major European banks, such as LIBOR, (ii) the prime rate offered by one or more major United States banks, (iii) the rate of a certificate of deposit or (iv) other base lending rates used by commercial lenders. The interest rate shown is the rate accruing at October 31, 2020. |
+ | Security that used significant unobservable inputs to determine its value. |
^ | Security is valued using fair value methods (other than supplied by independent pricing services). |
(a) | Non-income producing security. |
(b) | The interest rate is subject to change periodically. The interest rate and/or reference index and spread shown at October 31, 2020. |
(c) | Security is perpetual in nature and has no stated maturity date. |
(d) | Floating rate note. Coupon rate, reference index and spread shown at October 31, 2020. |
(e) | Payment-in-kind (PIK) security which may pay interest in the form of additional principal amount. |
(f) | Security is in default. |
(g) | Security issued with a zero coupon. Income is recognized through accretion of discount. |
(h) | Debt obligation initially issued at one coupon which converts to a higher coupon at a specific date. The rate shown is the rate at October 31, 2020. |
(i) | Issued as participation notes. |
(j) | Issued as preference shares. |
(k) | ANR, Inc. warrants are exercisable into 318,254 shares. |
(l) | Contura Energy, Inc. warrants are exercisable into 61 shares. |
(m) | Option does not become effective until underlying company’s outstanding common shares reach a market capitalization of MXN 12.5 Billion. |
(n) | Option does not become effective until underlying company’s outstanding common shares reach a market capitalization of MXN 15.0 Billion. |
(o) | Strike price is 1 Mexican Peso (MXN). |
# | Securities are restricted as to resale. |
The accompanying notes are an integral part of these financial statements.
Pioneer Global High Yield Fund | Annual Report | 10/31/20 35
Schedule of Investments | 10/31/20 (continued)
| | | | | | | | |
| Restricted Securities | Acquisition date | | Cost | | | Value | |
Alturas Re 2019-2 | 12/19/2018 | | $ | 3,037 | | | $ | 16,206 | |
Bantry Re 2017 | 2/6/2019 | | | 70,837 | | | | 70,830 | |
Bantry Re 2018 | 2/6/2019 | | | 2,845 | | | | 2,850 | |
Bantry Re 2019 | 2/1/2019 | | | — | | | | 8,491 | |
Bantry Re, 2016 | 2/6/2019 | | | 39,494 | | | | 39,494 | |
Berwick Re 2018-1 | 1/10/2018 | | | 270,961 | | | | 173,089 | |
Berwick Re 2019-1 | 12/31/2018 | | | 66,532 | | | | 66,537 | |
Blue Lotus Re 2018 | 12/20/2017 | | | — | | | | 10,925 | |
Caelus Re V | 5/4/2018 | | | 250,000 | | | | 100,000 | |
Caelus Re V | 4/27/2017 | | | 500,000 | | | | 44 | |
Carnoustie Re 2017 | 1/5/2017 | | | 190,205 | | | | 105,440 | |
Cypress Re 2017 | 1/24/2017 | | | 2,017 | | | | 10,920 | |
Dartmouth Re 2018 | 1/18/2018 | | | 190,089 | | | | 99,869 | |
Dingle Re 2019 | 3/4/2019 | | | — | | | | 5,131 | |
Eden Re II | 12/15/2017 | | | 747 | | | | 8,606 | |
Eden Re II | 1/23/2018 | | | 520 | | | | 14,945 | |
Formby Re 2018 | 7/9/2018 | | | 37,012 | | | | 44,229 | |
Gleneagles Re 2016 | 1/14/2016 | | | — | | | | 49,920 | |
Gleneagles Re 2018 | 12/27/2017 | | | 20,068 | | | | 29,575 | |
Gloucester Re 2018 | 1/2/2018 | | | 63,180 | | | | 68,618 | |
Harambee Re 2018 | 12/19/2017 | | | 78,048 | | | | 8,200 | |
Harambee Re 2019 | 4/24/2019 | | | — | | | | 7,997 | |
International Bank for Reconstruction & Development | 2/2/2018 | | | 175,000 | | | | 175,350 | |
Limestone Re | 12/15/2016 | | | 990 | | | | 196 | |
Limestone Re 2016-1 | 12/15/2016 | | | 990 | | | | 196 | |
Lorenz Re 2018 | 6/26/2018 | | | 120,727 | | | | 12,330 | |
Lorenz Re 2019 | 7/10/2019 | | | 75,309 | | | | 22,387 | |
Merion Re 2018-2 | 12/28/2017 | | | 600,000 | | | | 666,371 | |
Oakmont Re 2017 | 5/10/2017 | | | — | | | | 7,350 | |
Oyster Bay Re 2018 | 1/17/2018 | | | 247,922 | | | | 252,104 | |
Pangaea Re 2016-2 | 5/31/2016 | | | — | | | | 1,783 | |
Pangaea Re 2018-1 | 12/26/2017 | | | 42,902 | | | | 6,316 | |
Pangaea Re 2018-3 | 5/31/2018 | | | 72,258 | | | | 6,223 | |
Pangaea Re 2019-1 | 1/9/2019 | | | 2,580 | | | | 5,121 | |
Pangaea Re 2019-3 | 7/25/2019 | | | 6,618 | | | | 7,935 | |
Portrush Re 2017 | 6/12/2017 | | | 230,096 | | | | 191,430 | |
Resilience Re | 4/13/2017 | | | 1,307 | | | | 40 | |
Seminole Re 2018 | 1/2/2018 | | | 3,872 | | | | 8,420 | |
St. Andrews Re 2017-1 | 1/5/2017 | | | 33,874 | | | | 33,900 | |
St. Andrews Re 2017-4 | 3/31/2017 | | | — | | | | 51,305 | |
Tailwind Re 2017-1 | 12/20/2017 | | | 250,000 | | | | 253,775 | |
Thopas Re 2018 | 12/12/2017 | | | 40,037 | | | | 6,100 | |
Thopas Re 2019 | 12/21/2018 | | | 42,624 | | | | 46,250 | |
Versutus Re 2017 | 1/5/2017 | | | 39,744 | | | | — | |
Versutus Re 2018 | 1/31/2018 | | | 10,190 | | | | 5,700 | |
Versutus Re 2019-A | 1/28/2019 | | | — | | | | 11,835 | |
Versutus Re 2019-B | 12/24/2018 | | | — | | | | 1,575 | |
Viribus Re 2018 | 12/22/2017 | | | 33,085 | | | | 9,100 | |
Viribus Re 2019 | 3/25/2019 | | | — | | | | 4,289 | |
Walton Health Re 2018 | 6/25/2018 | | | 226,797 | | | | 131,376 | |
Woburn Re 2018 | 3/20/2018 | | | 94,515 | | | | 23,370 | |
Woburn Re 2019 | 1/30/2019 | | | 75,003 | | | | 83,452 | |
| Total Restricted Securities | | | | | | | $ | 2,967,495 | |
| % of Net assets | | | | | | | | 1.4 | % |
The accompanying notes are an integral part of these financial statements.
36 Pioneer Global High Yield Fund | Annual Report | 10/31/20
| | | | | | | | | | | | | | |
FORWARD FOREIGN CURRENCY EXCHANGE CONTRACTS
| |
| | | | | | | | | | | | | | |
| | In | | | | | | | | | | Unrealized | |
| Currency | | Exchange | | Currency | | | | | | Settlement | | Appreciation | |
| Purchased | | for | | Sold | | Deliver | | | Counterparty | Date | | (Depreciation) | |
| EUR | | | 9,844,000 | | USD | | | (11,551,429 | ) | | Bank of New York | 11/24/20 | | $ | (83,301 | ) |
| | | | | | | | | | | Mellon Corp. | | | | | |
| NOK | | | 20,938,362 | | EUR | | | (1,913,449 | ) | | Bank of New York | | | | | |
| | | | | | | | | | | Mellon Corp. | 1/7/21 | | | (40,466 | ) |
| USD | | | 820,179 | | EUR | | | (700,000 | ) | | State Street Bank | 11/24/20 | | | 4,689 | |
| | | | | | | | | | | & Trust Co. | | | | | |
| TOTAL FORWARD FOREIGN CURRENCY EXCHANGE CONTRACTS | $ | (119,078 | ) |
SWAP CONTRACTS
CENTRALLY CLEARED CREDIT DEFAULT SWAP CONTRACTS — SELL PROTECTION
| | | | | | | | |
| Obligation | | Annual | | Premiums | Unrealized | |
| Notional | Reference/ | Pay/ | Fixed | Expiration | Paid/ | Appreciation | Market |
Amount ($)(1) | Index | Receive(2) | Rate
| Date | (Received) | (Depreciation)
| Value |
1,194,250 | Markit CDX | Receive | 5.00% | 12/20/20 | $ (5,639) | $ 18,876 | $ 13,237 |
| North America | | | | | | |
| High Yield Index | | | | | | |
| Series 25 | | | | | | |
| 1,909,200 | Markit CDX | Receive | 5.00% | 6/20/21 | (18,297) | 60,625 | 42,328 |
| North America | | | | | | |
| High Yield Index | | | | | | |
| Series 26 | | | | | | |
| 2,270,000 | Markit CDX | Receive | 5.00% | 12/20/25 | 139,946 | (50,862) | 89,084 |
| North America | | | | | | |
| High Yield Index | | | | | | |
| Series 35 | | | | | | |
| TOTAL SWAP CONTRACTS | | | | $116,010 | $ 28,639 | $144,649 |
(1) | The notional amount is the maximum amount that a seller of credit protection would be obligated to pay upon occurrence of a credit event. |
(2) | Receives quarterly. |
Principal amounts are denominated in U.S. dollars (“USD”) unless otherwise noted.
ARS — Argentine Peso
EUR — Euro
GBP — Great British Pound
IDR — Indonesian Rupiah
MXN — Mexican Peso
NOK — Norwegian Krone
Purchases and sales of securities (excluding temporary cash investments) for the year ended October 31, 2020 were as follows:
| | | | | | | |
| | Purchases | | | Sales | |
Long-Term U.S. Government Securities | | $ | 13,534,466 | | | $ | 13,540,552 | |
Other Long-Term Securities | | $ | 208,430,623 | | | $ | 265,878,964 | |
The accompanying notes are an integral part of these financial statements.
Pioneer Global High Yield Fund | Annual Report | 10/31/20 37
Schedule of Investments | 10/31/20 (continued)
The Fund is permitted to engage in purchase and sale transactions (“cross trades”) with certain funds and accounts for which Amundi Pioneer Asset Management, Inc. (the “Adviser”) serves as the Fund’s investment adviser, as set forth in Rule 17a-7 under the Investment Company Act of 1940, pursuant to procedures adopted by the Board of Trustees. Under these procedures, cross trades are effected at current market prices. During the year ended October 31, 2020, the Fund engaged in sales of $7,711,649 which resulted in a net realized gain/(loss) of $(237,126). During the year ended October 31, 2020, the Fund did not engage in purchases pursuant to these procedures.
At October 31, 2020, the net unrealized depreciation on investments based on cost for federal tax purposes of $227,295,602 was as follows:
| | | | |
| Aggregate gross unrealized appreciation for all investments in which | | | |
| there is an excess of value over tax cost | | $ | 6,155,536 | |
| Aggregate gross unrealized depreciation for all investments in which | | | | |
| there is an excess of tax cost over value | | | (22,994,117 | ) |
| Net unrealized depreciation | | $ | (16,838,581 | ) |
Various inputs are used in determining the value of the Fund’s investments. These inputs are summarized in the three broad levels below.
Level 1 – quoted prices in active markets for identical securities.
Level 2 – other significant observable inputs (including quoted prices for similar securities, interest rates, prepayment speeds, credit risks, etc.). See Notes to Financial Statements —Note 1A.
Level 3 – significant unobservable inputs (including the Fund’s own assumptions in determining fair value of investments). See Notes to Financial Statements — Note 1A.
The following is a summary of the inputs used as of October 31, 2020, in valuing the Fund’s investments:
| | | | | | | | | | | | | |
| | Level 1 | | | Level 2 | | | Level 3 | | | Total | |
Common Stocks | | | | | | | | | | | | |
| Oil, Gas & Consumable Fuels | | $ | 16 | | | $ | — | | | $ | 172,055 | | | $ | 172,071 | |
| Paper & Forest Products | | | — | | | | 18,839 | | | | — | | | | 18,839 | |
| All Other Common Stocks | | | 14,681 | | | | — | | | | — | | | | 14,681 | |
Asset Backed Security | | | — | | | | 482,046 | | | | — | | | | 482,046 | |
Commercial Mortgage-Backed | | | | | | | | | | | | | | | | |
| Security | | | — | | | | 753,643 | | | | — | | | | 753,643 | |
Convertible Corporate Bonds | | | | | | | | | | | | | | | | |
| Banks | | | — | | | | — | | | | 38,216 | | | | 38,216 | |
| All Other Convertible | | | | | | | | | | | | | | | | |
| Corporate Bonds | | | — | | | | 5,784,547 | | | | — | | | | 5,784,547 | |
Corporate Bonds | | | — | | | | 176,397,902 | | | | — | | | | 176,397,902 | |
Foreign Government Bonds | | | — | | | | 10,804,203 | | | | — | | | | 10,804,203 | |
Insurance-Linked Securities | | | | | | | | | | | | | | | | |
| Catastrophe Linked Bonds | | | | | | | | | | | | | | | | |
| Multiperil - U.S. | | | — | | | | 353,775 | | | | 44 | | | | 353,819 | |
| Collateralized Reinsurance | | | | | | | | | | | | | | | | |
| Multiperil - U.S. | | | — | | | | — | | | | 5,131 | | | | 5,131 | |
| Multiperil - Worldwide | | | — | | | | — | | | | 571,739 | | | | 571,739 | |
| Windstorm - Florida | | | — | | | | — | | | | 235,659 | | | | 235,659 | |
| Windstorm - U.S. Regional | | | — | | | | — | | | | 7,350 | | | | 7,350 | |
| Reinsurance Sidecars | | | | | | | | | | | | | | | | |
| Multiperil - U.S. | | | — | | | | — | | | | 121,637 | | | | 121,637 | |
| Multiperil - Worldwide | | | — | | | | — | | | | 1,496,810 | | | | 1,496,810 | |
| All Other Insurance-Linked | | | | | | | | | | | | | | | | |
| Security | | | — | | | | 175,350 | | | | — | | | | 175,350 | |
The accompanying notes are an integral part of these financial statements.
38 Pioneer Global High Yield Fund | Annual Report | 10/31/20
| | | | | | | | | | | | | |
| | Level 1 | | | Level 2 | | | Level 3 | | | Total | |
Senior Secured Floating Rate | | | | | | | | | | | | |
| Loan Interests | | $ | — | | | $ | 5,053,941 | | | $ | — | | | $ | 5,053,941 | |
U.S. Government and | | | | | | | | | | | | | | | | |
| Agency Obligation | | | — | | | | 7,999,761 | | | | — | | | | 7,999,761 | |
Rights/Warrants | | | — | | | | 994 | | | | — | | | | 994 | |
Over The Counter (OTC) | | | | | | | | | | | | | | | | |
| Call Option Purchased | | | — | | | | — | * | | | — | | | | — | * |
Over The Counter (OTC) | | | | | | | | | | | | | | | | |
| Currency Put | | | | | | | | | | | | | | | | |
| Option Purchased | | | — | | | | 34,644 | | | | — | | | | 34,644 | |
| Total Investments | | | | | | | | | | | | | | | | |
| in Securities | | $ | 14,697 | | | $ | 207,859,645 | | | $ | 2,648,641 | | | $ | 210,522,983 | |
| Other Financial Instruments | | | | | | | | | | | | | | | | |
| Over The Counter (OTC) | | | | | | | | | | | | | | | | |
| Currency Call Option Written $ | | | — | | | $ | (91,533 | ) | | $ | — | | | $ | (91,533 | ) |
| Net unrealized depreciation | | | | | | | | | | | | | | | | |
| on forward foreign currency | | | | | | | | | | | | | | | | |
| exchange contracts | | | — | | | | (119,078 | ) | | | — | | | | (119,078 | ) |
| Swap contracts, at value | | | — | | | | 144,649 | | | | — | | | | 144,649 | |
| Total Other | | | | | | | | | | | | | | | | |
| Financial Instruments | | $ | — | | | $ | (65,962 | ) | | $ | — | | | $ | (65,962 | ) |
The following is a reconciliation of assets valued using significant unobservable inputs (Level 3):
| | | | | | | | | | | | | |
| | | | | Convertible | | | Insurance- | | | | |
| | Common | | | Corporate | | | Linked | | | | |
| | Stocks | | | Bonds | | | Securities | | | Total | |
Balance as of 10/31/19 | | $ | 860,272 | | | $ | — | | | $ | 8,606,139 | | | $ | 9,466,411 | |
Realized gain (loss)(1) | | | — | | | | — | | | | (114,931 | ) | | | (114,931 | ) |
Change in unrealized appreciation | | | | | | | | | | | | | | | | |
(depreciation)(2) | | | (688,217 | ) | | | (41,418 | ) | | | (361,689 | ) | | | (1,091,324 | ) |
Accrued discounts/premiums | | | — | | | | — | | | | — | | | | — | |
Purchases | | | — | | | | — | | | | — | | | | — | |
Sales | | | — | | | | — | | | | (5,691,199 | ) | | | (5,691,199 | ) |
Transfers in to Level 3* | | | — | | | | 79,634 | | | | 50 | | | | 79,684 | |
Transfers out of Level 3* | | | — | | | | — | | | | — | | | | — | |
| Balance as of 10/31/20 | | $ | 172,055 | | | $ | 38,216 | | | $ | 2,438,370 | | | $ | 2,648,641 | |
(1)
| Realized gain (loss) on these securities is included in the realized gain (loss) from investments on the Statement of Operations. |
(2)
| Unrealized appreciation (depreciation) on these securities is included in the change in unrealized appreciation (depreciation) from investments on the Statement of Operations. |
*
| Transfers are calculated on the beginning of period value. For the year ended October 31, 2020, securities with an aggregate market value of $79,684 transferred from Level 2 to Level 3 as there were no longer observable inputs available to determine their value. For the year ended October 31, 2020, securities with an aggregate market value of $305 transferred from Level 1 to Level 2. There were no other transfers between Level 1, 2 and 3. |
| | | | | |
| | Net change in unrealized appreciation (depreciation) of Level 3 investments still | | | |
| | held and considered Level 3 at October 31, 2020: | | $ | (863,145 | ) |
The accompanying notes are an integral part of these financial statements.
Pioneer Global High Yield Fund | Annual Report | 10/31/20 39
Statement of Assets and Liabilities |
10/31/20 | | | | |
| ASSETS: | | | |
| Investments in unaffiliated issuers, at value (cost $226,779,186) | | $ | 210,522,983 | |
| Cash | | | 8,566,461 | |
| Foreign currencies, at value (cost $491,538) | | | 477,762 | |
| Swaps collateral | | | 393,351 | |
| Swap contracts, at value (net premiums paid $116,010) | | | 144,649 | |
| Unrealized appreciation on unfunded loan commitments | | | 827 | |
| Receivables — | | | | |
| Investment securities sold | | | 1,720,006 | |
| Fund shares sold | | | 84,948 | |
| Interest | | | 3,605,827 | |
| Other assets | | | 31,407 | |
| Total assets | | $ | 225,548,221 | |
| LIABILITIES: | | | | |
| Payables — | | | | |
| Investment securities purchased | | $ | 4,109,983 | |
| Fund shares repurchased | | | 887,361 | |
| Distributions | | | 142,274 | |
| Trustees’ fees | | | 602 | |
| Due to broker for swaps | | | 148,111 | |
| Variation margin for centrally cleared swap contracts | | | 3,053 | |
| Written options outstanding (net premiums received $(124,570)) | | | 91,533 | |
| Net unrealized depreciation on forward foreign currency exchange contracts | | | 119,078 | |
| Due to affiliates | | | 40,173 | |
| Accrued expenses | | | 158,304 | |
| Total liabilities | | $ | 5,700,472 | |
| NET ASSETS: | | | | |
| Paid-in capital | | $ | 547,217,381 | |
| Distributable earnings (loss) | | | (327,369,632 | ) |
| Net assets | | $ | 219,847,749 | |
| NET ASSET VALUE PER SHARE: | | | | |
No par value (unlimited number of shares authorized) | | | | |
| Class A (based on $132,580,478/16,821,673 shares) | | $ | 7.88 | |
| Class C (based on $17,265,625/2,193,175 shares) | | $ | 7.87 | |
| Class Y (based on $70,001,646/9,050,453 shares) | | $ | 7.73 | |
| MAXIMUM OFFERING PRICE PER SHARE: | | | | |
| Class A (based on $7.88 net asset value per share/100%-4.50% | | | | |
| maximum sales charge) | | $ | 8.25 | |
The accompanying notes are an integral part of these financial statements.
40 Pioneer Global High Yield Fund | Annual Report | 10/31/20
| |
| Statement of Operations |
| FOR THE YEAR ENDED 10/31/20 |
| | |
| INVESTMENT INCOME: | | | | | | |
| Interest from unaffiliated issuers (net of foreign taxes | | | | | | |
| withheld $6,919) | | $ | 16,646,191 | | | | |
| Dividends from unaffiliated issuers (net of foreign taxes | | | | | | | |
| withheld $67,812) | | | 392,085 | | | | |
| Total investment income | | | | | | $ | 17,038,276 | |
| EXPENSES: | | | | | | | | |
| Management fees | | $ | 1,741,062 | | | | | |
| Administrative expense | | | 112,810 | | | | | |
| Transfer agent fees | | | | | | | | |
| Class A | | | 134,248 | | | | | |
| Class C | | | 34,086 | | | | | |
| Class Y | | | 82,924 | | | | | |
| Distribution fees | | | | | | | | |
| Class A | | | 349,417 | | | | | |
| Class C | | | 248,742 | | | | | |
| Shareowner communications expense | | | 33,001 | | | | | |
| Custodian fees | | | 39,056 | | | | | |
| Registration fees | | | 59,588 | | | | | |
| Professional fees | | | 51,492 | | | | | |
| Printing expense | | | 42,438 | | | | | |
| Pricing fees | | | 31,888 | | | | | |
| Trustees’ fees | | | 9,021 | | | | | |
| Insurance expense | | | 4,475 | | | | | |
| Interest expense | | | 177 | | | | | |
| Miscellaneous | | | 56,331 | | | | | |
| Total expenses | | | | | | $ | 3,030,756 | |
| Less fees waived and expenses reimbursed by the Adviser | | | | | | | (179,174 | ) |
| Net expenses | | | | | | $ | 2,851,582 | |
| Net investment income | | | | | | $ | 14,186,694 | |
| REALIZED AND UNREALIZED GAIN (LOSS) ON INVESTMENTS: | | | | | |
| Net realized gain (loss) on: | | | | | | | | |
| Investments in unaffiliated issuers | | $ | (24,603,370 | ) | | | | |
| Written options | | | 197,688 | | | | | |
| Forward foreign currency exchange contracts | | | 268,439 | | | | | |
| Swap contracts | | | (2,110,180 | ) | | | | |
| Other assets and liabilities denominated in | | | | | | | | |
| foreign currencies | | | 191,061 | | | $ | (26,056,362 | ) |
| Change in net unrealized appreciation (depreciation) on: | | | | | | | | |
| Investments in unaffiliated issuers | | $ | (734,480 | ) | | | | |
| Written options | | | (149,868 | ) | | | | |
| Forward foreign currency exchange contracts | | | (78,467 | ) | | | | |
| Swap contracts | | | 115,778 | | | | | |
| Unfunded loan commitments | | | 827 | | | | | |
| Other assets and liabilities denominated in foreign currencies | | | 1,040 | | | $ | (845,170 | ) |
| Net realized and unrealized gain (loss) on investments | | | | | | $ | (26,901,532 | ) |
| Net decrease in net assets resulting from operations | | | | | | $ | (12,714,838 | ) |
The accompanying notes are an integral part of these financial statements.
Pioneer Global High Yield Fund | Annual Report | 10/31/20 41
Statements of Changes in Net Assets
| | | | | | | |
| | Year | | | Year | |
| | Ended | | | Ended | |
| | 10/31/20 | | | 10/31/19 | |
| FROM OPERATIONS: | | | | | | |
Net investment income (loss) | | $ | 14,186,694 | | | $ | 18,450,851 | |
Net realized gain (loss) on investments | | | (26,056,362 | ) | | | (16,035,145 | ) |
Change in net unrealized appreciation (depreciation) | | | | | | | | |
| on investments | | | (845,170 | ) | | | 17,002,659 | |
| Net increase (decrease) in net assets resulting | | | | | | | | |
| from operations | | $ | (12,714,838 | ) | | $ | 19,418,365 | |
| DISTRIBUTIONS TO SHAREOWNERS: | | | | | | | | |
| Class A ($0.44 and $0.44 per share, respectively) | | $ | (7,607,774 | ) | | $ | (8,505,350 | ) |
| Class C ($0.36 and $0.37 per share, respectively) | | | (1,116,180 | ) | | | (2,108,733 | ) |
| Class Y ($0.45 and $0.45 per share, respectively) | | | (4,758,177 | ) | | | (6,505,082 | ) |
Tax return of capital: | | | | | | | | |
| Class A ($0.02 and $0.02 per share, respectively) | | | (422,850 | ) | | | (347,180 | ) |
| Class C ($0.02 and $0.02 per share, respectively) | | | (71,769 | ) | | | (97,011 | ) |
| Class Y ($0.02 and $0.02 per share, respectively) | | | (247,451 | ) | | | (255,692 | ) |
| Total distributions to shareowners | | $ | (14,224,201 | ) | | $ | (17,819,048 | ) |
| FROM FUND SHARE TRANSACTIONS: | | | | | | | | |
Net proceeds from sales of shares | | $ | 39,524,717 | | | $ | 47,115,843 | |
Reinvestment of distributions | | | 12,011,372 | | | | 15,175,861 | |
Cost of shares repurchased | | | (112,842,709 | ) | | | (123,101,208 | ) |
| Net decrease in net assets resulting from | | | | | | | | |
| Fund share transactions | | $ | (61,306,620 | ) | | $ | (60,809,504 | ) |
| Net decrease in net assets | | $ | (88,245,659 | ) | | $ | (59,210,187 | ) |
| NET ASSETS: | | | | | | | | |
Beginning of year | | $ | 308,093,408 | | | $ | 367,303,595 | |
End of year | | $ | 219,847,749 | | | $ | 308,093,408 | |
The accompanying notes are an integral part of these financial statements.
42 Pioneer Global High Yield Fund | Annual Report | 10/31/20
| | | | | | | | | | | | | |
| | Year Ended | | | Year Ended | | | Year Ended | | | Year Ended | |
| | 10/31/20 | | | 10/31/20 | | | 10/31/19 | | | 10/31/19 | |
| | Shares | | | Amount | | | Shares | | | Amount | |
| Class A | | | | | | | | | | | | |
Shares sold | | | 1,978,870 | | | $ | 15,555,737 | | | | 2,888,912 | | | $ | 24,625,526 | |
Reinvestment of | | | | | | | | | | | | | | | | |
| distributions | | | 891,978 | | | | 7,065,967 | | | | 921,422 | | | | 7,839,734 | |
Less shares repurchased | | | (4,735,012 | ) | | | (37,419,166 | ) | | | (5,516,071 | ) | | | (46,818,686 | ) |
| Net decrease | | | (1,864,164 | ) | | $ | (14,797,462 | ) | | | (1,705,737 | ) | | $ | (14,353,426 | ) |
| Class C | | | | | | | | | | | | | | | | |
Shares sold | | | 73,389 | | | $ | 593,219 | | | | 105,877 | | | $ | 886,605 | |
Reinvestment of | | | | | | | | | | | | | | | | |
| distributions | | | 126,903 | | | | 1,007,607 | | | | 220,439 | | | | 1,867,374 | |
Less shares repurchased | | | (2,045,110 | ) | | | (16,366,689 | ) | | | (3,438,461 | ) | | | (29,154,418 | ) |
| Net decrease | | | (1,844,818 | ) | | $ | (14,765,863 | ) | | | (3,112,145 | ) | | $ | (26,400,439 | ) |
| Class Y | | | | | | | | | | | | | | | | |
Shares sold | | | 3,031,125 | | | $ | 23,375,761 | | | | 2,583,429 | | | $ | 21,603,712 | |
Reinvestment of | | | | | | | | | | | | | | | | |
| distributions | | | 503,623 | | | | 3,937,798 | | | | 654,812 | | | | 5,468,753 | |
Less shares repurchased | | | (7,978,042 | ) | | | (59,056,854 | ) | | | (5,657,715 | ) | | | (47,128,104 | ) |
| Net decrease | | | (4,443,294 | ) | | $ | (31,743,295 | ) | | | (2,419,474 | ) | | $ | (20,055,639 | ) |
The accompanying notes are an integral part of these financial statements.
Pioneer Global High Yield Fund | Annual Report | 10/31/20 43
| | |
| | Year | | | Year | | | Year | | | Year | | | Year | |
| | Ended | | | Ended | | | Ended | | | Ended | | | Ended | |
| | 10/31/20 | | | 10/31/19 | | | 10/31/18 | | | 10/31/17 | | | 10/31/16* | |
| Class A | | | | | | | | | | | | | | | |
Net asset value, beginning of period | | $ | 8.57 | | | $ | 8.51 | | | $ | 9.12 | | | $ | 8.71 | | | $ | 8.64 | |
Increase (decrease) from investment operations: | | | | | | | | | | | | | | | | | | | | |
| Net investment income (loss) (a) | | $ | 0.46 | | | $ | 0.47 | | | $ | 0.49 | | | $ | 0.51 | | | $ | 0.54 | |
| Net realized and unrealized gain (loss) on investments | | | (0.69 | ) | | | 0.05 | | | | (0.65 | ) | | | 0.37 | | | | 0.04(b | ) |
| Net increase (decrease) from investment operations | | $ | (0.23 | ) | | $ | 0.52 | | | $ | (0.16 | ) | | $ | 0.88 | | | $ | 0.58 | |
Distributions to shareowners: | | | | | | | | | | | | | | | | | | | | |
| Net investment income | | $ | (0.44 | ) | | $ | (0.44 | ) | | $ | (0.45 | ) | | $ | (0.42 | ) | | $ | (0.47 | ) |
| Tax return of capital | | | (0.02 | ) | | | (0.02 | ) | | | — | | | | (0.05 | ) | | | (0.04 | ) |
| Total distributions | | $ | (0.46 | ) | | $ | (0.46 | ) | | $ | (0.45 | ) | | $ | (0.47 | ) | | $ | (0.51 | ) |
| Net increase (decrease) in net asset value | | $ | (0.69 | ) | | $ | 0.06 | | | $ | (0.61 | ) | | $ | 0.41 | | | $ | 0.07 | |
Net asset value, end of period | | $ | 7.88 | | | $ | 8.57 | | | $ | 8.51 | | | $ | 9.12 | | | $ | 8.71 | |
| Total return (c) | | | (2.57 | )% | | | 6.27 | % | | | (1.78 | )% | | | 10.33 | % | | | | |
Ratio of net expenses to average net assets | | | 1.14 | % | | | 1.25 | % | | | 1.17 | % | | | 1.18 | % | | | 1.19 | % |
Ratio of net investment income (loss) to average net assets | | | 5.72 | % | | | 5.57 | % | | | 5.56 | % | | | 5.71 | % | | | 6.50 | % |
Portfolio turnover rate | | | 94 | % | | | 54 | % | | | 48 | % | | | 53 | % | | | 40 | % |
Net assets, end of period (in thousands) | | $ | 132,580 | | | $ | 160,057 | | | $ | 173,588 | | | $ | 182,900 | | | $ | 201,360 | |
Ratios with no waiver of fees and assumption of expenses by | | | | | | | | | | | | | | | | | | | | |
| the Adviser and no reduction for fees paid indirectly: | | | | | | | | | | | | | | | | | | | | |
| Total expenses to average net assets | | | 1.23 | % | | | 1.26 | % | | | 1.17 | % | | | 1.18 | % | | | 1.19 | % |
| Net investment income (loss) to average net assets | | | 5.63 | % | | | 5.56 | % | | | 5.56 | % | | | 5.71 | % | | | 6.50 | % |
* | The Fund was audited by an independent registered public accounting firm other than Ernst & Young LLP. |
(a) | The per-share data presented above is based on the average shares outstanding for the period presented. |
(b) | The amount shown for a share outstanding does not correspond with the aggregate loss on investments for the period due to the timing of sales and repurchases of shares in relation to fluctuating market values of the investments of the Fund. |
(c) | Assumes initial investment at net asset value at the beginning of each period, reinvestment of all distributions, the complete redemption of the investment at net asset value at the end of each period and no sales charges. Total return would be reduced if sales charges were taken into account. |
(d) | If the Fund had not recognized gains in the settlement of class action lawsuits during the year ended October 31, 2016, the total return would have been 7.01%. |
The accompanying notes are an integral part of these financial statements.
44 Pioneer Global High Yield Fund | Annual Report | 10/31/20
| | | | | | | | | | | | | | | | |
| | Year | | | Year | | | Year | | | Year | | | Year | |
| | Ended | | | Ended | | | Ended | | | Ended | | | Ended | |
| | 10/31/20 | | | 10/31/19 | | | 10/31/18 | | | 10/31/17 | | | 10/31/16* | |
| Class C | | | | | | | | | | | | | | | |
Net asset value, beginning of period | | $ | 8.55 | | | $ | 8.49 | | | $ | 9.09 | | | $ | 8.69 | | | $ | 8.62 | |
Increase (decrease) from investment operations: | | | | | | | | | | | | | | | | | | | | |
| Net investment income (loss) (a) | | $ | 0.39 | | | $ | 0.41 | | | $ | 0.42 | | | $ | 0.44 | | | $ | 0.48 | |
| Net realized and unrealized gain (loss) on investments | | | (0.69 | ) | | | 0.04 | | | | (0.63 | ) | | | 0.36 | | | | 0.04(b | ) |
| Net increase (decrease) from investment operations | | $ | (0.30 | ) | | $ | 0.45 | | | $ | (0.21 | ) | | $ | 0.80 | | | $ | 0.52 | |
Distributions to shareowners: | | | | | | | | | | | | | | | | | | | | |
| Net investment income | | $ | (0.36 | ) | | $ | (0.37 | ) | | $ | (0.39 | ) | | $ | (0.35 | ) | | $ | (0.41 | ) |
| Tax return of capital | | | (0.02 | ) | | | (0.02 | ) | | | — | | | | (0.05 | ) | | | (0.04 | ) |
| Total distributions | | $ | (0.38 | ) | | $ | (0.39 | ) | | $ | (0.39 | ) | | $ | (0.40 | ) | | $ | (0.45 | ) |
| Net increase (decrease) in net asset value | | $ | (0.68 | ) | | $ | 0.06 | | | $ | (0.60 | ) | | $ | 0.40 | | | $ | 0.07 | |
Net asset value, end of period | | $ | 7.87 | | | $ | 8.55 | | | $ | 8.49 | | | $ | 9.09 | | | $ | 8.69 | |
| Total return (c) | | | (3.39 | )% | | | 5.46 | % | | | (2.39 | )% | | | 9.46 | % | | | 6.40 | %(d) |
Ratio of net expenses to average net assets | | | 2.02 | % | | | 1.97 | % | | | 1.90 | % | | | 1.89 | % | | | 1.90 | % |
Ratio of net investment income (loss) to average net assets | | | 4.83 | % | | | 4.86 | % | | | 4.75 | % | | | 5.01 | % | | | 5.79 | % |
Portfolio turnover rate | | | 94 | % | | | 54 | % | | | 48 | % | | | 53 | % | | | 40 | % |
Net assets, end of period (in thousands) | | $ | 17,266 | | | $ | 34,513 | | | $ | 60,700 | | | $ | 143,587 | | | $ | 183,542 | |
* | The Fund was audited by an independent registered public accounting firm other than Ernst & Young LLP. |
(a) | The per-share data presented above is based on the average shares outstanding for the period presented. |
(b) | The amount shown for a share outstanding does not correspond with the aggregate loss on investments for the period due to the timing of sales and repurchases of shares in relation to fluctuating market values of the investments of the Fund. |
(c) | Assumes initial investment at net asset value at the beginning of each period, reinvestment of all distributions, the complete redemption of the investment at net asset value at the end of each period and no sales charges. Total return would be reduced if sales charges were taken into account. |
(d) | If the Fund had not recognized gains in the settlement of class action lawsuits during the year ended October 31, 2016 the total return would have been 6.28%. |
The accompanying notes are an integral part of these financial statements.
Pioneer Global High Yield Fund | Annual Report | 10/31/20 45
Financial Highlights (continued)
| | |
| | Year | | | Year | | | Year | | | Year | | | Year | |
| | Ended | | | Ended | | | Ended | | | Ended | | | Ended | |
| | 10/31/20 | | | 10/31/19 | | | 10/31/18 | | | 10/31/17 | | | 10/31/16* | |
| Class Y | | | | | | | | | | | | | | | |
Net asset value, beginning of period | | $ | 8.41 | | | $ | 8.36 | | | $ | 8.95 | | | $ | 8.55 | | | $ | 8.49 | |
Increase (decrease) from investment operations: | | | | | | | | | | | | | | | | | | | | |
| Net investment income (loss) (a) | | $ | 0.47 | | | $ | 0.49 | | | $ | 0.50 | | | $ | 0.52 | | | $ | 0.57 | |
| Net realized and unrealized gain (loss) on investments | | | (0.68 | ) | | | 0.03 | | | | (0.62 | ) | | | 0.36 | | | | 0.01(b | ) |
| Net increase (decrease) from investment operations | | $ | (0.21 | ) | | $ | 0.52 | | | $ | (0.12 | ) | | $ | 0.88 | | | $ | 0.58 | |
Distributions to shareowners: | | | | | | | | | | | | | | | | | | | | |
| Net investment income | | $ | (0.45 | ) | | $ | (0.45 | ) | | $ | (0.47 | ) | | $ | (0.43 | ) | | $ | (0.48 | ) |
| Tax return of capital | | | (0.02 | ) | | | (0.02 | ) | | | — | | | | (0.05 | ) | | | (0.04 | ) |
| Total distributions | | $ | (0.47 | ) | | $ | (0.47 | ) | | $ | (0.47 | ) | | $ | (0.48 | ) | | $ | (0.52 | ) |
| Net increase (decrease) in net asset value | | $ | (0.68 | ) | | $ | 0.05 | | | $ | (0.59 | ) | | $ | 0.40 | | | $ | 0.06 | |
Net asset value, end of period | | $ | 7.73 | | | $ | 8.41 | | | $ | 8.36 | | | $ | 8.95 | | | $ | 8.55 | |
| Total return (c) | | | (2.37 | )% | | | 6.43 | % | | | (1.41 | )% | | | 10.60 | % | | | 7.34 | % |
Ratio of net expenses to average net assets | | | 0.90 | % | | | 0.96 | % | | | 0.92 | % | | | 0.91 | % | | | 0.90 | % |
Ratio of net investment income (loss) to average net assets | | | 5.94 | % | | | 5.85 | % | | | 5.73 | % | | | 5.96 | % | | | 6.93 | % |
Portfolio turnover rate | | | 94 | % | | | 54 | % | | | 48 | % | | | 53 | % | | | 40 | % |
Net assets, end of period (in thousands) | | $ | 70,002 | | | $ | 113,523 | | | $ | 133,015 | | | $ | 292,664 | | | $ | 280,262 | |
Ratios with no waiver of fees and assumption of expenses by | | | | | | | | | | | | | | | | | | | | |
| the Adviser and no reduction for fees paid indirectly: | | | | | | | | | | | | | | | | | | | | |
| Total expenses to average net assets | | | 0.96 | % | | | 0.96 | % | | | 0.92 | % | | | 0.91 | % | | | 0.90 | % |
| Net investment income (loss) to average net assets | | | 5.88 | % | | | 5.85 | % | | | 5.73 | % | | | 5.96 | % | | | 6.93 | % |
* | The Fund was audited by an independent registered public accounting firm other than Ernst & Young LLP. |
(a) | The per-share data presented above is based on the average shares outstanding for the period presented. |
(b) | The amount shown for a share outstanding does not correspond with the aggregate loss on investments for the period due to the timing of sales and repurchases of shares in relation to fluctuating market values of the investments of the Fund. |
(c) | Assumes initial investment at net asset value at the beginning of each period, reinvestment of all distributions and the complete redemption of the investment at net asset value at the end of each period. |
The accompanying notes are an integral part of these financial statements.
46 Pioneer Global High Yield Fund | Annual Report | 10/31/20
Notes to Financial Statements |
10/31/20 1. Organization and Significant Accounting Policies
Pioneer Global High Yield Fund (the “Fund”) is the sole series comprising Pioneer Series Trust VII (the “Trust”), a Delaware statutory trust. The Fund is registered under the Investment Company Act of 1940 as a diversified, open-end management investment company. The investment objective of the Fund is to maximize total return through a combination of income and capital appreciation.
The Fund offers four classes of shares designated as Class A, Class C, Class K and Class Y shares. Class K shares had not commenced operations as of October 31, 2020. Each class of shares represents an interest in the same portfolio of investments of the Fund and has identical rights (based on relative net asset values) to assets and liquidation proceeds. Share classes can bear different rates of class-specific fees and expenses, such as transfer agent and distribution fees. Differences in class-specific fees and expenses will result in differences in net investment income and, therefore, the payment of different dividends from net investment income earned by each class. The Amended and Restated Declaration of Trust of the Fund gives the Board of Trustees the flexibility to specify either per-share voting or dollar-weighted voting when submitting matters for shareowner approval. Under per-share voting, each share of a class of the Fund is entitled to one vote. Under dollar-weighted voting, a shareowner’s voting power is determined not by the number of shares owned, but by the dollar value of the shares on the record date. Each share class has exclusive voting rights with respect to matters affecting only that class, including with respect to the distribution plan for that class. There is no distribution plan for Class Y shares.
Amundi Pioneer Asset Management, Inc., an indirect, wholly owned subsidiary of Amundi and Amundi’s wholly owned subsidiary, Amundi USA, Inc., serves as the Fund’s investment adviser (the “Adviser”). Amundi Pioneer Distributor, Inc., an affiliate of Amundi Pioneer Asset Management, Inc., serves as the Fund’s distributor (the “Distributor”).
During March 2017, the Financial Accounting Standards Board (FASB) issued an Accounting Standard Update, ASU 2017-08, Receivables-Nonrefundable Fees and Other Costs (Subtopic 310-20), Premium Amortization on Purchased Callable Debt Securities (“ASU 2017-08”), which shortens the amortization period for purchased non-contingently callable debt securities held at a premium. ASU 2017-08 specifies that the premium amortization period ends at the earliest call date, for certain purchased non-contingently callable debt securities. ASU 2017-08 is effective for fiscal years, and interim
Pioneer Global High Yield Fund | Annual Report | 10/31/20 47
periods within those fiscal years, beginning after December 15, 2018. The Fund has adopted ASU 2017-08 as of January 1, 2019. The implementation of ASU 2017-08 did not have a material impact on the Fund’s financial statements.
In March 2020, FASB issued an Accounting Standard Update, ASU 2020-04, Reference Rate Reform (Topic 848) — Facilitation of the Effects of Reference Rate Reform on Financial Reporting (“ASU 2020-04”), which provides optional, temporary relief with respect to the financial reporting of contracts subject to certain types of modifications due to the planned discontinuation of the London Interbank Offered Rate (“LIBOR”) and other LIBOR-based reference rates at the end of 2021. The temporary relief provided by ASU 2020-04 is effective for certain reference rate-related contract modifications that occur during the period from March 12, 2020 through December 31, 2022. Management is evaluating the impact of ASU 2020-04 on the Fund’s investments, derivatives, debt and other contracts that will undergo reference rate-related modifications as a result of the reference rate reform.
The Fund is an investment company and follows investment company accounting and reporting guidance under U.S. Generally Accepted Accounting Principles (“U.S. GAAP”). U.S. GAAP requires the management of the Fund to make estimates and assumptions that affect the reported amounts of assets and liabilities, the disclosure of contingent assets and liabilities at the date of the financial statements, and the reported amounts of income, expenses and gain or loss on investments during the reporting period. Actual results could differ from those estimates.
The following is a summary of significant accounting policies followed by the Fund in the preparation of its financial statements:
A. Security Valuation
The net asset value of the Fund is computed once daily, on each day the New York Stock Exchange (“NYSE”) is open, as of the close of regular trading on the NYSE.
Fixed-income securities are valued by using prices supplied by independent pricing services, which consider such factors as market prices, market events, quotations from one or more brokers, Treasury spreads, yields, maturities and ratings, or may use a pricing matrix or other fair value methods or techniques to provide an estimated value of the security or instrument. A pricing matrix is a means of valuing a debt security on the basis of current market prices for other debt securities, historical trading patterns in the market for fixed-income securities and/or other factors. Non-U.S. debt securities that are listed on an exchange will be valued at the bid price obtained from an independent third party pricing service.
48 Pioneer Global High Yield Fund | Annual Report | 10/31/20
When independent third party pricing services are unable to supply prices, or when prices or market quotations are considered to be unreliable, the value of that security may be determined using quotations from one or more broker-dealers.
Loan interests are valued in accordance with guidelines established by the Board of Trustees at the mean between the last available bid and asked prices from one or more brokers or dealers as obtained from Loan Pricing Corporation, an independent third party pricing service. If price information is not available from Loan Pricing Corporation, or if the price information is deemed to be unreliable, price information will be obtained from an alternative loan interest pricing service. If no reliable price quotes are available from either the primary or alternative pricing service, broker quotes will be solicited.
Event-linked bonds are valued at the bid price obtained from an independent third party pricing service. Other insurance-linked securities (including reinsurance sidecars, collateralized reinsurance and industry loss warranties) may be valued at the bid price obtained from an independent pricing service, or through a third party using a pricing matrix, insurance industry valuation models, or other fair value methods or techniques to provide an estimated value of the instrument.
Equity securities that have traded on an exchange are valued by using the last sale price on the principal exchange where they are traded. Equity securities that have not traded on the date of valuation, or securities for which sale prices are not available, generally are valued using the mean between the last bid and asked prices or, if both last bid and asked prices are not available, at the last quoted bid price. Last sale and bid and asked prices are provided by independent third party pricing services. In the case of equity securities not traded on an exchange, prices are typically determined by independent third party pricing services using a variety of techniques and methods.
The value of foreign securities is translated into U.S. dollars based on foreign currency exchange rate quotations supplied by a third party pricing source. Trading in non-U.S. equity securities is substantially completed each day at various times prior to the close of the NYSE. The values of such securities used in computing the net asset value of the Fund’s shares are determined as of such times. The Fund may use a fair value model developed by an independent pricing service to value non-U.S. equity securities.
Options contracts are generally valued at the mean between the last bid and ask prices on the principal exchange where they are traded. Over-the-counter (“OTC”) options and options on swaps (“swaptions”) are valued
Pioneer Global High Yield Fund | Annual Report | 10/31/20 49
using prices supplied by independent pricing services, which consider such factors as market prices, market events, quotations from one or more brokers, Treasury spreads, yields, maturities and ratings, or may use a pricing matrix or other fair value methods or techniques to provide an estimated value of the security or instrument.
Forward foreign currency exchange contracts are valued daily using the foreign exchange rate or, for longer term forward contract positions, the spot currency rate and the forward points on a daily basis, in each case provided by a third party pricing service. Contracts whose forward settlement date falls between two quoted days are valued by interpolation.
Swap contracts, including interest rate swaps, caps and floors (other than centrally cleared swap contracts), are valued at the dealer quotations obtained from reputable International Swap Dealers Association members. Centrally cleared swaps are valued at the daily settlement price provided by the central clearing counterparty.
Securities or loan interests for which independent pricing services or broker-dealers are unable to supply prices or for which market prices and/or quotations are not readily available or are considered to be unreliable are valued by a fair valuation team comprised of certain personnel of the Adviser pursuant to procedures adopted by the Fund’s Board of Trustees. The Adviser’s fair valuation team uses fair value methods approved by the Valuation Committee of the Board of Trustees. The Adviser’s fair valuation team is responsible for monitoring developments that may impact fair valued securities and for discussing and assessing fair values on an ongoing basis, and at least quarterly, with the Valuation Committee of the Board of Trustees.
Inputs used when applying fair value methods to value a security may include credit ratings, the financial condition of the company, current market conditions and comparable securities. The Fund may use fair value methods if it is determined that a significant event has occurred after the close of the exchange or market on which the security trades and prior to the determination of the Fund’s net asset value. Examples of a significant event might include political or economic news, corporate restructurings, natural disasters, terrorist activity or trading halts. Thus, the valuation of the Fund’s securities may differ significantly from exchange prices, and such differences could be material.
At October 31, 2020, four securities were valued using fair value methods (in addition to securities valued using prices supplied by independent pricing services, broker-dealers or using a third party insurance pricing model) representing .10% of net assets. The value of these fair valued securities was $210,271.
50 Pioneer Global High Yield Fund | Annual Report | 10/31/20
B. Investment Income and Transactions
Dividend income is recorded on the ex-dividend date, except that certain dividends from foreign securities where the ex-dividend date may have passed are recorded as soon as the Fund becomes aware of the ex-dividend data in the exercise of reasonable diligence.
Interest income, including interest on income-bearing cash accounts, is recorded on the accrual basis. Dividend and interest income are reported net of unrecoverable foreign taxes withheld at the applicable country rates and net of income accrued on defaulted securities.
Interest and dividend income payable by delivery of additional shares is reclassified as PIK (payment-in-kind) income upon receipt and is included in interest and dividend income, respectively. Principal amounts of mortgage-backed securities are adjusted for monthly paydowns. Premiums and discounts related to certain mortgage-backed securities are amortized or accreted in proportion to the monthly paydowns. All discounts/premiums on purchase prices of debt securities are accreted/amortized for financial reporting purposes over the life of the respective securities, and such accretion/amortization is included in interest income.
Security transactions are recorded as of trade date. Gains and losses on sales of investments are calculated on the identified cost method for both financial reporting and federal income tax purposes.
C. Foreign Currency Translation
The books and records of the Fund are maintained in U.S. dollars. Amounts denominated in foreign currencies are translated into U.S. dollars using current exchange rates.
Net realized gains and losses on foreign currency transactions, if any, represent, among other things, the net realized gains and losses on foreign currency exchange contracts, disposition of foreign currencies and the difference between the amount of income accrued and the U.S. dollars actually received. Further, the effects of changes in foreign currency exchange rates on investments are not segregated on the Statement of Operations from the effects of changes in the market prices of those securities, but are included with the net realized and unrealized gain or loss on investments.
D. Federal Income Taxes
It is the Fund’s policy to comply with the requirements of the Internal Revenue Code applicable to regulated investment companies and to distribute all of its net taxable income and net realized capital gains, if any,
Pioneer Global High Yield Fund | Annual Report | 10/31/20 51
to its shareowners. Therefore, no provision for federal income taxes is required. As of October 31, 2020, the Fund did not accrue any interest or penalties with respect to uncertain tax positions, which, if applicable, would be recorded as an income tax expense on the Statement of Operations. Tax returns filed within the prior three years remain subject to examination by federal and state tax authorities.
The amount and character of income and capital gain distributions to shareowners are determined in accordance with federal income tax rules, which may differ from U.S. GAAP. Distributions in excess of net investment income or net realized gains are temporary over distributions for financial statement purposes resulting from differences in the recognition or classification of income or distributions for financial statement and tax purposes. Capital accounts within the financial statements are adjusted for permanent book/tax differences to reflect tax character, but are not adjusted for temporary differences.
At October 31, 2020, the Fund was permitted to carry forward indefinitely $26,678,693 of short-term and $283,708,767 of long-term losses.
The tax character of distributions paid during the years ended October 31, 2020 and October 31, 2019, were as follows:
| | | | | | | |
| | 2020 | | | 2019 | |
| Distributions paid from: | | | | | | |
| Ordinary income | | $ | 13,482,131 | | | $ | 17,119,165 | |
| Tax return of capital | | | 742,070 | | | | 699,883 | |
| Total | | $ | 14,224,201 | | | $ | 17,819,048 | |
The following shows the components of distributable earnings (losses) on a federal income tax basis at October 31, 2020:
| | | | |
| | 2020 | |
| Distributable earnings: | | | |
| Capital loss carryforward | | $ | (310,387,460 | ) |
| Dividend payable | | | (142,274 | ) |
| Net unrealized depreciation | | | (16,839,898 | ) |
| Total | | $ | (327,369,632 | ) |
The difference between book basis and tax basis unrealized depreciation is attributable to the tax deferral of losses on wash sales, the mark-to-market of foreign currency contracts and swaps, adjustments relating to catastrophe bonds and swaps.
52 Pioneer Global High Yield Fund | Annual Report | 10/31/20
E. Fund Shares
The Fund records sales and repurchases of its shares as of trade date. The Distributor earned $3,001 in underwriting commissions on the sale of Class A shares during the year ended October 31, 2020.
F. Class Allocations
Income, common expenses and realized and unrealized gains and losses are calculated at the Fund level and allocated daily to each class of shares based on its respective percentage of adjusted net assets at the beginning of the day.
Distribution fees are calculated based on the average daily net asset value attributable to Class A and Class C shares of the Fund, respectively (see Note 4). Class Y shares do not pay distribution fees. All expenses and fees paid to the Fund’s transfer agent for its services are allocated among the classes of shares based on the number of accounts in each class and the ratable allocation of related out-of-pocket expenses (see Note 3).
The Fund declares as daily dividends substantially all of its net investment income. All dividends are paid on a monthly basis. Short-term capital gain distributions, if any, may be declared with the daily dividends. Distributions to shareowners are recorded as of the ex-dividend date. Distributions paid by the Fund with respect to each class of shares are calculated in the same manner and at the same time, except that net investment income dividends to Class A, Class C and Class Y shares can reflect different transfer agent and distribution expense rates.
G. Risks
The value of securities held by the Fund may go up or down, sometimes rapidly or unpredictably, due to general market conditions, such as real or perceived adverse economic, political or regulatory conditions, recessions, the spread of infectious illness or other public health issues, inflation, changes in interest rates, lack of liquidity in the bond markets or adverse investor sentiment. In the past several years, financial markets have experienced increased volatility, depressed valuations, decreased liquidity and heightened uncertainty. These conditions may continue, recur, worsen or spread. A general rise in interest rates could adversely affect the price and liquidity of fixed-income securities and could also result in increased redemptions from the Fund.
At times, the Fund’s investments may represent industries or industry sectors that are interrelated or have common risks, making the Fund more susceptible to any economic, political, or regulatory developments or other risks affecting those industries and sectors. The Fund’s investments in
Pioneer Global High Yield Fund | Annual Report | 10/31/20 53
foreign markets and countries with limited developing markets may subject the Fund to a greater degree of risk than investments in a developed market. These risks include disruptive political or economic conditions and the imposition of adverse governmental laws or currency exchange restrictions.
The Fund invests in below-investment-grade (high-yield) debt securities and preferred stocks. Some of these high-yield securities may be convertible into equity securities of the issuer. Debt securities rated below-investment-grade are commonly referred to as “junk bonds” and are considered speculative. These securities involve greater risk of loss, are subject to greater price volatility, and are less liquid, especially during periods of economic uncertainty or change, than higher rated debt securities.
The Fund’s investments, payment obligations and financing terms may be based on floating rates, such as LIBOR (London Interbank Offered Rate). Plans are underway to phase out the use of LIBOR by the end of 2021. There remains uncertainty regarding the nature of any replacement rate and the impact of the transition from LIBOR on the fund, issuers of instruments in which the fund invests, and financial markets generally.
With the increased use of technologies such as the Internet to conduct business, the Fund is susceptible to operational, information security and related risks. While the Fund’s Adviser has established business continuity plans in the event of, and risk management systems to prevent, limit or mitigate, such cyber-attacks, there are inherent limitations in such plans and systems, including the possibility that certain risks have not been identified. Furthermore, the Fund cannot control the cybersecurity plans and systems put in place by service providers to the Fund such as Brown Brothers Harriman & Co., the Fund’s custodian and accounting agent, and DST Asset Manager Solutions, Inc., the Fund’s transfer agent. In addition, many beneficial owners of Fund shares hold them through accounts at broker-dealers, retirement platforms and other financial market participants over which neither the Fund nor Amundi exercises control. Each of these may in turn rely on service providers to them, which are also subject to the risk of cyber-attacks. Cybersecurity failures or breaches at Amundi or the Fund’s service providers or intermediaries have the ability to cause disruptions and impact business operations, potentially resulting in financial losses, interference with the Fund’s ability to calculate its net asset value, impediments to trading, the inability of Fund shareowners to effect share purchases, redemptions or exchanges or receive distributions, loss of or unauthorized access to private shareowner information and violations of applicable privacy and other laws, regulatory fines, penalties, reputational damage, or additional compliance costs. Such costs and losses may not be covered under any insurance. In addition, maintaining vigilance against cyber-attacks may involve substantial costs over time, and system enhancements may themselves be subject to cyber-attacks.
54 Pioneer Global High Yield Fund | Annual Report | 10/31/20
COVID-19
The respiratory illness COVID-19 caused by a novel coronavirus has resulted in a global pandemic and major disruption to economies and markets around the world, including the United States. Global financial markets have experienced extreme volatility and severe losses, and trading in many instruments has been disrupted. Liquidity for many instruments has been greatly reduced for periods of time. Some interest rates are very low and in some cases yields are negative. Some sectors of the economy and individual issuers have experienced particularly large losses. These circumstances may continue for an extended period of time, and may continue to affect adversely the value and liquidity of the Fund’s investments. The ultimate economic fallout from the pandemic, and the long-term impact on economies, markets, industries and individual issuers, are not known. Governments and central banks, including the Federal Reserve in the U.S., have taken extraordinary and unprecedented actions to support local and global economies and the financial markets. These actions have resulted in significant expansion of public debt, including in the U.S. The impact of these measures, and whether they will be effective to mitigate the economic and market disruption, will not be known for some time. The consequences of high public debt, including its future impact on the economy and securities markets, likewise may not be known for some time.
The Fund’s prospectus contains unaudited information regarding the Fund’s principal risks. Please refer to that document when considering the Fund’s principal risks.
H. Restricted Securities
Restricted Securities are subject to legal or contractual restrictions on resale. Restricted securities generally are resold in transactions exempt from registration under the Securities Act of 1933. Private placement securities are generally considered to be restricted except for those securities traded between qualified institutional investors under the provisions of Rule 144A of the Securities Act of 1933.
Disposal of restricted investments may involve negotiations and expenses, and prompt sale at an acceptable price may be difficult to achieve. Restricted investments held by the Fund at October 31, 2020 are listed in the Schedule of Investments.
I. Insurance-Linked Securities (“ILS”)
The Fund invests in ILS. The Fund could lose a portion or all of the principal it has invested in an ILS, and the right to additional interest or dividend payments with respect to the security, upon the occurrence of one or more trigger events, as defined within the terms of an insurance-linked security.
Pioneer Global High Yield Fund | Annual Report | 10/31/20 55
Trigger events, generally, are hurricanes, earthquakes, or other natural events of a specific size or magnitude that occur in a designated geographic region during a specified time period, and/or that involve losses or other metrics that exceed a specific amount. There is no way to accurately predict whether a trigger event will occur, and accordingly, ILS carry significant risk. The Fund is entitled to receive principal, and interest and/or dividend payments so long as no trigger event occurs of the description and magnitude specified by the instrument. In addition to the specified trigger events, ILS may expose the Fund to other risks, including but not limited to issuer (credit) default, adverse regulatory or jurisdictional interpretations and adverse tax consequences.
The Fund’s investments in ILS may include event-linked bonds. ILS also may include special purpose vehicles (“SPVs”) or similar instruments structured to comprise a portion of a reinsurer’s catastrophe-oriented business, known as quota share instruments (sometimes referred to as reinsurance sidecars), or to provide reinsurance relating to specific risks to insurance or reinsurance companies through a collateralized instrument, known as collateralized reinsurance. Structured reinsurance investments also may include industry loss warranties (“ILWs”). A traditional ILW takes the form of a bilateral reinsurance contract, but there are also products that take the form of derivatives, collateralized structures, or exchange-traded instruments.
Where the ILS are based on the performance of underlying reinsurance contracts, the Fund has limited transparency into the individual underlying contracts, and therefore must rely upon the risk assessment and sound underwriting practices of the issuer. Accordingly, it may be more difficult for the Adviser to fully evaluate the underlying risk profile of the Fund’s structured reinsurance investments, and therefore the Fund’s assets are placed at greater risk of loss than if the Adviser had more complete information. Structured reinsurance instruments generally will be considered illiquid securities by the Fund. These securities may be difficult to purchase, sell or unwind. Illiquid securities also may be difficult to value. If the Fund is forced to sell an illiquid asset, the Fund may be forced to sell at a loss.
J. Purchased Options
The Fund may purchase put and call options to seek to increase total return. Purchased call and put options entitle the Fund to buy and sell a specified number of shares or units of a particular security, currency or index at a specified price at a specific date or within a specific period of time. Upon the purchase of a call or put option, the premium paid by the Fund is included on the Statement of Assets and Liabilities as an
56 Pioneer Global High Yield Fund | Annual Report | 10/31/20
investment. All premiums are marked-to-market daily, and any unrealized appreciation or depreciation is recorded on the Fund’s Statement of Operations. As the purchaser of an index option, the Fund has the right to receive a cash payment equal to any depreciation in the value of the index below the strike price of the option (in the case of a put) or equal to any appreciation in the value of the index over the strike price of the option (in the case of a call) as of the valuation date of the option. Premiums paid for purchased call and put options which have expired are treated as realized losses on investments on the Statement of Operations. Upon the exercise or closing of a purchased put option, the premium is offset against the proceeds on the sale of the underlying security or financial instrument in order to determine the realized gain or loss on investments. Upon the exercise or closing of a purchased call option, the premium is added to the cost of the security or financial instrument. The risk associated with purchasing options is limited to the premium originally paid.
The average market value of purchased options contracts open during the year ended October 31, 2020, was $90,960. Open purchased options at October 31, 2020, are listed in the Schedule of Investments.
K. Option Writing
The Fund may write put and covered call options to seek to increase total return. When an option is written, the Fund receives a premium and becomes obligated to purchase or sell the underlying security at a fixed price, upon the exercise of the option. When the Fund writes an option, an amount equal to the premium received by the Fund is recorded as “Written options outstanding” on the Statement of Assets and Liabilities and is subsequently adjusted to the current value of the option written. Premiums received from writing options that expire unexercised are treated by the Fund on the expiration date as realized gains from investments on the Statement of Operations. The difference between the premium and the amount paid on effecting a closing purchase transaction, including brokerage commissions, is also treated as a realized gain on the Statement of Operations, or, if the premium is less than the amount paid for the closing purchase transaction, as a realized loss on the Statement of Operations. If a call option is exercised, the premium is added to the proceeds from the sale of the underlying security in determining whether the Fund has realized a gain or loss. The Fund as writer of an option bears the market risk of an unfavorable change in the price of the security underlying the written option.
The average market value of written options for the year ended October 31, 2020, was $(62,987). Open written options contracts at October 31, 2020, are listed in the Schedule of Investments.
Pioneer Global High Yield Fund | Annual Report | 10/31/20 57
L. Forward Foreign Currency Exchange Contracts
The Fund may enter into forward foreign currency exchange contracts (“contracts”) for the purchase or sale of a specific foreign currency at a fixed price on a future date. All contracts are marked-to-market daily at the applicable exchange rates, and any resulting unrealized appreciation or depreciation is recorded in the Fund’s financial statements. The Fund records realized gains and losses at the time a contract is offset by entry into a closing transaction or extinguished by delivery of the currency. Risks may arise upon entering into these contracts from the potential inability of counterparties to meet the terms of the contract and from unanticipated movements in the value of foreign currencies relative to the U.S. dollar (see Note 7).
During the year ended October 31, 2020, the Fund had entered into various forward foreign currency exchange contracts that obligated the Fund to deliver or take delivery of currencies at specified future maturity dates. Alternatively, prior to the settlement date of a forward foreign currency exchange contract, the Fund may close out such contract by entering into an offsetting contract.
The average market value of forward foreign currency exchange contracts open during the year ended October 31, 2020, was $3,861,570. Open forward foreign currency exchange contracts outstanding at October 31, 2020, are listed in the Schedule of Investments.
M. Credit Default Swap Contracts
A credit default swap is a contract between a buyer of protection and a seller of protection against a pre-defined credit event or an underlying reference obligation, which may be a single security or a basket or index of securities. The Fund may buy or sell credit default swap contracts to seek to increase the Fund’s income, or to attempt to hedge the risk of default on portfolio securities. A credit default swap index is used to hedge risk or take a position on a basket of credit entities or indices.
As a seller of protection, the Fund would be required to pay the notional (or other agreed-upon) value of the referenced debt obligation to the counterparty in the event of a default by a U.S. or foreign corporate issuer of a debt obligation, which would likely result in a loss to the Fund. In return, the Fund would receive from the counterparty a periodic stream of payments during the term of the contract, provided that no event of default occurred. The maximum exposure of loss to the seller would be the notional value of the credit default swaps outstanding. If no default occurs, the Fund would keep the stream of payments and would have no payment obligation. The Fund may also buy credit default swap contracts in order to hedge against the risk of default of debt securities, in which case the Fund would function as the counterparty referenced above.
58 Pioneer Global High Yield Fund | Annual Report | 10/31/20
As a buyer of protection, the Fund makes an upfront or periodic payment to the protection seller in exchange for the right to receive a contingent payment. An upfront payment made by the Fund, as the protection buyer, is recorded within the “Swap contracts, at value” line item on the Statement of Assets and Liabilities. Periodic payments received or paid by the Fund are recorded as realized gains or losses on the Statement of Operations.
Credit default swap contracts are marked-to-market daily using valuations supplied by independent sources, and the change in value, if any, is recorded within the “Swap contracts, at value” line item on the Statement of Assets and Liabilities. Payments received or made as a result of a credit event or upon termination of the contract are recognized, net of the appropriate amount of the upfront payment, as realized gains or losses on the Statement of Operations.
Credit default swap contracts involving the sale of protection may involve greater risks than if the Fund had invested in the referenced debt instrument directly. Credit default swap contracts are subject to general market risk, liquidity risk, counterparty risk and credit risk. If the Fund is a protection buyer and no credit event occurs, it will lose its investment. If the Fund is a protection seller and a credit event occurs, the value of the referenced debt instrument received by the Fund, together with the periodic payments received, may be less than the amount the Fund pays to the protection buyer, resulting in a loss to the Fund. In addition, obligations under sell protection credit default swaps may be partially offset by net amounts received from settlement of buy protection credit default swaps entered into by the Fund for the same reference obligation with the same counterparty.
Certain swap contracts that are cleared through a central clearinghouse are referred to as centrally cleared swaps. All payments made or received by the Fund are pursuant to a centrally cleared swap contract with the central clearing party rather than the original counterparty. Upon entering into a centrally cleared swap contract, the Fund is required to make an initial margin deposit, either in cash or in securities. The daily change in value on open centrally cleared contracts is recorded as “Variation margin for centrally cleared swap contracts” on the Statement of Assets and Liabilities. Cash received from or paid to the broker related to previous margin movement is held in a segregated account at the broker and is recorded as either “Due from broker for swaps” or “Due to broker for swaps” on the Statement of Assets and Liabilities. The amount of cash deposited with a broker as collateral at October 31, 2020, is recorded as “Swaps collateral” on the Statement of Assets and Liabilities.
Pioneer Global High Yield Fund | Annual Report | 10/31/20 59
The average market value of credit default swap contracts open during the year ended October 31, 2020, was $(815,524). Open credit default swap contracts at October 31, 2020, are listed in the Schedule of Investments.
2. Management Agreement
The Adviser manages the Fund’s portfolio. Management fees are calculated daily and paid monthly at the annual rate of 0.70% of the Fund’s average daily net assets up to $500 million; 0.65% of the Fund’s average daily net assets on next $500 million; 0.60% of the Fund’s average daily net assets on next $500 million; 0.55% of the Fund’s average daily net assets on next $500 million; and 0.45% of the Fund’s average daily net assets on over $2 billion. For the year ended October 31, 2020, the effective management fee (excluding waivers and/or assumption of expenses) was equivalent to 0.70% of the Fund’s average daily net assets.
Effective October 1, 2019, the Adviser has contractually agreed to limit ordinary operating expenses (ordinary operating expenses means all fund expenses other than extraordinary expenses, such as litigation, taxes, brokerage commissions and acquired fund fees and expenses) of the Fund to the extent required to reduce Fund expenses to 1.14% and 0.90% of the average daily net assets attributable to Class A and Class Y shares, respectively. These expense limitations are in effect through March 1, 2021 for Class A shares and Class Y shares. There can be no assurance that the Adviser will extend the expense limitation agreement for a class of shares beyond the date referred to above. Fees waived and expenses reimbursed during the year ended October 31, 2020 are reflected on the Statement of Operations.
In addition, under the management and administration agreements, certain other services and costs, including accounting, regulatory reporting and insurance premiums, are paid by the Fund as administrative reimbursements. Included in “Due to affiliates” reflected on the Statement of Assets and Liabilities is $16,423 in management fees, administrative costs and certain other reimbursements payable to the Adviser at October 31, 2020.
3. Transfer Agent
DST Asset Manager Solutions, Inc. serves as the transfer agent to the Fund at negotiated rates. Transfer agent fees and payables shown on the Statement of Operations and the Statement of Assets and Liabilities, respectively, include sub-transfer agent expenses incurred through the Fund’s omnibus relationship contracts.
60 Pioneer Global High Yield Fund | Annual Report | 10/31/20
In addition, the Fund reimbursed the transfer agent for out-of-pocket expenses incurred by the transfer agent related to shareowner communications activities such as proxy and statement mailings, and outgoing phone calls. For the year ended October 31, 2020, such out-of-pocket expenses by class of shares were as follows:
| | | | |
| Shareowner Communications | | | |
Class A | | $ | 27,151 | |
Class C | | | 4,001 | |
Class Y | | | 1,849 | |
| Total | | $ | 33,001 | |
4. Distribution Plan and Service Plans
The Fund has adopted a distribution plan (the “Plan”) pursuant to Rule 12b-1 of the Investment Company Act of 1940 with respect to its Class A and Class C shares. Pursuant to the Plan, the Fund pays the Distributor 0.25% of the average daily net assets attributable to Class A shares as compensation for personal services and/or account maintenance services or distribution services with regard to Class A shares. Pursuant to the Plan, the Fund also pays the Distributor 1.00% of the average daily net assets attributable to Class C shares. The fee for Class C shares consists of a 0.25% service fee and a 0.75% distribution fee paid as compensation for personal services and/or account maintenance services or distribution services with regard to Class C shares. Included in “Due to affiliates” reflected on the Statement of Assets and Liabilities is $23,750 in distribution fees payable to the Distributor at October 31, 2020.
In addition, redemptions of Class A and Class C shares may be subject to a contingent deferred sales charge (“CDSC”). A CDSC of 1.00% may be imposed on redemptions of certain net asset value purchases of Class A shares within 12 months of purchase. Redemptions of Class C shares within 12 months of purchase are subject to a CDSC of 1.00%, based on the lower of cost or market value of shares being redeemed. Shares purchased as part of an exchange remain subject to any CDSC that applied to the original purchase of those shares. There is no CDSC for Class Y shares. Proceeds from the CDSCs are paid to the Distributor. For the year ended October 31, 2020, CDSCs in the amount of $244 were paid to the Distributor.
5. Line of Credit Facility
The Fund, along with certain other funds in the Pioneer Family of Funds (the “Funds”), participates in a committed, unsecured revolving line of credit (“credit facility”). Borrowings are used solely for temporary or emergency purposes. The Fund may borrow up to the lesser of the amount available under the credit facility or the limits set for borrowing by the Fund’s prospectus and the 1940 Act. Effective March 11, 2020, the Fund participates
Pioneer Global High Yield Fund | Annual Report | 10/31/20 61
in a facility in the amount of $300 million. Prior to March 11, 2020, the Fund participated in a facility in the amount of $250 million. Under such facility, depending on the type of loan, interest on borrowings is payable at the London Interbank Offered Rate (“LIBOR”) plus a credit spread. The Fund also pays an annual commitment fee in the amount of 0.30% of the daily unused portion of each lender’s commitment to participate in the credit facility. The commitment fee is allocated among participating Funds based on an allocation schedule set forth in the credit agreement.
For the year ended October 31, 2020, the average daily amount of borrowings outstanding during the period were as follows:
| | | | |
| Weighted Average | | |
| Average daily | annualized | Number of | Total interest |
| amount of | interest rate | days | expense on |
| borrowings | for the period | outstanding | borrowings* |
$3,350,000 | 0.95% | 2 | $177 |
* Interest expense is recorded on the statement of operations.
6. Master Netting Agreement
The Fund has entered into an International Swaps and Derivatives Association, Inc. Master Agreement (“ISDA Master Agreement”) or similar agreement with substantially all of its derivative counterparties. An ISDA Master Agreement is a bilateral agreement between the Fund and a counterparty that governs the trading of certain Over the Counter (“OTC”) derivatives and typically contains, among other things, close-out and set-off provisions which apply upon the occurrence of an event of default and/or a termination event as defined under the relevant ISDA Master Agreement. The ISDA Master Agreement may also give a party the right to terminate all transactions traded under such agreement if, among other things, there is deterioration in the credit quality of the other party.
Upon an event of default or a termination of the ISDA Master Agreement, the non-defaulting party has the right to close out all transactions under such agreement and to net amounts owed under each transaction to determine one net amount payable by one party to the other. The right to close out and net payments across all transactions under the ISDA Master Agreement could result in a reduction of the Fund’s credit risk to its counterparty equal to any amounts payable by the Fund under the applicable transactions, if any. However, the Fund’s right to setoff may be restricted or prohibited by the bankruptcy or insolvency laws of the particular jurisdiction to which each specific ISDA of each counterparty is subject.
The collateral requirements for derivatives transactions under an ISDA Master Agreement are governed by a credit support annex to the ISDA Master Agreement. Collateral requirements are generally determined at the
62 Pioneer Global High Yield Fund | Annual Report | 10/31/20
close of business each day and are typically based on changes in market values for each transaction under an ISDA Master Agreement and netted into one amount for such agreement. Generally, the amount of collateral due from or to a counterparty is subject to threshold (a “minimum transfer amount”) before a transfer is required, which may vary by counterparty. Collateral pledged for the benefit of the Fund and/or counterparty is held in segregated accounts by the Fund’s custodian and cannot be sold, re-pledged, assigned or otherwise used while pledged. Cash that has been segregated to cover the Fund’s collateral obligations, if any, will be reported separately on the Statement of Assets and Liabilities as “Swaps collateral”. Securities pledged by the Fund as collateral, if any, are identified as such in the Schedule of Investments.
Financial instruments subject to an enforceable master netting agreement such as an ISDA Master Agreement have not been offset on the Statement of Assets and Liabilities.
The following charts show gross assets and liabilities of the Fund as of October 31, 2020.
| | | | | | | | | | | | | | | | |
| | Derivative Assets | | | Derivatives | | | Non-Cash | | | Cash | | | Net Amount | |
| | Subject to Master | | | Available for | | | Collateral | | | Collateral | | | of Derivative | |
| Counterparty | | Netting Agreement | | | Offset | | | Received (a) | | | Received (a) | | | Assets (b) | |
Bank of | | | | | | | | | | | | | | | |
| America NA | | $ | 25,696 | | | $ | (25,696 | ) | | $ | — | | | $ | — | | | $ | — | |
Bank of New | | | | | | | | | | | | | | | | | | | | |
| York Mellon | | | — | | | | — | | | | — | | | | — | | | | — | |
Goldman Sachs | | | | | | | | | | | | | | | | | | | | |
| International | | | 8,948 | | | | (8,948 | ) | | | — | | | | — | | | | — | |
State Street | | | | | | | | | | | | | | | | | | | | |
| Bank & Trust Co. | | | 4,689 | | | | — | | | | — | | | | — | | | | 4,689 | |
| Total | | $ | 39,333 | | | $ | (34,644 | ) | | $ | — | | | $ | — | | | $ | 4,689 | |
| | | | | | | | | | | | | | | | |
| | Derivative Liabilities | | | Derivatives
| | | Non-Cash | | | Cash | | | Net Amount | |
| | Subject to Master | | | Available for | | | Collateral | | | Collateral | | | of Derivative | |
| Counterparty | | Netting Agreement | | | Offset | | | Pledged (a) | | | Pledged (a) | | | Liabilities (c) | |
Bank of | | | | | | | | | | | | | | | |
| America NA | | $ | 76,783 | | | $ | (25,696 | ) | | $ | — | | | $ | — | | | $ | 51,087 | |
Bank of New | | | | | | | | | | | | | | | | | | | | |
| York Mellon | | | 123,767 | | | | — | | | | — | | | | — | | | | 123,767 | |
Goldman Sachs | | | | | | | | | | | | | | | | | | | | |
| International | | | 14,750 | | | | (8,948 | ) | | | — | | | | — | | | | 5,802 | |
State Street | | | | | | | | | | | | | | | | | | | | |
| Bank & rust Co. | | | — | | | | — | | | | — | | | | — | | | | — | |
| Total | | $ | 215,300 | | | $ | (34,644 | ) | | $ | — | | | $ | — | | | $ | 180,656 | |
(a) The amount presented here may be less than the total amount of collateral received/pledged as the net amount of derivative assets and liabilities cannot be less than $0.
(b) Represents the net amount due from the counterparty in the event of default.
(c) Represents the net amount payable to the counterparty in the event of default.
Pioneer Global High Yield Fund | Annual Report | 10/31/20 63
7. Additional Disclosures about Derivative Instruments and Hedging Activities
The Fund’s use of derivatives may enhance or mitigate the Fund’s exposure to the following risks:
Interest rate risk relates to the fluctuations in the value of interest-bearing securities due to changes in the prevailing levels of market interest rates.
Credit risk relates to the ability of the issuer of a financial instrument to make further principal or interest payments on an obligation or commitment that it has to the Fund.
Foreign exchange rate risk relates to fluctuations in the value of an asset or liability due to changes in currency exchange rates.
Equity risk relates to the fluctuations in the value of financial instruments as a result of changes in market prices (other than those arising from interest rate risk or foreign exchange rate risk), whether caused by factors specific to an individual investment, its issuer, or all factors affecting all instruments traded in a market or market segment.
Commodity risk relates to the risk that the value of a commodity or commodity index will fluctuate based on increases or decreases in the commodities market and factors specific to a particular industry or commodity.
The fair value of open derivative instruments (not considered to be hedging instruments for accounting disclosure purposes) by risk exposure at October 31, 2020, was as follows:
| | | | | | | | | | | | | | | | |
| | | | | | | | Foreign | | | | | | | |
| Statement of | | Interest | | | Credit | | | Exchange | | | Equity | | | Commodity | |
| Assets and Liabilities | | Rate Risk | | | Risk | | | Rate Risk | | | Risk | | | Risk | |
| Assets | | | | | | | | | | | | | | | |
| Options purchased* | | $ | — | | | $ | — | | | $ | 34,644 | | | $ | — | | | $ | — | |
| Swap contracts, at value | | | — | | | | 144,649 | | | | — | | | | — | | | | — | |
| Total Value | | $ | — | | | $ | 144,649 | | | $ | 34,644 | | | $ | — | | | $ | — | |
| Liabilities | | | | | | | | | | | | | | | | | | | | |
| Written options | | | | | | | | | | | | | | | | | | | | |
| outstanding | | $ | — | | | $ | — | | | $ | 91,533 | | | $ | — | | | $ | — | |
| Net unrealized | | | | | | | | | | | | | | | | | | | | |
| depreciation on | | | | | | | | | | | | | | | | | | | | |
| forward foreign | | | | | | | | | | | | | | | | | | | | |
| currency contracts | | | — | | | | — | | | | 119,078 | | | | — | | | | — | |
| Total Value | | $ | — | | | $ | — | | | $ | 210,611 | | | $ | — | | | $ | — | |
* | Reflects the market value of purchased option contracts (see Note 1I). These amounts are included in investments in unaffiliated issuers, at value, on the Statement of Assets and Liabilities. |
64 Pioneer Global High Yield Fund | Annual Report | 10/31/20
The effect of derivative instruments (not considered to be hedging instruments for accounting disclosure purposes) on the Statement of Operations by risk exposure at October 31, 2020, was as follows:
| | | | | | | | | | | | | | | | |
| | | | | | | | Foreign | | | | | | | |
| Statement | | Interest | | | Credit | | | Exchange | | | Equity | | | Commodity | |
| of Operations | | Rate Risk | | | Risk | | | Rate Risk | | | Risk | | | Risk | |
| Net realized gain (loss) on: | | | | | | | | | | | | | | | |
| Options purchased* | | $ | — | | | $ | — | | | $ | (197,688 | ) | | $ | — | | | $ | — | |
| Written options | | | — | | | | — | | | | 197,688 | | | | — | | | | — | |
| Forward foreign | | | | | | | | | | | | | | | | | | | | |
| exchange currency | | | | | | | | | | | | | | | | | | | | |
| contracts | | | — | | | | — | | | | 268,439 | | | | — | | | | — | |
| Swap contracts | | | — | | | | (2,110,180 | ) | | | — | | | | — | | | | — | |
| Total Value | | $ | — | | | $ | (2,110,180 | ) | | $ | 268,439 | | | $ | — | | | $ | — | |
| Change in net unrealized | | | | | | | | | | | | | | | | | | | | |
| appreciation | | | | | | | | | | | | | | | | | | | | |
| (depreciation) on: | | | | | | | | | | | | | | | | | | | | |
| Options purchased*** | | $ | — | | | $ | — | | | $ | (56,593 | ) | | $ | — | *** | | $ | — | |
| Written options | | | — | | | | — | | | | (149,868 | ) | | | — | | | | — | |
| Forward foreign | | | | | | | | | | | | | | | | | | | | |
| exchange currency | | | | | | | | | | | | | | | | | | | | |
| contracts | | | — | | | | — | | | | (78,467 | ) | | | — | | | | — | |
| Swap contracts | | | — | | | | 115,778 | | | | — | | | | — | | | | — | |
| Total Value | | $ | — | | | $ | 115,778 | | | $ | (284,928 | ) | | $ | — | *** | | $ | — | |
* | Reflects the net realized gain (loss) on purchased option contracts (see Note 1J). These amounts are included in Net realized gain (loss) on investments in unaffiliated issuers, on the Statement of Operations. |
** | Reflects the change in net unrealized appreciation (depreciation) on purchased option contracts (see Note 1I). These amounts are included in change in net unrealized appreciation (depreciation) on Investments in unaffiliated issuers, on the Statement of Operations. |
*** | Includes securities that are valued at $0. |
8. Unfunded Loan Commitments
The Fund may enter into unfunded loan commitments. Unfunded loan commitments may be partially or wholly unfunded. During the contractual period, the Fund is obliged to provide funding to the borrower upon demand. A fee is earned by the Fund on the unfunded loan commitment and is recorded as interest income on the Statement of Operations. Unfunded loan commitments are fair valued in accordance with the valuation policy described in Footnote 1A and unrealized appreciation or depreciation, if any, is recorded on the Statement of Assets and Liabilities.
Pioneer Global High Yield Fund | Annual Report | 10/31/20 65
As of October 31, 2020, the Fund had the following unfunded loan commitment outstanding:
| | | | | | | | | | | | | |
| | | | | | | | | | | Unrealized | |
| Loan | | Principal | | | Cost | | | Value | | | Appreciation | |
Grupo Aeromexico, Sociedad | | | | | | | | | | | | |
| Anonima Bursatil De Capital | | | | | | | | | | | | |
| Variable, Senior Secured Tranche 1 | | $ | 357,500 | | | $ | 354,155 | | | $ | 353,925 | | | $ | (230 | ) |
Grupo Aeromexico, Sociedad | | | | | | | | | | | | | | | | |
| Anonima Bursatil De Capital | | | | | | | | | | | | | | | | |
| Variable, DIP Tranche 2 Term Loan | | | 375,000 | | | | 301,641 | | | | 304,688 | | | | 3,047 | |
Spectacle Gary Holdings LLC | | | 74,600 | | | | 72,720 | | | | 70,730 | | | | (1,990 | ) |
| Total Value | | $ | 807,100 | | | $ | 728,516 | | | $ | 729,343 | | | $ | 827 | |
9. Subsequent Event
On November 19, 2020, Amundi Pioneer Asset Management announced it will be rebranding the US business of Amundi as Amundi US effective January 1, 2021. The new brand identity will replace Amundi Pioneer, which was first adopted in July 2017 following the acquisition of Pioneer Investments by Amundi. In connection with these changes, Amundi Pioneer Asset Management. Inc., the investment adviser to the Pioneer funds, will change its name to Amundi Asset Management US, Inc. In addition, Amundi Pioneer Distributor, Inc., the Pioneer funds’ distributor, will change its name to Amundi Distributor US, Inc. The names of the Pioneer funds will not change in connection with this rebranding.
66 Pioneer Global High Yield Fund | Annual Report | 10/31/20
Report of Independent Registered Public Accounting Firm
To the Board of Trustees of Pioneer Series Trust VII and the Shareowners of Pioneer Global High Yield Fund:
Opinion on the Financial Statements
We have audited the accompanying statement of assets and liabilities of Pioneer Global High Yield Fund (the “Fund”) (one of the funds constituting Pioneer Series Trust VII (the “Trust”)), including the schedule of investments, as of October 31, 2020, and the related statement of operations for the year then ended, the statements of changes in net assets for each of the two years in the period then ended, the financial highlights for each of the four years in the period then ended and the related notes (collectively referred to as the “financial statements”). The financial highlights for the period ended October 31, 2016 were audited by another independent registered public accounting firm whose report, dated December 23, 2016, expressed an unqualified opinion on those financial highlights. In our opinion, the financial statements present fairly, in all material respects, the financial position of the Fund (one of the funds constituting Pioneer Series Trust VII) at October 31, 2020, the results of its operations for the year then ended, the changes in its net assets for each of the two years in the period then ended, and its financial highlights for each of the four years in the period then ended, in conformity with U.S. generally accepted accounting principles.
Basis for Opinion
These financial statements are the responsibility of the Trust’s management. Our responsibility is to express an opinion on the Fund’s financial statements based on our audits. We are a public accounting firm registered with the Public Company Accounting Oversight Board (United States) (“PCAOB”) and are required to be independent with respect to the Trust in accordance with the U.S. federal securities laws and the applicable rules and regulations of the Securities and Exchange Commission and the PCAOB.
We conducted our audits in accordance with the standards of the PCAOB. Those standards require that we plan and perform the audit to obtain reasonable assurance about whether the financial statements are free of material misstatement, whether due to error or fraud. The Trust is not required to have, nor were we engaged to perform, an audit of the Trust’s internal control over financial reporting. As part of our audits, we are required to obtain an understanding of internal control over financial reporting, but not for the purpose of expressing an opinion on the effectiveness of the Trust’s internal control over financial reporting. Accordingly, we express no such opinion.
Pioneer Global High Yield Fund | Annual Report | 10/31/20 67
Our audits included performing procedures to assess the risks of material misstatement of the financial statements, whether due to error or fraud, and performing procedures that respond to those risks. Such procedures included examining, on a test basis, evidence regarding the amounts and disclosures in the financial statements. Our procedures included confirmation of securities owned as of October 31, 2020, by correspondence with the custodian and brokers or by other appropriate auditing procedures where replies from brokers were not received. Our audits also included evaluating the accounting principles used and significant estimates made by management, as well as evaluating the overall presentation of the financial statements. We believe that our audits provide a reasonable basis for our opinion.
We have served as the auditor of one or more Amundi Pioneer investment companies since 2017.
Boston, Massachusetts
December 18, 2020
68 Pioneer Global High Yield Fund | Annual Report | 10/31/20
Additional Information (unaudited)
The percentages of the Fund’s ordinary income distributions that are exempt from nonresident alien (NRA) tax withholding resulting from qualified interest income was 51.56%.
Pioneer Global High Yield Fund | Annual Report | 10/31/20 69
Statement Regarding Liquidity Risk Management Program
As required by law, the Fund has adopted and implemented a liquidity risk management program (the “Program”) that is designed to assess and manage liquidity risk. Liquidity risk is the risk that the Fund could not meet requests to redeem its shares without significant dilution of remaining investors’ interests in the Fund. The Fund’s Board of Trustees designated a liquidity risk management committee (the “Committee”) consisting of employees of Amundi Pioneer Asset Management, Inc. (the “Adviser”) to administer the Program.
The Committee provided the Board of Trustees with a report that addressed the operation of the Program and assessed its adequacy and effectiveness of implementation (the “Report”). The Report covered the period from December 1, 2018 through March 31, 2020 (the “Reporting Period”).
The Report confirmed that, throughout the Reporting Period, the Committee had monitored the Fund’s portfolio liquidity and liquidity risk on an ongoing basis, as described in the Program and in Board reporting throughout the Reporting Period.
The Report discussed the Committee’s annual review of the Program, which addressed, among other things, the following elements of the Program:
The Committee reviewed the Fund’s investment strategy and liquidity of portfolio investments during both normal and reasonably foreseeable stressed conditions. The Committee noted that the Fund’s investment strategy continues to be appropriate for an open-end fund, taking into account, among other things, whether and to what extent the Fund held less liquid and illiquid assets and the extent to which any such investments affected the Fund’s ability to meet redemption requests. In managing and reviewing the Fund’s liquidity risk, the Committee also considered the extent to which the Fund’s investment strategy involves a relatively concentrated portfolio or large positions in particular issuers, the extent to which the Fund uses borrowing for investment purposes, and the extent to which the Fund uses derivatives (including for hedging purposes). The Committee also reviewed the Fund’s short-term and long-term cash flow projections during both normal and reasonably foreseeable stressed conditions. In assessing the Fund’s cash flow projections, the Committee considered, among other factors, historical net redemption activity, redemption policies, ownership concentration, distribution channels, and the degree of certainty associated with the Fund’s short-term and long-term cash flow projections. The Committee also considered the Fund’s holdings of cash and cash equivalents, as well as borrowing arrangements
70 Pioneer Global High Yield Fund | Annual Report | 10/31/20
and other funding sources, including, if applicable, the Fund’s participation in a credit facility, as components of the Fund’s ability to meet redemption requests. The Fund has adopted an in-kind redemption policy which may be utilized to meet larger redemption requests.
The Committee reviewed the Program’s liquidity classification methodology for categorizing the Fund’s investments into one of four liquidity buckets. In reviewing the Fund’s investments, the Committee considered, among other factors, whether trading varying portions of a position in a particular portfolio investment or asset class in sizes the Fund would reasonably anticipate trading, would be reasonably expected to significantly affect liquidity.
The Committee performed an analysis to determine whether the Fund is required to maintain a Highly Liquid Investment Minimum, and determined that no such minimum is required because the Fund primarily holds highly liquid investments.
The Report stated that the Committee concluded the Program operates adequately and effectively, in all material respects, to assess and manage the Fund’s liquidity risk throughout the Reporting Period.
Pioneer Global High Yield Fund | Annual Report | 10/31/20 71
Approval of Investment Management Agreement
Amundi Pioneer Asset Management, Inc. (“APAM”) serves as the investment adviser to Pioneer Global High Yield Fund (the “Fund”) pursuant to an investment management agreement between APAM and the Fund. In order for APAM to remain the investment adviser of the Fund, the Trustees of the Fund must determine annually whether to renew the investment management agreement for the Fund.
The contract review process began in January 2020 as the Trustees of the Fund agreed on, among other things, an overall approach and timeline for the process. Contract review materials were provided to the Trustees in March 2020, July 2020 and September 2020. In addition, the Trustees reviewed and discussed the Fund’s performance at regularly scheduled meetings throughout the year, and took into account other information related to the Fund provided to the Trustees at regularly scheduled meetings, in connection with the review of the Fund’s investment management agreement.
In March 2020, the Trustees, among other things, discussed the memorandum provided by Fund counsel that summarized the legal standards and other considerations that are relevant to the Trustees in their deliberations regarding the renewal of the investment management agreement, and reviewed and discussed the qualifications of the investment management teams for the Fund, as well as the level of investment by the Fund’s portfolio managers in the Fund. In July 2020, the Trustees, among other things, reviewed the Fund’s management fees and total expense ratios, the financial statements of APAM and its parent companies, profitability analyses provided by APAM, and analyses from APAM as to possible economies of scale. The Trustees also reviewed the profitability of the institutional business of APAM and APAM’s affiliate, Amundi Pioneer Institutional Asset Management, Inc. (“APIAM” and, together with APAM, “Amundi Pioneer”), as compared to that of APAM’s fund management business, and considered the differences between the fees and expenses of the Fund and the fees and expenses of APAM’s and APIAM’s institutional accounts, as well as the different services provided by APAM to the Fund and by APAM and APIAM to the institutional accounts. The Trustees further considered contract review materials, including additional materials received in response to the Trustees’ request, in September 2020.
72 Pioneer Global High Yield Fund | Annual Report | 10/31/20
At a meeting held on September 15, 2020, based on their evaluation of the information provided by APAM and third parties, the Trustees of the Fund, including the Independent Trustees voting separately, unanimously approved the renewal of the investment management agreement for another year. In approving the renewal of the investment management agreement, the Trustees considered various factors that they determined were relevant, including the factors described below. The Trustees did not identify any single factor as the controlling factor in determining to approve the renewal of the agreement.
Nature, Extent and Quality of Services
The Trustees considered the nature, extent and quality of the services that had been provided by APAM to the Fund, taking into account the investment objective and strategy of the Fund. The Trustees also reviewed APAM’s investment approach for the Fund and its research process. The Trustees considered the resources of APAM and the personnel of APAM who provide investment management services to the Fund. They also reviewed the amount of non-Fund assets managed by the portfolio managers of the Fund. They considered the non-investment resources and personnel of APAM that are involved in APAM’s services to the Fund, including APAM’s compliance, risk management, and legal resources and personnel. The Trustees noted the substantial attention and high priority given by APAM’s senior management to the Pioneer Fund complex. The Trustees considered the implementation and effectiveness of APAM’s business continuity plan in response to the COVID-19 pandemic.
The Trustees considered that APAM supervises and monitors the performance of the Fund’s service providers and provides the Fund with personnel (including Fund officers) and other resources that are necessary for the Fund’s business management and operations. The Trustees also considered that, as administrator, APAM is responsible for the administration of the Fund’s business and other affairs. The Trustees considered the fees paid to APAM for the provision of administration services.
Based on these considerations, the Trustees concluded that the nature, extent and quality of services that had been provided by APAM to the Fund were satisfactory and consistent with the terms of the investment management agreement.
Pioneer Global High Yield Fund | Annual Report | 10/31/20 73
Performance of the Fund
In considering the Fund’s performance, the Trustees regularly review and discuss throughout the year data prepared by APAM and information comparing the Fund’s performance with the performance of its peer group of funds, as classified by Morningstar, Inc. (Morningstar), and with the performance of the Fund’s benchmark index. They also discuss the Fund’s performance with APAM on a regular basis. The Trustees’ regular reviews and discussions were factored into the Trustees’ deliberations concerning the renewal of the investment management agreement.
Management Fee and Expenses
The Trustees considered information showing the fees and expenses of the Fund in comparison to the management fees of its peer group of funds as classified by Morningstar and also to the expense ratios of a peer group of funds selected on the basis of criteria determined by the Independent Trustees for this purpose using data provided by Strategic Insight Mutual Fund Research and Consulting, LLC (Strategic Insight), an independent third party. The peer group comparisons referred to below are organized in quintiles. Each quintile represents one-fifth of the peer group. In all peer group comparisons referred to below, first quintile is most favorable to the Fund’s shareowners. The Trustees noted that they separately review and consider the impact of the Fund’s transfer agency and Fund- and APAM-paid expenses for sub-transfer agency and intermediary arrangements, and that the results of the most recent such review were considered in the consideration of the Fund’s expense ratio.
The Trustees considered that the Fund’s management fee for the most recent fiscal year was in the fourth quintile relative to the management fees paid by other funds in its Morningstar category for the comparable period. The Trustees considered that the expense ratio of the Fund’s Class A shares for the most recent fiscal year was in the fifth quintile relative to its Strategic Insight peer group for the comparable period. The Trustees noted the resource commitment necessary to manage a fund that invests significantly in non-U.S. securities. Trustees noted that APAM had agreed to waive fees and/or reimburse expenses in order to limit the ordinary operating expenses of the Fund.
The Trustees reviewed management fees charged by APAM and APIAM to institutional and other clients, including publicly offered European funds sponsored by APAM’s affiliates, unaffiliated U.S. registered investment companies (in a sub-advisory capacity), and unaffiliated foreign and domestic separate accounts. The Trustees also considered APAM’s costs in providing services to the Fund and APAM’s and APIAM’s costs in providing
74 Pioneer Global High Yield Fund | Annual Report | 10/31/20
services to the other clients and considered the differences in management fees and profit margins for fund and non-fund services. In evaluating the fees associated with APAM’s and APIAM’s client accounts, the Trustees took into account the respective demands, resources and complexity associated with the Fund and other client accounts. The Trustees noted that, in some instances, the fee rates for those clients were lower than the management fee for the Fund and considered that, under the investment management agreement with the Fund, APAM performs additional services for the Fund that it does not provide to those other clients or services that are broader in scope, including oversight of the Fund’s other service providers and activities related to compliance and the extensive regulatory and tax regimes to which the Fund is subject. The Trustees also considered the entrepreneurial risks associated with APAM’s management of the Fund.
The Trustees concluded that the management fee payable by the Fund to APAM was reasonable in relation to the nature and quality of the services provided by APAM.
Profitability
The Trustees considered information provided by APAM regarding the profitability of APAM with respect to the advisory services provided by APAM to the Fund, including the methodology used by APAM in allocating certain of its costs to the management of the Fund. The Trustees also considered APAM’s profit margin in connection with the overall operation of the Fund. They further reviewed the financial results, including the profit margins, realized by APAM and APIAM from non-fund businesses. The Trustees considered APAM’s profit margins in comparison to the limited industry data available and noted that the profitability of any adviser was affected by numerous factors, including its organizational structure and method for allocating expenses. The Trustees concluded that APAM’s profitability with respect to the management of the Fund was not unreasonable.
Economies of Scale
The Trustees considered APAM’s views relating to economies of scale in connection with the Pioneer Funds as fund assets grow and the extent to which any such economies of scale are shared with the Fund and Fund shareholders. The Trustees recognize that economies of scale are difficult to identify and quantify, and that, among other factors that may be relevant, are the following: fee levels, expense subsidization, investment by APAM in research and analytical capabilities and APAM’s commitment and resource allocation to the Fund. The Trustees noted that profitability also may be an indicator of the availability of any economies of scale, although profitability
Pioneer Global High Yield Fund | Annual Report | 10/31/20 75
may vary for other reasons including due to reductions in expenses. The Trustees concluded that economies of scale, if any, were being appropriately shared with the Fund.
Other Benefits
The Trustees considered the other benefits that APAM enjoys from its relationship with the Fund. The Trustees considered the character and amount of fees paid or to be paid by the Fund, other than under the investment management agreement, for services provided by APAM and its affiliates. The Trustees further considered the revenues and profitability of APAM’s businesses other than the Fund business. To the extent applicable, the Trustees also considered the benefits to the Fund and to APAM and its affiliates from the use of “soft” commission dollars generated by the Fund to pay for research and brokerage services.
The Trustees considered that Amundi Pioneer is the principal U.S. asset management business of Amundi, which is one of the largest asset managers globally. Amundi’s worldwide asset management business manages over $1.7 trillion in assets (including the Pioneer Funds). The Trustees considered that APAM’s relationship with Amundi creates potential opportunities for APAM, APIAM and Amundi that derive from APAM’s relationships with the Fund, including Amundi’s ability to market the services of APAM globally. The Trustees noted that APAM has access to additional research and portfolio management capabilities as a result of its relationship with Amundi and Amundi’s enhanced global presence that may contribute to an increase in the resources available to APAM. The Trustees considered that APAM and the Fund receive reciprocal intangible benefits from the relationship, including mutual brand recognition and, for the Fund, direct and indirect access to the resources of a large global asset manager. The Trustees concluded that any such benefits received by APAM as a result of its relationship with the Fund were reasonable.
Conclusion
After consideration of the factors described above as well as other factors, the Trustees, including the Independent Trustees, concluded that the investment management agreement for the Fund, including the fees payable thereunder, was fair and reasonable and voted to approve the proposed renewal of the investment management agreement.
76 Pioneer Global High Yield Fund | Annual Report | 10/31/20
Trustees, Officers and Service Providers
Investment Adviser and Administrator
Amundi Pioneer Asset Management, Inc.
Custodian and Sub-Administrator
Brown Brothers Harriman & Co.
Independent Registered Public Accounting Firm
Ernst & Young LLP
Principal Underwriter
Amundi Pioneer Distributor, Inc.
Legal Counsel
Morgan, Lewis & Bockius LLP
Transfer Agent
DST Asset Manager Solutions, Inc.
Proxy Voting Policies and Procedures of the Fund are available without charge, upon request, by calling our toll free number (1-800-225-6292). Information regarding how the Fund voted proxies relating to portfolio securities during the most recent 12-month period ended June 30 is publicly available to shareowners at www.amundipioneer.com/us. This information is also available on the Securities and Exchange Commission’s web site at www.sec.gov.
Trustees and Officers
The Fund’s Trustees and officers are listed below, together with their principal occupations and other directorships they have held during at least the past five years. Trustees who are interested persons of the Fund within the meaning of the 1940 Act are referred to as Interested Trustees. Trustees who are not interested persons of the Fund are referred to as Independent Trustees. Each of the Trustees serves as a Trustee of each of the 45 U.S. registered investment portfolios for which Amundi serves as investment adviser (the “Pioneer Funds”). The address for all Trustees and all officers of the Fund is 60 State Street, Boston, Massachusetts 02109.
The Statement of Additional Information of the Fund includes additional information about the Trustees and is available, without charge, upon request, by calling 1-800-225-6292.
Pioneer Global High Yield Fund | Annual Report | 10/31/20 77
| | | | |
| Independent Trustees |
|
| Name, Age and Position | Term of Office and | | Other Directorships |
| Held With the Fund | Length of Service | Principal Occupation | Held by Trustee |
| Thomas J. Perna (70) | Trustee since 2006. | Private investor (2004 – 2008 and 2013 – present); Chairman (2008 – 2013) | Director, Broadridge Financial |
Chairman of the Board | Serves until a successor | and Chief Executive Officer (2008 – 2012), Quadriserv, Inc. (technology | Solutions, Inc. (investor |
and Trustee | trustee is elected or | products for securities lending industry); and Senior Executive Vice | communications and securities |
| earlier retirement | President, The Bank of New York (financial and securities services) | processing provider for financial |
| or removal. | (1986 – 2004) | services industry) (2009 – present); |
| | | Director, Quadriserv, Inc. (2005 – |
| | | 2013); and Commissioner, New |
| | | Jersey State Civil Service |
| | | Commission (2011 – 2015) |
| John E. | Trustee since 2019. | Of Counsel (2019 – present), Partner (1983-2018), Sullivan & | Chairman, The Lakeville Journal |
| Baumgardner, Jr. (69) | Serves until a successor | Cromwell LLP (law firm). | Company, LLC, (privately-held |
Trustee | trustee is elected or | | community newspaper group) |
| earlier retirement | | (2015-present) |
| or removal. | | |
| Diane Durnin (63) | Trustee since 2019. | Managing Director - Head of Product Strategy and Development, BNY | None |
Trustee | Serves until a successor | Mellon Investment Management (investment management firm) (2012-2018); | |
| trustee is elected or | Vice Chairman – The Dreyfus Corporation (2005 – 2018): Executive Vice | |
| earlier retirement | President Head of Product, BNY Mellon Investment Management | |
| or removal. | (2007-2012); Executive Director- Product Strategy, Mellon Asset Management | |
| | (2005-2007); Executive Vice President Head of Products, Marketing and | |
| | Client Service, Dreyfus Corporation (investment management firm) | |
| | (2000-2005); and Senior Vice President Strategic Product and Business | |
| | Development, Dreyfus Corporation (1994-2000) | |
78 Pioneer Global High Yield Fund | Annual Report | 10/31/20
| | | | |
| Name, Age and Position | Term of Office and | | Other Directorships |
| Held With the Fund | Length of Service | Principal Occupation | Held by Trustee |
| Benjamin M. Friedman (76) | Trustee since 2008. | William Joseph Maier Professor of Political Economy, Harvard University | Trustee, Mellon Institutional Funds |
Trustee | Serves until a successor | (1972 – present) | Investment Trust and Mellon |
| trustee is elected or | | Institutional Funds Master Portfolio |
| earlier retirement | | (oversaw 17 portfolios in fund |
| or removal. | | complex) (1989 - 2008) |
| Lorraine H. Monchak (64) | Trustee since 2017. | Chief Investment Officer, 1199 SEIU Funds (healthcare workers union | None |
Trustee | (Advisory Trustee from | pension funds) (2001 – present); Vice President – International Investments | |
| 2014 - 2017). Serves | Group, American International Group, Inc. (insurance company) | |
| until a successor trustee | (1993 – 2001); Vice President – Corporate Finance and Treasury Group, | |
| is elected or earlier | Citibank, N.A. (1980 – 1986 and 1990 – 1993); Vice President – Asset/Liability | |
| retirement or removal. | Management Group, Federal Farm Funding Corporation | |
| | (government-sponsored issuer of debt securities) (1988 – 1990); Mortgage | |
| | Strategies Group, Shearson Lehman Hutton, Inc. (investment bank) | |
| | (1987 – 1988); and Mortgage Strategies Group, Drexel Burnham Lambert, | |
| | Ltd. (investment bank) (1986 – 1987) | |
| Marguerite A. Piret (72) | Trustee since 2001. | Chief Financial Officer, American Ag Energy, Inc. (controlled environment | Director of New America High |
Trustee | Serves until a successor | and agriculture company) (2016 – present); and President and Chief | Income Fund, Inc. (closed-end |
| trustee is elected or | Executive Officer, Metric Financial Inc. (formerly known as Newbury Piret | investment company) |
| earlier retirement | Company) (investment banking firm) (1981 – 2019) | (2004 – present); and Member, |
| or removal. | | Board of Governors, Investment |
| | | Company Institute (2000 – 2006) |
Pioneer Global High Yield Fund | Annual Report | 10/31/20 79
| | | | |
Independent Trustees (continued) | |
|
| Name, Age and Position | Term of Office and | | Other Directorships |
| Held With the Fund | Length of Service | Principal Occupation | Held by Trustee |
| Fred J. Ricciardi (73) | Trustee since 2014. | Private investor (2020 – present); Consultant (investment company services) | None |
Trustee | Serves until a successor | (2012 – 2020); Executive Vice President, BNY Mellon (financial and | |
| trustee is elected or | investment company services) (1969 – 2012); Director, BNY International | |
| earlier retirement | Financing Corp. (financial services) (2002 – 2012); Director, Mellon | |
| or removal. | Overseas Investment Corp. (financial services) (2009 – 2012); Director, | |
| | Financial Models (technology) (2005-2007); Director, BNY Hamilton Funds, | |
| | Ireland (offshore investment companies) (2004-2007); Chairman/Director, | |
| | AIB/BNY Securities Services, Ltd., Ireland (financial services) (1999-2006); | |
| | and Chairman, BNY Alternative Investment Services, Inc. (financial services) | |
| | (2005-2007) | |
80 Pioneer Global High Yield Fund | Annual Report | 10/31/20
| | | | |
| Interested Trustees | |
|
| Name, Age and Position | Term of Office and | | Other Directorships |
| Held With the Fund | Length of Service | Principal Occupation | Held by Trustee |
| Lisa M. Jones (58)* | Trustee since 2017. | Director, CEO and President of Amundi Pioneer Asset Management USA, | None |
Trustee, President and | Serves until a successor | Inc. (investment management firm) (since September 2014); Director, CEO | |
Chief Executive Officer | trustee is elected or | and President of Amundi Pioneer Asset Management, Inc. (since | |
| earlier retirement | September 2014); Director, CEO and President of Amundi Pioneer | |
| or removal | Distributor, Inc. (since September 2014); Director, CEO and President of | |
| | Amundi Pioneer Institutional Asset Management, Inc. (since September 2014); | |
| | Chair, Amundi Pioneer Asset Management USA, Inc., Amundi Pioneer | |
| | Distributor, Inc. and Amundi Pioneer Institutional Asset Management, Inc. | |
| | (September 2014 – 2018); Managing Director, Morgan Stanley Investment | |
| | Management (investment management firm) (2010 – 2013); Director of | |
| | Institutional Business, CEO of International, Eaton Vance Management | |
| | (investment management firm) (2005 – 2010); and Director of | |
| | Amundi USA, Inc. (since 2017) | |
| Kenneth J. Taubes (62)* | Trustee since 2014. | Director and Executive Vice President (since 2008) and Chief Investment | None |
Trustee | Serves until a successor | Officer, U.S. (since 2010) of Amundi Pioneer Asset Management USA, Inc. | |
| trustee is elected or | (investment management firm); Director and Executive Vice President and | |
| earlier retirement | Chief Investment Officer, U.S. of Amundi (since 2008); Executive | |
| or removal | Vice President and Chief Investment Officer, U.S. of Amundi Pioneer | |
| | Institutional Asset Management, Inc. (since 2009); Portfolio Manager of | |
| | Amundi (since 1999); and Director of Amundi USA, Inc. (since 2017) | |
| * Ms. Jones and Mr. Taubes are Interested Trustees because they are officers or directors of the Fund’s investment adviser and certain of its affiliates. |
Pioneer Global High Yield Fund | Annual Report | 10/31/20 81
| | | | |
Fund Officers
| |
|
| Name, Age and Position | Term of Office and | | Other Directorships |
| Held With the Fund | Length of Service | Principal Occupation | Held by Officer |
| Christopher J. Kelley (55) | Since 2003. Serves at | Vice President and Associate General Counsel of Amundi since | None |
Secretary and Chief | the discretion of | January 2008; Secretary and Chief Legal Officer of all of the Pioneer Funds | |
Legal Officer | the Board | since June 2010; Assistant Secretary of all of the Pioneer Funds from | |
| | September 2003 to May 2010; and Vice President and Senior Counsel of | |
| | Amundi from July 2002 to December 2007 | |
| Carol B. Hannigan (59) | Since 2010. Serves at | Fund Governance Director of Amundi since December 2006 and | None |
Assistant Secretary | the discretion of | Assistant Secretary of all the Pioneer Funds since June 2010; | |
| the Board | Manager – Fund Governance of Amundi from December 2003 to | |
| | November 2006; and Senior Paralegal of Amundi from | |
| | January 2000 to November 2003 | |
| Thomas Reyes (57) | Since 2010. Serves at | Assistant General Counsel of Amundi since May 2013 and | None |
Assistant Secretary | the discretion of | Assistant Secretary of all the Pioneer Funds since June 2010; and Counsel of | |
| the Board | Amundi Pioneer from June 2007 to May 2013 | |
| Mark E. Bradley (60) | Since 2008. Serves at | Vice President – Fund Treasury of Amundi; Treasurer of all of the | None |
Treasurer and | the discretion of | Pioneer Funds since March 2008; Deputy Treasurer of Amundi from | |
Chief Financial and | the Board | March 2004 to February 2008; and Assistant Treasurer of all of the | |
Accounting Officer | | Pioneer Funds from March 2004 to February 2008 | |
| Luis I. Presutti (55) | Since 2001. Serves at | Director – Fund Treasury of Amundi; and Assistant Treasurer of | None |
Assistant Treasurer | the discretion of | all of the Pioneer Funds | |
| the Board | | |
| Gary Sullivan (62) | Since 2002. Serves at | Senior Manager – Fund Treasury of Amundi; and Assistant Treasurer | None |
Assistant Treasurer | the discretion of | of all of the Pioneer Funds | |
| the Board | | |
82 Pioneer Global High Yield Fund | Annual Report | 10/31/20
| | | | |
| Name, Age and Position | Term of Office and | | Other Directorships |
| Held With the Fund | Length of Service | Principal Occupation | Held by Officer |
| Antonio Furtado (38) | Since 2020. Serves at | Fund Oversight Manager – Fund Treasury of Amundi; and Assistant | None |
Assistant Treasurer | the discretion of | Treasurer of all of the Pioneer Funds | |
| the Board | | |
| John Malone (48) | Since 2018. Serves at | Managing Director, Chief Compliance Officer of Amundi Pioneer Asset | None |
Chief Compliance Officer | the discretion of | Management; Amundi Pioneer Institutional Asset Management, Inc.; and | |
| the Board | the Pioneer Funds since September 2018; and Chief Compliance Officer of | |
| | Amundi Pioneer Distributor, Inc. since January 2014. | |
| Kelly O’Donnell (49) | Since 2006. Serves at | Vice President – Amundi Pioneer Asset Management; and Anti-Money | None |
Anti-Money | the discretion of | Laundering Officer of all the Pioneer Funds since 2006 | |
Laundering Officer | the Board | | |
Pioneer Global High Yield Fund | Annual Report | 10/31/20 83
This page was intentionally left blank.
84 Pioneer Global High Yield Fund | Annual Report | 10/31/20
How to Contact Amundi
We are pleased to offer a variety of convenient ways for you to contact us for assistance or information.
| | | |
| Call us for: | | |
Account Information, including existing accounts, | |
new accounts, prospectuses, applications | |
and service forms | | 1-800-225-6292 |
| | |
FactFoneSM for automated fund yields, prices, | |
account information and transactions | 1-800-225-4321 |
| | |
| Retirement plans information | | 1-800-622-0176 |
|
| Write to us: | | |
Amundi | | |
P.O. Box 219427 | | |
Kansas City, MO 64121-9427 | | |
| | | |
| Our toll-free fax | | 1-800-225-4240 |
| | | |
| Our internet e-mail address | us.askamundipioneer@amundipioneer.com |
(for general questions about Amundi only) | |
|
| Visit our web site: www.amundipioneer.com/us | |
This report must be preceded or accompanied by a prospectus.
The Fund files a complete schedule of portfolio holdings with the Securities and Exchange Commission for the first and third quarters of each fiscal year as an exhibit to its reports on Form N-PORT. Shareholders may view the filed Form N-PORT by visiting the Commission’s web site at https://www.sec.gov.
Amundi Pioneer Asset Management, Inc.
60 State Street
Boston, MA 02109
www.amundipioneer.com/us
Securities offered through Amundi Pioneer Distributor, Inc.
60 State Street, Boston, MA 02109
Underwriter of Pioneer Mutual Funds, Member SIPC
© 2020 Amundi Pioneer Asset Management 19440-14-1220
ITEM 2. CODE OF ETHICS.
(a) Disclose whether, as of the end of the period covered by the report, the registrant has adopted a code of ethics that applies to the registrant’s principal executive officer, principal financial officer, principal accounting officer or controller, or persons performing similar functions, regardless of whether these individuals are employed by the registrant or a third party. If the registrant has not adopted such a code of ethics, explain why it has not done so.
The registrant has adopted, as of the end of the period covered by this report, a code of ethics that applies to the registrant’s principal executive officer, principal financial officer, principal accounting officer and controller.
(b) For purposes of this Item, the term “code of ethics” means written standards that are reasonably designed to deter wrongdoing and to promote:
(1) Honest and ethical conduct, including the ethical handling of actual or apparent conflicts of interest between personal and professional relationships;
(2) Full, fair, accurate, timely, and understandable disclosure in reports and documents that a registrant files with, or submits to, the Commission and in other public communications made by the registrant;
(3) Compliance with applicable governmental laws, rules, and regulations;
(4) The prompt internal reporting of violations of the code to an appropriate person or persons identified in the code; and
(5) Accountability for adherence to the code.
(c) The registrant must briefly describe the nature of any amendment, during the period covered by the report, to a provision of its code of ethics that applies to the registrant’s principal executive officer, principal financial officer, principal accounting officer or controller, or persons performing similar functions, regardless of whether these individuals are employed by the registrant or a third party, and that relates to any element of the code of ethics definition enumerated in paragraph (b) of this Item. The registrant must file a copy of any such amendment as an exhibit pursuant to Item 10(a), unless the registrant has elected to satisfy paragraph (f) of this Item by posting its code of ethics on its website pursuant to paragraph (f)(2) of this Item, or by undertaking to provide its code of ethics to any person without charge, upon request, pursuant to paragraph (f)(3) of this Item.
The registrant has made no amendments to the code of ethics during the period covered by this report.
(d) If the registrant has, during the period covered by the report, granted a waiver, including an implicit waiver, from a provision of the code of ethics to the registrant’s principal executive officer, principal financial officer, principal accounting officer or controller, or persons performing similar functions, regardless of whether these individuals are employed by the registrant or a third party, that relates to one or more of the items set forth in paragraph (b) of this Item, the registrant must briefly describe the nature of the waiver, the name of the person to whom the waiver was granted, and the date of the waiver.
Not applicable.
(e) If the registrant intends to satisfy the disclosure requirement under paragraph (c) or (d) of this Item regarding an amendment to, or a waiver from, a provision of its code of ethics that applies to the registrant’s principal executive officer, principal financial officer, principal accounting officer or controller, or persons performing similar functions and that relates to any element of the code of ethics definition
enumerated in paragraph (b) of this Item by posting such information on its Internet website, disclose the registrant’s Internet address and such intention.
Not applicable.
(f) The registrant must:
(1) File with the Commission, pursuant to Item 12(a)(1), a copy of its code of ethics that applies to the registrant’s principal executive officer, principal financial officer, principal accounting officer or controller, or persons performing similar functions, as an exhibit to its annual report on this Form N-CSR (see attachment);
(2) Post the text of such code of ethics on its Internet website and disclose, in its most recent report on this Form N-CSR, its Internet address and the fact that it has posted such code of ethics on its Internet website; or
(3) Undertake in its most recent report on this Form N-CSR to provide to any person without charge, upon request, a copy of such code of ethics and explain the manner in which such request may be made. See Item 10(2)
ITEM 3. AUDIT COMMITTEE FINANCIAL EXPERT.
(a) (1) Disclose that the registrant’s board of trustees has determined that the registrant either:
(i) Has at least one audit committee financial expert serving on its audit committee; or
(ii) Does not have an audit committee financial expert serving on its audit committee.
The registrant’s Board of Trustees has determined that the registrant has at least one audit committee financial expert.
(2) If the registrant provides the disclosure required by paragraph (a)(1)(i) of this Item, it must disclose the name of the audit committee financial expert and whether that person is “independent.” In order to be considered “independent” for purposes of this Item, a member of an audit committee may not, other than in his or her capacity as a member of the audit committee, the board of trustees, or any other board committee:
(i) Accept directly or indirectly any consulting, advisory, or other compensatory fee from the issuer; or
(ii) Be an “interested person” of the investment company as defined in Section 2(a)(19) of the Act (15 U.S.C. 80a-2(a)(19)).
Mr. Fred J. Ricciardi, an independent trustee, is such an audit committee financial expert.
(3) If the registrant provides the disclosure required by paragraph (a)(1) (ii) of this Item, it must explain why it does not have an audit committee financial expert.
Not applicable.
ITEM 4. PRINCIPAL ACCOUNTANT FEES AND SERVICES.
(a) Disclose, under the caption AUDIT FEES, the aggregate fees billed for each of the last two fiscal years for professional services rendered by the principal accountant for the audit of the registrant’s annual financial statements or services that are normally provided by the accountant in connection with statutory and regulatory filings or engagements for those fiscal years.
The audit fees for the Trust were $37,700 payable to Ernst & Young LLP for the year ended October 31, 2020 and $35,000 for the year ended October 31, 2019.
(b) Disclose, under the caption AUDIT-RELATED FEES, the aggregate fees billed in each of the last two fiscal years for assurance and related services by the principal accountant that are reasonably related to the performance of the audit of the registrant’s financial statements and are not reported under paragraph (a) of this Item. Registrants shall describe the nature of the services comprising the fees disclosed under this category.
There were no audit-related services in 2020 or 2019.
(c) Disclose, under the caption TAX FEES, the aggregate fees billed in each of the last two fiscal years for professional services rendered by the principal accountant for tax compliance, tax advice, and tax planning. Registrants shall describe the nature of the services comprising the fees disclosed under this category.
The Trust paid aggregate non-audit fees to Ernst & Young LLP for tax services of $13,915 and $10,115 during the fiscal years ended October 31, 2020 and 2019, respectively.
(d) Disclose, under the caption ALL OTHER FEES, the aggregate fees billed in each of the last two fiscal years for products and services provided by the principal accountant, other than the services reported in paragraphs (a) through (c) of this Item. Registrants shall describe the nature of the services comprising the fees disclosed under this category.
There were no other fees in 2020 or 2019.
(e) (1) Disclose the audit committee’s pre-approval policies and procedures described in paragraph (c)(7) of Rule 2-01 of Regulation S-X.
PIONEER FUNDS
APPROVAL OF AUDIT, AUDIT-RELATED, TAX AND OTHER SERVICES
PROVIDED BY THE INDEPENDENT AUDITOR
SECTION I - POLICY PURPOSE AND APPLICABILITY
The Pioneer Funds recognize the importance of maintaining the independence of their outside auditors. Maintaining independence is a shared responsibility involving Amundi Pioneer Asset Management, Inc, the audit committee and the independent auditors.
The Funds recognize that a Fund’s independent auditors: 1) possess knowledge of the Funds, 2) are able to incorporate certain services into the scope of the audit, thereby avoiding redundant work, cost and disruption of Fund personnel and processes, and 3) have expertise that has value to the Funds. As a result, there are situations where it is desirable to use the Fund’s independent auditors for services in addition to the annual audit and where the potential for conflicts of interests are minimal. Consequently, this policy, which is intended to comply with Rule 210.2-01(C)(7), sets forth guidelines and procedures to
be followed by the Funds when retaining the independent audit firm to perform audit, audit-related tax and other services under those circumstances, while also maintaining independence.
Approval of a service in accordance with this policy for a Fund shall also constitute approval for any other Fund whose pre-approval is required pursuant to Rule 210.2-01(c)(7)(ii).
In addition to the procedures set forth in this policy, any non-audit services that may be provided consistently with Rule 210.2-01 may be approved by the Audit Committee itself and any pre-approval that may be waived in accordance with Rule 210.2-01(c)(7)(i)(C) is hereby waived.
Selection of a Fund’s independent auditors and their compensation shall be determined by the Audit Committee and shall not be subject to this policy.
| | | |
| SECTION II - POLICY |
| |
| SERVICE CATEGORY | SERVICE CATEGORY DESCRIPTION | SPECIFIC PRE-APPROVED SERVICE SUBCATEGORIES |
| | | |
| I. AUDIT SERVICES | Services that are directly | o Accounting research assistance |
| | related to performing the | o SEC consultation, registration |
| | independent audit of the Funds | statements, and reporting |
| | | o Tax accrual related matters |
| | | o Implementation of new accounting standards |
| | | o Compliance letters (e.g. rating agency letters) |
| | | o Regulatory reviews and assistance |
| | | regarding financial matters |
| | | o Semi-annual reviews (if requested) |
| | | o Comfort letters for closed end offerings |
| II. AUDIT-RELATED | Services which are not | o AICPA attest and agreed-upon procedures |
| SERVICES | prohibited under Rule | o Technology control assessments |
| | 210.2-01(C)(4) (the “Rule”) | o Financial reporting control assessments |
| | and are related extensions of | o Enterprise security architecture |
| | the audit services support the | assessment |
| | audit, or use the knowledge/expertise | |
| | gained from the audit procedures as a | |
| | foundation to complete the project. | |
| | In most cases, if the Audit-Related | |
| | Services are not performed by the | |
| | Audit firm, the scope of the Audit | |
| | Services would likely increase. | |
| | The Services are typically well-defined | |
| | and governed by accounting | |
| | professional standards (AICPA, | |
| | SEC, etc.) | |
| | |
| AUDIT COMMITTEE APPROVAL POLICY | AUDIT COMMITTEE REPORTING POLICY |
| o “One-time” pre-approval | o A summary of all such |
| for the audit period for all | services and related fees |
| pre-approved specific service | reported at each regularly |
| subcategories. Approval of the | scheduled Audit Committee |
| independent auditors as | meeting. |
| auditors for a Fund shall | |
| constitute pre approval for | |
| these services. | |
| |
| o “One-time” pre-approval | o A summary of all such |
| for the fund fiscal year within | services and related fees |
| a specified dollar limit | (including comparison to |
| for all pre-approved | specified dollar limits) |
| specific service subcategories | reported quarterly. |
| |
| o Specific approval is | |
| needed to exceed the | |
| pre-approved dollar limit for | |
| these services (see general | |
| Audit Committee approval policy | |
| below for details on obtaining | |
| specific approvals) | |
| |
| o Specific approval is | |
| needed to use the Fund’s | |
| auditors for Audit-Related | |
| Services not denoted as | |
| “pre-approved”, or | |
| to add a specific service | |
| subcategory as “pre-approved” | |
SECTION III - POLICY DETAIL, CONTINUED
| | |
| SERVICE CATEGORY | SERVICE CATEGORY DESCRIPTION | SPECIFIC PRE-APPROVED SERVICE |
| | | SUBCATEGORIES |
| III. TAX SERVICES | Services which are not | o Tax planning and support |
| | prohibited by the Rule, | o Tax controversy assistance |
| | if an officer of the Fund | o Tax compliance, tax returns, excise |
| | determines that using the | tax returns and support |
| | Fund’s auditor to provide | o Tax opinions |
| | these services creates | |
| | significant synergy in | |
| | the form of efficiency, | |
| | minimized disruption, or | |
| | the ability to maintain a | |
| | desired level of | |
| | confidentiality. | |
| | |
| AUDIT COMMITTEE APPROVAL POLICY | AUDIT COMMITTEE REPORTING POLICY |
| o “One-time” pre-approval | o A summary of |
| for the fund fiscal year | all such services and |
| within a specified dollar limit | related fees |
| | (including comparison |
| | to specified dollar |
| | limits) reported |
| | quarterly. |
| |
| o Specific approval is | |
| needed to exceed the | |
| pre-approved dollar limits for | |
| these services (see general | |
| Audit Committee approval policy | |
| below for details on obtaining | |
| specific approvals) | |
| |
| o Specific approval is | |
| needed to use the Fund’s | |
| auditors for tax services not | |
| denoted as pre-approved, or to | |
| add a specific service subcategory as | |
| “pre-approved” | |
SECTION III - POLICY DETAIL, CONTINUED
| |
| SERVICE CATEGORY | SERVICE CATEGORY DESCRIPTION | SPECIFIC PRE-APPROVED SERVICE |
| | | SUBCATEGORIES |
| IV. OTHER SERVICES | Services which are not | o Business Risk Management support |
| | prohibited by the Rule, | o Other control and regulatory |
| A. SYNERGISTIC, | if an officer of the Fund | compliance projects |
| UNIQUE QUALIFICATIONS | determines that using the | |
| | Fund’s auditor to provide | |
| | these services creates | |
| | significant synergy in | |
| | the form of efficiency, | |
| | minimized disruption, | |
| | the ability to maintain a | |
| | desired level of | |
| | confidentiality, or where | |
| | the Fund’s auditors | |
| | posses unique or superior | |
| | qualifications to provide | |
| | these services, resulting | |
| | in superior value and | |
| | results for the Fund. | |
| | |
| AUDIT COMMITTEE APPROVAL POLICY | AUDIT COMMITTEE REPORTING POLICY |
| o “One-time” pre-approval | o A summary of |
| for the fund fiscal year within | all such services and |
| a specified dollar limit | related fees |
| | (including comparison |
| | to specified dollar |
| | limits) reported |
| | quarterly. |
| o Specific approval is | |
| needed to exceed the | |
| pre-approved dollar limits for | |
| these services (see general | |
| Audit Committee approval policy | |
| below for details on obtaining | |
| specific approvals) | |
| |
| o Specific approval is | |
| needed to use the Fund’s | |
| auditors for “Synergistic” or | |
| “Unique Qualifications” Other | |
| Services not denoted as | |
| pre-approved to the left, or to | |
| add a specific service | |
| subcategory as “pre-approved” | |
SECTION III - POLICY DETAIL, CONTINUED
| |
| SERVICE CATEGORY | SERVICE CATEGORY DESCRIPTION | SPECIFIC PROHIBITED SERVICE |
| | | SUBCATEGORIES |
| PROHIBITED SERVICES | Services which result | 1. Bookkeeping or other services |
| | in the auditors losing | related to the accounting records or |
| | independence status | financial statements of the audit |
| | under the Rule. | client* |
| | | 2. Financial information systems design |
| | | and implementation* |
| | | 3. Appraisal or valuation services, |
| | | fairness* opinions, or |
| | | contribution-in-kind reports |
| | | 4. Actuarial services (i.e., setting |
| | | actuarial reserves versus actuarial |
| | | audit work)* |
| | | 5. Internal audit outsourcing services* |
| | | 6. Management functions or human |
| | | resources |
| | | 7. Broker or dealer, investment |
| | | advisor, or investment banking services |
| | | 8. Legal services and expert services |
| | | unrelated to the audit |
| | | 9. Any other service that the Public |
| | | Company Accounting Oversight Board |
| | | determines, by regulation, is |
| | | impermissible |
| | |
| AUDIT COMMITTEE APPROVAL POLICY | AUDIT COMMITTEE REPORTING POLICY |
| o These services are not to be | o A summary of all |
| performed with the exception of the(*) | services and related |
| services that may be permitted | fees reported at each |
| if they would not be subject to audit | regularly scheduled |
| procedures at the audit client (as | Audit Committee meeting |
| defined in rule 2-01(f)(4)) level | will serve as continual |
| the firm providing the service. | confirmation that has |
| | not provided any |
| | restricted services. |
GENERAL AUDIT COMMITTEE APPROVAL POLICY:
o For all projects, the officers of the Funds and the Fund’s auditors will each make an assessment to determine that any proposed projects will not impair independence.
o Potential services will be classified into the four non-restricted service categories and the “Approval of Audit, Audit-Related, Tax and Other Services” Policy above will be applied. Any services outside the specific pre-approved service subcategories set forth above must be specifically approved by the Audit Committee.
o At least quarterly, the Audit Committee shall review a report summarizing the services by service category, including fees, provided by the Audit firm as set forth in the above policy.
(2) Disclose the percentage of services described in each of paragraphs (b) through (d) of this Item that were approved by the audit committee pursuant to paragraph (c)(7)(i)(C) of Rule 2-01 of Regulation S-X.
Non-Audit Services
Beginning with non-audit service contracts entered into on or after May 6, 2003, the effective date of the new SEC pre-approval rules, the Trust’s audit committee is required to pre-approve services to affiliates defined by SEC rules to the extent that the services are determined to have a direct impact on the operations or financial reporting of the Trust. For the years ended October 31, 2020 and 2019, there were no services provided to an affiliate that required the Trust’s audit committee pre-approval.
(f) If greater than 50 percent, disclose the percentage of hours expended on the principal accountants engagement to audit the registrant’s financial statements for the most recent fiscal year that were attributed to work performed by persons other than the principal accountant’s full-time, permanent employees.
N/A
(g) Disclose the aggregate non-audit fees billed by the registrants accountant for services rendered to the registrant, and rendered to the registrants investment adviser (not including any sub-adviser whose role is primarily portfolio management and is subcontracted with or overseen by another investment adviser), and any entity controlling, controlled by, or under common control with the adviser that provides ongoing services to the registrant for each of the last two fiscal years of the registrant.
The Trust paid aggregate non-audit fees to Ernst & Young LLP for tax services of $13,915 and $10,115 during the fiscal years ended October 31, 2020 and 2019, respectively.
(h) Disclose whether the registrants audit committee of the board of trustees has considered whether the provision of non-audit services that were rendered to the registrants investment adviser (not including any subadviser whose role is primarily portfolio management and is subcontracted with or overseen by another investment adviser), and any entity controlling, controlled by, or under common control with the investment adviser that provides ongoing services to the registrant that were not pre-approved pursuant to paragraph (c)(7)(ii) of Rule 2-01 of Regulation S-X is compatible with maintaining the principal accountant’s independence.
The Fund’s audit committee of the Board of Trustees has considered whether the provision of non-audit services that were rendered to the Affiliates (as defined) that were not pre- approved pursuant to paragraph (c)(7)(ii) of Rule 2-01 of Regulation S-X is compatible with maintaining the principal accountant��s independence.
ITEM 5. AUDIT COMMITTEE OF LISTED REGISTRANTS
(a) If the registrant is a listed issuer as defined in Rule 10A-3 under the Exchange Act (17 CFR 240.10A-3), state whether or not the registrant has a separately-designated standing audit committee established in accordance with Section 3(a)(58)(A) of the Exchange Act (15 U.S.C. 78c(a)(58)(A)). If the registrant has such a committee, however designated, identify each committee member. If the entire board of directors is acting as the registrant’s audit committee as specified in Section 3(a)(58)(B) of the Exchange Act (15 U.S.C. 78c(a)(58)(B)), so state.
N/A
(b) If applicable, provide the disclosure required by Rule 10A-3(d) under the Exchange Act (17 CFR 240.10A-3(d)) regarding an exemption from the listing standards for audit committees.
N/A
ITEM 6. SCHEDULE OF INVESTMENTS.
File Schedule of Investments in securities of unaffiliated issuers as of the close of the reporting period as set forth in 210.1212 of Regulation S-X [17 CFR 210.12-12], unless the schedule is included as part of the report to shareholders filed under Item 1 of this Form.
Included in Item 1
ITEM 7. DISCLOSURE OF PROXY VOTING POLICIES AND PROCEDURES FOR CLOSED-END MANAGEMENT INVESTMENT COMPANIES.
A closed-end management investment company that is filing an annual report on this Form N-CSR must, unless it invests exclusively in non-voting securities, describe the policies and procedures that it uses to determine how to vote proxies relating to portfolio securities, including the procedures that the company uses when a vote presents a conflict between the interests of its shareholders, on the one hand, and those of the company’s investment adviser; principal underwriter; or any affiliated person (as defined in Section 2(a)(3) of the Investment Company Act of 1940 (15 U.S.C. 80a-2(a)(3)) and the rules thereunder) of the company, its investment adviser, or its principal underwriter, on the other. Include any policies and procedures of the company’s investment adviser, or any other third party, that the company uses, or that are used on the company’s behalf, to determine how to vote proxies relating to portfolio securities.
N/A
ITEM 8. PORTFOLIO MANAGERS OF CLOSED-END MANAGEMENT INVESTMENT COMPANIES.
(a) If the registrant is a closed-end management investment company that is filing an annual report on this Form N-CSR, provide the following information:
(1) State the name, title, and length of service of the person or persons employed by or associated with the registrant or an investment adviser of the registrant who are primarily responsible for the day-to-day management of the registrant’s portfolio (“Portfolio Manager”). Also state each Portfolio Manager’s business experience during the past 5 years.
N/A
ITEM 9. PURCHASES OF EQUITY SECURITIES BY CLOSED-END MANAGEMENT INVESTMENT COMPANY AND AFFILIATED PURCHASERS.
(a) If the registrant is a closed-end management investment company, in the following tabular format, provide the information specified in paragraph (b) of this Item with respect to any purchase made by or on behalf of the registrant or any affiliated purchaser, as defined in Rule 10b-18(a)(3) under the Exchange Act (17 CFR 240.10b-18(a)(3)), of shares or other units of any class of the registrant’s equity securities that is registered by the registrant pursuant to Section 12 of the Exchange Act (15 U.S.C. 781).
N/A
ITEM 10. SUBMISSION OF MATTERS TO A VOTE OF SECURITY HOLDERS.
Describe any material changes to the procedures by which shareholders may recommend nominees to the registrant’s board of directors, where those changes were implemented after the registrant last provided disclosure in response to the requirements of Item 407(c)(2)(iv) of Regulation S-R(17 CFR 229.407)(as required by Item 22(b)(15)) of Schedule 14A (17 CFR 240.14a-101), or this Item.
There have been no material changes to the procedures by which the shareholders may recommend nominees to the registrant’s board of directors since the registrant last provided disclosure in response to the requirements of Item 407(c)(2)(iv) of Regulation S-R of Schedule 14(A) in its definitive proxy statement, or this item.
ITEM 11. CONTROLS AND PROCEDURES.
(a) Disclose the conclusions of the registrant’s principal executive and principal financials officers, or persons performing similar functions, regarding the effectiveness of the registrant’s disclosure controls and procedures (as defined in Rule 30a-3(c) under the Act (17 CFR 270.30a-3(c))) as of a date within 90 days of the filing date of the report that includes the disclosure required by this paragraph, based on the evaluation of these controls and procedures required by Rule 30a-3(b) under the Act (17 CFR 270.30(a)-3(b) and Rules 13a-15(b) or 15d-15(b) under the Exchange Act (17 CFR 240.13a-15(b) or 240.15d-15(b)).
The registrant’s principal executive officer and principal financial officer have concluded that the registrant’s disclosure controls and procedures are effective based on the evaluation of these controls and procedures as of a date within 90 days of the filing date of this report.
(b) Disclose any change in the registrant’s internal control over financial reporting (as defined in Rule 30a-3(d) under the Act (17CFR 270.30a-3(d)) that occured during the second fiscal quarter of the period covered by this report that has materially affected, or is reasonably likely to materially affect, the registrant’s internal control over financial reporting.
There were no significant changes in the registrant’s internal control over financial reporting that occurred during the second fiscal quarter of the period covered by this report that have materially affected, or are reasonably likely to materially affect, the registrant’s internal control over financial reporting.
Item 12. Disclosure of Securities Lending Activities for Closed-End Management Investment Companies.
(a) If the registrant is a closed-end management investment company, provide the following dollar amounts of income and compensation related to the securities lending activities of the registrant during its most recent fiscal year:
N/A
(1) Gross income from securities lending activities;
N/A
(2) All fees and/or compensation for each of the following securities lending activities and related services: any share of revenue generated by the securities lending program paid to the securities lending agent(s) (revenue split); fees paid for cash collateral management services (including fees deducted from a pooled cash collateral reinvestment vehicle) that are not included in the revenue split; administrative fees that are not included in the revenue split; fees for indemnification that are not included in the revenue split; rebates paid to borrowers; and any other fees relating to the securities lending program that are not included in the revenue split, including a description of those other fees;
N/A
(3) The aggregate fees/compensation disclosed pursuant to paragraph (2); and
N/A
(4) Net income from securities lending activities (i.e., the dollar amount in paragraph (1) minus the dollar amount in paragraph (3)).
If a fee for a service is included in the revenue split, state that the fee is included in the revenue split.
N/A
(b) If the registrant is a closed-end management investment company, describe the services provided to the registrant by the securities lending agent in the registrants most recent fiscal year.
N/A
ITEM 13. EXHIBITS.
(a) File the exhibits listed below as part of this Form. Letter or number the exhibits in the sequence indicated.
SIGNATURES
[See General Instruction F]
Pursuant to the requirements of the Securities Exchange Act of 1934 and the Investment Company Act of 1940, the registrant has duly caused this report to be signed on its behalf by the undersigned, thereunto duly authorized.
(Registrant) Pioneer Series Trust VII
By (Signature and Title)* /s/ Lisa M. Jones
Lisa M. Jones, President & Chief Executive Officer
Date December 30, 2020
Pursuant to the requirements of the Securities Exchange Act of 1934 and the Investment Company Act of 1940, this report has been signed below by the following persons on behalf of the registrant and in the capacities and on the dates indicated.
By (Signature and Title)* /s/ Lisa M. Jones
Lisa M. Jones, President & Chief Executive Officer
Date December 30, 2020
By (Signature and Title)* /s/ Mark E. Bradley
Mark E. Bradley, Treasurer & Chief Accounting & Financial Officer
Date December 30, 2020
* Print the name and title of each signing officer under his or her signature.