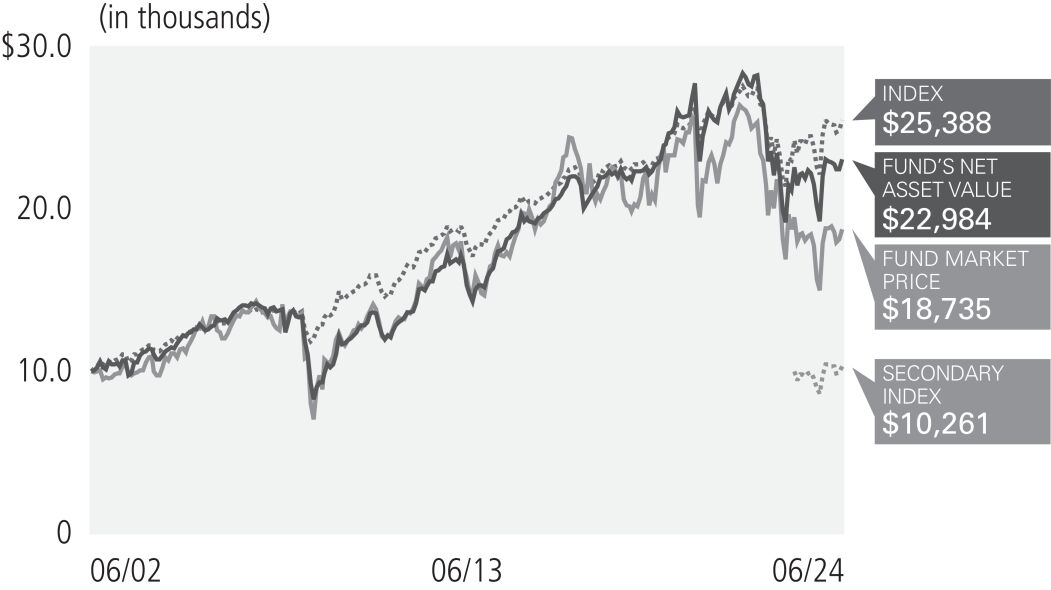
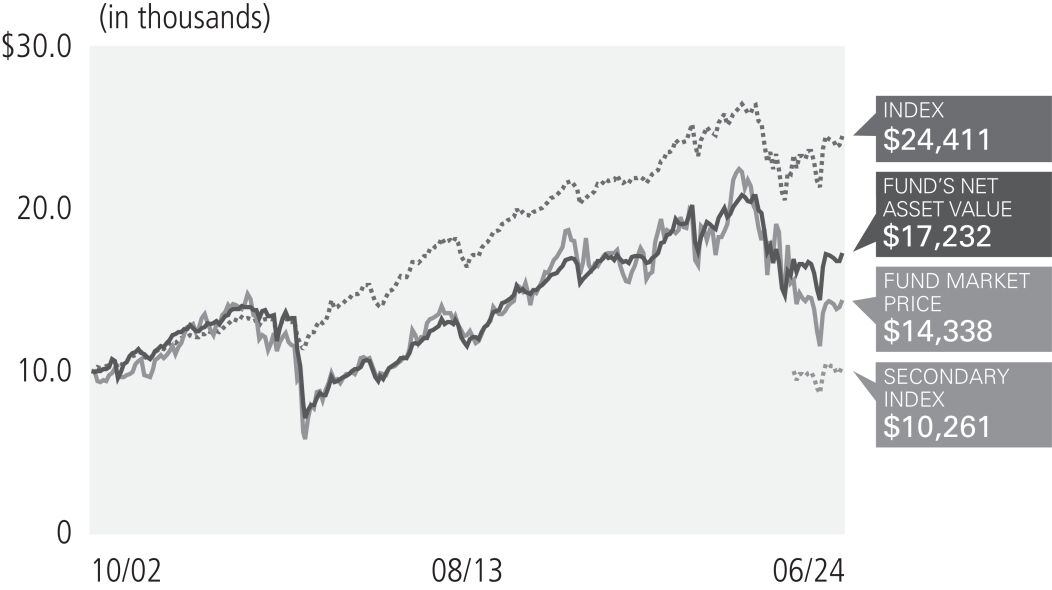
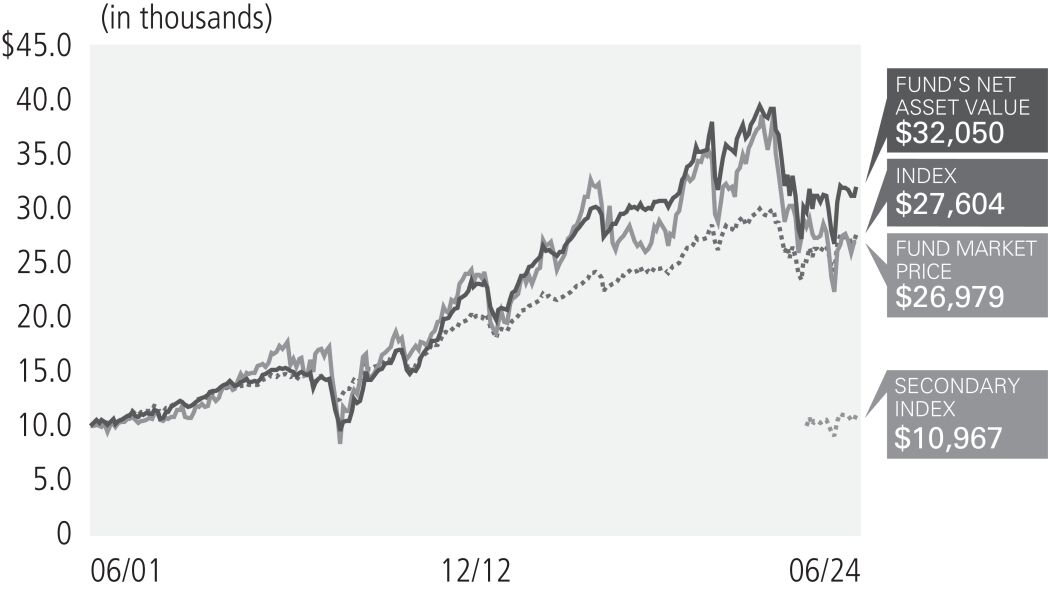
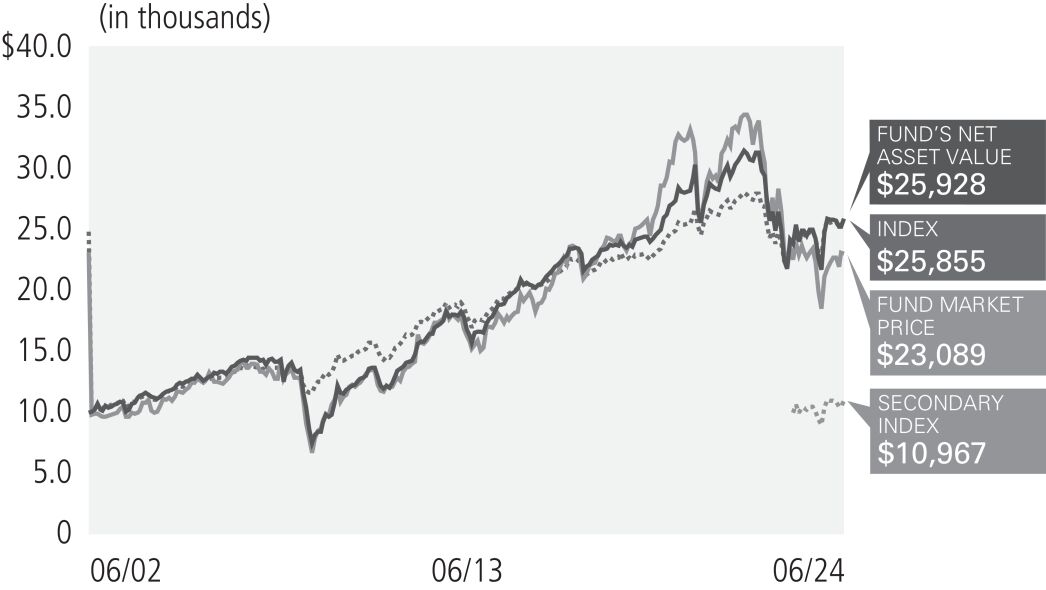
Item 1. | Reports to Shareholders. |
Page | ||||||||
2 | ||||||||
15 | ||||||||
16 | ||||||||
22 | ||||||||
23 | ||||||||
24 | ||||||||
25 | ||||||||
26 | ||||||||
28 | ||||||||
29 | ||||||||
30 | ||||||||
71 | ||||||||
96 | ||||||||
97 | ||||||||
99 | ||||||||
100 | ||||||||
Fund | Fund Summary | Schedule of Investments | ||||||
6 | 31 | |||||||
7 | 35 | |||||||
8 | 39 | |||||||
9 | 43 | |||||||
10 | 46 | |||||||
11 | 49 | |||||||
12 | 52 | |||||||
13 | 58 | |||||||
14 | 65 |
(1) | Consolidated Schedule of Investments |
Important Information About the Funds |
2 | PIMCO CLOSED-END FUNDS |
SEMIANNUAL REPORT | | | JUNE 30, 2024 | 3 |
Important Information About the Funds | (Cont.) |
Fund Name | Inception Date | Diversification Status | ||||||||
PIMCO Municipal Income Fund | 06/29/01 | Diversified | ||||||||
PIMCO Municipal Income Fund II | 06/28/02 | Diversified | ||||||||
PIMCO Municipal Income Fund III | 10/31/02 | Diversified | ||||||||
PIMCO California Municipal Income Fund | 06/29/01 | Diversified | ||||||||
PIMCO California Municipal Income Fund II | 06/28/02 | Diversified | ||||||||
PIMCO California Municipal Income Fund III | 10/31/02 | Diversified | ||||||||
PIMCO New York Municipal Income Fund | 06/29/01 | Non-diversified | ||||||||
PIMCO New York Municipal Income Fund II | 06/28/02 | Diversified | ||||||||
PIMCO New York Municipal Income Fund III | 10/31/02 | Non-diversified |
4 | PIMCO CLOSED-END FUNDS |
SEMIANNUAL REPORT | | | JUNE 30, 2024 | 5 |
Symbol on NYSE - PCQ |
Municipal Bonds & Notes | ||||
Ad Valorem Property Tax | 29.0% | |||
Health, Hospital & Nursing Home Revenue | 12.2% | |||
Local or Guaranteed Housing | 9.4% | |||
College & University Revenue | 7.5% | |||
Lease (Abatement) | 5.4% | |||
Port, Airport & Marina Revenue | 4.9% | |||
General Fund | 4.4% | |||
Tobacco Settlement Funded | 4.3% | |||
Natural Gas Revenue | 4.2% | |||
Sales Tax Revenue | 3.8% | |||
Special Tax | 2.3% | |||
Electric Power & Light Revenue | 2.3% | |||
Highway Revenue Tolls | 2.2% | |||
Sewer Revenue | 2.1% | |||
Water Revenue | 1.4% | |||
Lease (Non-Terminable) | 1.2% | |||
Other | 2.3% | |||
U.S. Government Agencies | 1.1% |
† | % of Investments, at value. |
§ | Allocation Breakdown and % of investments exclude securities sold short and financial derivative instruments, if any. |
Market Price | $9.42 | |||
NAV | $10.48 | |||
Premium/(Discount) to NAV | (10.11)% | |||
Market Price Distribution Rate (2) | 4.59% | |||
NAV Distribution Rate (2) | 4.12% | |||
Total Effective Leverage (3) | 40.79% |
Average Annual Total Return (1) for the period ended June 30, 2024 | ||||||||||||||||||||||||||
6 Month* | 1 Year | 5 Year | 10 Year | Since launch of Secondary Index 01/25/23 | Commencement of Operations (06/29/01) | |||||||||||||||||||||
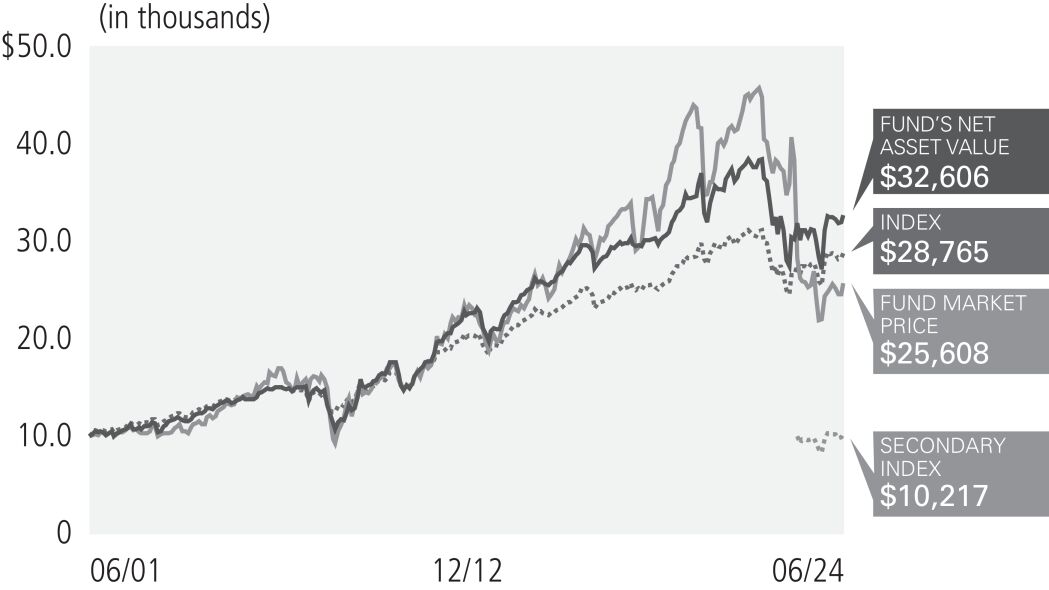
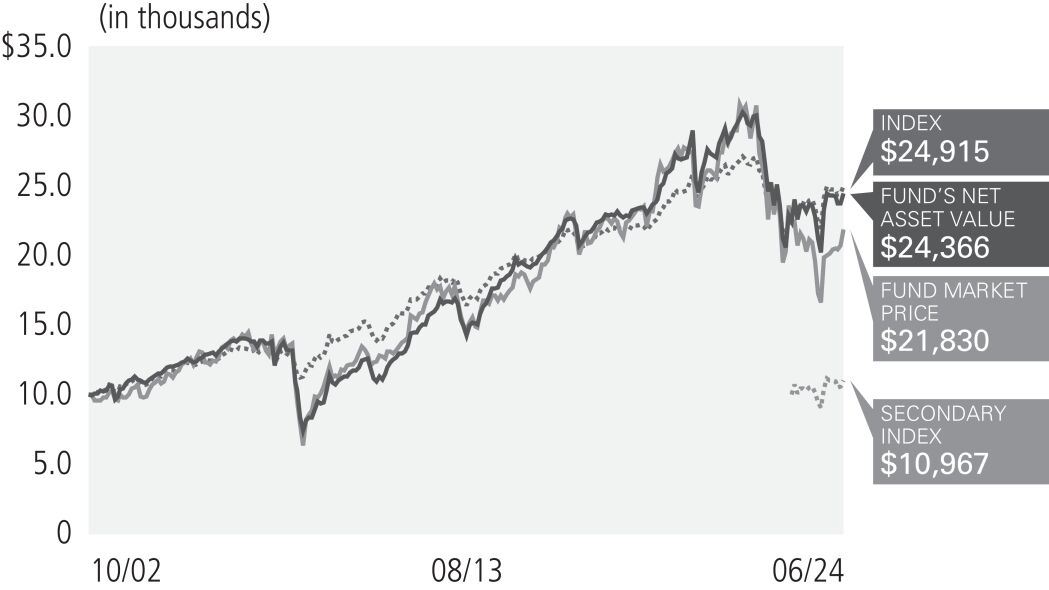
Market Price | 3.42% | 0.68% | (8.51)% | 1.12% | (8.08)% | 4.17% | ||||||||||||||||||||
NAV | 0.35% | 4.71% | (0.31)% | 3.24% | 1.54% | 5.28% | ||||||||||||||||||||
Bloomberg CA Muni 22+ Year Index | (0.27)% | 4.27% | 0.96% | 3.05% | 3.06% | 4.70% | ¨ | |||||||||||||||||||
ICE California Long Duration Municipal Securities Index** | (0.97)% | 5.22% | — | — | 1.47% | — |
(1) | Performance quoted represents past performance. Past performance is not a guarantee or a reliable indicator of future results. Current performance may be lower or higher than performance shown. Investment return and the principal value of an investment will fluctuate. Returns shown do not reflect the deduction of taxes that a shareholder would pay on Fund distributions or the sale of Fund shares. Total return, market price, NAV, market price distribution rate, and NAV distribution rate will fluctuate with changes in market conditions. Performance current to the most recent month-end is available at www.pimco.com or via (844) 33-PIMCO. Performance is calculated assuming all dividends and distributions are reinvested at prices obtained under the Fund’s dividend reinvestment plan. Performance does not reflect any brokerage commissions in connection with the purchase or sale of Fund shares. |
Performance of an index is shown in light of a requirement by the Securities and Exchange Commission that the performance of an appropriate broad-based securities market index be disclosed. However, the Fund is not managed to an index nor should the index be viewed as a “benchmark” for the Fund’s performance. The indexes are not intended to be indicative of the Fund’s investment strategies, portfolio components or past or future performance. Please see Additional Information Regarding the Funds for a description of the Fund’s principal investment strategies. |
(2) | Distribution rates are not performance and are calculated by annualizing the most recent distribution per share and dividing by the NAV or Market Price, as applicable, as of the reported date. Distributions may be comprised of ordinary income, net capital gains, and/or a return of capital (“ROC”) of your investment in the Fund. Because the distribution rate may include a ROC, it should not be confused with yield or income. If the Fund estimates that a portion of its distribution may be comprised of amounts from sources other than net investment income in accordance with its policies and good accounting practices, the Fund will notify shareholders of the estimated composition of such distribution through a Section 19 Notice. Please refer to the most recent Section 19 Notice, if applicable, for additional information regarding the estimated composition of distributions. Please visit www.pimco.com for most recent Section 19 Notice, if applicable. Final determination of a distribution’s tax character will be provided to shareholders when such information is available. |
(3) | Represents total effective leverage outstanding, as a percentage of total managed assets. Total effective leverage consists of preferred shares, reverse repurchase agreements and other borrowings, credit default swap notional and floating rate notes issued in tender option bond transactions, as applicable (collectively “Total Effective Leverage”). The Fund may engage in other transactions not included in Total Effective Leverage disclosed above that may give rise to a form of leverage, including certain derivative transactions. For the purpose of calculating Total Effective Leverage outstanding as a percentage of total managed assets, total managed assets refer to total assets (including assets attributable to Total Effective Leverage that may be outstanding) minus accrued liabilities (other than liabilities representing Total Effective Leverage). |
» | Exposure to the housing sector contributed to performance, as the sector posted positive returns. |
» | Security selection within the education sector contributed to performance, as select securities held within the Fund posted positive returns. |
» | Security selection within taxable municipals contributed to performance, as select taxable municipals held within the Fund posted positive performance. |
» | The costs associated with one or more forms of leverage detracted from performance. The costs of leverage generally will reduce returns to the extent they exceed the rate of return on the additional investments purchased with such leverage. |
» | Exposure to the electric utility sector detracted from performance, as the sector posted negative returns. |
» | Exposure to the lease-backed sector detracted from performance, as the sector posted negative returns. |
6 | PIMCO CLOSED-END FUNDS |
Symbol on NYSE - PCK |
Municipal Bonds & Notes | ||||
Ad Valorem Property Tax | 31.3 | % | ||
Health, Hospital & Nursing Home Revenue | 11.0 | % | ||
Local or Guaranteed Housing | 9.6 | % | ||
College & University Revenue | 5.9 | % | ||
Natural Gas Revenue | 5.4 | % | ||
Port, Airport & Marina Revenue | 4.9 | % | ||
Tobacco Settlement Funded | 4.4 | % | ||
General Fund | 4.2 | % | ||
Sales Tax Revenue | 3.3 | % | ||
Lease (Abatement) | 3.2 | % | ||
Highway Revenue Tolls | 3.1 | % | ||
Special Tax | 2.5 | % | ||
Electric Power & Light Revenue | 2.3 | % | ||
Sewer Revenue | 1.9 | % | ||
Water Revenue | 1.3 | % | ||
Lease (Non-Terminable) | 1.0 | % | ||
Other | 3.3 | % | ||
U.S. Government Agencies | 1.1 | % | ||
Short-Term Instruments | 0.3 | % |
† | % of Investments, at value. |
§ | Allocation Breakdown and % of investments exclude securities sold short and financial derivative instruments, if any. |
Market Price | $5.85 | |||
NAV | $6.68 | |||
Premium/(Discount) to NAV | (12.43)% | |||
Market Price Distribution Rate (2) | 4.41% | |||
NAV Distribution Rate (2) | 3.86% | |||
Total Effective Leverage (3) | 40.70% |
Average Annual Total Return (1) for the period ended June 30, 2024 | ||||||||||||||||||||||||||
6 Month* | 1 Year | 5 Year | 10 Year | Since launch of Secondary Index 01/25/23 | Commencement of Operations (06/28/02) | |||||||||||||||||||||
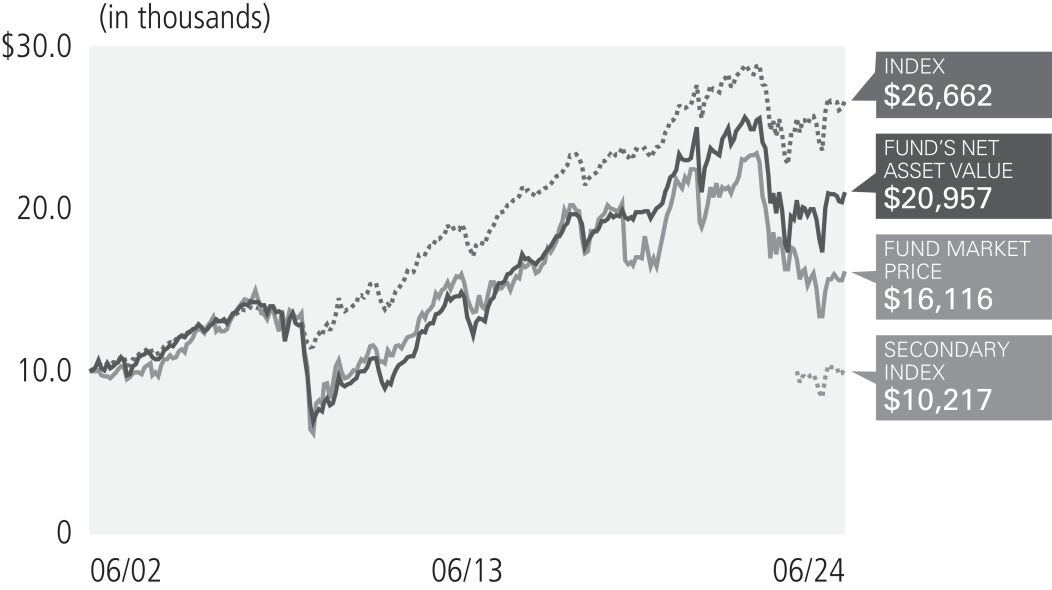
Market Price | 3.12% | 2.88% | (4.96)% | 0.65% | (2.71)% | 2.25% | ||||||||||||||||||||
NAV | 0.15% | 4.99% | (0.98)% | 3.12% | 1.44% | 3.42% | ||||||||||||||||||||
Bloomberg CA Muni 22+ Year Index | (0.27)% | 4.27% | 0.96% | 3.05% | 3.06% | 4.55% | ¨ | |||||||||||||||||||
ICE California Long Duration Municipal Securities Index** | (0.97)% | 5.22% | — | — | 1.47% | — |
(1) | Performance quoted represents past performance. Past performance is not a guarantee or a reliable indicator of future results. Current performance may be lower or higher than performance shown. Investment return and the principal value of an investment will fluctuate. Returns shown do not reflect the deduction of taxes that a shareholder would pay on Fund distributions or the sale of Fund shares. Total return, market price, NAV, market price distribution rate, and NAV distribution rate will fluctuate with changes in market conditions. Performance current to the most recent month-end is available at www.pimco.com or via (844)33-PIMCO. Performance is calculated assuming all dividends and distributions are reinvested at prices obtained under the Fund’s dividend reinvestment plan. Performance does not reflect any brokerage commissions in connection with the purchase or sale of Fund shares. |
Performance of an index is shown in light of a requirement by the Securities and Exchange Commission that the performance of an appropriate broad-based securities market index be disclosed. However, the Fund is not managed to an index nor should the index be viewed as a “benchmark” for the Fund’s performance. The indexes are not intended to be indicative of the Fund’s investment strategies, portfolio components or past or future performance. Please see Additional Information Regarding the Funds for a description of the Fund’s principal investment strategies. |
(2) | Distribution rates are not performance and are calculated by annualizing the most recent distribution per share and dividing by the NAV or Market Price, as applicable, as of the reported date. Distributions may be comprised of ordinary income, net capital gains, and/or a return of capital (“ROC”) of your investment in the Fund. Because the distribution rate may include a ROC, it should not be confused with yield or income. If the Fund estimates that a portion of its distribution may be comprised of amounts from sources other than net investment income in accordance with its policies and good accounting practices, the Fund will notify shareholders of the estimated composition of such distribution through a Section 19 Notice. Please refer to the most recent Section 19 Notice, if applicable, for additional information regarding the estimated composition of distributions. Please visit www.pimco.com for most recent Section 19 Notice, if applicable. Final determination of a distribution’s tax character will be provided to shareholders when such information is available. |
(3) | Represents total effective leverage outstanding, as a percentage of total managed assets. Total effective leverage consists of preferred shares, reverse repurchase agreements and other borrowings, credit default swap notional and floating rate notes issued in tender option bond transactions, as applicable (collectively “Total Effective Leverage”). The Fund may engage in other transactions not included in Total Effective Leverage disclosed above that may give rise to a form of leverage, including certain derivative transactions. For the purpose of calculating Total Effective Leverage outstanding as a percentage of total managed assets, total managed assets refer to total assets (including assets attributable to Total Effective Leverage that may be outstanding) minus accrued liabilities (other than liabilities representing Total Effective Leverage). |
» | Exposure to the housing sector contributed to performance, as the sector posted positive returns. |
» | Security selection within the education sector contributed to performance, as select securities held within the Fund posted positive returns. |
» | Security selection within the special tax sector contributed to performance, as select securities held within the Fund posted positive returns. |
» | The costs associated with one or more forms of leverage detracted from performance. The costs of leverage generally will reduce returns to the extent they exceed the rate of return on the additional investments purchased with such leverage. |
» | Exposure to the lease-backed sector detracted from performance, as the sector posted negative returns. |
» | Exposure to the electric utility sector detracted from performance, as the sector posted negative returns. |
SEMIANNUAL REPORT | | | JUNE 30, 2024 | 7 |
Symbol on NYSE - PZC |
Municipal Bonds & Notes | ||||
Ad Valorem Property Tax | 28.6% | |||
Health, Hospital & Nursing Home Revenue | 12.8% | |||
Local or Guaranteed Housing | 9.8% | |||
Tobacco Settlement Funded | 6.4% | |||
College & University Revenue | 6.1% | |||
Port, Airport & Marina Revenue | 4.8% | |||
Lease (Abatement) | 4.0% | |||
General Fund | 3.6% | |||
Sales Tax Revenue | 3.3% | |||
Special Tax | 3.1% | |||
Electric Power & Light Revenue | 2.3% | |||
Natural Gas Revenue | 2.1% | |||
Water Revenue | 1.9% | |||
Sewer Revenue | 1.8% | |||
Highway Revenue Tolls | 1.5% | |||
Lease (Non-Terminable) | 1.4% | |||
Other | 3.1% | |||
U.S. Government Agencies | 1.7% | |||
Short-Term Instruments | 1.7% |
† | % of Investments, at value. |
§ | Allocation Breakdown and % of investments exclude securities sold short and financial derivative instruments, if any. |
Market Price | $7.18 | |||
NAV | $7.75 | |||
Premium/(Discount) to NAV | (7.35)% | |||
Market Price Distribution Rate (2) | 4.93% | |||
NAV Distribution Rate (2) | 4.57% | |||
Total Effective Leverage (3) | 40.66% |
Average Annual Total Return (1) for the period ended June 30, 2024 | ||||||||||||||||||||||||||
6 Month* | 1 Year | 5 Year | 10 Year | Since launch of Secondary Index 01/25/23 | Commencement of Operations (10/31/02) | |||||||||||||||||||||
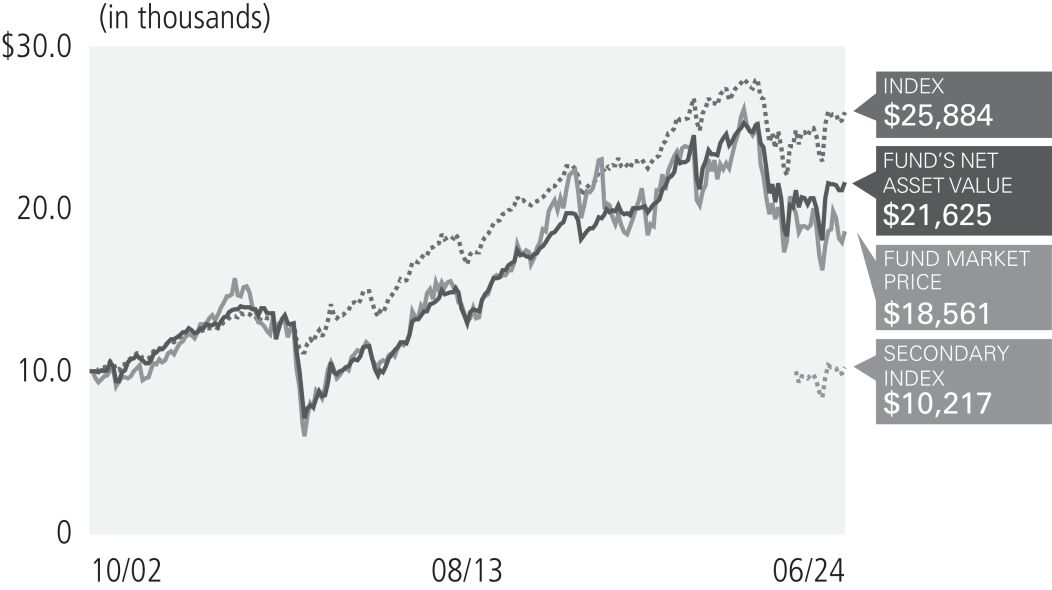
Market Price | (0.22)% | (2.12)% | (3.99)% | 1.58% | (3.56)% | 2.90% | ||||||||||||||||||||
NAV | 0.49% | 4.78% | (0.33)% | 3.26% | 1.59% | 3.62% | ||||||||||||||||||||
Bloomberg CA Muni 22+ Year Index | (0.27)% | 4.27% | 0.96% | 3.05% | 3.06% | 4.48% | ||||||||||||||||||||
ICE California Long Duration Municipal Securities Index** | (0.97)% | 5.22% | — | — | 1.47% | — |
(1) | Performance quoted represents past performance. Past performance is not a guarantee or a reliable indicator of future results. Current performance may be lower or higher than performance shown. Investment return and the principal value of an investment will fluctuate. Returns shown do not reflect the deduction of taxes that a shareholder would pay on Fund distributions or the sale of Fund shares. Total return, market price, NAV, market price distribution rate, and NAV distribution rate will fluctuate with changes in market conditions. Performance current to the most recent month-end is available at www.pimco.com or via (844) 33-PIMCO. Performance is calculated assuming all dividends and distributions are reinvested at prices obtained under the Fund’s dividend reinvestment plan. Performance does not reflect any brokerage commissions in connection with the purchase or sale of Fund shares. |
Performance of an index is shown in light of a requirement by the Securities and Exchange Commission that the performance of an appropriate broad-based securities market index be disclosed. However, the Fund is not managed to an index nor should the index be viewed as a “benchmark” for the Fund’s performance. The indexes are not intended to be indicative of the Fund’s investment strategies, portfolio components or past or future performance. Please see Additional Information Regarding the Funds for a description of the Fund’s principal investment strategies. |
(2) | Distribution rates are not performance and are calculated by annualizing the most recent distribution per share and dividing by the NAV or Market Price, as applicable, as of the reported date. Distributions may be comprised of ordinary income, net capital gains, and/or a return of capital (“ROC”) of your investment in the Fund. Because the distribution rate may include a ROC, it should not be confused with yield or income. If the Fund estimates that a portion of its distribution may be comprised of amounts from sources other than net investment income in accordance with its policies and good accounting practices, the Fund will notify shareholders of the estimated composition of such distribution through a Section 19 Notice. Please refer to the most recent Section 19 Notice, if applicable, for additional information regarding the estimated composition of distributions. Please visit www.pimco.com for most recent Section 19 Notice, if applicable. Final determination of a distribution’s tax character will be provided to shareholders when such information is available. |
(3) | Represents total effective leverage outstanding, as a percentage of total managed assets. Total effective leverage consists of preferred shares, reverse repurchase agreements and other borrowings, credit default swap notional and floating rate notes issued in tender option bond transactions, as applicable (collectively “Total Effective Leverage”). The Fund may engage in other transactions not included in Total Effective Leverage disclosed above that may give rise to a form of leverage, including certain derivative transactions. For the purpose of calculating Total Effective Leverage outstanding as a percentage of total managed assets, total managed assets refer to total assets (including assets attributable to Total Effective Leverage that may be outstanding) minus accrued liabilities (other than liabilities representing Total Effective Leverage). |
» | Exposure to the housing sector contributed to performance, as the sector posted positive returns. |
» | Select exposure within the education sector contributed to performance, as select securities held within the Fund posted positive returns. |
» | Select exposure within the special tax sector contributed to performance, as select securities held within the Fund posted positive returns. |
» | The costs associated with one or more forms of leverage detracted from performance. The costs of leverage generally will reduce returns to the extent they exceed the rate of return on the additional investments purchased with such leverage. |
» | Select exposure within the industrial revenue sector detracted from performance, as select securities held within the Fund posted negative returns. |
» | Exposure to the electric utility sector detracted from performance, as the sector posted negative returns. |
8 | PIMCO CLOSED-END FUNDS |
Symbol on NYSE - PNF |
Municipal Bonds & Notes | ||||
College & University Revenue | 10.8% | |||
Income Tax Revenue | 10.7% | |||
Water Revenue | 8.8% | |||
Tobacco Settlement Funded | 8.8% | |||
Health, Hospital & Nursing Home Revenue | 8.6% | |||
Port, Airport & Marina Revenue | 7.5% | |||
Transit Revenue | 7.4% | |||
Ad Valorem Property Tax | 7.2% | |||
Local or Guaranteed Housing | 7.0% | |||
Electric Power & Light Revenue | 6.7% | |||
Industrial Revenue | 5.3% | |||
Sales Tax Revenue | 2.7% | |||
Highway Revenue Tolls | 2.3% | |||
Miscellaneous Taxes | 1.6% | |||
Charter School Aid | 1.1% | |||
Other | 3.4% | |||
Short-Term Instruments | 0.1% |
† | % of Investments, at value. |
§ | Allocation Breakdown and % of investments exclude securities sold short and financial derivative instruments, if any. |
Marke t Price | $7.83 | |||
NAV | $8.79 | |||
Premium/(Discount) to NAV | (10.92)% | |||
Market Price Distribution Rate (2) | 5.13% | |||
NAV Distribution Rate (2) | 4.57% | |||
Total Effective Leverage (3) | 37.45% |
Average Annual Total Return (1) for the period ended June 30, 2024 | ||||||||||||||||||||||||||
6 Month* | 1 Year | 5 Year | 10 Year | Since launch of Secondary Index 01/25/23 | Commencement of Operations (06/29/01) | |||||||||||||||||||||
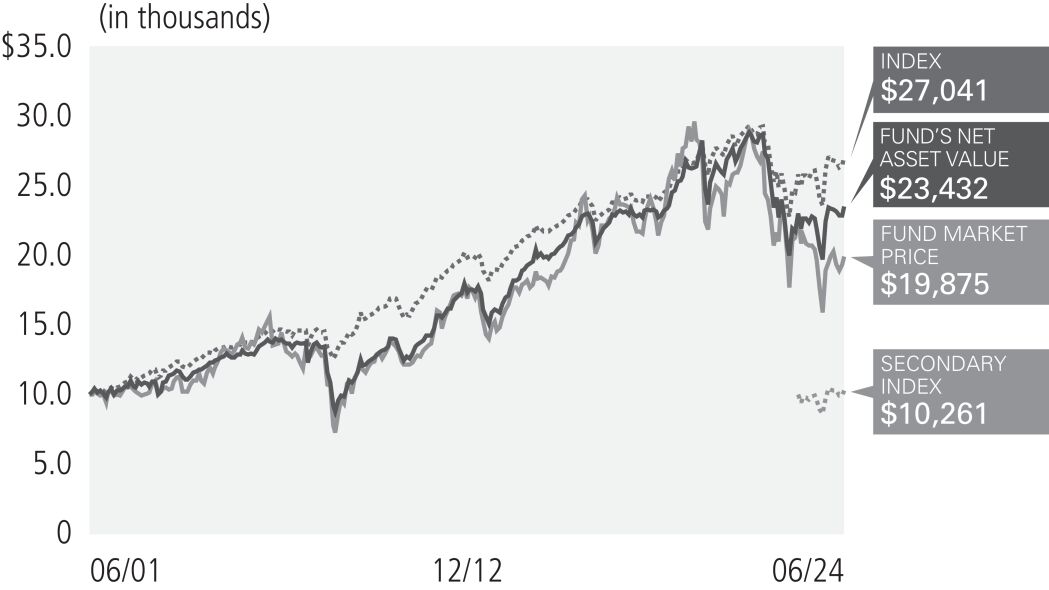
Market Price | 2.20% | (3.90)% | (5.45)% | 1.21% | (10.40)% | 3.03% | ||||||||||||||||||||
NAV | 0.14% | 3.12% | (1.56)% | 2.57% | 1.31% | 3.77% | ||||||||||||||||||||
Bloomberg NY Muni 22+ Year Index | (0.13)% | 3.98% | 0.80% | 2.77% | 3.36% | 4.42% | ¨ | |||||||||||||||||||
ICE New York Long Duration Municipal Securities Index** | (1.18)% | 3.89% | — | — | 1.79% | — |
(1) | Performance quoted represents past performance. Past performance is not a guarantee or a reliable indicator of future results. Current performance may be lower or higher than performance shown. Investment return and the principal value of an investment will fluctuate. Returns shown do not reflect the deduction of taxes that a shareholder would pay on Fund distributions or the sale of Fund shares. Total return, market price, NAV, market price distribution rate, and NAV distribution rate will fluctuate with changes in market conditions. Performance current to the most recent month-end is available at www.pimco.com or via (844) 33-PIMCO. Performance is calculated assuming all dividends and distributions are reinvested at prices obtained under the Fund’s dividend reinvestment plan. Performance does not reflect any brokerage commissions in connection with the purchase or sale of Fund shares. |
Performance of an index is shown in light of a requirement by the Securities and Exchange Commission that the performance of an appropriate broad-based securities market index be disclosed. However, the Fund is not managed to an index nor should the index be viewed as a “benchmark” for the Fund’s performance. The indexes are not intended to be indicative of the Fund’s investment strategies, portfolio components or past or future performance. Please see Additional Information Regarding the Funds for a description of the Fund’s principal investment strategies. |
(2) | Distribution rates are not performance and are calculated by annualizing the most recent distribution per share and dividing by the NAV or Market Price, as applicable, as of the reported date. Distributions may be comprised of ordinary income, net capital gains, and/or a return of capital (“ROC”) of your investment in the Fund. Because the distribution rate may include a ROC, it should not be confused with yield or income. If the Fund estimates that a portion of its distribution may be comprised of amounts from sources other than net investment income in accordance with its policies and good accounting practices, the Fund will notify shareholders of the estimated composition of such distribution through a Section 19 Notice. Please refer to the most recent Section 19 Notice, if applicable, for additional information regarding the estimated composition of distributions. Please visit www.pimco.com for most recent Section 19 Notice, if applicable. Final determination of a distribution’s tax character will be provided to shareholders when such information is available. |
(3) | Represents total effective leverage outstanding, as a percentage of total managed assets. Total effective leverage consists of preferred shares, reverse repurchase agreements and other borrowings, credit default swap notional and floating rate notes issued in tender option bond transactions, as applicable (collectively “Total Effective Leverage”). The Fund may engage in other transactions not included in Total Effective Leverage disclosed above that may give rise to a form of leverage, including certain derivative transactions. For the purpose of calculating Total Effective Leverage outstanding as a percentage of total managed assets, total managed assets refer to total assets (including assets attributable to Total Effective Leverage that may be outstanding) minus accrued liabilities (other than liabilities representing Total Effective Leverage). |
» | Security selection within the transportation sector contributed to performance, as select securities held within the Fund posted positive performance. |
» | Exposure to the healthcare sector contributed to performance, as the sector posted positive returns. |
» | Select exposure within taxable municipals contributed to performance, as select securities held within the Fund posted positive returns. |
» | The costs associated with one or more forms of leverage detracted from performance. The costs of leverage generally will reduce returns to the extent they exceed the rate of return on the additional investments purchased with such leverage. |
» | Exposure to the special tax sector detracted from performance, as the sector posted negative returns. |
» | Exposure to the electric utility sector detracted from performance, as the sector posted negative returns. |
SEMIANNUAL REPORT | | | JUNE 30, 2024 | 9 |
Symbol on NYSE - PNI |
Municipal Bonds & Notes | ||||
College & University Revenue | 12.0% | |||
Tobacco Settlement Funded | 12.0% | |||
Electric Power & Light Revenue | 8.8% | |||
Water Revenue | 8.6% | |||
Port, Airport & Marina Revenue | 7.9% | |||
Health, Hospital & Nursing Home Revenue | 7.2% | |||
Ad Valorem Property Tax | 6.8% | |||
Local or Guaranteed Housing | 6.7% | |||
Income Tax Revenue | 6.7% | |||
Industrial Revenue | 4.1% | |||
Highway Revenue Tolls | 4.1% | |||
Transit Revenue | 4.0% | |||
Sales Tax Revenue | 3.0% | |||
Miscellaneous Revenue | 2.3% | |||
Lease (Appropriation) | 2.0% | |||
Miscellaneous Taxes | 1.2% | |||
Charter School Aid | 1.2% | |||
Other | 0.1% | |||
Short-Term Instruments | 1.3% |
† | % of Investments, at value. |
§ | Allocation Breakdown and % of investments exclude securities sold short and financial derivative instruments, if any. |
Market Price | $7.41 | |||
NAV | $8.48 | |||
Premium/(Discount) to NAV | (12.62)% | |||
Market Price Distribution Rate (2) | 4.78% | |||
NAV Distribution Rate (2) | 4.17% | |||
Total Effective Leverage (3) | 40.74% |
Average Annual Total Return (1) for the period ended June 30, 2024 | ||||||||||||||||||||||||||
6 Month* | 1 Year | 5 Year | 10 Year | Since launch of Secondary Index 01/25/23 | Commencement of Operations (06/28/02) | |||||||||||||||||||||
Market Price | (0.03)% | 2.50% | (4.23)% | 0.90% | (2.56)% | 2.94% | ||||||||||||||||||||
NAV | (0.02)% | 3.02% | (1.42)% | 2.81% | 1.28% | 3.85% | ||||||||||||||||||||
Bloomberg NY Muni 22+ Year Index | (0.13)% | 3.98% | 0.80% | 2.77% | 3.36% | 4.32% | ¨ | |||||||||||||||||||
ICE New York Long Duration Municipal Securities Index** | (1.18)% | 3.89% | — | — | 1.79% | — |
(1) | Performance quoted represents past performance. Past performance is not a guarantee or a reliable indicator of future results. Current performance may be lower or higher than performance shown. Investment return and the principal value of an investment will fluctuate. Returns shown do not reflect the deduction of taxes that a shareholder would pay on Fund distributions or the sale of Fund shares. Total return, market price, NAV, market price distribution rate, and NAV distribution rate will fluctuate with changes in market conditions. Performance current to the most recent month-end is available at www.pimco.com or via (844)33-PIMCO. Performance is calculated assuming all dividends and distributions are reinvested at prices obtained under the Fund’s dividend reinvestment plan. Performance does not reflect any brokerage commissions in connection with the purchase or sale of Fund shares. |
Performance of an index is shown in light of a requirement by the Securities and Exchange Commission that the performance of an appropriate broad-based securities market index be disclosed. However, the Fund is not managed to an index nor should the index be viewed as a “benchmark” for the Fund’s performance. The indexes are not intended to be indicative of the Fund’s investment strategies, portfolio components or past or future performance. Please see Additional Information Regarding the Funds for a description of the Fund’s principal investment strategies. |
(2) | Distribution rates are not performance and are calculated by annualizing the most recent distribution per share and dividing by the NAV or Market Price, as applicable, as of the reported date. Distributions may be comprised of ordinary income, net capital gains, and/or a return of capital (“ROC”) of your investment in the Fund. Because the distribution rate may include a ROC, it should not be confused with yield or income. If the Fund estimates that a portion of its distribution may be comprised of amounts from sources other than net investment income in accordance with its policies and good accounting practices, the Fund will notify shareholders of the estimated composition of such distribution through a Section 19 Notice. Please refer to the most recent Section 19 Notice, if applicable, for additional information regarding the estimated composition of distributions. Please visit www.pimco.com for most recent Section 19 Notice, if applicable. Final determination of a distribution’s tax character will be provided to shareholders when such information is available. |
(3) | Represents total effective leverage outstanding, as a percentage of total managed assets. Total effective leverage consists of preferred shares, reverse repurchase agreements and other borrowings, credit default swap notional and floating rate notes issued in tender option bond transactions, as applicable (collectively “Total Effective Leverage”). The Fund may engage in other transactions not included in Total Effective Leverage disclosed above that may give rise to a form of leverage, including certain derivative transactions. For the purpose of calculating Total Effective Leverage outstanding as a percentage of total managed assets, total managed assets refer to total assets (including assets attributable to Total Effective Leverage that may be outstanding) minus accrued liabilities (other than liabilities representing Total Effective Leverage). |
» | Security selection within the transportation sector contributed to performance, as select securities held within the Fund posted positive returns. |
» | Exposure to the healthcare sector contributed to performance, as the sector posted positive returns. |
» | Exposure to the tobacco sector contributed to performance, as the sector posted positive returns. |
» | The costs associated with one or more forms of leverage detracted from performance. The costs of leverage generally will reduce returns to the extent they exceed the rate of return on the additional investments purchased with such leverage. |
» | Exposure to the special tax sector detracted from performance, as the sector posted negative returns. |
» | Exposure to the lease-backed sector detracted from performance, as the sector posted negative returns. |
10 | PIMCO CLOSED-END FUNDS |
Symbol on NYSE - PYN |
Municipal Bonds & Notes | ||||
Tobacco Settlement Funded | 10.4% | |||
College & University Revenue | 10.2% | |||
Water Revenue | 8.3% | |||
Local or Guaranteed Housing | 8.1% | |||
Income Tax Revenue | 8.1% | |||
Port, Airport & Marina Revenue | 7.5% | |||
Industrial Revenue | 7.5% | |||
Electric Power & Light Revenue | 6.9% | |||
Ad Valorem Property Tax | 6.6% | |||
Health, Hospital & Nursing Home Revenue | 6.5% | |||
Transit Revenue | 6.4% | |||
Highway Revenue Tolls | 2.9% | |||
Sales Tax Revenue | 2.6% | |||
Lease (Appropriation) | 2.6% | |||
Fuel Sales Tax Revenue | 1.3% | |||
Miscellaneous Taxes | 1.2% | |||
Charter School Aid | 1.1% | |||
Other | 0.8% | |||
Short-Term Instruments | 1.0% |
† | % of Investments, at value. |
§ | Allocation Breakdown and % of investments exclude securities sold short and financial derivative instruments, if any. |
Market Price | $5.90 | |||
NAV | $6.75 | |||
Premium/(Discount) to NAV | (12.59)% | |||
Market Price Distribution Rate (2) | 5.04% | |||
NAV Distribution Rate (2) | 4.41% | |||
Total Effective Leverage (3) | 40.13% |
Average Annual Total Return (1) for the period ended June 30, 2024 | ||||||||||||||||||||||||||
6 Month* | 1 Year | 5 Year | 10 Year | Since launch of Secondary Index 01/25/23 | Commencement of Operations (10/31/02) | |||||||||||||||||||||
Market Price | 1.51% | (1.29)% | (4.98)% | 0.49% | (5.94)% | 1.68% | ||||||||||||||||||||
NAV | 0.30% | 3.23% | (1.31)% | 2.36% | 1.39% | 2.54% | ||||||||||||||||||||
Bloomberg NY Muni 22+ Year Index | (0.13)% | 3.98% | 0.80% | 2.77% | 3.36% | 4.20% | ||||||||||||||||||||
ICE New York Long Duration Municipal Securities Index** | (1.18)% | 3.89% | — | — | 1.79% | — |
(1) | Performance quoted represents past performance. Past performance is not a guarantee or a reliable indicator of future results. Current performance may be lower or higher than performance shown. Investment return and the principal value of an investment will fluctuate. Returns shown do not reflect the deduction of taxes that a shareholder would pay on Fund distributions or the sale of Fund shares. Total return, market price, NAV, market price distribution rate, and NAV distribution rate will fluctuate with changes in market conditions. Performance current to the most recent month-end is available at www.pimco.com or via (844) 33-PIMCO. Performance is calculated assuming all dividends and distributions are reinvested at prices obtained under the Fund’s dividend reinvestment plan. Performance does not reflect any brokerage commissions in connection with the purchase or sale of Fund shares. |
Performance of an index is shown in light of a requirement by the Securities and Exchange Commission that the performance of an appropriate broad-based securities market index be disclosed. However, the Fund is not managed to an index nor should the index be viewed as a “benchmark” for the Fund’s performance. The indexes are not intended to be indicative of the Fund’s investment strategies, portfolio components or past or future performance. Please see Additional Information Regarding the Funds for a description of the Fund’s principal investment strategies. |
(2) | Distribution rates are not performance and are calculated by annualizing the most recent distribution per share and dividing by the NAV or Market Price, as applicable, as of the reported date. Distributions may be comprised of ordinary income, net capital gains, and/or a return of capital (“ROC”) of your investment in the Fund. Because the distribution rate may include a ROC, it should not be confused with yield or income. If the Fund estimates that a portion of its distribution may be comprised of amounts from sources other than net investment income in accordance with its policies and good accounting practices, the Fund will notify shareholders of the estimated composition of such distribution through a Section 19 Notice. Please refer to the most recent Section 19 Notice, if applicable, for additional information regarding the estimated composition of distributions. Please visit www.pimco.com for most recent Section 19 Notice, if applicable. Final determination of a distribution’s tax character will be provided to shareholders when such information is available. |
(3) | Represents total effective leverage outstanding, as a percentage of total managed assets. Total effective leverage consists of preferred shares, reverse repurchase agreements and other borrowings, credit default swap notional and floating rate notes issued in tender option bond transactions, as applicable (collectively “Total Effective Leverage”). The Fund may engage in other transactions not included in Total Effective Leverage disclosed above that may give rise to a form of leverage, including certain derivative transactions. For the purpose of calculating Total Effective Leverage outstanding as a percentage of total managed assets, total managed assets refer to total assets (including assets attributable to Total Effective Leverage that may be outstanding) minus accrued liabilities (other than liabilities representing Total Effective Leverage). |
» | Security selection within the transportation sector contributed to performance, as select securities held within the Fund posted positive returns. |
» | Exposure to the healthcare sector contributed to performance, as the sector posted positive returns. |
» | Exposure to the industrial revenue sector contributed to performance, as the sector posted positive returns. |
» | The costs associated with one or more forms of leverage detracted from performance. The costs of leverage generally will reduce returns to the extent they exceed the rate of return on the additional investments purchased with such leverage. |
» | Exposure to the lease-backed sector detracted from performance, as the sector posted negative returns. |
» | Exposure to the electric utility sector detracted from performance, as the sector posted negative returns. |
SEMIANNUAL REPORT | | | JUNE 30, 2024 | 11 |
Symbol on NYSE - PMF |
Municipal Bonds & Notes | ||||
Health, Hospital & Nursing Home Revenue | 16.0% | |||
Ad Valorem Property Tax | 11.4% | |||
Local or Guaranteed Housing | 6.5% | |||
Sales Tax Revenue | 6.5% | |||
Miscellaneous Revenue | 5.3% | |||
Tobacco Settlement Funded | 4.9% | |||
Lease (Appropriation) | 4.8% | |||
Industrial Revenue | 4.7% | |||
Highway Revenue Tolls | 4.4% | |||
Electric Power & Light Revenue | 4.4% | |||
Water Revenue | 4.0% | |||
College & University Revenue | 3.2% | |||
Income Tax Revenue | 2.6% | |||
Appropriations | 2.6% | |||
Port, Airport & Marina Revenue | 2.5% | |||
Nuclear Revenue | 1.7% | |||
Fuel Sales Tax Revenue | 1.5% | |||
General Fund | 1.4% | |||
Natural Gas Revenue | 1.2% | |||
Economic Development Revenue | 1.1% | |||
Miscellaneous Taxes | 1.0% | |||
Other | 5.4% | |||
U.S. Government Agencies | 1.7% | |||
Loan Participations and Assignments | 0.7% | |||
Short-Term Instruments | 0.5% |
† | % of Investments, at value. |
§ | Allocation Breakdown and % of investments exclude securities sold short and financial derivative instruments, if any. |
Market Price | $9.17 | |||
NAV | $9.46 | |||
Premium/(Discount) to NAV | (3.07)% | |||
Market Price Distribution Rate (2) | 5.50% | |||
NAV Distribution Rate (2) | 5.33% | |||
Total Effective Leverage (3) | 41.31% |
Average Annual Total Return (1) for the period ended June 30, 2024 | ||||||||||||||||||||||||||
6 Month* | 1 Year | 5 Year | 10 Year | Since launch of Secondary Index 12/09/2022 | Commencement of Operations (06/29/01) | |||||||||||||||||||||
Market Price | 0.96% | (5.78)% | (3.67)% | 1.26% | (4.00)% | 4.41% | ||||||||||||||||||||
NAV | (0.17)% | 2.51% | (1.19)% | 3.01% | 2.74% | 5.19% | ||||||||||||||||||||
Bloomberg Municipal Long 22+ Bond Index | 0.08% | 4.26% | 0.89% | 2.96% | 5.04% | 4.51% | ¨ | |||||||||||||||||||
ICE Long Duration National Municipal Securities Index** | (1.22)% | 4.53% | — | — | 4.28% | — |
(1) | Performance quoted represents past performance. Past performance is not a guarantee or a reliable indicator of future results. Current performance may be lower or higher than performance shown. Investment return and the principal value of an investment will fluctuate. Returns shown do not reflect the deduction of taxes that a shareholder would pay on Fund distributions or the sale of Fund shares. Total return, market price, NAV, market price distribution rate, and NAV distribution rate will fluctuate with changes in market conditions. Performance current to the most recent month-end is available at www.pimco.com or via (844) 33-PIMCO. Performance is calculated assuming all dividends and distributions are reinvested at prices obtained under the Fund’s dividend reinvestment plan. Performance does not reflect any brokerage commissions in connection with the purchase or sale of Fund shares. |
Performance of an index is shown in light of a requirement by the Securities and Exchange Commission that the performance of an appropriate broadbased securities market index be disclosed. However, the Fund is not managed to an index nor should the index be viewed as a “benchmark” for the Fund’s performance. The indexes are not intended to be indicative of the Fund’s investment strategies, portfolio components or past or future performance. Please see Additional Information Regarding the Funds for a description of the Fund’s principal investment strategies. |
(2) | Distribution rates are not performance and are calculated by annualizing the most recent distribution per share and dividing by the NAV or Market Price, as applicable, as of the reported date. Distributions may be comprised of ordinary income, net capital gains, and/or a return of capital (“ROC”) of your investment in the Fund. Because the distribution rate may include a ROC, it should not be confused with yield or income. If the Fund estimates that a portion of its distribution may be comprised of amounts from sources other than net investment income in accordance with its policies and good accounting practices, the Fund will notify shareholders of the estimated composition of such distribution through a Section 19 Notice. Please refer to the most recent Section 19 Notice, if applicable, for additional information regarding the estimated composition of distributions. Please visit www.pimco.com for most recent Section 19 Notice, if applicable. Final determination of a distribution’s tax character will be provided to shareholders when such information is available. |
(3) | Represents total effective leverage outstanding, as a percentage of total managed assets. Total effective leverage consists of preferred shares, reverse repurchase agreements and other borrowings, credit default swap notional and floating rate notes issued in tender option bond transactions, as applicable (collectively “Total Effective Leverage”). The Fund may engage in other transactions not included in Total Effective Leverage disclosed above that may give rise to a form of leverage, including certain derivative transactions. For the purpose of calculating Total Effective Leverage outstanding as a percentage of total managed assets, total managed assets refer to total assets (including assets attributable to Total Effective Leverage that may be outstanding) minus accrued liabilities (other than liabilities representing Total Effective Leverage). |
» | Exposure to the healthcare sector contributed to performance, as the sector posted positive returns. |
» | Exposure to the industrial revenue sector contributed to performance, as the sector posted positive returns. |
» | Exposure to the housing sector contributed to performance, as the sector posted positive returns. |
» | The costs associated with one or more forms of leverage detracted from performance. The costs of leverage generally will reduce returns to the extent they exceed the rate of return on the additional investments purchased with such leverage. |
» | Security selection within the tobacco sector detracted from performance, as select securities held within the fund posted negative returns. |
» | Exposure to the lease-backed sector detracted from performance, as the sector posted negative returns. |
12 | PIMCO CLOSED-END FUNDS |
Symbol on NYSE - PML |
Municipal Bonds & Notes | ||||
Health, Hospital & Nursing Home Revenue | 16.1% | |||
Ad Valorem Property Tax | 10.4% | |||
Highway Revenue Tolls | 6.2% | |||
Sales Tax Revenue | 5.5% | |||
Local or Guaranteed Housing | 5.5% | |||
Lease (Appropriation) | 5.0% | |||
Tobacco Settlement Funded | 4.9% | |||
Industrial Revenue | 4.7% | |||
Natural Gas Revenue | 4.3% | |||
Electric Power & Light Revenue | 4.1% | |||
Miscellaneous Revenue | 3.8% | |||
College & University Revenue | 2.9% | |||
Appropriations | 2.8% | |||
Water Revenue | 2.7% | |||
Port, Airport & Marina Revenue | 2.7% | |||
Income Tax Revenue | 2.6% | |||
Sewer Revenue | 1.4% | |||
General Fund | 1.3% | |||
Fuel Sales Tax Revenue | 1.3% | |||
Economic Development Revenue | 1.3% | |||
Hotel Occupancy Tax | 1.2% | |||
Nuclear Revenue | 1.1% | |||
Miscellaneous Taxes | 1.1% | |||
Other | 4.2% | |||
U.S. Government Agencies | 1.6% | |||
Loan Participations and Assignments | 0.7% | |||
Short-Term Instruments | 0.6% |
† | % of Investments, at value. |
§ | Allocation Breakdown and % of investments exclude securities sold short and financial derivative instruments, if any. |
Market Price | $8.53 | |||
NAV | $8.78 | |||
Premium/(Discount) to NAV | (2.85)% | |||
Market Price Distribution Rate (2) | 5.56% | |||
NAV Distribution Rate (2) | 5.40% | |||
Total Effective Leverage (3) | 39.64% |
Average Annual Total Return (1) for the period ended June 30, 2024 | ||||||||||||||||||||||||||
6 Month* | 1 Year | 5 Year | 10 Year | Since launch of Secondary Index 12/09/2022 | Commencement of Operations (06/28/02) | |||||||||||||||||||||
Market Price | 5.67% | (0.14)% | (5.42)% | 2.62% | (1.44)% | 3.94% | ||||||||||||||||||||
NAV | 0.09% | 3.50% | (0.89)% | 3.23% | 3.30% | 4.42% | ||||||||||||||||||||
Bloomberg Municipal Long 22+ Bond Index | 0.08% | 4.26% | 0.89% | 2.96% | 5.04% | 4.41% | ¨ | |||||||||||||||||||
ICE Long Duration National Municipal Securities Index** | (1.22)% | 4.53% | — | — | 4.28% | — |
(1) | Performance quoted represents past performance. Past performance is not a guarantee or a reliable indicator of future results. Current performance may be lower or higher than performance shown. Investment return and the principal value of an investment will fluctuate. Returns shown do not reflect the deduction of taxes that a shareholder would pay on Fund distributions or the sale of Fund shares. Total return, market price, NAV, market price distribution rate, and NAV distribution rate will fluctuate with changes in market conditions. Performance current to the most recent month-end is available at www.pimco.com or via (844) 33-PIMCO. Performance is calculated assuming all dividends and distributions are reinvested at prices obtained under the Fund’s dividend reinvestment plan. Performance does not reflect any brokerage commissions in connection with the purchase or sale of Fund shares. |
Performance of an index is shown in light of a requirement by the Securities and Exchange Commission that the performance of an appropriate broad-based securities market index be disclosed. However, the Fund is not managed to an index nor should the index be viewed as a “benchmark” for the Fund’s performance. The indexes are not intended to be indicative of the Fund’s investment strategies, portfolio components or past or future performance. Please see Additional Information Regarding the Funds for a description of the Fund’s principal investment strategies. |
(2) | Distribution rates are not performance and are calculated by annualizing the most recent distribution per share and dividing by the NAV or Market Price, as applicable, as of the reported date. Distributions may be comprised of ordinary income, net capital gains, and/or a return of capital (“ROC”) of your investment in the Fund. Because the distribution rate may include a ROC, it should not be confused with yield or income. If the Fund estimates that a portion of its distribution may be comprised of amounts from sources other than net investment income in accordance with its policies and good accounting practices, the Fund will notify shareholders of the estimated composition of such distribution through a Section 19 Notice. Please refer to the most recent Section 19 Notice, if applicable, for additional information regarding the estimated composition of distributions. Please visit www.pimco.com for most recent Section 19 Notice, if applicable. Final determination of a distribution’s tax character will be provided to shareholders when such information is available. |
(3) | Represents total effective leverage outstanding, as a percentage of total managed assets. Total effective leverage consists of preferred shares, reverse repurchase agreements and other borrowings, credit default swap notional and floating rate notes issued in tender option bond transactions, as applicable (collectively “Total Effective Leverage”). The Fund may engage in other transactions not included in Total Effective Leverage disclosed above that may give rise to a form of leverage, including certain derivative transactions. For the purpose of calculating Total Effective Leverage outstanding as a percentage of total managed assets, total managed assets refer to total assets (including assets attributable to Total Effective Leverage that may be outstanding) minus accrued liabilities (other than liabilities representing Total Effective Leverage). |
» | Exposure to the healthcare sector contributed to performance, as the sector posted positive returns. |
» | Exposure to the industrial revenue sector contributed to performance as the sector posted positive returns. |
» | Security selection within taxable municipals contributed to performance, as select taxable municipals held within the Fund posted positive performance. |
» | The costs associated with one or more forms of leverage detracted from performance. The costs of leverage generally will reduce returns to the extent they exceed the rate of return on the additional investments purchased with such leverage. |
» | Exposure to the lease-backed sector detracted from performance, as the sector posted negative returns. |
» | Security selection within the tobacco sector detracted from performance, as select securities held within the fund posted negative returns. |
SEMIANNUAL REPORT | | | JUNE 30, 2024 | 13 |
Symbol on NYSE - PMX |
Municipal Bonds & Notes | ||||
Health, Hospital & Nursing Home Revenue | 13.4% | |||
Ad Valorem Property Tax | 11.6% | |||
Local or Guaranteed Housing | 7.6% | |||
Sales Tax Revenue | 6.3% | |||
Highway Revenue Tolls | 5.1% | |||
Electric Power & Light Revenue | 4.9% | |||
Natural Gas Revenue | 4.5% | |||
Industrial Revenue | 4.2% | |||
Tobacco Settlement Funded | 4.0% | |||
Lease (Appropriation) | 3.9% | |||
Water Revenue | 3.8% | |||
Port, Airport & Marina Revenue | 3.4% | |||
Income Tax Revenue | 3.3% | |||
Appropriations | 2.9% | |||
College & University Revenue | 2.8% | |||
Fuel Sales Tax Revenue | 2.5% | |||
Miscellaneous Revenue | 2.1% | |||
Nuclear Revenue | 1.5% | |||
Sewer Revenue | 1.5% | |||
Economic Development Revenue | 1.3% | |||
General Fund | 1.1% | |||
Charter School Aid | 1.0% | |||
Other | 4.8% | |||
U.S. Government Agencies | 1.6% | |||
Loan Participations and Assignments | 0.7% | |||
Short-Term Instruments | 0.2% |
† | % of Investments, at value. |
§ | Allocation Breakdown and % of investments exclude securities sold short and financial derivative instruments, if any. |
Market Price | $7.88 | |||
NAV | $8.10 | |||
Premium/(Discount) to NAV | (2.72)% | |||
Market Price Distribution Rate (2) | 5.03% | |||
NAV Distribution Rate (2) | 4.89% | |||
Total Effective Leverage (3) | 40.33% |
Average Annual Total Return (1) for the period ended June 30, 2024 | ||||||||||||||||||||||||||
6 Month* | 1 Year | 5 Year | 10 Year | Since launch of Secondary Index 12/09/2022 | Commencement of Operations (10/31/02) | |||||||||||||||||||||
Market Price | 9.45% | 3.28% | (3.70)% | 2.48% | (4.22)% | 3.67% | ||||||||||||||||||||
NAV | (0.01)% | 3.31% | (1.24)% | 3.32% | 3.28% | 4.20% | ||||||||||||||||||||
Bloomberg Municipal Long 22+ Bond Index | 0.08% | 4.26% | 0.89% | 2.96% | 5.04% | 4.30% | ||||||||||||||||||||
ICE Long Duration National Municipal Securities Index** | (1.22)% | 4.53% | — | — | 4.28% | — |
(1) | Performance quoted represents past performance. Past performance is not a guarantee or a reliable indicator of future results. Current performance may be lower or higher than performance shown. Investment return and the principal value of an investment will fluctuate. Returns shown do not reflect the deduction of taxes that a shareholder would pay on Fund distributions or the sale of Fund shares. Total return, market price, NAV, market price distribution rate, and NAV distribution rate will fluctuate with changes in market conditions. Performance current to the most recent month-end is available at www.pimco.com or via (844) 33-PIMCO. Performance is calculated assuming all dividends and distributions are reinvested at prices obtained under the Fund’s dividend reinvestment plan. Performance does not reflect any brokerage commissions in connection with the purchase or sale of Fund shares. |
Performance of an index is shown in light of a requirement by the Securities and Exchange Commission that the performance of an appropriate broad-based securities market index be disclosed. However, the Fund is not managed to an index nor should the index be viewed as a “benchmark” for the Fund’s performance. The indexes are not intended to be indicative of the Fund’s investment strategies, portfolio components or past or future performance. Please see Additional Information Regarding the Funds for a description of the Fund’s principal investment strategies. |
(2) | Distribution rates are not performance and are calculated by annualizing the most recent distribution per share and dividing by the NAV or Market Price, as applicable, as of the reported date. Distributions may be comprised of ordinary income, net capital gains, and/or a return of capital (“ROC”) of your investment in the Fund. Because the distribution rate may include a ROC, it should not be confused with yield or income. If the Fund estimates that a portion of its distribution may be comprised of amounts from sources other than net investment income in accordance with its policies and good accounting practices, the Fund will notify shareholders of the estimated composition of such distribution through a Section 19 Notice. Please refer to the most recent Section 19 Notice, if applicable, for additional information regarding the estimated composition of distributions. Please visit www.pimco.com for most recent Section 19 Notice, if applicable. Final determination of a distribution’s tax character will be provided to shareholders when such information is available. |
(3) | Represents total effective leverage outstanding, as a percentage of total managed assets. Total effective leverage consists of preferred shares, reverse repurchase agreements and other borrowings, credit default swap notional and floating rate notes issued in tender option bond transactions, as applicable (collectively “Total Effective Leverage”). The Fund may engage in other transactions not included in Total Effective Leverage disclosed above that may give rise to a form of leverage, including certain derivative transactions. For the purpose of calculating Total Effective Leverage outstanding as a percentage of total managed assets, total managed assets refer to total assets (including assets attributable to Total Effective Leverage that may be outstanding) minus accrued liabilities (other than liabilities representing Total Effective Leverage). |
» | Exposure to the industrial revenue sector contributed to performance, as the sector posted positive performance. |
» | Exposure to the healthcare sector contributed to performance, as the sector posted positive performance. |
» | Exposure to the housing sector contributed to performance, as the sector posted positive performance. |
» | The costs associated with one or more forms of leverage detracted from performance. The costs of leverage generally will reduce returns to the extent they exceed the rate of return on the additional investments purchased with such leverage. |
» | Exposure to the lease-backed sector detracted from performance, as the sector posted negative returns. |
» | Security selection within the tobacco sector detracted from performance, as select securities held posted negative returns. |
14 | PIMCO CLOSED-END FUNDS |
Index Descriptions |
Index* | Index Description | |
Bloomberg CA Muni 22+ Year Index | The Bloomberg CA Muni 22+ Year Index is the long maturity California component of the Bloomberg Municipal Bond Index, which consists of a broad selection of investment grade general obligation and revenue bonds. It is an unmanaged index representative of the tax-exempt bond market. | |
Bloomberg Municipal Long 22+ Bond Index | Bloomberg Municipal Long 22+ Bond Index is a rules-based, market-value-weighted index engineered for the long-term tax-exempt bond market. | |
Bloomberg NY Muni 22+ Year Index | The Bloomberg NY Muni 22+ Year Index is the long maturity New York component of the Bloomberg Municipal Bond Index, which consists of a broad selection of investment grade general obligation and revenue bonds. It is an unmanaged index representative of the tax-exempt bond market. | |
ICE California Long Duration Municipal Securities Index | ICE California Long Duration Municipal Securities Index is a subset of the ICE Long Duration National Municipal Securities Index including only securities issued within the State of California. The ICE Long Duration National Municipal Securities Index tracks the performance of long duration rated and unrated US dollar denominated tax-exempt debt publicly issued by US states and territories, and their political subdivisions, in the US domestic market. | |
ICE Long Duration National Municipal Securities Index | ICE Long Duration National Municipal Securities Index tracks the performance of long duration rated and unrated US dollar denominated tax-exempt debt publicly issued by US states and territories, and their political subdivisions, in the US domestic market. | |
ICE New York Long Duration Municipal Securities Index | ICE New York Long Duration Municipal Securities Index is a subset of the ICE Long Duration National Municipal Securities Index including only securities issued within the State of New York. The ICE Long Duration National Municipal Securities Index tracks the performance of long duration rated and unrated US dollar denominated tax-exempt debt publicly issued by US states and territories, and their political subdivisions, in the US domestic market. |
SEMIANNUAL REPORT | | | JUNE 30, 2024 | 15 |
Financial Highlights |
Investment Operations | Less Distributions to Preferred Shareholders (c) | Less Distributions to Common Shareholders (d) | ||||||||||||||||||||||||||||||||||||||||||||||||||
Selected Per Share Data for the Year or Period Ended^: | Net Asset Value Beginning of Year or Period (a) | Net Investment Income (Loss) (b) | Net Realized/ Unrealized Gain (Loss) | From Net Investment Income | From Net Realized Capital Gains | Net Increase (Decrease) in Net Assets Applicable to Common Shareholders Resulting from Operations | From Net Investment Income | From Net Realized Capital Gains | Tax Basis Return of Capital | Total | Increase Resulting from Tender of ARPS (c) | Increase Resulting from Common Share Offering | Offering Cost Charged to Paid in Capital | |||||||||||||||||||||||||||||||||||||||
PIMCO California Municipal Income Fund | ||||||||||||||||||||||||||||||||||||||||||||||||||||
01/01/2024 - 06/30/2024+ | $ | 10.66 | $ | 0.21 | $ | (0.20 | ) | $ | (0.10 | ) | $ | 0.00 | $ | (0.09 | ) | $ | (0.22 | ) | $ | 0.00 | $ | 0.00 | $ | (0.22 | ) | $ | 0.12 | $ | N/A | $ | N/A | |||||||||||||||||||||
12/31/2023 | 10.31 | 0.55 | 0.57 | (0.37 | ) | 0.00 | 0.75 | (0.24 | ) | 0.00 | (0.19 | ) | (0.43 | ) | 0.03 | N/A | N/A | |||||||||||||||||||||||||||||||||||
12/31/2022 | 14.08 | 0.65 | (3.48 | ) | (0.14 | ) | 0.00 | (2.97 | ) | (0.59 | ) | (0.02 | ) | (0.19 | ) | (0.80 | ) | 0.00 | N/A | N/A | ||||||||||||||||||||||||||||||||
12/31/2021 | 14.28 | 0.71 | (0.12 | ) | (0.01 | ) | 0.00 | 0.58 | (0.78 | ) | 0.00 | 0.00 | (0.78 | ) | 0.00 | N/A | N/A | |||||||||||||||||||||||||||||||||||
12/31/2020 | 14.20 | 0.74 | 0.20 | (0.07 | ) | 0.00 | 0.87 | (0.78 | ) | (0.01 | ) | 0.00 | (0.79 | ) | 0.00 | N/A | N/A | |||||||||||||||||||||||||||||||||||
12/31/2019 | 13.32 | 0.80 | 1.16 | (0.16 | ) | 0.00 | 1.80 | (0.92 | ) | 0.00 | 0.00 | (0.92 | ) | 0.00 | N/A | N/A | ||||||||||||||||||||||||||||||||||||
PIMCO California Municipal Income Fund II | ||||||||||||||||||||||||||||||||||||||||||||||||||||
01/01/2024 - 06/30/2024+ | $ | 6.81 | $ | 0.13 | $ | (0.15 | ) | $ | (0.05 | ) | $ | 0.00 | $ | (0.07 | ) | $ | (0.13 | ) | $ | 0.00 | $ | 0.00 | $ | (0.13 | ) | $ | 0.06 | $ | N/A | $ | N/A | |||||||||||||||||||||
12/31/2023 | 6.53 | 0.33 | 0.38 | (0.22 | ) | 0.00 | 0.49 | (0.16 | ) | 0.00 | (0.10 | ) | (0.26 | ) | 0.05 | N/A | N/A | |||||||||||||||||||||||||||||||||||
12/31/2022 | 9.11 | 0.39 | (2.50 | ) | (0.09 | ) | 0.00 | (2.20 | ) | (0.36 | ) | 0.00 | (0.02 | ) | (0.38 | ) | 0.00 | N/A | N/A | |||||||||||||||||||||||||||||||||
12/31/2021 | 9.13 | 0.40 | (0.04 | ) | 0.00 | 0.00 | 0.36 | (0.38 | ) | 0.00 | 0.00 | (0.38 | ) | 0.00 | N/A | N/A | ||||||||||||||||||||||||||||||||||||
12/31/2020 | 8.98 | 0.41 | 0.17 | (0.04 | ) | 0.00 | 0.54 | (0.38 | ) | (0.01 | ) | 0.00 | (0.39 | ) | 0.00 | N/A | N/A | |||||||||||||||||||||||||||||||||||
12/31/2019 | 8.29 | 0.50 | 0.87 | (0.10 | ) | 0.00 | 1.27 | (0.42 | ) | (0.16 | ) | 0.00 | (0.58 | ) | 0.00 | N/A | N/A | |||||||||||||||||||||||||||||||||||
PIMCO California Municipal Income Fund III | ||||||||||||||||||||||||||||||||||||||||||||||||||||
01/01/2024 - 06/30/2024+ | $ | 7.89 | $ | 0.16 | $ | (0.13 | ) | $ | (0.07 | ) | $ | 0.00 | $ | (0.04 | ) | $ | (0.18 | ) | $ | 0.00 | $ | 0.00 | $ | (0.18 | ) | $ | 0.08 | $ | N/A | $ | N/A | |||||||||||||||||||||
12/31/2023 | 7.70 | 0.39 | 0.37 | (0.25 | ) | 0.00 | 0.51 | (0.27 | ) | 0.00 | (0.08 | ) | (0.35 | ) | 0.03 | N/A | N/A | |||||||||||||||||||||||||||||||||||
12/31/2022 | 10.20 | 0.48 | (2.43 | ) | (0.09 | ) | 0.00 | (2.04 | ) | (0.46 | ) | 0.00 | 0.00 | (0.46 | ) | 0.00 | N/A | N/A | ||||||||||||||||||||||||||||||||||
12/31/2021 | 10.29 | 0.52 | (0.15 | ) | 0.00 | 0.00 | 0.37 | (0.46 | ) | 0.00 | 0.00 | (0.46 | ) | 0.00 | N/A | N/A | ||||||||||||||||||||||||||||||||||||
12/31/2020 | 10.20 | 0.52 | 0.09 | (0.05 | ) | 0.00 | 0.56 | (0.46 | ) | (0.01 | ) | 0.00 | (0.47 | ) | 0.00 | N/A | N/A | |||||||||||||||||||||||||||||||||||
12/31/2019 | 9.46 | 0.56 | 0.80 | (0.11 | ) | 0.00 | 1.25 | (0.51 | ) | 0.00 | 0.00 | (0.51 | ) | 0.00 | N/A | N/A | ||||||||||||||||||||||||||||||||||||
PIMCO New York Municipal Income Fund | ||||||||||||||||||||||||||||||||||||||||||||||||||||
01/01/2024 - 06/30/2024+ | $ | 8.98 | $ | 0.18 | $ | (0.19 | ) | $ | (0.07 | ) | $ | 0.00 | $ | (0.08 | ) | $ | (0.20 | ) | $ | 0.00 | $ | 0.00 | $ | (0.20 | ) | $ | 0.08 | $ | N/A | $ | N/A | |||||||||||||||||||||
12/31/2023 | 8.70 | 0.45 | 0.47 | (0.29 | ) | 0.00 | 0.63 | (0.15 | ) | 0.00 | (0.25 | ) | (0.40 | ) | 0.05 | N/A | N/A | |||||||||||||||||||||||||||||||||||
12/31/2022 | 12.13 | 0.48 | (3.30 | ) | (0.11 | ) | 0.00 | (2.93 | ) | (0.40 | ) | 0.00 | (0.10 | ) | (0.50 | ) | 0.00 | N/A | N/A | |||||||||||||||||||||||||||||||||
12/31/2021 | 12.01 | 0.54 | 0.09 | (0.01 | ) | 0.00 | 0.62 | (0.50 | ) | 0.00 | 0.00 | (0.50 | ) | 0.00 | N/A | N/A | ||||||||||||||||||||||||||||||||||||
12/31/2020 | 12.15 | 0.60 | (0.17 | ) | (0.06 | ) | 0.00 | 0.37 | (0.50 | ) | (0.01 | ) | 0.00 | (0.51 | ) | 0.00 | N/A | N/A | ||||||||||||||||||||||||||||||||||
12/31/2019 | 11.29 | 0.68 | 0.96 | (0.13 | ) | 0.00 | 1.51 | (0.65 | ) | 0.00 | 0.00 | (0.65 | ) | 0.00 | N/A | N/A | ||||||||||||||||||||||||||||||||||||
PIMCO New York Municipal Income Fund II | ||||||||||||||||||||||||||||||||||||||||||||||||||||
01/01/2024 - 06/30/2024+ | $ | 8.66 | $ | 0.18 | $ | (0.20 | ) | $ | (0.08 | ) | $ | 0.00 | $ | (0.10 | ) | $ | (0.18 | ) | $ | 0.00 | $ | 0.00 | $ | (0.18 | ) | $ | 0.09 | $ | N/A | $ | N/A | |||||||||||||||||||||
12/31/2023 | 8.29 | 0.44 | 0.55 | (0.30 | ) | 0.00 | 0.69 | (0.23 | ) | 0.00 | (0.12 | ) | (0.35 | ) | 0.03 | N/A | N/A | |||||||||||||||||||||||||||||||||||
12/31/2022 | 11.66 | 0.47 | (3.25 | ) | (0.11 | ) | 0.00 | (2.89 | ) | (0.48 | ) | 0.00 | 0.00 | (0.48 | ) | 0.00 | N/A | N/A | ||||||||||||||||||||||||||||||||||
12/31/2021 | 11.50 | 0.48 | 0.17 | (0.01 | ) | 0.00 | 0.64 | (0.48 | ) | 0.00 | 0.00 | (0.48 | ) | 0.00 | N/A | N/A | ||||||||||||||||||||||||||||||||||||
12/31/2020 | 11.59 | 0.56 | (0.12 | ) | (0.05 | ) | 0.00 | 0.39 | (0.48 | ) | 0.00 | 0.00 | (0.48 | ) | 0.00 | N/A | N/A | |||||||||||||||||||||||||||||||||||
12/31/2019 | 10.67 | 0.63 | 0.93 | (0.13 | ) | 0.00 | 1.43 | (0.51 | ) | 0.00 | 0.00 | (0.51 | ) | 0.00 | N/A | N/A | ||||||||||||||||||||||||||||||||||||
PIMCO New York Municipal Income Fund III | ||||||||||||||||||||||||||||||||||||||||||||||||||||
01/01/2024 - 06/30/2024+ | $ | 6.88 | $ | 0.15 | $ | (0.14 | ) | $ | (0.08 | ) | $ | 0.00 | $ | (0.07 | ) | $ | (0.15 | ) | $ | 0.00 | $ | 0.00 | $ | (0.15 | ) | $ | 0.09 | $ | N/A | $ | N/A | |||||||||||||||||||||
12/31/2023 | 6.66 | 0.39 | 0.40 | (0.30 | ) | 0.00 | 0.49 | (0.10 | ) | 0.00 | (0.20 | ) | (0.30 | ) | 0.03 | N/A | N/A | |||||||||||||||||||||||||||||||||||
12/31/2022 | 9.20 | 0.42 | (2.42 | ) | (0.11 | ) | 0.00 | (2.11 | ) | (0.33 | ) | 0.00 | (0.10 | ) | (0.43 | ) | 0.00 | N/A | N/A | |||||||||||||||||||||||||||||||||
12/31/2021 | 9.15 | 0.44 | 0.05 | (0.01 | ) | 0.00 | 0.48 | (0.43 | ) | 0.00 | 0.00 | (0.43 | ) | 0.00 | N/A | N/A | ||||||||||||||||||||||||||||||||||||
12/31/2020 | 9.29 | 0.48 | (0.14 | ) | (0.05 | ) | 0.00 | 0.29 | (0.42 | ) | 0.00 | (0.01 | ) | (0.43 | ) | 0.00 | N/A | N/A | ||||||||||||||||||||||||||||||||||
12/31/2019 | 8.66 | 0.55 | 0.66 | (0.13 | ) | 0.00 | 1.08 | (0.41 | ) | 0.00 | (0.04 | ) | (0.45 | ) | 0.00 | N/A | N/A | |||||||||||||||||||||||||||||||||||
PIMCO Municipal Income Fund (Consolidated) | ||||||||||||||||||||||||||||||||||||||||||||||||||||
01/01/2024 - 06/30/2024+ | $ | 9.73 | $ | 0.23 | $ | (0.26 | ) | $ | (0.10 | ) | $ | 0.00 | $ | (0.13 | ) | $ | (0.25 | ) | $ | 0.00 | $ | 0.00 | $ | (0.25 | ) | $ | 0.11 | $ | N/A | $ | N/A | |||||||||||||||||||||
12/31/2023 | 9.51 | 0.61 | 0.43 | (0.37 | ) | 0.00 | 0.67 | (0.37 | ) | 0.00 | (0.13 | ) | (0.50 | ) | 0.05 | N/A | N/A | |||||||||||||||||||||||||||||||||||
12/31/2022 | 13.33 | 0.68 | (3.71 | ) | (0.14 | ) | 0.00 | (3.17 | ) | (0.65 | ) | 0.00 | 0.00 | (0.65 | ) | 0.00 | N/A | N/A | ||||||||||||||||||||||||||||||||||
12/31/2021 | 13.22 | 0.71 | 0.06 | (0.01 | ) | 0.00 | 0.76 | (0.65 | ) | 0.00 | 0.00 | (0.65 | ) | 0.00 | N/A | N/A | ||||||||||||||||||||||||||||||||||||
12/31/2020 | 13.35 | 0.74 | (0.07 | ) | (0.07 | ) | 0.00 | 0.60 | (0.65 | ) | (0.08 | ) | 0.00 | (0.73 | ) | 0.00 | N/A | N/A | ||||||||||||||||||||||||||||||||||
12/31/2019 | 12.36 | 0.81 | 1.07 | (0.16 | ) | 0.00 | 1.72 | (0.72 | ) | (0.01 | ) | 0.00 | (0.73 | ) | 0.00 | N/A | N/A |
16 | PIMCO CLOSED-END FUNDS | See Accompanying Notes |
Common Share | Ratios/Supplemental Data | |||||||||||||||||||||||||||||||||||||
Ratios to Average Net Assets Applicable to Common Shareholders | ||||||||||||||||||||||||||||||||||||||
Net Asset Value End of Year or Period (a) | Market Price End of Year or Period | Total Investment Return (e) | Net Assets Applicable to Common Shareholders End of Year or Period (000s) | Expenses (f)(g) | Expenses Excluding Waivers (f)(g) | Expenses Excluding Interest Expense (f) | Expenses Excluding Interest Expense and Waivers (f) | Net Investment Income (Loss) (f) | Portfolio Turnover Rate | |||||||||||||||||||||||||||||
$ | 10.47 | $ | 9.42 | 3.42 | % | $ | 198,690 | 3.24 | %* | 3.24 | %* | 1.38 | %* | 1.38 | %* | 4.14 | %* | 14 | % | |||||||||||||||||||
10.66 | 9.32 | (35.33 | ) | 202,306 | 2.16 | 2.16 | 1.34 | 1.34 | 5.43 | 28 | ||||||||||||||||||||||||||||
10.31 | 15.07 | (14.34 | ) | 195,462 | 1.78 | 1.78 | 1.26 | 1.26 | 5.73 | 28 | ||||||||||||||||||||||||||||
14.08 | 18.58 | 7.99 | 266,321 | 1.44 | 1.44 | 1.20 | 1.20 | 5.05 | 11 | |||||||||||||||||||||||||||||
14.28 | 17.98 | (4.94 | ) | 269,561 | 1.67 | 1.67 | 1.22 | 1.22 | 5.28 | 15 | ||||||||||||||||||||||||||||
14.20 | 19.86 | 29.47 | 267,390 | 2.09 | 2.09 | 1.18 | 1.18 | 5.75 | 16 | |||||||||||||||||||||||||||||
| | | ||||||||||||||||||||||||||||||||||||
$ | 6.67 | $ | 5.85 | 3.12 | % | $ | 215,277 | 3.44 | %* | 3.44 | %* | 1.37 | %* | 1.37 | %* | 3.09 | %* | 12 | % | |||||||||||||||||||
6.81 | 5.80 | (10.74 | ) | 219,490 | 2.29 | 2.29 | 1.37 | 1.37 | 5.12 | 25 | ||||||||||||||||||||||||||||
6.53 | 6.79 | (23.32 | ) | 210,581 | 1.77 | 1.77 | 1.29 | 1.29 | 5.49 | 27 | ||||||||||||||||||||||||||||
9.11 | 9.35 | 7.99 | 293,165 | 1.41 | 1.41 | 1.21 | 1.21 | 4.44 | 11 | |||||||||||||||||||||||||||||
9.13 | 9.03 | (5.58 | ) | 293,591 | 1.62 | 1.62 | 1.23 | 1.23 | 4.68 | 19 | ||||||||||||||||||||||||||||
8.98 | 10.00 | 36.01 | 288,138 | 1.99 | 1.99 | 1.18 | 1.18 | 5.61 | 16 | |||||||||||||||||||||||||||||
$ | 7.75 | $ | 7.18 | (0.22 | )% | $ | 174,244 | 3.29 | %* | 3.29 | %* | 1.35 | %* | 1.35 | %* | 4.06 | %* | 14 | % | |||||||||||||||||||
7.89 | 7.37 | (7.46 | ) | 177,348 | 2.33 | 2.33 | 1.36 | 1.36 | 5.20 | 30 | ||||||||||||||||||||||||||||
7.70 | 8.35 | (20.55 | ) | 172,972 | 1.80 | 1.80 | 1.27 | 1.27 | 5.71 | 28 | ||||||||||||||||||||||||||||
10.20 | 11.10 | 13.11 | 228,733 | 1.45 | 1.45 | 1.21 | 1.21 | 5.06 | 13 | |||||||||||||||||||||||||||||
10.29 | 10.25 | (5.89 | ) | 230,271 | 1.68 | 1.68 | 1.23 | 1.23 | 5.13 | 13 | ||||||||||||||||||||||||||||
10.20 | 11.41 | 25.66 | 227,745 | 2.12 | 2.12 | 1.20 | 1.20 | 5.59 | 16 | |||||||||||||||||||||||||||||
$ | 8.78 | $ | 7.83 | 2.20 | % | $ | 69,113 | 2.58 | %* | 2.58 | %* | 1.36 | %* | 1.36 | %* | 4.11 | %* | 13 | % | |||||||||||||||||||
8.98 | 7.86 | (8.59 | ) | 70,675 | 1.48 | 1.48 | 1.39 | 1.39 | 5.16 | 45 | ||||||||||||||||||||||||||||
8.70 | 9.03 | (22.47 | ) | 68,397 | 1.49 | 1.49 | 1.24 | 1.24 | 4.90 | 45 | ||||||||||||||||||||||||||||
12.13 | 12.29 | 9.70 | 95,190 | 1.25 | 1.25 | 1.20 | 1.20 | 4.44 | 23 | |||||||||||||||||||||||||||||
12.01 | 11.68 | (11.51 | ) | 94,059 | 1.52 | 1.52 | 1.23 | 1.23 | 5.13 | 26 | ||||||||||||||||||||||||||||
12.15 | 13.80 | 24.04 | 95,010 | 1.97 | 1.97 | 1.19 | 1.19 | 5.74 | 25 | |||||||||||||||||||||||||||||
$ | 8.47 | $ | 7.41 | (0.03 | )% | $ | 94,922 | 3.29 | %* | 3.29 | %* | 1.49 | %* | 1.49 | %* | 4.22 | %* | 15 | % | |||||||||||||||||||
8.66 | 7.59 | 0.12 | 97,066 | 2.13 | 2.13 | 1.43 | 1.43 | 5.34 | 46 | |||||||||||||||||||||||||||||
8.29 | 7.95 | (26.06 | ) | 92,937 | 1.93 | 1.93 | 1.38 | 1.38 | 5.10 | 42 | ||||||||||||||||||||||||||||
11.66 | 11.35 | 8.87 | 130,581 | 1.57 | 1.57 | 1.31 | 1.31 | 4.18 | 14 | |||||||||||||||||||||||||||||
11.50 | 10.87 | (5.82 | ) | 128,709 | 1.84 | 1.84 | 1.35 | 1.35 | 4.97 | 22 | ||||||||||||||||||||||||||||
11.59 | 12.07 | 20.57 | 129,596 | 2.16 | 2.16 | 1.27 | 1.27 | 5.62 | 17 | |||||||||||||||||||||||||||||
$ | 6.75 | $ | 5.90 | 1.51 | % | $ | 38,764 | 3.07 | %* | 3.07 | %* | 1.68 | %* | 1.68 | %* | 4.44 | %* | 14 | % | |||||||||||||||||||
6.88 | 5.96 | (8.35 | ) | 39,552 | 1.73 | 1.73 | 1.73 | 1.73 | 5.91 | 58 | ||||||||||||||||||||||||||||
6.66 | 6.83 | (22.40 | ) | 38,240 | 1.69 | 1.69 | 1.55 | 1.55 | 5.64 | 38 | ||||||||||||||||||||||||||||
9.20 | 9.31 | 8.99 | 52,786 | 1.62 | 1.62 | 1.49 | 1.49 | 4.78 | 16 | |||||||||||||||||||||||||||||
9.15 | 8.93 | (2.75 | ) | 52,414 | 1.80 | 1.80 | 1.49 | 1.49 | 5.32 | 27 | ||||||||||||||||||||||||||||
9.29 | 9.63 | 16.76 | 53,135 | 2.19 | 2.19 | 1.47 | 1.47 | 6.06 | 14 | |||||||||||||||||||||||||||||
$ | 9.46 | $ | 9.17 | 0.96 | % | $ | 248,450 | 3.23 | %* | 3.23 | %* | 1.41 | %* | 1.41 | %* | 4.96 | %* | 11 | % | |||||||||||||||||||
9.73 | 9.33 | (5.62 | ) | 255,236 | 1.98 | 1.98 | 1.35 | 1.35 | 6.49 | 36 | ||||||||||||||||||||||||||||
9.51 | 10.43 | (27.24 | ) | 248,707 | 1.67 | 1.67 | 1.26 | 1.26 | 6.38 | 36 | ||||||||||||||||||||||||||||
13.33 | 15.22 | 15.11 | 347,062 | 1.36 | 1.36 | 1.19 | 1.19 | 5.33 | 18 | |||||||||||||||||||||||||||||
13.22 | 13.85 | (2.99 | ) | 343,020 | 1.59 | 1.59 | 1.23 | 1.23 | 5.71 | 21 | ||||||||||||||||||||||||||||
13.35 | 15.10 | 26.76 | 345,113 | 1.92 | 1.92 | 1.18 | 1.18 | 6.20 | 16 |
SEMIANNUAL REPORT | | | JUNE 30, 2024 | 17 |
Financial Highlights | (Cont.) |
Investment Operations | Less Distributions to Preferred Shareholders (c) | Less Distributions to Common Shareholders (d) | ||||||||||||||||||||||||||||||||||||||||||||||||||
Selected Per Share Data for the Year or Period Ended^: | Net Asset Value Beginning of Year or Period (a) | Net Investment Income (Loss) (b) | Net Realized/ Unrealized Gain (Loss) | From Net Investment Income | From Net Realized Capital Gains | Net Increase (Decrease) in Net Assets Applicable to Common Shareholders Resulting from Operations | From Net Investment Income | From Net Realized Capital Gains | Tax Basis Return of Capital | Total | Increase Resulting from Tender of ARPS (c) | Increase Resulting from Common Share Offering | Offering Cost Charged to Paid in Capital | |||||||||||||||||||||||||||||||||||||||
PIMCO Municipal Income Fund II (Consolidated) | ||||||||||||||||||||||||||||||||||||||||||||||||||||
01/01/2024 - 06/30/2024+ | $ | 9.01 | $ | 0.20 | $ | (0.20 | ) | $ | (0.06 | ) | $ | 0.00 | $ | (0.06 | ) | $ | (0.24 | ) | $ | 0.00 | $ | 0.00 | $ | (0.24 | ) | $ | 0.07 | $ | N/A | $ | N/A | |||||||||||||||||||||
12/31/2023 | 8.76 | 0.52 | 0.40 | (0.25 | ) | 0.00 | 0.67 | (0.30 | ) | 0.00 | (0.17 | ) | (0.47 | ) | 0.05 | 0.00 | 0.00 | |||||||||||||||||||||||||||||||||||
12/31/2022 | 12.37 | 0.60 | (3.43 | ) | (0.10 | ) | 0.00 | (2.93 | ) | (0.60 | ) | 0.00 | (0.11 | ) | (0.71 | ) | 0.00 | 0.03 | 0.00 | |||||||||||||||||||||||||||||||||
12/31/2021 | 12.42 | 0.66 | 0.00 | 0.00 | 0.00 | 0.66 | (0.71 | ) | 0.00 | 0.00 | (0.71 | ) | 0.00 | N/A | N/A | |||||||||||||||||||||||||||||||||||||
12/31/2020 | 12.50 | 0.69 | (0.01 | ) | (0.05 | ) | 0.00 | 0.63 | (0.71 | ) | 0.00 | 0.00 | (0.71 | ) | 0.00 | N/A | N/A | |||||||||||||||||||||||||||||||||||
12/31/2019 | 11.62 | 0.77 | 1.01 | (0.12 | ) | 0.00 | 1.66 | (0.78 | ) | 0.00 | 0.00 | (0.78 | ) | 0.00 | N/A | N/A | ||||||||||||||||||||||||||||||||||||
PIMCO Municipal Income Fund III (Consolidated) | ||||||||||||||||||||||||||||||||||||||||||||||||||||
01/01/2024 - 06/30/2024+ | $ | 8.30 | $ | 0.19 | $ | (0.20 | ) | $ | (0.07 | ) | $ | 0.00 | $ | (0.08 | ) | $ | (0.20 | ) | $ | 0.00 | $ | 0.00 | $ | (0.20 | ) | $ | 0.08 | $ | N/A | $ | N/A | |||||||||||||||||||||
12/31/2023 | 8.02 | 0.49 | 0.41 | (0.26 | ) | 0.00 | 0.64 | (0.30 | ) | 0.00 | (0.10 | ) | (0.40 | ) | 0.04 | N/A | N/A | |||||||||||||||||||||||||||||||||||
12/31/2022 | 11.41 | 0.57 | (3.31 | ) | (0.10 | ) | 0.00 | (2.84 | ) | (0.55 | ) | 0.00 | 0.00 | (0.55 | ) | 0.00 | N/A | N/A | ||||||||||||||||||||||||||||||||||
12/31/2021 | 11.36 | 0.59 | 0.01 | 0.00 | 0.00 | 0.60 | (0.55 | ) | 0.00 | 0.00 | (0.55 | ) | 0.00 | N/A | N/A | |||||||||||||||||||||||||||||||||||||
12/31/2020 | 11.34 | 0.62 | 0.01 | (0.05 | ) | 0.00 | 0.58 | (0.55 | ) | (0.01 | ) | 0.00 | (0.56 | ) | 0.00 | N/A | N/A | |||||||||||||||||||||||||||||||||||
12/31/2019 | 10.49 | 0.72 | 0.87 | (0.12 | ) | 0.00 | 1.47 | (0.62 | ) | 0.00 | 0.00 | (0.62 | ) | 0.00 | N/A | N/A |
18 | PIMCO CLOSED-END FUNDS | See Accompanying Notes |
Common Share | Ratios/Supplemental Data | |||||||||||||||||||||||||||||||||||||
Ratios to Average Net Assets Applicable to Common Shareholders | ||||||||||||||||||||||||||||||||||||||
Net Asset Value End of Year or Period (a) | Market Price End of Year or Period | Total Investment Return (e) | Net Assets Applicable to Common Shareholders End of Year or Period (000s) | Expenses (f)(g) | Expenses Excluding Waivers (f)(g) | Expenses Excluding Interest Expense (f) | Expenses Excluding Interest Expense and Waivers (f) | Net Investment Income (Loss) (f) | Portfolio Turnover Rate | |||||||||||||||||||||||||||||
$ | 8.78 | $ | 8.53 | 5.67 | % | $ | 583,090 | 3.16 | %* | 3.16 | %* | 1.25 | %* | 1.25 | %* | 4.46 | %* | 10 | % | |||||||||||||||||||
9.01 | 8.30 | (2.97 | ) | 598,635 | 2.28 | 2.28 | 1.22 | 1.22 | 5.97 | 35 | ||||||||||||||||||||||||||||
8.76 | 9.04 | (33.71 | ) | 578,039 | 1.77 | 1.77 | 1.14 | 1.14 | 6.08 | 33 | ||||||||||||||||||||||||||||
12.37 | 14.61 | 7.47 | 783,316 | 1.30 | 1.30 | 1.08 | 1.08 | 5.32 | 13 | |||||||||||||||||||||||||||||
12.42 | 14.30 | (4.81 | ) | 782,327 | 1.59 | 1.59 | 1.11 | 1.11 | 5.70 | 20 | ||||||||||||||||||||||||||||
12.50 | 15.87 | 25.88 | 782,682 | 2.06 | 2.06 | 1.06 | 1.06 | 6.25 | 12 | |||||||||||||||||||||||||||||
$ | 8.10 | $ | 7.88 | 9.45 | % | $ | 270,641 | 3.23 | %* | 3.23 | %* | 1.31 | %* | 1.31 | %* | 4.81 | %* | 12 | % | |||||||||||||||||||
8.30 | 7.39 | (10.64 | ) | 277,608 | 2.25 | 2.25 | 1.32 | 1.32 | 6.07 | 40 | ||||||||||||||||||||||||||||
8.02 | 8.71 | (27.40 | ) | 267,714 | 1.76 | 1.76 | 1.22 | 1.22 | 6.32 | 32 | ||||||||||||||||||||||||||||
11.41 | 12.75 | 12.32 | 379,521 | 1.37 | 1.37 | 1.15 | 1.15 | 5.18 | 9 | |||||||||||||||||||||||||||||
11.36 | 11.89 | (0.54 | ) | 376,741 | 1.64 | 1.64 | 1.18 | 1.18 | 5.57 | 25 | ||||||||||||||||||||||||||||
11.34 | 12.58 | 19.03 | 374,805 | 2.04 | 2.04 | 1.14 | 1.14 | 6.48 | 14 |
SEMIANNUAL REPORT | | | JUNE 30, 2024 | 19 |
Financial Highlights | (Cont.) |
ARPS | RVMTP (5) | |||||||||||||||||||||||||||||||
Selected Per Share Data for the Year or Period Ended^: | Total Amount Outstanding | Asset Coverage per Preferred Share (1) | Involuntary Liquidating Preference per Preferred Share (2) | Average Market Value per ARPS (3) | Total Amount Outstanding | Asset Coverage per Preferred Share (1) | Involuntary Liquidating Preference per Preferred Share (2) | Average Market Value per RVMTP (4) | ||||||||||||||||||||||||
PIMCO California Municipal Income Fund | ||||||||||||||||||||||||||||||||
01/01/2024 - 06/30/2024+ | $ | 600,000 | $ | 61,075 | $ | 25,000 | N/A | $ | 136,600,000 | $ | 244,300 | $ | 100,000 | N/A | ||||||||||||||||||
12/31/2023 | 109,900,000 | 59,968 | 25,000 | N/A | 34,600,000 | 239,870 | 100,000 | N/A | ||||||||||||||||||||||||
12/31/2022 | 120,625,000 | 58,655 | 25,000 | N/A | 24,400,000 | 234,620 | 100,000 | N/A | ||||||||||||||||||||||||
12/31/2021 | 120,625,000 | 69,408 | 25,000 | N/A | 29,300,000 | 277,630 | 100,000 | N/A | ||||||||||||||||||||||||
12/31/2020 | 120,625,000 | 69,948 | 25,000 | N/A | 29,300,000 | 279,790 | 100,000 | N/A | ||||||||||||||||||||||||
12/31/2019 | 120,625,000 | 69,580 | 25,000 | N/A | 29,300,000 | 278,320 | 100,000 | N/A | ||||||||||||||||||||||||
PIMCO California Municipal Income Fund II | ||||||||||||||||||||||||||||||||
01/01/2024 - 06/30/2024+ | $ | 1,475,000 | $ | 61,193 | $ | 25,000 | N/A | $ | 146,700,000 | $ | 244,770 | $ | 100,000 | N/A | ||||||||||||||||||
12/31/2023 | 97,875,000 | 60,470 | 25,000 | N/A | 56,700,000 | 241,880 | 100,000 | N/A | ||||||||||||||||||||||||
12/31/2022 | 128,675,000 | 58,680 | 25,000 | N/A | 27,500,000 | 234,720 | 100,000 | N/A | ||||||||||||||||||||||||
12/31/2021 | 128,675,000 | 69,970 | 25,000 | N/A | 34,300,000 | 279,880 | 100,000 | N/A | ||||||||||||||||||||||||
12/31/2020 | 128,675,000 | 70,035 | 25,000 | N/A | 34,300,000 | 280,140 | 100,000 | N/A | ||||||||||||||||||||||||
12/31/2019 | 128,675,000 | 69,188 | 25,000 | N/A | 34,300,000 | 276,750 | 100,000 | N/A | ||||||||||||||||||||||||
PIMCO California Municipal Income Fund III | ||||||||||||||||||||||||||||||||
01/01/2024 - 06/30/2024+ | $ | 1,125,000 | $ | 61,258 | $ | 25,000 | N/A | $ | 118,600,000 | $ | 245,030 | $ | 100,000 | N/A | ||||||||||||||||||
12/31/2023 | 86,775,000 | 60,620 | 25,000 | N/A | 37,600,000 | 242,480 | 100,000 | N/A | ||||||||||||||||||||||||
12/31/2022 | 97,875,000 | 59,578 | 25,000 | N/A | 27,100,000 | 238,310 | 100,000 | N/A | ||||||||||||||||||||||||
12/31/2021 | 97,875,000 | 70,755 | 25,000 | N/A | 27,100,000 | 283,020 | 100,000 | N/A | ||||||||||||||||||||||||
12/31/2020 | 97,875,000 | 71,063 | 25,000 | N/A | 27,100,000 | 284,250 | 100,000 | N/A | ||||||||||||||||||||||||
12/31/2019 | 97,875,000 | 70,545 | 25,000 | N/A | 27,100,000 | 282,180 | 100,000 | N/A | ||||||||||||||||||||||||
PIMCO New York Municipal Income Fund | ||||||||||||||||||||||||||||||||
01/01/2024 - 06/30/2024+ | $ | 475,000 | $ | 66,500 | $ | 25,000 | N/A | $ | 41,000,000 | $ | 266,000 | $ | 100,000 | N/A | ||||||||||||||||||
12/31/2023 | 33,400,000 | 77,838 | 25,000 | N/A | N/A | N/A | 100,000 | N/A | ||||||||||||||||||||||||
12/31/2022 | 41,025,000 | 66,640 | 25,000 | N/A | N/A | N/A | 100,000 | N/A | ||||||||||||||||||||||||
12/31/2021 | 41,025,000 | 83,005 | 25,000 | N/A | N/A | N/A | 100,000 | N/A | ||||||||||||||||||||||||
12/31/2020 | 41,025,000 | 82,318 | 25,000 | N/A | N/A | N/A | 100,000 | N/A | ||||||||||||||||||||||||
12/31/2019 | 41,025,000 | 82,875 | 25,000 | N/A | N/A | N/A | 100,000 | N/A | ||||||||||||||||||||||||
PIMCO New York Municipal Income Fund II | ||||||||||||||||||||||||||||||||
01/01/2024 - 06/30/2024+ | $ | 550,000 | $ | 61,130 | $ | 25,000 | N/A | $ | 64,900,000 | $ | 244,520 | $ | 100,000 | N/A | ||||||||||||||||||
12/31/2023 | 51,100,000 | 61,733 | 25,000 | N/A | 14,900,000 | 246,930 | 100,000 | N/A | ||||||||||||||||||||||||
12/31/2022 | 58,000,000 | 56,845 | 25,000 | N/A | 14,900,000 | 227,380 | 100,000 | N/A | ||||||||||||||||||||||||
12/31/2021 | 58,000,000 | 66,323 | 25,000 | N/A | 21,000,000 | 265,290 | 100,000 | N/A | ||||||||||||||||||||||||
12/31/2020 | 58,000,000 | 65,730 | 25,000 | N/A | 21,000,000 | 262,920 | 100,000 | N/A | ||||||||||||||||||||||||
12/31/2019 | 58,000,000 | 66,003 | 25,000 | N/A | 21,000,000 | 264,010 | 100,000 | N/A | ||||||||||||||||||||||||
PIMCO New York Municipal Income Fund III | ||||||||||||||||||||||||||||||||
01/01/2024 - 06/30/2024+ | $ | 75,000 | $ | 62,023 | $ | 25,000 | N/A | $ | 26,000,000 | $ | 248,090 | $ | 100,000 | N/A | ||||||||||||||||||
12/31/2023 | 26,025,000 | 62,943 | 25,000 | N/A | N/A | N/A | 100,000 | N/A | ||||||||||||||||||||||||
12/31/2022 | 29,450,000 | 57,425 | 25,000 | N/A | N/A | N/A | 100,000 | N/A | ||||||||||||||||||||||||
12/31/2021 | 29,450,000 | 69,808 | 25,000 | N/A | N/A | N/A | 100,000 | N/A | ||||||||||||||||||||||||
12/31/2020 | 29,450,000 | 69,493 | 25,000 | N/A | N/A | N/A | 100,000 | N/A | ||||||||||||||||||||||||
12/31/2019 | 29,450,000 | 70,100 | 25,000 | N/A | N/A | N/A | 100,000 | N/A |
20 | PIMCO CLOSED-END FUNDS | See Accompanying Notes |
ARPS | RVMTP (5) | |||||||||||||||||||||||||||||||
Selected Per Share Data for the Year or Period Ended^: | Total Amount Outstanding | Asset Coverage per Preferred Share (1) | Involuntary Liquidating Preference per Preferred Share (2) | Average Market Value per ARPS (3) | Total Amount Outstanding | Asset Coverage per Preferred Share (1) | Involuntary Liquidating Preference per Preferred Share (2) | Average Market Value per RVMTP (4) | ||||||||||||||||||||||||
PIMCO Municipal Income Fund (Consolidated) | ||||||||||||||||||||||||||||||||
01/01/2024 - 06/30/2024+ | $ | 2,500,000 | $ | 60,315 | $ | 25,000 | N/A | $ | 172,600,000 | $ | 241,260 | $ | 100,000 | N/A | ||||||||||||||||||
12/31/2023 | 145,125,000 | 59,698 | 25,000 | N/A | 38,600,000 | 238,790 | 100,000 | N/A | ||||||||||||||||||||||||
12/31/2022 | 166,700,000 | 58,598 | 25,000 | N/A | 18,200,000 | 234,390 | 100,000 | N/A | ||||||||||||||||||||||||
12/31/2021 | 166,700,000 | 70,665 | 25,000 | N/A | 23,300,000 | 282,660 | 100,000 | N/A | ||||||||||||||||||||||||
12/31/2020 | 166,700,000 | 70,133 | 25,000 | N/A | 23,300,000 | 280,530 | 100,000 | N/A | ||||||||||||||||||||||||
12/31/2019 | 166,700,000 | 70,395 | 25,000 | N/A | 23,300,000 | 281,580 | 100,000 | N/A | ||||||||||||||||||||||||
PIMCO Municipal Income Fund II (Consolidated) | ||||||||||||||||||||||||||||||||
01/01/2024 - 06/30/2024+ | $ | 6,425,000 | $ | 62,863 | $ | 25,000 | N/A | $ | 377,200,000 | $ | 251,450 | $ | 100,000 | N/A | ||||||||||||||||||
12/31/2023 | 239,650,000 | 66,098 | 25,000 | N/A | 124,200,000 | 264,390 | 100,000 | N/A | ||||||||||||||||||||||||
12/31/2022 | 298,275,000 | 64,345 | 25,000 | N/A | 68,700,000 | 257,380 | 100,000 | N/A | ||||||||||||||||||||||||
12/31/2021 | 298,275,000 | 78,363 | 25,000 | N/A | 68,700,000 | 313,450 | 100,000 | N/A | ||||||||||||||||||||||||
12/31/2020 | 298,275,000 | 78,293 | 25,000 | N/A | 68,700,000 | 313,170 | 100,000 | N/A | ||||||||||||||||||||||||
12/31/2019 | 298,275,000 | 78,308 | 25,000 | N/A | 68,700,000 | 313,230 | 100,000 | N/A | ||||||||||||||||||||||||
PIMCO Municipal Income Fund III (Consolidated) | ||||||||||||||||||||||||||||||||
01/01/2024 - 06/30/2024+ | $ | 1,175,000 | $ | 61,765 | $ | 25,000 | N/A | $ | 182,200,000 | $ | 247,060 | $ | 100,000 | N/A | ||||||||||||||||||
12/31/2023 | 129,425,000 | 61,958 | 25,000 | N/A | 58,200,000 | 247,830 | 100,000 | N/A | ||||||||||||||||||||||||
12/31/2022 | 154,700,000 | 60,383 | 25,000 | N/A | 34,300,000 | 241,530 | 100,000 | N/A | ||||||||||||||||||||||||
12/31/2021 | 154,700,000 | 75,200 | 25,000 | N/A | 34,300,000 | 300,800 | 100,000 | N/A | ||||||||||||||||||||||||
12/31/2020 | 154,700,000 | 74,833 | 25,000 | N/A | 34,300,000 | 299,330 | 100,000 | N/A | ||||||||||||||||||||||||
12/31/2019 | 154,700,000 | 74,565 | 25,000 | N/A | 34,300,000 | 298,260 | 100,000 | N/A |
^ | A zero balance may reflect actual amounts rounding to less than $0.01 or 0.01%. |
+ | Unaudited |
* | Annualized, except for organizational expense, if any. |
(a) | Includes adjustments required by U.S. GAAP and may differ from net asset values and performance reported elsewhere by the Funds. |
(b) | Per share amounts based on average number of common shares outstanding during the year or period. |
(c) | Auction Rate Preferred Shareholders (“ARPS”). See Note 12, Auction Rate Preferred Shares, in the Notes to Financial Statements for more information. |
(d) | The tax characterization of distributions is determined in accordance with Federal income tax regulations. The actual tax characterization of distributions paid is determined at the end of the fiscal year. See Note 2, Distributions — Common Shares, in the Notes to Financial Statements for more information. |
(e) | Total investment return is calculated assuming a purchase of a common share at the market price on the first day and a sale of a common share at the market price on the last day of each year or period reported. Dividends and distributions, if any, are assumed, for purposes of this calculation, to be reinvested at prices obtained under the Funds’ dividend reinvestment plan. Total investment return does not reflect brokerage commissions in connection with the purchase or sale of Fund shares. |
(f) | Calculated on the basis of income and expenses applicable to both common and preferred shares relative to the average net assets of common shareholders. The expense ratio and net investment income do not reflect the effects of dividend payments to preferred shareholders. |
(g) | Ratio includes interest expense which primarily relates to participation in borrowing and financing transactions, interest paid to RVMTP shareholders and the amortization of debt issuance costs of RVMTP Shares. See Note 5, Borrowings and Other Financing Transactions and Note 12, Preferred Shares in the Notes to Financial Statements for more information. |
1 | “Asset Coverage per Preferred Share” means the ratio that the value of the total assets of the Fund, less all liabilities and indebtedness not represented by ARPS or RVMTP, bears to the aggregate of the involuntary liquidation preference of ARPS or RVMTP, expressed as a dollar amount per ARPS or RVMTP. |
2 | “Involuntary Liquidating Preference” means the amount to which a holder of ARPS or RVMTP would be entitled upon the involuntary liquidation of the Fund in preference to the Common Shareholders, expressed as a dollar amount per Preferred Share. |
3 | The ARPS have no readily ascertainable market value. Auctions for the ARPS have failed since February 2008, there is currently no active trading market for the ARPS and the Fund is not able to reliably estimate what their value would be in a third-party market sale. The liquidation value of the ARPS represents its liquidation preference, which approximates fair value of the shares less any accumulated unpaid dividends. See Note 12, Preferred Shares, in the Notes to Financial Statements for more information. |
4 | The RVMTP have no readily ascertainable market value. The liquidation value of the RVMTP represents its liquidation preference, which approximates fair value of the shares less any unamortized debt issuance costs. See Note 12, in the Notes to Financial Statements for more information. |
5 | Prior to July 14, 2021, RVMTP Shares were Variable Rate MuniFund Term Preferred Shares. See Note 12, Preferred Shares. |
SEMIANNUAL REPORT | | | JUNE 30, 2024 | 21 |
Statements of Assets and Liabilities | June 30, 2024 | (Unaudited) |
(Amounts in thousands † | PIMCO California Municipal Income Fund | PIMCO California Municipal Income Fund II | PIMCO California Municipal Income Fund III | PIMCO New York Municipal Income Fund | PIMCO New York Municipal Income Fund II | PIMCO New York Municipal Income Fund III | ||||||||||||||||||
Assets: | ||||||||||||||||||||||||
Investments, at value | ||||||||||||||||||||||||
Investments in securities* | $ | 336,304 | $ | 364,582 | $ | 296,934 | $ | 109,998 | $ | 159,390 | $ | 64,507 | ||||||||||||
Cash | 98 | 1 | 0 | 1 | 0 | 1 | ||||||||||||||||||
Interest and/or dividends receivable | 4,279 | 4,156 | 3,413 | 1,095 | 1,688 | 637 | ||||||||||||||||||
Other assets | 165 | 89 | 79 | 31 | 42 | 19 | ||||||||||||||||||
Total Assets | 340,846 | 368,828 | 300,426 | 111,125 | 161,120 | 65,164 | ||||||||||||||||||
Liabilities: | ||||||||||||||||||||||||
Remarketable Variable Rate MuniFund Term Preferred Shares, at liquidation value** | $ | 136,258 | $ | 146,298 | $ | 118,269 | $ | 40,903 | $ | 64,694 | $ | 25,909 | ||||||||||||
Payable for investments purchased | 3,485 | 3,800 | 5,106 | 0 | 0 | 0 | ||||||||||||||||||
Distributions payable to common shareholders | 683 | 693 | 664 | 264 | 331 | 142 | ||||||||||||||||||
Distributions payable to auction rate preferred shareholders | 0 | 1 | 0 | 0 | 0 | 0 | ||||||||||||||||||
Accrued management fees | 182 | 196 | 161 | 65 | 90 | 43 | ||||||||||||||||||
Other liabilities | 948 | 1,088 | 857 | 305 | 533 | 231 | ||||||||||||||||||
Total Liabilities | 141,556 | 152,076 | 125,057 | 41,537 | 65,648 | 26,325 | ||||||||||||||||||
Commitments and Contingent Liabilities ^ | ||||||||||||||||||||||||
Auction Rate Preferred Shares ^^ | 600 | 1,475 | 1,125 | 475 | 550 | 75 | ||||||||||||||||||
Net Assets Applicable to Common Shareholders | $ | 198,690 | $ | 215,277 | $ | 174,244 | $ | 69,113 | $ | 94,922 | $ | 38,764 | ||||||||||||
Net Assets Applicable to Common Shareholders Consist of: | ||||||||||||||||||||||||
Par value ^^^ | $ | 0 | $ | 0 | $ | 0 | $ | 0 | $ | 0 | $ | 0 | ||||||||||||
Paid in capital in excess of par | 221,135 | 232,545 | 194,569 | 81,589 | 111,579 | 44,967 | ||||||||||||||||||
Distributable earnings (accumulated loss) | (22,445 | ) | (17,268 | ) | (20,325 | ) | (12,476 | ) | (16,657 | ) | (6,203 | ) | ||||||||||||
Net Assets Applicable to Common Shareholders | $ | 198,690 | $ | 215,277 | $ | 174,244 | $ | 69,113 | $ | 94,922 | $ | 38,764 | ||||||||||||
Net Asset Value Per Common Share (a) | $ | 10.47 | $ | 6.67 | $ | 7.75 | $ | 8.78 | $ | 8.47 | $ | 6.75 | ||||||||||||
Common Shares Outstanding | 18,981 | 32,253 | 22,488 | 7,868 | 11,209 | 5,747 | ||||||||||||||||||
Auction Rate Preferred Shares Issued and Outstanding | 0 | 0 | 0 | 0 | 0 | 0 | ||||||||||||||||||
Cost of investments in securities | $ | 334,771 | $ | 357,083 | $ | 296,208 | $ | 110,633 | $ | 159,461 | $ | 64,114 | ||||||||||||
* Includes repurchase agreements of: | $ | 0 | $ | 969 | $ | 2,955 | $ | 140 | $ | 2,032 | $ | 671 | ||||||||||||
** Includes unamortized debt issuance cost of | $ | 342 | $ | 402 | $ | 331 | $ | 97 | $ | 206 | $ | 91 |
† | A zero balance may reflect actual amounts rounding to less than one thousand. |
^ | See Note 8, Fees and Expenses, in the Notes to Financial Statements for more information. |
^^ | ($0.00001 par value and $25,000 liquidation preference per share) |
^^^ | ($0.00001 per share) |
(a) | Includes adjustments required by U.S. GAAP and may differ from net asset values and performance reported elsewhere by the Funds. |
22 | PIMCO CLOSED-END FUNDS | See Accompanying Notes |
Consolidated Statements of Assets and Liabilities | June 30, 2024 | (Unaudited) |
(Amounts in thousands † | PIMCO Municipal Income Fund | PIMCO Municipal Income Fund II | PIMCO Municipal Income Fund III | |||||||||
Assets: | ||||||||||||
Investments, at value | ||||||||||||
Investments in securities* | $ | 423,478 | $ | 974,788 | $ | 454,053 | ||||||
Cash | 425 | 1,010 | 465 | |||||||||
Receivable for investments sold | 0 | 0 | 13 | |||||||||
Interest and/or dividends receivable | 5,078 | 11,450 | 5,400 | |||||||||
Other assets | 156 | 310 | 149 | |||||||||
Total Assets | 429,137 | 987,558 | 460,080 | |||||||||
Liabilities: | ||||||||||||
Borrowings & Other Financing Transactions | ||||||||||||
Payable for tender option bond floating rate certificates | $ | 0 | $ | 7,584 | $ | 0 | ||||||
Remarketable Variable Rate MuniFund Term Preferred Shares, at liquidation value** | 172,209 | 376,477 | 181,773 | |||||||||
Payable for investments purchased | 1,357 | 3,005 | 1,454 | |||||||||
Payable for unfunded loan commitments | 2,284 | 5,409 | 2,427 | |||||||||
Distributions payable to common shareholders | 1,103 | 2,624 | 1,103 | |||||||||
Distributions payable to auction rate preferred shareholders | 1 | 2 | 1 | |||||||||
Accrued management fees | 229 | 507 | 245 | |||||||||
Other liabilities | 1,204 | 2,435 | 1,261 | |||||||||
Total Liabilities | 178,387 | 398,043 | 188,264 | |||||||||
Commitments and Contingent Liabilities ^ | ||||||||||||
Auction Rate Preferred Shares ^^ | 2,500 | 6,425 | 1,175 | |||||||||
Net Assets Applicable to Common Shareholders | $ | 248,250 | $ | 583,090 | $ | 270,641 | ||||||
Net Assets Applicable to Common Shareholders Consist of: | ||||||||||||
Par value ^^^ | $ | 0 | $ | 1 | $ | 0 | ||||||
Paid in capital in excess of par | 289,439 | 675,277 | 314,257 | |||||||||
Distributable earnings (accumulated loss) | (41,189 | ) | (92,188 | ) | (43,616 | ) | ||||||
Net Assets Applicable to Common Shareholders | $ | 248,250 | $ | 583,090 | $ | 270,641 | ||||||
Net Asset Value Per Common Share (a) | $ | 9.46 | $ | 8.78 | $ | 8.10 | ||||||
Common Shares Outstanding | 26,254 | 66,417 | 33,428 | |||||||||
Auction Rate Preferred Shares Issued and Outstanding | 0 | 0 | 0 | |||||||||
Cost of investments in securities | $ | 425,546 | $ | 970,134 | $ | 452,609 | ||||||
* Includes repurchase agreements of: | $ | 2,160 | $ | 5,945 | $ | 886 | ||||||
** Includes unamortized debt issuance cost of | $ | 391 | $ | 723 | $ | 427 |
† | A zero balance may reflect actual amounts rounding to less than one thousand. |
^ | See Note 8, Fees and Expenses, in the Notes to Financial Statements for more information. |
^^ | ($0.00001 par value and $25,000 liquidation preference per share) |
^^^ | ($0.00001 per share) |
(a) | Includes adjustments required by U.S. GAAP and may differ from net asset values and performance reported elsewhere by the Funds. |
See Accompanying Notes | SEMIANNUAL REPORT | | | JUNE 30, 2024 | 23 |
Statements of Operations |
Six Months Ended June 30, 2024 (Unaudited) | ||||||||||||||||||||||||
(Amounts in thousands † | PIMCO California Municipal Income Fund | PIMCO California Municipal Income Fund II | PIMCO California Municipal Income Fund III | PIMCO New York Municipal Income Fund | PIMCO New York Municipal Income Fund II | PIMCO New York Municipal Income Fund III | ||||||||||||||||||
Investment Income: | ||||||||||||||||||||||||
Interest | $ | 7,248 | $ | 7,806 | $ | 6,334 | $ | 2,290 | $ | 3,524 | $ | 1,437 | ||||||||||||
Miscellaneous income | 1 | 1 | 1 | 0 | 0 | 0 | ||||||||||||||||||
Total Income | 7,249 | 7,807 | 6,335 | 2,290 | 3,524 | 1,437 | ||||||||||||||||||
Expenses: | ||||||||||||||||||||||||
Management fees | 1,182 | 1,276 | 1,046 | 401 | 582 | 274 | ||||||||||||||||||
Trustee fees and related expenses | 18 | 20 | 16 | 6 | 9 | 4 | ||||||||||||||||||
Interest expense | 1,823 | 2,199 | 1,675 | 418 | 846 | 266 | ||||||||||||||||||
Auction agent fees and commissions | 144 | 153 | 94 | 48 | 95 | 33 | ||||||||||||||||||
Auction rate preferred shares related expenses | 12 | 12 | 11 | 11 | 12 | 11 | ||||||||||||||||||
Total Expenses | 3,179 | 3,660 | 2,842 | 884 | 1,544 | 588 | ||||||||||||||||||
Net Investment Income (Loss) | 4,070 | 4,147 | 3,493 | 1,406 | 1,980 | 849 | ||||||||||||||||||
Net Realized Gain (Loss): | ||||||||||||||||||||||||
Investments in securities | (617 | ) | (482 | ) | (549 | ) | (168 | ) | (402 | ) | (136 | ) | ||||||||||||
Net Realized Gain (Loss) | (617 | ) | (482 | ) | (549 | ) | (168 | ) | (402 | ) | (136 | ) | ||||||||||||
Net Change in Unrealized Appreciation (Depreciation): | ||||||||||||||||||||||||
Investments in securities | (3,270 | ) | (3,966 | ) | (2,313 | ) | (1,300 | ) | (1,869 | ) | (720 | ) | ||||||||||||
Net Change in Unrealized Appreciation (Depreciation) | (3,270 | ) | (3,966 | ) | (2,313 | ) | (1,300 | ) | (1,869 | ) | (720 | ) | ||||||||||||
Net Increase (Decrease) in Net Assets Resulting from Operations | $ | 183 | $ | (301 | ) | $ | 631 | $ | (62 | ) | $ | (291 | ) | $ | (7 | ) | ||||||||
Distributions on Auction Rate Preferred Shares from Net Investment Income and/or Realized Capital Gains | $ | (1,885 | ) | $ | (1,679 | ) | $ | (1,502 | ) | $ | (577 | ) | $ | (880 | ) | $ | (445 | ) | ||||||
Net Increase (Decrease) in Net Assets Applicable to Common Shareholders Resulting from Operations | $ | (1,702 | ) | $ | (1,980 | ) | $ | (871 | ) | $ | (639 | ) | $ | (1,171 | ) | $ | (452 | ) |
† | A zero balance may reflect actual amounts rounding to less than one thousand. |
24 | PIMCO CLOSED-END FUNDS | See Accompanying Notes |
Consolidated Statements of Operations |
Six Months Ended June 30, 2024 (Unaudited) | ||||||||||||
(Amounts in thousands † | PIMCO Municipal Income Fund | PIMCO Municipal Income Fund II | PIMCO Municipal Income Fund III | |||||||||
Investment Income: | ||||||||||||
Interest | $ | 10,084 | $ | 22,560 | $ | 10,788 | ||||||
Total Income | 10,084 | 22,560 | 10,788 | |||||||||
Expenses: | ||||||||||||
Management fees | 1,491 | 3,234 | 1,589 | |||||||||
Trustee fees and related expenses | 23 | 56 | 25 | |||||||||
Interest expense | 2,246 | 5,541 | 2,575 | |||||||||
Auction agent fees and commissions | 205 | 293 | 138 | |||||||||
Auction rate preferred shares related expenses | 12 | 12 | 11 | |||||||||
Miscellaneous expense | 1 | 1 | 1 | |||||||||
Total Expenses | 3,978 | 9,137 | 4,339 | |||||||||
Net Investment Income (Loss) | 6,106 | 13,423 | 6,449 | |||||||||
Net Realized Gain (Loss): | ||||||||||||
Investments in securities | 895 | 3,021 | 1,442 | |||||||||
Net Realized Gain (Loss) | 895 | 3,021 | 1,442 | |||||||||
Net Change in Unrealized Appreciation (Depreciation): | ||||||||||||
Investments in securities | (7,983 | ) | (16,766 | ) | (8,580 | ) | ||||||
Net Change in Unrealized Appreciation (Depreciation) | (7,983 | ) | (16,766 | ) | (8,580 | ) | ||||||
Net Increase (Decrease) in Net Assets Resulting from Operations | $ | (982 | ) | $ | (322 | ) | $ | (689 | ) | |||
Distributions on Auction Rate Preferred Shares from Net Investment Income and/or Realized Capital Gains | $ | (2,505 | ) | $ | (4,147 | ) | $ | (2,224 | ) | |||
Net Increase (Decrease) in Net Assets Applicable to Common Shareholders Resulting from Operations | $ | (3,487 | ) | $ | (4,469 | ) | $ | (2,913 | ) |
† | A zero balance may reflect actual amounts rounding to less than one thousand. |
SEMIANNUAL REPORT | | | JUNE 30, 2024 | 25 |
Statements of Changes in Net Assets |
PIMCO California Municipal Income Fund | PIMCO California Municipal Income Fund II | |||||||||||||||
(Amounts in thousands † | Six Months Ended June 30, 2024 (Unaudited) | Year Ended December 31, 2023 | Six Months Ended June 30, 2024 (Unaudited) | Year Ended December 31, 2023 | ||||||||||||
Increase (Decrease) in Net Assets from: | ||||||||||||||||
Operations: | ||||||||||||||||
Net investment income (loss) | $ | 4,070 | $ | 10,492 | $ | 4,147 | $ | 10,675 | ||||||||
Net realized gain (loss) | (617 | ) | (4,648 | ) | (482 | ) | (5,692 | ) | ||||||||
Net change in unrealized appreciation (depreciation) | (3,270 | ) | 15,447 | (3,966 | ) | 17,630 | ||||||||||
Net Increase (Decrease) in Net Assets Resulting from Operations | 183 | 21,291 | (301 | ) | 22,613 | |||||||||||
Distributions on auction rate preferred shares from net investment income and/or realized capital gains | (1,885 | ) | (6,998 | ) | (1,679 | ) | (7,129 | ) | ||||||||
Net Increase (Decrease) in Net Assets Applicable to Common Shareholders Resulting from Operations | (1,702 | ) | 14,293 | (1,980 | ) | 15,484 | ||||||||||
Distributions to Common Shareholders: | ||||||||||||||||
From net investment income and/or net realized capital gains | (4,100 | ) | (4,534 | ) | (4,161 | ) | (5,001 | ) | ||||||||
Tax basis return of capital | 0 | (3,665 | ) | 0 | (3,320 | ) | ||||||||||
Total Distributions to Common Shareholders (a) | (4,100 | ) | (8,199 | ) | (4,161 | ) | (8,321 | ) | ||||||||
Auction-Rate Preferred Share Transactions: | ||||||||||||||||
Net Increase (Decrease) resulting from tender of Auction Rate Preferred Shares | 2,186 | 590 | 1,928 | 1,694 | ||||||||||||
Common Share Transactions*: | ||||||||||||||||
Issued as reinvestment of distributions | 0 | 160 | 0 | 52 | ||||||||||||
Total increase (decrease) in net assets applicable to common shareholders | (3,616 | ) | 6,844 | (4,213 | ) | 8,909 | ||||||||||
Net Assets Applicable to Common Shareholders: | ||||||||||||||||
Beginning of period | 202,306 | 195,462 | 219,490 | 210,581 | ||||||||||||
End of period | $ | 198,690 | $ | 202,306 | $ | 215,277 | $ | 219,490 | ||||||||
* Common Share Transactions: | ||||||||||||||||
Shares issued as reinvestment of distributions | 0 | 14 | 0 | 7 |
† | A zero balance may reflect actual amounts rounding to less than one thousand. |
(a) | The tax characterization of distributions is determined in accordance with Federal income tax regulations. The actual tax characterization of distributions paid is determined at the end of the fiscal year. See Note 2, Distributions — Common Shares, in the Notes to Financial Statements for more information. |
26 | PIMCO CLOSED-END FUNDS | See Accompanying Notes |
PIMCO California Municipal Income Fund III | PIMCO New York Municipal Income Fund | PIMCO New York Municipal Income Fund II | PIMCO New York Municipal Income Fund III | |||||||||||||||||||||||||||
Six Months Ended June 30, 2024 (Unaudited) | Year Ended December 31, 2023 | Six Months Ended June 30, 2024 (Unaudited) | Year Ended December 31, 2023 | Six Months Ended June 30, 2024 (Unaudited) | Year Ended December 31, 2023 | Six Months Ended June 30, 2024 (Unaudited) | Year Ended December 31, 2023 | |||||||||||||||||||||||
$ | 3,493 | $ | 8,856 | $ | 1,406 | $ | 3,515 | $ | 1,980 | $ | 4,978 | $ | 849 | $ | 2,248 | |||||||||||||||
(549 | ) | (3,759 | ) | (168 | ) | (2,953 | ) | (402 | ) | (3,210 | ) | (136 | ) | (1,444 | ) | |||||||||||||||
(2,313 | ) | 12,099 | (1,300 | ) | 6,707 | (1,869 | ) | 9,278 | (720 | ) | 3,724 | |||||||||||||||||||
631 | 17,196 | (62 | ) | 7,269 | (291 | ) | 11,046 | (7 | ) | 4,528 | ||||||||||||||||||||
| (1,502 | ) | (5,655 | ) | (577 | ) | (2,313 | ) | (880 | ) | (3,329 | ) | (445 | ) | (1,701 | ) | ||||||||||||||
| (871 | ) | 11,541 | (639 | ) | 4,956 | (1,171 | ) | 7,717 | (452 | ) | 2,827 | ||||||||||||||||||
(3,980 | ) | (6,169 | ) | (1,582 | ) | (1,197 | ) | (1,984 | ) | (2,581 | ) | (855 | ) | (556 | ) | |||||||||||||||
0 | (1,788 | ) | 0 | (1,966 | ) | 0 | (1,387 | ) | 0 | (1,154 | ) | |||||||||||||||||||
(3,980 | ) | (7,957 | ) | (1,582 | ) | (3,163 | ) | (1,984 | ) | (3,968 | ) | (855 | ) | (1,710 | ) | |||||||||||||||
1,713 | 611 | 659 | 419 | 1,011 | 380 | 519 | 188 | |||||||||||||||||||||||
34 | 181 | 0 | 66 | 0 | 0 | 0 | 7 | |||||||||||||||||||||||
(3,104 | ) | 4,376 | (1,562 | ) | 2,278 | (2,144 | ) | 4,129 | (788 | ) | 1,312 | |||||||||||||||||||
177,348 | 172,972 | 70,675 | 68,397 | 97,066 | 92,937 | 39,552 | 38,240 | |||||||||||||||||||||||
$ | 174,244 | $ | 177,348 | $ | 69,113 | $ | 70,675 | $ | 94,922 | $ | 97,066 | $ | 38,764 | $ | 39,552 | |||||||||||||||
4 | 23 | 0 | 7 | 0 | 0 | 0 | 1 |
SEMIANNUAL REPORT | | | JUNE 30, 2024 | 27 |
Consolidated Statements of Changes in Net Assets |
PIMCO Municipal Income Fund | PIMCO Municipal Income Fund II | PIMCO Municipal Income Fund III | ||||||||||||||||||||||
(Amounts in thousands † | Six Months Ended June 30, 2024 (Unaudited) | Year Ended December 31, 2023 | Six Months Ended June 30, 2024 (Unaudited) | Year Ended December 31, 2023 | Six Months Ended June 30, 2024 (Unaudited) | Year Ended December 31, 2023 | ||||||||||||||||||
Increase (Decrease) in Net Assets from: | ||||||||||||||||||||||||
Operations: | ||||||||||||||||||||||||
Net investment income (loss) | $ | 6,106 | $ | 16,049 | $ | 13,423 | $ | 34,479 | $ | 6,449 | $ | 16,227 | ||||||||||||
Net realized gain (loss) | 895 | (13,462 | ) | 3,021 | (32,858 | ) | 1,442 | (18,254 | ) | |||||||||||||||
Net change in unrealized appreciation (depreciation) | (7,983 | ) | 24,752 | (16,766 | ) | 60,084 | (8,580 | ) | 32,194 | |||||||||||||||
Net Increase (Decrease) in Net Assets Resulting from Operations | (982 | ) | 27,339 | (322 | ) | 61,705 | (689 | ) | 30,167 | |||||||||||||||
Distributions on auction rate preferred shares from net investment income and/or realized capital gains | (2,505 | ) | (9,566 | ) | (4,147 | ) | (16,754 | ) | (2,224 | ) | (8,784 | ) | ||||||||||||
Net Increase (Decrease) in Net Assets Applicable to Common Shareholders Resulting from Operations | (3,487 | ) | 17,773 | (4,469 | ) | 44,951 | (2,913 | ) | 21,383 | |||||||||||||||
Distributions to Common Shareholders: | ||||||||||||||||||||||||
From net investment income and/or net realized capital gains | (6,613 | ) | (9,815 | ) | (15,741 | ) | (20,242 | ) | (6,619 | ) | (9,970 | ) | ||||||||||||
Tax basis return of capital | 0 | (3,390 | ) | 0 | (11,189 | ) | 0 | (3,266 | ) | |||||||||||||||
Total Distributions to Common Shareholders (a) | (6,613 | ) | (13,205 | ) | (15,741 | ) | (31,431 | ) | (6,619 | ) | (13,236 | ) | ||||||||||||
Auction-Rate Preferred Share Transactions: | ||||||||||||||||||||||||
Net Increase (Decrease) resulting from tender of Auction Rate Preferred Shares | 2,852 | 1,187 | 4,665 | 3,224 | 2,565 | 1,390 | ||||||||||||||||||
Common Share Transactions*: | ||||||||||||||||||||||||
Net proceeds from at-the-market | 0 | 0 | 0 | 1,377 | 0 | 0 | ||||||||||||||||||
Issued as reinvestment of distributions | 262 | 773 | 0 | 2,475 | 0 | 357 | ||||||||||||||||||
Total increase (decrease) in net assets applicable to common shareholders | (6,986 | ) | 6,528 | (15,545 | ) | 20,596 | (6,967 | ) | 9,894 | |||||||||||||||
Net Assets Applicable to Common Shareholders: | ||||||||||||||||||||||||
Beginning of period | 255,236 | 248,707 | 598,635 | 578,039 | 277,608 | 267,714 | ||||||||||||||||||
End of period | $ | 248,250 | $ | 255,236 | $ | 583,090 | $ | 598,635 | $ | 270,641 | $ | 277,608 | ||||||||||||
* Common Share Transactions: | ||||||||||||||||||||||||
Shares sold | 0 | 0 | 0 | 149 | 0 | 0 | ||||||||||||||||||
Shares issued as reinvestment of distributions | 28 | 78 | 0 | 278 | 0 | 42 |
† | A zero balance may reflect actual amounts rounding to less than one thousand. |
(a) | The tax characterization of distributions is determined in accordance with Federal income tax regulations. The actual tax characterization of distributions paid is determined at the end of the fiscal year. See Note 2, Distributions — Common Shares, in the Notes to Financial Statements for more information. |
28 | PIMCO CLOSED-END FUNDS | See Accompanying Notes |
Statements of Cash Flows |
Six Months Ended June 30, 2024 (Unaudited) | ||||||||||||||||||||||||
(Amounts in thousands † | PIMCO California Municipal Income Fund | PIMCO California Municipal Income Fund II | PIMCO California Municipal Income Fund III | PIMCO New York Municipal Income Fund | PIMCO New York Municipal Income Fund II | PIMCO New York Municipal Income Fund III | ||||||||||||||||||
Cash Flows Provided by (Used for) Operating Activities: | ||||||||||||||||||||||||
Net increase (decrease) in net assets resulting from operations | $ | 183 | $ | (301 | ) | $ | 631 | $ | (62 | ) | $ | (291 | ) | $ | (7 | ) | ||||||||
Adjustments to Reconcile Net Increase (Decrease) in Net Assets from Operations to Net Cash Provided by (Used for) | ||||||||||||||||||||||||
Operating Activities: | ||||||||||||||||||||||||
Purchases of long-term securities | (46,072 | ) | (50,280 | ) | (45,538 | ) | (23,649 | ) | (27,257 | ) | (11,550 | ) | ||||||||||||
Proceeds from sales of long-term securities | 47,067 | 41,767 | 41,192 | 14,077 | 24,455 | 8,814 | ||||||||||||||||||
(Purchases) Proceeds from sales of short-term portfolio investments, net | 2,454 | 11,081 | 4,180 | 2,399 | 3,626 | 1,061 | ||||||||||||||||||
(Increase) decrease in receivable for investments sold | 0 | 0 | 0 | 1,032 | 1,296 | 1,659 | ||||||||||||||||||
(Increase) decrease in interest and/or dividends receivable | (29 | ) | (102 | ) | (117 | ) | (233 | ) | (113 | ) | (78 | ) | ||||||||||||
(Increase) decrease in other assets | 0 | 0 | (1 | ) | 0 | 0 | 0 | |||||||||||||||||
Increase (decrease) in payable for investments purchased | 3,485 | 3,800 | 5,106 | (1,689 | ) | (1,689 | ) | 0 | ||||||||||||||||
Increase (decrease) in accrued management fees | (30 | ) | (33 | ) | (26 | ) | (5 | ) | (14 | ) | (6 | ) | ||||||||||||
Increase (decrease) in other liabilities | 784 | 811 | 682 | 285 | 480 | 217 | ||||||||||||||||||
Net Realized (Gain) Loss | ||||||||||||||||||||||||
Investments in securities | 617 | 482 | 549 | 168 | 402 | 136 | ||||||||||||||||||
Net Change in Unrealized (Appreciation) Depreciation | ||||||||||||||||||||||||
Investments in securities | 3,270 | 3,966 | 2,313 | 1,300 | 1,869 | 720 | ||||||||||||||||||
Net amortization (accretion) on investments | (159 | ) | (535 | ) | (272 | ) | (59 | ) | (107 | ) | (107 | ) | ||||||||||||
Amortization of debt issuance cost | (17 | ) | (7 | ) | (14 | ) | 4 | 16 | 4 | |||||||||||||||
Net Cash Provided by (Used for) Operating Activities | 11,553 | 10,649 | 8,685 | (6,432 | ) | 2,673 | 863 | |||||||||||||||||
Cash Flows Received from (Used for) Financing Activities: | ||||||||||||||||||||||||
Payments resulting from tender of Auction Rate Preferred Shares | (107,114 | ) | (94,472 | ) | (83,937 | ) | (32,266 | ) | (49,539 | ) | (25,431 | ) | ||||||||||||
Cash distributions paid to common shareholders * | (4,100 | ) | (4,161 | ) | (3,945 | ) | (1,582 | ) | (1,984 | ) | (856 | ) | ||||||||||||
Cash distributions paid to auction rate preferred shareholders | (2,020 | ) | (1,801 | ) | (1,590 | ) | (617 | ) | (940 | ) | (481 | ) | ||||||||||||
Proceeds on Remarketable Variable Rate MuniFund Term Preferred Shares Net | 101,778 | 89,786 | 80,786 | 40,898 | 49,789 | 25,905 | ||||||||||||||||||
Net Cash Received from (Used for) Financing Activities | (11,456 | ) | (10,648 | ) | (8,686 | ) | 6,433 | (2,674 | ) | (863 | ) | |||||||||||||
Net Increase (Decrease) in Cash and Foreign Currency | 97 | 1 | (1 | ) | 1 | (1 | ) | 0 | ||||||||||||||||
Cash and Foreign Currency: | ||||||||||||||||||||||||
Beginning of period | 1 | 0 | 1 | 0 | 1 | 1 | ||||||||||||||||||
End of period | $ | 98 | $ | 1 | $ | 0 | $ | 1 | $ | 0 | $ | 1 | ||||||||||||
*Reinvestment of distributions to common shareholders | $ | 0 | $ | 0 | $ | 34 | $ | 0 | $ | 0 | $ | 0 | ||||||||||||
Supplemental Disclosure of Cash Flow Information: | ||||||||||||||||||||||||
Interest expense paid during the period | $ | 1,350 | $ | 1,689 | $ | 1,273 | $ | 254 | $ | 600 | $ | 161 |
† | A zero balance may reflect actual amounts rounding to less than one thousand. |
SEMIANNUAL REPORT | | | JUNE 30, 2024 | 29 |
Consolidated Statements of Cash Flows |
Six Months Ended June 30, 2024 (Unaudited) | ||||||||||||
(Amounts in thousands † | PIMCO Municipal Income Fund | PIMCO Municipal Income Fund II | PIMCO Municipal Income Fund III | |||||||||
Cash Flows Provided by (Used for) Operating Activities: | ||||||||||||
Net increase (decrease) in net assets resulting from operations | $ | (982 | ) | $ | (322 | ) | $ | (689 | ) | |||
Adjustments to Reconcile Net Increase (Decrease) in Net Assets from Operations to Net Cash Provided by (Used for) Operating Activities: | ||||||||||||
Purchases of long-term securities | (47,686 | ) | (109,275 | ) | (55,425 | ) | ||||||
Proceeds from sales of long-term securities | 62,483 | 97,075 | 66,010 | |||||||||
(Purchases) Proceeds from sales of short-term portfolio investments, net | (312 | ) | (4,958 | ) | (475 | ) | ||||||
(Increase) decrease in receivable for investments sold | 0 | 0 | 1 | |||||||||
(Increase) decrease in interest and/or dividends receivable | (65 | ) | (631 | ) | (137 | ) | ||||||
(Increase) decrease in other assets | (39 | ) | (91 | ) | (25 | ) | ||||||
Increase (decrease) in payable for investments purchased | (4,518 | ) | 3,005 | (4,421 | ) | |||||||
Increase (decrease) in payable for unfunded loan commitments | (711 | ) | (1,679 | ) | (768 | ) | ||||||
Increase (decrease) in accrued management fees | (39 | ) | (65 | ) | (40 | ) | ||||||
Increase (decrease) in other liabilities | 962 | 1,863 | 992 | |||||||||
Net Realized (Gain) Loss | ||||||||||||
Investments in securities | (895 | ) | (3,021 | ) | (1,442 | ) | ||||||
Net Change in Unrealized (Appreciation) Depreciation | ||||||||||||
Investments in securities | 7,983 | 16,766 | 8,580 | |||||||||
Net amortization (accretion) on investments | (715 | ) | (1,497 | ) | (748 | ) | ||||||
Amortization of debt issuance cost | (17 | ) | (43 | ) | (20 | ) | ||||||
Net Cash Provided by (Used for) Operating Activities | 15,449 | (2,873 | ) | 11,393 | ||||||||
Cash Flows Received from (Used for) Financing Activities: | ||||||||||||
Payments resulting from tender of Auction Rate Preferred Shares | (139,773 | ) | (228,560 | ) | (125,685 | ) | ||||||
Cash distributions paid to common shareholders* | (6,349 | ) | (15,741 | ) | (6,619 | ) | ||||||
Cash distributions paid to auction rate preferred shareholders | (2,676 | ) | (4,435 | ) | (2,377 | ) | ||||||
Payments on tender option bond transactions | 0 | 2 | 0 | |||||||||
Proceeds on Remarketable Variable Rate MuniFund Term Preferred Shares Net | 133,774 | 252,616 | 123,752 | |||||||||
Net Cash Received from (Used for) Financing Activities | (15,024 | ) | 3,882 | (10,929 | ) | |||||||
Net Increase (Decrease) in Cash and Foreign Currency | 425 | 1,009 | 464 | |||||||||
Cash and Foreign Currency: | ||||||||||||
Beginning of period | 0 | 1 | 1 | |||||||||
End of period | $ | 425 | $ | 1,010 | $ | 465 | ||||||
* Reinvestment of distributions to common shareholders | $ | 262 | $ | 0 | $ | 0 | ||||||
Supplemental Disclosure of Cash Flow Information: | ||||||||||||
Interest expense paid during the period | $ | 1,626 | $ | 4,217 | $ | 1,945 |
† | A zero balance may reflect actual amounts rounding to less than one thousand. |
30 | PIMCO CLOSED-END FUNDS | See Accompanying Notes |
Schedule of Investments | PIMCO California Municipal Income Fund | June 30, 2024 | (Unaudited) |
PRINCIPAL AMOUNT (000S) | MARKET VALUE (000S) | |||||||||||
INVESTMENTS IN SECURITIES 169.3% | ||||||||||||
MUNICIPAL BONDS & NOTES 167.4% | ||||||||||||
ARIZONA 0.0% | ||||||||||||
Arizona Industrial Development Authority Revenue Bonds, Series 2020 | ||||||||||||
7.750% due 07/01/2050 ^(b) | $ | 850 | $ | 51 | ||||||||
CALIFORNIA 151.1% | ||||||||||||
Alameda Corridor Transportation Authority, California Revenue Bonds, (AGM Insured), Series 2024 | ||||||||||||
0.000% due 10/01/2052 (c) | 2,200 | 580 | ||||||||||
Alameda Corridor Transportation Authority, California Revenue Bonds, Series 2022 | ||||||||||||
5.375% due 10/01/2049 (d) | 2,890 | 1,628 | ||||||||||
Alameda Unified School District-Alameda County, California General Obligation Bonds, Series 2024 | ||||||||||||
5.000% due 08/01/2049 | 850 | 945 | ||||||||||
Alhambra Unified School District, California General Obligation Bonds, Series 2022 | ||||||||||||
5.250% due 08/01/2047 | 870 | 972 | ||||||||||
Anaheim City School District, California General Obligation Bonds, (BAM Insured), Series 2023 | ||||||||||||
4.250% due 08/01/2050 | 2,500 | 2,516 | ||||||||||
Antelope Valley Community College District, California General Obligation Bonds, Series 2022 | ||||||||||||
0.000% due 08/01/2047 (c) | 680 | 213 | ||||||||||
Bay Area Toll Authority, California Revenue Bonds, Series 2017 | ||||||||||||
5.000% due 04/01/2056 | 1,750 | 1,847 | ||||||||||
Bay Area Toll Authority, California Revenue Bonds, Series 2023 | ||||||||||||
4.125% due 04/01/2054 | 1,700 | 1,700 | ||||||||||
Butte-Glenn Community College District, California General Obligation Bonds, Series 2022 | ||||||||||||
4.000% due 08/01/2047 | 1,500 | 1,493 | ||||||||||
California Community Choice Financing Authority Revenue Bonds, Series 2023 | ||||||||||||
5.250% due 11/01/2054 | 2,000 | 2,138 | ||||||||||
California Community Housing Agency Revenue Bonds, Series 2019 | ||||||||||||
5.000% due 04/01/2049 | 1,225 | 1,069 | ||||||||||
California Community Housing Agency Revenue Bonds, Series 2021 | ||||||||||||
4.000% due 02/01/2056 | 1,000 | 825 | ||||||||||
California Community Housing Agency Revenue Bonds, Series 2022 | ||||||||||||
4.500% due 08/01/2052 | 1,000 | 869 | ||||||||||
California County Tobacco Securitization Agency Revenue Bonds, Series 2002 | ||||||||||||
6.000% due 06/01/2035 | 1,085 | 1,086 | ||||||||||
California County Tobacco Securitization Agency Revenue Bonds, Series 2007 | ||||||||||||
0.000% due 06/01/2057 (c) | 7,000 | 1,083 | ||||||||||
California County Tobacco Securitization Agency Revenue Bonds, Series 2020 | ||||||||||||
0.000% due 06/01/2055 (c) | 4,700 | 855 | ||||||||||
California Educational Facilities Authority Revenue Bonds, Series 2018 | ||||||||||||
4.000% due 10/01/2039 | 1,250 | 1,250 | ||||||||||
5.000% due 10/01/2048 | 1,000 | 1,036 | ||||||||||
California Health Facilities Financing Authority Revenue Bonds, Series 2015 | ||||||||||||
5.000% due 08/15/2054 | 1,300 | 1,316 | ||||||||||
California Health Facilities Financing Authority Revenue Bonds, Series 2016 | ||||||||||||
5.000% due 11/15/2046 | 2,960 | 3,026 | ||||||||||
5.000% due 08/15/2055 | 6,000 | 6,095 | ||||||||||
California Health Facilities Financing Authority Revenue Bonds, Series 2017 | ||||||||||||
4.000% due 11/01/2038 | 1,400 | 1,396 | ||||||||||
4.000% due 11/01/2044 | 1,000 | 990 | ||||||||||
4.000% due 11/01/2051 | 2,500 | 2,413 |
PRINCIPAL AMOUNT (000S) | MARKET VALUE (000S) | |||||||||||
California Health Facilities Financing Authority Revenue Bonds, Series 2020 | ||||||||||||
4.000% due 08/15/2050 | $ | 4,000 | $ | 3,888 | ||||||||
California Health Facilities Financing Authority Revenue Bonds, Series 2021 | ||||||||||||
4.000% due 08/15/2048 | 2,500 | 2,420 | ||||||||||
California Health Facilities Financing Authority Revenue Bonds, Series 2024 | ||||||||||||
5.000% due 11/15/2044 | 1,700 | 1,894 | ||||||||||
California Housing Finance Agency Revenue Bonds, (FNMA Insured), Series 2024 | ||||||||||||
4.330% due 02/01/2042 | 1,000 | 1,005 | ||||||||||
California Housing Finance Agency Revenue Bonds, Series 2024 | ||||||||||||
5.970% due 11/01/2053 | 2,000 | 2,000 | ||||||||||
California Housing Finance Revenue Bonds, Series 2024 | ||||||||||||
5.700% due 06/01/2054 | 1,300 | 1,304 | ||||||||||
6.000% due 03/01/2053 | 2,000 | 1,998 | ||||||||||
7.000% due 03/01/2053 | 500 | 498 | ||||||||||
California Infrastructure & Economic Development Bank Revenue Bonds, Series 2020 | ||||||||||||
0.000% due 01/01/2060 (c) | 5,250 | 406 | ||||||||||
4.000% due 11/01/2055 | 915 | 846 | ||||||||||
8.000% due 01/01/2050 | 1,650 | 1,715 | ||||||||||
California Municipal Finance Authority Certificates of Participation Bonds, (AGM Insured), Series 2022 | ||||||||||||
5.250% due 11/01/2052 | 1,700 | 1,807 | ||||||||||
California Municipal Finance Authority Revenue Bonds, (BAM Insured), Series 2021 | ||||||||||||
4.000% due 05/15/2046 | 700 | 691 | ||||||||||
California Municipal Finance Authority Revenue Bonds, Series 2018 | ||||||||||||
5.000% due 05/15/2043 | 500 | 514 | ||||||||||
5.000% due 06/01/2048 | 1,370 | 1,424 | ||||||||||
California Municipal Finance Authority Revenue Bonds, Series 2021 | ||||||||||||
4.000% due 09/01/2050 (e) | 1,200 | 1,016 | ||||||||||
California Municipal Finance Authority Revenue Bonds, Series 2024 | ||||||||||||
5.750% due 05/01/2054 | 235 | 241 | ||||||||||
6.000% due 01/01/2039 | 2,000 | 2,105 | ||||||||||
California Municipal Finance Authority Special Tax Bonds, Series 2024 | ||||||||||||
5.125% due 09/01/2059 | 675 | 697 | ||||||||||
California Public Finance Authority Revenue Bonds, Series 2019 | ||||||||||||
6.250% due 07/01/2054 | 2,600 | 2,743 | ||||||||||
California School Finance Authority Revenue Bonds, Series 2019 | ||||||||||||
5.000% due 07/01/2054 | 1,000 | 1,013 | ||||||||||
California State General Obligation Bonds, (AGM Insured), Series 2007 | ||||||||||||
5.250% due 08/01/2032 | 2,500 | 2,862 | ||||||||||
California State General Obligation Bonds, Series 2017 | ||||||||||||
4.000% due 11/01/2047 | 2,750 | 2,755 | ||||||||||
California State General Obligation Bonds, Series 2021 | ||||||||||||
5.000% due 09/01/2041 | 1,500 | 1,660 | ||||||||||
California State General Obligation Bonds, Series 2022 | ||||||||||||
4.000% due 09/01/2042 | 1,350 | 1,376 | ||||||||||
4.000% due 04/01/2049 | 2,250 | 2,243 | ||||||||||
California State General Obligation Bonds, Series 2023 | ||||||||||||
4.000% due 09/01/2043 | 1,800 | 1,831 | ||||||||||
California State University Revenue Bonds, Series 2015 | ||||||||||||
5.000% due 11/01/2047 | 8,000 | 8,131 | ||||||||||
California State University Revenue Bonds, Series 2023 | ||||||||||||
5.000% due 11/01/2044 | 1,000 | 1,127 | ||||||||||
California Statewide Communities Development Authority Revenue Bonds, (AGM Insured), Series 2022 | ||||||||||||
5.375% due 08/15/2057 | 1,000 | 1,082 | ||||||||||
California Statewide Communities Development Authority Revenue Bonds, (CM Insured), Series 2018 | ||||||||||||
4.000% due 07/01/2040 | 1,000 | 1,003 | ||||||||||
4.000% due 07/01/2043 | 350 | 349 | ||||||||||
4.000% due 07/01/2047 | 1,750 | 1,713 |
PRINCIPAL AMOUNT (000S) | MARKET VALUE (000S) | |||||||||||
California Statewide Communities Development Authority Revenue Bonds, Series 2016 | ||||||||||||
4.000% due 08/15/2051 | $ | 225 | $ | 219 | ||||||||
5.000% due 12/01/2046 | 5,700 | 5,741 | ||||||||||
California Statewide Communities Development Authority Revenue Bonds, Series 2018 | ||||||||||||
4.000% due 07/01/2048 | 1,000 | 1,000 | ||||||||||
5.000% due 03/01/2048 | 1,700 | 1,725 | ||||||||||
5.500% due 12/01/2058 | 1,775 | 1,820 | ||||||||||
California Statewide Communities Development Authority Revenue Bonds, Series 2019 | ||||||||||||
4.250% due 11/01/2059 | 1,785 | 1,572 | ||||||||||
California Statewide Financing Authority Revenue Bonds, Series 2002 | ||||||||||||
6.000% due 05/01/2037 | 1,910 | 1,951 | ||||||||||
Calistoga Joint Unified School District, California General Obligation Bonds, Series 2023 | ||||||||||||
5.000% due 08/01/2052 | 1,445 | 1,583 | ||||||||||
Chino Valley Unified School District, California General Obligation Bonds, Series 2020 | ||||||||||||
5.000% due 08/01/2055 | 2,000 | 2,126 | ||||||||||
Chino Valley Unified School District, California General Obligation Bonds, Series 2022 | ||||||||||||
0.000% due 08/01/2036 (c) | 1,395 | 878 | ||||||||||
0.000% due 08/01/2042 (c) | 1,500 | 692 | ||||||||||
CMFA Special Finance Agency VII, California Revenue Bonds, Series 2021 | ||||||||||||
3.000% due 08/01/2056 | 2,500 | 1,754 | ||||||||||
4.000% due 08/01/2047 | 595 | 499 | ||||||||||
CMFA Special Finance Agency, California Revenue Bonds, Series 2021 | ||||||||||||
4.000% due 08/01/2045 | 750 | 631 | ||||||||||
Colton Joint Unified School District, California General Obligation Bonds, (BAM Insured), Series 2024 | ||||||||||||
5.000% due 08/01/2049 | 1,500 | 1,646 | ||||||||||
Corona Norco Unified School District, California General Obligation Bonds, Series 2018 | ||||||||||||
4.000% due 08/01/2047 | 1,650 | 1,653 | ||||||||||
CSCDA Community Improvement Authority, California Revenue Bonds, Series 2021 | ||||||||||||
3.000% due 02/01/2057 | 500 | 362 | ||||||||||
3.400% due 10/01/2046 | 450 | 374 | ||||||||||
4.000% due 08/01/2056 | 250 | 220 | ||||||||||
4.000% due 10/01/2056 | 600 | 455 | ||||||||||
CSCDA Community Improvement Authority, California Revenue Bonds, Series 2022 | ||||||||||||
4.750% due 09/01/2062 (d) | 2,000 | 1,110 | ||||||||||
Department of Veterans Affairs Veteran’s Farm & Home Purchase Program, California Revenue Bonds, Series 2022 | ||||||||||||
4.950% due 12/01/2046 | 340 | 351 | ||||||||||
Desert Community College District, California General Obligation Bonds, Series 2024 | ||||||||||||
4.000% due 08/01/2051 | 1,250 | 1,229 | ||||||||||
El Monte City School District, California General Obligation Bonds, (BAM Insured), Series 2023 | ||||||||||||
5.000% due 08/01/2052 | 1,600 | 1,730 | ||||||||||
El Monte, California Certificates of Participation Bonds, (AMBAC Insured), Series 2001 | ||||||||||||
5.250% due 01/01/2034 | 8,170 | 8,185 | ||||||||||
Elk Grove Finance Authority, California Special Tax Bonds, Series 2016 | ||||||||||||
5.000% due 09/01/2046 | 1,000 | 1,006 | ||||||||||
Folsom Cordova Unified School District, California General Obligation Bonds, (AGM Insured), Series 2019 | ||||||||||||
4.000% due 10/01/2044 | 1,315 | 1,316 | ||||||||||
Foothill-Eastern Transportation Corridor Agency, California Revenue Bonds, Series 2014 | ||||||||||||
3.950% due 01/15/2053 | 860 | 803 | ||||||||||
Fresno Unified School District, California General Obligation Bonds, Series 2016 | ||||||||||||
4.000% due 08/01/2046 | 2,410 | 2,396 | ||||||||||
Glendale Community College District, California General Obligation Bonds, Series 2020 | ||||||||||||
4.000% due 08/01/2050 | 1,500 | 1,503 |
See Accompanying Notes | SEMIANNUAL REPORT | | | JUNE 30, 2024 | 31 |
Schedule of Investments | PIMCO California Municipal Income Fund | (Cont.) |
PRINCIPAL AMOUNT (000S) | MARKET VALUE (000S) | |||||||||||
Golden State, California Tobacco Securitization Corp. Revenue Bonds, Series 2021 | ||||||||||||
0.000% due 06/01/2066 (c) | $ | 20,500 | $ | 2,288 | ||||||||
Hacienda La Puente Unified School District, California General Obligation Bonds, Series 2017 | ||||||||||||
4.000% due 08/01/2047 | 2,000 | 1,984 | ||||||||||
Hartnell Community College District, California General Obligation Bonds, Series 2017 | ||||||||||||
4.000% due 08/01/2042 | 3,400 | 3,410 | ||||||||||
Hastings Campus Housing Finance Authority, California Revenue Bonds, Series 2020 | ||||||||||||
5.000% due 07/01/2061 | 2,000 | 1,909 | ||||||||||
Hayward Unified School District, California General Obligation Bonds, Series 2015 | ||||||||||||
5.000% due 08/01/2038 | 2,000 | 2,002 | ||||||||||
Lancaster County Hospital Authority, California Revenue Bonds, (BAM Insured), Series 2024 | ||||||||||||
4.000% due 05/01/2049 (a) | 1,350 | 1,301 | ||||||||||
Long Beach Bond Finance Authority, California General Obligation Bonds, Series 2023 | ||||||||||||
4.000% due 08/01/2053 | 2,000 | 1,997 | ||||||||||
Long Beach Bond Finance Authority, California Revenue Bonds, Series 2007 | ||||||||||||
5.500% due 11/15/2027 | 1,000 | 1,042 | ||||||||||
Los Angeles County, California Metropolitan Transportation Authority Sales Tax Revenue Bonds, Series 2021 | ||||||||||||
4.000% due 06/01/2037 | 1,750 | 1,850 | ||||||||||
Los Angeles County, California Sanitation Districts Financing Authority Revenue Bonds, Series 2016 | ||||||||||||
4.000% due 10/01/2042 | 1,500 | 1,502 | ||||||||||
Los Angeles Department of Airports, California Revenue Bonds, Series 2020 | ||||||||||||
4.000% due 05/15/2050 | 2,185 | 2,075 | ||||||||||
Los Angeles Department of Airports, California Revenue Bonds, Series 2021 | ||||||||||||
5.000% due 05/15/2048 | 2,500 | 2,704 | ||||||||||
Los Angeles Department of Water & Power Water System, California Revenue Bonds, Series 2022 | ||||||||||||
5.000% due 07/01/2052 | 1,335 | 1,452 | ||||||||||
Los Angeles Unified School District, California General Obligation Bonds, Series 2022 | ||||||||||||
5.250% due 07/01/2047 | 2,500 | 2,803 | ||||||||||
M-S-R | ||||||||||||
6.500% due 11/01/2039 | 10,345 | 13,123 | ||||||||||
Mammoth Lakes, California Certificates of Participation Bonds, (BAM Insured), Series 2024 | ||||||||||||
4.000% due 06/01/2049 (a) | 1,900 | 1,845 | ||||||||||
Manteca Unified School District, California General Obligation Bonds, Series 2020 | ||||||||||||
4.000% due 08/01/2045 | 880 | 882 | ||||||||||
Monterey Peninsula Unified School District, California General Obligation Bonds, Series 2019 | ||||||||||||
4.000% due 08/01/2040 | 3,000 | 3,020 | ||||||||||
Mount San Antonio Community College District, California General Obligation Bonds, Series 2019 | ||||||||||||
4.000% due 08/01/2049 | 2,000 | 1,963 | ||||||||||
Mount San Jacinto Community College District, California General Obligation Bonds, Series 2018 | ||||||||||||
4.000% due 08/01/2043 | 2,650 | 2,657 | ||||||||||
Norwalk-La Mirada Unified School District, California General Obligation Bonds, Series 2019 | ||||||||||||
4.000% due 08/01/2048 | 2,550 | 2,542 | ||||||||||
Oceanside Unified School District, California General Obligation Bonds, Series 2022 | ||||||||||||
4.000% due 08/01/2041 | 1,020 | 1,034 | ||||||||||
Ontario International Airport Authority, California Revenue Bonds, (AGM Insured), Series 2021 | ||||||||||||
4.000% due 05/15/2051 | 500 | 497 | ||||||||||
Ontario Montclair School District, California General Obligation Bonds, Series 2017 | ||||||||||||
5.000% due 08/01/2046 | 1,650 | 1,712 | ||||||||||
Orange County, California Community Facilities District Special Tax Bonds, Series 2022 | ||||||||||||
5.000% due 08/15/2052 | 1,275 | 1,302 |
PRINCIPAL AMOUNT (000S) | MARKET VALUE (000S) | |||||||||||
Pacifica School District, California General Obligation Bonds, Series 2018 | ||||||||||||
4.000% due 08/01/2048 | $ | 1,750 | $ | 1,739 | ||||||||
Palm Springs Unified School District, California General Obligation Bonds, Series 2024 | ||||||||||||
4.000% due 08/01/2049 | 1,300 | 1,284 | ||||||||||
Redwood City School District, California General Obligation Bonds, Series 2023 | ||||||||||||
5.000% due 08/01/2052 | 1,900 | 2,087 | ||||||||||
Richmond, California Wastewater Revenue Bonds, Series 2019 | ||||||||||||
4.000% due 08/01/2049 | 1,350 | 1,353 | ||||||||||
Rio Hondo Community College District, California General Obligation Bonds, Series 2022 | ||||||||||||
0.000% due 08/01/2045 (c) | 1,650 | 610 | ||||||||||
River Islands Public Financing Authority, California Special Tax Bonds, Series 2024 | ||||||||||||
5.000% due 09/01/2054 (a) | 350 | 353 | ||||||||||
River Islands Public Financing Authority, California Special Tax, (AGM Insured), Series 2022 | ||||||||||||
4.250% due 09/01/2047 | 1,000 | 1,008 | ||||||||||
Riverside County, California Transportation Commission Revenue Bonds, Series 2013 | ||||||||||||
0.000% due 06/01/2042 (c) | 1,000 | 457 | ||||||||||
Riverside County, California Transportation Commission Revenue Bonds, Series 2021 | ||||||||||||
4.000% due 06/01/2038 | 1,125 | 1,134 | ||||||||||
4.000% due 06/01/2047 | 1,500 | 1,437 | ||||||||||
Riverside, California Electric Revenue Bonds, Series 2024 | ||||||||||||
5.000% due 10/01/2049 | 2,500 | 2,782 | ||||||||||
Riverside, California Sewer Revenue Bonds, Series 2018 | ||||||||||||
4.000% due 08/01/2038 | 4,250 | 4,283 | ||||||||||
Sacramento City Unified School District, California General Obligation Bonds, (AGM Insured), Series 2021 | ||||||||||||
4.000% due 08/01/2049 | 1,400 | 1,361 | ||||||||||
Sacramento County, California Special Tax Bonds, Series 2022 | ||||||||||||
5.000% due 09/01/2042 | 1,650 | 1,720 | ||||||||||
5.000% due 09/01/2047 | 450 | 462 | ||||||||||
Sacramento Municipal Utility District, California Revenue Bonds, Series 2023 | ||||||||||||
5.000% due 08/15/2048 | 500 | 554 | ||||||||||
Sacramento, California Special Tax Bonds, Series 2021 | ||||||||||||
4.000% due 09/01/2050 | 1,500 | 1,303 | ||||||||||
San Bernardino Community College District, California General Obligation Bonds, Series 2023 | ||||||||||||
5.000% due 08/01/2049 | 3,300 | 3,591 | ||||||||||
San Diego County, California Certificates of Participation Bonds, Series 2023 | ||||||||||||
5.000% due 10/01/2053 | 3,350 | 3,670 | ||||||||||
San Diego County, California Regional Airport Authority Revenue Bonds, Series 2021 | ||||||||||||
4.000% due 07/01/2051 | 2,750 | 2,608 | ||||||||||
5.000% due 07/01/2051 | 2,215 | 2,301 | ||||||||||
San Diego Housing Authority, Inc., California Revenue Bonds, (FHLMC Insured), Series 2024 | ||||||||||||
4.200% due 06/01/2040 | 2,000 | 2,008 | ||||||||||
San Diego Public Facilities Financing Authority, California Revenue Bonds, Series 2022 | ||||||||||||
5.000% due 05/15/2047 | 1,000 | 1,102 | ||||||||||
San Diego Unified School District, California General Obligation Bonds, Series 2020 | ||||||||||||
4.000% due 07/01/2050 | 1,000 | 980 | ||||||||||
San Diego Unified School District, California General Obligation Bonds, Series 2023 | ||||||||||||
4.000% due 07/01/2053 | 4,500 | 4,389 | ||||||||||
5.000% due 07/01/2048 | 1,000 | 1,106 | ||||||||||
San Francisco, California City & County Airport Comm-San Francisco International Airport Revenue Bonds, Series 2019 | ||||||||||||
5.000% due 05/01/2049 | 2,000 | 2,098 | ||||||||||
5.000% due 05/01/2050 | 1,900 | 1,991 |
PRINCIPAL AMOUNT (000S) | MARKET VALUE (000S) | |||||||||||
San Francisco, California City & County Public Utilities Commission Power Revenue Bonds, Series 2023 | ||||||||||||
5.000% due 11/01/2048 | $ | 1,700 | $ | 1,866 | ||||||||
San Francisco, California Public Utilities Commission Water Revenue Bonds, Series 2016 | ||||||||||||
4.000% due 11/01/2039 | 825 | 825 | ||||||||||
San Francisco, California Public Utilities Commission Water Revenue Bonds, Series 2020 | ||||||||||||
5.000% due 11/01/2050 | 1,100 | 1,182 | ||||||||||
San Francisco, California Public Utilities Commission Water Revenue Bonds, Series 2023 | ||||||||||||
5.250% due 11/01/2052 | 1,250 | 1,406 | ||||||||||
San Jose Financing Authority, California Revenue Bonds, Series 2022 | ||||||||||||
5.000% due 11/01/2052 | 1,700 | 1,867 | ||||||||||
San Juan Unified School District, California General Obligation Bonds, Series 2024 | ||||||||||||
4.000% due 08/01/2049 | 1,700 | 1,687 | ||||||||||
San Mateo County, California Community College District General Obligation Bonds, (NPFGC Insured), Series 2006 | ||||||||||||
0.000% due 09/01/2034 (c) | 3,000 | 2,113 | ||||||||||
San Mateo Joint Powers Financing Authority, California Revenue Bonds, Series 2018 | ||||||||||||
4.000% due 07/15/2052 | 1,650 | 1,654 | ||||||||||
Santa Clarita Community College District, California General Obligation Bonds, Series 2016 | ||||||||||||
4.000% due 08/01/2046 | 2,000 | 1,960 | ||||||||||
Santa Monica, California Community College District General Obligation Bonds, Series 2022 | ||||||||||||
4.000% due 08/01/2045 | 1,190 | 1,206 | ||||||||||
Silicon Valley Tobacco Securitization Authority, California Revenue Bonds, Series 2007 | ||||||||||||
0.000% due 06/01/2036 (c) | 1,000 | 522 | ||||||||||
South San Francisco Unified School District, California General Obligation Bonds, Series 2023 | ||||||||||||
4.000% due 09/01/2052 | 1,000 | 1,000 | ||||||||||
Southwestern Community College District, California General Obligation Bonds, Series 2021 | ||||||||||||
4.000% due 08/01/2046 | 4,300 | 4,313 | ||||||||||
State Center Community College District, California General Obligation Bonds, Series 2022 | ||||||||||||
5.000% due 08/01/2047 | 1,690 | 1,859 | ||||||||||
Sweetwater Union High School District, California General Obligation Bonds, Series 2022 | ||||||||||||
5.000% due 08/01/2052 | 2,025 | 2,187 | ||||||||||
Tobacco Securitization Authority of Northern California Revenue Bonds, Series 2021 | ||||||||||||
0.000% due 06/01/2060 (c) | 15,900 | 2,605 | ||||||||||
Tobacco Securitization Authority of Southern California Revenue Bonds, Series 2006 | ||||||||||||
0.000% due 06/01/2046 (c) | 4,000 | 756 | ||||||||||
Tobacco Securitization Authority of Southern California Revenue Bonds, Series 2019 | ||||||||||||
5.000% due 06/01/2048 | 1,750 | 1,797 | ||||||||||
University of California Revenue Bonds, Series 2018 | ||||||||||||
5.000% due 05/15/2048 | 5,000 | 5,247 | ||||||||||
University of California Revenue Bonds, Series 2022 | ||||||||||||
5.000% due 05/15/2052 | 5,100 | 5,550 | ||||||||||
Upland, California Certificates of Participation Bonds, Series 2017 | ||||||||||||
4.000% due 01/01/2042 | 3,250 | 2,951 | ||||||||||
Victor Valley Community College District, California General Obligation Bonds, Series 2024 | ||||||||||||
5.000% due 08/01/2051 | 660 | 719 | ||||||||||
Washington Township Health Care District, California General Obligation Bonds, Series 2015 | ||||||||||||
4.000% due 08/01/2045 | 2,500 | 2,452 | ||||||||||
Washington Township Health Care District, California General Obligation Bonds, Series 2023 | ||||||||||||
5.500% due 08/01/2053 | 1,350 | 1,505 | ||||||||||
West Valley-Mission Community College District, California General Obligation Bonds, Series 2022 | ||||||||||||
4.000% due 08/01/2047 | 2,000 | 1,998 | ||||||||||
300,122 | ||||||||||||
32 | PIMCO CLOSED-END FUNDS | See Accompanying Notes |
June 30, 2024 | (Unaudited) |
PRINCIPAL AMOUNT (000S) | MARKET VALUE (000S) | |||||||||||
DELAWARE 1.4% | ||||||||||||
Affordable Housing Opportunities Trust, Delaware Revenue Bonds, Series 2022 | ||||||||||||
3.167% due 10/01/2038 | $ | 2,715 | $ | 2,327 | ||||||||
7.120% due 10/01/2038 | 480 | 462 | ||||||||||
2,789 | ||||||||||||
ILLINOIS 3.3% | ||||||||||||
Chicago, Illinois General Obligation Bonds, Series 2007 | ||||||||||||
5.500% due 01/01/2042 | 2,000 | 2,005 | ||||||||||
Chicago, Illinois General Obligation Bonds, Series 2017 | ||||||||||||
6.000% due 01/01/2038 | 1,500 | 1,561 | ||||||||||
Illinois State General Obligation Bonds, Series 2020 | ||||||||||||
4.125% due 10/01/2036 | 2,000 | 2,029 | ||||||||||
Illinois State General Obligation Notes, Series 2017 | ||||||||||||
5.000% due 11/01/2027 | 1,000 | 1,046 | ||||||||||
6,641 | ||||||||||||
NEW HAMPSHIRE 1.0% | ||||||||||||
New Hampshire Business Finance Authority Revenue Bonds, Series 2023 | ||||||||||||
4.817% due 12/20/2036 | 1,968 | 1,989 | ||||||||||
NEW YORK 0.3% | ||||||||||||
New York Power Authority Revenue Bonds, Series 2020 | ||||||||||||
4.000% due 11/15/2055 | 525 | 505 | ||||||||||
NORTH DAKOTA 0.0% | ||||||||||||
Grand Forks County, North Dakota Revenue Bonds, Series 2021 | ||||||||||||
7.000% due 12/15/2043 ^(b) | 650 | 19 | ||||||||||
PRINCIPAL AMOUNT (000S) | MARKET VALUE (000S) | |||||||||||
PENNSYLVANIA 0.7% | ||||||||||||
Pennsylvania Economic Development Financing Authority Revenue Bonds, Series 2021 | ||||||||||||
9.000% due 04/01/2051 | $ | 1,170 | $ | 1,287 | ||||||||
PUERTO RICO 8.6% | ||||||||||||
Children’s Trust Fund, Puerto Rico Revenue Bonds, Series 2008 | ||||||||||||
0.000% due 05/15/2057 (c) | 20,400 | 1,420 | ||||||||||
Commonwealth of Puerto Rico Bonds, Series 2022 | ||||||||||||
0.000% due 11/01/2043 | 2,164 | 1,328 | ||||||||||
0.000% due 11/01/2051 | 2,586 | 1,504 | ||||||||||
Commonwealth of Puerto Rico General Obligation Bonds, Series 2021 | ||||||||||||
0.000% due 07/01/2033 (c) | 1,250 | 836 | ||||||||||
4.000% due 07/01/2041 | 1,200 | 1,122 | ||||||||||
Puerto Rico Sales Tax Financing Corp. Sales Tax Revenue Bonds, Series 2018 | ||||||||||||
0.000% due 07/01/2051 (c) | 25,500 | 6,000 | ||||||||||
Puerto Rico Sales Tax Financing Corp. Sales Tax Revenue Bonds, Series 2019 | ||||||||||||
4.784% due 07/01/2058 | 4,951 | 4,897 | ||||||||||
17,107 | ||||||||||||
TEXAS 0.5% | ||||||||||||
Angelina & Neches River Authority, Texas Revenue Bonds, Series 2021 | ||||||||||||
7.500% due 12/01/2045 | 460 | 311 | ||||||||||
12.000% due 12/01/2045 | 800 | 704 | ||||||||||
1,015 | ||||||||||||
PRINCIPAL AMOUNT (000S) | MARKET VALUE (000S) | |||||||||||
VIRGINIA 0.5% | ||||||||||||
Virginia Small Business Financing Authority Revenue Bonds, Series 2019 | ||||||||||||
0.000% due 07/01/2061 (c) | $ | 17,000 | $ | 546 | ||||||||
5.500% due 07/01/2044 | 500 | 457 | ||||||||||
1,003 | ||||||||||||
Total Municipal Bonds & Notes (Cost $331,057) | 332,528 | |||||||||||
U.S. GOVERNMENT AGENCIES 1.9% | ||||||||||||
Freddie Mac | ||||||||||||
3.720% due 01/01/2041 | 1,993 | 1,864 | ||||||||||
3.850% due 02/01/2038 | 1,997 | 1,912 | ||||||||||
Total U.S. Government Agencies (Cost $3,714) | 3,776 | |||||||||||
Total Investments in Securities (Cost $334,771) | 336,304 | |||||||||||
Total Investments 169.3% (Cost $334,771) | $ | 336,304 | ||||||||||
Auction Rate Preferred Shares (0.3)% | (600 | ) | ||||||||||
Remarketable Variable Rate MuniFund Term Preferred Shares, at liquidation value (68.6)% | (136,258 | ) | ||||||||||
Other Assets and Liabilities, net (0.4)% | (756 | ) | ||||||||||
Net Assets Applicable to Common Shareholders 100.0% | $ | 198,690 | ||||||||||
* | A zero balance may reflect actual amounts rounding to less than one thousand. |
^ | Security is in default. |
(a) | When-issued security. |
(b) | Security is not accruing income as of the date of this report. |
(c) | Zero coupon security. |
(d) | Security becomes interest bearing at a future date. |
Issuer Description | Coupon | Maturity Date | Acquisition Date | Cost | Market Value | Market Value as Percentage of Net Assets Applicable to Common Shareholders | ||||||||||||||||
California Municipal Finance Authority Revenue Bonds, Series 2021 | 4.000% | 09/01/2050 | 08/03/2022 | $ 1,089 | $ | 1,016 | 0.51% | |||||||||||||||
See Accompanying Notes | SEMIANNUAL REPORT | | | JUNE 30, 2024 | 33 |
Schedule of Investments | PIMCO California Municipal Income Fund | (Cont.) | June 30, 2024 | (Unaudited) |
Category and Subcategory | Level 1 | Level 2 | Level 3 | Fair Value at 06/30/2024 | ||||||||||||
Investments in Securities, at Value | ||||||||||||||||
Municipal Bonds & Notes | ||||||||||||||||
Arizona | $ | 0 | $ | 51 | $ | 0 | $ | 51 | ||||||||
California | 0 | 300,122 | 0 | 300,122 | ||||||||||||
Delaware | 0 | 2,789 | 0 | 2,789 | ||||||||||||
Illinois | 0 | 6,641 | 0 | 6,641 | ||||||||||||
New Hampshire | 0 | 1,989 | 0 | 1,989 | ||||||||||||
New York | 0 | 505 | 0 | 505 |
Category and Subcategory | Level 1 | Level 2 | Level 3 | Fair Value at 06/30/2024 | ||||||||||||
North Dakota | $ | 0 | $ | 19 | $ | 0 | $ | 19 | ||||||||
Pennsylvania | 0 | 1,287 | 0 | 1,287 | ||||||||||||
Puerto Rico | 0 | 17,107 | 0 | 17,107 | ||||||||||||
Texas | 0 | 1,015 | 0 | 1,015 | ||||||||||||
Virginia | 0 | 1,003 | 0 | 1,003 | ||||||||||||
U.S. Government Agencies | 0 | 3,776 | 0 | 3,776 | ||||||||||||
Total Investments | $ | 0 | $ | 336,304 | $ | 0 | $ | 336,304 | ||||||||
34 | PIMCO CLOSED-END FUNDS | See Accompanying Notes |
Schedule of Investments | PIMCO California Municipal Income Fund II | June 30, 2024 | (Unaudited) |
PRINCIPAL AMOUNT (000S) | MARKET VALUE (000S) | |||||||||||
INVESTMENTS IN SECURITIES 169.2% | ||||||||||||
MUNICIPAL BONDS & NOTES 167.0% | ||||||||||||
ARIZONA 0.0% | ||||||||||||
Arizona Industrial Development Authority Revenue Bonds, Series 2020 | ||||||||||||
7.750% due 07/01/2050 ^(b) | $ | 940 | $ | 56 | ||||||||
CALIFORNIA 151.5% | ||||||||||||
Alameda Corridor Transportation Authority, California Revenue Bonds, (AGM Insured), Series 2024 | ||||||||||||
0.000% due 10/01/2052 (c) | 2,400 | 633 | ||||||||||
Alameda Corridor Transportation Authority, California Revenue Bonds, Series 2022 | ||||||||||||
5.375% due 10/01/2049 (d) | 3,085 | 1,738 | ||||||||||
Alameda Unified School District-Alameda County, California General Obligation Bonds, Series 2024 | ||||||||||||
5.000% due 08/01/2049 | 900 | 1,001 | ||||||||||
Anaheim City School District, California General Obligation Bonds, (BAM Insured), Series 2023 | ||||||||||||
4.250% due 08/01/2050 | 2,700 | 2,717 | ||||||||||
Antelope Valley Community College District, California General Obligation Bonds, Series 2022 | ||||||||||||
0.000% due 08/01/2047 (c) | 720 | 225 | ||||||||||
Bay Area Toll Authority, California Revenue Bonds, Series 2014 | ||||||||||||
5.000% due 10/01/2054 | 3,000 | 3,011 | ||||||||||
Bay Area Toll Authority, California Revenue Bonds, Series 2017 | ||||||||||||
4.000% due 04/01/2047 | 3,000 | 2,950 | ||||||||||
Bay Area Toll Authority, California Revenue Bonds, Series 2023 | ||||||||||||
4.125% due 04/01/2054 | 1,800 | 1,800 | ||||||||||
Butte-Glenn Community College District, California General Obligation Bonds, Series 2022 | ||||||||||||
4.000% due 08/01/2047 | 1,600 | 1,592 | ||||||||||
California Community Choice Financing Authority Revenue Bonds, Series 2023 | ||||||||||||
5.250% due 11/01/2054 | 2,000 | 2,138 | ||||||||||
California Community Housing Agency Revenue Bonds, Series 2019 | ||||||||||||
5.000% due 04/01/2049 | 1,700 | 1,484 | ||||||||||
California Community Housing Agency Revenue Bonds, Series 2021 | ||||||||||||
4.000% due 02/01/2056 | 1,000 | 825 | ||||||||||
California Community Housing Agency Revenue Bonds, Series 2022 | ||||||||||||
4.500% due 08/01/2052 | 1,000 | 869 | ||||||||||
California County Tobacco Securitization Agency Revenue Bonds, Series 2002 | ||||||||||||
5.875% due 06/01/2043 | 660 | 664 | ||||||||||
6.125% due 06/01/2038 | 1,000 | 1,001 | ||||||||||
California County Tobacco Securitization Agency Revenue Bonds, Series 2007 | ||||||||||||
0.000% due 06/01/2057 (c) | 9,000 | 1,393 | ||||||||||
California County Tobacco Securitization Agency Revenue Bonds, Series 2020 | ||||||||||||
0.000% due 06/01/2055 (c) | 5,100 | 927 | ||||||||||
California Educational Facilities Authority Revenue Bonds, Series 2018 | ||||||||||||
5.000% due 10/01/2043 | 1,300 | 1,358 | ||||||||||
5.000% due 10/01/2048 | 1,320 | 1,368 | ||||||||||
California Health Facilities Financing Authority Revenue Bonds, Series 2015 | ||||||||||||
5.000% due 08/15/2054 | 5,000 | 5,060 | ||||||||||
California Health Facilities Financing Authority Revenue Bonds, Series 2016 | ||||||||||||
5.000% due 08/15/2055 | 6,275 | 6,375 | ||||||||||
California Health Facilities Financing Authority Revenue Bonds, Series 2017 | ||||||||||||
4.000% due 11/01/2038 | 1,500 | 1,496 | ||||||||||
4.000% due 11/01/2044 | 1,000 | 990 | ||||||||||
4.000% due 11/01/2051 | 2,750 | 2,654 |
PRINCIPAL AMOUNT (000S) | MARKET VALUE (000S) | |||||||||||
California Health Facilities Financing Authority Revenue Bonds, Series 2021 | ||||||||||||
4.000% due 08/15/2048 | $ | 1,200 | $ | 1,162 | ||||||||
California Health Facilities Financing Authority Revenue Bonds, Series 2024 | ||||||||||||
5.000% due 11/15/2044 | 1,800 | 2,005 | ||||||||||
California Housing Finance Agency Revenue Bonds, (FNMA Insured), Series 2024 | ||||||||||||
4.330% due 02/01/2042 | 1,000 | 1,005 | ||||||||||
California Housing Finance Agency Revenue Bonds, Series 2024 | ||||||||||||
5.970% due 11/01/2053 | 2,000 | 2,000 | ||||||||||
California Housing Finance Revenue Bonds, Series 2024 | ||||||||||||
5.700% due 06/01/2054 | 1,400 | 1,404 | ||||||||||
6.000% due 03/01/2053 | 2,100 | 2,098 | ||||||||||
7.000% due 03/01/2053 | 500 | 498 | ||||||||||
California Infrastructure & Economic Development Bank Revenue Bonds, Series 2020 | ||||||||||||
0.000% due 01/01/2060 (c) | 6,250 | 483 | ||||||||||
4.000% due 11/01/2045 | 850 | 826 | ||||||||||
8.000% due 01/01/2050 | 1,900 | 1,975 | ||||||||||
California Municipal Finance Authority Certificates of Participation Bonds, (AGM Insured), Series 2022 | ||||||||||||
5.250% due 11/01/2052 | 1,800 | 1,913 | ||||||||||
California Municipal Finance Authority Revenue Bonds, (BAM Insured), Series 2021 | ||||||||||||
4.000% due 05/15/2041 | 500 | 500 | ||||||||||
California Municipal Finance Authority Revenue Bonds, Series 2018 | ||||||||||||
5.000% due 05/15/2043 | 1,000 | 1,027 | ||||||||||
California Municipal Finance Authority Revenue Bonds, Series 2021 | ||||||||||||
4.000% due 09/01/2050 (e) | 1,500 | 1,269 | ||||||||||
California Municipal Finance Authority Revenue Bonds, Series 2024 | ||||||||||||
5.875% due 05/01/2059 | 390 | 402 | ||||||||||
6.000% due 01/01/2039 | 2,000 | 2,105 | ||||||||||
California Municipal Finance Authority Special Tax Bonds, Series 2024 | ||||||||||||
5.000% due 09/01/2054 | 825 | 844 | ||||||||||
California Public Finance Authority Revenue Bonds, Series 2019 | ||||||||||||
6.250% due 07/01/2054 | 2,900 | 3,060 | ||||||||||
California State General Obligation Bonds, Series 2017 | ||||||||||||
4.000% due 11/01/2047 | 3,250 | 3,256 | ||||||||||
California State General Obligation Bonds, Series 2018 | ||||||||||||
4.000% due 10/01/2039 | 4,500 | 4,510 | ||||||||||
California State General Obligation Bonds, Series 2020 | ||||||||||||
4.000% due 11/01/2040 | 1,500 | 1,528 | ||||||||||
California State General Obligation Bonds, Series 2022 | ||||||||||||
4.000% due 09/01/2042 | 1,500 | 1,529 | ||||||||||
California State General Obligation Bonds, Series 2023 | ||||||||||||
4.000% due 09/01/2043 | 2,000 | 2,035 | ||||||||||
California State University Revenue Bonds, Series 2015 | ||||||||||||
5.000% due 11/01/2047 | 5,000 | 5,082 | ||||||||||
California State University Revenue Bonds, Series 2023 | ||||||||||||
5.000% due 11/01/2044 | 1,000 | 1,127 | ||||||||||
California Statewide Communities Development Authority Revenue Bonds, (AGM Insured), Series 2022 | ||||||||||||
5.375% due 08/15/2057 | 1,100 | 1,190 | ||||||||||
California Statewide Communities Development Authority Revenue Bonds, (CM Insured), Series 2018 | ||||||||||||
4.000% due 07/01/2043 | 1,350 | 1,346 | ||||||||||
California Statewide Communities Development Authority Revenue Bonds, Series 2016 | ||||||||||||
4.000% due 08/15/2051 | 225 | 219 | ||||||||||
5.000% due 06/01/2046 | 2,000 | 2,008 | ||||||||||
5.000% due 12/01/2046 | 2,600 | 2,619 | ||||||||||
5.250% due 12/01/2056 | 3,550 | 3,578 | ||||||||||
California Statewide Communities Development Authority Revenue Bonds, Series 2018 | ||||||||||||
4.000% due 07/01/2048 | 1,000 | 1,000 | ||||||||||
4.000% due 12/01/2053 | 230 | 215 | ||||||||||
4.000% due 12/01/2057 | 2,000 | 1,849 |
PRINCIPAL AMOUNT (000S) | MARKET VALUE (000S) | |||||||||||
5.000% due 03/01/2048 | $ | 2,800 | $ | 2,841 | ||||||||
5.500% due 12/01/2058 | 2,200 | 2,255 | ||||||||||
California Statewide Communities Development Authority Revenue Bonds, Series 2019 | ||||||||||||
4.250% due 11/01/2059 | 1,985 | 1,748 | ||||||||||
California Statewide Financing Authority Revenue Bonds, Series 2002 | ||||||||||||
6.000% due 05/01/2037 | 1,275 | 1,302 | ||||||||||
Calistoga Joint Unified School District, California General Obligation Bonds, Series 2023 | ||||||||||||
5.000% due 08/01/2052 | 1,565 | 1,714 | ||||||||||
Chino Valley Unified School District, California General Obligation Bonds, Series 2020 | ||||||||||||
5.000% due 08/01/2055 | 2,000 | 2,126 | ||||||||||
Chino Valley Unified School District, California General Obligation Bonds, Series 2022 | ||||||||||||
0.000% due 08/01/2037 (c) | 1,000 | 599 | ||||||||||
0.000% due 08/01/2040 (c) | 1,400 | 714 | ||||||||||
0.000% due 08/01/2043 (c) | 1,750 | 768 | ||||||||||
0.000% due 08/01/2044 (c) | 1,405 | 587 | ||||||||||
City of California, Eureka City Schools, General Obligation Bonds, (BAM Insured), Series 2020 | ||||||||||||
4.000% due 08/01/2049 | 3,000 | 2,982 | ||||||||||
CMFA Special Finance Agency VII, California Revenue Bonds, Series 2021 | ||||||||||||
3.000% due 08/01/2056 | 1,000 | 702 | ||||||||||
4.000% due 08/01/2047 | 595 | 499 | ||||||||||
CMFA Special Finance Agency, California Revenue Bonds, Series 2021 | ||||||||||||
4.000% due 08/01/2045 | 750 | 631 | ||||||||||
Colton Joint Unified School District, California General Obligation Bonds, (BAM Insured), Series 2024 | ||||||||||||
5.000% due 08/01/2049 | 1,500 | 1,646 | ||||||||||
Corona Norco Unified School District, California General Obligation Bonds, Series 2018 | ||||||||||||
4.000% due 08/01/2047 | 1,790 | 1,794 | ||||||||||
CSCDA Community Improvement Authority, California Revenue Bonds, Series 2021 | ||||||||||||
3.000% due 02/01/2057 | 500 | 362 | ||||||||||
3.400% due 10/01/2046 | 445 | 369 | ||||||||||
4.000% due 08/01/2056 | 250 | 220 | ||||||||||
4.000% due 10/01/2056 | 550 | 417 | ||||||||||
CSCDA Community Improvement Authority, California Revenue Bonds, Series 2022 | ||||||||||||
4.750% due 09/01/2062 (d) | 2,200 | 1,221 | ||||||||||
Department of Veterans Affairs Veteran’s Farm & Home Purchase Program, California Revenue Bonds, Series 2022 | ||||||||||||
4.950% due 12/01/2046 | 360 | 371 | ||||||||||
Desert Community College District, California General Obligation Bonds, Series 2024 | ||||||||||||
4.000% due 08/01/2051 | 1,400 | 1,376 | ||||||||||
East Bay Municipal Utility District Water System, California Revenue Bonds, Series 2024 | ||||||||||||
5.000% due 06/01/2043 | 700 | 799 | ||||||||||
El Monte City School District, California General Obligation Bonds, (BAM Insured), Series 2023 | ||||||||||||
5.000% due 08/01/2052 | 1,635 | 1,768 | ||||||||||
Elk Grove Finance Authority, California Special Tax Bonds, Series 2016 | ||||||||||||
5.000% due 09/01/2046 | 1,670 | 1,680 | ||||||||||
Folsom Cordova Unified School District, California General Obligation Bonds, (AGM Insured), Series 2019 | ||||||||||||
4.000% due 10/01/2044 | 1,415 | 1,416 | ||||||||||
Foothill-Eastern Transportation Corridor Agency, California Revenue Bonds, Series 2014 | ||||||||||||
3.950% due 01/15/2053 | 920 | 859 | ||||||||||
Fremont Community Facilities District No. 1, California Special Tax Bonds, Series 2015 | ||||||||||||
5.000% due 09/01/2045 | 1,400 | 1,408 | ||||||||||
Fresno Unified School District, California General Obligation Bonds, Series 2016 | ||||||||||||
4.000% due 08/01/2046 | 2,605 | 2,590 | ||||||||||
Golden State, California Tobacco Securitization Corp. Revenue Bonds, Series 2021 | ||||||||||||
0.000% due 06/01/2066 (c) | 20,000 | 2,232 |
See Accompanying Notes | SEMIANNUAL REPORT | | | JUNE 30, 2024 | 35 |
Schedule of Investments | PIMCO California Municipal Income Fund II | (Cont.) |
PRINCIPAL AMOUNT (000S) | MARKET VALUE (000S) | |||||||||||
Hacienda La Puente Unified School District, California General Obligation Bonds, Series 2017 | ||||||||||||
4.000% due 08/01/2047 | $ | 3,000 | $ | 2,976 | ||||||||
Hartnell Community College District, California General Obligation Bonds, Series 2017 | ||||||||||||
4.000% due 08/01/2042 | 3,500 | 3,510 | ||||||||||
Hastings Campus Housing Finance Authority, California Revenue Bonds, Series 2020 | ||||||||||||
5.000% due 07/01/2061 | 2,650 | 2,530 | ||||||||||
Hayward Unified School District, California General Obligation Bonds, Series 2015 | ||||||||||||
5.000% due 08/01/2038 | 3,000 | 3,003 | ||||||||||
Lancaster County Hospital Authority, California Revenue Bonds, (BAM Insured), Series 2024 | ||||||||||||
4.000% due 05/01/2049 (a) | 1,450 | 1,398 | ||||||||||
Long Beach Bond Finance Authority, California General Obligation Bonds, Series 2023 | ||||||||||||
4.000% due 08/01/2053 | 2,000 | 1,997 | ||||||||||
Long Beach Bond Finance Authority, California Revenue Bonds, Series 2007 | ||||||||||||
5.500% due 11/15/2037 | 7,500 | 8,519 | ||||||||||
Los Angeles County, California Facilities, Inc., Revenue Bonds, Series 2018 | ||||||||||||
4.000% due 12/01/2048 | 2,500 | 2,497 | ||||||||||
Los Angeles County, California Metropolitan Transportation Authority Sales Tax Revenue Bonds, Series 2021 | ||||||||||||
4.000% due 06/01/2037 | 2,000 | 2,114 | ||||||||||
Los Angeles County, California Sanitation Districts Financing Authority Revenue Bonds, Series 2016 | ||||||||||||
4.000% due 10/01/2042 | 2,000 | 2,003 | ||||||||||
Los Angeles Department of Airports, California Revenue Bonds, Series 2021 | ||||||||||||
5.000% due 05/15/2048 | 2,500 | 2,704 | ||||||||||
Los Angeles Department of Water & Power Water System, California Revenue Bonds, Series 2022 | ||||||||||||
5.000% due 07/01/2052 | 1,475 | 1,605 | ||||||||||
M-S-R | ||||||||||||
6.500% due 11/01/2039 | 7,810 | 9,907 | ||||||||||
7.000% due 11/01/2034 | 1,000 | 1,224 | ||||||||||
Mammoth Lakes, California Certificates of Participation Bonds, (BAM Insured),Series 2024 | ||||||||||||
4.000% due 06/01/2049 (a) | 2,100 | 2,039 | ||||||||||
Mount San Antonio Community College District, California General Obligation Bonds, Series 2019 | ||||||||||||
4.000% due 08/01/2049 | 2,200 | 2,160 | ||||||||||
Mount San Jacinto Community College District, California General Obligation Bonds, Series 2018 | ||||||||||||
4.000% due 08/01/2043 | 2,200 | 2,206 | ||||||||||
Norwalk-La Mirada Unified School District, California General Obligation Bonds, Series 2019 | ||||||||||||
4.000% due 08/01/2048 | 2,750 | 2,741 | ||||||||||
Ontario International Airport Authority, California Revenue Bonds, (AGM Insured), Series 2021 | ||||||||||||
4.000% due 05/15/2051 | 500 | 497 | ||||||||||
Ontario Montclair School District, California General Obligation Bonds, Series 2017 | ||||||||||||
5.000% due 08/01/2046 | 1,825 | 1,893 | ||||||||||
Orange County, California Community Facilities District Special Tax Bonds, Series 2022 | ||||||||||||
5.000% due 08/15/2052 | 1,360 | 1,389 | ||||||||||
Pacifica School District, California General Obligation Bonds, Series 2018 | ||||||||||||
4.000% due 08/01/2048 | 2,000 | 1,988 | ||||||||||
Palm Springs Unified School District, California General Obligation Bonds, Series 2024 | ||||||||||||
4.000% due 08/01/2049 | 1,500 | 1,482 | ||||||||||
Poway Unified School District, California General Obligation Bonds, Series 2011 | ||||||||||||
0.000% due 08/01/2040 (c) | 11,000 | 5,826 | ||||||||||
0.000% due 08/01/2046 (c) | 16,000 | 5,862 | ||||||||||
Redwood City School District, California General Obligation Bonds, Series 2023 | ||||||||||||
5.000% due 08/01/2052 | 2,140 | 2,351 |
PRINCIPAL AMOUNT (000S) | MARKET VALUE (000S) | |||||||||||
Richmond, California Wastewater Revenue Bonds, Series 2019 | ||||||||||||
4.000% due 08/01/2049 | $ | 1,460 | $ | 1,463 | ||||||||
Rio Hondo Community College District, California General Obligation Bonds, Series 2022 | ||||||||||||
0.000% due 08/01/2045 (c) | 1,850 | 684 | ||||||||||
River Islands Public Financing Authority, California Special Tax Bonds, Series 2024 | ||||||||||||
5.000% due 09/01/2054 (a) | 375 | 378 | ||||||||||
River Islands Public Financing Authority, California Special Tax, (AGM Insured), Series 2022 | ||||||||||||
4.250% due 09/01/2047 | 1,100 | 1,109 | ||||||||||
Riverside County, California Transportation Commission Revenue Bonds, Series 2013 | ||||||||||||
0.000% due 06/01/2042 (c) | 1,000 | 457 | ||||||||||
Riverside County, California Transportation Commission Revenue Bonds, Series 2021 | ||||||||||||
4.000% due 06/01/2047 | 2,185 | 2,093 | ||||||||||
Riverside, California Electric Revenue Bonds, Series 2024 | ||||||||||||
5.000% due 10/01/2049 | 2,800 | 3,116 | ||||||||||
Riverside, California Sewer Revenue Bonds, Series 2018 | ||||||||||||
4.000% due 08/01/2038 | 3,500 | 3,527 | ||||||||||
Sacramento City Unified School District, California General Obligation Bonds, (AGM Insured), Series 2021 | ||||||||||||
4.000% due 08/01/2049 | 1,500 | 1,459 | ||||||||||
Sacramento County, California Special Tax Bonds, Series 2022 | ||||||||||||
5.000% due 09/01/2042 | 1,800 | 1,877 | ||||||||||
5.000% due 09/01/2047 | 500 | 513 | ||||||||||
Sacramento Municipal Utility District, California Revenue Bonds, Series 2023 | ||||||||||||
5.000% due 08/15/2048 | 500 | 554 | ||||||||||
San Bernardino Community College District, California General Obligation Bonds, Series 2023 | ||||||||||||
5.000% due 08/01/2049 | 3,700 | 4,026 | ||||||||||
San Diego County, California Certificates of Participation Bonds, Series 2023 | ||||||||||||
5.000% due 10/01/2053 | 3,650 | 3,998 | ||||||||||
San Diego County, California Regional Airport Authority Revenue Bonds, Series 2021 | ||||||||||||
4.000% due 07/01/2051 | 3,000 | 2,853 | ||||||||||
5.000% due 07/01/2051 | 2,360 | 2,451 | ||||||||||
San Diego Housing Authority, Inc., California Revenue Bonds, (FHLMC Insured), Series 2024 | ||||||||||||
4.200% due 06/01/2040 | 2,000 | 2,008 | ||||||||||
San Diego Public Facilities Financing Authority, California Revenue Bonds, Series 2022 | ||||||||||||
5.000% due 05/15/2047 | 1,000 | 1,102 | ||||||||||
San Diego Unified School District, California General Obligation Bonds, Series 2020 | ||||||||||||
4.000% due 07/01/2050 | 900 | 882 | ||||||||||
San Diego Unified School District, California General Obligation Bonds, Series 2023 | ||||||||||||
4.000% due 07/01/2053 | 4,500 | 4,389 | ||||||||||
5.000% due 07/01/2048 | 1,000 | 1,106 | ||||||||||
San Francisco Bay Area Rapid Transit District, California General Obligation Bonds, Series 2017 | ||||||||||||
5.000% due 08/01/2047 | 1,000 | 1,038 | ||||||||||
San Francisco, California City & County Airport Comm-San Francisco International Airport Revenue Bonds, Series 2017 | ||||||||||||
5.000% due 05/01/2047 | 2,750 | 2,840 | ||||||||||
San Francisco, California City & County Airport Comm-San Francisco International Airport Revenue Bonds, Series 2019 | ||||||||||||
5.000% due 05/01/2049 | 4,000 | 4,084 | ||||||||||
San Francisco, California City & County Public Utilities Commission Power Revenue Bonds, Series 2023 | ||||||||||||
5.000% due 11/01/2048 | 1,800 | 1,976 | ||||||||||
San Francisco, California Public Utilities Commission Water Revenue Bonds, Series 2016 | ||||||||||||
4.000% due 11/01/2039 | 900 | 900 |
PRINCIPAL AMOUNT (000S) | MARKET VALUE (000S) | |||||||||||
San Francisco, California Public Utilities Commission Water Revenue Bonds, Series 2020 | ||||||||||||
5.000% due 11/01/2050 | $ | 1,200 | $ | 1,289 | ||||||||
San Jose Financing Authority, California Revenue Bonds, Series 2022 | ||||||||||||
5.000% due 11/01/2052 | 1,800 | 1,976 | ||||||||||
San Juan Unified School District, California General Obligation Bonds, Series 2024 | ||||||||||||
4.000% due 08/01/2049 | 1,800 | 1,786 | ||||||||||
San Marcos Redevelopment Agency Successor Agency, California Tax Allocation Bonds, Series 2015 | ||||||||||||
5.000% due 10/01/2032 | 850 | 865 | ||||||||||
5.000% due 10/01/2033 | 1,125 | 1,145 | ||||||||||
San Mateo County, California Community College District General Obligation Bonds, (NPFGC Insured), Series 2006 | ||||||||||||
0.000% due 09/01/2034 (c) | 12,000 | 8,450 | ||||||||||
San Mateo Joint Powers Financing Authority, California Revenue Bonds, Series 2018 | ||||||||||||
4.000% due 07/15/2052 | 1,800 | 1,805 | ||||||||||
Santa Ana Unified School District, California General Obligation Bonds, Series 2019 | ||||||||||||
4.000% due 08/01/2048 | 1,750 | 1,742 | ||||||||||
Santa Clarita Community College District, California General Obligation Bonds, Series 2016 | ||||||||||||
4.000% due 08/01/2046 | 2,200 | 2,156 | ||||||||||
Santa Monica, California Community College District General Obligation Bonds, Series 2022 | ||||||||||||
4.000% due 08/01/2045 | 1,270 | 1,287 | ||||||||||
Silicon Valley Tobacco Securitization Authority, California Revenue Bonds, Series 2007 | ||||||||||||
0.000% due 06/01/2036 (c) | 1,000 | 522 | ||||||||||
South San Francisco Unified School District, California General Obligation Bonds, Series 2023 | ||||||||||||
4.000% due 09/01/2052 | 1,000 | 1,000 | ||||||||||
Southwestern Community College District, California General Obligation Bonds, Series 2021 | ||||||||||||
4.000% due 08/01/2046 | 4,850 | 4,865 | ||||||||||
State Center Community College District, California General Obligation Bonds, Series 2022 | ||||||||||||
5.000% due 08/01/2047 | 1,815 | 1,996 | ||||||||||
Sweetwater Union High School District, California General Obligation Bonds, Series 2022 | ||||||||||||
5.000% due 08/01/2052 | 2,190 | 2,365 | ||||||||||
Tobacco Securitization Authority of Northern California Revenue Bonds, Series 2021 | ||||||||||||
0.000% due 06/01/2060 (c) | 19,480 | 3,192 | ||||||||||
Tobacco Securitization Authority of Southern California Revenue Bonds, Series 2006 | ||||||||||||
0.000% due 06/01/2046 (c) | 5,000 | 939 | ||||||||||
Tobacco Securitization Authority of Southern California Revenue Bonds, Series 2019 | ||||||||||||
5.000% due 06/01/2048 | 2,160 | 2,218 | ||||||||||
University of California Revenue Bonds, Series 2022 | ||||||||||||
5.000% due 05/15/2052 | 8,800 | 9,576 | ||||||||||
Upland, California Certificates of Participation Bonds, Series 2017 | ||||||||||||
4.000% due 01/01/2042 | 3,000 | 2,724 | ||||||||||
Victor Valley Community College District, California General Obligation Bonds, Series 2024 | ||||||||||||
5.000% due 08/01/2051 | 680 | 740 | ||||||||||
Washington Township Health Care District, California General Obligation Bonds, Series 2015 | ||||||||||||
4.000% due 08/01/2045 | 3,000 | 2,942 | ||||||||||
Washington Township Health Care District, California General Obligation Bonds, Series 2023 | ||||||||||||
5.500% due 08/01/2053 | 1,500 | 1,673 | ||||||||||
326,489 | ||||||||||||
DELAWARE 1.4% | ||||||||||||
Affordable Housing Opportunities Trust, Delaware Revenue Bonds, Series 2022 | ||||||||||||
3.167% due 10/01/2038 | 2,920 | 2,503 | ||||||||||
7.120% due 10/01/2038 | 510 | 490 | ||||||||||
2,993 | ||||||||||||
36 | PIMCO CLOSED-END FUNDS | See Accompanying Notes |
JUNE 30, 2024 | (Unaudited) |
PRINCIPAL AMOUNT (000S) | MARKET VALUE (000S) | |||||||||||
ILLINOIS 2.3% | ||||||||||||
Chicago, Illinois General Obligation Bonds, Series 2007 | ||||||||||||
5.500% due 01/01/2042 | $ | 2,350 | $ | 2,355 | ||||||||
Illinois State General Obligation Bonds, Series 2018 | ||||||||||||
5.000% due 05/01/2035 | 1,000 | 1,045 | ||||||||||
Illinois State General Obligation Bonds, Series 2020 | ||||||||||||
4.125% due 10/01/2036 | 1,500 | 1,522 | ||||||||||
4,922 | ||||||||||||
NEW HAMPSHIRE 1.0% | ||||||||||||
New Hampshire Business Finance Authority Revenue Bonds, Series 2023 | ||||||||||||
4.817% due 12/20/2036 | 2,097 | 2,119 | ||||||||||
NEW YORK 0.9% | ||||||||||||
New York Liberty Development Corp. Revenue Bonds, Series 2005 | ||||||||||||
5.250% due 10/01/2035 | 1,250 | 1,445 | ||||||||||
New York Power Authority Revenue Bonds, Series 2020 | ||||||||||||
4.000% due 11/15/2055 | 550 | 529 | ||||||||||
1,974 | ||||||||||||
NORTH DAKOTA 0.0% | ||||||||||||
Grand Forks County, North Dakota Revenue Bonds, Series 2021 | ||||||||||||
7.000% due 12/15/2043 ^(b) | 720 | 22 | ||||||||||
PENNSYLVANIA 0.7% | ||||||||||||
Pennsylvania Economic Development Financing Authority Revenue Bonds, Series 2021 | ||||||||||||
9.000% due 04/01/2051 | 1,275 | 1,403 | ||||||||||
PRINCIPAL AMOUNT (000S) | MARKET VALUE (000S) | |||||||||||
PUERTO RICO 7.2% | ||||||||||||
Children’s Trust Fund, Puerto Rico Revenue Bonds, Series 2008 | ||||||||||||
0.000% due 05/15/2057 (c) | $ | 24,300 | $ | 1,679 | ||||||||
Commonwealth of Puerto Rico Bonds, Series 2022 | ||||||||||||
0.000% due 11/01/2051 | 2,752 | 1,601 | ||||||||||
Commonwealth of Puerto Rico General Obligation Bonds, Series 2021 | ||||||||||||
0.000% due 07/01/2033 (c) | 1,250 | 836 | ||||||||||
4.000% due 07/01/2041 | 1,300 | 1,216 | ||||||||||
Puerto Rico Sales Tax Financing Corp. Sales Tax Revenue Bonds, Series 2018 | ||||||||||||
0.000% due 07/01/2051 (c) | 20,000 | 4,706 | ||||||||||
Puerto Rico Sales Tax Financing Corp. Sales Tax Revenue Bonds, Series 2019 | ||||||||||||
4.784% due 07/01/2058 | 5,425 | 5,365 | ||||||||||
15,403 | ||||||||||||
TEXAS 1.5% | ||||||||||||
Angelina & Neches River Authority, Texas Revenue Bonds, Series 2021 | ||||||||||||
7.500% due 12/01/2045 | 500 | 338 | ||||||||||
12.000% due 12/01/2045 | 850 | 748 | ||||||||||
San Antonio Municipal Facilities Corp., Texas Revenue Bonds, Series 2021 | ||||||||||||
4.000% due 08/01/2048 | 2,300 | 2,210 | ||||||||||
3,296 | ||||||||||||
VIRGINIA 0.5% | ||||||||||||
Virginia Small Business Financing Authority Revenue Bonds, Series 2019 | ||||||||||||
0.000% due 07/01/2061 (c) | 19,000 | 611 | ||||||||||
5.500% due 07/01/2044 | 500 | 456 | ||||||||||
1,067 | ||||||||||||
Total Municipal Bonds & Notes (Cost $352,308) | 359,744 | |||||||||||
PRINCIPAL AMOUNT (000S) | MARKET VALUE (000S) | |||||||||||
U.S. GOVERNMENT AGENCIES 1.8% | ||||||||||||
Freddie Mac | ||||||||||||
3.720% due 01/01/2041 | $ | 2,093 | $ | 1,957 | ||||||||
3.850% due 02/01/2038 | 1,997 | 1,912 | ||||||||||
Total U.S. Government Agencies (Cost $3,806) | 3,869 | |||||||||||
SHORT-TERM INSTRUMENTS 0.4% | ||||||||||||
REPURCHASE AGREEMENTS (f) 0.4% | ||||||||||||
969 | ||||||||||||
Total Short-Term Instruments (Cost $969) | 969 | |||||||||||
Total Investments in Securities (Cost $357,083) | 364,582 | |||||||||||
Total Investments 169.4% (Cost $357,083) | $ | 364,582 | ||||||||||
Auction Rate Preferred Shares (0.7)% | (1,475 | ) | ||||||||||
Remarketable Variable Rate MuniFund Term Preferred Shares, at liquidation value (68.0)% | (146,298 | ) | ||||||||||
Other Assets and Liabilities, net (0.7)% | (1,532 | ) | ||||||||||
Net Assets Applicable to Common Shareholders 100.0% | $ | 215,277 | ||||||||||
* | A zero balance may reflect actual amounts rounding to less than one thousand. |
^ | Security is in default. |
(a) | When-issued security. |
(b) | Security is not accruing income as of the date of this report. |
(c) | Zero coupon security. |
(d) | Security becomes interest bearing at a future date. |
Issuer Description | Coupon | Maturity Date | Acquisition Date | Cost | Market Value | Market Value as Percentage of Net Assets Applicable to Common Shareholders | ||||||||||||||||
California Municipal Finance Authority Revenue Bonds, Series 2021 | 4.000% | 09/01/2050 | 08/03/2022 | $ 1,361 | $ | 1,269 | 0.59% | |||||||||||||||
Counterparty | Lending Rate | Settlement Date | Maturity Date | Principal Amount | Collateralized By | Collateral (Received) | Repurchase Agreements, at Value | Repurchase Agreement Proceeds to be Received (1) | ||||||||||||||||||||||
FICC | 2.600 | % | 06/28/2024 | 07/01/2024 | $ | 969 | U.S. Treasury Inflation Protected Securities 0.625% due 01/15/2026 | $ | (988 | ) | $ | 969 | $ | 969 | ||||||||||||||||
Total Repurchase Agreements | $ | (988 | ) | $ | 969 | $ | 969 | |||||||||||||||||||||||
See Accompanying Notes | SEMIANNUAL REPORT | | | JUNE 30, 2024 | 37 |
Schedule of Investments | PIMCO California Municipal Income Fund II | (Cont.) | June 30, 2024 | (Unaudited) |
Counterparty | Repurchase Agreement Proceeds to be Received (1) | Payable for Reverse Repurchase Agreements | Payable for Sale-Buyback Transactions | Total Borrowings and Other Financing Transactions | Collateral Pledged/(Received) | Net Exposure (2) | ||||||||||||||||||
Global/Master Repurchase Agreement | ||||||||||||||||||||||||
FICC | $ | 969 | $ | 0 | $ | 0 | $ | 969 | $ | (988 | ) | $ | (19 | ) | ||||||||||
Total Borrowings and Other Financing Transactions | $ | 969 | $ | 0 | $ | 0 | ||||||||||||||||||
(1) | Includes accrued interest. |
(2) | Net Exposure represents the net receivable/(payable) that would be due from/to the counterparty in the event of default. Exposure from borrowings and other financing transactions can only be netted across transactions governed under the same master agreement with the same legal entity. See Note 7, Master Netting Arrangements, in the Notes to Financial Statements for more information. |
Category and Subcategory | Level 1 | Level 2 | Level 3 | Fair Value at 06/30/2024 | ||||||||||||
Investments in Securities, at Value | ||||||||||||||||
Municipal Bonds & Notes | ||||||||||||||||
Arizona | $ | 0 | $ | 56 | $ | 0 | $ | 56 | ||||||||
California | 0 | 326,489 | 0 | 326,489 | ||||||||||||
Delaware | 0 | 2,993 | 0 | 2,993 | ||||||||||||
Illinois | 0 | 4,922 | 0 | 4,922 | ||||||||||||
New Hampshire | 0 | 2,119 | 0 | 2,119 | ||||||||||||
New York | 0 | 1,974 | 0 | 1,974 | ||||||||||||
North Dakota | 0 | 22 | 0 | 22 | ||||||||||||
Pennsylvania | 0 | 1,403 | 0 | 1,403 |
Category and Subcategory | Level 1 | Level 2 | Level 3 | Fair Value at 06/30/2024 | ||||||||||||
Puerto Rico | $ | 0 | $ | 15,403 | $ | 0 | $ | 15,403 | ||||||||
Texas | 0 | 3,296 | 0 | 3,296 | ||||||||||||
Virginia | 0 | 1,067 | 0 | 1,067 | ||||||||||||
U.S. Government Agencies | 0 | 3,869 | 0 | 3,869 | ||||||||||||
Short-Term Instruments | ||||||||||||||||
Repurchase Agreements | 0 | 969 | 0 | 969 | ||||||||||||
Total Investments | $ | 0 | $ | 364,582 | $ | 0 | $ | 364,582 | ||||||||
38 | PIMCO CLOSED-END FUNDS | See Accompanying Notes |
Schedule of Investments | PIMCO California Municipal Income Fund III | June 30, 2024 | (Unaudited) |
PRINCIPAL AMOUNT (000S) | MARKET VALUE (000S) | |||||||||||
INVESTMENTS IN SECURITIES 170.3% | ||||||||||||
MUNICIPAL BONDS & NOTES 164.5% | ||||||||||||
ARIZONA 0.0% | ||||||||||||
Arizona Industrial Development Authority Revenue Bonds, Series 2020 | ||||||||||||
7.750% due 07/01/2050 ^(b) | $ | 730 | $ | 44 | ||||||||
CALIFORNIA 151.2% | ||||||||||||
Alameda Corridor Transportation Authority, California Revenue Bonds, (AGM Insured), Series 2024 | ||||||||||||
0.000% due 10/01/2052 (c) | 1,900 | 501 | ||||||||||
Alameda Corridor Transportation Authority, California Revenue Bonds, Series 2022 | ||||||||||||
5.375% due 10/01/2049 (d) | 2,525 | 1,422 | ||||||||||
Alameda Unified School District-Alameda County, California General Obligation Bonds, Series 2024 | ||||||||||||
5.000% due 08/01/2049 | 750 | 834 | ||||||||||
Anaheim City School District, California General Obligation Bonds, (BAM Insured), Series 2023 | ||||||||||||
4.250% due 08/01/2050 | 2,300 | 2,314 | ||||||||||
Antelope Valley Community College District, California General Obligation Bonds, Series 2022 | ||||||||||||
0.000% due 08/01/2047 (c) | 600 | 188 | ||||||||||
Bay Area Toll Authority, California Revenue Bonds, Series 2023 | ||||||||||||
4.125% due 04/01/2054 | 1,500 | 1,500 | ||||||||||
Butte-Glenn Community College District, California General Obligation Bonds, Series 2022 | ||||||||||||
4.000% due 08/01/2047 | 1,330 | 1,323 | ||||||||||
California Community Choice Financing Authority Revenue Bonds, Series 2023 | ||||||||||||
5.250% due 11/01/2054 | 1,750 | 1,871 | ||||||||||
California Community Housing Agency Revenue Bonds, Series 2019 | ||||||||||||
5.000% due 04/01/2049 | 1,100 | 960 | ||||||||||
California Community Housing Agency Revenue Bonds, Series 2021 | ||||||||||||
4.000% due 02/01/2056 | 1,000 | 825 | ||||||||||
California Community Housing Agency Revenue Bonds, Series 2022 | ||||||||||||
4.500% due 08/01/2052 | 1,000 | 869 | ||||||||||
California County Tobacco Securitization Agency Revenue Bonds, Series 2002 | ||||||||||||
6.000% due 06/01/2042 | 6,950 | 7,099 | ||||||||||
6.125% due 06/01/2038 | 1,000 | 1,001 | ||||||||||
California County Tobacco Securitization Agency Revenue Bonds, Series 2007 | ||||||||||||
0.000% due 06/01/2057 (c) | 4,000 | 619 | ||||||||||
California County Tobacco Securitization Agency Revenue Bonds, Series 2020 | ||||||||||||
0.000% due 06/01/2055 (c) | 4,000 | 727 | ||||||||||
California Educational Facilities Authority Revenue Bonds, Series 2018 | ||||||||||||
5.000% due 10/01/2043 | 1,000 | 1,044 | ||||||||||
California Health Facilities Financing Authority Revenue Bonds, Series 2015 | ||||||||||||
5.000% due 08/15/2054 | 3,000 | 3,036 | ||||||||||
California Health Facilities Financing Authority Revenue Bonds, Series 2016 | ||||||||||||
5.000% due 11/15/2046 | 2,960 | 3,026 | ||||||||||
5.000% due 08/15/2055 | 5,000 | 5,080 | ||||||||||
California Health Facilities Financing Authority Revenue Bonds, Series 2017 | ||||||||||||
4.000% due 11/01/2038 | 1,220 | 1,216 | ||||||||||
4.000% due 11/01/2044 | 1,000 | 990 | ||||||||||
4.000% due 11/01/2051 | 2,250 | 2,172 | ||||||||||
California Health Facilities Financing Authority Revenue Bonds, Series 2020 | ||||||||||||
4.000% due 08/15/2050 | 1,000 | 972 | ||||||||||
California Health Facilities Financing Authority Revenue Bonds, Series 2021 | ||||||||||||
4.000% due 08/15/2048 | 2,300 | 2,227 |
PRINCIPAL AMOUNT (000S) | MARKET VALUE (000S) | |||||||||||
California Health Facilities Financing Authority Revenue Bonds, Series 2024 | ||||||||||||
5.000% due 11/15/2044 | $ | 1,500 | $ | 1,671 | ||||||||
California Housing Finance Agency Revenue Bonds, (FNMA Insured), Series 2024 | ||||||||||||
4.330% due 02/01/2042 | 1,000 | 1,005 | ||||||||||
California Housing Finance Agency Revenue Bonds, Series 2024 | ||||||||||||
5.970% due 11/01/2053 | 1,750 | 1,750 | ||||||||||
California Housing Finance Revenue Bonds, Series 2024 | ||||||||||||
5.700% due 06/01/2054 | 1,100 | 1,103 | ||||||||||
6.000% due 03/01/2053 | 1,750 | 1,748 | ||||||||||
7.000% due 03/01/2053 | 500 | 498 | ||||||||||
California Infrastructure & Economic Development Bank Revenue Bonds, Series 2020 | ||||||||||||
0.000% due 01/01/2060 (c) | 5,000 | 386 | ||||||||||
4.000% due 11/01/2050 | 860 | 810 | ||||||||||
8.000% due 01/01/2050 | 1,450 | 1,508 | ||||||||||
California Municipal Finance Authority Certificates of Participation Bonds, (AGM Insured), Series 2022 | ||||||||||||
5.250% due 11/01/2052 | 1,500 | 1,594 | ||||||||||
California Municipal Finance Authority Revenue Bonds, Series 2018 | ||||||||||||
5.000% due 06/01/2048 | 1,100 | 1,144 | ||||||||||
California Municipal Finance Authority Revenue Bonds, Series 2021 | ||||||||||||
4.000% due 09/01/2050 (e) | 1,200 | 1,016 | ||||||||||
California Municipal Finance Authority Revenue Bonds, Series 2024 | ||||||||||||
5.750% due 05/01/2054 | 200 | 205 | ||||||||||
6.000% due 01/01/2039 | 2,000 | 2,105 | ||||||||||
California Municipal Finance Authority Special Tax Bonds, Series 2024 | ||||||||||||
5.125% due 09/01/2059 | 575 | 594 | ||||||||||
California Public Finance Authority Revenue Bonds, Series 2019 | ||||||||||||
6.250% due 07/01/2054 | 2,250 | 2,374 | ||||||||||
California State General Obligation Bonds, Series 2017 | ||||||||||||
4.000% due 11/01/2047 | 1,500 | 1,503 | ||||||||||
California State General Obligation Bonds, Series 2018 | ||||||||||||
5.000% due 10/01/2047 | 2,000 | 2,041 | ||||||||||
California State General Obligation Bonds, Series 2020 | ||||||||||||
4.000% due 11/01/2040 | 850 | 866 | ||||||||||
California State General Obligation Bonds, Series 2021 | ||||||||||||
5.000% due 09/01/2041 | 1,500 | 1,660 | ||||||||||
California State General Obligation Bonds, Series 2022 | ||||||||||||
4.000% due 09/01/2042 | 1,150 | 1,172 | ||||||||||
4.000% due 04/01/2049 | 1,750 | 1,745 | ||||||||||
California State General Obligation Bonds, Series 2023 | ||||||||||||
4.000% due 09/01/2043 | 1,600 | 1,628 | ||||||||||
California State University Revenue Bonds, Series 2015 | ||||||||||||
5.000% due 11/01/2047 | 6,750 | 6,861 | ||||||||||
California State University Revenue Bonds, Series 2023 | ||||||||||||
5.000% due 11/01/2044 | 1,000 | 1,127 | ||||||||||
California Statewide Communities Development Authority Revenue Bonds, (AGM Insured), Series 2022 | ||||||||||||
5.375% due 08/15/2057 | 950 | 1,028 | ||||||||||
California Statewide Communities Development Authority Revenue Bonds, (CM Insured), Series 2018 | ||||||||||||
4.000% due 07/01/2047 | 250 | 245 | ||||||||||
California Statewide Communities Development Authority Revenue Bonds, Series 2016 | ||||||||||||
4.000% due 08/15/2051 | 200 | 194 | ||||||||||
5.000% due 06/01/2046 | 1,000 | 1,004 | ||||||||||
5.000% due 12/01/2046 | 3,100 | 3,122 | ||||||||||
5.250% due 12/01/2056 | 3,750 | 3,780 | ||||||||||
California Statewide Communities Development Authority Revenue Bonds, Series 2018 | ||||||||||||
4.000% due 03/01/2042 | 2,500 | 2,388 | ||||||||||
4.000% due 07/01/2048 | 850 | 850 | ||||||||||
4.000% due 12/01/2057 | 2,000 | 1,849 | ||||||||||
5.000% due 03/01/2048 | 1,505 | 1,527 | ||||||||||
California Statewide Communities Development Authority Revenue Bonds, Series 2019 | ||||||||||||
4.250% due 11/01/2059 | 1,485 | 1,308 |
PRINCIPAL AMOUNT (000S) | MARKET VALUE (000S) | |||||||||||
Calistoga Joint Unified School District, California General Obligation Bonds, Series 2023 | ||||||||||||
5.000% due 08/01/2052 | $ | 1,275 | $ | 1,397 | ||||||||
Chino Valley Unified School District, California General Obligation Bonds, Series 2022 | ||||||||||||
0.000% due 08/01/2038 (c) | 1,300 | 738 | ||||||||||
0.000% due 08/01/2039 (c) | 1,600 | 861 | ||||||||||
0.000% due 08/01/2041 (c) | 1,935 | 939 | ||||||||||
0.000% due 08/01/2046 (c) | 1,500 | 568 | ||||||||||
Chino Valley Unified School District, California General Obligation Notes, Series 2022 | ||||||||||||
0.000% due 08/01/2030 (c) | 1,135 | 923 | ||||||||||
City of California, Eureka City Schools, General Obligation Bonds, (BAM Insured), Series 2020 | ||||||||||||
4.000% due 08/01/2049 | 2,000 | 1,988 | ||||||||||
CMFA Special Finance Agency VII, California Revenue Bonds, Series 2021 | ||||||||||||
3.000% due 08/01/2056 | 1,500 | 1,053 | ||||||||||
4.000% due 08/01/2047 | 595 | 499 | ||||||||||
CMFA Special Finance Agency, California Revenue Bonds, Series 2021 | ||||||||||||
4.000% due 08/01/2045 | 750 | 631 | ||||||||||
Colton Joint Unified School District, California General Obligation Bonds, (BAM Insured), Series 2024 | ||||||||||||
5.000% due 08/01/2049 | 2,000 | 2,195 | ||||||||||
Corona Norco Unified School District, California General Obligation Bonds, Series 2018 | ||||||||||||
4.000% due 08/01/2047 | 1,460 | 1,463 | ||||||||||
CSCDA Community Improvement Authority, California Revenue Bonds, Series 2021 | ||||||||||||
3.000% due 02/01/2057 | 500 | 362 | ||||||||||
3.400% due 10/01/2046 | 350 | 291 | ||||||||||
4.000% due 08/01/2056 | 500 | 439 | ||||||||||
4.000% due 10/01/2056 | 750 | 568 | ||||||||||
CSCDA Community Improvement Authority, California Revenue Bonds, Series 2022 | ||||||||||||
4.750% due 09/01/2062 (d) | 1,800 | 999 | ||||||||||
Department of Veterans Affairs Veteran’s Farm & Home Purchase Program, California Revenue Bonds, Series 2022 | ||||||||||||
4.950% due 12/01/2046 | 300 | 310 | ||||||||||
Desert Community College District, California General Obligation Bonds, Series 2024 | ||||||||||||
4.000% due 08/01/2051 | 1,100 | 1,081 | ||||||||||
East Bay Municipal Utility District Water System, California Revenue Bonds, Series 2024 | ||||||||||||
5.000% due 06/01/2043 | 600 | 685 | ||||||||||
El Monte City School District, California General Obligation Bonds, (BAM Insured), Series 2023 | ||||||||||||
5.000% due 08/01/2052 | 1,400 | 1,514 | ||||||||||
Elk Grove Finance Authority, California Special Tax Bonds, Series 2016 | ||||||||||||
5.000% due 09/01/2046 | 1,000 | 1,006 | ||||||||||
Folsom Cordova Unified School District, California General Obligation Bonds, (AGM Insured), Series 2019 | ||||||||||||
4.000% due 10/01/2044 | 1,160 | 1,160 | ||||||||||
Foothill-Eastern Transportation Corridor Agency, California Revenue Bonds, Series 2014 | ||||||||||||
3.950% due 01/15/2053 | 720 | 672 | ||||||||||
Fremont Community Facilities District No. 1, California Special Tax Bonds, Series 2015 | ||||||||||||
5.000% due 09/01/2045 | 1,400 | 1,408 | ||||||||||
Fresno Unified School District, California General Obligation Bonds, Series 2016 | ||||||||||||
4.000% due 08/01/2046 | 2,125 | 2,113 | ||||||||||
Glendale Community College District, California General Obligation Bonds, Series 2020 | ||||||||||||
4.000% due 08/01/2050 | 1,000 | 1,002 | ||||||||||
Golden State, California Tobacco Securitization Corp. Revenue Bonds, Series 2021 | ||||||||||||
0.000% due 06/01/2066 (c) | 20,500 | 2,288 | ||||||||||
Hartnell Community College District, California General Obligation Bonds, Series 2017 | ||||||||||||
4.000% due 08/01/2042 | 1,150 | 1,153 |
See Accompanying Notes | SEMIANNUAL REPORT | | | JUNE 30, 2024 | 39 |
Schedule of Investments | PIMCO California Municipal Income Fund III | (Cont.) |
PRINCIPAL AMOUNT (000S) | MARKET VALUE (000S) | |||||||||||
Hastings Campus Housing Finance Authority, California Revenue Bonds, Series 2020 | ||||||||||||
5.000% due 07/01/2061 | $ | 2,000 | $ | 1,909 | ||||||||
Hayward Unified School District, California General Obligation Bonds, Series 2015 | ||||||||||||
5.000% due 08/01/2038 | 5,000 | 5,006 | ||||||||||
Irvine Facilities Financing Authority, California Special Tax Bonds, (BAM Insured), Series 2023 | ||||||||||||
4.000% due 09/01/2058 | 2,000 | 1,976 | ||||||||||
Lancaster County Hospital Authority, California Revenue Bonds, (BAM Insured), Series 2024 | ||||||||||||
4.000% due 05/01/2049 (a) | 1,200 | 1,157 | ||||||||||
Long Beach Bond Finance Authority, California General Obligation Bonds, Series 2023 | ||||||||||||
4.000% due 08/01/2053 | 1,250 | 1,248 | ||||||||||
Long Beach Bond Finance Authority, California Revenue Bonds, Series 2023 | ||||||||||||
4.000% due 08/01/2053 | 1,250 | 1,221 | ||||||||||
Long Beach Unified School District, California General Obligation Bonds, Series 2009 | ||||||||||||
5.750% due 08/01/2033 | 305 | 305 | ||||||||||
Los Angeles County, California Facilities, Inc., Revenue Bonds, Series 2018 | ||||||||||||
4.000% due 12/01/2048 | 2,000 | 1,998 | ||||||||||
Los Angeles County, California Metropolitan Transportation Authority Sales Tax Revenue Bonds, Series 2021 | ||||||||||||
4.000% due 06/01/2037 | 1,500 | 1,585 | ||||||||||
Los Angeles County, California Sanitation Districts Financing Authority Revenue Bonds, Series 2016 | ||||||||||||
4.000% due 10/01/2042 | 1,185 | 1,187 | ||||||||||
Los Angeles Department of Airports, California Revenue Bonds, Series 2018 | ||||||||||||
5.000% due 05/15/2048 | 1,800 | 1,856 | ||||||||||
Los Angeles Department of Water & Power Water System, California Revenue Bonds, Series 2022 | ||||||||||||
5.000% due 07/01/2052 | 1,190 | 1,295 | ||||||||||
M-S-R | ||||||||||||
6.500% due 11/01/2039 | 2,700 | 3,426 | ||||||||||
7.000% due 11/01/2034 | 2,285 | 2,797 | ||||||||||
Mammoth Lakes, California Certificates of Participation Bonds, (BAM Insured),Series 2024 | ||||||||||||
4.000% due 06/01/2049 (a) | 1,700 | 1,651 | ||||||||||
Manteca Financing Authority, California Revenue Bonds, Series 2009 | ||||||||||||
5.750% due 12/01/2036 | 1,000 | 1,009 | ||||||||||
Manteca Unified School District, California General Obligation Bonds, Series 2020 | ||||||||||||
4.000% due 08/01/2045 | 1,800 | 1,804 | ||||||||||
Monterey Peninsula Unified School District, California General Obligation Bonds, Series 2019 | ||||||||||||
4.000% due 08/01/2040 | 2,545 | 2,562 | ||||||||||
Mount San Antonio Community College District, California General Obligation Bonds, Series 2019 | ||||||||||||
4.000% due 08/01/2049 | 1,800 | 1,767 | ||||||||||
Mount San Jacinto Community College District, California General Obligation Bonds, Series 2018 | ||||||||||||
4.000% due 08/01/2043 | 3,650 | 3,660 | ||||||||||
Norwalk-La Mirada Unified School District, California General Obligation Bonds, Series 2019 | ||||||||||||
4.000% due 08/01/2048 | 2,200 | 2,193 | ||||||||||
Oakland Redevelopment Agency Successor Agency, California Tax Allocation Bonds, (AGM Insured), Series 2015 | ||||||||||||
5.000% due 09/01/2036 | 800 | 812 | ||||||||||
Ontario International Airport Authority, California Revenue Bonds, (AGM Insured), Series 2021 | ||||||||||||
4.000% due 05/15/2051 | 400 | 398 | ||||||||||
Ontario Montclair School District, California General Obligation Bonds, Series 2017 | ||||||||||||
5.000% due 08/01/2046 | 1,525 | 1,582 | ||||||||||
Orange County, California Community Facilities District Special Tax Bonds, Series 2022 | ||||||||||||
5.000% due 08/15/2052 | 1,115 | 1,139 |
PRINCIPAL AMOUNT (000S) | MARKET VALUE (000S) | |||||||||||
Pacifica School District, California General Obligation Bonds, Series 2018 | ||||||||||||
4.000% due 08/01/2048 | $ | 1,250 | $ | 1,242 | ||||||||
Palm Springs Unified School District, California General Obligation Bonds, Series 2024 | ||||||||||||
4.000% due 08/01/2049 | 1,200 | 1,185 | ||||||||||
Redwood City School District, California General Obligation Bonds, Series 2023 | ||||||||||||
5.000% due 08/01/2052 | 1,700 | 1,868 | ||||||||||
Richmond, California Wastewater Revenue Bonds, Series 2019 | ||||||||||||
4.000% due 08/01/2049 | 1,190 | 1,192 | ||||||||||
Rio Hondo Community College District, California General Obligation Bonds, Series 2022 | ||||||||||||
0.000% due 08/01/2045 (c) | 1,500 | 554 | ||||||||||
River Islands Public Financing Authority, California Special Tax Bonds, Series 2024 | ||||||||||||
5.000% due 09/01/2054 (a) | 275 | 277 | ||||||||||
River Islands Public Financing Authority, California Special Tax, (AGM Insured), Series 2022 | ||||||||||||
4.250% due 09/01/2047 | 900 | 907 | ||||||||||
Riverside County, California Transportation Commission Revenue Bonds, Series 2013 | ||||||||||||
0.000% due 06/01/2042 (c) | 1,000 | 457 | ||||||||||
Riverside County, California Transportation Commission Revenue Bonds, Series 2021 | ||||||||||||
4.000% due 06/01/2047 | 1,880 | 1,800 | ||||||||||
Riverside, California Electric Revenue Bonds, Series 2024 | ||||||||||||
5.000% due 10/01/2049 | 2,200 | 2,448 | ||||||||||
Riverside, California Sewer Revenue Bonds, Series 2018 | ||||||||||||
4.000% due 08/01/2038 | 2,000 | 2,016 | ||||||||||
Sacramento City Unified School District, California General Obligation Bonds, (AGM Insured), Series 2021 | ||||||||||||
4.000% due 08/01/2049 | 1,340 | 1,303 | ||||||||||
Sacramento County, California Sanitation Districts Financing Authority Revenue Bonds, Series 2020 | ||||||||||||
5.000% due 12/01/2050 | 1,000 | 1,076 | ||||||||||
Sacramento County, California Special Tax Bonds, Series 2022 | ||||||||||||
5.000% due 09/01/2042 | 1,550 | 1,616 | ||||||||||
5.000% due 09/01/2047 | 400 | 410 | ||||||||||
Sacramento Municipal Utility District, California Revenue Bonds, Series 2023 | ||||||||||||
5.000% due 08/15/2048 | 500 | 554 | ||||||||||
San Bernardino Community College District, California General Obligation Bonds, Series 2023 | ||||||||||||
5.000% due 08/01/2049 | 3,000 | 3,265 | ||||||||||
San Diego County, California Certificates of Participation Bonds, Series 2023 | ||||||||||||
5.000% due 10/01/2053 | 3,000 | 3,286 | ||||||||||
San Diego County, California Regional Airport Authority Revenue Bonds, Series 2021 | ||||||||||||
4.000% due 07/01/2051 | 2,250 | 2,131 | ||||||||||
5.000% due 07/01/2051 | 1,925 | 1,999 | ||||||||||
San Diego Housing Authority, Inc., California Revenue Bonds,(FHLMC Insured), Series 2024 | ||||||||||||
4.200% due 06/01/2040 | 2,000 | 2,008 | ||||||||||
San Diego Public Facilities Financing Authority, California Revenue Bonds, Series 2022 | ||||||||||||
5.000% due 05/15/2047 | 1,000 | 1,102 | ||||||||||
San Diego Unified School District, California General Obligation Bonds, Series 2023 | ||||||||||||
4.000% due 07/01/2053 | 4,000 | 3,901 | ||||||||||
5.000% due 07/01/2048 | 2,000 | 2,212 | ||||||||||
San Francisco, California City & County Airport Comm-San Francisco International Airport Revenue Bonds, Series 2017 | ||||||||||||
5.000% due 05/01/2047 | 2,125 | 2,194 | ||||||||||
San Francisco, California City & County Airport Comm-San Francisco International Airport Revenue Bonds, Series 2019 | ||||||||||||
5.000% due 05/01/2049 | 3,750 | 3,829 |
PRINCIPAL AMOUNT (000S) | MARKET VALUE (000S) | |||||||||||
San Francisco, California City & County Public Utilities Commission Power Revenue Bonds, Series 2023 | ||||||||||||
5.000% due 11/01/2048 | $ | 1,500 | $ | 1,647 | ||||||||
San Francisco, California Public Utilities Commission Water Revenue Bonds, Series 2016 | ||||||||||||
4.000% due 11/01/2039 | 775 | 775 | ||||||||||
San Francisco, California Public Utilities Commission Water Revenue Bonds, Series 2020 | ||||||||||||
5.000% due 11/01/2050 | 1,500 | 1,611 | ||||||||||
San Francisco, California Public Utilities Commission Water Revenue Bonds, Series 2023 | ||||||||||||
5.250% due 11/01/2052 | 1,250 | 1,406 | ||||||||||
San Jose Financing Authority, California Revenue Bonds, Series 2022 | ||||||||||||
5.000% due 11/01/2052 | 1,500 | 1,647 | ||||||||||
San Juan Unified School District, California General Obligation Bonds, Series 2024 | ||||||||||||
4.000% due 08/01/2049 | 1,500 | 1,489 | ||||||||||
San Marcos Redevelopment Agency Successor Agency, California Tax Allocation Bonds, Series 2015 | ||||||||||||
5.000% due 10/01/2034 | 885 | 901 | ||||||||||
San Mateo County, California Community College District General Obligation Bonds, (NPFGC Insured), Series 2006 | ||||||||||||
0.000% due 09/01/2034 (c) | 2,530 | 1,782 | ||||||||||
San Mateo Joint Powers Financing Authority, California Revenue Bonds, Series 2018 | ||||||||||||
4.000% due 07/15/2052 | 1,550 | 1,554 | ||||||||||
Santa Ana Unified School District, California General Obligation Bonds, Series 2019 | ||||||||||||
4.000% due 08/01/2048 | 1,250 | 1,244 | ||||||||||
Santa Clarita Community College District, California General Obligation Bonds, Series 2016 | ||||||||||||
4.000% due 08/01/2046 | 1,800 | 1,764 | ||||||||||
Santa Monica, California Community College District General Obligation Bonds, Series 2022 | ||||||||||||
4.000% due 08/01/2045 | 1,040 | 1,054 | ||||||||||
Silicon Valley Tobacco Securitization Authority, California Revenue Bonds, Series 2007 | ||||||||||||
0.000% due 06/01/2036 (c) | 1,000 | 522 | ||||||||||
South San Francisco Unified School, California General Obligation Bonds, Series 2023 | ||||||||||||
4.000% due 09/01/2048 | 2,000 | 1,990 | ||||||||||
Southwestern Community College District, California General Obligation Bonds, Series 2021 | ||||||||||||
4.000% due 08/01/2046 | 3,850 | 3,862 | ||||||||||
State Center Community College District, California General Obligation Bonds, Series 2022 | ||||||||||||
5.000% due 08/01/2047 | 1,495 | 1,644 | ||||||||||
Sweetwater Union High School District, California General Obligation Bonds, Series 2022 | ||||||||||||
5.000% due 08/01/2052 | 1,785 | 1,928 | ||||||||||
Tobacco Securitization Authority of Northern California Revenue Bonds, Series 2021 | ||||||||||||
0.000% due 06/01/2060 (c) | 20,000 | 3,277 | ||||||||||
Tobacco Securitization Authority of Southern California Revenue Bonds, Series 2006 | ||||||||||||
0.000% due 06/01/2046 (c) | 3,995 | 755 | ||||||||||
Tobacco Securitization Authority of Southern California Revenue Bonds, Series 2019 | ||||||||||||
5.000% due 06/01/2048 | 1,325 | 1,360 | ||||||||||
University of California Revenue Bonds, Series 2018 | ||||||||||||
4.000% due 05/15/2043 | 1,050 | 1,050 | ||||||||||
University of California Revenue Bonds, Series 2022 | ||||||||||||
5.000% due 05/15/2052 | 4,500 | 4,897 | ||||||||||
University of California Revenue Bonds, Series 2024 | ||||||||||||
5.000% due 05/15/2043 | 800 | 906 | ||||||||||
Upland, California Certificates of Participation Bonds, Series 2017 | ||||||||||||
4.000% due 01/01/2042 | 2,250 | 2,043 | ||||||||||
Victor Valley Community College District, California General Obligation Bonds, Series 2024 | ||||||||||||
5.000% due 08/01/2051 | 660 | 719 |
40 | PIMCO CLOSED-END FUNDS | See Accompanying Notes |
JUNE 30, 2024 | (Unaudited) |
PRINCIPAL AMOUNT (000S) | MARKET VALUE (000S) | |||||||||||
Washington Township Health Care District, California General Obligation Bonds, Series 2015 | ||||||||||||
4.000% due 08/01/2045 | $ | 2,500 | $ | 2,452 | ||||||||
Washington Township Health Care District, California General Obligation Bonds, Series 2023 | ||||||||||||
5.500% due 08/01/2053 | 1,270 | 1,416 | ||||||||||
263,601 | ||||||||||||
DELAWARE 1.4% | ||||||||||||
Affordable Housing Opportunities Trust, Delaware Revenue Bonds, Series 2022 | ||||||||||||
3.167% due 10/01/2038 | 2,370 | 2,032 | ||||||||||
7.120% due 10/01/2038 | 420 | 404 | ||||||||||
2,436 | ||||||||||||
ILLINOIS 0.6% | ||||||||||||
Illinois State General Obligation Notes, Series 2017 | ||||||||||||
5.000% due 11/01/2027 | 1,000 | 1,046 | ||||||||||
NEW HAMPSHIRE 1.0% | ||||||||||||
New Hampshire Business Finance Authority Revenue Bonds, Series 2023 | ||||||||||||
4.817% due 12/20/2036 | 1,674 | 1,692 | ||||||||||
NEW YORK 0.2% | ||||||||||||
New York Power Authority Revenue Bonds, Series 2020 | ||||||||||||
4.000% due 11/15/2055 | 425 | 409 | ||||||||||
NORTH DAKOTA 0.0% | ||||||||||||
Grand Forks County, North Dakota Revenue Bonds, Series 2021 | ||||||||||||
7.000% due 12/15/2043 ^(b) | 570 | 17 | ||||||||||
PENNSYLVANIA 0.6% | ||||||||||||
Pennsylvania Economic Development Financing Authority Revenue Bonds, Series 2021 | ||||||||||||
9.000% due 04/01/2051 | 1,005 | 1,106 | ||||||||||
PRINCIPAL AMOUNT (000S) | MARKET VALUE (000S) | |||||||||||
PUERTO RICO 7.9% | ||||||||||||
Children’s Trust Fund, Puerto Rico Revenue Bonds, Series 2008 | ||||||||||||
0.000% due 05/15/2057 (c) | $ | 18,000 | $ | 1,251 | ||||||||
Commonwealth of Puerto Rico Bonds, Series 2022 | ||||||||||||
0.000% due 11/01/2043 | 1,890 | 1,160 | ||||||||||
0.000% due 11/01/2051 | 2,591 | 1,515 | ||||||||||
Commonwealth of Puerto Rico General Obligation Bonds, Series 2021 | ||||||||||||
0.000% due 07/01/2033 (c) | 1,000 | 669 | ||||||||||
4.000% due 07/01/2041 | 1,000 | 935 | ||||||||||
Puerto Rico Sales Tax Financing Corp. Sales Tax Revenue Bonds, Series 2018 | ||||||||||||
0.000% due 07/01/2046 (c) | 7,700 | 2,490 | ||||||||||
0.000% due 07/01/2051 (c) | 6,630 | 1,560 | ||||||||||
Puerto Rico Sales Tax Financing Corp. Sales Tax Revenue Bonds, Series 2019 | ||||||||||||
4.784% due 07/01/2058 | 4,280 | 4,233 | ||||||||||
13,813 | ||||||||||||
TEXAS 0.5% | ||||||||||||
Angelina & Neches River Authority, Texas Revenue Bonds, Series 2021 | ||||||||||||
7.500% due 12/01/2045 | 390 | 263 | ||||||||||
12.000% due 12/01/2045 | 650 | 572 | ||||||||||
835 | ||||||||||||
VIRGINIA 0.6% | ||||||||||||
Virginia Small Business Financing Authority Revenue Bonds, Series 2019 | ||||||||||||
0.000% due 07/01/2061 (c) | 15,000 | 482 | ||||||||||
5.500% due 07/01/2044 | 500 | 457 | ||||||||||
939 | ||||||||||||
WISCONSIN 0.5% | ||||||||||||
Wisconsin Center District Revenue Bonds, (AGM Insured), Series 2020 | ||||||||||||
0.000% due 12/15/2055 (c) | 4,100 | 879 | ||||||||||
Total Municipal Bonds & Notes (Cost $286,152) | 286,817 | |||||||||||
PRINCIPAL AMOUNT (000S) | MARKET VALUE (000S) | |||||||||||
U.S. GOVERNMENT AGENCIES 2.9% | ||||||||||||
Freddie Mac | ||||||||||||
3.600% due 12/01/2040 | $ | 1,993 | $ | 1,824 | ||||||||
3.720% due 01/01/2041 | 1,694 | 1,584 | ||||||||||
3.850% due 02/01/2038 | 1,797 | 1,721 | ||||||||||
Total U.S. Government Agencies (Cost $5,067) | 5,129 | |||||||||||
SHORT-TERM INSTRUMENTS 2.9% | ||||||||||||
REPURCHASE AGREEMENTS (f) 1.7% | ||||||||||||
2,955 | ||||||||||||
MUNICIPAL BONDS & NOTES 1.2% | ||||||||||||
Los Angeles County, California Revenue Notes, Series 2024 | ||||||||||||
5.000% due 06/30/2025 (a) | 2,000 | 2,033 | ||||||||||
Total Municipal Bonds & Notes (Cost $2,034) | 2,033 | |||||||||||
Total Short-Term Instruments (Cost $4,989) | 4,988 | |||||||||||
Total Investments in Securities (Cost $296,208) | 296,934 | |||||||||||
Total Investments 170.3% (Cost $296,208) | $ | 296,934 | ||||||||||
Auction Rate Preferred Shares (0.6)% | (1,125 | ) | ||||||||||
Remarketable Variable Rate MuniFund Term Preferred Shares, at liquidation value (67.8)% | (118,269 | ) | ||||||||||
Other Assets and Liabilities, net (1.9)% | (3,296 | ) | ||||||||||
Net Assets Applicable to Common Shareholders 100.0% | $ | 174,244 | ||||||||||
* | A zero balance may reflect actual amounts rounding to less than one thousand. |
^ | Security is in default. |
(a) | When-issued security. |
(b) | Security is not accruing income as of the date of this report. |
(c) | Zero coupon security. |
(d) | Security becomes interest bearing at a future date. |
Issuer Description | Coupon | Maturity Date | Acquisition Date | Cost | Market Value | Market Value as Percentage of Net Assets Applicable to Common Shareholders | ||||||||||||||||||
California Municipal Finance Authority Revenue Bonds, Series 2021 | 4.000% | 09/01/2050 | 08/03/2022 | $ | 1,089 | $ | 1,016 | 0.58% | ||||||||||||||||
Counterparty | Lending Rate | Settlement Date | Maturity Date | Principal Amount | Collateralized By | Collateral (Received) | Repurchase Agreements, at Value | Repurchase Agreement Proceeds to be Received (1) | ||||||||||||||||||||||
FICC | 2.600 | % | 06/28/2024 | 07/01/2024 | $ | 2,955 | U.S. Treasury Inflation Protected Securities 0.625% due 01/15/2026 | $ | (3,014 | ) | $ | 2,955 | $ | 2,956 | ||||||||||||||||
Total Repurchase Agreements | $ | (3,014 | ) | $ | 2,955 | $ | 2,956 | |||||||||||||||||||||||
See Accompanying Notes | SEMIANNUAL REPORT | | | JUNE 30, 2024 | 41 |
Schedule of Investments | PIMCO California Municipal Income Fund III | (Cont.) | June 30, 2024 | (Unaudited) |
Counterparty | Repurchase Agreement Proceeds to be Received (1) | Payable for Reverse Repurchase Agreements | Payable for Sale-Buyback Transactions | Total Borrowings and Other Financing Transactions | Collateral Pledged/(Received) | Net Exposure (2) | ||||||||||||||||||
Global/Master Repurchase Agreement | ||||||||||||||||||||||||
FICC | $ | 2,956 | $ | 0 | $ | 0 | $ | 2,956 | $ | (3,014 | ) | $ | (58 | ) | ||||||||||
Total Borrowings and Other Financing Transactions | $ | 2,956 | $ | 0 | $ | 0 | ||||||||||||||||||
(1) | Includes accrued interest. |
(2) | Net Exposure represents the net receivable/(payable) that would be due from/to the counterparty in the event of default. Exposure from borrowings and other financing transactions can only be netted across transactions governed under the same master agreement with the same legal entity. See Note 7, Master Netting Arrangements, in the Notes to Financial Statements for more information. |
Category and Subcategory | Level 1 | Level 2 | Level 3 | Fair Value at 06/30/2024 | ||||||||||||
Investments in Securities, at Value | ||||||||||||||||
Municipal Bonds & Notes | ||||||||||||||||
Arizona | $ | 0 | $ | 44 | $ | 0 | $ | 44 | ||||||||
California | 0 | 263,601 | 0 | 263,601 | ||||||||||||
Delaware | 0 | 2,436 | 0 | 2,436 | ||||||||||||
Illinois | 0 | 1,046 | 0 | 1,046 | ||||||||||||
New Hampshire | 0 | 1,692 | 0 | 1,692 | ||||||||||||
New York | 0 | 409 | 0 | 409 | ||||||||||||
North Dakota | 0 | 17 | 0 | 17 | ||||||||||||
Pennsylvania | 0 | 1,106 | 0 | 1,106 | ||||||||||||
Puerto Rico | 0 | 13,813 | 0 | 13,813 |
Category and Subcategory | Level 1 | Level 2 | Level 3 | Fair Value at 06/30/2024 | ||||||||||||
Texas | $ | 0 | $ | 835 | $ | 0 | $ | 835 | ||||||||
Virginia | 0 | 939 | 0 | 939 | ||||||||||||
Wisconsin | 0 | 879 | 0 | 879 | ||||||||||||
U.S. Government Agencies | 0 | 5,129 | 0 | 5,129 | ||||||||||||
Short-Term Instruments | ||||||||||||||||
Repurchase Agreements | 0 | 2,955 | 0 | 2,955 | ||||||||||||
Municipal Bonds & Notes | 0 | 2,033 | 0 | 2,033 | ||||||||||||
Total Investments | $ | 0 | $ | 296,934 | $ | 0 | $ | 296,934 | ||||||||
42 | PIMCO CLOSED-END FUNDS | See Accompanying Notes |
Schedule of Investments | PIMCO New York Municipal Income Fund | June 30, 2024 | (Unaudited) |
PRINCIPAL AMOUNT (000S) | MARKET VALUE (000S) | |||||||||||
INVESTMENTS IN SECURITIES 159.1% | ||||||||||||
MUNICIPAL BONDS & NOTES 158.9% | ||||||||||||
ARIZONA 0.0% | ||||||||||||
Arizona Industrial Development Authority Revenue Bonds, Series 2020 | ||||||||||||
7.750% due 07/01/2050 ^(a) | $ | 300 | $ | 18 | ||||||||
CALIFORNIA 1.3% | ||||||||||||
California Health Facilities Financing Authority Revenue Bonds, Series 2016 | ||||||||||||
5.000% due 11/15/2046 | 890 | 910 | ||||||||||
DELAWARE 1.4% | ||||||||||||
Affordable Housing Opportunities Trust, Delaware Revenue Bonds, Series 2022 | ||||||||||||
3.167% due 10/01/2038 | 970 | 832 | ||||||||||
7.120% due 10/01/2038 | 175 | 168 | ||||||||||
1,000 | ||||||||||||
FLORIDA 5.2% | ||||||||||||
Florida Development Finance Corp. Revenue Bonds, (AGM Insured), Series 2024 | ||||||||||||
5.250% due 07/01/2047 | 1,700 | 1,790 | ||||||||||
5.250% due 07/01/2053 | 1,700 | 1,781 | ||||||||||
3,571 | ||||||||||||
NEW HAMPSHIRE 1.0% | ||||||||||||
New Hampshire Business Finance Authority Revenue Notes, Series 2023 | ||||||||||||
5.087% due 07/20/2027 | 655 | 671 | ||||||||||
NEW YORK 143.5% | ||||||||||||
Albany Capital Resource Corp., New York Revenue Bonds, Series 2024 | ||||||||||||
4.750% due 06/01/2054 | 400 | 397 | ||||||||||
Build NYC Resource Corp., New York Revenue Bonds, Series 2018 | ||||||||||||
5.625% due 12/01/2050 | 1,190 | 1,074 | ||||||||||
Build NYC Resource Corp., New York Revenue Bonds, Series 2023 | ||||||||||||
5.250% due 07/01/2062 | 750 | 773 | ||||||||||
Dutchess County, New York Local Development Corp. Revenue Bonds, Series 2017 | ||||||||||||
4.000% due 07/01/2046 | 435 | 425 | ||||||||||
Dutchess County, New York Local Development Corp. Revenue Bonds, Series 2020 | ||||||||||||
5.000% due 07/01/2045 | 410 | 428 | ||||||||||
Dutchess County, New York Local Development Corp. Revenue Bonds, Series 2022 | ||||||||||||
4.000% due 07/01/2049 | 765 | 715 | ||||||||||
Erie County, New York Industrial Development Agency Revenue Bonds, (FNMA Insured), Series 2023 | ||||||||||||
4.250% due 02/01/2041 | 1,400 | 1,341 | ||||||||||
Housing Development Corp., New York Revenue Bonds, Series 2017 | ||||||||||||
3.700% due 11/01/2047 | 1,000 | 892 | ||||||||||
Huntington Local Development Corp., New York Revenue Bonds, Series 2021 | ||||||||||||
5.250% due 07/01/2056 | 500 | 413 | ||||||||||
Long Island Power Authority, New York Revenue Bonds, Series 2023 | ||||||||||||
5.000% due 09/01/2048 | 1,000 | 1,087 | ||||||||||
Metropolitan Transportation Authority, New York Revenue Bonds, Series 2014 | ||||||||||||
5.000% due 11/15/2039 | 1,000 | 1,003 | ||||||||||
Metropolitan Transportation Authority, New York Revenue Bonds, Series 2015 | ||||||||||||
4.900% due 11/15/2050 | 1,000 | 1,000 |
PRINCIPAL AMOUNT (000S) | MARKET VALUE (000S) | |||||||||||
Metropolitan Transportation Authority, New York Revenue Bonds, Series 2016 | ||||||||||||
5.000% due 11/15/2031 | $ | 2,500 | $ | 2,577 | ||||||||
5.000% due 11/15/2051 | 1,000 | 1,018 | ||||||||||
Monroe County Industrial Development Corp, New York Revenue Bonds, Series 2023 | ||||||||||||
5.000% due 07/01/2053 | 750 | 812 | ||||||||||
Monroe County Industrial Development Corp., New York Revenue Bonds, Series 2020 | ||||||||||||
4.000% due 07/01/2050 | 750 | 721 | ||||||||||
Nassau County, New York General Obligation Bonds, (AGM Insured), Series 2018 | ||||||||||||
5.000% due 04/01/2036 | 2,000 | 2,117 | ||||||||||
Nassau County, New York Industrial Development Agency Revenue Bonds, Series 2021 | ||||||||||||
5.000% due 01/01/2058 ^(a) | 1,092 | 327 | ||||||||||
Nassau County, New York Tobacco Settlement Corp. Revenue Bonds, Series 2006 | ||||||||||||
5.125% due 06/01/2046 | 1,230 | 1,130 | ||||||||||
New York City Housing Development Corp., New York Revenue Bonds, Series 2024 | ||||||||||||
4.850% due 11/01/2059 | 500 | 503 | ||||||||||
New York City Water & Sewer System, New York Revenue Bonds, Series 2016 | ||||||||||||
4.000% due 06/15/2046 | 830 | 821 | ||||||||||
New York City Water & Sewer System, New York Revenue Bonds, Series 2018 | ||||||||||||
5.000% due 06/15/2040 | 2,700 | 2,815 | ||||||||||
New York City, New York General Obligation Bonds, Series 2018 | ||||||||||||
5.000% due 04/01/2045 | 1,300 | 1,345 | ||||||||||
New York City, New York General Obligation Bonds, Series 2024 | ||||||||||||
5.250% due 03/01/2053 | 800 | 884 | ||||||||||
5.250% due 04/01/2054 | 1,300 | 1,436 | ||||||||||
New York City, New York Health and Hospitals Corp. Revenue Bonds, Series 2021 | ||||||||||||
4.000% due 02/15/2048 | 880 | 838 | ||||||||||
New York City, New York Municipal Water Finance Authority Revenue Bonds, Series 2020 | ||||||||||||
4.000% due 06/15/2050 | 600 | 582 | ||||||||||
New York City, New York Municipal Water Finance Authority Revenue Bonds, Series 2022 | ||||||||||||
5.250% due 06/15/2052 | 2,000 | 2,193 | ||||||||||
New York City, New York Municipal Water Finance Authority Revenue Bonds, Series 2023 | ||||||||||||
5.250% due 06/15/2048 | 700 | 778 | ||||||||||
5.250% due 06/15/2053 | 700 | 773 | ||||||||||
New York City, New York Transitional Finance Authority Future Tax Secured Revenue Bonds, Series 2022 | ||||||||||||
5.250% due 11/01/2048 | 3,500 | 3,852 | ||||||||||
New York Convention Center Development Corp. Revenue Bonds, Series 2016 | ||||||||||||
5.000% due 11/15/2046 | 750 | 765 | ||||||||||
New York County, New York Tobacco Trust Revenue Bonds, Series 2005 | ||||||||||||
0.000% due 06/01/2050 (b) | 20,000 | 4,460 | ||||||||||
0.000% due 06/01/2055 (b) | 7,000 | 596 | ||||||||||
New York Liberty Development Corp. Revenue Bonds, Series 2005 | ||||||||||||
5.250% due 10/01/2035 | 770 | 890 | ||||||||||
New York Liberty Development Corp. Revenue Bonds, Series 2007 | ||||||||||||
5.500% due 10/01/2037 | 750 | 890 | ||||||||||
New York Liberty Development Corp. Revenue Bonds, Series 2014 | ||||||||||||
5.000% due 11/15/2044 | 1,650 | 1,652 | ||||||||||
New York Liberty Development Corp. Revenue Bonds, Series 2021 | ||||||||||||
2.875% due 11/15/2046 | 440 | 323 | ||||||||||
New York Mortgage Agency Homeowner Mortgage State Revenue Bonds, Series 2015 | ||||||||||||
3.800% due 04/01/2028 | 500 | 488 |
PRINCIPAL AMOUNT (000S) | MARKET VALUE (000S) | |||||||||||
New York Power Authority Revenue Bonds, (AGM Insured), Series 2022 | ||||||||||||
4.000% due 11/15/2047 | $ | 750 | $ | 732 | ||||||||
4.000% due 11/15/2061 | 750 | 718 | ||||||||||
New York Power Authority Revenue Bonds, Series 2020 | ||||||||||||
4.000% due 11/15/2055 | 2,100 | 2,021 | ||||||||||
New York State Dormitory Authority Memorial Sloan-Kettering Cancer Revenue Bonds, Series 2022 | ||||||||||||
4.000% due 07/01/2051 | 1,200 | 1,155 | ||||||||||
New York State Dormitory Authority Revenue Bonds, (AGM/CR Insured), Series 2022 | ||||||||||||
4.250% due 05/01/2052 | 850 | 855 | ||||||||||
New York State Dormitory Authority Revenue Bonds, Series 2017 | ||||||||||||
4.000% due 02/15/2047 | 500 | 486 | ||||||||||
New York State Dormitory Authority Revenue Bonds, Series 2018 | ||||||||||||
4.000% due 07/01/2041 | 750 | 751 | ||||||||||
4.000% due 03/15/2043 | 1,000 | 979 | ||||||||||
New York State Dormitory Authority Revenue Bonds, Series 2019 | ||||||||||||
4.000% due 07/01/2044 | 1,200 | 1,182 | ||||||||||
New York State Dormitory Authority Revenue Bonds, Series 2020 | ||||||||||||
4.000% due 07/01/2050 | 4,355 | 4,250 | ||||||||||
5.000% due 07/01/2053 | 650 | 687 | ||||||||||
New York State Dormitory Authority Revenue Bonds, Series 2022 | ||||||||||||
4.000% due 07/01/2049 | 345 | 323 | ||||||||||
5.000% due 07/15/2050 | 345 | 346 | ||||||||||
New York State Dormitory Authority Revenue Bonds, Series 2023 | ||||||||||||
5.000% due 07/01/2048 | 300 | 323 | ||||||||||
New York State Dormitory Authority Revenue Bonds, Series 2024 | ||||||||||||
5.500% due 07/01/2054 | 1,400 | 1,597 | ||||||||||
New York State Environmental Facilities Corp. Revenue Bonds, Series 2022 | ||||||||||||
4.000% due 06/15/2047 | 1,750 | 1,747 | ||||||||||
New York State Housing Finance Agency Revenue Bonds, Series 2024 | ||||||||||||
4.600% due 11/01/2054 | 850 | 848 | ||||||||||
New York State Thruway Authority Revenue Bonds, Series 2019 | ||||||||||||
4.000% due 01/01/2039 | 1,250 | 1,255 | ||||||||||
New York State Thruway Authority Revenue Bonds, Series 2021 | ||||||||||||
4.000% due 01/01/2040 | 750 | 754 | ||||||||||
New York State Thruway Authority Revenue Bonds, Series 2022 | ||||||||||||
5.000% due 03/15/2055 | 400 | 431 | ||||||||||
New York State Urban Development Corp. Revenue Bonds, Series 2019 | ||||||||||||
4.000% due 03/15/2045 | 600 | 586 | ||||||||||
New York State Urban Development Corp. Revenue Bonds, Series 2023 | ||||||||||||
5.000% due 03/15/2047 | 4,000 | 4,369 | ||||||||||
5.000% due 03/15/2063 | 1,500 | 1,610 | ||||||||||
New York Transportation Development Corp. Revenue Bonds, (AGM Insured), Series 2023 | ||||||||||||
5.125% due 06/30/2060 | 1,200 | 1,243 | ||||||||||
New York Transportation Development Corp. Revenue Bonds, Series 2016 | ||||||||||||
5.000% due 07/01/2046 | 700 | 700 | ||||||||||
5.250% due 01/01/2050 | 855 | 855 | ||||||||||
New York Transportation Development Corp. Revenue Bonds, Series 2020 | ||||||||||||
4.375% due 10/01/2045 | 1,670 | 1,638 | ||||||||||
5.000% due 10/01/2040 | 800 | 833 | ||||||||||
Onondaga County, New York Trust for Cultural Resources Revenue Bonds, Series 2019 | ||||||||||||
4.000% due 12/01/2049 | 1,300 | 1,256 | ||||||||||
Port Authority of New York & New Jersey Revenue Bonds, Series 2017 | ||||||||||||
5.250% due 10/15/2057 | 4,500 | 4,667 |
See Accompanying Notes | SEMIANNUAL REPORT | | | JUNE 30, 2024 | 43 |
Schedule of Investments | PIMCO New York Municipal Income Fund | (Cont.) |
PRINCIPAL AMOUNT (000S) | MARKET VALUE (000S) | |||||||||||
Port Authority of New York & New Jersey Revenue Bonds, Series 2020 | ||||||||||||
4.000% due 07/15/2060 | $ | 350 | $ | 317 | ||||||||
Port Authority of New York & New Jersey Revenue Bonds, Series 2023 | ||||||||||||
5.000% due 12/01/2043 | 475 | 507 | ||||||||||
Riverhead IDA Economic Job Development Corp., New York Revenue Bonds, (FNMA Insured), Series 2023 | ||||||||||||
4.500% due 02/01/2041 | 700 | 709 | ||||||||||
Schenectady County Capital Resource Corp. Union College Project, New York Revenue Notes, Series 2022 | ||||||||||||
5.000% due 07/01/2032 | 340 | 387 | ||||||||||
Suffolk County, New York Economic Development Corp. Revenue Bonds, Series 2021 | ||||||||||||
5.125% due 11/01/2041 | 350 | 308 | ||||||||||
Suffolk Tobacco Asset Securitization Corp., New York Revenue Bonds, Series 2021 | ||||||||||||
0.000% due 06/01/2066 (b) | 5,000 | 496 | ||||||||||
4.000% due 06/01/2050 | 500 | 447 | ||||||||||
The Genesee County Funding Corporation Tax-Exempt, New York Revenue Bonds, Series 2022 | ||||||||||||
5.250% due 12/01/2052 | 1,000 | 1,036 | ||||||||||
Town of Hempstead, New York General Obligation Bonds, Series 2024 | ||||||||||||
4.000% due 05/01/2047 | 750 | 747 | ||||||||||
Triborough Bridge & Tunnel Authority Sales Tax, New York Revenue Bonds, Series 2022 | ||||||||||||
5.250% due 05/15/2062 | 1,500 | 1,629 | ||||||||||
Triborough Bridge & Tunnel Authority Sales Tax, New York Revenue Bonds, Series 2024 | ||||||||||||
5.000% due 05/15/2049 | 700 | 767 | ||||||||||
Triborough Bridge & Tunnel Authority, New York Revenue Bonds, Series 2019 | ||||||||||||
5.000% due 11/15/2043 | 500 | 524 | ||||||||||
Triborough Bridge & Tunnel Authority, New York Revenue Bonds, Series 2021 | ||||||||||||
5.000% due 05/15/2051 | 300 | 321 | ||||||||||
Triborough Bridge & Tunnel Authority, New York Revenue Bonds, Series 2024 | ||||||||||||
5.250% due 05/15/2054 | 1,300 | 1,442 | ||||||||||
TSASC, Inc., New York Revenue Bonds, Series 2017 | ||||||||||||
5.000% due 06/01/2041 | 2,000 | 2,035 |
PRINCIPAL AMOUNT (000S) | MARKET VALUE (000S) | |||||||||||
Ulster County, New York Capital Resource Corp. Revenue Bonds, Series 2017 | ||||||||||||
5.250% due 09/15/2047 | $ | 500 | $ | 412 | ||||||||
Utility Debt Securitization Authority, New York Revenue Bonds, Series 2023 | ||||||||||||
5.000% due 12/15/2050 | 2,500 | 2,769 | ||||||||||
99,184 | ||||||||||||
NORTH DAKOTA 0.0% | ||||||||||||
Grand Forks County, North Dakota Revenue Bonds, Series 2021 | ||||||||||||
7.000% due 12/15/2043 ^(a) | 230 | 7 | ||||||||||
PENNSYLVANIA 0.7% | ||||||||||||
Pennsylvania Economic Development Financing Authority Revenue Bonds, Series 2021 | ||||||||||||
9.000% due 04/01/2051 | 425 | 468 | ||||||||||
PUERTO RICO 3.7% | ||||||||||||
Children’s Trust Fund, Puerto Rico Revenue Bonds, Series 2008 | ||||||||||||
0.000% due 05/15/2057 (b) | 7,700 | 532 | ||||||||||
Commonwealth of Puerto Rico Bonds, Series 2022 | ||||||||||||
0.000% due 11/01/2043 | 818 | 502 | ||||||||||
0.000% due 11/01/2051 | 766 | 484 | ||||||||||
Commonwealth of Puerto Rico General Obligation Bonds, Series 2021 | ||||||||||||
4.000% due 07/01/2041 | 450 | 421 | ||||||||||
Puerto Rico Sales Tax Financing Corp. Sales Tax Revenue Bonds, Series 2018 | ||||||||||||
0.000% due 07/01/2051 (b) | 2,580 | 607 | ||||||||||
2,546 | ||||||||||||
TEXAS 0.5% | ||||||||||||
Angelina & Neches River Authority, Texas Revenue Bonds, Series 2021 | ||||||||||||
7.500% due 12/01/2045 | 160 | 108 |
PRINCIPAL AMOUNT (000S) | MARKET VALUE (000S) | |||||||||||
12.000% due 12/01/2045 | $ | 275 | $ | 242 | ||||||||
350 | ||||||||||||
VIRGINIA 0.9% | ||||||||||||
Virginia Small Business Financing Authority Revenue Bonds, Series 2019 | ||||||||||||
0.000% due 07/01/2061 (b) | 6,000 | 193 | ||||||||||
5.500% due 07/01/2044 | 500 | 456 | ||||||||||
649 | ||||||||||||
WISCONSIN 0.7% | ||||||||||||
Wisconsin Health & Educational Facilities Authority Revenue Bonds, Series 2022 | ||||||||||||
4.000% due 12/01/2051 | 525 | 484 | ||||||||||
Total Municipal Bonds & Notes (Cost $110,493) | 109,858 | |||||||||||
SHORT-TERM INSTRUMENTS 0.2% | ||||||||||||
REPURCHASE AGREEMENTS (c) 0.2% | ||||||||||||
140 | ||||||||||||
Total Short-Term Instruments (Cost $140) | 140 | |||||||||||
Total Investments in Securities (Cost $110,633) | 109,998 | |||||||||||
Total Investments 159.1% (Cost $110,633) | $ | 109,998 | ||||||||||
Auction Rate Preferred Shares (0.7)% | (475 | ) | ||||||||||
Remarketable Variable Rate MuniFund Term Preferred Shares, at liquidation value (59.1)% | (40,903 | ) | ||||||||||
Other Assets and Liabilities, net 0.7% | 493 | |||||||||||
Net Assets Applicable to Common Shareholders 100.0% | $ | 69,113 | ||||||||||
* | A zero balance may reflect actual amounts rounding to less than one thousand. |
^ | Security is in default. |
(a) | Security is not accruing income as of the date of this report. |
(b) | Zero coupon security. |
Counterparty | Lending Rate | Settlement Date | Maturity Date | Principal Amount | Collateralized By | Collateral (Received) | Repurchase Agreements, at Value | Repurchase Agreement Proceeds to be Received (1) | ||||||||||||||||||||||
FICC | 2.600 | % | 06/28/2024 | 07/01/2024 | $ | 140 | U.S. Treasury Inflation Protected Securities 0.625% due 01/15/2026 | $ | (143 | ) | $ | 140 | $ | 140 | ||||||||||||||||
Total Repurchase Agreements | $ | (143 | ) | $ | 140 | $ | 140 | |||||||||||||||||||||||
44 | PIMCO CLOSED-END FUNDS | See Accompanying Notes |
June 30, 2024 | (Unaudited) |
Counterparty | Repurchase Agreement Proceeds to be Received (1) | Payable for Reverse Repurchase Agreements | Payable for Sale-Buyback Transactions | Total Borrowings and Other Financing Transactions | Collateral Pledged/(Received) | Net Exposure (2) | ||||||||||||||||||
Global/Master Repurchase Agreement | ||||||||||||||||||||||||
FICC | $ | 140 | $ | 0 | $ | 0 | $ | 140 | $ | (143 | ) | $ | (3 | ) | ||||||||||
Total Borrowings and Other Financing Transactions | $ | 140 | $ | 0 | $ | 0 | ||||||||||||||||||
(1) | Includes accrued interest. |
(2) | Net Exposure represents the net receivable/(payable) that would be due from/to the counterparty in the event of default. Exposure from borrowings and other financing transactions can only be netted across transactions governed under the same master agreement with the same legal entity. See Note 7, Master Netting Arrangements, in the Notes to Financial Statements for more information. |
Category and Subcategory | Level 1 | Level 2 | Level 3 | Fair Value at 06/30/2024 | ||||||||||||
Investments in Securities, at Value | ||||||||||||||||
Municipal Bonds & Notes | ||||||||||||||||
Arizona | $ | 0 | $ | 18 | $ | 0 | $ | 18 | ||||||||
California | 0 | 910 | 0 | 910 | ||||||||||||
Delaware | 0 | 1,000 | 0 | 1,000 | ||||||||||||
Florida | 0 | 3,571 | 0 | 3,571 | ||||||||||||
New Hampshire | 0 | 671 | 0 | 671 | ||||||||||||
New York | 0 | 99,184 | 0 | 99,184 | ||||||||||||
North Dakota | 0 | 7 | 0 | 7 | ||||||||||||
Pennsylvania | 0 | 468 | 0 | 468 |
Category and Subcategory | Level 1 | Level 2 | Level 3 | Fair Value at 06/30/2024 | ||||||||||||
Puerto Rico | $ | 0 | $ | 2,546 | $ | 0 | $ | 2,546 | ||||||||
Texas | 0 | 350 | 0 | 350 | ||||||||||||
Virginia | 0 | 649 | 0 | 649 | ||||||||||||
Wisconsin | 0 | 484 | 0 | 484 | ||||||||||||
Short-Term Instruments | ||||||||||||||||
Repurchase Agreements | 0 | 140 | 0 | 140 | ||||||||||||
Total Investments | $ | 0 | $ | 109,998 | $ | 0 | $ | 109,998 | ||||||||
See Accompanying Notes | SEMIANNUAL REPORT | | | JUNE 30, 2024 | 45 |
Schedule of Investments | PIMCO New York Municipal Income Fund II |
PRINCIPAL AMOUNT (000S) | MARKET VALUE (000S) | |||||||||||
INVESTMENTS IN SECURITIES 167.8% | ||||||||||||
MUNICIPAL BONDS & NOTES 165.7% | ||||||||||||
ARIZONA 0.0% | ||||||||||||
Arizona Industrial Development Authority Revenue Bonds, Series 2020 | ||||||||||||
7.750% due 07/01/2050 ^(a) | $ | 400 | $ | 24 | ||||||||
DELAWARE 1.4% | ||||||||||||
Affordable Housing Opportunities Trust, Delaware Revenue Bonds, Series 2022 | ||||||||||||
3.167% due 10/01/2038 | 1,320 | 1,131 | ||||||||||
7.120% due 10/01/2038 | 235 | 226 | ||||||||||
1,357 | ||||||||||||
FLORIDA 5.1% | ||||||||||||
Florida Development Finance Corp. Revenue Bonds, (AGM Insured), Series 2024 | ||||||||||||
5.250% due 07/01/2047 | 2,300 | 2,422 | ||||||||||
5.250% due 07/01/2053 | 2,300 | 2,409 | ||||||||||
4,831 | ||||||||||||
ILLINOIS 1.1% | ||||||||||||
Chicago, Illinois General Obligation Bonds, Series 2017 | ||||||||||||
6.000% due 01/01/2038 | 1,000 | 1,041 | ||||||||||
NEW HAMPSHIRE 1.1% | ||||||||||||
New Hampshire Business Finance Authority Revenue Notes, Series 2023 | ||||||||||||
5.087% due 07/20/2027 | 974 | 998 | ||||||||||
NEW YORK 150.2% | ||||||||||||
Albany Capital Resource Corp., New York Revenue Bonds, Series 2024 | ||||||||||||
4.750% due 06/01/2054 | 600 | 596 | ||||||||||
Build NYC Resource Corp., New York Revenue Bonds, Series 2018 | ||||||||||||
5.625% due 12/01/2050 | 1,745 | 1,574 | ||||||||||
Build NYC Resource Corp., New York Revenue Bonds, Series 2023 | ||||||||||||
5.250% due 07/01/2062 | 1,250 | 1,288 | ||||||||||
Dutchess County, New York Local Development Corp. Revenue Bonds, Series 2015 | ||||||||||||
5.000% due 07/01/2045 | 3,000 | 3,018 | ||||||||||
Dutchess County, New York Local Development Corp. Revenue Bonds, Series 2017 | ||||||||||||
4.000% due 07/01/2046 | 590 | 577 | ||||||||||
Erie County, New York Industrial Development Agency Revenue Bonds, (FNMA Insured), Series 2023 | ||||||||||||
4.250% due 02/01/2041 | 1,900 | 1,819 | ||||||||||
Housing Development Corp., New York Revenue Bonds, Series 2017 | ||||||||||||
3.700% due 11/01/2047 | 1,000 | 892 | ||||||||||
Huntington Local Development Corp., New York Revenue Bonds, Series 2021 | ||||||||||||
5.250% due 07/01/2056 | 700 | 579 | ||||||||||
Long Island Power Authority, New York Revenue Bonds, Series 2014 | ||||||||||||
5.000% due 09/01/2044 | 3,500 | 3,505 | ||||||||||
Long Island Power Authority, New York Revenue Bonds, Series 2023 | ||||||||||||
5.000% due 09/01/2048 | 1,300 | 1,413 | ||||||||||
Metropolitan Transportation Authority, New York Revenue Bonds, Series 2014 | ||||||||||||
5.000% due 11/15/2039 | 1,500 | 1,505 | ||||||||||
Monroe County Industrial Development Corp, New York Revenue Bonds, Series 2023 | ||||||||||||
5.000% due 07/01/2053 | 1,000 | 1,083 | ||||||||||
Monroe County Industrial Development Corp., New York Revenue Bonds, Series 2017 | ||||||||||||
4.000% due 12/01/2041 | 1,400 | 1,313 |
PRINCIPAL AMOUNT (000S) | MARKET VALUE (000S) | |||||||||||
Monroe County Industrial Development Corp., New York Revenue Bonds, Series 2020 | ||||||||||||
4.000% due 07/01/2050 | $ | 1,000 | $ | 961 | ||||||||
Nassau County, New York General Obligation Bonds, Series 2022 | ||||||||||||
4.250% due 04/01/2052 | 2,245 | 2,242 | ||||||||||
Nassau County, New York Industrial Development Agency Revenue Bonds, Series 2021 | ||||||||||||
5.000% due 01/01/2058 ^(a) | 1,638 | 491 | ||||||||||
Nassau County, New York Tobacco Settlement Corp. Revenue Bonds, Series 2006 | ||||||||||||
5.125% due 06/01/2046 | 4,000 | 3,676 | ||||||||||
New York City Housing Development Corp., New York Revenue Bonds, Series 2024 | ||||||||||||
4.850% due 11/01/2059 | 1,000 | 1,006 | ||||||||||
New York City Transitional Finance Authority Building Aid, New York Revenue Bonds, Series 2016 | ||||||||||||
4.000% due 07/15/2040 | 1,000 | 990 | ||||||||||
New York City Water & Sewer System, New York Revenue Bonds, Series 2016 | ||||||||||||
4.000% due 06/15/2046 | 1,130 | 1,118 | ||||||||||
New York City Water & Sewer System, New York Revenue Bonds, Series 2018 | ||||||||||||
5.000% due 06/15/2040 | 1,300 | 1,355 | ||||||||||
New York City Water & Sewer System, New York Revenue Bonds, Series 2020 | ||||||||||||
5.000% due 06/15/2050 | 2,750 | 2,925 | ||||||||||
New York City, New York General Obligation Bonds, Series 2024 | ||||||||||||
5.250% due 03/01/2053 | 2,900 | 3,204 | ||||||||||
5.250% due 04/01/2054 | 1,750 | 1,933 | ||||||||||
New York City, New York Municipal Water Finance Authority Revenue Bonds, Series 2020 | ||||||||||||
4.000% due 06/15/2050 | 1,000 | 971 | ||||||||||
New York City, New York Municipal Water Finance Authority Revenue Bonds, Series 2022 | ||||||||||||
5.250% due 06/15/2052 | 2,000 | 2,193 | ||||||||||
New York City, New York Municipal Water Finance Authority Revenue Bonds, Series 2023 | ||||||||||||
5.250% due 06/15/2048 | 900 | 1,001 | ||||||||||
5.250% due 06/15/2053 | 900 | 994 | ||||||||||
New York Convention Center Development Corp. Revenue Bonds, Series 2015 | ||||||||||||
4.000% due 11/15/2045 | 230 | 223 | ||||||||||
New York County, New York Tobacco Trust Revenue Bonds, Series 2005 | ||||||||||||
0.000% due 06/01/2050 (b) | 30,000 | 6,689 | ||||||||||
0.000% due 06/01/2055 (b) | 9,000 | 766 | ||||||||||
New York County, New York Tobacco Trust Revenue Bonds, Series 2016 | ||||||||||||
5.000% due 06/01/2036 | 1,000 | 1,017 | ||||||||||
5.000% due 06/01/2041 | 1,000 | 1,005 | ||||||||||
New York Liberty Development Corp. Revenue Bonds, Series 2005 | ||||||||||||
5.250% due 10/01/2035 | 3,130 | 3,618 | ||||||||||
New York Liberty Development Corp. Revenue Bonds, Series 2014 | ||||||||||||
5.000% due 11/15/2044 | 2,000 | 2,002 | ||||||||||
New York Liberty Development Corp. Revenue Bonds, Series 2021 | ||||||||||||
2.875% due 11/15/2046 | 605 | 444 | ||||||||||
New York Mortgage Agency Homeowner Mortgage State Revenue Bonds, Series 2015 | ||||||||||||
3.800% due 04/01/2028 | 1,000 | 976 | ||||||||||
New York Power Authority Revenue Bonds, (AGM Insured), Series 2022 | ||||||||||||
4.000% due 11/15/2047 | 1,250 | 1,221 | ||||||||||
4.000% due 11/15/2061 | 1,000 | 958 | ||||||||||
New York Power Authority Revenue Bonds, Series 2020 | ||||||||||||
4.000% due 11/15/2055 | 3,135 | 3,018 | ||||||||||
New York State Dormitory Authority Memorial Sloan-Kettering Cancer Revenue Bonds, Series 2022 | ||||||||||||
4.000% due 07/01/2051 | 1,500 | 1,444 | ||||||||||
New York State Dormitory Authority Revenue Bonds, (AMBAC Insured), Series 2005 | ||||||||||||
5.500% due 05/15/2031 | 1,490 | 1,707 |
PRINCIPAL AMOUNT (000S) | MARKET VALUE (000S) | |||||||||||
New York State Dormitory Authority Revenue Bonds, Series 2017 | ||||||||||||
4.000% due 02/15/2047 | $ | 750 | $ | 729 | ||||||||
New York State Dormitory Authority Revenue Bonds, Series 2018 | ||||||||||||
4.000% due 08/01/2037 | 2,750 | 2,673 | ||||||||||
4.000% due 03/15/2043 | 2,000 | 1,958 | ||||||||||
5.000% due 03/15/2044 | 2,625 | 2,720 | ||||||||||
New York State Dormitory Authority Revenue Bonds, Series 2019 | ||||||||||||
4.000% due 07/01/2044 | 1,600 | 1,576 | ||||||||||
5.000% due 07/01/2042 | 1,000 | 1,064 | ||||||||||
5.000% due 03/15/2043 | 1,575 | 1,680 | ||||||||||
New York State Dormitory Authority Revenue Bonds, Series 2020 | ||||||||||||
4.000% due 02/15/2039 | 2,000 | 2,004 | ||||||||||
4.000% due 07/01/2050 | 5,365 | 5,234 | ||||||||||
5.000% due 07/01/2053 | 1,000 | 1,056 | ||||||||||
New York State Dormitory Authority Revenue Bonds, Series 2022 | ||||||||||||
4.000% due 07/01/2049 | 465 | 436 | ||||||||||
5.000% due 07/15/2050 | 465 | 467 | ||||||||||
New York State Dormitory Authority Revenue Bonds, Series 2023 | ||||||||||||
5.000% due 07/01/2048 | 400 | 431 | ||||||||||
New York State Dormitory Authority Revenue Bonds, Series 2024 | ||||||||||||
5.500% due 07/01/2054 | 1,900 | 2,167 | ||||||||||
New York State Environmental Facilities Corp. Revenue Bonds, Series 2022 | ||||||||||||
4.000% due 06/15/2047 | 2,250 | 2,247 | ||||||||||
New York State Housing Finance Agency Revenue Bonds, Series 2024 | ||||||||||||
4.600% due 11/01/2054 | 1,150 | 1,147 | ||||||||||
New York State Thruway Authority Revenue Bonds, Series 2018 | ||||||||||||
4.000% due 01/01/2036 | 1,000 | 1,018 | ||||||||||
New York State Thruway Authority Revenue Bonds, Series 2019 | ||||||||||||
4.000% due 01/01/2050 | 1,775 | 1,692 | ||||||||||
New York State Thruway Authority Revenue Bonds, Series 2022 | ||||||||||||
5.000% due 03/15/2055 | 1,000 | 1,076 | ||||||||||
New York State Urban Development Corp. Revenue Bonds, Series 2019 | ||||||||||||
4.000% due 03/15/2045 | 1,000 | 976 | ||||||||||
New York State Urban Development Corp. Revenue Bonds, Series 2023 | ||||||||||||
5.000% due 03/15/2063 | 2,035 | 2,184 | ||||||||||
New York Transportation Development Corp. Revenue Bonds, (AGM Insured), Series 2023 | ||||||||||||
5.125% due 06/30/2060 | 2,000 | 2,071 | ||||||||||
New York Transportation Development Corp. Revenue Bonds, Series 2016 | ||||||||||||
5.000% due 07/01/2046 | 1,150 | 1,150 | ||||||||||
5.250% due 01/01/2050 | 1,165 | 1,165 | ||||||||||
New York Transportation Development Corp. Revenue Bonds, Series 2020 | ||||||||||||
4.375% due 10/01/2045 | 2,290 | 2,246 | ||||||||||
5.000% due 10/01/2040 | 1,200 | 1,249 | ||||||||||
Niagara Tobacco Asset Securitization Corp., New York Revenue Bonds, Series 2014 | ||||||||||||
5.250% due 05/15/2040 | 500 | 500 | ||||||||||
Onondaga County, New York Trust for Cultural Resources Revenue Bonds, Series 2019 | ||||||||||||
4.000% due 12/01/2047 | 2,000 | 1,953 | ||||||||||
Port Authority of New York & New Jersey Revenue Bonds, Series 2017 | ||||||||||||
5.250% due 10/15/2057 | 6,865 | 7,119 | ||||||||||
Port Authority of New York & New Jersey Revenue Bonds, Series 2020 | ||||||||||||
4.000% due 07/15/2060 | 400 | 363 | ||||||||||
Port Authority of New York & New Jersey Revenue Bonds, Series 2023 | ||||||||||||
5.000% due 12/01/2043 | 630 | 672 |
46 | PIMCO CLOSED-END FUNDS | See Accompanying Notes |
JUNE 30, 2024 | (Unaudited) |
PRINCIPAL AMOUNT (000S) | MARKET VALUE (000S) | |||||||||||
Riverhead IDA Economic Job Development Corp., New York Revenue Bonds, (FNMA Insured), Series 2023 | ||||||||||||
4.500% due 02/01/2041 | $ | 1,000 | $ | 1,013 | ||||||||
Schenectady County Capital Resource Corp. Union College Project, New York Revenue Notes, Series 2022 | ||||||||||||
5.000% due 07/01/2032 | 470 | 535 | ||||||||||
Suffolk County, New York Economic Development Corp. Revenue Bonds, Series 2021 | ||||||||||||
5.125% due 11/01/2041 | 475 | 418 | ||||||||||
Suffolk Tobacco Asset Securitization Corp., New York Revenue Bonds, Series 2021 | ||||||||||||
0.000% due 06/01/2066 (b) | 5,000 | 496 | ||||||||||
4.000% due 06/01/2050 | 750 | 671 | ||||||||||
Town of Hempstead, New York General Obligation Bonds, Series 2024 | ||||||||||||
4.000% due 05/01/2047 | 1,000 | 996 | ||||||||||
Triborough Bridge & Tunnel Authority Sales Tax, New York Revenue Bonds, Series 2022 | ||||||||||||
4.000% due 05/15/2057 | 1,250 | 1,191 | ||||||||||
Triborough Bridge & Tunnel Authority, New York Revenue Bonds, Series 2019 | ||||||||||||
5.000% due 11/15/2043 | 750 | 786 | ||||||||||
Triborough Bridge & Tunnel Authority, New York Revenue Bonds, Series 2021 | ||||||||||||
5.000% due 11/15/2056 | 2,810 | 2,980 | ||||||||||
Triborough Bridge & Tunnel Authority, New York Revenue Bonds, Series 2024 | ||||||||||||
5.250% due 05/15/2054 | 1,750 | 1,941 | ||||||||||
TSASC, Inc., New York Revenue Bonds, Series 2017 | ||||||||||||
5.000% due 06/01/2035 | 3,000 | 3,100 | ||||||||||
5.000% due 06/01/2041 | 500 | 509 | ||||||||||
Ulster County, New York Capital Resource Corp. Revenue Bonds, Series 2017 | ||||||||||||
5.250% due 09/15/2047 | 1,000 | 823 | ||||||||||
Utility Debt Securitization Authority, New York Revenue Bonds, Series 2023 | ||||||||||||
5.000% due 12/15/2050 | 3,500 | 3,877 | ||||||||||
Westchester County, New York Local Development Corp. Revenue Bonds, Series 2014 | ||||||||||||
5.500% due 05/01/2042 | 1,000 | 1,000 | ||||||||||
142,669 | ||||||||||||
PRINCIPAL AMOUNT (000S) | MARKET VALUE (000S) | |||||||||||
NORTH DAKOTA 0.0% | ||||||||||||
Grand Forks County, North Dakota Revenue Bonds, Series 2021 | ||||||||||||
7.000% due 12/15/2043 ^(a) | $ | 320 | $ | 10 | ||||||||
PENNSYLVANIA 0.7% | ||||||||||||
Pennsylvania Economic Development Financing Authority Revenue Bonds, Series 2021 | ||||||||||||
9.000% due 04/01/2051 | 560 | 616 | ||||||||||
PUERTO RICO 3.1% | ||||||||||||
Children’s Trust Fund, Puerto Rico Revenue Bonds, Series 2008 | ||||||||||||
0.000% due 05/15/2057 (b) | 10,200 | 707 | ||||||||||
Commonwealth of Puerto Rico Bonds, Series 2022 | ||||||||||||
0.000% due 11/01/2043 | 1,080 | 663 | ||||||||||
0.000% due 11/01/2051 | 283 | 179 | ||||||||||
Commonwealth of Puerto Rico General Obligation Bonds, Series 2021 | ||||||||||||
4.000% due 07/01/2041 | 550 | 514 | ||||||||||
Puerto Rico Sales Tax Financing Corp. Sales Tax Revenue Bonds, Series 2018 | ||||||||||||
0.000% due 07/01/2051 (b) | 3,900 | 918 | ||||||||||
2,981 | ||||||||||||
TEXAS 1.5% | ||||||||||||
Angelina & Neches River Authority, Texas Revenue Bonds, Series 2021 | ||||||||||||
7.500% due 12/01/2045 | 220 | 149 | ||||||||||
12.000% due 12/01/2045 | 400 | 352 | ||||||||||
Texas Water Development Board Revenue Bonds, Series 2022 | ||||||||||||
5.000% due 10/15/2057 | 890 | 951 | ||||||||||
1,452 | ||||||||||||
PRINCIPAL AMOUNT (000S) | MARKET VALUE (000S) | |||||||||||
VIRGINIA 0.8% | ||||||||||||
Virginia Small Business Financing Authority Revenue Bonds, Series 2019 | ||||||||||||
0.000% due 07/01/2061 (b) | $ | 8,000 | $ | 257 | ||||||||
5.500% due 07/01/2044 | 500 | 457 | ||||||||||
714 | ||||||||||||
WISCONSIN 0.7% | ||||||||||||
Wisconsin Health & Educational Facilities Authority Revenue Bonds, Series 2022 | ||||||||||||
4.000% due 12/01/2051 | 720 | 665 | ||||||||||
Total Municipal Bonds & Notes (Cost $157,429) | 157,358 | |||||||||||
SHORT-TERM INSTRUMENTS 2.1% | ||||||||||||
REPURCHASE AGREEMENTS (c) 2.1% | ||||||||||||
2,032 | ||||||||||||
Total Short-Term Instruments (Cost $2,032) | 2,032 | |||||||||||
Total Investments in Securities (Cost $159,461) | 159,390 | |||||||||||
Total Investments 167.8% (Cost $159,461) | $ | 159,390 | ||||||||||
Auction Rate Preferred Shares (0.6)% | (550 | ) | ||||||||||
Remarketable Variable Rate MuniFund Term Preferred Shares, at liquidation value (68.1)% | (64,694 | ) | ||||||||||
Other Assets and Liabilities, net 0.9% | 776 | |||||||||||
Net Assets Applicable to Common Shareholders 100.0% | $ | 94,922 | ||||||||||
* | A zero balance may reflect actual amounts rounding to less than one thousand. |
^ | Security is in default. |
(a) | Security is not accruing income as of the date of this report. |
(b) | Zero coupon security. |
Counterparty | Lending Rate | Settlement Date | Maturity Date | Principal Amount | Collateralized By | Collateral (Received) | Repurchase Agreements, at Value | Repurchase Agreement Proceeds to be Received (1) | ||||||||||||||||||||||
FICC | 2.600 | % | 06/28/2024 | 07/01/2024 | $ | 2,032 | U.S. Treasury Inflation Protected Securities 0.625% due 01/15/2026 | $ | (2,073 | ) | $ | 2,032 | $ | 2,032 | ||||||||||||||||
Total Repurchase Agreements | $ | (2,073 | ) | $ | 2,032 | $ | 2,032 | |||||||||||||||||||||||
See Accompanying Notes | SEMIANNUAL REPORT | | | JUNE 30, 2024 | 47 |
Schedule of Investments | PIMCO New York Municipal Income Fund II | (Cont.) | June 30, 2024 | (Unaudited) |
Counterparty | Repurchase Agreement Proceeds to be Received (1) | Payable for Reverse Repurchase Agreements | Payable for Sale-Buyback Transactions | Total Borrowings and Other Financing Transactions | Collateral Pledged/(Received) | Net Exposure (2) | ||||||||||||||||||
Global/Master Repurchase Agreement | ||||||||||||||||||||||||
FICC | $ | 2,032 | $ | 0 | $ | 0 | $ | 2,032 | $ | (2,073 | ) | $ | (41 | ) | ||||||||||
Total Borrowings and Other Financing Transactions | $ | 2,032 | $ | 0 | $ | 0 | ||||||||||||||||||
(1) | Includes accrued interest. |
(2) | Net Exposure represents the net receivable/(payable) that would be due from/to the counterparty in the event of default. Exposure from borrowings and other financing transactions can only be netted across transactions governed under the same master agreement with the same legal entity. See Note 7, Master Netting Arrangements, in the Notes to Financial Statements for more information. |
Category and Subcategory | Level 1 | Level 2 | Level 3 | Fair Value at 06/30/2024 | ||||||||||||
Investments in Securities, at Value | ||||||||||||||||
Municipal Bonds & Notes | ||||||||||||||||
Arizona | $ | 0 | $ | 24 | $ | 0 | $ | 24 | ||||||||
Delaware | 0 | 1,357 | 0 | 1,357 | ||||||||||||
Florida | 0 | 4,831 | 0 | 4,831 | ||||||||||||
Illinois | 0 | 1,041 | 0 | 1,041 | ||||||||||||
New Hampshire | 0 | 998 | 0 | 998 | ||||||||||||
New York | 0 | 142,669 | 0 | 142,669 | ||||||||||||
North Dakota | 0 | 10 | 0 | 10 | ||||||||||||
Pennsylvania | 0 | 616 | 0 | 616 |
Category and Subcategory | Level 1 | Level 2 | Level 3 | Fair Value at 06/30/2024 | ||||||||||||
Puerto Rico | $ | 0 | $ | 2,981 | $ | 0 | $ | 2,981 | ||||||||
Texas | 0 | 1,452 | 0 | 1,452 | ||||||||||||
Virginia | 0 | 714 | 0 | 714 | ||||||||||||
Wisconsin | 0 | 665 | 0 | 665 | ||||||||||||
Short-Term Instruments | ||||||||||||||||
Repurchase Agreements | 0 | 2,032 | 0 | 2,032 | ||||||||||||
Total Investments | $ | 0 | $ | 159,390 | $ | 0 | $ | 159,390 | ||||||||
48 | PIMCO CLOSED-END FUNDS | See Accompanying Notes |
Schedule of Investments | PIMCO New York Municipal Income Fund III | June 30, 2024 | (Unaudited) |
PRINCIPAL AMOUNT (000S) | MARKET VALUE (000S) | |||||||||||
INVESTMENTS IN SECURITIES 166.3% | ||||||||||||
MUNICIPAL BONDS & NOTES 164.6% | ||||||||||||
ARIZONA 0.0% | ||||||||||||
Arizona Industrial Development Authority Revenue Bonds, Series 2020 | ||||||||||||
7.750% due 07/01/2050 ^(a) | $ | 150 | $ | 9 | ||||||||
DELAWARE 1.5% | ||||||||||||
Affordable Housing Opportunities Trust, Delaware Revenue Bonds, Series 2022 | ||||||||||||
3.167% due 10/01/2038 | 550 | 472 | ||||||||||
7.120% due 10/01/2038 | 95 | 91 | ||||||||||
563 | ||||||||||||
FLORIDA 5.4% | ||||||||||||
Florida Development Finance Corp. Revenue Bonds, (AGM Insured), Series 2024 | ||||||||||||
5.250% due 07/01/2047 | 1,000 | 1,053 | ||||||||||
5.250% due 07/01/2053 | 1,000 | 1,048 | ||||||||||
2,101 | ||||||||||||
NEW HAMPSHIRE 1.3% | ||||||||||||
New Hampshire Business Finance Authority Revenue Notes, Series 2023 | ||||||||||||
5.087% due 07/20/2027 | 487 | 499 | ||||||||||
NEW YORK 147.7% | ||||||||||||
Albany Capital Resource Corp., New York Revenue Bonds, Series 2024 | ||||||||||||
4.750% due 06/01/2054 | 200 | 198 | ||||||||||
Build NYC Resource Corp., New York Revenue Bonds, Series 2018 | ||||||||||||
5.625% due 12/01/2050 | 730 | 659 | ||||||||||
Build NYC Resource Corp., New York Revenue Bonds, Series 2023 | ||||||||||||
5.250% due 07/01/2062 | 500 | 515 | ||||||||||
Dutchess County, New York Local Development Corp. Revenue Bonds, Series 2017 | ||||||||||||
4.000% due 07/01/2046 | 245 | 239 | ||||||||||
Dutchess County, New York Local Development Corp. Revenue Bonds, Series 2022 | ||||||||||||
4.000% due 07/01/2049 | 435 | 406 | ||||||||||
Erie County, New York Industrial Development Agency Revenue Bonds, (FNMA Insured), Series 2023 | ||||||||||||
4.250% due 02/01/2041 | 800 | 766 | ||||||||||
Housing Development Corp., New York Revenue Bonds, Series 2017 | ||||||||||||
3.700% due 11/01/2047 | 500 | 446 | ||||||||||
Huntington Local Development Corp., New York Revenue Bonds, Series 2021 | ||||||||||||
5.250% due 07/01/2056 | 300 | 248 | ||||||||||
Long Island Power Authority, New York Revenue Bonds, Series 2023 | ||||||||||||
5.000% due 09/01/2048 | 500 | 544 | ||||||||||
Metropolitan Transportation Authority, New York Revenue Bonds, Series 2014 | ||||||||||||
5.000% due 11/15/2039 | 2,000 | 2,006 | ||||||||||
Metropolitan Transportation Authority, New York Revenue Bonds, Series 2016 | ||||||||||||
5.000% due 11/15/2051 | 500 | 509 | ||||||||||
Monroe County Industrial Development Corp, New York Revenue Bonds, Series 2023 | ||||||||||||
5.000% due 07/01/2053 | 500 | 541 | ||||||||||
Monroe County Industrial Development Corp., New York Revenue Bonds, Series 2020 | ||||||||||||
4.000% due 07/01/2050 | 425 | 409 | ||||||||||
Nassau County, New York General Obligation Bonds, Series 2022 | ||||||||||||
4.250% due 04/01/2052 | 950 | 949 |
PRINCIPAL AMOUNT (000S) | MARKET VALUE (000S) | |||||||||||
Nassau County, New York Industrial Development Agency Revenue Bonds, Series 2021 | ||||||||||||
5.000% due 01/01/2058 ^(a) | $ | 341 | $ | 102 | ||||||||
New York City Housing Development Corp., New York Revenue Bonds, Series 2024 | ||||||||||||
4.850% due 11/01/2059 | 500 | 503 | ||||||||||
New York City Water & Sewer System, New York Revenue Bonds, Series 2016 | ||||||||||||
4.000% due 06/15/2046 | 465 | 460 | ||||||||||
New York City, New York General Obligation Bonds, Series 2018 | ||||||||||||
5.000% due 04/01/2045 | 900 | 931 | ||||||||||
New York City, New York General Obligation Bonds, Series 2024 | ||||||||||||
5.250% due 03/01/2053 | 300 | 331 | ||||||||||
5.250% due 04/01/2054 | 700 | 773 | ||||||||||
New York City, New York Health and Hospitals Corp. Revenue Bonds, Series 2021 | ||||||||||||
4.000% due 02/15/2045 | 265 | 257 | ||||||||||
New York City, New York Municipal Water Finance Authority Revenue Bonds, Series 2020 | ||||||||||||
4.000% due 06/15/2050 | 600 | 582 | ||||||||||
New York City, New York Municipal Water Finance Authority Revenue Bonds, Series 2022 | ||||||||||||
5.000% due 06/15/2047 | 750 | 814 | ||||||||||
5.250% due 06/15/2052 | 1,000 | 1,096 | ||||||||||
New York City, New York Municipal Water Finance Authority Revenue Bonds, Series 2023 | ||||||||||||
4.125% due 06/15/2047 | 500 | 498 | ||||||||||
5.250% due 06/15/2048 | 400 | 445 | ||||||||||
5.250% due 06/15/2053 | 400 | 442 | ||||||||||
New York City, New York Transitional Finance Authority Future Tax Secured Revenue Bonds, Series 2022 | ||||||||||||
5.250% due 11/01/2048 | 500 | 550 | ||||||||||
New York County, New York Tobacco Trust Revenue Bonds, Series 2001 | ||||||||||||
5.750% due 06/01/2043 | 305 | 311 | ||||||||||
New York County, New York Tobacco Trust Revenue Bonds, Series 2005 | ||||||||||||
0.000% due 06/01/2050 (b) | 10,000 | 2,230 | ||||||||||
0.000% due 06/01/2055 (b) | 7,500 | 638 | ||||||||||
New York Liberty Development Corp. Revenue Bonds, Series 2005 | ||||||||||||
5.250% due 10/01/2035 | 450 | 520 | ||||||||||
New York Liberty Development Corp. Revenue Bonds, Series 2007 | ||||||||||||
5.500% due 10/01/2037 | 1,650 | 1,958 | ||||||||||
New York Liberty Development Corp. Revenue Bonds, Series 2014 | ||||||||||||
5.000% due 11/15/2044 | 1,000 | 1,001 | ||||||||||
New York Liberty Development Corp. Revenue Bonds, Series 2021 | ||||||||||||
2.875% due 11/15/2046 | 250 | 183 | ||||||||||
New York Mortgage Agency Homeowner Mortgage State Revenue Bonds, Series 2015 | ||||||||||||
3.800% due 04/01/2028 | 500 | 488 | ||||||||||
New York Power Authority Revenue Bonds, (AGM Insured), Series 2022 | ||||||||||||
4.000% due 11/15/2047 | 900 | 879 | ||||||||||
New York Power Authority Revenue Bonds, Series 2020 | ||||||||||||
4.000% due 11/15/2055 | 1,400 | 1,348 | ||||||||||
New York State Dormitory Authority Memorial Sloan-Kettering Cancer Revenue Bonds, Series 2022 | ||||||||||||
4.000% due 07/01/2051 | 750 | 722 | ||||||||||
New York State Dormitory Authority Revenue Bonds, Series 2017 | ||||||||||||
4.000% due 02/15/2047 | 250 | 243 | ||||||||||
New York State Dormitory Authority Revenue Bonds, Series 2018 | ||||||||||||
4.000% due 07/01/2041 | 405 | 406 | ||||||||||
New York State Dormitory Authority Revenue Bonds, Series 2019 | ||||||||||||
4.000% due 07/01/2044 | 620 | 611 | ||||||||||
5.000% due 03/15/2043 | 1,700 | 1,814 |
PRINCIPAL AMOUNT (000S) | MARKET VALUE (000S) | |||||||||||
New York State Dormitory Authority Revenue Bonds, Series 2020 | ||||||||||||
4.000% due 07/01/2050 | $ | 2,280 | $ | 2,226 | ||||||||
5.000% due 07/01/2053 | 350 | 370 | ||||||||||
New York State Dormitory Authority Revenue Bonds, Series 2022 | ||||||||||||
4.000% due 07/01/2049 | 190 | 178 | ||||||||||
5.000% due 07/15/2050 | 190 | 191 | ||||||||||
New York State Dormitory Authority Revenue Bonds, Series 2023 | ||||||||||||
5.000% due 07/01/2048 | 500 | 539 | ||||||||||
New York State Dormitory Authority Revenue Bonds, Series 2024 | ||||||||||||
5.500% due 07/01/2054 | 700 | 798 | ||||||||||
New York State Environmental Facilities Corp. Revenue Bonds, Series 2022 | ||||||||||||
4.000% due 06/15/2047 | 1,000 | 998 | ||||||||||
New York State Housing Finance Agency Revenue Bonds, Series 2024 | ||||||||||||
4.600% due 11/01/2054 | 500 | 499 | ||||||||||
New York State Thruway Authority Revenue Bonds, Series 2019 | ||||||||||||
4.000% due 01/01/2039 | 600 | 603 | ||||||||||
New York State Thruway Authority Revenue Bonds, Series 2021 | ||||||||||||
4.000% due 01/01/2040 | 500 | 503 | ||||||||||
New York State Thruway Authority Revenue Bonds, Series 2022 | ||||||||||||
5.000% due 03/15/2055 | 600 | 646 | ||||||||||
New York State Urban Development Corp. Revenue Bonds, Series 2019 | ||||||||||||
4.000% due 03/15/2045 | 1,500 | 1,464 | ||||||||||
New York State Urban Development Corp. Revenue Bonds, Series 2023 | ||||||||||||
5.000% due 03/15/2047 | 1,000 | 1,092 | ||||||||||
5.000% due 03/15/2063 | 800 | 859 | ||||||||||
New York Transportation Development Corp. Revenue Bonds, (AGM Insured), Series 2023 | ||||||||||||
5.125% due 06/30/2060 | 750 | 777 | ||||||||||
New York Transportation Development Corp. Revenue Bonds, Series 2016 | ||||||||||||
5.000% due 07/01/2046 | 500 | 500 | ||||||||||
5.250% due 01/01/2050 | 480 | 480 | ||||||||||
New York Transportation Development Corp. Revenue Bonds, Series 2020 | ||||||||||||
4.375% due 10/01/2045 | 940 | 922 | ||||||||||
5.000% due 10/01/2040 | 500 | 520 | ||||||||||
Niagara Tobacco Asset Securitization Corp., New York Revenue Bonds, Series 2014 | ||||||||||||
5.250% due 05/15/2040 | 500 | 500 | ||||||||||
Onondaga County, New York Trust for Cultural Resources Revenue Bonds, Series 2019 | ||||||||||||
4.000% due 12/01/2047 | 1,000 | 976 | ||||||||||
Port Authority of New York & New Jersey Revenue Bonds, Series 2017 | ||||||||||||
5.250% due 10/15/2057 | 2,500 | 2,592 | ||||||||||
Port Authority of New York & New Jersey Revenue Bonds, Series 2020 | ||||||||||||
4.000% due 07/15/2060 | 250 | 227 | ||||||||||
Port Authority of New York & New Jersey Revenue Bonds, Series 2023 | ||||||||||||
5.000% due 12/01/2043 | 275 | 293 | ||||||||||
Riverhead IDA Economic Job Development Corp., New York Revenue Bonds, (FNMA Insured), Series 2023 | ||||||||||||
4.500% due 02/01/2041 | 400 | 405 | ||||||||||
Schenectady County Capital Resource Corp. Union College Project, New York Revenue Notes, Series 2022 | ||||||||||||
5.000% due 07/01/2032 | 190 | 216 | ||||||||||
Suffolk County, New York Economic Development Corp. Revenue Bonds, Series 2021 | ||||||||||||
5.125% due 11/01/2041 | 200 | 176 | ||||||||||
Suffolk Tobacco Asset Securitization Corp., New York Revenue Bonds, Series 2021 | ||||||||||||
0.000% due 06/01/2066 (b) | 5,000 | 496 | ||||||||||
4.000% due 06/01/2050 | 250 | 224 |
See Accompanying Notes | SEMIANNUAL REPORT | | | JUNE 30, 2024 | 49 |
Schedule of Investments | PIMCO New York Municipal Income Fund III | (Cont.) |
PRINCIPAL AMOUNT (000S) | MARKET VALUE (000S) | |||||||||||
The Genesee County Funding Corporation Tax-Exempt, New York Revenue Bonds, Series 2022 | ||||||||||||
5.250% due 12/01/2052 | $ | 500 | $ | 518 | ||||||||
Town of Hempstead, New York General Obligation Bonds, Series 2024 | ||||||||||||
4.000% due 05/01/2047 | 500 | 498 | ||||||||||
Triborough Bridge & Tunnel Authority Sales Tax, New York Revenue Bonds, Series 2024 | ||||||||||||
5.000% due 05/15/2049 | 400 | 438 | ||||||||||
Triborough Bridge & Tunnel Authority, New York Revenue Bonds, Series 2019 | ||||||||||||
5.000% due 11/15/2043 | 750 | 786 | ||||||||||
Triborough Bridge & Tunnel Authority, New York Revenue Bonds, Series 2022 | ||||||||||||
4.500% due 05/15/2047 | 300 | 307 | ||||||||||
Triborough Bridge & Tunnel Authority, New York Revenue Bonds, Series 2024 | ||||||||||||
5.250% due 05/15/2054 | 700 | 776 | ||||||||||
TSASC, Inc., New York Revenue Bonds, Series 2017 | ||||||||||||
5.000% due 06/01/2041 | 2,000 | 2,035 | ||||||||||
Ulster County, New York Capital Resource Corp. Revenue Bonds, Series 2017 | ||||||||||||
5.250% due 09/15/2047 | 500 | 412 | ||||||||||
Utility Debt Securitization Authority, New York Revenue Bonds, Series 2023 | ||||||||||||
5.000% due 12/15/2050 | 1,500 | 1,662 | ||||||||||
57,273 | ||||||||||||
NORTH DAKOTA 0.0% | ||||||||||||
Grand Forks County, North Dakota Revenue Bonds, Series 2021 | ||||||||||||
7.000% due 12/15/2043 ^(a) | 130 | 4 | ||||||||||
PRINCIPAL AMOUNT (000S) | MARKET VALUE (000S) | |||||||||||
PENNSYLVANIA 0.6% | ||||||||||||
Pennsylvania Economic Development Financing Authority Revenue Bonds, Series 2021 | ||||||||||||
9.000% due 04/01/2051 | $ | 225 | $ | 247 | ||||||||
PUERTO RICO 6.0% | ||||||||||||
Children’s Trust Fund, Puerto Rico Revenue Bonds, Series 2008 | ||||||||||||
0.000% due 05/15/2057 (b) | 4,400 | 303 | ||||||||||
Commonwealth of Puerto Rico Bonds, Series 2022 | ||||||||||||
0.000% due 11/01/2043 | 362 | 222 | ||||||||||
0.000% due 11/01/2051 | 497 | 314 | ||||||||||
Commonwealth of Puerto Rico General Obligation Bonds, Series 2021 | ||||||||||||
4.000% due 07/01/2041 | 250 | 234 | ||||||||||
Puerto Rico Sales Tax Financing Corp. Sales Tax Revenue Bonds, Series 2018 | ||||||||||||
0.000% due 07/01/2046 (b) | 3,850 | 1,245 | ||||||||||
2,318 | ||||||||||||
TEXAS 0.5% | ||||||||||||
Angelina & Neches River Authority, Texas Revenue Bonds, Series 2021 | ||||||||||||
7.500% due 12/01/2045 | 90 | 61 | ||||||||||
12.000% due 12/01/2045 | 150 | 132 | ||||||||||
193 | ||||||||||||
VIRGINIA 0.9% | ||||||||||||
Virginia Small Business Financing Authority Revenue Bonds, Series 2019 | ||||||||||||
0.000% due 07/01/2061 (b) | 4,000 | 129 | ||||||||||
5.500% due 07/01/2044 | 250 | 228 | ||||||||||
357 | ||||||||||||
PRINCIPAL AMOUNT (000S) | MARKET VALUE (000S) | |||||||||||
WISCONSIN 0.7% | ||||||||||||
Wisconsin Health & Educational Facilities Authority Revenue Bonds, Series 2022 | ||||||||||||
4.000% due 12/01/2051 | $ | 295 | $ | 272 | ||||||||
Total Municipal Bonds & Notes (Cost $63,443) | 63,836 | |||||||||||
SHORT-TERM INSTRUMENTS 1.7% | ||||||||||||
REPURCHASE AGREEMENTS (c) 1.7% | ||||||||||||
671 | ||||||||||||
Total Short-Term Instruments (Cost $671) | 671 | |||||||||||
Total Investments in Securities (Cost $64,114) | 64,507 | |||||||||||
Total Investments 166.3% (Cost $64,114) | $ | 64,507 | ||||||||||
Auction Rate Preferred Shares (0.1)% | (75 | ) | ||||||||||
Remarketable Variable Rate MuniFund Term Preferred Shares, at liquidation value (66.8)% | (25,909 | ) | ||||||||||
Other Assets and Liabilities, net 0.6% | 241 | |||||||||||
Net Assets Applicable to Common Shareholders 100.0% | $ | 38,764 | ||||||||||
* | A zero balance may reflect actual amounts rounding to less than one thousand. |
^ | Security is in default. |
(a) | Security is not accruing income as of the date of this report. |
(b) | Zero coupon security. |
Counterparty | Lending Rate | Settlement Date | Maturity Date | Principal Amount | Collateralized By | Collateral (Received) | Repurchase Agreements, at Value | Repurchase Agreement Proceeds to be Received (1) | ||||||||||||||||||||||
FICC | 2.600 | % | 06/28/2024 | 07/01/2024 | $ | 671 | U.S. Treasury Inflation Protected Securities 0.625% due 01/15/2026 | $ | (685 | ) | $ | 671 | $ | 671 | ||||||||||||||||
Total Repurchase Agreements | $ | (685 | ) | $ | 671 | $ | 671 | |||||||||||||||||||||||
Counterparty | Repurchase Agreement Proceeds to be Received (1) | Payable for Reverse Repurchase Agreements | Payable for Sale-Buyback Transactions | Total Borrowings and Other Financing Transactions | Collateral Pledged/(Received) | Net Exposure (2) | ||||||||||||||||||
Global/Master Repurchase Agreement | ||||||||||||||||||||||||
FICC | $ | 671 | $ | 0 | $ | 0 | $ | 671 | $ | (685 | ) | $ | (14 | ) | ||||||||||
Total Borrowings and Other Financing Transactions | $ | 671 | $ | 0 | $ | 0 | ||||||||||||||||||
(1) | Includes accrued interest. |
50 | PIMCO CLOSED-END FUNDS | See Accompanying Notes |
June 30, 2024 | (Unaudited) |
(2) | Net Exposure represents the net receivable/(payable) that would be due from/to the counterparty in the event of default. Exposure from borrowings and other financing transactions can only be netted across transactions governed under the same master agreement with the same legal entity. See Note 7, Master Netting Arrangements, in the Notes to Financial Statements for more information. |
Category and Subcategory | Level 1 | Level 2 | Level 3 | Fair Value at 06/30/2024 | ||||||||||||
Investments in Securities, at Value | ||||||||||||||||
Municipal Bonds & Notes | ||||||||||||||||
Arizona | $ | 0 | $ | 9 | $ | 0 | $ | 9 | ||||||||
Delaware | 0 | 563 | 0 | 563 | ||||||||||||
Florida | 0 | 2,101 | 0 | 2,101 | ||||||||||||
New Hampshire | 0 | 499 | 0 | 499 | ||||||||||||
New York | 0 | 57,273 | 0 | 57,273 | ||||||||||||
North Dakota | 0 | 4 | 0 | 4 | ||||||||||||
Pennsylvania | 0 | 247 | 0 | 247 |
Category and Subcategory | Level 1 | Level 2 | Level 3 | Fair Value at 06/30/2024 | ||||||||||||
Puerto Rico | $ | 0 | $ | 2,318 | $ | 0 | $ | 2,318 | ||||||||
Texas | 0 | 193 | 0 | 193 | ||||||||||||
Virginia | 0 | 357 | 0 | 357 | ||||||||||||
Wisconsin | 0 | 272 | 0 | 272 | ||||||||||||
Short-Term Instruments | ||||||||||||||||
Repurchase Agreements | 0 | 671 | 0 | 671 | ||||||||||||
Total Investments | $ | 0 | $ | 64,507 | $ | 0 | $ | 64,507 | ||||||||
See Accompanying Notes | SEMIANNUAL REPORT | | | JUNE 30, 2024 | 51 |
Schedule of Investments | PIMCO Municipal Income Fund |
PRINCIPAL AMOUNT (000S) | MARKET VALUE (000S) | |||||||||||
INVESTMENTS IN SECURITIES 170.6% | ||||||||||||
LOAN PARTICIPATIONS AND ASSIGNMENTS 1.2% | ||||||||||||
Falcon PK | ||||||||||||
TBD% due 11/01/2026 «µ | $ | 500 | $ | 500 | ||||||||
TBD% - 7.181% due 10/26/2063 «µ | 2,500 | 2,500 | ||||||||||
Total Loan Participations and Assignments (Cost $3,000) | 3,000 | |||||||||||
MUNICIPAL BONDS & NOTES 165.7% | ||||||||||||
ALABAMA 1.6% | ||||||||||||
Jefferson County, Alabama Sewer Revenue Bonds, Series 2024 | ||||||||||||
5.500% due 10/01/2053 | 2,250 | 2,440 | ||||||||||
Tuscaloosa County, Alabama Industrial Development Authority Revenue Bonds, Series 2019 | ||||||||||||
5.250% due 05/01/2044 | 1,575 | 1,582 | ||||||||||
4,022 | ||||||||||||
ALASKA 0.5% | ||||||||||||
Alaska Industrial Development & Export Authority Revenue Bonds, Series 2007 | ||||||||||||
6.000% due 12/01/2036 ^(b) | 900 | 12 | ||||||||||
Municipality of Anchorage, Alaska Solid Waste Services Revenue Bonds, Series 2022 | ||||||||||||
5.250% due 11/01/2062 | 1,080 | 1,148 | ||||||||||
1,160 | ||||||||||||
ARIZONA 4.0% | ||||||||||||
Arizona Industrial Development Authority Revenue Bonds, Series 2019 | ||||||||||||
4.500% due 01/01/2049 | 900 | 518 | ||||||||||
5.000% due 01/01/2043 ^(b) | 550 | 260 | ||||||||||
5.500% due 01/01/2054 ^(b) | 1,500 | 687 | ||||||||||
Arizona Industrial Development Authority Revenue Bonds, Series 2020 | ||||||||||||
7.750% due 07/01/2050 ^(b) | 1,100 | 66 | ||||||||||
Industrial Development Authority of the County, Arizona of Pima Revenue Bonds, Series 2020 | ||||||||||||
5.000% due 07/01/2055 | 1,100 | 1,021 | ||||||||||
Maricopa County, Arizona Industrial Development Authority Revenue Bonds, Series 2017 | ||||||||||||
4.000% due 01/01/2041 | 750 | 741 | ||||||||||
Maricopa County, Arizona Industrial Development Authority Revenue Bonds, Series 2019 | ||||||||||||
4.000% due 01/01/2044 | 3,500 | 3,400 | ||||||||||
Maricopa County, Arizona School District No 83, Cartwright Elementary Revenue Bonds, Series 2020 | ||||||||||||
4.000% due 10/01/2044 | 3,600 | 3,166 | ||||||||||
9,859 | ||||||||||||
ARKANSAS 2.2% | ||||||||||||
Arkansas Development Finance Authority Revenue Bonds, (AMBAC Insured), Series 2006 | ||||||||||||
0.000% due 07/01/2036 (c) | 5,500 | 3,246 | ||||||||||
Arkansas Development Finance Authority Revenue Bonds, Series 2023 | ||||||||||||
7.375% due 07/01/2048 | 1,250 | 1,373 | ||||||||||
County of Pulaski Hospital, Arkansas Revenue Bonds, Series 2023 | ||||||||||||
5.250% due 03/01/2053 | 700 | 757 | ||||||||||
5,376 | ||||||||||||
CALIFORNIA 3.6% | ||||||||||||
California County Tobacco Securitization Agency Revenue Bonds, Series 2002 | ||||||||||||
6.000% due 06/01/2035 | 545 | 545 | ||||||||||
California Housing Finance Revenue Bonds, Series 2024 | ||||||||||||
6.000% due 03/01/2053 | 2,200 | 2,198 |
PRINCIPAL AMOUNT (000S) | MARKET VALUE (000S) | |||||||||||
California Statewide Communities Development Authority Revenue Bonds, Series 2016 | ||||||||||||
5.000% due 12/01/2046 | $ | 1,500 | $ | 1,511 | ||||||||
Golden State, California Tobacco Securitization Corp. Revenue Bonds, Series 2021 | ||||||||||||
0.000% due 06/01/2066 (c) | 2,500 | 279 | ||||||||||
Golden State, California Tobacco Securitization Corp. Revenue Bonds, Series 2022 | ||||||||||||
5.000% due 06/01/2051 | 1,000 | 1,037 | ||||||||||
M-S-R | ||||||||||||
6.125% due 11/01/2029 | 1,640 | 1,730 | ||||||||||
San Diego County, California Regional Airport Authority Revenue Bonds, Series 2021 | ||||||||||||
4.000% due 07/01/2051 | 1,000 | 937 | ||||||||||
San Francisco, California City & County Public Utilities Commission Wastewater Revenue Bonds, Series 2021 | ||||||||||||
4.000% due 10/01/2048 | 675 | 672 | ||||||||||
8,909 | ||||||||||||
COLORADO 3.6% | ||||||||||||
Colorado Health Facilities Authority Revenue Bonds, Series 2019 | ||||||||||||
4.000% due 01/01/2040 | 2,200 | 2,190 | ||||||||||
4.000% due 08/01/2049 | 2,000 | 1,900 | ||||||||||
Colorado International Center Metropolitan District No 7, General Obligation Bonds, Series 2021 | ||||||||||||
5.250% due 12/01/2051 (d) | 715 | 434 | ||||||||||
Colorado State Building Excellent School Certificates of Participation Bonds, Series 2018 | ||||||||||||
4.000% due 03/15/2043 | 1,015 | 998 | ||||||||||
Dominion Water & Sanitation District, Colorado Revenue Bonds, Series 2022 | ||||||||||||
5.875% due 12/01/2052 | 1,000 | 1,009 | ||||||||||
Harvest Crossing Metropolitan District No 4, Colorado General Obligation Bonds, Series 2022 | ||||||||||||
7.250% due 12/01/2052 | 1,250 | 1,247 | ||||||||||
Public Authority for Colorado Energy Revenue Bonds, Series 2008 | ||||||||||||
6.500% due 11/15/2038 | 500 | 613 | ||||||||||
Senac South Metropolitan District No 1, Colorado General Obligation Bonds, Series 2021 | ||||||||||||
5.250% due 12/01/2051 | 500 | 444 | ||||||||||
8,835 | ||||||||||||
CONNECTICUT 0.5% | ||||||||||||
Connecticut State Health & Educational Facilities Authority Revenue Bonds, Series 2022 | ||||||||||||
5.000% due 07/01/2047 | 1,300 | 1,355 | ||||||||||
DELAWARE 2.1% | ||||||||||||
Affordable Housing Opportunities Trust, Delaware Revenue Bonds, Series 2022 | ||||||||||||
3.461% due 07/01/2037 | 4,940 | 4,474 | ||||||||||
7.120% due 07/01/2037 | 870 | 849 | ||||||||||
5,323 | ||||||||||||
DISTRICT OF COLUMBIA 0.7% | ||||||||||||
District of Columbia Revenue Bonds, Series 2022 | ||||||||||||
5.500% due 02/29/2036 | 1,625 | 1,859 | ||||||||||
FLORIDA 7.2% | ||||||||||||
Avenir Community Development District, Florida Special Assessment Bonds, Series 2023 | ||||||||||||
5.625% due 05/01/2054 | 600 | 614 | ||||||||||
Central Florida Expressway Authority Revenue Bonds, Series 2017 | ||||||||||||
4.000% due 07/01/2041 | 1,950 | 1,885 |
PRINCIPAL AMOUNT (000S) | MARKET VALUE (000S) | |||||||||||
Charlotte County Industrial Development Authority, Florida Revenue Bonds, Series 2021 | ||||||||||||
4.000% due 10/01/2041 | $ | 500 | $ | 460 | ||||||||
4.000% due 10/01/2051 | 2,500 | 2,106 | ||||||||||
Florida Development Finance Corp. Revenue Bonds, Series 2024 | ||||||||||||
4.500% due 08/01/2055 | 1,250 | 1,253 | ||||||||||
Hillsborough County, Florida Industrial Development Authority Revenue Bonds, Series 2020 | ||||||||||||
4.000% due 08/01/2050 | 1,650 | 1,485 | ||||||||||
JEA Water & Sewer System, Florida Revenue Bonds, Series 2024 | ||||||||||||
5.250% due 10/01/2049 | 800 | 890 | ||||||||||
Miami-Dade County, Florida Transit System Revenue Bonds, Series 2018 | ||||||||||||
4.000% due 07/01/2044 | 1,000 | 992 | ||||||||||
4.000% due 07/01/2046 | 1,000 | 973 | ||||||||||
Miami-Dade Seaport Department, Florida Revenue Bonds, Series 2023 | ||||||||||||
5.000% due 10/01/2047 | 1,600 | 1,681 | ||||||||||
Orange County Health Facilities Authority, Florida Revenue Bonds, Series 2023 | ||||||||||||
5.000% due 10/01/2053 | 910 | 957 | ||||||||||
Tampa, Florida Revenue Bonds, Series 2016 | ||||||||||||
4.000% due 11/15/2046 | 2,500 | 2,376 | ||||||||||
Tampa-Hillsborough County, Florida Expressway Authority Revenue Bonds, Series 2017 | ||||||||||||
4.000% due 07/01/2042 | 2,250 | 2,176 | ||||||||||
17,848 | ||||||||||||
GEORGIA 4.7% | ||||||||||||
Atlanta Development Authority, Georgia Revenue Bonds, Series 2017 | ||||||||||||
6.750% due 01/01/2035 ^(b) | 1,600 | 720 | ||||||||||
Municipal Electric Authority of Georgia Revenue Bonds, Series 2015 | ||||||||||||
5.000% due 07/01/2060 | 9,000 | 9,006 | ||||||||||
Municipal Electric Authority of Georgia Revenue Bonds, Series 2022 | ||||||||||||
5.000% due 07/01/2052 | 1,000 | 1,045 | ||||||||||
Valdosta & Lowndes County, Georgia Hospital Authority Revenue Bonds, Series 2024 | ||||||||||||
4.125% due 10/01/2049 | 1,000 | 984 | ||||||||||
11,755 | ||||||||||||
ILLINOIS 10.8% | ||||||||||||
Chicago O’Hare International Airport, Illinois Revenue Bonds, Series 2018 | ||||||||||||
5.000% due 01/01/2048 | 3,000 | 3,106 | ||||||||||
Chicago, Illinois General Obligation Bonds, Series 2003 | ||||||||||||
5.500% due 01/01/2034 | 1,750 | 1,761 | ||||||||||
Chicago, Illinois General Obligation Bonds, Series 2007 | ||||||||||||
5.500% due 01/01/2042 | 2,400 | 2,405 | ||||||||||
Illinois Finance Authority Revenue Bonds, Series 2017 | ||||||||||||
5.000% due 02/15/2037 ^(b) | 945 | 217 | ||||||||||
Illinois Finance Authority Revenue Bonds, Series 2019 | ||||||||||||
5.000% due 11/01/2035 ^(b) | 1,000 | 903 | ||||||||||
Illinois State General Obligation Bonds, Series 2018 | ||||||||||||
4.625% due 05/01/2037 | 2,000 | 2,042 | ||||||||||
Illinois State General Obligation Notes, Series 2017 | ||||||||||||
5.000% due 11/01/2027 | 9,500 | 9,940 | ||||||||||
Metropolitan Pier & Exposition Authority, Illinois Revenue Bonds, (AGM/CR/NPFGC Insured), Series 2002 | ||||||||||||
0.000% due 12/15/2040 (c) | 2,000 | 996 | ||||||||||
Metropolitan Pier & Exposition Authority, Illinois Revenue Bonds, Series 2012 | ||||||||||||
0.000% due 12/15/2051 (c) | 2,500 | 617 | ||||||||||
Metropolitan Pier & Exposition Authority, Illinois Revenue Bonds, Series 2022 | ||||||||||||
0.000% due 06/15/2036 (c) | 1,000 | 605 |
52 | PIMCO CLOSED-END FUNDS | See Accompanying Notes |
June 30, 2024 | (Unaudited) |
PRINCIPAL AMOUNT (000S) | MARKET VALUE (000S) | |||||||||||
Regional Transportation Authority, Illinois Revenue Bonds, Series 2018 | ||||||||||||
5.000% due 06/01/2038 | $ | 3,500 | $ | 3,679 | ||||||||
Sales Tax Securitization Corp., Illinois Revenue Bonds, Series 2018 | ||||||||||||
4.000% due 01/01/2048 | 650 | 602 | ||||||||||
26,873 | ||||||||||||
INDIANA 2.2% | ||||||||||||
Indiana Finance Authority Midwestern Disaster Relief Revenue Bonds, Series 2012 | ||||||||||||
4.250% due 11/01/2030 | 1,250 | 1,256 | ||||||||||
Indiana Finance Authority Revenue Bonds, Series 2019 | ||||||||||||
7.000% due 03/01/2039 | 1,650 | 1,079 | ||||||||||
Indiana Health & Educational Facilities Financing Authority Revenue Bonds, Series 2006 | ||||||||||||
4.000% due 11/15/2046 | 1,000 | 948 | ||||||||||
Indianapolis Local Public Improvement Bond Bank, Indiana Revenue Bonds, Series 2023 | ||||||||||||
5.000% due 01/01/2053 | 1,000 | 1,066 | ||||||||||
6.000% due 03/01/2053 | 1,000 | 1,099 | ||||||||||
5,448 | ||||||||||||
IOWA 3.1% | ||||||||||||
Iowa Finance Authority Midwestern Disaster Area Revenue Refunding Bonds, Series 2012 | ||||||||||||
4.750% due 08/01/2042 | 1,500 | 1,493 | ||||||||||
Iowa Finance Authority Midwestern Disaster Area Revenue Refunding Bonds, Series 2022 | ||||||||||||
5.000% due 12/01/2050 | 5,030 | 5,325 | ||||||||||
Iowa Finance Authority Revenue Bonds, Series 2022 | ||||||||||||
8.000% due 01/01/2042 | 800 | 770 | ||||||||||
7,588 | ||||||||||||
KANSAS 0.0% | ||||||||||||
Lenexa, Kansas Tax Allocation Bonds, Series 2007 | ||||||||||||
6.000% due 04/01/2027 ^(b) | 677 | 102 | ||||||||||
LOUISIANA 3.9% | ||||||||||||
Louisiana Gasoline & Fuels Tax State Revenue Bonds, Series 2017 | ||||||||||||
4.000% due 05/01/2045 | 4,000 | 3,922 | ||||||||||
Louisiana Public Facilities Authority Revenue Bonds, Series 2017 | ||||||||||||
5.000% due 05/15/2046 | 2,500 | 2,525 | ||||||||||
Louisiana Public Facilities Authority Revenue Bonds, Series 2023 | ||||||||||||
5.000% due 10/15/2052 | 1,780 | 1,897 | ||||||||||
Parish of St James, Louisiana Revenue Bonds, Series 2010 | ||||||||||||
6.350% due 07/01/2040 | 1,250 | 1,374 | ||||||||||
9,718 | ||||||||||||
MARYLAND 0.2% | ||||||||||||
Maryland Economic Development Corp. Revenue Bonds, Series 2020 | ||||||||||||
4.000% due 07/01/2040 | 500 | 481 | ||||||||||
MASSACHUSETTS 1.8% | ||||||||||||
Commonwealth of Massachusetts General Obligation Bonds, Series 2018 | ||||||||||||
4.000% due 05/01/2040 | 1,000 | 1,003 | ||||||||||
Commonwealth of Massachusetts Transportation Fund Revenue Bonds, Series 2023 | ||||||||||||
5.000% due 06/01/2053 | 2,250 | 2,437 | ||||||||||
Massachusetts Development Finance Agency Revenue Bonds, Series 2016 | ||||||||||||
5.000% due 01/01/2047 | 1,000 | 1,008 | ||||||||||
4,448 | ||||||||||||
PRINCIPAL AMOUNT (000S) | MARKET VALUE (000S) | |||||||||||
MICHIGAN 5.6% | ||||||||||||
Detroit City School District, Michigan General Obligation Bonds, (AGM/Q-SBLF Insured), Series 2001 | ||||||||||||
6.000% due 05/01/2029 | $ | 1,145 | $ | 1,220 | ||||||||
Great Lakes Water Authority Water Supply System, Michigan Revenue Bonds, Series 2023 | ||||||||||||
5.250% due 07/01/2048 | 2,500 | 2,772 | ||||||||||
Michigan Finance Authority Hospital Revenue Refunding Bonds, Series 2022 | ||||||||||||
4.000% due 04/15/2042 | 1,000 | 975 | ||||||||||
Michigan Finance Authority Revenue Bonds, Series 2017 | ||||||||||||
5.000% due 12/01/2046 | 2,330 | 2,372 | ||||||||||
Michigan Finance Authority Revenue Bonds, Series 2019 | ||||||||||||
4.000% due 02/15/2047 | 3,500 | 3,311 | ||||||||||
4.000% due 02/15/2050 | 2,000 | 1,865 | ||||||||||
Michigan State Housing Development Authority Revenue Bonds, Series 2015 | ||||||||||||
4.350% due 10/01/2045 | 920 | 911 | ||||||||||
Michigan Tobacco Settlement Finance Authority Revenue Bonds, Series 2008 | ||||||||||||
0.000% due 06/01/2058 (c) | 15,000 | 482 | ||||||||||
13,908 | ||||||||||||
MINNESOTA 0.7% | ||||||||||||
Duluth Economic Development Authority Health Care Facilities, Minnesota Revenue Bonds, Series 2022 | ||||||||||||
5.250% due 06/15/2047 | 500 | 543 | ||||||||||
Minnesota Agricultural & Economic Development Board Revenue Bonds, Series 2024 | ||||||||||||
5.250% due 01/01/2047 | 1,000 | 1,095 | ||||||||||
1,638 | ||||||||||||
MISSOURI 1.2% | ||||||||||||
Health & Educational Facilities Authority of the State of Missouri Revenue Bonds, Series 2019 | ||||||||||||
4.000% due 02/15/2039 | 600 | 598 | ||||||||||
Health & Educational Facilities Authority of the State of Missouri Revenue Bonds, Series 2023 | ||||||||||||
5.500% due 12/01/2048 | 1,150 | 1,269 | ||||||||||
Missouri Development Finance Board Revenue Bonds, Series 2022 | ||||||||||||
5.250% due 05/01/2055 | 1,000 | 1,059 | ||||||||||
2,926 | ||||||||||||
MULTI-STATE 0.8% | ||||||||||||
Freddie Mac Multifamily ML Certificates, Revenue Bonds, Series 2023 | ||||||||||||
4.141% due 01/25/2040 | 1,981 | 1,942 | ||||||||||
NEBRASKA 0.4% | ||||||||||||
University of Nebraska Facilities Corp Revenue Bonds, Series 2021 | ||||||||||||
4.000% due 07/15/2062 | 1,125 | 1,059 | ||||||||||
NEVADA 1.2% | ||||||||||||
Las Vegas Convention & Visitors Authority, Nevada Revenue Bonds, Series 2023 | ||||||||||||
5.000% due 07/01/2049 | 1,700 | 1,817 | ||||||||||
Reno, Nevada Revenue Bonds, Series 2018 | ||||||||||||
0.000% due 07/01/2058 (c) | 10,500 | 1,117 | ||||||||||
2,934 | ||||||||||||
NEW HAMPSHIRE 1.1% | ||||||||||||
New Hampshire Business Finance Authority Revenue Bonds, Series 2023 | ||||||||||||
4.837% due 07/20/2036 | 2,690 | 2,721 | ||||||||||
PRINCIPAL AMOUNT (000S) | MARKET VALUE (000S) | |||||||||||
NEW JERSEY 8.2% | ||||||||||||
Cherry Hill Township School District, New Jersey General Obligation Bonds, Series 2022 | ||||||||||||
4.000% due 08/01/2040 | $ | 2,600 | $ | 2,602 | ||||||||
Federal Home Loan Mortgage Corp. Enhanced Receipt, New Jersey Revenue Bonds, Series 2019 | ||||||||||||
3.870% due 11/15/2035 (e) | 65 | 59 | ||||||||||
New Jersey Economic Development Authority Revenue Bonds, Series 2016 | ||||||||||||
5.000% due 06/15/2041 | 2,500 | 2,610 | ||||||||||
New Jersey Economic Development Authority Special Assessment Bonds, Series 2002 | ||||||||||||
5.750% due 04/01/2031 | 2,050 | 2,086 | ||||||||||
New Jersey Health Care Facilities Financing Authority Revenue Bonds, Series 2013 | ||||||||||||
5.500% due 07/01/2043 | 2,000 | 2,004 | ||||||||||
New Jersey Transportation Trust Fund Authority Revenue Bonds, (AGM Insured), Series 2006 | ||||||||||||
0.000% due 12/15/2034 (c) | 1,500 | 1,015 | ||||||||||
New Jersey Transportation Trust Fund Authority Revenue Bonds, Series 2019 | ||||||||||||
5.250% due 06/15/2043 | 1,000 | 1,045 | ||||||||||
New Jersey Transportation Trust Fund Authority Revenue Bonds, Series 2023 | ||||||||||||
5.250% due 06/15/2050 | 1,150 | 1,258 | ||||||||||
New Jersey Turnpike Authority Revenue Bonds, Series 2024 | ||||||||||||
4.125% due 01/01/2054 | 1,200 | 1,194 | ||||||||||
South Jersey Port Corp., New Jersey Revenue Bonds, Series 2017 | ||||||||||||
5.000% due 01/01/2049 | 250 | 256 | ||||||||||
Tobacco Settlement Financing Corp., New Jersey Revenue Bonds, Series 2018 | ||||||||||||
5.000% due 06/01/2031 | 1,000 | 1,055 | ||||||||||
5.000% due 06/01/2046 | 5,225 | 5,275 | ||||||||||
20,459 | ||||||||||||
NEW YORK 26.8% | ||||||||||||
Build NYC Resource Corp., New York Revenue Bonds, Series 2023 | ||||||||||||
5.250% due 07/01/2057 | 1,000 | 1,034 | ||||||||||
Erie County, New York Industrial Development Agency Revenue Bonds, (FNMA Insured), Series 2023 | ||||||||||||
4.250% due 02/01/2041 | 1,100 | 1,053 | ||||||||||
Freddie Mac Multifamily ML Certificates, Revenue Bonds, Series 2024 | ||||||||||||
4.563% due 04/25/2042 ~ | 2,500 | 2,619 | ||||||||||
Metropolitan Transportation Authority, New York Revenue Bonds, Series 2020 | ||||||||||||
5.250% due 11/15/2055 | 2,000 | 2,105 | ||||||||||
Monroe County Industrial Development Corp, New York Revenue Bonds, Series 2023 | ||||||||||||
5.000% due 07/01/2053 | 1,250 | 1,354 | ||||||||||
Monroe County Industrial Development Corp., New York Revenue Bonds, Series 2020 | ||||||||||||
4.000% due 07/01/2050 | 1,780 | 1,711 | ||||||||||
Nassau County, New York Industrial Development Agency Revenue Bonds, Series 2021 | ||||||||||||
5.000% due 01/01/2058 ^(b) | 2,867 | 858 | ||||||||||
New York City Transitional Finance Authority Future Tax Secured, New York Revenue Bonds, Series 2019 | ||||||||||||
4.000% due 05/01/2041 | 1,110 | 1,102 | ||||||||||
New York City, New York General Obligation Bonds, Series 2018 | ||||||||||||
5.000% due 12/01/2037 | 750 | 794 | ||||||||||
5.000% due 04/01/2045 | 2,300 | 2,380 | ||||||||||
New York City, New York Municipal Water Finance Authority Revenue Bonds, Series 2022 | ||||||||||||
5.000% due 06/15/2047 | 4,000 | 4,341 | ||||||||||
New York City, New York Transitional Finance Authority Future Tax Secured Revenue Bonds, Series 2022 | ||||||||||||
5.500% due 11/01/2045 | 2,000 | 2,272 |
See Accompanying Notes | SEMIANNUAL REPORT | | | JUNE 30, 2024 | 53 |
Schedule of Investments | PIMCO Municipal Income Fund | (Cont.) |
PRINCIPAL AMOUNT (000S) | MARKET VALUE (000S) | |||||||||||
New York Liberty Development Corp. Revenue Bonds, Series 2005 | ||||||||||||
5.250% due 10/01/2035 | $ | 10,000 | $ | 11,559 | ||||||||
New York Liberty Development Corp. Revenue Bonds, Series 2007 | ||||||||||||
5.500% due 10/01/2037 | 3,000 | 3,560 | ||||||||||
New York Liberty Development Corp. Revenue Bonds, Series 2021 | ||||||||||||
2.875% due 11/15/2046 | 1,625 | 1,193 | ||||||||||
New York Power Authority Revenue Bonds, (AGM Insured), Series 2022 | ||||||||||||
4.000% due 11/15/2061 | 850 | 814 | ||||||||||
New York Power Authority Revenue Bonds, Series 2020 | ||||||||||||
4.000% due 11/15/2060 | 1,250 | 1,189 | ||||||||||
New York State Dormitory Authority Revenue Bonds, Series 2017 | ||||||||||||
4.000% due 02/15/2047 | 1,500 | 1,458 | ||||||||||
New York State Dormitory Authority Revenue Bonds, Series 2019 | ||||||||||||
5.000% due 03/15/2041 | 1,000 | 1,056 | ||||||||||
New York State Dormitory Authority Revenue Bonds, Series 2020 | ||||||||||||
4.000% due 03/15/2048 | 3,375 | 3,297 | ||||||||||
New York State Dormitory Authority Revenue Bonds, Series 2024 | ||||||||||||
5.000% due 03/15/2046 | 1,500 | 1,650 | ||||||||||
New York State Thruway Authority Revenue Bonds, Series 2019 | ||||||||||||
4.000% due 01/01/2050 | 575 | 548 | ||||||||||
New York State Thruway Authority Revenue Bonds, Series 2021 | ||||||||||||
4.000% due 03/15/2040 | 1,500 | 1,505 | ||||||||||
4.000% due 03/15/2047 | 2,000 | 1,956 | ||||||||||
New York State Urban Development Corp. Revenue Bonds, Series 2019 | ||||||||||||
4.000% due 03/15/2045 | 1,200 | 1,171 | ||||||||||
New York State Urban Development Corp. Revenue Bonds, Series 2021 | ||||||||||||
4.000% due 03/15/2047 | 2,750 | 2,658 | ||||||||||
New York State Urban Development Corp. Revenue Bonds, Series 2023 | ||||||||||||
5.000% due 03/15/2051 | 1,000 | 1,089 | ||||||||||
New York Transportation Development Corp. Revenue Bonds, (AGM Insured), Series 2023 | ||||||||||||
5.125% due 06/30/2060 | 2,500 | 2,589 | ||||||||||
Onondaga County, New York Trust for Cultural Resources Revenue Bonds, Series 2019 | ||||||||||||
4.000% due 12/01/2047 | 1,100 | 1,074 | ||||||||||
Suffolk Tobacco Asset Securitization Corp., New York Revenue Bonds, Series 2021 | ||||||||||||
4.000% due 06/01/2050 | 1,500 | 1,341 | ||||||||||
Triborough Bridge & Tunnel Authority Sales Tax, New York Revenue Bonds, Series 2022 | ||||||||||||
4.000% due 05/15/2057 | 2,750 | 2,621 | ||||||||||
Triborough Bridge & Tunnel Authority, New York Revenue Bonds, Series 2021 | ||||||||||||
5.000% due 05/15/2051 | 1,760 | 1,874 | ||||||||||
Utility Debt Securitization Authority, New York Revenue Bonds, Series 2023 | ||||||||||||
5.000% due 12/15/2050 | 700 | 775 | ||||||||||
66,600 | ||||||||||||
NORTH CAROLINA 2.2% | ||||||||||||
Inlivian, North Carolina Revenue Bonds, (FNMA Insured), Series 2024 | ||||||||||||
4.450% due 06/01/2041 | 1,100 | 1,101 | ||||||||||
North Carolina Turnpike Authority Revenue Bonds, (AGM Insured), Series 2024 | ||||||||||||
5.000% due 01/01/2058 | 1,900 | 2,009 | ||||||||||
University of North Carolina Hospitals at Chapel Hill Revenue Bonds, Series 2016 | ||||||||||||
4.000% due 02/01/2046 | 2,500 | 2,448 | ||||||||||
5,558 | ||||||||||||
PRINCIPAL AMOUNT (000S) | MARKET VALUE (000S) | |||||||||||
NORTH DAKOTA 0.0% | ||||||||||||
Grand Forks County, North Dakota Revenue Bonds, Series 2021 | ||||||||||||
7.000% due 12/15/2043 ^(b) | $ | 850 | $ | 25 | ||||||||
OHIO 5.2% | ||||||||||||
Buckeye Tobacco Settlement Financing Authority, Ohio Revenue Bonds, Series 2020 | ||||||||||||
0.000% due 06/01/2057 (c) | 36,500 | 3,424 | ||||||||||
Canton City School District, Ohio General Obligation Bonds, Series 2023 | ||||||||||||
5.500% due 12/01/2050 | 1,500 | 1,650 | ||||||||||
Montgomery County, Ohio Dayton Children’s Hospital Revenue Bonds, Series 2021 | ||||||||||||
4.000% due 08/01/2046 | 2,250 | 2,186 | ||||||||||
Ohio Air Quality Development Authority Dayton Power And Light Company Project Revenue Bonds , Series 2015 | ||||||||||||
4.250% due 11/01/2040 | 2,000 | 2,009 | ||||||||||
Ohio Air Quality Development Authority Revenue Bonds, Series 2019 | ||||||||||||
5.000% due 07/01/2049 | 1,250 | 1,169 | ||||||||||
Ohio Air Quality Development Authority Revenue Notes, Series 2019 | ||||||||||||
3.250% due 09/01/2029 | 850 | 817 | ||||||||||
Ohio Housing Finance Agency Revenue Bonds, (GNMA/FNMA/FHLMC Insured), Series 2024 | ||||||||||||
4.350% due 09/01/2044 | 1,100 | 1,104 | ||||||||||
Worthington City School District, Ohio General Obligation Bonds, Series 2023 | ||||||||||||
5.500% due 12/01/2054 | 455 | 508 | ||||||||||
12,867 | ||||||||||||
OKLAHOMA 1.3% | ||||||||||||
Oklahoma Development Finance Authority Revenue Bonds, Series 2021 | ||||||||||||
8.000% due 12/01/2041 | 750 | 619 | ||||||||||
Oklahoma Turnpike Authority Revenue Bonds, Series 2023 | ||||||||||||
4.500% due 01/01/2053 | 2,510 | 2,561 | ||||||||||
3,180 | ||||||||||||
OREGON 1.8% | ||||||||||||
Medford Hospital Facilities Authority, Oregon Revenue Bonds, Series 2020 | ||||||||||||
4.000% due 08/15/2039 | 1,000 | 985 | ||||||||||
4.000% due 08/15/2050 | 1,500 | 1,405 | ||||||||||
Multnomah County School District 40, Oregon General Obligation Bonds, Series 2023 | ||||||||||||
0.000% due 06/15/2051 (c) | 1,590 | 412 | ||||||||||
Washington & Multnomah Counties School District No 48J Beaverton, Oregon General Obligation Bonds, Series 2022 | ||||||||||||
0.000% due 06/15/2048 (c) | 2,310 | 721 | ||||||||||
5.000% due 06/15/2052 | 1,000 | 1,074 | ||||||||||
4,597 | ||||||||||||
PENNSYLVANIA 3.5% | ||||||||||||
Commonwealth of Pennsylvania General Obligation Bonds, Series 2023 | ||||||||||||
4.000% due 09/01/2042 | 2,800 | 2,756 | ||||||||||
Pennsylvania Economic Development Financing Authority Revenue Bonds, (AGM Insured), Series 2022 | ||||||||||||
5.750% due 12/31/2062 | 3,000 | 3,279 | ||||||||||
Pennsylvania Economic Development Financing Authority Revenue Bonds, Series 2021 | ||||||||||||
9.000% due 04/01/2051 | 1,500 | 1,651 | ||||||||||
Philadelphia Authority for Industrial Development, Pennsylvania Revenue Bonds, Series 2017 | ||||||||||||
5.500% due 12/01/2058 | 1,000 | 964 | ||||||||||
8,650 | ||||||||||||
PRINCIPAL AMOUNT (000S) | MARKET VALUE (000S) | |||||||||||
PUERTO RICO 6.1% | ||||||||||||
Children’s Trust Fund, Puerto Rico Revenue Bonds, Series 2008 | ||||||||||||
0.000% due 05/15/2057 (c) | $ | 28,000 | $ | 1,945 | ||||||||
Commonwealth of Puerto Rico Bonds, Series 2022 | ||||||||||||
0.000% due 11/01/2051 | 2,708 | 1,489 | ||||||||||
Commonwealth of Puerto Rico General Obligation Bonds, Series 2021 | ||||||||||||
0.000% due 07/01/2033 (c) | 1,750 | 1,170 | ||||||||||
4.000% due 07/01/2041 | 1,700 | 1,590 | ||||||||||
Puerto Rico Sales Tax Financing Corp. Sales Tax Revenue Bonds, Series 2018 | ||||||||||||
0.000% due 07/01/2046 (c) | 9,650 | 3,120 | ||||||||||
0.000% due 07/01/2051 (c) | 10,000 | 2,353 | ||||||||||
Puerto Rico Sales Tax Financing Corp. Sales Tax Revenue Bonds, Series 2019 | ||||||||||||
4.784% due 07/01/2058 | 3,395 | 3,358 | ||||||||||
15,025 | ||||||||||||
RHODE ISLAND 0.8% | ||||||||||||
Tobacco Settlement Financing Corp., Rhode Island Revenue Bonds, Series 2015 | ||||||||||||
5.000% due 06/01/2050 | 2,000 | 2,003 | ||||||||||
SOUTH CAROLINA 2.5% | ||||||||||||
South Carolina Public Service Authority Revenue Obligations Revenue Bonds, Series 2013 | ||||||||||||
5.125% due 12/01/2043 | 5,000 | 5,000 | ||||||||||
5.500% due 12/01/2053 | 1,100 | 1,101 | ||||||||||
6,101 | ||||||||||||
TENNESSEE 0.2% | ||||||||||||
Shelby County, Tennessee Health Educational & Housing Facilities Board Revenue Bonds, Series 2019 | ||||||||||||
5.750% due 10/01/2049 | 700 | 519 | ||||||||||
TEXAS 28.4% | ||||||||||||
Angelina & Neches River Authority, Texas Revenue Bonds, Series 2021 | ||||||||||||
7.500% due 12/01/2045 | 590 | 398 | ||||||||||
12.000% due 12/01/2045 | 1,000 | 880 | ||||||||||
Board of Regents of the University of Texas System Revenue Bonds, Series 2022 | ||||||||||||
4.000% due 08/15/2052 | 2,500 | 2,409 | ||||||||||
Brazoria County, Texas Industrial Development Corp. Revenue Bonds, Series 2023 | ||||||||||||
12.000% due 06/01/2043 | 2,000 | 2,025 | ||||||||||
Central Texas Turnpike System Revenue Bonds, Series 2015 | ||||||||||||
0.000% due 08/15/2036 (c) | 1,250 | 727 | ||||||||||
0.000% due 08/15/2037 (c) | 3,500 | 1,934 | ||||||||||
Clifton Higher Education Finance Corp., Texas Revenue Bonds, Series 2018 | ||||||||||||
6.125% due 08/15/2048 | 1,000 | 1,016 | ||||||||||
Coppell Independent School District, Texas General Obligation Bonds, (PSF Insured), Series 2023 | ||||||||||||
4.250% due 08/15/2053 | 850 | 847 | ||||||||||
Corpus Christi Independent School District, Texas General Obligation Bonds, (PSF Insured), Series 2023 | ||||||||||||
4.125% due 08/15/2053 | 1,200 | 1,179 | ||||||||||
Dallas Area Rapid Transit, Texas Revenue Bonds, Series 2021 | ||||||||||||
4.000% due 12/01/2051 | 4,750 | 4,547 | ||||||||||
Dallas Fort Worth International Airport, Texas Revenue Bonds, Series 2022 | ||||||||||||
5.000% due 11/01/2039 | 1,000 | 1,111 | ||||||||||
Dallas Independent School District, Texas General Obligation Bonds, (PSF Insured), Series 2024 | ||||||||||||
4.000% due 02/15/2054 | 1,400 | 1,345 |
54 | PIMCO CLOSED-END FUNDS | See Accompanying Notes |
JUNE 30, 2024 | (Unaudited) |
PRINCIPAL AMOUNT (000S) | MARKET VALUE (000S) | |||||||||||
Edgewood Independent School District/Van Zandt County, Texas General Obligation Bonds, (PSF Insured), Series 2023 | ||||||||||||
4.000% due 02/15/2048 | $ | 1,200 | $ | 1,166 | ||||||||
EP Tuscany Zaragosa PFC, Texas Revenue Notes, Series 2023 | ||||||||||||
4.000% due 12/01/2033 | 3,750 | 3,639 | ||||||||||
Fort Bend County Texas Public Facility Corp. Revenue Bonds, Series 2023 | ||||||||||||
5.000% due 03/01/2048 | 3,000 | 3,182 | ||||||||||
Garland Independent School District, Texas General Obligation Bonds, (PSF Insured), Series 2023 | ||||||||||||
5.000% due 02/15/2048 | 2,800 | 3,037 | ||||||||||
Grand Parkway Transportation Corp., Texas Revenue Bonds, (AGM/CR Insured), Series 2020 | ||||||||||||
4.000% due 10/01/2049 | 900 | 852 | ||||||||||
Greenwood Independent School District, Texas General Obligation Bonds, (PSF Insured), Series 2024 | ||||||||||||
4.000% due 02/15/2054 | 2,700 | 2,545 | ||||||||||
Harris County, Texas Toll Road Revenue Bonds, Series 2024 | ||||||||||||
4.000% due 08/15/2041 | 1,250 | 1,247 | ||||||||||
Hays Consolidated Independent School District, Texas General Obligation Bonds, (PSF Insured), Series 2023 | ||||||||||||
5.000% due 02/15/2048 | 1,250 | 1,341 | ||||||||||
Houston, Texas Combined Utility System Revenue Bonds, Series 2020 | ||||||||||||
4.000% due 11/15/2049 | 1,000 | 954 | ||||||||||
Hurst-Euless-Bedford Independent School District, Texas General Obligation Bonds, (PSF Insured), Series 2024 | ||||||||||||
4.000% due 08/15/2050 | 1,000 | 969 | ||||||||||
Katy Independent School District, Texas General Obligation Bonds, (PSF Insured), Series 2024 | ||||||||||||
4.000% due 02/15/2049 (a) | 1,400 | 1,351 | ||||||||||
Lamar Consolidated Independent School District, Texas General Obligation Bonds, (PSF Insured), Series 2023 | ||||||||||||
4.000% due 02/15/2048 | 1,250 | 1,213 | ||||||||||
Lamar Consolidated Independent School District, Texas General Obligation Bonds, (PSF Insured), Series 2023 | ||||||||||||
5.000% due 02/15/2053 | 4,500 | 4,832 | ||||||||||
Lamar Consolidated Independent School District, Texas General Obligation Bonds, Series 2023 | ||||||||||||
4.000% due 02/15/2048 | 2,500 | 2,414 | ||||||||||
Lower Colorado River Authority, Texas Revenue Bonds, (AGM Insured), Series 2024 | ||||||||||||
5.000% due 05/15/2049 | 1,000 | 1,087 | ||||||||||
Medina Valley Independent School District, Texas General Obligation Bonds, (PSF Insured), Series 2023 | ||||||||||||
4.500% due 02/15/2047 | 1,000 | 1,029 | ||||||||||
North Texas Tollway Authority Revenue Bonds, Series 2017 | ||||||||||||
4.000% due 01/01/2043 | 1,500 | 1,455 | ||||||||||
San Antonio Municipal Facilities Corp., Texas Revenue Bonds, Series 2021 | ||||||||||||
4.000% due 08/01/2048 | 2,700 | 2,595 | ||||||||||
San Antonio, Texas Electric & Gas Systems Revenue Bonds, Series 2024 | ||||||||||||
5.250% due 02/01/2049 | 2,500 | 2,751 | ||||||||||
Tarrant County, Texas Cultural Education Facilities Finance Corp. Revenue Bonds, Series 2017 | ||||||||||||
6.750% due 11/15/2047 | 500 | 518 |
PRINCIPAL AMOUNT (000S) | MARKET VALUE (000S) | |||||||||||
Tarrant County, Texas Cultural Education Facilities Finance Corp. Revenue Bonds, Series 2022 | ||||||||||||
5.000% due 11/15/2051 | $ | 1,380 | $ | 1,454 | ||||||||
Tarrant County, Texas Hospital District General Obligation Bonds, Series 2023 | ||||||||||||
5.250% due 08/15/2048 | 2,600 | 2,849 | ||||||||||
Texas Municipal Gas Acquisition & Supply Corp. Revenue Bonds, Series 2008 | ||||||||||||
6.250% due 12/15/2026 | 2,800 | 2,883 | ||||||||||
Texas Private Activity Bond Surface Transportation Corp. Revenue Bonds, Series 2019 | ||||||||||||
5.000% due 06/30/2058 | 2,000 | 2,042 | ||||||||||
Texas Water Development Board Revenue Bonds, Series 2022 | ||||||||||||
4.800% due 10/15/2052 | 800 | 832 | ||||||||||
Texas Water Development Board Revenue Bonds, Series 2023 | ||||||||||||
4.875% due 10/15/2048 | 1,500 | 1,586 | ||||||||||
5.000% due 10/15/2058 | 1,000 | 1,075 | ||||||||||
West Harris County, Texas Regional Water Authority Revenue Bonds, (BAM Insured), Series 2021 | ||||||||||||
4.000% due 12/15/2060 | 1,160 | 1,071 | ||||||||||
70,387 | ||||||||||||
UTAH 3.1% | ||||||||||||
County of Salt Lake, Utah Revenue Bonds, (AMBAC Insured), Series 2001 | ||||||||||||
5.125% due 02/15/2033 | 7,000 | 7,047 | ||||||||||
Ogden City Redevelopment Agency, Utah Revenue Bonds, Series 2023 | ||||||||||||
5.000% due 01/15/2053 | 600 | 638 | ||||||||||
7,685 | ||||||||||||
VIRGINIA 5.2% | ||||||||||||
Virginia Small Business Financing Authority Revenue Bonds, Series 2019 | ||||||||||||
0.000% due 07/01/2061 (c) | 23,000 | 739 | ||||||||||
5.000% due 07/01/2034 | 1,470 | 1,371 | ||||||||||
Virginia Small Business Financing Authority Revenue Bonds, Series 2020 | ||||||||||||
4.000% due 12/01/2049 | 11,200 | 10,714 | ||||||||||
12,824 | ||||||||||||
WASHINGTON 0.8% | ||||||||||||
Washington State Convention Center Public Facilities District Revenue Bonds, Series 2018 | ||||||||||||
4.000% due 07/01/2058 | 2,155 | 1,959 | ||||||||||
WEST VIRGINIA 1.4% | ||||||||||||
Monongalia County, West Virginia Commission Special District Revenue Bonds, Series 2017 | ||||||||||||
5.500% due 06/01/2037 | 1,000 | 1,025 | ||||||||||
West Virginia Economic Development Authority Revenue Bonds, Series 2017 | ||||||||||||
4.000% due 06/15/2040 | 2,500 | 2,502 | ||||||||||
3,527 | ||||||||||||
PRINCIPAL AMOUNT (000S) | MARKET VALUE (000S) | |||||||||||
WISCONSIN 4.5% | ||||||||||||
Public Finance Authority, Wisconsin Revenue Bonds, Series 2017 | ||||||||||||
7.000% due 01/01/2050 | $ | 2,500 | $ | 2,675 | ||||||||
Public Finance Authority, Wisconsin Revenue Bonds, Series 2018 | ||||||||||||
6.375% due 01/01/2048 | 3,000 | 1,350 | ||||||||||
Public Finance Authority, Wisconsin Revenue Bonds, Series 2020 | ||||||||||||
0.000% due 01/01/2060 (c) | 7,500 | 557 | ||||||||||
Public Finance Authority, Wisconsin Revenue Bonds, Series 2021 | ||||||||||||
4.000% due 03/31/2056 | 1,100 | 916 | ||||||||||
4.500% due 06/01/2056 | 820 | 663 | ||||||||||
Wisconsin Center District Revenue Bonds, (AGM Insured), Series 2020 | ||||||||||||
0.000% due 12/15/2045 (c) | 7,000 | 2,511 | ||||||||||
Wisconsin Health & Educational Facilities Authority Revenue Bonds, Series 2016 | ||||||||||||
4.000% due 11/15/2046 | 695 | 703 | ||||||||||
Wisconsin Health & Educational Facilities Authority Revenue Bonds, Series 2022 | ||||||||||||
4.000% due 12/01/2051 | 1,920 | 1,772 | ||||||||||
11,147 | ||||||||||||
Total Municipal Bonds & Notes (Cost $413,237) | 411,200 | |||||||||||
U.S. GOVERNMENT AGENCIES 2.8% | ||||||||||||
Freddie Mac | ||||||||||||
3.800% due 01/01/2040 | 4,988 | 4,740 | ||||||||||
3.850% due 01/01/2040 | 2,500 | 2,378 | ||||||||||
Total U.S. Government Agencies (Cost $7,149) | 7,118 | |||||||||||
SHORT-TERM INSTRUMENTS 0.9% | ||||||||||||
REPURCHASE AGREEMENTS (f) 0.9% | ||||||||||||
2,160 | ||||||||||||
Total Short-Term Instruments (Cost $2,160) | 2,160 | |||||||||||
Total Investments in Securities (Cost $425,546) | 423,478 | |||||||||||
Total Investments 170.6% (Cost $425,546) | $ | 423,478 | ||||||||||
Auction Rate Preferred Shares (1.0)% | (2,500 | ) | ||||||||||
Remarketable Variable Rate MuniFund Term Preferred Shares, at liquidation value (69.4)% | (172,209 | ) | ||||||||||
Other Assets and Liabilities, net (0.2)% | (519 | ) | ||||||||||
Net Assets Applicable to Common Shareholders 100.0% | $ | 248,250 | ||||||||||
* | A zero balance may reflect actual amounts rounding to less than one thousand. |
^ | Security is in default. |
« | Security valued using significant unobservable inputs (Level 3). |
µ | All or a portion of this amount represents unfunded loan commitments. The interest rate for the unfunded portion will be determined at the time of funding. See Note 4, Securities and Other Investments, in the Notes to Financial Statements for more information regarding unfunded loan commitments. |
~ | Variable or Floating rate security. Rate shown is the rate in effect as of period end. Certain variable rate securities are not based on a published reference rate and spread, rather are determined by the issuer or agent and are based on current market conditions. Reference rate is as of reset date, which may vary by security. These securities may not indicate a reference rate and/or spread in their description. |
(a) | When-issued security. |
See Accompanying Notes | SEMIANNUAL REPORT | | | JUNE 30, 2024 | 55 |
Schedule of Investments | PIMCO Municipal Income Fund | (Cont.) |
(b) | Security is not accruing income as of the date of this report. |
(c) | Zero coupon security. |
(d) | Security becomes interest bearing at a future date. |
Issuer Description | Coupon | Maturity Date | Acquisition Date | Cost | Market Value | Market Value as Percentage of Net Assets Applicable to Common Shareholders | ||||||||||||||||
Federal Home Loan Mortgage Corp. Enhanced Receipt, New Jersey Revenue Bonds, Series 2019 | 3.870% | 11/15/2035 | 10/26/2020 | $ 73 | $ | 59 | 0.02% | |||||||||||||||
Counterparty | Lending Rate | Settlement Date | Maturity Date | Principal Amount | Collateralized By | Collateral (Received) | Repurchase Agreements, at Value | Repurchase Agreement Proceeds to be Received (1) | ||||||||||||||||||||||
FICC | 2.600 | % | 06/28/2024 | 07/01/2024 | $ | 2,160 | U.S. Treasury Inflation Protected Securities 0.625% due 01/15/2026 | $ | (2,203 | ) | $ | 2,160 | $ | 2,160 | ||||||||||||||||
Total Repurchase Agreements | $ | (2,203 | ) | $ | 2,160 | $ | 2,160 | |||||||||||||||||||||||
Counterparty | Repurchase Agreement Proceeds to be Received (1) | Payable for Reverse Repurchase Agreements | Payable for Sale-Buyback Transactions | Total Borrowings and Other Financing Transactions | Collateral Pledged/(Received) | Net Exposure (2) | ||||||||||||||||||
Global/Master Repurchase Agreement | ||||||||||||||||||||||||
FICC | $ | 2,160 | $ | 0 | $ | 0 | $ | 2,160 | $ | (2,203 | ) | $ | (43 | ) | ||||||||||
Total Borrowings and Other Financing Transactions | $ | 2,160 | $ | 0 | $ | 0 | ||||||||||||||||||
(1) | Includes accrued interest. |
(2) | Net Exposure represents the net receivable/(payable) that would be due from/to the counterparty in the event of default. Exposure from borrowings and other financing transactions can only be netted across transactions governed under the same master agreement with the same legal entity. See Note 7, Master Netting Arrangements, in the Notes to Financial Statements for more information. |
Category and Subcategory | Level 1 | Level 2 | Level 3 | Fair Value at 06/30/2024 | ||||||||||||
Investments in Securities, at Value | ||||||||||||||||
Loan Participations and Assignments | $ | 0 | $ | 0 | $ | 3,000 | $ | 3,000 | ||||||||
Municipal Bonds & Notes | ||||||||||||||||
Alabama | 0 | 4,022 | 0 | 4,022 | ||||||||||||
Alaska | 0 | 1,160 | 0 | 1,160 | ||||||||||||
Arizona | 0 | 9,859 | 0 | 9,859 | ||||||||||||
Arkansas | 0 | 5,376 | 0 | 5,376 | ||||||||||||
California | 0 | 8,909 | 0 | 8,909 | ||||||||||||
Colorado | 0 | 8,835 | 0 | 8,835 | ||||||||||||
Connecticut | 0 | 1,355 | 0 | 1,355 | ||||||||||||
Delaware | 0 | 5,323 | 0 | 5,323 | ||||||||||||
District of Columbia | 0 | 1,859 | 0 | 1,859 | ||||||||||||
Florida | 0 | 17,848 | 0 | 17,848 | ||||||||||||
Georgia | 0 | 11,755 | 0 | 11,755 | ||||||||||||
Illinois | 0 | 26,873 | 0 | 26,873 | ||||||||||||
Indiana | 0 | 5,448 | 0 | 5,448 | ||||||||||||
Iowa | 0 | 7,588 | 0 | 7,588 |
Category and Subcategory | Level 1 | Level 2 | Level 3 | Fair Value at 06/30/2024 | ||||||||||||
Kansas | $ | 0 | $ | 102 | $ | 0 | $ | 102 | ||||||||
Louisiana | 0 | 9,718 | 0 | 9,718 | ||||||||||||
Maryland | 0 | 481 | 0 | 481 | ||||||||||||
Massachusetts | 0 | 4,448 | 0 | 4,448 | ||||||||||||
Michigan | 0 | 13,908 | 0 | 13,908 | ||||||||||||
Minnesota | 0 | 1,638 | 0 | 1,638 | ||||||||||||
Missouri | 0 | 2,926 | 0 | 2,926 | ||||||||||||
Multi-State | 0 | 1,942 | 0 | 1,942 | ||||||||||||
Nebraska | 0 | 1,059 | 0 | 1,059 | ||||||||||||
Nevada | 0 | 2,934 | 0 | 2,934 | ||||||||||||
New Hampshire | 0 | 2,721 | 0 | 2,721 | ||||||||||||
New Jersey | 0 | 20,459 | 0 | 20,459 | ||||||||||||
New York | 0 | 66,600 | 0 | 66,600 | ||||||||||||
North Carolina | 0 | 5,558 | 0 | 5,558 | ||||||||||||
North Dakota | 0 | 25 | 0 | 25 | ||||||||||||
Ohio | 0 | 12,867 | 0 | 12,867 | ||||||||||||
Oklahoma | 0 | 3,180 | 0 | 3,180 |
56 | PIMCO CLOSED-END FUNDS | See Accompanying Notes |
June 30, 2024 | (Unaudited) |
Category and Subcategory | Level 1 | Level 2 | Level 3 | Fair Value at 06/30/2024 | ||||||||||||
Oregon | $ | 0 | $ | 4,597 | $ | 0 | $ | 4,597 | ||||||||
Pennsylvania | 0 | 8,650 | 0 | 8,650 | ||||||||||||
Puerto Rico | 0 | 15,025 | 0 | 15,025 | ||||||||||||
Rhode Island | 0 | 2,003 | 0 | 2,003 | ||||||||||||
South Carolina | 0 | 6,101 | 0 | 6,101 | ||||||||||||
Tennessee | 0 | 519 | 0 | 519 | ||||||||||||
Texas | 0 | 70,387 | 0 | 70,387 | ||||||||||||
Utah | 0 | 7,685 | 0 | 7,685 | ||||||||||||
Virginia | 0 | 12,824 | 0 | 12,824 |
Category and Subcategory | Level 1 | Level 2 | Level 3 | Fair Value at 06/30/2024 | ||||||||||||
Washington | $ | 0 | $ | 1,959 | $ | 0 | $ | 1,959 | ||||||||
West Virginia | 0 | 3,527 | 0 | 3,527 | ||||||||||||
Wisconsin | 0 | 11,147 | 0 | 11,147 | ||||||||||||
U.S. Government Agencies | 0 | 7,118 | 0 | 7,118 | ||||||||||||
Short-Term Instruments | ||||||||||||||||
Repurchase Agreements | 0 | 2,160 | 0 | 2,160 | ||||||||||||
Total Investments | $ | 0 | $ | 420,478 | $ | 3,000 | $ | 423,478 | ||||||||
Category and Subcategory | Beginning Balance at 12/31/2023 | Net Purchases | Net Sales/ Settlements | Accrued Discounts/ (Premiums) | Realized Gain/(Loss) | Net Change in Unrealized Appreciation/ (Depreciation) (1) | Transfers into Level 3 | Transfers out of Level 3 | Ending Balance at 06/30/2024 | Net Change in Unrealized Appreciation/ (Depreciation) on Investments Held at 06/30/2024 (1) | ||||||||||||||||||||||||||||||
Investments in Securities, at Value | ||||||||||||||||||||||||||||||||||||||||
Loan Participations and Assignments | $ | 3,130 | $ | 0 | $ | 0 | $ | 0 | $ | 0 | $ | (130 | ) | $ | 0 | $ | 0 | $ | 3,000 | $ | (130 | ) | ||||||||||||||||||
Totals | $ | 3,130 | $ | 0 | $ | 0 | $ | 0 | $ | 0 | $ | (130 | ) | $ | 0 | $ | 0 | $ | 3,000 | $ | (130 | ) | ||||||||||||||||||
Category and Subcategory | Ending Balance at 06/30/2024 | Valuation Technique | Unobservable Inputs | (% Unless Noted Otherwise) | ||||||||||||
Input Value(s) | Weighted Average | |||||||||||||||
Investments in Securities, at Value | ||||||||||||||||
Loan Participations and Assignments | $ | 3,000 | Discounted Cash Flow | Discount Rate | 6.578 - 7.585 | 6.746 | ||||||||||
Total | $ | 3,000 | ||||||||||||||
(1) | Any difference between Net Change in Unrealized Appreciation/(Depreciation) and Net Change in Unrealized Appreciation/(Depreciation) on Investments Held at June 30, 2024 may be due to an investment no longer held or categorized as Level 3 at period end. |
See Accompanying Notes | SEMIANNUAL REPORT | | | JUNE 30, 2024 | 57 |
Schedule of Investments | PIMCO Municipal Income Fund II |
PRINCIPAL AMOUNT (000S) | MARKET VALUE (000S) | |||||||||||
INVESTMENTS IN SECURITIES 167.1% | ||||||||||||
LOAN PARTICIPATIONS AND ASSIGNMENTS 1.2% | ||||||||||||
Falcon PK | ||||||||||||
TBD% due 11/01/2026 «µ | $ | 1,200 | $ | 1,200 | ||||||||
TBD% - 7.181% due 10/26/2063 «µ | 5,900 | 5,899 | ||||||||||
Total Loan Participations and Assignments (Cost $7,100) | 7,099 | |||||||||||
MUNICIPAL BONDS & NOTES 162.3% | ||||||||||||
ALABAMA 1.5% | ||||||||||||
Jefferson County, Alabama Sewer Revenue Bonds, Series 2024 | ||||||||||||
5.500% due 10/01/2053 | 5,250 | 5,694 | ||||||||||
Tuscaloosa County, Alabama Industrial Development Authority Revenue Bonds, Series 2019 | ||||||||||||
5.250% due 05/01/2044 | 3,300 | 3,314 | ||||||||||
9,008 | ||||||||||||
ALASKA 0.4% | ||||||||||||
Municipality of Anchorage, Alaska Solid Waste Services Revenue Bonds, Series 2022 | ||||||||||||
5.250% due 11/01/2062 | 2,450 | 2,603 | ||||||||||
ARIZONA 9.1% | ||||||||||||
Arizona Industrial Development Authority Revenue Bonds, Series 2019 | ||||||||||||
4.500% due 01/01/2033 | 740 | 410 | ||||||||||
4.750% due 01/01/2038 ^(b) | 950 | 461 | ||||||||||
5.125% due 01/01/2054 ^(b) | 1,500 | 708 | ||||||||||
5.500% due 01/01/2054 ^(b) | 1,500 | 687 | ||||||||||
Arizona Industrial Development Authority Revenue Bonds, Series 2020 | ||||||||||||
7.750% due 07/01/2050 ^(b) | 2,500 | 150 | ||||||||||
Industrial Development Authority of the County, Arizona of Pima Revenue Bonds, Series 2020 | ||||||||||||
5.000% due 07/01/2055 | 2,400 | 2,228 | ||||||||||
Maricopa County, Arizona Industrial Development Authority Revenue Bonds, Series 2017 | ||||||||||||
4.000% due 01/01/2041 | 1,500 | 1,482 | ||||||||||
Maricopa County, Arizona Industrial Development Authority Revenue Bonds, Series 2019 | ||||||||||||
4.000% due 01/01/2044 | 7,700 | 7,479 | ||||||||||
Maricopa County, Arizona School District No 83, Cartwright Elementary Revenue Bonds, Series 2020 | ||||||||||||
4.000% due 10/01/2044 | 8,600 | 7,562 | ||||||||||
Salt River Project Agricultural Improvement & Power District, Arizona Revenue Bonds, Series 2023 | ||||||||||||
5.000% due 01/01/2050 | 2,000 | 2,164 | ||||||||||
Salt Verde Financial Corp., Arizona Revenue Bonds, Series 2007 | ||||||||||||
5.000% due 12/01/2032 | 4,930 | 5,248 | ||||||||||
5.000% due 12/01/2037 | 22,400 | 24,421 | ||||||||||
53,000 | ||||||||||||
ARKANSAS 0.8% | ||||||||||||
Arkansas Development Finance Authority Revenue Bonds, Series 2022 | ||||||||||||
5.450% due 09/01/2052 | 350 | 360 | ||||||||||
Arkansas Development Finance Authority Revenue Bonds, Series 2023 | ||||||||||||
7.375% due 07/01/2048 | 2,500 | 2,746 | ||||||||||
County of Pulaski Hospital, Arkansas Revenue Bonds, Series 2023 | ||||||||||||
5.250% due 03/01/2053 | 1,600 | 1,729 | ||||||||||
4,835 | ||||||||||||
CALIFORNIA 5.4% | ||||||||||||
California Health Facilities Financing Authority Revenue Bonds, Series 2016 | ||||||||||||
5.000% due 11/15/2046 | 7,400 | 7,565 |
PRINCIPAL AMOUNT (000S) | MARKET VALUE (000S) | |||||||||||
California Housing Finance Revenue Bonds, Series 2024 | ||||||||||||
6.000% due 03/01/2053 | $ | 5,100 | $ | 5,095 | ||||||||
California Statewide Communities Development Authority Revenue Bonds, Series 2016 | ||||||||||||
5.000% due 12/01/2046 | 3,000 | 3,021 | ||||||||||
Golden State, California Tobacco Securitization Corp. Revenue Bonds, Series 2021 | ||||||||||||
0.000% due 06/01/2066 (c) | 7,500 | 837 | ||||||||||
Golden State, California Tobacco Securitization Corp. Revenue Bonds, Series 2022 | ||||||||||||
5.000% due 06/01/2051 | 2,000 | 2,073 | ||||||||||
Los Angeles County, California Public Works Financing Authority Revenue Bonds, Series 2021 | ||||||||||||
4.000% due 12/01/2046 | 3,435 | 3,450 | ||||||||||
M-S-R | ||||||||||||
6.500% due 11/01/2039 | 1,750 | 2,220 | ||||||||||
San Diego County, California Regional Airport Authority Revenue Bonds, Series 2021 | ||||||||||||
4.000% due 07/01/2051 | 2,715 | 2,543 | ||||||||||
San Francisco, California City & County Public Utilities Commission Wastewater Revenue Bonds, Series 2021 | ||||||||||||
4.000% due 10/01/2048 | 1,570 | 1,564 | ||||||||||
West Valley-Mission Community College District, California General Obligation Bonds, Series 2022 | ||||||||||||
4.000% due 08/01/2047 | 3,000 | 2,998 | ||||||||||
31,366 | ||||||||||||
COLORADO 5.9% | ||||||||||||
Colorado Health Facilities Authority Revenue Bonds, Series 2018 | ||||||||||||
4.000% due 11/15/2048 | 12,555 | 12,015 | ||||||||||
Colorado Health Facilities Authority Revenue Bonds, Series 2019 | ||||||||||||
4.000% due 01/01/2040 | 5,300 | 5,275 | ||||||||||
4.000% due 08/01/2049 | 4,000 | 3,800 | ||||||||||
Colorado International Center Metropolitan District No 7, General Obligation Bonds, Series 2021 | ||||||||||||
5.250% due 12/01/2051 (d) | 1,615 | 980 | ||||||||||
Colorado State Building Excellent School Certificates of Participation Bonds, Series 2018 | ||||||||||||
4.000% due 03/15/2043 | 3,250 | 3,194 | ||||||||||
Dominion Water & Sanitation District, Colorado Revenue Bonds, Series 2022 | ||||||||||||
5.875% due 12/01/2052 | 2,500 | 2,523 | ||||||||||
Harvest Crossing Metropolitan District No 4, Colorado General Obligation Bonds, Series 2022 | ||||||||||||
7.250% due 12/01/2052 | 3,500 | 3,491 | ||||||||||
Public Authority for Colorado Energy Revenue Bonds, Series 2008 | ||||||||||||
6.500% due 11/15/2038 | 1,430 | 1,754 | ||||||||||
Senac South Metropolitan District No 1, Colorado General Obligation Bonds, Series 2021 | ||||||||||||
5.250% due 12/01/2051 | 1,000 | 889 | ||||||||||
Third Creek Metropolitan District No 1, Colorado General Obligation Bonds, Series 2022 | ||||||||||||
4.750% due 12/01/2051 | 775 | 619 | ||||||||||
34,540 | ||||||||||||
CONNECTICUT 0.5% | ||||||||||||
Connecticut State Health & Educational Facilities Authority Revenue Bonds, Series 2022 | ||||||||||||
5.000% due 07/01/2047 | 3,000 | 3,126 | ||||||||||
DELAWARE 1.0% | ||||||||||||
Affordable Housing Opportunities Trust, Delaware Revenue Bonds, Series 2022 | ||||||||||||
3.461% due 07/01/2037 | 5,360 | 4,855 | ||||||||||
7.120% due 07/01/2037 | 945 | 922 | ||||||||||
5,777 | ||||||||||||
PRINCIPAL AMOUNT (000S) | MARKET VALUE (000S) | |||||||||||
DISTRICT OF COLUMBIA 0.4% | ||||||||||||
District of Columbia Revenue Bonds, Series 2022 | ||||||||||||
5.500% due 02/28/2037 | $ | 1,850 | $ | 2,126 | ||||||||
FLORIDA 5.7% | ||||||||||||
Avenir Community Development District, Florida Special Assessment Bonds, Series 2023 | ||||||||||||
5.625% due 05/01/2054 | 1,385 | 1,417 | ||||||||||
Babcock Ranch Community Independent Special District, Florida Special Assessment Bonds, Series 2022 | ||||||||||||
5.000% due 05/01/2042 | 1,230 | 1,233 | ||||||||||
Central Florida Expressway Authority Revenue Bonds, Series 2017 | ||||||||||||
4.000% due 07/01/2041 | 4,290 | 4,146 | ||||||||||
Charlotte County Industrial Development Authority, Florida Revenue Bonds, Series 2021 | ||||||||||||
4.000% due 10/01/2051 | 1,250 | 1,053 | ||||||||||
Florida Development Finance Corp. Revenue Bonds, Series 2024 | ||||||||||||
4.500% due 08/01/2055 | 3,500 | 3,507 | ||||||||||
Hillsborough County, Florida Industrial Development Authority Revenue Bonds, Series 2020 | ||||||||||||
4.000% due 08/01/2050 | 3,700 | 3,330 | ||||||||||
JEA Water & Sewer System, Florida Revenue Bonds, Series 2024 | ||||||||||||
5.250% due 10/01/2049 | 1,800 | 2,004 | ||||||||||
Miami-Dade County, Florida Water & Sewer System Revenue Bonds, Series 2019 | ||||||||||||
4.000% due 10/01/2049 | 2,500 | 2,408 | ||||||||||
Miami-Dade Seaport Department, Florida Revenue Bonds, Series 2023 | ||||||||||||
5.000% due 10/01/2047 | 3,800 | 3,993 | ||||||||||
Orange County Health Facilities Authority, Florida Revenue Bonds, Series 2023 | ||||||||||||
5.000% due 10/01/2053 | 2,110 | 2,219 | ||||||||||
Palm Beach County, Florida Health Facilities Authority Revenue Bonds, Series 2022 | ||||||||||||
5.000% due 11/01/2052 | 2,850 | 2,869 | ||||||||||
Tampa-Hillsborough County, Florida Expressway Authority Revenue Bonds, Series 2017 | ||||||||||||
4.000% due 07/01/2042 | 5,300 | 5,126 | ||||||||||
33,305 | ||||||||||||
GEORGIA 5.9% | ||||||||||||
Atlanta Development Authority, Georgia Revenue Bonds, Series 2015 | ||||||||||||
5.000% due 07/01/2044 | 3,895 | 3,900 | ||||||||||
Atlanta Development Authority, Georgia Revenue Bonds, Series 2017 | ||||||||||||
6.750% due 01/01/2035 ^(b) | 3,750 | 1,688 | ||||||||||
Fayette County, Georgia Hospital Authority Revenue Bonds, Series 2016 | ||||||||||||
5.000% due 07/01/2046 | 7,000 | 7,073 | ||||||||||
Municipal Electric Authority of Georgia Revenue Bonds, Series 2015 | ||||||||||||
5.000% due 07/01/2060 | 19,680 | 19,700 | ||||||||||
Municipal Electric Authority of Georgia Revenue Bonds, Series 2022 | ||||||||||||
5.000% due 07/01/2052 | 1,000 | 1,045 | ||||||||||
Valdosta & Lowndes County, Georgia Hospital Authority Revenue Bonds, Series 2024 | ||||||||||||
4.125% due 10/01/2049 | 1,000 | 984 | ||||||||||
34,390 | ||||||||||||
ILLINOIS 12.7% | ||||||||||||
Chicago Board of Education, Illinois General Obligation Bonds, Series 2018 | ||||||||||||
5.000% due 12/01/2046 | 7,000 | 7,024 | ||||||||||
Chicago O’Hare International Airport, Illinois Revenue Bonds, (AGM Insured), Series 2020 | ||||||||||||
4.000% due 01/01/2039 | 3,000 | 3,033 |
58 | PIMCO CLOSED-END FUNDS | See Accompanying Notes |
June 30, 2024 | (Unaudited) |
PRINCIPAL AMOUNT (000S) | MARKET VALUE (000S) | |||||||||||
Chicago O’Hare International Airport, Illinois Revenue Bonds, Series 2018 | ||||||||||||
4.000% due 01/01/2044 | $ | 3,000 | $ | 2,936 | ||||||||
Chicago Park District, Illinois General Obligation Bonds, Series 2020 | ||||||||||||
4.000% due 01/01/2036 | 1,300 | 1,312 | ||||||||||
Chicago, Illinois General Obligation Bonds, Series 2007 | ||||||||||||
5.500% due 01/01/2035 | 4,000 | 4,023 | ||||||||||
Illinois Finance Authority Revenue Bonds, Series 2017 | ||||||||||||
5.000% due 02/15/2037 ^(b) | 2,155 | 496 | ||||||||||
Illinois Finance Authority Revenue Bonds, Series 2019 | ||||||||||||
5.000% due 11/01/2035 ^(b) | 2,000 | 1,805 | ||||||||||
Illinois State General Obligation Bonds, Series 2017 | ||||||||||||
5.000% due 11/01/2029 | 1,000 | 1,042 | ||||||||||
Illinois State General Obligation Bonds, Series 2018 | ||||||||||||
4.625% due 05/01/2037 | 2,175 | 2,221 | ||||||||||
5.000% due 05/01/2041 | 1,500 | 1,548 | ||||||||||
Illinois State General Obligation Bonds, Series 2024 | ||||||||||||
4.250% due 05/01/2046 | 6,250 | 6,133 | ||||||||||
Illinois State General Obligation Notes, Series 2017 | ||||||||||||
5.000% due 11/01/2025 | 7,740 | 7,885 | ||||||||||
5.000% due 11/01/2027 | 6,140 | 6,424 | ||||||||||
Illinois State Toll Highway Authority Revenue Bonds, Series 2016 | ||||||||||||
5.000% due 01/01/2041 | 12,500 | 12,738 | ||||||||||
Metropolitan Pier & Exposition Authority, Illinois Revenue Bonds, (AGM/CR/NPFGC Insured), Series 2002 | ||||||||||||
0.000% due 12/15/2040 (c) | 6,000 | 2,989 | ||||||||||
Metropolitan Pier & Exposition Authority, Illinois Revenue Bonds, Series 2012 | ||||||||||||
0.000% due 12/15/2051 (c) | 5,000 | 1,233 | ||||||||||
Metropolitan Pier & Exposition Authority, Illinois Revenue Bonds, Series 2022 | ||||||||||||
0.000% due 12/15/2036 (c) | 1,750 | 1,034 | ||||||||||
0.000% due 06/15/2037 (c) | 1,000 | 577 | ||||||||||
Regional Transportation Authority, Illinois Revenue Bonds, Series 2018 | ||||||||||||
5.000% due 06/01/2038 | 8,000 | 8,409 | ||||||||||
Sales Tax Securitization Corp., Illinois Revenue Bonds, Series 2018 | ||||||||||||
4.000% due 01/01/2048 | 1,400 | 1,296 | ||||||||||
74,158 | ||||||||||||
INDIANA 1.7% | ||||||||||||
Indiana Finance Authority Midwestern Disaster Relief Revenue Bonds, Series 2012 | ||||||||||||
4.250% due 11/01/2030 | 3,000 | 3,015 | ||||||||||
Indiana Finance Authority Revenue Bonds, Series 2019 | ||||||||||||
7.000% due 03/01/2039 | 2,815 | 1,841 | ||||||||||
Indiana Health & Educational Facilities Financing Authority Revenue Bonds, Series 2006 | ||||||||||||
4.000% due 11/15/2046 | 1,000 | 948 | ||||||||||
Indianapolis Local Public Improvement Bond Bank, Indiana Revenue Bonds, Series 2023 | ||||||||||||
5.000% due 01/01/2053 | 1,000 | 1,066 | ||||||||||
6.000% due 03/01/2053 | 2,500 | 2,748 | ||||||||||
9,618 | ||||||||||||
IOWA 2.7% | ||||||||||||
Iowa Finance Authority Midwestern Disaster Area Revenue Refunding Bonds, Series 2012 | ||||||||||||
4.750% due 08/01/2042 | 2,000 | 1,990 | ||||||||||
Iowa Finance Authority Midwestern Disaster Area Revenue Refunding Bonds, Series 2022 | ||||||||||||
5.000% due 12/01/2050 | 10,715 | 11,345 | ||||||||||
Iowa Finance Authority Revenue Bonds, Series 2014 | ||||||||||||
5.400% due 11/15/2046 | 680 | 684 | ||||||||||
Iowa Finance Authority Revenue Bonds, Series 2022 | ||||||||||||
8.000% due 01/01/2042 | 1,900 | 1,828 | ||||||||||
15,847 | ||||||||||||
PRINCIPAL AMOUNT (000S) | MARKET VALUE (000S) | |||||||||||
LOUISIANA 3.8% | ||||||||||||
Louisiana Gasoline & Fuels Tax State Revenue Bonds, Series 2017 | ||||||||||||
4.000% due 05/01/2045 | $ | 7,000 | $ | 6,864 | ||||||||
Louisiana Public Facilities Authority Revenue Bonds, Series 2017 | ||||||||||||
5.000% due 05/15/2042 | 7,750 | 7,864 | ||||||||||
Louisiana Public Facilities Authority Revenue Bonds, Series 2023 | ||||||||||||
5.000% due 10/15/2052 | 4,125 | 4,398 | ||||||||||
Parish of St James, Louisiana Revenue Bonds, Series 2010 | ||||||||||||
6.350% due 10/01/2040 | 2,800 | 3,077 | ||||||||||
22,203 | ||||||||||||
MAINE 0.3% | ||||||||||||
Maine Health & Higher Educational Facilities Authority Revenue Bonds, Series 2020 | ||||||||||||
4.000% due 07/01/2050 | 2,000 | 1,926 | ||||||||||
MARYLAND 0.2% | ||||||||||||
Maryland Economic Development Corp. Revenue Bonds, Series 2020 | ||||||||||||
4.250% due 07/01/2050 | 1,400 | 1,303 | ||||||||||
MASSACHUSETTS 2.4% | ||||||||||||
Commonwealth of Massachusetts General Obligation Bonds, Series 2024 | ||||||||||||
5.000% due 01/01/2049 | 5,000 | 5,425 | ||||||||||
Commonwealth of Massachusetts Transportation Fund Revenue Bonds, Series 2023 | ||||||||||||
5.000% due 06/01/2053 | 5,300 | 5,741 | ||||||||||
Massachusetts Development Finance Agency Revenue Bonds, Series 2010 | ||||||||||||
7.625% due 10/15/2037 ^(b) | 444 | 4 | ||||||||||
Massachusetts Development Finance Agency Revenue Bonds, Series 2016 | ||||||||||||
5.000% due 01/01/2047 | 2,500 | 2,520 | ||||||||||
13,690 | ||||||||||||
MICHIGAN 2.9% | ||||||||||||
Great Lakes Water Authority Sewage Disposal System, Michigan Revenue Bonds, Series 2023 | ||||||||||||
5.250% due 07/01/2048 | 4,000 | 4,436 | ||||||||||
Great Lakes Water Authority Water Supply System, Michigan Revenue Bonds, Series 2023 | ||||||||||||
5.250% due 07/01/2048 | 2,000 | 2,218 | ||||||||||
Michigan Finance Authority Hospital Revenue Refunding Bonds, Series 2022 | ||||||||||||
4.000% due 04/15/2042 | 2,000 | 1,950 | ||||||||||
Michigan Finance Authority Revenue Bonds, Series 2017 | ||||||||||||
5.000% due 12/01/2046 | 4,945 | 5,034 | ||||||||||
Michigan Finance Authority Revenue Bonds, Series 2020 | ||||||||||||
4.800% due 09/01/2040 | 185 | 160 | ||||||||||
5.000% due 09/01/2050 | 300 | 248 | ||||||||||
Michigan Finance Authority Revenue Notes, Series 2020 | ||||||||||||
4.300% due 09/01/2030 | 100 | 93 | ||||||||||
Michigan State Housing Development Authority Revenue Bonds, Series 2015 | ||||||||||||
4.350% due 10/01/2045 | 2,000 | 1,980 | ||||||||||
Michigan Tobacco Settlement Finance Authority Revenue Bonds, Series 2008 | ||||||||||||
0.000% due 06/01/2058 (c) | 25,000 | 803 | ||||||||||
16,922 | ||||||||||||
PRINCIPAL AMOUNT (000S) | MARKET VALUE (000S) | |||||||||||
MINNESOTA 1.3% | ||||||||||||
Duluth Economic Development Authority Health Care Facilities, Minnesota Revenue Bonds, Series 2022 | ||||||||||||
5.250% due 06/15/2047 | $ | 2,000 | $ | 2,171 | ||||||||
Minnesota Agricultural & Economic Development Board Revenue Bonds, Series 2024 | ||||||||||||
5.250% due 01/01/2047 | 2,000 | 2,191 | ||||||||||
Rochester, Minnesota Revenue Bonds, Series 2018 | ||||||||||||
4.000% due 11/15/2048 | 3,500 | 3,417 | ||||||||||
7,779 | ||||||||||||
MISSISSIPPI 0.0% | ||||||||||||
Mississippi Development Bank Revenue Bonds, (AMBAC Insured), Series 1999 | ||||||||||||
5.000% due 07/01/2024 | 40 | 40 | ||||||||||
MISSOURI 2.8% | ||||||||||||
Health & Educational Facilities Authority of the State of Missouri Revenue Bonds, Series 2013 | ||||||||||||
5.000% due 11/15/2044 | 10,000 | 10,003 | ||||||||||
Health & Educational Facilities Authority of the State of Missouri Revenue Bonds, Series 2019 | ||||||||||||
4.000% due 02/15/2037 | 510 | 513 | ||||||||||
5.000% due 02/15/2036 | 425 | 448 | ||||||||||
Health & Educational Facilities Authority of the State of Missouri Revenue Bonds, Series 2023 | ||||||||||||
5.500% due 12/01/2048 | 2,700 | 2,980 | ||||||||||
Missouri Development Finance Board Revenue Bonds, Series 2022 | ||||||||||||
5.250% due 05/01/2055 | 2,000 | 2,117 | ||||||||||
16,061 | ||||||||||||
MULTI-STATE 0.5% | ||||||||||||
Freddie Mac Multifamily ML Certificates, Revenue Bonds, Series 2023 | ||||||||||||
4.141% due 01/25/2040 | 2,972 | 2,912 | ||||||||||
NEBRASKA 0.4% | ||||||||||||
University of Nebraska Facilities Corp Revenue Bonds, Series 2021 | ||||||||||||
4.000% due 07/15/2062 | 2,650 | 2,494 | ||||||||||
NEVADA 1.3% | ||||||||||||
Las Vegas Convention & Visitors Authority, Nevada Revenue Bonds, Series 2023 | ||||||||||||
5.000% due 07/01/2049 | 4,450 | 4,756 | ||||||||||
Reno, Nevada Revenue Bonds, Series 2018 | ||||||||||||
0.000% due 07/01/2058 (c) | 24,000 | 2,553 | ||||||||||
7,309 | ||||||||||||
NEW HAMPSHIRE 1.0% | ||||||||||||
New Hampshire Business Finance Authority Revenue Bonds, Series 2023 | ||||||||||||
4.837% due 07/20/2036 | 5,469 | 5,533 | ||||||||||
NEW JERSEY 7.0% | ||||||||||||
Cherry Hill Township School District, New Jersey General Obligation Bonds, Series 2022 | ||||||||||||
4.000% due 08/01/2040 | 6,400 | 6,404 | ||||||||||
Federal Home Loan Mortgage Corp. Enhanced Receipt, New Jersey Revenue Bonds, Series 2019 | ||||||||||||
3.870% due 11/15/2035 (f) | 147 | 133 | ||||||||||
New Jersey Economic Development Authority Revenue Bonds, Series 2016 | ||||||||||||
5.000% due 06/15/2041 | 5,000 | 5,220 | ||||||||||
New Jersey Health Care Facilities Financing Authority Revenue Bonds, Series 2013 | ||||||||||||
5.500% due 07/01/2043 | 4,000 | 4,008 |
See Accompanying Notes | SEMIANNUAL REPORT | | | JUNE 30, 2024 | 59 |
Schedule of Investments | PIMCO Municipal Income Fund II | (Cont.) |
PRINCIPAL AMOUNT (000S) | MARKET VALUE (000S) | |||||||||||
New Jersey Transportation Trust Fund Authority Revenue Bonds, (AGM Insured), Series 2006 | ||||||||||||
0.000% due 12/15/2034 (c) | $ | 2,500 | $ | 1,692 | ||||||||
New Jersey Transportation Trust Fund Authority Revenue Bonds, Series 2018 | ||||||||||||
5.000% due 12/15/2036 | 1,500 | 1,580 | ||||||||||
New Jersey Transportation Trust Fund Authority Revenue Bonds, Series 2019 | ||||||||||||
5.250% due 06/15/2043 | 4,000 | 4,180 | ||||||||||
New Jersey Transportation Trust Fund Authority Revenue Bonds, Series 2023 | ||||||||||||
5.250% due 06/15/2050 | 2,650 | 2,899 | ||||||||||
New Jersey Turnpike Authority Revenue Bonds, Series 2024 | ||||||||||||
4.125% due 01/01/2054 | 2,600 | 2,588 | ||||||||||
South Jersey Port Corp., New Jersey Revenue Bonds, Series 2017 | ||||||||||||
5.000% due 01/01/2049 | 1,010 | 1,035 | ||||||||||
Tobacco Settlement Financing Corp., New Jersey Revenue Bonds, Series 2018 | ||||||||||||
5.000% due 06/01/2046 | 10,710 | 10,812 | ||||||||||
40,551 | ||||||||||||
NEW YORK 21.2% | ||||||||||||
Build NYC Resource Corp., New York Revenue Bonds, Series 2023 | ||||||||||||
5.250% due 07/01/2057 | 1,000 | 1,034 | ||||||||||
Erie County, New York Industrial Development Agency Revenue Bonds, (FNMA Insured), Series 2023 | ||||||||||||
4.250% due 02/01/2041 | 2,600 | 2,489 | ||||||||||
Freddie Mac Multifamily ML Certificates, Revenue Bonds, Series 2024 | ||||||||||||
4.563% due 04/25/2042 ~ | 6,000 | 6,285 | ||||||||||
Monroe County Industrial Development Corp, New York Revenue Bonds, Series 2023 | ||||||||||||
5.000% due 07/01/2053 | 2,500 | 2,708 | ||||||||||
Nassau County, New York Industrial Development Agency Revenue Bonds, Series 2021 | ||||||||||||
5.000% due 01/01/2058 ^(b) | 751 | 225 | ||||||||||
New York City, New York Municipal Water Finance Authority Revenue Bonds, Series 2022 | ||||||||||||
5.000% due 06/15/2047 | 3,000 | 3,256 | ||||||||||
5.250% due 06/15/2052 | 6,000 | 6,578 | ||||||||||
New York City, New York Municipal Water Finance Authority Revenue Bonds, Series 2023 | ||||||||||||
5.250% due 06/15/2053 | 1,800 | 1,988 | ||||||||||
New York City, New York Transitional Finance Authority Future Tax Secured Revenue Bonds, Series 2022 | ||||||||||||
5.500% due 11/01/2045 | 5,000 | 5,680 | ||||||||||
New York Liberty Development Corp. Revenue Bonds, Series 2005 | ||||||||||||
5.250% due 10/01/2035 (e) | 11,505 | 13,298 | ||||||||||
New York Liberty Development Corp. Revenue Bonds, Series 2014 | ||||||||||||
5.000% due 11/15/2044 | 9,250 | 9,259 | ||||||||||
New York Liberty Development Corp. Revenue Bonds, Series 2021 | ||||||||||||
2.875% due 11/15/2046 | 3,775 | 2,771 | ||||||||||
New York Power Authority Revenue Bonds, (AGM Insured), Series 2022 | ||||||||||||
4.000% due 11/15/2061 | 2,000 | 1,915 | ||||||||||
New York Power Authority Revenue Bonds, Series 2020 | ||||||||||||
4.000% due 11/15/2060 | 3,500 | 3,328 | ||||||||||
New York State Dormitory Authority Northwell Health Obligated Group Revenue Bonds, Series 2022 | ||||||||||||
5.000% due 05/01/2052 | 2,000 | 2,099 | ||||||||||
New York State Dormitory Authority Revenue Bonds, Series 2017 | ||||||||||||
4.000% due 02/15/2047 | 4,000 | 3,889 | ||||||||||
New York State Dormitory Authority Revenue Bonds, Series 2020 | ||||||||||||
4.000% due 03/15/2048 | 8,000 | 7,815 |
PRINCIPAL AMOUNT (000S) | MARKET VALUE (000S) | |||||||||||
New York State Thruway Authority Revenue Bonds, Series 2019 | ||||||||||||
4.000% due 01/01/2039 | $ | 2,900 | $ | 2,912 | ||||||||
4.000% due 01/01/2050 | 1,305 | 1,244 | ||||||||||
New York State Thruway Authority Revenue Bonds, Series 2021 | ||||||||||||
4.000% due 03/15/2047 | 7,375 | 7,212 | ||||||||||
New York State Urban Development Corp. Revenue Bonds, Series 2019 | ||||||||||||
4.000% due 03/15/2045 | 2,900 | 2,830 | ||||||||||
New York State Urban Development Corp. Revenue Bonds, Series 2021 | ||||||||||||
4.000% due 03/15/2047 | 6,250 | 6,040 | ||||||||||
New York State Urban Development Corp. Revenue Bonds, Series 2023 | ||||||||||||
5.000% due 03/15/2051 | 2,500 | 2,722 | ||||||||||
5.000% due 03/15/2063 | 2,000 | 2,147 | ||||||||||
New York Transportation Development Corp. Revenue Bonds, (AGM Insured), Series 2023 | ||||||||||||
5.125% due 06/30/2060 | 5,500 | 5,696 | ||||||||||
Onondaga County, New York Trust for Cultural Resources Revenue Bonds, Series 2019 | ||||||||||||
4.000% due 12/01/2047 | 2,250 | 2,197 | ||||||||||
Port Authority of New York & New Jersey Revenue Bonds, Series 2017 | ||||||||||||
5.250% due 10/15/2057 | 3,300 | 3,422 | ||||||||||
Suffolk Tobacco Asset Securitization Corp., New York Revenue Bonds, Series 2021 | ||||||||||||
4.000% due 06/01/2050 | 2,920 | 2,611 | ||||||||||
Triborough Bridge & Tunnel Authority Sales Tax, New York Revenue Bonds, Series 2022 | ||||||||||||
4.000% due 05/15/2057 | 6,000 | 5,719 | ||||||||||
Triborough Bridge & Tunnel Authority, New York Revenue Bonds, Series 2021 | ||||||||||||
5.000% due 05/15/2051 | 4,250 | 4,526 | ||||||||||
123,895 | ||||||||||||
NORTH CAROLINA 1.2% | ||||||||||||
Inlivian, North Carolina Revenue Bonds, (FNMA Insured), Series 2024 | ||||||||||||
4.450% due 06/01/2041 | 2,500 | 2,503 | ||||||||||
North Carolina Turnpike Authority Revenue Bonds, (AGM Insured), Series 2024 | ||||||||||||
5.000% due 01/01/2058 | 4,500 | 4,759 | ||||||||||
7,262 | ||||||||||||
NORTH DAKOTA 0.0% | ||||||||||||
Grand Forks County, North Dakota Revenue Bonds, Series 2021 | ||||||||||||
7.000% due 12/15/2043 ^(b) | 1,950 | 59 | ||||||||||
OHIO 6.5% | ||||||||||||
Buckeye Tobacco Settlement Financing Authority, Ohio Revenue Bonds, Series 2020 | ||||||||||||
0.000% due 06/01/2057 (c) | 79,500 | 7,458 | ||||||||||
Canton City School District, Ohio General Obligation Bonds, Series 2023 | ||||||||||||
5.500% due 12/01/2050 | 3,700 | 4,070 | ||||||||||
Geisinger Authority, Ohio Revenue Bonds, Series 2017 | ||||||||||||
4.000% due 02/15/2047 | 11,000 | 10,528 | ||||||||||
Montgomery County, Ohio Dayton Children’s Hospital Revenue Bonds, Series 2021 | ||||||||||||
4.000% due 08/01/2046 | 5,500 | 5,344 | ||||||||||
Ohio Air Quality Development Authority Dayton Power And Light Company Project Revenue Bonds , Series 2015 | ||||||||||||
4.250% due 11/01/2040 | 3,000 | 3,013 | ||||||||||
Ohio Air Quality Development Authority Revenue Bonds, Series 2019 | ||||||||||||
5.000% due 07/01/2049 | 2,500 | 2,338 | ||||||||||
Ohio Air Quality Development Authority Revenue Notes, Series 2019 | ||||||||||||
3.250% due 09/01/2029 | 1,700 | 1,634 |
PRINCIPAL AMOUNT (000S) | MARKET VALUE (000S) | |||||||||||
Ohio Housing Finance Agency Revenue Bonds, (GNMA/FNMA/FHLMC Insured), Series 2024 | ||||||||||||
4.550% due 09/01/2049 | $ | 2,500 | $ | 2,511 | ||||||||
Worthington City School District, Ohio General Obligation Bonds, Series 2023 | ||||||||||||
5.500% due 12/01/2054 | 1,060 | 1,183 | ||||||||||
38,079 | ||||||||||||
OKLAHOMA 1.6% | ||||||||||||
Oklahoma Development Finance Authority Revenue Bonds, Series 2018 | ||||||||||||
5.500% due 08/15/2052 | 2,000 | 2,058 | ||||||||||
Oklahoma Development Finance Authority Revenue Bonds, Series 2021 | ||||||||||||
8.000% due 12/01/2041 | 1,750 | 1,445 | ||||||||||
Oklahoma Turnpike Authority Revenue Bonds, Series 2023 | ||||||||||||
4.500% due 01/01/2053 | 5,900 | 6,019 | ||||||||||
9,522 | ||||||||||||
OREGON 1.1% | ||||||||||||
Medford Hospital Facilities Authority, Oregon Revenue Bonds, Series 2020 | ||||||||||||
4.000% due 08/15/2039 | 1,545 | 1,521 | ||||||||||
Multnomah County School District 40, Oregon General Obligation Bonds, Series 2023 | ||||||||||||
0.000% due 06/15/2051 (c) | 3,700 | 959 | ||||||||||
Washington & Multnomah Counties School District No 48J Beaverton, Oregon General Obligation Bonds, Series 2022 | ||||||||||||
0.000% due 06/15/2048 (c) | 5,195 | 1,622 | ||||||||||
5.000% due 06/15/2052 | 2,000 | 2,148 | ||||||||||
6,250 | ||||||||||||
PENNSYLVANIA 4.9% | ||||||||||||
Bucks County, Pennsylvania Water and Sewer Authority Revenue Bonds, (AGM Insured), Series 2022 | ||||||||||||
4.250% due 12/01/2047 | 1,800 | 1,779 | ||||||||||
Commonwealth of Pennsylvania General Obligation Bonds, Series 2023 | ||||||||||||
4.000% due 09/01/2042 | 6,625 | 6,522 | ||||||||||
Montgomery County Industrial Development Authority, Pennsylvania Revenue Bonds, Series 2023 | ||||||||||||
4.450% due 10/01/2034 | 3,000 | 3,063 | ||||||||||
Pennsylvania Economic Development Financing Authority Revenue Bonds, (AGM Insured), Series 2022 | ||||||||||||
5.750% due 12/31/2062 | 7,000 | 7,650 | ||||||||||
Pennsylvania Economic Development Financing Authority Revenue Bonds, Series 2021 | ||||||||||||
9.000% due 04/01/2051 | 3,400 | 3,742 | ||||||||||
Pennsylvania Higher Educational Facilities Authority Revenue Bonds, Series 2015 | ||||||||||||
5.000% due 09/01/2045 | 4,915 | 4,934 | ||||||||||
Philadelphia Authority for Industrial Development, Pennsylvania Revenue Bonds, Series 2017 | ||||||||||||
5.500% due 12/01/2058 | 1,000 | 964 | ||||||||||
28,654 | ||||||||||||
PUERTO RICO 6.5% | ||||||||||||
Children’s Trust Fund, Puerto Rico Revenue Bonds, Series 2008 | ||||||||||||
0.000% due 05/15/2057 (c) | 63,000 | 4,377 | ||||||||||
Commonwealth of Puerto Rico Bonds, Series 2022 | ||||||||||||
0.000% due 11/01/2043 | 6,411 | 3,935 | ||||||||||
0.000% due 11/01/2051 | 7,819 | 4,442 | ||||||||||
Commonwealth of Puerto Rico General Obligation Bonds, Series 2021 | ||||||||||||
0.000% due 07/01/2033 (c) | 3,750 | 2,507 | ||||||||||
4.000% due 07/01/2041 | 3,500 | 3,274 |
60 | PIMCO CLOSED-END FUNDS | See Accompanying Notes |
June 30, 2024 | (Unaudited) |
PRINCIPAL AMOUNT (000S) | MARKET VALUE (000S) | |||||||||||
Puerto Rico Sales Tax Financing Corp. Sales Tax Revenue Bonds, Series 2018 | ||||||||||||
0.000% due 07/01/2051 (c) | $ | 52,000 | $ | 12,235 | ||||||||
Puerto Rico Sales Tax Financing Corp. Sales Tax Revenue Bonds, Series 2019 | ||||||||||||
4.784% due 07/01/2058 | 7,005 | 6,928 | ||||||||||
37,698 | ||||||||||||
RHODE ISLAND 3.2% | ||||||||||||
Tobacco Settlement Financing Corp., Rhode Island Revenue Bonds, Series 2015 | ||||||||||||
5.000% due 06/01/2050 | 18,450 | 18,480 | ||||||||||
SOUTH CAROLINA 1.7% | ||||||||||||
South Carolina Public Service Authority Revenue Obligations Revenue Bonds, Series 2013 | ||||||||||||
5.500% due 12/01/2053 | 10,000 | 10,003 | ||||||||||
TENNESSEE 0.2% | ||||||||||||
Shelby County, Tennessee Health Educational & Housing Facilities Board Revenue Bonds, Series 2019 | ||||||||||||
5.750% due 10/01/2049 | 1,550 | 1,149 | ||||||||||
TEXAS 27.1% | ||||||||||||
Angelina & Neches River Authority, Texas Revenue Bonds, Series 2021 | ||||||||||||
7.500% due 12/01/2045 | 1,345 | 908 | ||||||||||
12.000% due 12/01/2045 | 2,250 | 1,980 | ||||||||||
Board of Regents of the University of Texas System Revenue Bonds, Series 2022 | ||||||||||||
4.000% due 08/15/2052 | 6,500 | 6,263 | ||||||||||
Brazoria County, Texas Industrial Development Corp. Revenue Bonds, Series 2023 | ||||||||||||
12.000% due 06/01/2043 | 4,000 | 4,049 | ||||||||||
Calhoun County, Texas Navigation Industrial Development Authority Revenue Notes, Series 2021 | ||||||||||||
3.625% due 07/01/2026 | 2,600 | 2,464 | ||||||||||
Central Texas Turnpike System Revenue Bonds, Series 2015 | ||||||||||||
0.000% due 08/15/2036 (c) | 2,500 | 1,453 | ||||||||||
0.000% due 08/15/2037 (c) | 8,000 | 4,419 | ||||||||||
Clifton Higher Education Finance Corp., Texas Revenue Bonds, Series 2018 | ||||||||||||
6.125% due 08/15/2048 | 1,750 | 1,779 | ||||||||||
Coppell Independent School District, Texas General Obligation Bonds, (PSF Insured), Series 2023 | ||||||||||||
4.250% due 08/15/2053 | 2,000 | 1,994 | ||||||||||
Corpus Christi Independent School District, Texas General Obligation Bonds, (PSF Insured), Series 2023 | ||||||||||||
4.125% due 08/15/2053 | 2,800 | 2,752 | ||||||||||
Dallas Area Rapid Transit, Texas Revenue Bonds, Series 2021 | ||||||||||||
4.000% due 12/01/2051 | 10,250 | 9,811 | ||||||||||
Dallas Fort Worth International Airport, Texas Revenue Bonds, Series 2022 | ||||||||||||
5.000% due 11/01/2039 | 2,000 | 2,221 | ||||||||||
Dallas Independent School District, Texas General Obligation Bonds, (PSF Insured), Series 2024 | ||||||||||||
4.000% due 02/15/2054 | 3,100 | 2,979 | ||||||||||
Edgewood Independent School District/Van Zandt County, Texas General Obligation Bonds, (PSF Insured), Series 2023 | ||||||||||||
4.000% due 02/15/2048 | 2,800 | 2,721 | ||||||||||
EP Tuscany Zaragosa PFC, Texas Revenue Notes, Series 2023 | ||||||||||||
4.000% due 12/01/2033 | 7,455 | 7,235 | ||||||||||
Fort Bend County Texas Public Facility Corp. Revenue Bonds, Series 2023 | ||||||||||||
5.000% due 03/01/2048 | 7,125 | 7,557 | ||||||||||
Garland Independent School District, Texas General Obligation Bonds, (PSF Insured), Series 2023 | ||||||||||||
5.000% due 02/15/2048 | 6,600 | 7,158 |
PRINCIPAL AMOUNT (000S) | MARKET VALUE (000S) | |||||||||||
Grand Parkway Transportation Corp., Texas Revenue Bonds, (AGM/CR Insured), Series 2020 | ||||||||||||
4.000% due 10/01/2049 | $ | 2,100 | $ | 1,989 | ||||||||
Greenwood Independent School District, Texas General Obligation Bonds, (PSF Insured), Series 2024 | ||||||||||||
4.000% due 02/15/2054 | 6,300 | 5,938 | ||||||||||
Harris County, Texas Toll Road Revenue Bonds, Series 2024 | ||||||||||||
4.000% due 08/15/2041 | 3,000 | 2,993 | ||||||||||
Hays Consolidated Independent School District, Texas General Obligation Bonds, (PSF Insured), Series 2023 | ||||||||||||
5.000% due 02/15/2048 | 3,000 | 3,219 | ||||||||||
Houston, Texas Combined Utility System Revenue Bonds, Series 2020 | ||||||||||||
4.000% due 11/15/2049 | 1,510 | 1,441 | ||||||||||
Hurst-Euless-Bedford Independent School District, Texas General Obligation Bonds, (PSF Insured), Series 2024 | ||||||||||||
4.000% due 08/15/2050 | 1,000 | 969 | ||||||||||
Katy Independent School District, Texas General Obligation Bonds, (PSF Insured), Series 2024 | ||||||||||||
4.000% due 02/15/2049 (a) | 3,100 | 2,992 | ||||||||||
Lamar Consolidated Independent School District, Texas General Obligation Bonds, (PSF Insured), Series 2023 | ||||||||||||
4.000% due 02/15/2048 | 2,500 | 2,426 | ||||||||||
Lamar Consolidated Independent School District, Texas General Obligation Bonds, (PSF Insured), Series 2023 | ||||||||||||
5.000% due 02/15/2053 | 10,600 | 11,381 | ||||||||||
Lower Colorado River Authority, Texas Revenue Bonds, (AGM Insured), Series 2024 | ||||||||||||
5.000% due 05/15/2049 | 1,750 | 1,903 | ||||||||||
Medina Valley Independent School District, Texas General Obligation Bonds, (PSF Insured), Series 2023 | ||||||||||||
4.500% due 02/15/2047 | 2,000 | 2,057 | ||||||||||
New Hope Cultural Education Facilities Finance Corp., Texas Revenue Bonds, Series 2016 | ||||||||||||
5.000% due 07/01/2046 ^(b) | 1,030 | 736 | ||||||||||
North Texas Tollway Authority Revenue Bonds, Series 2017 | ||||||||||||
4.000% due 01/01/2043 | 3,590 | 3,483 | ||||||||||
North Texas Tollway Authority Revenue Bonds, Series 2018 | ||||||||||||
5.000% due 01/01/2048 | 1,000 | 1,030 | ||||||||||
San Antonio Public Facilities Corp., Texas Revenue Bonds, Series 2012 | ||||||||||||
4.000% due 09/15/2042 | 10,000 | 9,546 | ||||||||||
San Antonio, Texas Electric & Gas Systems Revenue Bonds, Series 2024 | ||||||||||||
5.250% due 02/01/2049 | 5,000 | 5,502 | ||||||||||
Southwest Independent School District, Texas General Obligation Bonds, (PSF Insured), Series 2023 | ||||||||||||
4.000% due 02/01/2053 | 5,000 | 4,786 | ||||||||||
Tarrant County, Texas Cultural Education Facilities Finance Corp. Revenue Bonds, Series 2017 | ||||||||||||
6.750% due 11/15/2047 | 1,000 | 1,036 | ||||||||||
Tarrant County, Texas Cultural Education Facilities Finance Corp. Revenue Bonds, Series 2022 | ||||||||||||
5.000% due 11/15/2051 | 3,140 | 3,309 | ||||||||||
Tarrant County, Texas Hospital District General Obligation Bonds, Series 2023 | ||||||||||||
5.250% due 08/15/2048 | 6,300 | 6,904 | ||||||||||
Texas Municipal Gas Acquisition & Supply Corp. Revenue Bonds, Series 2008 | ||||||||||||
6.250% due 12/15/2026 | 8,350 | 8,597 | ||||||||||
Texas Private Activity Bond Surface Transportation Corp. Revenue Bonds, Series 2019 | ||||||||||||
5.000% due 06/30/2058 | 5,000 | 5,106 | ||||||||||
Texas Water Development Board Revenue Bonds, Series 2022 | ||||||||||||
4.800% due 10/15/2052 | 1,800 | 1,873 | ||||||||||
West Harris County, Texas Regional Water Authority Revenue Bonds, (BAM Insured), Series 2021 | ||||||||||||
4.000% due 12/15/2060 | 1,250 | 1,154 | ||||||||||
158,113 | ||||||||||||
PRINCIPAL AMOUNT (000S) | MARKET VALUE (000S) | |||||||||||
UTAH 0.7% | ||||||||||||
Mida Mountain Village Public Infrastructure District, Utah Special Assessment Notes, Series 2021 | ||||||||||||
4.000% due 08/01/2031 | $ | 1,000 | $ | 973 | ||||||||
Military Installation Development Authority, Utah Revenue Bonds, Series 2021 | ||||||||||||
4.000% due 06/01/2052 | 2,000 | 1,623 | ||||||||||
Ogden City Redevelopment Agency, Utah Revenue Bonds, Series 2023 | ||||||||||||
5.000% due 01/15/2053 | 1,440 | 1,531 | ||||||||||
4,127 | ||||||||||||
VIRGINIA 1.1% | ||||||||||||
Virginia Housing Development Authority Revenue Bonds, (FHA Insured), Series 2023 | ||||||||||||
5.125% due 10/01/2048 | 2,210 | 2,350 | ||||||||||
Virginia Small Business Financing Authority Revenue Bonds, Series 2019 | ||||||||||||
0.000% due 07/01/2061 (c) | 51,000 | 1,639 | ||||||||||
5.000% due 07/01/2034 | 2,445 | 2,281 | ||||||||||
6,270 | ||||||||||||
WASHINGTON 0.5% | ||||||||||||
Washington State Convention Center Public Facilities District Revenue Bonds, Series 2018 | ||||||||||||
4.000% due 07/01/2058 | 2,960 | 2,691 | ||||||||||
WEST VIRGINIA 1.6% | ||||||||||||
Monongalia County, West Virginia Commission Special District Revenue Bonds, Series 2017 | ||||||||||||
5.500% due 06/01/2037 | 2,000 | 2,051 | ||||||||||
West Virginia Economic Development Authority Revenue Bonds, Series 2017 | ||||||||||||
4.000% due 06/15/2040 | 7,110 | 7,114 | ||||||||||
9,165 | ||||||||||||
WISCONSIN 5.6% | ||||||||||||
Public Finance Authority, Wisconsin Revenue Bonds, Series 2017 | ||||||||||||
6.750% due 08/01/2031 | 500 | 365 | ||||||||||
7.000% due 01/01/2050 | 4,500 | 4,815 | ||||||||||
Public Finance Authority, Wisconsin Revenue Bonds, Series 2018 | ||||||||||||
6.375% due 01/01/2048 | 4,000 | 1,800 | ||||||||||
Public Finance Authority, Wisconsin Revenue Bonds, Series 2020 | ||||||||||||
0.000% due 01/01/2060 (c) | 15,000 | 1,114 | ||||||||||
Public Finance Authority, Wisconsin Revenue Bonds, Series 2021 | ||||||||||||
4.000% due 09/30/2051 | 1,700 | 1,443 | ||||||||||
4.000% due 03/31/2056 | 900 | 749 | ||||||||||
4.500% due 06/01/2056 | 2,900 | 2,345 | ||||||||||
Public Finance Authority, Wisconsin Revenue Bonds, Series 2022 | ||||||||||||
5.000% due 10/01/2052 | 5,500 | 5,806 | ||||||||||
Wisconsin Center District Revenue Bonds, (AGM Insured), Series 2020 | ||||||||||||
0.000% due 12/15/2045 (c) | 3,855 | 1,383 | ||||||||||
0.000% due 12/15/2055 (c) | 20,420 | 4,378 | ||||||||||
Wisconsin Health & Educational Facilities Authority Revenue Bonds, Series 2016 | ||||||||||||
4.000% due 11/15/2046 | 4,345 | 4,394 | ||||||||||
Wisconsin Health & Educational Facilities Authority Revenue Bonds, Series 2022 | ||||||||||||
4.000% due 12/01/2051 | 4,470 | 4,126 | ||||||||||
32,718 | ||||||||||||
Total Municipal Bonds & Notes (Cost $941,848) | 946,557 | |||||||||||
See Accompanying Notes | SEMIANNUAL REPORT | | | JUNE 30, 2024 | 61 |
Schedule of Investments | PIMCO Municipal Income Fund II | (Cont.) |
PRINCIPAL AMOUNT (000S) | MARKET VALUE (000S) | |||||||||||
U.S. GOVERNMENT AGENCIES 2.6% | ||||||||||||
Freddie Mac | ||||||||||||
3.800% due 01/01/2040 | $ | 9,976 | $ | 9,481 | ||||||||
3.850% due 01/01/2040 | 6,000 | 5,706 | ||||||||||
Total U.S. Government Agencies (Cost $15,241) | 15,187 | |||||||||||
MARKET VALUE (000S) | ||||||||||||
SHORT-TERM INSTRUMENTS 1.0% | ||||||||||||
REPURCHASE AGREEMENTS (g) 1.0% | ||||||||||||
$ | 5,945 | |||||||||||
Total Short-Term Instruments (Cost $5,945) | 5,945 | |||||||||||
Total Investments in Securities (Cost $970,134) | 974,788 | |||||||||||
Total Investments 167.1% (Cost $970,134) | $ | 974,788 | ||||||||||
Auction Rate Preferred Shares (1.1)% | (6,425 | ) | ||||||||||
Remarketable Variable Rate MuniFund Term Preferred Shares, at liquidation value (64.6)% | (376,477 | ) | ||||||||||
Other Assets and Liabilities, net (1.4)% | (8,796 | ) | ||||||||||
Net Assets Applicable to Common Shareholders 100.0% | $ | 583,090 | ||||||||||
* | A zero balance may reflect actual amounts rounding to less than one thousand. |
^ | Security is in default. |
« | Security valued using significant unobservable inputs (Level 3). |
µ | All or a portion of this amount represents unfunded loan commitments. The interest rate for the unfunded portion will be determined at the time of funding. |
~ | Variable or Floating rate security. Rate shown is the rate in effect as of period end. Certain variable rate securities are not based on a published reference rate and spread, rather are determined by the issuer or agent and are based on current market conditions. Reference rate is as of reset date, which may vary by security. These securities may not indicate a reference rate and/or spread in their description. |
(a) | When-issued security. |
(b) | Security is not accruing income as of the date of this report. |
(c) | Zero coupon security. |
(d) | Security becomes interest bearing at a future date. |
(e) | Represents an underlying municipal bond transferred to a tender option bond trust established in a tender option bond transaction in which the Fund sold, or caused the sale of, the underlying municipal bond and purchased the residual interest certificate. The security serves as collateral in a financing transaction. |
Issuer Description | Coupon | Maturity Date | Acquisition Date | Cost | Market Value | Market Value as Percentage of Net Assets | ||||||||||||||||||
Federal Home Loan Mortgage Corp. Enhanced Receipt, New Jersey Revenue Bonds, Series 2019 | 3.870% | 11/15/2035 | 10/26/2020 | $ | 169 | $ | 133 | 0.02% | ||||||||||||||||
Counterparty | Lending Rate | Settlement Date | Maturity Date | Principal Amount | Collateralized By | Collateral (Received) | Repurchase Agreements, at Value | Repurchase Agreement Proceeds to be Received (1) | ||||||||||||||||||||||
FICC | 2.600 | % | 06/28/2024 | 07/01/2024 | $ | 5,945 | U.S. Treasury Inflation Protected Securities 0.625% due 01/15/2026 | $ | (6,064 | ) | $ | 5,945 | $ | 5,946 | ||||||||||||||||
Total Repurchase Agreements | $ | (6,064 | ) | $ | 5,945 | $ | 5,946 | |||||||||||||||||||||||
62 | PIMCO CLOSED-END FUNDS | See Accompanying Notes |
June 30, 2024 | (Unaudited) |
Counterparty | Repurchase Agreement Proceeds to be Received (1) | Payable for Reverse Repurchase Agreements | Payable for Sale-Buyback Transactions | Total Borrowings and Other Financing Transactions | Collateral Pledged/(Received) | Net Exposure (2) | ||||||||||||||||||
Global/Master Repurchase Agreement | ||||||||||||||||||||||||
FICC | $ | 5,946 | $ | 0 | $ | 0 | $ | 5,946 | $ | (6,064 | ) | $ | (118 | ) | ||||||||||
Total Borrowings and Other Financing Transactions | $ | 5,946 | $ | 0 | $ | 0 | ||||||||||||||||||
(1) | Includes accrued interest. |
(2) | Net Exposure represents the net receivable/(payable) that would be due from/to the counterparty in the event of default. Exposure from borrowings and other financing transactions can only be netted across transactions governed under the same master agreement with the same legal entity. See Note 7, Master Netting Arrangements, in the Notes to Financial Statements for more information. |
Category and Subcategory | Level 1 | Level 2 | Level 3 | Fair Value at 06/30/2024 | ||||||||||||
Investments in Securities, at Value | ||||||||||||||||
Loan Participations and Assignments | $ | 0 | $ | 0 | $ | 7,099 | $ | 7,099 | ||||||||
Municipal Bonds & Notes | ||||||||||||||||
Alabama | 0 | 9,008 | 0 | 9,008 | ||||||||||||
Alaska | 0 | 2,603 | 0 | 2,603 | ||||||||||||
Arizona | 0 | 53,000 | 0 | 53,000 | ||||||||||||
Arkansas | 0 | 4,835 | 0 | 4,835 | ||||||||||||
California | 0 | 31,366 | 0 | 31,366 | ||||||||||||
Colorado | 0 | 34,540 | 0 | 34,540 | ||||||||||||
Connecticut | 0 | 3,126 | 0 | 3,126 | ||||||||||||
Delaware | 0 | 5,777 | 0 | 5,777 | ||||||||||||
District of Columbia | 0 | 2,126 | 0 | 2,126 | ||||||||||||
Florida | 0 | 33,305 | 0 | 33,305 | ||||||||||||
Georgia | 0 | 34,390 | 0 | 34,390 | ||||||||||||
Illinois | 0 | 74,158 | 0 | 74,158 | ||||||||||||
Indiana | 0 | 9,618 | 0 | 9,618 | ||||||||||||
Iowa | 0 | 15,847 | 0 | 15,847 | ||||||||||||
Louisiana | 0 | 22,203 | 0 | 22,203 | ||||||||||||
Maine | 0 | 1,926 | 0 | 1,926 | ||||||||||||
Maryland | 0 | 1,303 | 0 | 1,303 | ||||||||||||
Massachusetts | 0 | 13,690 | 0 | 13,690 | ||||||||||||
Michigan | 0 | 16,922 | 0 | 16,922 | ||||||||||||
Minnesota | 0 | 7,779 | 0 | 7,779 | ||||||||||||
Mississippi | 0 | 40 | 0 | 40 | ||||||||||||
Missouri | 0 | 16,061 | 0 | 16,061 | ||||||||||||
Multi-State | 0 | 2,912 | 0 | 2,912 | ||||||||||||
Nebraska | 0 | 2,494 | 0 | 2,494 |
Category and Subcategory | Level 1 | Level 2 | Level 3 | Fair Value at 06/30/2024 | ||||||||||||
Nevada | $ | 0 | $ | 7,309 | $ | 0 | $ | 7,309 | ||||||||
New Hampshire | 0 | 5,533 | 0 | 5,533 | ||||||||||||
New Jersey | 0 | 40,551 | 0 | 40,551 | ||||||||||||
New York | 0 | 123,895 | 0 | 123,895 | ||||||||||||
North Carolina | 0 | 7,262 | 0 | 7,262 | ||||||||||||
North Dakota | 0 | 59 | 0 | 59 | ||||||||||||
Ohio | 0 | 38,079 | 0 | 38,079 | ||||||||||||
Oklahoma | 0 | 9,522 | 0 | 9,522 | ||||||||||||
Oregon | 0 | 6,250 | 0 | 6,250 | ||||||||||||
Pennsylvania | 0 | 28,654 | 0 | 28,654 | ||||||||||||
Puerto Rico | 0 | 37,698 | 0 | 37,698 | ||||||||||||
Rhode Island | 0 | 18,480 | 0 | 18,480 | ||||||||||||
South Carolina | 0 | 10,003 | 0 | 10,003 | ||||||||||||
Tennessee | 0 | 1,149 | 0 | 1,149 | ||||||||||||
Texas | 0 | 158,113 | 0 | 158,113 | ||||||||||||
Utah | 0 | 4,127 | 0 | 4,127 | ||||||||||||
Virginia | 0 | 6,270 | 0 | 6,270 | ||||||||||||
Washington | 0 | 2,691 | 0 | 2,691 | ||||||||||||
West Virginia | 0 | 9,165 | 0 | 9,165 | ||||||||||||
Wisconsin | 0 | 32,718 | 0 | 32,718 | ||||||||||||
U.S. Government Agencies | 0 | 15,187 | 0 | 15,187 | ||||||||||||
Short-Term Instruments | ||||||||||||||||
Repurchase Agreements | 0 | 5,945 | 0 | 5,945 | ||||||||||||
Total Investments | $ | 0 | $ | 967,689 | $ | 7,099 | $ | 974,788 | ||||||||
Category and Subcategory | Beginning Balance at 12/31/2023 | Net Purchases | Net Sales/ Settlements | Accrued Discounts/ (Premiums) | Realized Gain/(Loss) | Net Change in Unrealized Appreciation/ (Depreciation) (1) | Transfers into Level 3 | Transfers out of Level 3 | Ending Balance at 06/30/2024 | Net Change in Unrealized Appreciation/ (Depreciation) on Investments Held at 06/30/2024 (1) | ||||||||||||||||||||||||||||||
Investments in Securities, at Value | ||||||||||||||||||||||||||||||||||||||||
Loan Participations and Assignments | $ | 7,406 | $ | 0 | $ | 0 | $ | 0 | $ | 0 | $ | (307 | ) | $ | 0 | $ | 0 | $ | 7,099 | $ | (307 | ) | ||||||||||||||||||
Totals | $ | 7,406 | $ | 0 | $ | 0 | $ | 0 | $ | 0 | $ | (307 | ) | $ | 0 | $ | 0 | $ | 7,099 | $ | (307 | ) | ||||||||||||||||||
See Accompanying Notes | SEMIANNUAL REPORT | | | JUNE 30, 2024 | 63 |
Schedule of Investments | PIMCO Municipal Income Fund II | (Cont.) | June 30, 2024 | (Unaudited) |
Category and Subcategory | Ending Balance at 06/30/2024 | Valuation Technique | Unobservable Inputs | (% Unless Noted Otherwise) | ||||||||||||
Input Value(s) | Weighted Average | |||||||||||||||
Investments in Securities, at Value | ||||||||||||||||
Loan Participations and Assignments | $ | 7,099 | Discounted Cash Flow | Discount Rate | 6.578-7.585 | 6.748 | ||||||||||
Total | $ | 7,099 | ||||||||||||||
(1) | Any difference between Net Change in Unrealized Appreciation/(Depreciation) and Net Change in Unrealized Appreciation/(Depreciation) on Investments Held at June 30, 2024 may be due to an investment no longer held or categorized as Level 3 at period end. |
64 | PIMCO CLOSED-END FUNDS | See Accompanying Notes |
Schedule of Investments | PIMCO Municipal Income Fund III | June 30, 2024 | (Unaudited) |
PRINCIPAL AMOUNT (000S) | MARKET VALUE (000S) | |||||||||||
INVESTMENTS IN SECURITIES 167.7% | ||||||||||||
LOAN PARTICIPATIONS AND ASSIGNMENTS 1.2% | ||||||||||||
Falcon PK | ||||||||||||
TBD% due 11/01/2026 «µ | $ | 500 | $ | 500 | ||||||||
TBD% - 7.181% due 10/26/2063 «µ | 2,700 | 2,700 | ||||||||||
Total Loan Participations and Assignments (Cost $3,200) | 3,200 | |||||||||||
MUNICIPAL BONDS & NOTES 163.4% | ||||||||||||
ALABAMA 1.6% | ||||||||||||
Jefferson County, Alabama Sewer Revenue Bonds, Series 2024 | ||||||||||||
5.500% due 10/01/2053 | 2,500 | 2,711 | ||||||||||
Tuscaloosa County, Alabama Industrial Development Authority Revenue Bonds, Series 2019 | ||||||||||||
5.250% due 05/01/2044 | 1,625 | 1,632 | ||||||||||
4,343 | ||||||||||||
ALASKA 0.5% | ||||||||||||
Municipality of Anchorage, Alaska Solid Waste Services Revenue Bonds, Series 2022 | ||||||||||||
5.250% due 11/01/2062 | 1,165 | 1,238 | ||||||||||
ARIZONA 8.9% | ||||||||||||
Arizona Industrial Development Authority Revenue Bonds, Series 2019 | ||||||||||||
4.500% due 01/01/2031 ^(b) | 675 | 431 | ||||||||||
4.500% due 01/01/2032 ^(b) | 710 | 416 | ||||||||||
4.500% due 01/01/2049 | 750 | 432 | ||||||||||
Arizona Industrial Development Authority Revenue Bonds, Series 2020 | ||||||||||||
7.750% due 07/01/2050 ^(b) | 1,200 | 72 | ||||||||||
Industrial Development Authority of the County, Arizona of Pima Revenue Bonds, Series 2020 | ||||||||||||
5.000% due 07/01/2055 | 1,200 | 1,114 | ||||||||||
Maricopa County, Arizona Industrial Development Authority Revenue Bonds, Series 2017 | ||||||||||||
4.000% due 01/01/2041 | 750 | 741 | ||||||||||
Maricopa County, Arizona Industrial Development Authority Revenue Bonds, Series 2019 | ||||||||||||
4.000% due 01/01/2044 | 3,800 | 3,691 | ||||||||||
Maricopa County, Arizona School District No 83, Cartwright Elementary Revenue Bonds, Series 2020 | ||||||||||||
4.000% due 10/01/2044 | 4,120 | 3,623 | ||||||||||
Salt River Project Agricultural Improvement & Power District, Arizona Revenue Bonds, Series 2023 | ||||||||||||
5.000% due 01/01/2050 | 1,000 | 1,082 | ||||||||||
Salt Verde Financial Corp., Arizona Revenue Bonds, Series 2007 | ||||||||||||
5.000% due 12/01/2037 | 11,600 | 12,646 | ||||||||||
24,248 | ||||||||||||
ARKANSAS 0.8% | ||||||||||||
Arkansas Development Finance Authority Revenue Bonds, Series 2023 | ||||||||||||
7.375% due 07/01/2048 | 1,250 | 1,373 | ||||||||||
County of Pulaski Hospital, Arkansas Revenue Bonds, Series 2023 | ||||||||||||
5.250% due 03/01/2053 | 700 | 756 | ||||||||||
2,129 | ||||||||||||
CALIFORNIA 4.7% | ||||||||||||
California Housing Finance Revenue Bonds, Series 2024 | ||||||||||||
6.000% due 03/01/2053 | 2,400 | 2,397 | ||||||||||
California Statewide Communities Development Authority Revenue Bonds, Series 2016 | ||||||||||||
5.000% due 12/01/2046 | 1,500 | 1,511 |
PRINCIPAL AMOUNT (000S) | MARKET VALUE (000S) | |||||||||||
Folsom Cordova Unified School District, California General Obligation Bonds, (AGM Insured), Series 2019 | ||||||||||||
4.000% due 10/01/2044 | $ | 1,810 | $ | 1,811 | ||||||||
Golden State, California Tobacco Securitization Corp. Revenue Bonds, Series 2021 | ||||||||||||
0.000% due 06/01/2066 (c) | 2,500 | 279 | ||||||||||
Golden State, California Tobacco Securitization Corp. Revenue Bonds, Series 2022 | ||||||||||||
5.000% due 06/01/2051 | 1,050 | 1,089 | ||||||||||
Los Angeles County, California Public Works Financing Authority Revenue Bonds, Series 2021 | ||||||||||||
4.000% due 12/01/2046 | 1,490 | 1,497 | ||||||||||
M-S-R | ||||||||||||
6.500% due 11/01/2039 | 2,000 | 2,537 | ||||||||||
San Diego County, California Regional Airport Authority Revenue Bonds, Series 2021 | ||||||||||||
4.000% due 07/01/2051 | 1,100 | 1,030 | ||||||||||
San Francisco, California City & County Public Utilities Commission Wastewater Revenue Bonds, Series 2021 | ||||||||||||
4.000% due 10/01/2048 | 730 | 727 | ||||||||||
12,878 | ||||||||||||
COLORADO 3.9% | ||||||||||||
Colorado Health Facilities Authority Revenue Bonds, Series 2019 | ||||||||||||
4.000% due 01/01/2040 | 2,500 | 2,488 | ||||||||||
4.000% due 08/01/2049 | 2,000 | 1,900 | ||||||||||
Colorado International Center Metropolitan District No 7, General Obligation Bonds, Series 2021 | ||||||||||||
5.250% due 12/01/2051 (d) | 1,615 | 980 | ||||||||||
Colorado State Building Excellent School Certificates of Participation Bonds, Series 2018 | ||||||||||||
4.000% due 03/15/2043 | 1,250 | 1,229 | ||||||||||
Dominion Water & Sanitation District, Colorado Revenue Bonds, Series 2022 | ||||||||||||
5.875% due 12/01/2052 | 1,250 | 1,262 | ||||||||||
Harvest Crossing Metropolitan District No 4, Colorado General Obligation Bonds, Series 2022 | ||||||||||||
7.250% due 12/01/2052 | 1,250 | 1,247 | ||||||||||
Public Authority for Colorado Energy Revenue Bonds, Series 2008 | ||||||||||||
6.500% due 11/15/2038 | 500 | 613 | ||||||||||
Senac South Metropolitan District No 1, Colorado General Obligation Bonds, Series 2021 | ||||||||||||
5.250% due 12/01/2051 | 550 | 489 | ||||||||||
Third Creek Metropolitan District No 1, Colorado General Obligation Bonds, Series 2022 | ||||||||||||
4.750% due 12/01/2051 | 500 | 399 | ||||||||||
10,607 | ||||||||||||
CONNECTICUT 0.5% | ||||||||||||
Connecticut State Health & Educational Facilities Authority Revenue Bonds, Series 2022 | ||||||||||||
5.000% due 07/01/2047 | 1,380 | 1,438 | ||||||||||
DELAWARE 4.4% | ||||||||||||
Affordable Housing Opportunities Trust, Delaware Revenue Bonds, Series 2022 | ||||||||||||
3.461% due 07/01/2037 | 11,120 | 10,072 | ||||||||||
7.120% due 07/01/2037 | 1,965 | 1,917 | ||||||||||
11,989 | ||||||||||||
DISTRICT OF COLUMBIA 0.8% | ||||||||||||
District of Columbia Revenue Bonds, Series 2022 | ||||||||||||
5.500% due 08/31/2036 | 1,800 | 2,063 | ||||||||||
PRINCIPAL AMOUNT (000S) | MARKET VALUE (000S) | |||||||||||
FLORIDA 6.4% | ||||||||||||
Avenir Community Development District, Florida Special Assessment Bonds, Series 2023 | ||||||||||||
5.625% due 05/01/2054 | $ | 645 | $ | 660 | ||||||||
Charlotte County Industrial Development Authority, Florida Revenue Bonds, Series 2021 | ||||||||||||
4.000% due 10/01/2041 | 500 | 460 | ||||||||||
4.000% due 10/01/2051 | 1,250 | 1,053 | ||||||||||
Florida Development Finance Corp. Revenue Bonds, Series 2024 | ||||||||||||
4.500% due 08/01/2055 | 1,250 | 1,253 | ||||||||||
Hillsborough County, Florida Industrial Development Authority Revenue Bonds, Series 2020 | ||||||||||||
4.000% due 08/01/2050 | 1,800 | 1,620 | ||||||||||
JEA Water & Sewer System, Florida Revenue Bonds, Series 2024 | ||||||||||||
5.250% due 10/01/2049 | 900 | 1,002 | ||||||||||
Miami-Dade County, Florida Water & Sewer System Revenue Bonds, Series 2019 | ||||||||||||
4.000% due 10/01/2049 | 2,500 | 2,408 | ||||||||||
Miami-Dade Seaport Department, Florida Revenue Bonds, Series 2023 | ||||||||||||
5.000% due 10/01/2047 | 1,850 | 1,944 | ||||||||||
Orange County Health Facilities Authority, Florida Revenue Bonds, Series 2023 | ||||||||||||
5.000% due 10/01/2053 | 980 | 1,030 | ||||||||||
South Miami Health Facilities Authority, Florida Revenue Bonds, Series 2017 | ||||||||||||
4.000% due 08/15/2047 | 3,750 | 3,496 | ||||||||||
Tampa-Hillsborough County, Florida Expressway Authority Revenue Bonds, Series 2017 | ||||||||||||
4.000% due 07/01/2042 | 2,450 | 2,369 | ||||||||||
17,295 | ||||||||||||
GEORGIA 4.4% | ||||||||||||
Atlanta Development Authority, Georgia Revenue Bonds, Series 2017 | ||||||||||||
6.750% due 01/01/2035 ^(b) | 1,750 | 788 | ||||||||||
Fayette County, Georgia Hospital Authority Revenue Bonds, Series 2016 | ||||||||||||
5.000% due 07/01/2046 | 3,000 | 3,031 | ||||||||||
Municipal Electric Authority of Georgia Revenue Bonds, Series 2015 | ||||||||||||
5.000% due 07/01/2060 | 7,000 | 7,004 | ||||||||||
Valdosta & Lowndes County, Georgia Hospital Authority Revenue Bonds, Series 2024 | ||||||||||||
4.125% due 10/01/2049 | 1,000 | 984 | ||||||||||
11,807 | ||||||||||||
ILLINOIS 11.9% | ||||||||||||
Chicago Board of Education, Illinois General Obligation Bonds, Series 2018 | ||||||||||||
5.000% due 12/01/2046 | 4,000 | 4,014 | ||||||||||
Chicago O’Hare International Airport, Illinois Revenue Bonds, Series 2018 | ||||||||||||
5.000% due 01/01/2048 | 3,800 | 3,935 | ||||||||||
Chicago, Illinois General Obligation Bonds, Series 2007 | ||||||||||||
5.500% due 01/01/2035 | 400 | 402 | ||||||||||
5.500% due 01/01/2042 | 1,000 | 1,002 | ||||||||||
Chicago, Illinois General Obligation Bonds, Series 2017 | ||||||||||||
6.000% due 01/01/2038 | 3,000 | 3,122 | ||||||||||
Illinois Finance Authority Revenue Bonds, Series 2017 | ||||||||||||
5.000% due 02/15/2037 ^(b) | 1,030 | 237 | ||||||||||
Illinois Finance Authority Revenue Bonds, Series 2019 | ||||||||||||
5.000% due 11/01/2035 ^(b) | 1,010 | 912 | ||||||||||
Illinois State General Obligation Bonds, Series 2018 | ||||||||||||
4.625% due 05/01/2037 | 2,000 | 2,042 | ||||||||||
5.000% due 05/01/2041 | 1,500 | 1,548 | ||||||||||
Illinois State General Obligation Bonds, Series 2024 | ||||||||||||
4.250% due 05/01/2046 | 1,250 | 1,227 | ||||||||||
Illinois State General Obligation Notes, Series 2017 | ||||||||||||
5.000% due 11/01/2027 | 7,000 | 7,324 |
See Accompanying Notes | SEMIANNUAL REPORT | | | JUNE 30, 2024 | 65 |
Schedule of Investments | PIMCO Municipal Income Fund III | (Cont.) |
PRINCIPAL AMOUNT (000S) | MARKET VALUE (000S) | |||||||||||
Metropolitan Pier & Exposition Authority, Illinois Revenue Bonds, (AGM/CR/NPFGC Insured), Series 2002 | ||||||||||||
0.000% due 12/15/2040 (c) | $ | 2,000 | $ | 996 | ||||||||
Metropolitan Pier & Exposition Authority, Illinois Revenue Bonds, Series 2012 | ||||||||||||
0.000% due 12/15/2051 (c) | 2,500 | 617 | ||||||||||
Regional Transportation Authority, Illinois Revenue Bonds, Series 2018 | ||||||||||||
5.000% due 06/01/2038 | 3,900 | 4,099 | ||||||||||
Sales Tax Securitization Corp., Illinois Revenue Bonds, Series 2018 | ||||||||||||
4.000% due 01/01/2048 | 700 | 648 | ||||||||||
32,125 | ||||||||||||
INDIANA 1.7% | ||||||||||||
Indiana Finance Authority Midwestern Disaster Relief Revenue Bonds, Series 2012 | ||||||||||||
4.250% due 11/01/2030 | 1,400 | 1,407 | ||||||||||
Indiana Finance Authority Revenue Bonds, Series 2019 | ||||||||||||
7.000% due 03/01/2039 | 1,650 | 1,079 | ||||||||||
Indianapolis Local Public Improvement Bond Bank, Indiana Revenue Bonds, Series 2023 | ||||||||||||
5.000% due 01/01/2053 | 1,000 | 1,066 | ||||||||||
6.000% due 03/01/2053 | 1,000 | 1,099 | ||||||||||
4,651 | ||||||||||||
IOWA 3.1% | ||||||||||||
Iowa Finance Authority Midwestern Disaster Area Revenue Refunding Bonds, Series 2012 | ||||||||||||
4.750% due 08/01/2042 | 1,500 | 1,493 | ||||||||||
Iowa Finance Authority Midwestern Disaster Area Revenue Refunding Bonds, Series 2022 | ||||||||||||
5.000% due 12/01/2050 | 5,455 | 5,775 | ||||||||||
Iowa Finance Authority Revenue Bonds, Series 2014 | ||||||||||||
5.400% due 11/15/2046 | 356 | 359 | ||||||||||
Iowa Finance Authority Revenue Bonds, Series 2022 | ||||||||||||
8.000% due 01/01/2042 | 875 | 841 | ||||||||||
8,468 | ||||||||||||
LOUISIANA 3.7% | ||||||||||||
Louisiana Gasoline & Fuels Tax State Revenue Bonds, Series 2017 | ||||||||||||
4.000% due 05/01/2045 | 4,000 | 3,922 | ||||||||||
Louisiana Public Facilities Authority Revenue Bonds, Series 2017 | ||||||||||||
5.000% due 05/15/2046 | 2,500 | 2,525 | ||||||||||
Louisiana Public Facilities Authority Revenue Bonds, Series 2023 | ||||||||||||
5.000% due 10/15/2052 | 1,915 | 2,042 | ||||||||||
Parish of St James, Louisiana Revenue Bonds, Series 2010 | ||||||||||||
6.350% due 07/01/2040 | 1,350 | 1,483 | ||||||||||
9,972 | ||||||||||||
MAINE 0.7% | ||||||||||||
Maine Health & Higher Educational Facilities Authority Revenue Bonds, Series 2020 | ||||||||||||
4.000% due 07/01/2045 | 2,000 | 1,943 | ||||||||||
MARYLAND 0.2% | ||||||||||||
Maryland Economic Development Corp. Revenue Bonds, Series 2020 | ||||||||||||
4.000% due 07/01/2040 | 500 | 481 | ||||||||||
MASSACHUSETTS 1.9% | ||||||||||||
Commonwealth of Massachusetts General Obligation Bonds, Series 2018 | ||||||||||||
4.000% due 05/01/2040 | 1,000 | 1,003 |
PRINCIPAL AMOUNT (000S) | MARKET VALUE (000S) | |||||||||||
Commonwealth of Massachusetts Transportation Fund Revenue Bonds, Series 2023 | ||||||||||||
5.000% due 06/01/2053 | $ | 2,450 | $ | 2,654 | ||||||||
Massachusetts Development Finance Agency Revenue Bonds, Series 2010 | ||||||||||||
7.625% due 10/15/2037 ^(b) | 228 | 2 | ||||||||||
Massachusetts Development Finance Agency Revenue Bonds, Series 2016 | ||||||||||||
5.000% due 01/01/2047 | 1,000 | 1,008 | ||||||||||
Massachusetts Housing Finance Agency Revenue Bonds, Series 2003 | ||||||||||||
5.125% due 06/01/2043 | 525 | 525 | ||||||||||
5,192 | ||||||||||||
MICHIGAN 5.4% | ||||||||||||
Gerald R Ford International Airport Authority, Michigan Revenue Bonds, Series 2021 | ||||||||||||
5.000% due 01/01/2051 | 2,500 | 2,629 | ||||||||||
Great Lakes Water Authority Sewage Disposal System, Michigan Revenue Bonds, Series 2023 | ||||||||||||
5.250% due 07/01/2048 | 2,875 | 3,188 | ||||||||||
Michigan Finance Authority Revenue Bonds, Series 2017 | ||||||||||||
5.000% due 12/01/2046 | 2,425 | 2,469 | ||||||||||
Michigan State Housing Development Authority Revenue Bonds, Series 2015 | ||||||||||||
4.350% due 10/01/2045 | 920 | 911 | ||||||||||
Michigan Tobacco Settlement Finance Authority Revenue Bonds, Series 2008 | ||||||||||||
0.000% due 06/01/2058 (c) | 12,500 | 401 | ||||||||||
Michigan Trunk Line State Revenue Bonds, Series 2021 | ||||||||||||
4.000% due 11/15/2044 | 5,000 | 4,922 | ||||||||||
14,520 | ||||||||||||
MINNESOTA 1.0% | ||||||||||||
Minnesota Agricultural & Economic Development Board Revenue Bonds, Series 2024 | ||||||||||||
5.250% due 01/01/2047 | 1,000 | 1,096 | ||||||||||
Rochester, Minnesota Revenue Bonds, Series 2018 | ||||||||||||
4.000% due 11/15/2048 | 1,750 | 1,708 | ||||||||||
2,804 | ||||||||||||
MISSOURI 2.2% | ||||||||||||
Health & Educational Facilities Authority of the State of Missouri Revenue Bonds, Series 2018 | ||||||||||||
4.000% due 11/15/2048 | 3,000 | 2,906 | ||||||||||
Health & Educational Facilities Authority of the State of Missouri Revenue Bonds, Series 2019 | ||||||||||||
5.000% due 02/15/2035 | 500 | 527 | ||||||||||
Health & Educational Facilities Authority of the State of Missouri Revenue Bonds, Series 2023 | ||||||||||||
5.500% due 12/01/2048 | 1,250 | 1,380 | ||||||||||
Missouri Development Finance Board Revenue Bonds, Series 2022 | ||||||||||||
5.250% due 05/01/2055 | 1,000 | 1,059 | ||||||||||
5,872 | ||||||||||||
MULTI-STATE 0.4% | ||||||||||||
Freddie Mac Multifamily ML Certificates, Revenue Bonds, Series 2023 | ||||||||||||
4.141% due 01/25/2040 | 991 | 971 | ||||||||||
NEBRASKA 0.4% | ||||||||||||
University of Nebraska Facilities Corp Revenue Bonds, Series 2021 | ||||||||||||
4.000% due 07/15/2062 | 1,310 | 1,233 | ||||||||||
PRINCIPAL AMOUNT (000S) | MARKET VALUE (000S) | |||||||||||
NEVADA 1.1% | ||||||||||||
Las Vegas Convention & Visitors Authority, Nevada Revenue Bonds, Series 2023 | ||||||||||||
5.000% due 07/01/2049 | $ | 1,800 | $ | 1,924 | ||||||||
Reno, Nevada Revenue Bonds, Series 2018 | ||||||||||||
0.000% due 07/01/2058 (c) | 11,000 | 1,170 | ||||||||||
3,094 | ||||||||||||
NEW HAMPSHIRE 1.0% | ||||||||||||
New Hampshire Business Finance Authority Revenue Bonds, Series 2023 | ||||||||||||
4.837% due 07/20/2036 | 2,680 | 2,712 | ||||||||||
NEW JERSEY 8.6% | ||||||||||||
Cherry Hill Township School District, New Jersey General Obligation Bonds, Series 2022 | ||||||||||||
4.000% due 08/01/2040 | 3,000 | 3,002 | ||||||||||
Federal Home Loan Mortgage Corp. Enhanced Receipt, New Jersey Revenue Bonds, Series 2019 | ||||||||||||
3.870% due 11/15/2035 (e) | 71 | 64 | ||||||||||
New Jersey Economic Development Authority Revenue Bonds, Series 2016 | ||||||||||||
5.000% due 06/15/2041 | 5,000 | 5,220 | ||||||||||
New Jersey Health Care Facilities Financing Authority Revenue Bonds, Series 2013 | ||||||||||||
5.500% due 07/01/2043 | 2,000 | 2,004 | ||||||||||
New Jersey Transportation Trust Fund Authority Revenue Bonds, (AGM Insured), Series 2006 | ||||||||||||
0.000% due 12/15/2034 (c) | 3,200 | 2,166 | ||||||||||
New Jersey Transportation Trust Fund Authority Revenue Bonds, Series 2023 | ||||||||||||
5.250% due 06/15/2050 | 1,200 | 1,313 | ||||||||||
New Jersey Turnpike Authority Revenue Bonds, Series 2024 | ||||||||||||
4.125% due 01/01/2054 | 1,200 | 1,194 | ||||||||||
South Jersey Port Corp., New Jersey Revenue Bonds, Series 2017 | ||||||||||||
5.000% due 01/01/2049 | 900 | 923 | ||||||||||
Tobacco Settlement Financing Corp., New Jersey Revenue Bonds, Series 2018 | ||||||||||||
5.000% due 06/01/2031 | 1,200 | 1,266 | ||||||||||
5.000% due 06/01/2046 | 6,095 | 6,153 | ||||||||||
23,305 | ||||||||||||
NEW YORK 19.7% | ||||||||||||
Build NYC Resource Corp., New York Revenue Bonds, Series 2023 | ||||||||||||
5.250% due 07/01/2057 | 2,000 | 2,068 | ||||||||||
Erie County, New York Industrial Development Agency Revenue Bonds, (FNMA Insured), Series 2023 | ||||||||||||
4.250% due 02/01/2041 | 1,200 | 1,149 | ||||||||||
Freddie Mac Multifamily ML Certificates, Revenue Bonds, Series 2024 | ||||||||||||
4.563% due 04/25/2042 ~ | 2,700 | 2,828 | ||||||||||
Monroe County Industrial Development Corp, New York Revenue Bonds, Series 2023 | ||||||||||||
5.000% due 07/01/2053 | 1,250 | 1,354 | ||||||||||
Monroe County Industrial Development Corp., New York Revenue Bonds, Series 2020 | ||||||||||||
4.000% due 07/01/2050 | 1,915 | 1,841 | ||||||||||
Nassau County, New York Industrial Development Agency Revenue Bonds, Series 2021 | ||||||||||||
5.000% due 01/01/2058 ^(b) | 785 | 235 | ||||||||||
New York City Transitional Finance Authority Future Tax Secured, New York Revenue Bonds, Series 2020 | ||||||||||||
4.000% due 05/01/2045 | 3,000 | 2,955 | ||||||||||
New York City, New York Municipal Water Finance Authority Revenue Bonds, Series 2022 | ||||||||||||
5.250% due 06/15/2052 | 2,530 | 2,774 | ||||||||||
New York City, New York Municipal Water Finance Authority Revenue Bonds, Series 2023 | ||||||||||||
5.250% due 06/15/2053 | 800 | 884 |
66 | PIMCO CLOSED-END FUNDS | See Accompanying Notes |
June 30, 2024 | (Unaudited) |
PRINCIPAL AMOUNT (000S) | MARKET VALUE (000S) | |||||||||||
New York City, New York Transitional Finance Authority Future Tax Secured Revenue Bonds, Series 2022 | ||||||||||||
5.500% due 11/01/2045 | $ | 2,250 | $ | 2,556 | ||||||||
New York Liberty Development Corp. Revenue Bonds, Series 2007 | ||||||||||||
5.500% due 10/01/2037 | 1,700 | 2,017 | ||||||||||
New York Liberty Development Corp. Revenue Bonds, Series 2021 | ||||||||||||
2.875% due 11/15/2046 | 1,760 | 1,292 | ||||||||||
New York Power Authority Revenue Bonds, (AGM Insured), Series 2022 | ||||||||||||
4.000% due 11/15/2061 | 925 | 886 | ||||||||||
New York Power Authority Revenue Bonds, Series 2020 | ||||||||||||
4.000% due 11/15/2060 | 1,750 | 1,664 | ||||||||||
New York State Dormitory Authority Revenue Bonds, Series 2017 | ||||||||||||
4.000% due 02/15/2047 | 500 | 486 | ||||||||||
New York State Dormitory Authority Revenue Bonds, Series 2020 | ||||||||||||
4.000% due 03/15/2048 | 3,625 | 3,541 | ||||||||||
New York State Thruway Authority Revenue Bonds, Series 2019 | ||||||||||||
4.000% due 01/01/2039 | 5,250 | 5,272 | ||||||||||
4.000% due 01/01/2050 | 620 | 591 | ||||||||||
New York State Urban Development Corp. Revenue Bonds, Series 2021 | ||||||||||||
4.000% due 03/15/2047 | 3,250 | 3,141 | ||||||||||
New York State Urban Development Corp. Revenue Bonds, Series 2023 | ||||||||||||
5.000% due 03/15/2051 | 1,300 | 1,416 | ||||||||||
5.000% due 03/15/2063 | 5,000 | 5,367 | ||||||||||
New York Transportation Development Corp. Revenue Bonds, (AGM Insured), Series 2023 | ||||||||||||
5.125% due 06/30/2060 | 2,500 | 2,589 | ||||||||||
Triborough Bridge & Tunnel Authority Sales Tax, New York Revenue Bonds, Series 2022 | ||||||||||||
4.000% due 05/15/2057 | 2,750 | 2,621 | ||||||||||
5.250% due 05/15/2062 | 1,000 | 1,086 | ||||||||||
Triborough Bridge & Tunnel Authority, New York Revenue Bonds, Series 2021 | ||||||||||||
5.000% due 05/15/2051 | 1,835 | 1,954 | ||||||||||
Utility Debt Securitization Authority, New York Revenue Bonds, Series 2023 | ||||||||||||
5.000% due 12/15/2050 | 700 | 776 | ||||||||||
53,343 | ||||||||||||
NORTH CAROLINA 1.2% | ||||||||||||
Inlivian, North Carolina Revenue Bonds, (FNMA Insured), Series 2024 | ||||||||||||
4.450% due 06/01/2041 | 1,100 | 1,101 | ||||||||||
North Carolina Turnpike Authority Revenue Bonds, (AGM Insured), Series 2024 | ||||||||||||
5.000% due 01/01/2058 | 2,100 | 2,221 | ||||||||||
3,322 | ||||||||||||
NORTH DAKOTA 0.0% | ||||||||||||
Grand Forks County, North Dakota Revenue Bonds, Series 2021 | ||||||||||||
7.000% due 12/15/2043 ^(b) | 940 | 28 | ||||||||||
OHIO 6.9% | ||||||||||||
Buckeye Tobacco Settlement Financing Authority, Ohio Revenue Bonds, Series 2020 | ||||||||||||
0.000% due 06/01/2057 (c) | 39,500 | 3,706 | ||||||||||
Canton City School District, Ohio General Obligation Bonds, Series 2023 | ||||||||||||
5.500% due 12/01/2050 | 1,750 | 1,925 | ||||||||||
Geisinger Authority, Ohio Revenue Bonds, Series 2017 | ||||||||||||
4.000% due 02/15/2047 | 5,310 | 5,082 | ||||||||||
Montgomery County, Ohio Dayton Children’s Hospital Revenue Bonds, Series 2021 | ||||||||||||
4.000% due 08/01/2046 | 2,250 | 2,186 |
PRINCIPAL AMOUNT (000S) | MARKET VALUE (000S) | |||||||||||
Ohio Air Quality Development Authority Dayton Power And Light Company Project Revenue Bonds , Series 2015 | ||||||||||||
4.250% due 11/01/2040 | $ | 2,000 | $ | 2,009 | ||||||||
Ohio Air Quality Development Authority Revenue Bonds, Series 2019 | ||||||||||||
5.000% due 07/01/2049 | 1,250 | 1,169 | ||||||||||
Ohio Air Quality Development Authority Revenue Notes, Series 2019 | ||||||||||||
3.250% due 09/01/2029 | 900 | 865 | ||||||||||
Ohio Housing Finance Agency Revenue Bonds, (GNMA/FNMA/FHLMC Insured), Series 2024 | ||||||||||||
4.350% due 09/01/2044 | 1,200 | 1,204 | ||||||||||
Worthington City School District, Ohio General Obligation Bonds, Series 2023 | ||||||||||||
5.500% due 12/01/2054 | 485 | 541 | ||||||||||
18,687 | ||||||||||||
OKLAHOMA 2.0% | ||||||||||||
Oklahoma Development Finance Authority Revenue Bonds, Series 2018 | ||||||||||||
5.500% due 08/15/2052 | 1,600 | 1,646 | ||||||||||
Oklahoma Development Finance Authority Revenue Bonds, Series 2021 | ||||||||||||
8.000% due 12/01/2041 | 1,000 | 826 | ||||||||||
Oklahoma Turnpike Authority Revenue Bonds, Series 2023 | ||||||||||||
4.500% due 01/01/2053 | 2,825 | 2,882 | ||||||||||
5,354 | ||||||||||||
OREGON 1.2% | ||||||||||||
Medford Hospital Facilities Authority, Oregon Revenue Bonds, Series 2020 | ||||||||||||
4.000% due 08/15/2039 | 1,000 | 985 | ||||||||||
Multnomah County School District 40, Oregon General Obligation Bonds, Series 2023 | ||||||||||||
0.000% due 06/15/2051 (c) | 1,710 | 443 | ||||||||||
Washington & Multnomah Counties School District No 48J Beaverton, Oregon General Obligation Bonds, Series 2022 | ||||||||||||
0.000% due 06/15/2048 (c) | 2,495 | 779 | ||||||||||
5.000% due 06/15/2052 | 1,000 | 1,074 | ||||||||||
3,281 | ||||||||||||
PENNSYLVANIA 2.9% | ||||||||||||
Montgomery County, Pennsylvania Higher Education and Health Authority Revenue Bonds, Series 2022 | ||||||||||||
4.000% due 05/01/2040 | 1,750 | 1,742 | ||||||||||
Pennsylvania Economic Development Financing Authority Revenue Bonds, (AGM Insured), Series 2022 | ||||||||||||
5.750% due 12/31/2062 | 3,000 | 3,278 | ||||||||||
Pennsylvania Economic Development Financing Authority Revenue Bonds, Series 2021 | ||||||||||||
9.000% due 04/01/2051 | 1,650 | 1,816 | ||||||||||
Philadelphia Authority for Industrial Development, Pennsylvania Revenue Bonds, Series 2017 | ||||||||||||
5.500% due 12/01/2058 | 1,000 | 964 | ||||||||||
7,800 | ||||||||||||
PUERTO RICO 6.3% | ||||||||||||
Children’s Trust Fund, Puerto Rico Revenue Bonds, Series 2008 | ||||||||||||
0.000% due 05/15/2057 (c) | 31,000 | 2,152 | ||||||||||
Commonwealth of Puerto Rico Bonds, Series 2022 | ||||||||||||
0.000% due 11/01/2051 | 4,099 | 2,349 | ||||||||||
Commonwealth of Puerto Rico General Obligation Bonds, Series 2021 | ||||||||||||
0.000% due 07/01/2033 (c) | 1,750 | 1,170 | ||||||||||
4.000% due 07/01/2041 | 1,700 | 1,590 |
PRINCIPAL AMOUNT (000S) | MARKET VALUE (000S) | |||||||||||
Puerto Rico Sales Tax Financing Corp. Sales Tax Revenue Bonds, Series 2018 | ||||||||||||
0.000% due 07/01/2046 (c) | $ | 9,650 | $ | 3,121 | ||||||||
0.000% due 07/01/2051 (c) | 10,500 | 2,471 | ||||||||||
Puerto Rico Sales Tax Financing Corp. Sales Tax Revenue Bonds, Series 2019 | ||||||||||||
4.784% due 07/01/2058 | 4,260 | 4,213 | ||||||||||
17,066 | ||||||||||||
RHODE ISLAND 1.1% | ||||||||||||
Tobacco Settlement Financing Corp., Rhode Island Revenue Bonds, Series 2015 | ||||||||||||
5.000% due 06/01/2050 | 3,000 | 3,005 | ||||||||||
SOUTH CAROLINA 2.5% | ||||||||||||
South Carolina Public Service Authority Revenue Obligations Revenue Bonds, Series 2013 | ||||||||||||
5.125% due 12/01/2043 | 5,000 | 5,000 | ||||||||||
5.500% due 12/01/2053 | 1,750 | 1,751 | ||||||||||
6,751 | ||||||||||||
TENNESSEE 0.2% | ||||||||||||
Shelby County, Tennessee Health Educational & Housing Facilities Board Revenue Bonds, Series 2019 | ||||||||||||
5.750% due 10/01/2049 | 750 | 556 | ||||||||||
TEXAS 30.4% | ||||||||||||
Angelina & Neches River Authority, Texas Revenue Bonds, Series 2021 | ||||||||||||
7.500% due 12/01/2045 | 650 | 439 | ||||||||||
12.000% due 12/01/2045 | 1,100 | 968 | ||||||||||
Bexar County Texas Hospital District, General Obligation Bonds, Series 2018 | ||||||||||||
4.000% due 02/15/2043 | 2,500 | 2,436 | ||||||||||
Brazoria County, Texas Industrial Development Corp. Revenue Bonds, Series 2023 | ||||||||||||
12.000% due 06/01/2043 | 2,000 | 2,025 | ||||||||||
Calhoun County, Texas Navigation Industrial Development Authority Revenue Notes, Series 2021 | ||||||||||||
3.625% due 07/01/2026 | 1,250 | 1,184 | ||||||||||
Central Texas Turnpike System Revenue Bonds, Series 2015 | ||||||||||||
0.000% due 08/15/2036 (c) | 1,250 | 727 | ||||||||||
0.000% due 08/15/2037 (c) | 4,000 | 2,210 | ||||||||||
Clifton Higher Education Finance Corp., Texas Revenue Bonds, Series 2018 | ||||||||||||
6.125% due 08/15/2048 | 1,000 | 1,016 | ||||||||||
Coppell Independent School District, Texas General Obligation Bonds, (PSF Insured), Series 2023 | ||||||||||||
4.250% due 08/15/2053 | 925 | 922 | ||||||||||
Corpus Christi Independent School District, Texas General Obligation Bonds, (PSF Insured), Series 2023 | ||||||||||||
4.125% due 08/15/2053 | 1,260 | 1,238 | ||||||||||
Dallas Area Rapid Transit, Texas Revenue Bonds, Series 2021 | ||||||||||||
4.000% due 12/01/2051 | 5,000 | 4,786 | ||||||||||
Dallas Fort Worth International Airport, Texas Revenue Bonds, Series 2022 | ||||||||||||
5.000% due 11/01/2039 | 1,000 | 1,111 | ||||||||||
Dallas Independent School District, Texas General Obligation Bonds, (PSF Insured), Series 2024 | ||||||||||||
4.000% due 02/15/2054 | 1,500 | 1,441 | ||||||||||
Edgewood Independent School District/Van Zandt County, Texas General Obligation Bonds, (PSF Insured), Series 2023 | ||||||||||||
4.000% due 02/15/2048 | 1,290 | 1,254 | ||||||||||
EP Tuscany Zaragosa PFC, Texas Revenue Notes, Series 2023 | ||||||||||||
4.000% due 12/01/2033 | 4,000 | 3,882 | ||||||||||
Fort Bend County Texas Public Facility Corp. Revenue Bonds, Series 2023 | ||||||||||||
5.000% due 03/01/2048 | 3,375 | 3,580 |
See Accompanying Notes | SEMIANNUAL REPORT | | | JUNE 30, 2024 | 67 |
Schedule of Investments | PIMCO Municipal Income Fund III | (Cont.) |
PRINCIPAL AMOUNT (000S) | MARKET VALUE (000S) | |||||||||||
Garland Independent School District, Texas General Obligation Bonds, (PSF Insured), Series 2023 | ||||||||||||
5.000% due 02/15/2048 | $ | 3,100 | $ | 3,362 | ||||||||
Grand Parkway Transportation Corp., Texas Revenue Bonds, (AGM/CR Insured), Series 2020 | ||||||||||||
4.000% due 10/01/2049 | 1,045 | 990 | ||||||||||
Greenwood Independent School District, Texas General Obligation Bonds, (PSF Insured), Series 2024 | ||||||||||||
4.000% due 02/15/2054 | 3,000 | 2,828 | ||||||||||
Harris County, Texas Toll Road Revenue Bonds, Series 2024 | ||||||||||||
4.000% due 08/15/2041 | 1,250 | 1,247 | ||||||||||
Hays Consolidated Independent School District, Texas General Obligation Bonds, (PSF Insured), Series 2023 | ||||||||||||
5.000% due 02/15/2048 | 1,250 | 1,341 | ||||||||||
Houston, Texas Combined Utility System Revenue Bonds, Series 2020 | ||||||||||||
4.000% due 11/15/2049 | 1,000 | 954 | ||||||||||
Hurst-Euless-Bedford Independent School District, Texas General Obligation Bonds, (PSF Insured), Series 2024 | ||||||||||||
4.000% due 08/15/2050 | 1,000 | 969 | ||||||||||
Katy Independent School District, Texas General Obligation Bonds, (PSF Insured), Series 2024 | ||||||||||||
4.000% due 02/15/2049 (a) | 1,500 | 1,448 | ||||||||||
Lamar Consolidated Independent School District, Texas General Obligation Bonds, (PSF Insured), Series 2023 | ||||||||||||
4.000% due 02/15/2048 | 1,250 | 1,213 | ||||||||||
Lamar Consolidated Independent School District, Texas General Obligation Bonds, (PSF Insured), Series 2023 | ||||||||||||
5.000% due 02/15/2053 | 4,900 | 5,261 | ||||||||||
Lamar Consolidated Independent School District, Texas General Obligation Bonds, Series 2023 | ||||||||||||
4.000% due 02/15/2048 | 2,500 | 2,414 | ||||||||||
Lower Colorado River Authority, Texas Revenue Bonds, (AGM Insured), Series 2024 | ||||||||||||
5.000% due 05/15/2049 | 1,000 | 1,087 | ||||||||||
Lower Colorado River Authority, Texas Revenue Bonds, Series 2020 | ||||||||||||
5.000% due 05/15/2045 | 1,750 | 1,829 | ||||||||||
Medina Valley Independent School District, Texas General Obligation Bonds, (PSF Insured), Series 2023 | ||||||||||||
4.500% due 02/15/2047 | 1,000 | 1,029 | ||||||||||
North Texas Tollway Authority Revenue Bonds, Series 2017 | ||||||||||||
4.000% due 01/01/2043 | 1,500 | 1,455 | ||||||||||
San Antonio Municipal Facilities Corp., Texas Revenue Bonds, Series 2021 | ||||||||||||
4.000% due 08/01/2048 | 3,000 | 2,883 | ||||||||||
San Antonio, Texas Electric & Gas Systems Revenue Bonds, Series 2024 | ||||||||||||
5.250% due 02/01/2049 | 2,500 | 2,751 | ||||||||||
Tarrant County, Texas Cultural Education Facilities Finance Corp. Revenue Bonds, Series 2017 | ||||||||||||
6.750% due 11/15/2047 | 500 | 518 | ||||||||||
Tarrant County, Texas Cultural Education Facilities Finance Corp. Revenue Bonds, Series 2022 | ||||||||||||
5.000% due 11/15/2051 | 1,480 | 1,560 | ||||||||||
Tarrant County, Texas Hospital District General Obligation Bonds, Series 2023 | ||||||||||||
5.250% due 08/15/2048 | 2,900 | 3,178 | ||||||||||
Texas Municipal Gas Acquisition & Supply Corp. Revenue Bonds, Series 2006 | ||||||||||||
5.250% due 12/15/2026 | 150 | 153 |
PRINCIPAL AMOUNT (000S) | MARKET VALUE (000S) | |||||||||||
Texas Municipal Gas Acquisition & Supply Corp. Revenue Bonds, Series 2008 | ||||||||||||
6.250% due 12/15/2026 | $ | 4,140 | $ | 4,262 | ||||||||
Texas Private Activity Bond Surface Transportation Corp. Revenue Bonds, Series 2019 | ||||||||||||
5.000% due 06/30/2058 | 2,000 | 2,042 | ||||||||||
Texas Water Development Board Revenue Bonds, Series 2022 | ||||||||||||
4.800% due 10/15/2052 | 800 | 832 | ||||||||||
Texas Water Development Board Revenue Bonds, Series 2023 | ||||||||||||
4.875% due 10/15/2048 | 1,700 | 1,797 | ||||||||||
5.000% due 10/15/2058 | 1,100 | 1,182 | ||||||||||
University of North Texas System Revenue Bonds, Series 2018 | ||||||||||||
4.000% due 04/15/2050 | 2,200 | 2,095 | ||||||||||
West Harris County, Texas Regional Water Authority Revenue Bonds, (BAM Insured), Series 2021 | ||||||||||||
4.000% due 12/15/2060 | 2,700 | 2,493 | ||||||||||
82,392 | ||||||||||||
UTAH 0.6% | ||||||||||||
Military Installation Development Authority, Utah Revenue Bonds, Series 2021 | ||||||||||||
4.000% due 06/01/2036 | 1,000 | 900 | ||||||||||
Ogden City Redevelopment Agency, Utah Revenue Bonds, Series 2023 | ||||||||||||
5.000% due 01/15/2053 | 700 | 744 | ||||||||||
1,644 | ||||||||||||
VIRGINIA 0.8% | ||||||||||||
Virginia Small Business Financing Authority Revenue Bonds, Series 2019 | ||||||||||||
0.000% due 07/01/2061 (c) | 25,000 | 804 | ||||||||||
5.000% due 07/01/2034 | 1,465 | 1,366 | ||||||||||
2,170 | ||||||||||||
WASHINGTON 2.2% | ||||||||||||
Seattle, Washington Municipal Light & Power Revenue Bonds, Series 2018 | ||||||||||||
4.000% due 01/01/2046 | 4,000 | 3,926 | ||||||||||
Washington State Convention Center Public Facilities District Revenue Bonds, Series 2018 | ||||||||||||
4.000% due 07/01/2058 | 1,345 | 1,223 | ||||||||||
Washington State Housing Finance Commission Revenue Bonds, Series 2018 | ||||||||||||
5.000% due 07/01/2038 | 825 | 697 | ||||||||||
5,846 | ||||||||||||
WEST VIRGINIA 0.4% | ||||||||||||
Monongalia County, West Virginia Commission Special District Revenue Bonds, Series 2017 | ||||||||||||
5.500% due 06/01/2037 | 1,000 | 1,025 | ||||||||||
WISCONSIN 4.8% | ||||||||||||
Public Finance Authority, Wisconsin Revenue Bonds, Series 2017 | ||||||||||||
7.000% due 01/01/2050 | 2,500 | 2,675 |
PRINCIPAL AMOUNT (000S) | MARKET VALUE (000S) | |||||||||||
Public Finance Authority, Wisconsin Revenue Bonds, Series 2018 | ||||||||||||
6.375% due 01/01/2048 | $ | 2,500 | $ | 1,125 | ||||||||
Public Finance Authority, Wisconsin Revenue Bonds, Series 2020 | ||||||||||||
0.000% due 01/01/2060 (c) | 7,500 | 557 | ||||||||||
Public Finance Authority, Wisconsin Revenue Bonds, Series 2021 | ||||||||||||
4.000% due 09/30/2051 | 1,260 | 1,069 | ||||||||||
4.500% due 06/01/2056 | 885 | 716 | ||||||||||
Public Finance Authority, Wisconsin Revenue Bonds, Series 2022 | ||||||||||||
5.000% due 10/01/2052 | 2,000 | 2,111 | ||||||||||
Wisconsin Center District Revenue Bonds, (AGM Insured), Series 2020 | ||||||||||||
0.000% due 12/15/2045 (c) | 6,500 | 2,332 | ||||||||||
Wisconsin Health & Educational Facilities Authority Revenue Bonds, Series 2016 | ||||||||||||
4.000% due 11/15/2046 | 415 | 420 | ||||||||||
Wisconsin Health & Educational Facilities Authority Revenue Bonds, Series 2022 | ||||||||||||
4.000% due 12/01/2051 | 2,070 | 1,911 | ||||||||||
12,916 | ||||||||||||
Total Municipal Bonds & Notes (Cost $441,091) | 442,564 | |||||||||||
U.S. GOVERNMENT AGENCIES 2.8% | ||||||||||||
Freddie Mac | ||||||||||||
3.800% due 01/01/2040 | 4,988 | 4,740 | ||||||||||
3.850% due 01/01/2040 | 2,800 | 2,663 | ||||||||||
Total U.S. Government Agencies (Cost $7,432) | 7,403 | |||||||||||
SHORT-TERM INSTRUMENTS 0.3% | ||||||||||||
REPURCHASE AGREEMENTS (f) 0.3% | ||||||||||||
886 | ||||||||||||
Total Short-Term Instruments (Cost $886) | 886 | |||||||||||
Total Investments in Securities (Cost $452,609) | 454,053 | |||||||||||
Total Investments 167.7% (Cost $452,609) | $ | 454,053 | ||||||||||
Auction Rate Preferred Shares (0.4)% | (1,175 | ) | ||||||||||
Remarketable Variable Rate MuniFund Term Preferred Shares, at liquidation value (67.1)% | (181,773 | ) | ||||||||||
Other Assets and Liabilities, net (0.2)% | (464 | ) | ||||||||||
Net Assets Applicable to Common Shareholders 100.0% | $ | 270,641 | ||||||||||
* | A zero balance may reflect actual amounts rounding to less than one thousand. |
^ | Security is in default. |
« | Security valued using significant unobservable inputs (Level 3). |
µ | All or a portion of this amount represents unfunded loan commitments. The interest rate for the unfunded portion will be determined at the time of funding. See Note 4, Securities and Other Investments, in the Notes to Financial Statements for more information regarding unfunded loan commitments. |
68 | PIMCO CLOSED-END FUNDS | See Accompanying Notes |
June 30, 2024 | (Unaudited) |
~ | Variable or Floating rate security. Rate shown is the rate in effect as of period end. Certain variable rate securities are not based on a published reference rate and spread, rather are determined by the issuer or agent and are based on current market conditions. Reference rate is as of reset date, which may vary by security. These securities may not indicate a reference rate and/or spread in their description. |
(a) | When-issued security. |
(b) | Security is not accruing income as of the date of this report. |
(c) | Zero coupon security. |
(d) | Security becomes interest bearing at a future date. |
Issuer Description | Coupon | Maturity Date | Acquisition Date | Cost | Market Value | Market Value as Percentage of Net Assets Applicable to Common Shareholders | ||||||||||||||||
Federal Home Loan Mortgage Corp. Enhanced Receipt, New Jersey Revenue Bonds, Series 2019 | 3.870% | 11/15/2035 | 10/26/2020 | $ 77 | $ | 64 | 0.02% | |||||||||||||||
Counterparty | Lending Rate | Settlement Date | Maturity Date | Principal Amount | Collateralized By | Collateral (Received) | Repurchase Agreements, at Value | Repurchase Agreement Proceeds to be Received (1) | ||||||||||||||||||||||
FICC | 2.600 | % | 06/28/2024 | 07/01/2024 | $ | 886 | U.S. Treasury Inflation Protected Securities 0.625% due 01/15/2026 | $ | (904 | ) | $ | 886 | $ | 886 | ||||||||||||||||
Total Repurchase Agreements | $ | (904 | ) | $ | 886 | $ | 886 | |||||||||||||||||||||||
Counterparty | Repurchase Agreement Proceeds to be Received (1) | Payable for Reverse Repurchase Agreements | Payable for Sale-Buyback Transactions | Total Borrowings and Other Financing Transactions | Collateral Pledged/(Received) | Net Exposure (2) | ||||||||||||||||||
Global/Master Repurchase Agreement | ||||||||||||||||||||||||
FICC | $ | 886 | $ | 0 | $ | 0 | $ | 886 | $ | (904 | ) | $ | (18 | ) | ||||||||||
Total Borrowings and Other Financing Transactions | $ | 886 | $ | 0 | $ | 0 | ||||||||||||||||||
(1) | Includes accrued interest. |
(2) | Net Exposure represents the net receivable/(payable) that would be due from/to the counterparty in the event of default. Exposure from borrowings and other financing transactions can only be netted across transactions governed under the same master agreement with the same legal entity. See Note 7, Master Netting Arrangements, in the Notes to Financial Statements for more information. |
Category and Subcategory | Level 1 | Level 2 | Level 3 | Fair Value at 06/30/2024 | ||||||||||||
Investments in Securities, at Value | ||||||||||||||||
Loan Participations and Assignments | $ | 0 | $ | 0 | $ | 3,200 | $ | 3,200 | ||||||||
Municipal Bonds & Notes | ||||||||||||||||
Alabama | 0 | 4,343 | 0 | 4,343 | ||||||||||||
Alaska | 0 | 1,238 | 0 | 1,238 | ||||||||||||
Arizona | 0 | 24,248 | 0 | 24,248 | ||||||||||||
Arkansas | 0 | 2,129 | 0 | 2,129 | ||||||||||||
California | 0 | 12,878 | 0 | 12,878 | ||||||||||||
Colorado | 0 | 10,607 | 0 | 10,607 | ||||||||||||
Connecticut | 0 | 1,438 | 0 | 1,438 | ||||||||||||
Delaware | 0 | 11,989 | 0 | 11,989 | ||||||||||||
District of Columbia | 0 | 2,063 | 0 | 2,063 |
Category and Subcategory | Level 1 | Level 2 | Level 3 | Fair Value at 06/30/2024 | ||||||||||||
Florida | $ | 0 | $ | 17,295 | $ | 0 | $ | 17,295 | ||||||||
Georgia | 0 | 11,807 | 0 | 11,807 | ||||||||||||
Illinois | 0 | 32,125 | 0 | 32,125 | ||||||||||||
Indiana | 0 | 4,651 | 0 | 4,651 | ||||||||||||
Iowa | 0 | 8,468 | 0 | 8,468 | ||||||||||||
Louisiana | 0 | 9,972 | 0 | 9,972 | ||||||||||||
Maine | 0 | 1,943 | 0 | 1,943 | ||||||||||||
Maryland | 0 | 481 | 0 | 481 | ||||||||||||
Massachusetts | 0 | 5,192 | 0 | 5,192 | ||||||||||||
Michigan | 0 | 14,520 | 0 | 14,520 | ||||||||||||
Minnesota | 0 | 2,804 | 0 | 2,804 | ||||||||||||
Missouri | 0 | 5,872 | 0 | 5,872 |
See Accompanying Notes | SEMIANNUAL REPORT | | | JUNE 30, 2024 | 69 |
Schedule of Investments | PIMCO Municipal Income Fund III | (Cont.) | June 30, 2024 | (Unaudited) |
Category and Subcategory | Level 1 | Level 2 | Level 3 | Fair Value at 06/30/2024 | ||||||||||||
Multi-State | $ | 0 | $ | 971 | $ | 0 | $ | 971 | ||||||||
Nebraska | 0 | 1,233 | 0 | 1,233 | ||||||||||||
Nevada | 0 | 3,094 | 0 | 3,094 | ||||||||||||
New Hampshire | 0 | 2,712 | 0 | 2,712 | ||||||||||||
New Jersey | 0 | 23,305 | 0 | 23,305 | ||||||||||||
New York | 0 | 53,343 | 0 | 53,343 | ||||||||||||
North Carolina | 0 | 3,322 | 0 | 3,322 | ||||||||||||
North Dakota | 0 | 28 | 0 | 28 | ||||||||||||
Ohio | 0 | 18,687 | 0 | 18,687 | ||||||||||||
Oklahoma | 0 | 5,354 | 0 | 5,354 | ||||||||||||
Oregon | 0 | 3,281 | 0 | 3,281 | ||||||||||||
Pennsylvania | 0 | 7,800 | 0 | 7,800 | ||||||||||||
Puerto Rico | 0 | 17,066 | 0 | 17,066 | ||||||||||||
Rhode Island | 0 | 3,005 | 0 | 3,005 |
Category and Subcategory | Level 1 | Level 2 | Level 3 | Fair Value at 06/30/2024 | ||||||||||||
South Carolina | $ | 0 | $ | 6,751 | $ | 0 | $ | 6,751 | ||||||||
Tennessee | 0 | 556 | 0 | 556 | ||||||||||||
Texas | 0 | 82,392 | 0 | 82,392 | ||||||||||||
Utah | 0 | 1,644 | 0 | 1,644 | ||||||||||||
Virginia | 0 | 2,170 | 0 | 2,170 | ||||||||||||
Washington | 0 | 5,846 | 0 | 5,846 | ||||||||||||
West Virginia | 0 | 1,025 | 0 | 1,025 | ||||||||||||
Wisconsin | 0 | 12,916 | 0 | 12,916 | ||||||||||||
U.S. Government Agencies | 0 | 7,403 | 0 | 7,403 | ||||||||||||
Short-Term Instruments | ||||||||||||||||
Repurchase Agreements | 0 | 886 | 0 | 886 | ||||||||||||
Total Investments | $ | 0 | $ | 450,853 | $ | 3,200 | $ | 454,053 | ||||||||
Category and Subcategory | Beginning Balance at 12/31/2023 | Net Purchases | Net Sales/ Settlements | Accrued Discounts/ (Premiums) | Realized Gain/(Loss) | Net Change in Unrealized Appreciation/ (Depreciation) (1) | Transfers into Level 3 | Transfers out of Level 3 | Ending Balance at 06/30/2024 | Net Change in Unrealized Appreciation/ (Depreciation) on Investments Held at 06/30/2024 (1) | ||||||||||||||||||||||||||||||
Investments in Securities, at Value | ||||||||||||||||||||||||||||||||||||||||
Loan Participations and Assignments | $ | 3,340 | $ | 0 | $ | 0 | $ | 0 | $ | 0 | $ | (140 | ) | $ | 0 | $ | 0 | $ | 3,200 | $ | (140 | ) | ||||||||||||||||||
Totals | $ | 3,340 | $ | 0 | $ | 0 | $ | 0 | $ | 0 | $ | (140 | ) | $ | 0 | $ | 0 | $ | 3,200 | $ | (140 | ) | ||||||||||||||||||
Category and Subcategory | Ending Balance at 06/30/2024 | Valuation Technique | Unobservable Inputs | (% Unless Noted Otherwise) | ||||||||||||
Input Value(s) | Weighted Average | |||||||||||||||
Investments in Securities, at Value | ||||||||||||||||
Loan Participations and Assignments | $ | 3,200 | Discounted Cash Flow | Discount Rate | 6.578-7.585 | 6.735 | ||||||||||
Total | $ | 3,200 | ||||||||||||||
(1) | Any difference between Net Change in Unrealized Appreciation/(Depreciation) and Net Change in Unrealized Appreciation/(Depreciation) on Investments Held at June 30, 2024 may be due to an investment no longer held or categorized as Level 3 at period end. |
70 | PIMCO CLOSED-END FUNDS | See Accompanying Notes |
Notes to Financial Statements | June 30, 2024 | (Unaudited) |
Fund Name | Formation Date | |||||||
PIMCO California Municipal Income Fund | May 10, 2001 | |||||||
PIMCO California Municipal Income Fund II | March 29, 2002 | |||||||
PIMCO California Municipal Income Fund III | August 20, 2002 | |||||||
PIMCO New York Municipal Income Fund | May 10, 2001 | |||||||
PIMCO New York Municipal Income Fund II | March 29, 2002 | |||||||
PIMCO New York Municipal Income Fund III | August 20, 2002 | |||||||
PIMCO Municipal Income Fund | May 9, 2001 | |||||||
PIMCO Municipal Income Fund II | March 29, 2002 | |||||||
PIMCO Municipal Income Fund III | August 20, 2002 |
Distribution Frequency | ||||||||||||
Fund Name | Declared | Distributed | ||||||||||
PIMCO California Municipal Income Fund | Monthly | Monthly | ||||||||||
PIMCO California Municipal Income Fund II | Monthly | Monthly | ||||||||||
PIMCO California Municipal Income Fund III | Monthly | Monthly | ||||||||||
PIMCO New York Municipal Income Fund | Monthly | Monthly | ||||||||||
PIMCO New York Municipal Income Fund II | Monthly | Monthly | ||||||||||
PIMCO New York Municipal Income Fund III | Monthly | Monthly | ||||||||||
PIMCO Municipal Income Fund | Monthly | Monthly | ||||||||||
PIMCO Municipal Income Fund II | Monthly | Monthly | ||||||||||
PIMCO Municipal Income Fund III | Monthly | Monthly |
SEMIANNUAL REPORT | | | JUNE 30, 2024 | 71 |
Notes to Financial Statements | (Cont.) |
72 | PIMCO CLOSED-END FUNDS |
June 30, 2024 | (Unaudited) |
SEMIANNUAL REPORT | | | JUNE 30, 2024 | 73 |
Notes to Financial Statements | (Cont.) |
∎ | Level 1 — Quoted prices (unadjusted) in active markets or exchanges for identical assets and liabilities. |
∎ | Level 2 — Significant other observable inputs, which may include, but are not limited to, quoted prices for similar assets or liabilities in markets that are active, quoted prices for identical or similar assets or liabilities in markets that are not active, inputs other than quoted prices that are observable for the assets or liabilities (such as interest rates, yield curves, volatilities, prepayment speeds, loss severities, credit risks and default rates) or other market corroborated inputs. |
∎ | Level 3 — Significant unobservable inputs based on the best information available in the circumstances, to the extent observable inputs are not available, which may include assumptions made by the Valuation Designee that are used in determining the fair value of investments. |
74 | PIMCO CLOSED-END FUNDS |
June 30, 2024 | (Unaudited) |
SEMIANNUAL REPORT | | | JUNE 30, 2024 | 75 |
Notes to Financial Statements | (Cont.) |
76 | PIMCO CLOSED-END FUNDS |
June 30, 2024 | (Unaudited) |
SEMIANNUAL REPORT | | | JUNE 30, 2024 | 77 |
Notes to Financial Statements | (Cont.) |
78 | PIMCO CLOSED-END FUNDS |
June 30, 2024 | (Unaudited) |
Fund Name | Average Leverage Outstanding (000s) | Weighted Average Interest Rate* | ||||||||||
PIMCO Municipal Income Fund II | $ | 7,500 | 4.31% |
* | Annualized |
PIMCO Municipal Income Fund (PMF) | PIMCO Municipal Income Fund II (PML) | PIMCO Municipal Income Fund III (PMX) | PIMCO California Municipal Income Fund (PCQ) | PIMCO California Municipal Income Fund II (PCK) | PIMCO California Municipal Income Fund III (PZC) | PIMCO New York Municipal Income Fund (PNF) | PIMCO New York Municipal Income Fund II (PNI) | PIMCO New York Municipal Income Fund III (PYN) | ||||||||||||||
AMT Bonds | X | X | X | X | X | X | X | X | X | |||||||||||||
Asset Allocation | X | X | X | X | X | X | X | X | X | |||||||||||||
California State-Specific | X | X | X | X | X | X | — | — | — | |||||||||||||
Call | X | X | X | X | X | X | X | X | X | |||||||||||||
Confidential Information Access Risk | X | X | X | X | X | X | X | X | X | |||||||||||||
Credit | X | X | X | X | X | X | X | X | X | |||||||||||||
Cyber Security | X | X | X | X | X | X | X | X | X | |||||||||||||
Derivatives | X | X | X | X | X | X | X | X | X | |||||||||||||
Distribution Rate | X | X | X | X | X | X | X | X | X | |||||||||||||
High Yield Securities | X | X | X | X | X | X | X | X | X | |||||||||||||
Illinois State-Specific | X | X | X | — | — | — | — | — | — | |||||||||||||
Inflation/Deflation | X | X | X | X | X | X | X | X | X | |||||||||||||
Insurance | X | X | X | X | X | X | X | X | X | |||||||||||||
Interest Rate | X | X | X | X | X | X | X | X | X | |||||||||||||
Issuer | X | X | X | X | X | X | X | X | X | |||||||||||||
Leverage | X | X | X | X | X | X | X | X | X | |||||||||||||
Liquidity | X | X | X | X | X | X | X | X | X | |||||||||||||
Loan Origination | X | X | X | X | X | X | X | X | X | |||||||||||||
Loans and Other Indebtedness; Loan Participations and Assignments | X | X | X | X | X | X | X | X | X | |||||||||||||
Management | X | X | X | X | X | X | X | X | X | |||||||||||||
Market | X | X | X | X | X | X | X | X | X | |||||||||||||
Market Discounts | X | X | X | X | X | X | X | X | X | |||||||||||||
Market Disruptions | X | X | X | X | X | X | X | X | X | |||||||||||||
Mortgage-Related and Other Asset-Backed Securities | X | X | X | X | X | X | X | X | X | |||||||||||||
Municipal Bond Market | X | X | X | X | X | X | X | X | X | |||||||||||||
Municipal Bond | X | X | X | X | X | X | X | X | X | |||||||||||||
Municipal Project-Specific | X | X | X | X | X | X | X | X | X | |||||||||||||
New York State-Specific | X | X | X | — | — | — | X | X | X | |||||||||||||
Non-Diversification | — | — | — | — | — | — | X | — | X | |||||||||||||
Operational | X | X | X | X | X | X | X | X | X | |||||||||||||
Other Investment Companies | X | X | X | X | X | X | X | X | X | |||||||||||||
Portfolio Turnover | X | X | X | X | X | X | X | X | X |
SEMIANNUAL REPORT | | | JUNE 30, 2024 | 79 |
Notes to Financial Statements | (Cont.) |
PIMCO Municipal Income Fund (PMF) | PIMCO Municipal Income Fund II (PML) | PIMCO Municipal Income Fund III (PMX) | PIMCO California Municipal Income Fund (PCQ) | PIMCO California Municipal Income Fund II (PCK) | PIMCO California Municipal Income Fund III (PZC) | PIMCO New York Municipal Income Fund (PNF) | PIMCO New York Municipal Income Fund II (PNI) | PIMCO New York Municipal Income Fund III (PYN) | ||||||||||||||
Potential Conflicts of Interest — Allocation of Investment Opportunities | X | X | X | X | X | X | X | X | X | |||||||||||||
Privacy and Data Security | X | X | X | X | X | X | X | X | X | |||||||||||||
Private Placement and Restricted Securities | X | X | X | X | X | X | X | X | X | |||||||||||||
Puerto Rico-Specific | X | X | X | X | X | X | X | X | X | |||||||||||||
Regulatory Changes | X | X | X | X | X | X | X | X | X | |||||||||||||
Regulatory — LIBOR | X | X | X | X | X | X | X | X | X | |||||||||||||
Reinvestment | X | X | X | X | X | X | X | X | X | |||||||||||||
Repurchase Agreements | X | X | X | X | X | X | X | X | X | |||||||||||||
Securities Lending | X | X | X | X | X | X | X | X | X | |||||||||||||
Short Exposure | X | X | X | X | X | X | X | X | X | |||||||||||||
Structured Investments | X | X | X | X | X | X | X | X | X | |||||||||||||
Tax | X | X | X | X | X | X | X | X | X | |||||||||||||
U.S. Government Securities | X | X | X | X | X | X | X | X | X | |||||||||||||
Valuation | X | X | X | X | X | X | X | X | X |
80 | PIMCO CLOSED-END FUNDS |
June 30, 2024 | (Unaudited) |
SEMIANNUAL REPORT | | | JUNE 30, 2024 | 81 |
Notes to Financial Statements | (Cont.) |
82 | PIMCO CLOSED-END FUNDS |
June 30, 2024 | (Unaudited) |
SEMIANNUAL REPORT | | | JUNE 30, 2024 | 83 |
Notes to Financial Statements | (Cont.) |
84 | PIMCO CLOSED-END FUNDS |
June 30, 2024 | (Unaudited) |
SEMIANNUAL REPORT | | | JUNE 30, 2024 | 85 |
Notes to Financial Statements | (Cont.) |
Fund Name | Annual Rate (1) | |||||||
PIMCO California Municipal Income Fund | 0.705% | |||||||
PIMCO California Municipal Income Fund II | 0.705% | |||||||
PIMCO California Municipal Income Fund III | 0.715% | |||||||
PIMCO New York Municipal Income Fund | 0.770% | |||||||
PIMCO New York Municipal Income Fund II | 0.735% | |||||||
PIMCO New York Municipal Income Fund III | 0.860% | |||||||
PIMCO Municipal Income Fund | 0.705% | |||||||
PIMCO Municipal Income Fund II | 0.685% | |||||||
PIMCO Municipal Income Fund III | 0.705% |
(1) | Management fees calculated based on a Fund’s average daily NAV (including daily net assets attributable to any preferred shares of the Fund that may be outstanding). |
86 | PIMCO CLOSED-END FUNDS |
June 30, 2024 | (Unaudited) |
Fund Name | Purchases | Sales | Realized Gain/Loss | |||||||||||||
PIMCO California Municipal Income Fund | $ | 2,989 | $ | 0 | $ | 0 | ||||||||||
PIMCO California Municipal Income Fund II | 3,141 | 0 | 0 | |||||||||||||
PIMCO California Municipal Income Fund III | 2,624 | 0 | 0 | |||||||||||||
PIMCO New York Municipal Income Fund | 766 | 0 | 0 | |||||||||||||
PIMCO New York Municipal Income Fund II | 1,021 | 0 | 0 | |||||||||||||
PIMCO New York Municipal Income Fund III | 511 | 0 | 0 | |||||||||||||
PIMCO Municipal Income Fund | 0 | 3,849 | (24 | ) | ||||||||||||
PIMCO Municipal Income Fund II | 0 | 9,008 | (173 | ) | ||||||||||||
PIMCO Municipal Income Fund III | 0 | 4,079 | (19 | ) |
† | A zero balance may reflect actual amounts rounding to less than one thousand. |
SEMIANNUAL REPORT | | | JUNE 30, 2024 | 87 |
Notes to Financial Statements | (Cont.) |
U.S. Government/Agency | All Other | |||||||||||||||||||
Fund Name | Purchases | Sales | Purchases | Sales | ||||||||||||||||
PIMCO California Municipal Income Fund | $ | 3,720 | $ | 0 | $ | 42,352 | $ | 47,045 | ||||||||||||
PIMCO California Municipal Income Fund II | 3,813 | 0 | 46,468 | 41,743 | ||||||||||||||||
PIMCO California Municipal Income Fund III | 5,076 | 0 | 40,461 | 41,165 | ||||||||||||||||
PIMCO New York Municipal Income Fund | 0 | 0 | 23,649 | 14,068 | ||||||||||||||||
PIMCO New York Municipal Income Fund II | 0 | 0 | 27,257 | 24,445 | ||||||||||||||||
PIMCO New York Municipal Income Fund III | 0 | 0 | 11,550 | 8,808 | ||||||||||||||||
PIMCO Municipal Income Fund | 7,156 | 0 | 40,530 | 62,445 | ||||||||||||||||
PIMCO Municipal Income Fund II | 15,257 | 5,748 | 94,018 | 91,229 | ||||||||||||||||
PIMCO Municipal Income Fund III | 7,440 | 0 | 47,986 | 65,965 |
† | A zero balance may reflect actual amounts rounding to less than one thousand. |
Fund Name | Shares Issued and Outstanding | High | Low | As of June 30, 2024 | ||||||||||||||||
PIMCO California Municipal Income Fund | ||||||||||||||||||||
Series A | 3 | 7.433% | 2.138% | 2.417% | ||||||||||||||||
Series B | 17 | 7.433% | 2.130% | 2.417% | ||||||||||||||||
Series C | 4 | 6.742% | 2.122% | 2.337% | ||||||||||||||||
PIMCO California Municipal Income Fund II | ||||||||||||||||||||
Series A | 9 | 7.433% | 2.138% | 2.417% | ||||||||||||||||
Series B | 8 | 7.433% | 2.134% | 2.417% | ||||||||||||||||
Series C | 6 | 7.433% | 2.130% | 2.417% | ||||||||||||||||
Series D | 5 | 7.433% | 2.122% | 2.417% | ||||||||||||||||
Series E | 31 | 6.742% | 2.122% | 2.337% | ||||||||||||||||
PIMCO California Municipal Income Fund III | ||||||||||||||||||||
Series A | 7 | 7.433% | 2.134% | 2.417% | ||||||||||||||||
Series B | 38 | 7.433% | 2.122% | 2.417% | ||||||||||||||||
PIMCO New York Municipal Income Fund | ||||||||||||||||||||
Series A | 19 | 7.433% | 2.134% | 2.417% | ||||||||||||||||
PIMCO New York Municipal Income Fund II | ||||||||||||||||||||
Series A | 16 | 7.433% | 5.845% | 6.647% | ||||||||||||||||
Series B | 6 | 6.742% | 2.122% | 2.337% | ||||||||||||||||
PIMCO New York Municipal Income Fund III | ||||||||||||||||||||
Series A | 3 | 7.433% | 2.138% | 2.417% | ||||||||||||||||
PIMCO Municipal Income Fund | ||||||||||||||||||||
Series A | 13 | 7.433% | 5.834% | 6.647% | ||||||||||||||||
Series B | 13 | 7.433% | 2.134% | 2.417% | ||||||||||||||||
Series C | 37 | 7.433% | 2.130% | 2.417% | ||||||||||||||||
Series D | 22 | 7.433% | 2.122% | 2.417% | ||||||||||||||||
Series E | 15 | 6.742% | 2.122% | 2.337% | ||||||||||||||||
PIMCO Municipal Income Fund II | ||||||||||||||||||||
Series A | 31 | 7.433% | 2.138% | 2.417% | ||||||||||||||||
Series B | 49 | 7.433% | 2.134% | 2.417% | ||||||||||||||||
Series C | 44 | 7.433% | 2.130% | 2.417% | ||||||||||||||||
Series D | 55 | 7.433% | 2.122% | 2.417% | ||||||||||||||||
Series E | 78 | 6.742% | 2.122% | 2.337% |
88 | PIMCO CLOSED-END FUNDS |
June 30, 2024 | (Unaudited) |
Fund Name | Shares Issued and Outstanding | High | Low | As of June 30, 2024 | ||||||||||||||||
PIMCO Municipal Income Fund III | ||||||||||||||||||||
Series A | 6 | 7.433% | 2.138% | 2.417% | ||||||||||||||||
Series B | 10 | 7.433% | 2.134% | 2.417% | ||||||||||||||||
Series C | 20 | 7.433% | 5.845% | 6.647% | ||||||||||||||||
Series D | 6 | 7.433% | 5.834% | 6.647% | ||||||||||||||||
Series E | 5 | 6.742% | 5.834% | 6.427% |
Applicable % | Reference Rate | Maximum Rate | ||||||||||||
The higher of 30-day “AA” Financial Composite Commercial Paper Rates | ||||||||||||||
110% 1 | x | OR | = | Maximum Rate for the Funds | ||||||||||
The Taxable Equivalent of the Short-Term Municipal Obligation Rate 2 |
1 | 150% if all or part of the dividend consists of taxable income or capital gain. |
2 | “Taxable Equivalent of the Short-Term Municipal Obligation Rate” means 90% of the quotient of (A) the per annum rate expressed on an interest equivalent basis equal to the S&P 7 Day Index divided by (B) 1.00 minus the Marginal Tax Rate (expressed as a decimal). |
Fund Name | Liquidation Preference Per Share | Tender Offer Price Per Share | Price Percentage | Cash Exchanged for ARPS Tendered | ARPS Outstanding as of 12/31/2023 | ARPS Tendered | ARPS Outstanding After Tender Offer as of 06/30/2024 | |||||||||||||||||||||||
PIMCO California Municipal Income Fund | $ | 25,000 | $ | 24,500 | 98% | $ | 107,114,000 | 4,396 | 4,372 | 24 | ||||||||||||||||||||
PIMCO California Municipal Income Fund II | 25,000 | 24,500 | 98% | 94,472,000 | 3,915 | 3,856 | 59 | |||||||||||||||||||||||
PIMCO California Municipal Income Fund III | 25,000 | 24,500 | 98% | 83,937,000 | 3,471 | 3,426 | 45 | |||||||||||||||||||||||
PIMCO New York Municipal Income Fund | 25,000 | 24,500 | 98% | 32,266,500 | 1,336 | 1,317 | 19 | |||||||||||||||||||||||
PIMCO New York Municipal Income Fund II | 25,000 | 24,500 | 98% | 49,539,000 | 2,044 | 2,022 | 22 | |||||||||||||||||||||||
PIMCO New York Municipal Income Fund III | 25,000 | 24,500 | 98% | 25,431,000 | 1,041 | 1,038 | 3 | |||||||||||||||||||||||
PIMCO Municipal Income Fund | 25,000 | 24,500 | 98% | 139,772,500 | 5,805 | 5,705 | 100 | |||||||||||||||||||||||
PIMCO Municipal Income Fund II | 25,000 | 24,500 | 98% | 228,560,500 | 9,586 | 9,329 | 257 | |||||||||||||||||||||||
PIMCO Municipal Income Fund III | 25,000 | 24,500 | 98% | 125,685,000 | 5,177 | 5,130 | 47 |
SEMIANNUAL REPORT | | | JUNE 30, 2024 | 89 |
Notes to Financial Statements | (Cont.) |
Fund Name | RVMTP Shares Outstanding | Interest Expense † | Weighted Average Interest Rate* | |||||||||||||
PIMCO California Municipal Income Fund | ||||||||||||||||
Series 2051 ‡ | 0 | 547 | 5.02% | |||||||||||||
Series 2053 | 102 | 239 | 4.71% | |||||||||||||
Series 2054 | 1,020 | 1,035 | 4.94% | |||||||||||||
Series 2054-A | 244 | 2 | 0.14% | |||||||||||||
PIMCO California Municipal Income Fund II | ||||||||||||||||
Series 2051 ‡ | 0 | 614 | 5.00% | |||||||||||||
Series 2053 | 292 | 669 | 4.59% | |||||||||||||
Series 2054 | 900 | 914 | 4.94% | |||||||||||||
Series 2054-A | 275 | 2 | 0.13% |
90 | PIMCO CLOSED-END FUNDS |
June 30, 2024 | (Unaudited) |
Fund Name | RVMTP Shares Outstanding | Interest Expense † | Weighted Average Interest Rate* | |||||||||||||
PIMCO California Municipal Income Fund III | ||||||||||||||||
Series 2051 ‡ | 0 | 604 | 4.99% | |||||||||||||
Series 2053 | 105 | 246 | 4.70% | |||||||||||||
Series 2054 | 810 | 823 | 4.94% | |||||||||||||
Series 2054-A | 271 | 2 | 0.13% | |||||||||||||
PIMCO New York Municipal Income Fund | ||||||||||||||||
Series 2054 | 410 | 414 | 4.91% | |||||||||||||
PIMCO New York Municipal Income Fund II | ||||||||||||||||
Series 2051 ‡ | 0 | 340 | 5.11% | |||||||||||||
Series 2054 | 500 | 505 | 4.91% | |||||||||||||
Series 2054-A | 149 | 0 | 0.00% | |||||||||||||
PIMCO New York Municipal Income Fund III | ||||||||||||||||
Series 2054 | 260 | 262 | 4.91% | |||||||||||||
PIMCO Municipal Income Fund | ||||||||||||||||
Series 2051 ‡ | 0 | 415 | 5.10% | |||||||||||||
Series 2053 | 204 | 470 | 4.62% | |||||||||||||
Series 2054 | 1,340 | 1,359 | 4.94% | |||||||||||||
Series 2054-A | 182 | 1 | 0.16% | |||||||||||||
PIMCO Municipal Income Fund II | ||||||||||||||||
Series 2051 ‡ | 0 | 1,546 | 5.04% | |||||||||||||
Series 2053 | 555 | 1,264 | 4.57% | |||||||||||||
Series 2054 | 2,530 | 2,565 | 4.93% | |||||||||||||
Series 2054-A | 687 | 3 | 0.09% | |||||||||||||
PIMCO Municipal Income Fund III | ||||||||||||||||
Series 2051 ‡ | 0 | 765 | 5.00% | |||||||||||||
Series 2053 | 239 | 549 | 4.61% | |||||||||||||
Series 2054 | 1,240 | 1,258 | 4.94% | |||||||||||||
Series 2054-A | 343 | 2 | 0.11% |
† | Amounts in thousands. |
* | The rate presented is inclusive of the amortized debt issuance cost. As a result, the rate shown may not fall into the range presented in the table below. |
‡ | Prior to June 12, 2024, the Fund had Series 2051 RVMTP Shares outstanding. |
Fund Name | Shares Issued and Outstanding | High | Low | As of June 30, 2024 | ||||||||||||||||
PIMCO California Municipal Income Fund | ||||||||||||||||||||
Series 2051 † | 0 | 5.47% | 2.82% | 4.59% | ||||||||||||||||
Series 2053 | 102 | 5.50% | 2.85% | 4.83% | ||||||||||||||||
Series 2054 | 1,020 | 5.39% | 5.18% | 5.18% | ||||||||||||||||
Series 2054-A | 244 | 5.29% | 5.08% | 5.08% | ||||||||||||||||
PIMCO California Municipal Income Fund II | ||||||||||||||||||||
Series 2051 † | 0 | 5.47% | 2.82% | 4.59% | ||||||||||||||||
Series 2053 | 292 | 5.50% | 2.85% | 4.83% | ||||||||||||||||
Series 2054 | 900 | 5.39% | 5.18% | 5.18% | ||||||||||||||||
Series 2054-A | 275 | 5.29% | 5.08% | 5.08% | ||||||||||||||||
PIMCO California Municipal Income Fund III | ||||||||||||||||||||
Series 2051 † | 0 | 5.47% | 2.82% | 4.59% | ||||||||||||||||
Series 2053 | 105 | 5.50% | 2.85% | 4.83% | ||||||||||||||||
Series 2054 | 810 | 5.39% | 5.18% | 5.18% | ||||||||||||||||
Series 2054-A | 271 | 5.29% | 5.08% | 5.08% | ||||||||||||||||
PIMCO New York Municipal Income Fund | ||||||||||||||||||||
Series 2054 | 410 | 5.39% | 5.18% | 5.18% |
SEMIANNUAL REPORT | | | JUNE 30, 2024 | 91 |
Notes to Financial Statements | (Cont.) |
Fund Name | Shares Issued and Outstanding | High | Low | As of June 30, 2024 | ||||||||||||||||
PIMCO New York Municipal Income Fund II | ||||||||||||||||||||
Series 2051 † | 0 | 5.47% | 2.82% | 4.59% | ||||||||||||||||
Series 2054 | 500 | 5.39% | 5.18% | 5.18% | ||||||||||||||||
Series 2054-A | 149 | 5.29% | 5.08% | 5.08% | ||||||||||||||||
PIMCO New York Municipal Income Fund III | ||||||||||||||||||||
Series 2054 | 260 | 5.39% | 5.18% | 5.18% | ||||||||||||||||
PIMCO Municipal Income Fund | ||||||||||||||||||||
Series 2051 † | 0 | 5.47% | 2.82% | 4.59% | ||||||||||||||||
Series 2053 | 204 | 5.50% | 2.85% | 4.83% | ||||||||||||||||
Series 2054 | 1,340 | 5.39% | 5.18% | 5.18% | ||||||||||||||||
Series 2054-A | 182 | 5.44% | 5.23% | 5.23% | ||||||||||||||||
PIMCO Municipal Income Fund II | ||||||||||||||||||||
Series 2051 † | 0 | 5.47% | 2.82% | 4.59% | ||||||||||||||||
Series 2053 | 555 | 5.50% | 2.85% | 4.83% | ||||||||||||||||
Series 2054 | 2,530 | 5.39% | 5.18% | 5.18% | ||||||||||||||||
Series 2054-A | 687 | 5.44% | 5.23% | 5.23% | ||||||||||||||||
PIMCO Municipal Income Fund III | ||||||||||||||||||||
Series 2051 † | 0 | 5.47% | 2.82% | 4.59% | ||||||||||||||||
Series 2053 | 239 | 5.50% | 2.85% | 4.83% | ||||||||||||||||
Series 2054 | 1,240 | 5.39% | 5.18% | 5.18% | ||||||||||||||||
Series 2054-A | 343 | 5.44% | 5.23% | 5.23% |
† | Prior to June 12, 2024, the Fund had Series 2051 RVMTP Shares outstanding. |
92 | PIMCO CLOSED-END FUNDS |
June 30, 2024 | (Unaudited) |
Dividend Rate | Rate Period Fraction | Liquidation Preference | Dividend | |||||||||||||||||
Number of days in the Rate Period (or a part thereof) | ||||||||||||||||||||
Dividend Rate | x | Divided by | X | 100,000 | = | Dividends per RVMTP Share | ||||||||||||||
Total number of days in the year |
1 | The Index Rate is determined by reference to a weekly, high-grade index comprised of seven-day, tax-exempt variable rate demand notes, generally the Securities Industry and Financial Markets Association Municipal Swap Index. |
2 | The Applicable Spread for a Rate Period is a percentage per year that is based on the long-term rating most recently assigned by the applicable ratings agency to the RVMTP Shares. |
3 | For the Series 2053 RVMTP Shares (A) in connection with a failed remarketing related to an Early Term Redemption, the Failed Remarketing Spread is (i) 0.75% for the first 59 days following the applicable Early Term Redemption Date, (ii) 1.00% for the 60th to the 89th day following such Early Term Redemption Date, (iii) 1.25% for the 90th to the 119th day following such Early Term Redemption Date, (iv) 1.50% for the 120th to the 149th day following such Early Term Redemption Date, and (v) 1.75% for the 150th day following such |
SEMIANNUAL REPORT | | | JUNE 30, 2024 | 93 |
Notes to Financial Statements | (Cont.) |
Early Term Redemption Date to the date of the associated mandatory redemption of the RVMTP Shares; and (B) in connection with a failed remarketing related to a Special Terms Period (each a “Failed Special Terms Period Remarketing”), the Failed Remarketing Spread means (i) for so long as two or more Failed Special Terms Period Remarketings have not occurred, 0.05%, and (ii) following the second occurrence of a Failed Special Terms Period Remarketing, 0.10% multiplied by the number of Failed Special Terms Period Remarketings that have occurred after the first Failed Special Terms Period Remarketing. For the Series 2054 RVMTP Shares, the Failed Remarketing Spread is (i) for so long as two or more failed remarketings have not occurred, 0%, and (ii) following the second occurrence of a failed remarketing, 0.15% multiplied by the number of failed remarketings that have occurred after the first failed remarketing. For the Series 2054-A RVMTP Shares, the Failed Remarketing Spread is (i) for so long as two or more failed remarketings have not occurred, 0%, and (ii) following the second occurrence of a failed remarketing, 0.25% multiplied by the number of failed remarketings that have occurred after the first failed remarketing. |
4 | The Applicable Multiplier for a Rate Period is a percentage that is based on the long-term rating most recently assigned by the applicable ratings agency to the RVMTP Shares. |
5 | For each series of RVMTP Shares, an increased RVMTP Share Dividend Rate could be triggered by the Fund’s failure to comply with certain requirements relating to such series of RVMTP Shares, certain actions taken by the applicable ratings agency or certain determinations regarding the tax status of such series of RVMTP Shares made by a court or other applicable governmental authority. The Dividend Rate will in no event exceed 15% per year. |
Fund name | Subsidiary | Date of Formation | Subsidiary % of Consolidated Fund Net Assets † | |||||||||||||
PIMCO Municipal Income Fund | 1800 SPV I LLC | 06/29/2023 | 0.5% | |||||||||||||
PIMCO Municipal Income Fund II | 1860 SPV I LLC | 06/29/2023 | 0.5% | |||||||||||||
PIMCO Municipal Income Fund III | 1830 SPV I LLC | 06/29/2023 | 0.5% |
† | A zero balance may reflect actual amounts rounding to less than one thousand. |
94 | PIMCO CLOSED-END FUNDS |
June 30, 2024 | (Unaudited) |
Short-Term | Long-Term | |||||||||||
PIMCO California Municipal Income Fund | $ | 9,045 | $ | 11,491 | ||||||||
PIMCO California Municipal Income Fund II | 10,028 | 11,823 | ||||||||||
PIMCO California Municipal Income Fund III | 7,934 | 9,743 | ||||||||||
PIMCO New York Municipal Income Fund | 2,181 | 8,204 | ||||||||||
PIMCO New York Municipal Income Fund II | 5,293 | 9,532 | ||||||||||
PIMCO New York Municipal Income Fund III | 1,073 | 4,606 | ||||||||||
PIMCO Municipal Income Fund | 12,755 | 21,877 | ||||||||||
PIMCO Municipal Income Fund II | 31,764 | 57,665 | ||||||||||
PIMCO Municipal Income Fund III | 12,755 | 29,625 |
† | A zero balance may reflect actual amounts rounding to less than one thousand. |
Federal Tax Cost | Unrealized Appreciation | Unrealized (Depreciation) | Net Unrealized Appreciation/ (Depreciation) (1) | |||||||||||||||||
PIMCO California Municipal Income Fund | $ | 334,771 | $ | 7,358 | $ | (5,825 | ) | $ | 1,533 | |||||||||||
PIMCO California Municipal Income Fund II | 357,083 | 13,903 | (6,404 | ) | 7,499 | |||||||||||||||
PIMCO California Municipal Income Fund III | 296,208 | 6,072 | (5,346 | ) | 726 | |||||||||||||||
PIMCO New York Municipal Income Fund | 110,633 | 2,354 | (2,989 | ) | (635 | ) | ||||||||||||||
PIMCO New York Municipal Income Fund II | 159,461 | 4,087 | (4,158 | ) | (71 | ) | ||||||||||||||
PIMCO New York Municipal Income Fund III | 64,114 | 1,932 | (1,539 | ) | 393 | |||||||||||||||
PIMCO Municipal Income Fund | 425,546 | 14,987 | (17,055 | ) | (2,068 | ) | ||||||||||||||
PIMCO Municipal Income Fund II | 970,134 | 32,926 | (28,272 | ) | 4,654 | |||||||||||||||
PIMCO Municipal Income Fund III | 452,609 | 16,068 | (14,624 | ) | 1,444 |
† | A zero balance may reflect actual amounts rounding to less than one thousand. |
(1) | Primary differences, if any, between book and tax net unrealized appreciation/(depreciation) are attributable to wash sale loss deferrals for federal income tax purposes. |
PIMCO California Municipal Income Fund | $ | 0.036000 per common share | ||||||
PIMCO California Municipal Income Fund II | $ | 0.021500 per common share | ||||||
PIMCO California Municipal Income Fund III | $ | 0.029500 per common share | ||||||
PIMCO New York Municipal Income Fund | $ | 0.033500 per common share | ||||||
PIMCO New York Municipal Income Fund II | $ | 0.029500 per common share | ||||||
PIMCO New York Municipal Income Fund III | $ | 0.024800 per common share | ||||||
PIMCO Municipal Income Fund | $ | 0.042000 per common share | ||||||
PIMCO Municipal Income Fund II | $ | 0.039500 per common share | ||||||
PIMCO Municipal Income Fund III | $ | 0.033000 per common share |
SEMIANNUAL REPORT | | | JUNE 30, 2024 | 95 |
Glossary: | (abbreviations that may be used in the preceding statements) | (Unaudited) |
Counterparty Abbreviations: | ||||||||||
FICC | Fixed Income Clearing Corporation | |||||||||
Currency Abbreviations: | ||||||||||
USD (or $) | United States Dollar | |||||||||
Municipal Bond or Agency Abbreviations: | ||||||||||
AGM | Assured Guaranty Municipal | CR | Custodial Receipts | GNMA | Government National Mortgage Association | |||||
AMBAC | American Municipal Bond Assurance Corp. | FHA | Federal Housing Administration | NPFGC | National Public Finance Guarantee Corp. | |||||
BAM | Build America Mutual Assurance | FHLMC | Federal Home Loan Mortgage Corp. | PSF | Public School Fund | |||||
CM | California Mortgage Insurance | FNMA | Federal National Mortgage Association | Q-SBLF | Qualified School Bond Loan Fund | |||||
Other Abbreviations: | ||||||||||
TBA | To-Be-Announced | TBD | To-Be-Determined | TBD% | Interest rate to be determined when loan settles or at the time of funding |
96 | PIMCO CLOSED-END FUNDS |
Distribution Information | (Unaudited) |
Municipal Income Fund | Net Investment Income* | Net Realized Capital Gains* | Paid-in Surplus or Other Capital Sources** | Total (per common share) | ||||||||||||||||
January 2024 | $ | 0.0211 | $ | 0.0000 | $ | 0.0209 | $ | 0.0420 | ||||||||||||
February 2024 | $ | 0.0220 | $ | 0.0000 | $ | 0.0200 | $ | 0.0420 | ||||||||||||
March 2024 | $ | 0.0207 | $ | 0.0000 | $ | 0.0213 | $ | 0.0420 | ||||||||||||
April 2024 | $ | 0.0277 | $ | 0.0000 | $ | 0.0143 | $ | 0.0420 | ||||||||||||
May 2024 | $ | 0.0290 | $ | 0.0000 | $ | 0.0130 | $ | 0.0420 | ||||||||||||
June 2024 | $ | 0.0244 | $ | 0.0000 | $ | 0.0176 | $ | 0.0420 | ||||||||||||
Municipal Income Fund II | Net Investment Income* | Net Realized Capital Gains* | Paid-in Surplus orOther Capital Sources** | Total (per common share) | ||||||||||||||||
January 2024 | $ | 0.0230 | $ | 0.0000 | $ | 0.0165 | $ | 0.0395 | ||||||||||||
February 2024 | $ | 0.0245 | $ | 0.0000 | $ | 0.0150 | $ | 0.0395 | ||||||||||||
March 2024 | $ | 0.0210 | $ | 0.0000 | $ | 0.0185 | $ | 0.0395 | ||||||||||||
April 2024 | $ | 0.0256 | $ | 0.0000 | $ | 0.0139 | $ | 0.0395 | ||||||||||||
May 2024 | $ | 0.0269 | $ | 0.0000 | $ | 0.0126 | $ | 0.0395 | ||||||||||||
June 2024 | $ | 0.0232 | $ | 0.0000 | $ | 0.0163 | $ | 0.0395 | ||||||||||||
Municipal Income Fund III | Net Investment Income* | Net Realized Capital Gains* | Paid-in Surplus orOther Capital Sources** | Total (per common share) | ||||||||||||||||
January 2024 | $ | 0.0197 | $ | 0.0000 | $ | 0.0133 | $ | 0.0330 | ||||||||||||
February 2024 | $ | 0.0209 | $ | 0.0000 | $ | 0.0121 | $ | 0.0330 | ||||||||||||
March 2024 | $ | 0.0199 | $ | 0.0000 | $ | 0.0131 | $ | 0.0330 | ||||||||||||
April 2024 | $ | 0.0246 | $ | 0.0000 | $ | 0.0084 | $ | 0.0330 | ||||||||||||
May 2024 | $ | 0.0252 | $ | 0.0000 | $ | 0.0078 | $ | 0.0330 | ||||||||||||
June 2024 | $ | 0.0217 | $ | 0.0000 | $ | 0.0113 | $ | 0.0330 | ||||||||||||
California Municipal Income Fund | Net Investment Income* | Net Realized Capital Gains* | Paid-in Surplus orOther Capital Sources** | Total (per common share) | ||||||||||||||||
January 2024 | $ | 0.0156 | $ | 0.0000 | $ | 0.0204 | $ | 0.0360 | ||||||||||||
February 2024 | $ | 0.0185 | $ | 0.0000 | $ | 0.0175 | $ | 0.0360 | ||||||||||||
March 2024 | $ | 0.0158 | $ | 0.0000 | $ | 0.0202 | $ | 0.0360 | ||||||||||||
April 2024 | $ | 0.0254 | $ | 0.0000 | $ | 0.0106 | $ | 0.0360 | ||||||||||||
May 2024 | $ | 0.0255 | $ | 0.0000 | $ | 0.0105 | $ | 0.0360 | ||||||||||||
June 2024 | $ | 0.0219 | $ | 0.0000 | $ | 0.0141 | $ | 0.0360 | ||||||||||||
California Municipal Income Fund II | Net Investment Income* | Net Realized Capital Gains* | Paid-in Surplus orOther Capital Sources** | Total (per common share) | ||||||||||||||||
January 2024 | $ | 0.0109 | $ | 0.0000 | $ | 0.0106 | $ | 0.0215 | ||||||||||||
February 2024 | $ | 0.0124 | $ | 0.0000 | $ | 0.0091 | $ | 0.0215 | ||||||||||||
March 2024 | $ | 0.0105 | $ | 0.0000 | $ | 0.0110 | $ | 0.0215 | ||||||||||||
April 2024 | $ | 0.0168 | $ | 0.0000 | $ | 0.0047 | $ | 0.0215 | ||||||||||||
May 2024 | $ | 0.0162 | $ | 0.0000 | $ | 0.0053 | $ | 0.0215 | ||||||||||||
June 2024 | $ | 0.0146 | $ | 0.0000 | $ | 0.0069 | $ | 0.0215 |
SEMIANNUAL REPORT | | | JUNE 30, 2024 | 97 |
Distribution Information | (Cont.) | (Unaudited) |
California Municipal Income Fund III | Net Investment Income* | Net Realized Capital Gains* | Paid-in Surplus or Other Capital Sources** | Total (per common share) | ||||||||||||||||
January 2024 | $ | 0.0121 | $ | 0.0000 | $ | 0.0174 | $ | 0.0295 | ||||||||||||
February 2024 | $ | 0.0140 | $ | 0.0000 | $ | 0.0155 | $ | 0.0295 | ||||||||||||
March 2024 | $ | 0.0133 | $ | 0.0000 | $ | 0.0162 | $ | 0.0295 | ||||||||||||
April 2024 | $ | 0.0189 | $ | 0.0000 | $ | 0.0106 | $ | 0.0295 | ||||||||||||
May 2024 | $ | 0.0189 | $ | 0.0000 | $ | 0.0106 | $ | 0.0295 | ||||||||||||
June 2024 | $ | 0.0162 | $ | 0.0000 | $ | 0.0133 | $ | 0.0295 | ||||||||||||
New York Municipal Income Fund | Net Investment Income* | Net Realized Capital Gains* | Paid-in Surplus orOther Capital Sources** | Total (per common share) | ||||||||||||||||
January 2024 | $ | 0.0163 | $ | 0.0000 | $ | 0.0172 | $ | 0.0335 | ||||||||||||
February 2024 | $ | 0.0177 | $ | 0.0000 | $ | 0.0158 | $ | 0.0335 | ||||||||||||
March 2024 | $ | 0.0160 | $ | 0.0000 | $ | 0.0175 | $ | 0.0335 | ||||||||||||
April 2024 | $ | 0.0221 | $ | 0.0000 | $ | 0.0114 | $ | 0.0335 | ||||||||||||
May 2024 | $ | 0.0212 | $ | 0.0000 | $ | 0.0123 | $ | 0.0335 | ||||||||||||
June 2024 | $ | 0.0179 | $ | 0.0000 | $ | 0.0156 | $ | 0.0335 | ||||||||||||
New York Municipal Income Fund II | Net Investment Income* | Net Realized Capital Gains* | Paid-in Surplus orOther Capital Sources** | Total (per common share) | ||||||||||||||||
January 2024 | $ | 0.0146 | $ | 0.0000 | $ | 0.0149 | $ | 0.0295 | ||||||||||||
February 2024 | $ | 0.0164 | $ | 0.0000 | $ | 0.0131 | $ | 0.0295 | ||||||||||||
March 2024 | $ | 0.0123 | $ | 0.0000 | $ | 0.0172 | $ | 0.0295 | ||||||||||||
April 2024 | $ | 0.0225 | $ | 0.0000 | $ | 0.0070 | $ | 0.0295 | ||||||||||||
May 2024 | $ | 0.0211 | $ | 0.0000 | $ | 0.0084 | $ | 0.0295 | ||||||||||||
June 2024 | $ | 0.0181 | $ | 0.0000 | $ | 0.0114 | $ | 0.0295 | ||||||||||||
New York Municipal Income Fund III | Net Investment Income* | Net Realized Capital Gains* | Paid-in Surplus orOther Capital Sources** | Total (per common share) | ||||||||||||||||
January 2024 | $ | 0.0090 | $ | 0.0000 | $ | 0.0158 | $ | 0.0248 | ||||||||||||
February 2024 | $ | 0.0109 | $ | 0.0000 | $ | 0.0139 | $ | 0.0248 | ||||||||||||
March 2024 | $ | 0.0102 | $ | 0.0000 | $ | 0.0146 | $ | 0.0248 | ||||||||||||
April 2024 | $ | 0.0179 | $ | 0.0000 | $ | 0.0069 | $ | 0.0248 | ||||||||||||
May 2024 | $ | 0.0168 | $ | 0.0000 | $ | 0.0080 | $ | 0.0248 | ||||||||||||
June 2024 | $ | 0.0128 | $ | 0.0000 | $ | 0.0120 | $ | 0.0248 |
* | The source of dividends provided in the table differs, in some respects, from information presented in this report prepared in accordance with generally accepted accounting principles, or U.S. GAAP. For example, net earnings from certain interest rate swap contracts are included as a source of net investment income for purposes of Section 19(a). Accordingly, the information in the table may differ from information in the accompanying financial statements that are presented on the basis of U.S. GAAP and may differ from tax information presented in the footnotes. Amounts shown may include accumulated, as well as fiscal period net income and net profits. |
** | Occurs when a fund distributes an amount greater than its accumulated net income and net profits. Amounts are not reflective of a fund’s net income, yield, earnings or investment performance. |
98 | PIMCO CLOSED-END FUNDS |
Changes to Board of Trustees | (Unaudited) |
SEMIANNUAL REPORT | | | JUNE 30, 2024 | 99 |
Approval of Investment Management Agreements |
100 | PIMCO CLOSED-END FUNDS |
(Unaudited) |
SEMIANNUAL REPORT | | | JUNE 30, 2024 | 101 |
Approval of Investment Management Agreements | (Cont.) |
102 | PIMCO CLOSED-END FUNDS |
(Unaudited) |
SEMIANNUAL REPORT | | | JUNE 30, 2024 | 103 |
Approval of Investment Management Agreements | (Cont.) |
104 | PIMCO CLOSED-END FUNDS |
(Unaudited) |
SEMIANNUAL REPORT | | | JUNE 30, 2024 | 105 |
Approval of Investment Management Agreements | (Cont.) | (Unaudited) |
106 | PIMCO CLOSED-END FUNDS |
Item 2. | Code of Ethics. |
The information required by this Item 2 is only required in an annual report on Form N-CSR.
Item 3. | Audit Committee Financial Expert. |
The information required by this Item 3 is only required in an annual report on Form N-CSR.
Item 4. | Principal Accountant Fees and Services. |
The information required by this Item 4 is only required in an annual report on Form N-CSR.
Item 5. | Audit Committee of Listed Registrants. |
The information required by this Item 5 is only required in an annual report on Form N-CSR.
Item 6. | Schedule of Investments. |
The information required by this Item 6 is included as part of the semiannual report to shareholders filed under Item 1 of this Form N-CSRS.
Item 7. | Financial Statements and Financial Highlights for Open-End Management Investment Companies. |
(a) | Not applicable to closed-end investment companies. |
(b) | Not applicable to closed-end investment companies. |
Item 8. | Changes in and Disagreements with Accountant for Open-End Management Investment Companies. |
Not applicable to closed-end investment companies.
Item 9. | Proxy Disclosures for Open-End Management Investment Companies. |
Not applicable to closed-end investment companies.
Item 10. | Remuneration Paid to Directors, Officers, and Others of Open-End Management Investment Companies. |
Not applicable to closed-end investment companies.
Item 11. | Statement Regarding Basis for Approval of Investment Advisory Contract. |
The information required by this Item 11 is included as part of the semiannual report to shareholders filed under Item 1 of this Form N-CSRS.
Item 12. | Disclosure of Proxy Voting Policies and Procedures for Closed-End Management Investment Companies. |
The information required by this Item 12 is only required in an annual report on Form N-CSR.
Item 13. | Portfolio Managers of Closed-End Management Investment Companies. |
(a) | The information required by this Item 13(a) is only required in an annual report on Form N-CSR. |
(b) | There have been no changes in any of the Portfolio Managers identified in the Registrant’s most recent annual report on Form N-CSR. |
Item 14. | Purchases of Equity Securities by Closed-End Management Investment Company and Affiliated Purchasers. |
None.
Item 15. | Submission of Matters to a Vote of Security Holders. |
There have been no material changes to the procedures by which shareholders may recommend nominees to the Fund’s Board of Trustees since the Fund last provided disclosure in response to this item.
Item 16. | Controls and Procedures. |
(a) | The principal executive officer and principal financial & accounting officer have concluded as of a date within 90 days of the filing date of this report, based on their evaluation of the Registrant’s disclosure controls and procedures (as defined in Rule 30a-3(c) under the 1940 Act), that the design of such procedures is effective to provide reasonable assurance that material information required to be disclosed by the Registrant on Form N-CSR is recorded, processed, summarized and reported within the time periods specified in the Commission’s rules and forms. |
(b) | There were no changes in the Registrant’s internal control over financial reporting (as defined in Rule 30a-3(d) under the 1940 Act (17 CFR 270.30a-3(d))) that occurred during the period covered by this report that have materially affected, or are reasonably likely to materially affect, the Registrant’s internal control over financial reporting. |
Item 17. | Disclosure of Securities Lending Activities for Closed-End Management Investment Companies. |
None.
Item 18. | Recovery of Erroneously Awarded Compensation. |
(a) | Not Applicable. |
(b) | Not Applicable. |
Item 19. | Exhibits. |
(a)(1) | Exhibit 99.CODE—Code of Ethics is not applicable for semiannual reports. |
(a)(2) | Exhibit 99.CERT—Certifications pursuant to Section 302 of the Sarbanes-Oxley Act of 2002. |
(a)(3) | None. |
(a)(4) | There was no change in the registrant’s independent public accountant for the period covered by the report. |
(b) | Exhibit 99.906CERT—Certifications pursuant to Section 906 of the Sarbanes-Oxley Act of 2002. |
Signatures
Pursuant to the requirements of the Securities Exchange Act of 1934 and the Investment Company Act of 1940, the registrant has duly caused this report to be signed on its behalf by the undersigned, thereunto duly authorized.
PIMCO New York Municipal Income Fund | ||
By: | /s/ Joshua D. Ratner | |
| ||
Joshua D. Ratner | ||
President (Principal Executive Officer) | ||
Date: | September 4, 2024 |
Pursuant to the requirements of the Securities Exchange Act of 1934 and the Investment Company Act of 1940, this report has been signed below by the following persons on behalf of the registrant and in the capacities and on the dates indicated.
By: | /s/ Joshua D. Ratner | |
| ||
Joshua D. Ratner | ||
President (Principal Executive Officer) | ||
Date: | September 4, 2024 | |
By: | /s/ Bijal Y. Parikh | |
| ||
Bijal Y. Parikh | ||
Treasurer (Principal Financial & Accounting Officer) | ||
Date: | September 4, 2024 |