
| Page | ||||||||
| 2 | ||||||||
| 3 | ||||||||
| 18 | ||||||||
| 20 | ||||||||
| 26 | ||||||||
| 28 | ||||||||
| 30 | ||||||||
| 33 | ||||||||
| 73 | ||||||||
| 95 | ||||||||
| 96 | ||||||||
| 97 | ||||||||
| 98 | ||||||||
| 100 | ||||||||
| 103 | ||||||||
| 104 | ||||||||
| 106 | ||||||||
| 107 | ||||||||
| 111 | ||||||||
| 134 | ||||||||
| 135 | ||||||||
| 136 | ||||||||
| 142 | ||||||||
| 145 | ||||||||
| Fund | Fund Summary | Schedule of Investments | ||||||
| 7 | 35 | |||||||
| 8 | 40 | |||||||
| 11 | 46 | |||||||
| 12 | 52 | |||||||
| 13 | 56 | |||||||
| 14 | 60 | |||||||
| 15 | 64 | |||||||
| 16 | 67 | |||||||
| 17 | 70 | |||||||
 |  | |
 |  | |
| Deborah A. DeCotis | Eric D. Johnson | |
| Chair of the Board of Trustees | President | |
| 2 | PIMCO CLOSED‑END FUNDS |
| Important Information About the Funds |
| ANNUAL REPORT | | | DECEMBER 31, 2022 | 3 |
| Important Information About the Funds | (Cont.) |
| 4 | PIMCO CLOSED-END FUNDS |
| Fund Name | Inception Date | Diversification Status | ||||||||
| PIMCO Municipal Income Fund | 06/29/01 | Diversified | ||||||||
| PIMCO Municipal Income Fund II | 06/28/02 | Diversified | ||||||||
| PIMCO Municipal Income Fund III | 10/31/02 | Diversified | ||||||||
| PIMCO California Municipal Income Fund | 06/29/01 | Diversified | ||||||||
| PIMCO California Municipal Income Fund II | 06/28/02 | Diversified | ||||||||
| PIMCO California Municipal Income Fund III | 10/31/02 | Diversified | ||||||||
| PIMCO New York Municipal Income Fund | 06/29/01 | Non‑diversified | ||||||||
| PIMCO New York Municipal Income Fund II | 06/28/02 | Diversified | ||||||||
| PIMCO New York Municipal Income Fund III | 10/31/02 | Non-diversified | ||||||||
| ANNUAL REPORT | | | DECEMBER 31, 2022 | 5 |
| Important Information About the Funds | (Cont.) |
| 6 | PIMCO CLOSED-END FUNDS |
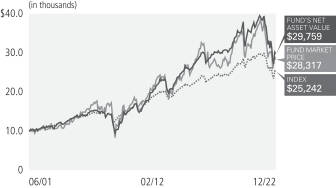
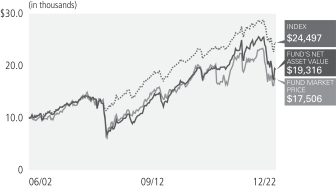
| Symbol on NYSE ‑ PMF |
| Municipal Bonds & Notes | ||||
| Health, Hospital & Nursing Home Revenue | 20.1% | |||
| Ad Valorem Property Tax | 8.3% | |||
| Miscellaneous Revenue | 6.7% | |||
| Sales Tax Revenue | 6.6% | |||
| Highway Revenue Tolls | 6.3% | |||
| Natural Gas Revenue | 6.1% | |||
| Tobacco Settlement Funded | 5.0% | |||
| Industrial Revenue | 4.4% | |||
| Electric Power & Light Revenue | 4.3% | |||
| Sewer Revenue | 3.6% | |||
| Local or Guaranteed Housing | 3.3% | |||
| Water Revenue | 3.0% | |||
| Appropriations | 2.7% | |||
| Port, Airport & Marina Revenue | 2.6% | |||
| Lease (Appropriation) | 1.9% | |||
| Nuclear Revenue | 1.6% | |||
| Income Tax Revenue | 1.3% | |||
| College & University Revenue | 1.3% | |||
| Transit Revenue | 1.2% | |||
| Miscellaneous Taxes | 1.2% | |||
| Fuel Sales Tax Revenue | 1.1% | |||
| Other | 6.7% | |||
| Short-Term Instruments | 0.7% | |||
| † | % of Investments, at value. |
| § | Allocation Breakdown and % of investments exclude securities sold short and financial derivative instruments, if any. |
| Market Price | $10.43 | |||
| NAV | $9.51 | |||
| Premium/(Discount) to NAV | 9.67% | |||
Market Price Distribution Rate(2) | 6.21% | |||
NAV Distribution Rate(2) | 6.81% | |||
Total Effective Leverage(3) | 44.82% | |||
| Average Annual Total Return(1) for the period ended December 31, 2022 | ||||||||||||||||||
| 1 Year | 5 Year | 10 Year | Commencement of Operations (06/29/01) | |||||||||||||||
 | Market Price | (27.24)% | 1.03% | 2.01% | 4.96% | |||||||||||||
 | NAV | (24.19)% | (0.48)% | 2.70% | 5.20% | |||||||||||||
 | Bloomberg Long Municipal Bond Index | (15.58)% | 0.47% | 2.39% | 4.28% | ¨ | ||||||||||||
| (1) | Performance quoted represents past performance. Past performance is not a guarantee or a reliable indicator of future results. Current performance may be lower or higher than performance shown. Investment return and the principal value of an investment will fluctuate. Returns shown do not reflect the deduction of taxes that a shareholder would pay on Fund distributions or the sale of Fund shares. Total return, market price, NAV, market price distribution rate, and NAV distribution rate will fluctuate with changes in market conditions. Performance current to the most recent month‑end is available at www.pimco.com or via (844) 33‑PIMCO. Performance is calculated assuming all dividends and distributions are reinvested at prices obtained under the Fund’s dividend reinvestment plan. Performance does not reflect any brokerage commissions in connection with the purchase or sale of Fund shares. |
| Performance of an index is shown in light of a requirement by the Securities and Exchange Commission that the performance of an appropriate broad-based securities market index be disclosed. However, the Fund is not managed to an index nor should the index be viewed as a “benchmark” for the Fund’s performance. The index is not intended to be indicative of the Fund’s investment strategies, portfolio components or past or future performance. Please see Additional Information Regarding the Funds for a description of the Fund’s principal investment strategies. |
| (2) | Distribution rates are not performance and are calculated by annualizing the most recent distribution per share and dividing by the NAV or Market Price, as applicable, as of the reported date. Distributions may be comprised of ordinary income, net capital gains, and/or a return of capital (“ROC”) of your investment in the Fund. Because the distribution rate may include a ROC, it should not be confused with yield or income. If the Fund estimates that a portion of its distribution may be comprised of amounts from sources other than net investment income in accordance with its policies and good accounting practices, the Fund will notify shareholders of the estimated composition of such distribution through a Section 19 Notice. Please refer to the most recent Section 19 Notice, if applicable, for additional information regarding the estimated composition of distributions. Please visit www.pimco.com for most recent Section 19 Notice, if applicable. Final determination of a distribution’s tax character will be provided to shareholders when such information is available. |
| (3) | Represents total effective leverage outstanding, as a percentage of total managed assets. Total effective leverage consists of preferred shares, reverse repurchase agreements and other borrowings, credit default swap notional and floating rate notes issued in tender option bond transactions, as applicable (collectively “Total Effective Leverage”). The Fund may engage in other transactions not included in Total Effective Leverage disclosed above that may give rise to a form of leverage, including certain derivative transactions. For the purpose of calculating Total Effective Leverage outstanding as a percentage of total managed assets, total managed assets refer to total assets (including assets attributable to Total Effective Leverage that may be outstanding) minus accrued liabilities (other than liabilities representing Total Effective Leverage). |
| » | Security selection within the taxable municipal bonds sector contributed to performance, as select securities posted positive returns. |
| » | Security selection within the resource recovery sector contributed to performance, as a select security posted positive returns. |
| » | There were no other material contributors for this Fund. |
| » | Exposure to the hospitals sector detracted from performance, as the sector posted negative performance. |
| » | Exposure to the special tax sector detracted from performance, as the sector posted negative performance. |
| » | Exposure to the industrial revenue sector detracted from performance, as the sector posted negative performance. |
| ANNUAL REPORT | | | DECEMBER 31, 2022 | 7 |
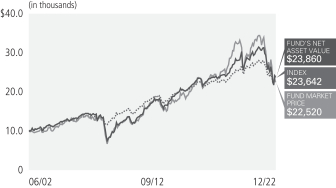
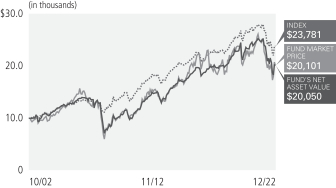
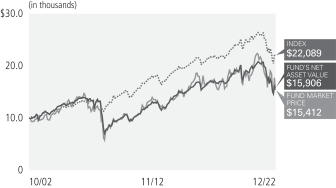
| Symbol on NYSE ‑ PML |
| Municipal Bonds & Notes | ||||
| Health, Hospital & Nursing Home Revenue | 19.2% | |||
| Highway Revenue Tolls | 8.7% | |||
| Ad Valorem Property Tax | 7.0% | |||
| Natural Gas Revenue | 6.6% | |||
| Sales Tax Revenue | 5.8% | |||
| Tobacco Settlement Funded | 5.1% | |||
| Industrial Revenue | 4.5% | |||
| Miscellaneous Revenue | 4.3% | |||
| Sewer Revenue | 4.2% | |||
| Water Revenue | 3.7% | |||
| Port, Airport & Marina Revenue | 3.4% | |||
| Local or Guaranteed Housing | 3.0% | |||
| Appropriations | 2.8% | |||
| Lease (Appropriation) | 2.5% | |||
| Electric Power & Light Revenue | 2.3% | |||
| College & University Revenue | 1.9% | |||
| Transit Revenue | 1.5% | |||
| Income Tax Revenue | 1.4% | |||
| Miscellaneous Taxes | 1.3% | |||
| Lottery Revenue | 1.2% | |||
| Nuclear Revenue | 1.1% | |||
| Government Fund/Grant Revenue | 1.0% | |||
| Other | 7.4% | |||
| Short-Term Instruments | 0.1% | |||
| † | % of Investments, at value. |
| § | Allocation Breakdown and % of investments exclude securities sold short and financial derivative instruments, if any. |
| Market Price | $9.04 | |||
| NAV | $8.76 | |||
| Premium/(Discount) to NAV | 3.20% | |||
Market Price Distribution Rate(2) | 7.83% | |||
NAV Distribution Rate(2) | 8.08% | |||
Total Effective Leverage(3) | 43.44% | |||
| Average Annual Total Return(1) for the period ended December 31, 2022 | ||||||||||||||||||
| 1 Year | 5 Year | 10 Year | Commencement of Operations (06/28/02) | |||||||||||||||
| Market Price | (33.71)% | (1.69)% | 2.42% | 4.11% | |||||||||||||
| NAV | (23.92)% | (0.16)% | 2.94% | 4.33% | |||||||||||||
| Bloomberg Long Municipal Bond Index | (15.58)% | 0.47% | 2.39% | 4.28% | ¨ | ||||||||||||
| (1) | Performance quoted represents past performance. Past performance is not a guarantee or a reliable indicator of future results. Current performance may be lower or higher than performance shown. Investment return and the principal value of an investment will fluctuate. Returns shown do not reflect the deduction of taxes that a shareholder would pay on Fund distributions or the sale of Fund shares. Total return, market price, NAV, market price distribution rate, and NAV distribution rate will fluctuate with changes in market conditions. Performance current to the most recent month‑end is available at www.pimco.com or via (844) 33‑PIMCO. Performance is calculated assuming all dividends and distributions are reinvested at prices obtained under the Fund’s dividend reinvestment plan. Performance does not reflect any brokerage commissions in connection with the purchase or sale of Fund shares. |
| Performance of an index is shown in light of a requirement by the Securities and Exchange Commission that the performance of an appropriate broad-based securities market index be disclosed. However, the Fund is not managed to an index nor should the index be viewed as a “benchmark” for the Fund’s performance. The index is not intended to be indicative of the Fund’s investment strategies, portfolio components or past or future performance. Please see Additional Information Regarding the Funds for a description of the Fund’s principal investment strategies. |
| (2) | Distribution rates are not performance and are calculated by annualizing the most recent distribution per share and dividing by the NAV or Market Price, as applicable, as of the reported date. Distributions may be comprised of ordinary income, net capital gains, and/or a return of capital (“ROC”) of your investment in the Fund. Because the distribution rate may include a ROC, it should not be confused with yield or income. If the Fund estimates that a portion of its distribution may be comprised of amounts from sources other than net investment income in accordance with its policies and good accounting practices, the Fund will notify shareholders of the estimated composition of such distribution through a Section 19 Notice. Please refer to the most recent Section 19 Notice, if applicable, for additional information regarding the estimated composition of distributions. Please visit www.pimco.com for most recent Section 19 Notice, if applicable. Final determination of a distribution’s tax character will be provided to shareholders when such information is available. |
| (3) | Represents total effective leverage outstanding, as a percentage of total managed assets. Total effective leverage consists of preferred shares, reverse repurchase agreements and other borrowings, credit default swap notional and floating rate notes issued in tender option bond transactions, as applicable (collectively “Total Effective Leverage”). The Fund may engage in other transactions not included in Total Effective Leverage disclosed above that may give rise to a form of leverage, including certain derivative transactions. For the purpose of calculating Total Effective Leverage outstanding as a percentage of total managed assets, total managed assets refer to total assets (including assets attributable to Total Effective Leverage that may be outstanding) minus accrued liabilities (other than liabilities representing Total Effective Leverage). |
| » | Security selection within the taxable municipal bonds sector contributed to performance, as select securities posted positive returns. |
| » | Security selection within the resource recovery sector contributed to performance, as a select security posted positive returns. |
| » | There were no other material contributors for this Fund. |
| » | Exposure to the hospitals sector detracted from performance, as the sector posted negative performance. |
| » | Exposure to the special tax sector detracted from performance, as the sector posted negative performance. |
| » | Exposure to the industrial revenue sector detracted from performance, as the sector posted negative performance. |
| 8 | PIMCO CLOSED-END FUNDS |
| Market and Net Asset Value Information |
| Common share market price(1) | Common share net asset value | Premium (discount) as a % of net asset value | ||||||||||||||||||||||
| Quarter | High | Low | High | Low | High | Low | ||||||||||||||||||
| Quarter ended December 31, 2022 | $ 9.89 | $ 8.58 | $ 9.13 | $ 8.03 | 14.60% | 2.83% | ||||||||||||||||||
| Quarter ended September 30, 2022 | $12.10 | $ 9.53 | $10.12 | $ 8.42 | 20.64% | 12.74% | ||||||||||||||||||
| Quarter ended June 30, 2022 | $11.82 | $10.12 | $10.78 | $ 9.14 | 16.48% | 2.22% | ||||||||||||||||||
| Quarter ended March 31, 2022 | $14.55 | $11.20 | $12.37 | $10.70 | 19.55% | 3.99% | ||||||||||||||||||
| Quarter ended December 31, 2021 | $14.83 | $13.86 | $12.42 | $12.15 | 19.58% | 13.51% | ||||||||||||||||||
| Quarter ended September 30, 2021 | $15.31 | $14.74 | $12.77 | $12.32 | 20.72% | 16.72% | ||||||||||||||||||
| Quarter ended June 30, 2021 | $15.08 | $14.53 | $12.68 | $12.26 | 22.02% | 16.48% | ||||||||||||||||||
| Quarter ended March 31, 2021 | $15.35 | $14.15 | $12.65 | $12.14 | 21.67% | 13.63% | ||||||||||||||||||
| Quarter ended December 31, 2020 | $14.71 | $13.09 | $12.42 | $11.87 | 18.92% | 9.91% | ||||||||||||||||||
| Quarter ended September 30, 2020 | $14.28 | $13.14 | $12.44 | $11.95 | 14.93% | 8.86% | ||||||||||||||||||
| Quarter ended June 30, 2020 | $13.45 | $11.59 | $11.95 | $10.95 | 13.64% | 4.70% | ||||||||||||||||||
| Quarter ended March 31, 2020 | $15.97 | $10.10 | $13.30 | $10.12 | 27.45% | (11.79)% | ||||||||||||||||||
| (1) | Such prices reflect inter-dealer prices, without retail mark-up, mark-down or commission and may not represent actual transactions. |
| ANNUAL REPORT | | | DECEMBER 31, 2022 | 9 |
Sales load (as a percentage of offering price)(1) | [ ]% | |||||||
Offering Expenses Borne by Common Shareholders (as a percentage of offering price)(2) | [ ]% | |||||||
Dividend Reinvestment Plan Fees(3) | None | |||||||
| (1) | In the event that the Common Shares to which this relates are sold to or through underwriters or dealer managers, a corresponding supplement will disclose the applicable sale load and/or commission. |
| (2) | The related supplement will disclose the estimated amount of offering expense, the offering price and the offering expenses borne by the Fund and indirectly by all of its Common Shareholders as a percentage of the offering price. |
| (3) | You will pay broker chargers if you direct your broker or the plan agent to sell your Common Shares that you acquired pursuant to a dividend reinvestment plan. You may also pay a pro rata share of brokerage commissions incurred in connection with open market purchase pursuant to the Fund’s Dividend Reinvestment Plan. |
| Percentage of Net Assets Attributable to Common Shares (reflecting leverage attributable to Preferred Shares, and tender option bonds) | ||||||||
Management Fees(1) | 1.08% | |||||||
Dividend Cost on Preferred Shares(2) | 3.33% | |||||||
Interest Payments on Borrowed Funds(3) | 0.34% | |||||||
Other Expenses(4) | 0.06% | |||||||
Total Annual Fund Operating Expenses(5) | 4.81% | |||||||
| (1) | Management fees include fees payable to the Investment Manager for advisory services and for supervisory, administrative and other services. The Fund pays for the advisory, supervisory and administrative services it requires under what is essentially an all‑in fee structure. Pursuant to an investment management agreement, PIMCO is paid a Management Fee of 0.685% of the Fund’s average daily net assets (including daily net assets attributable to any preferred shares of the Fund that may be |
| outstanding). The Fund (and not PIMCO) will be responsible for certain fees and expenses which are, reflected in the table above, that are not covered by the management fee under the investment management agreement. Please see Note 9, Fees and Expenses in the Notes to Financial Statements for an explanation of the management fee. |
| (2) | “Dividends and Other Costs on Preferred Shares” reflects the Fund’s outstanding ARPS and RVMTP averaged over the year ended December 31, 2022 which represented 25.54% and 5.88%, respectively of the Fund’s total average managed assets (including the liquidation preference of outstanding Preferred Shares and assets attributable to tender option bond) at an annual dividend cost of 6.01% for ARPS and 4.58% for RVMTP as of December 31, 2022, and including the amortization of Preferred Share offering costs of $37,515 over the three-year term of the Preferred Shares). The actual dividend rate paid on the PreferredShares will vary over time in accordance with variations in market interest rates. See “Use of Leverage” and “Description of Capital Structure.” Dividend and Other Costs on Preferred Shares are borne directly by the Fund and reflected in the Fund’s financial statement; however, the information presented in the table will differ from that presented in the Fund’s Financial Highlights. |
| (3) | “Interest Payments on Borrowed Funds” reflects the Fund’s use of leverage in the form of tender option bonds averaged over the year ended December 31, 2022, which represented 14.50% of the Fund’s total managed assets, at an annual interest rate cost to the Fund of 1.43%, as of December 31, 2022. The actual amount of borrowing expenses borne by the Fund will vary over time in accordance with the level of the Fund’s use of tender option bonds and/or other forms of borrowings and variations in market interest rates. Borrowing expense is required to be treated as an expense of the Fund for accounting purposes. Any associated income or gains (or losses) realized from leverage obtained through such instruments is not reflected in the Annual Expenses table above, but would be reflected in the Fund’s performance results. |
| (4) | Other expenses are estimated for the Fund’s fiscal year ending December 31, 2023. |
| (5) | “Dividend Cost on Preferred Shares”, including distributions on Preferred Shares, and “Interest Payments on Borrowed Funds” are borne by the Fund separately from management fees paid to PIMCO. Excluding these expenses, Total Annual Fund Operating Expenses are 1.14%. |
| 1 Year | 3 Years | 5 Years | 10 Years | |||||||||||||||||
| Total Expenses Incurred | $ | 48 | $ | 145 | $ | 242 | $ | 486 | ||||||||||||
| (1) | The example above should not be considered a representation of future expenses. Actual expenses may be higher or lower than those shown. The example assumes that the estimated Interest Payments on Borrowed Funds, Dividend Cost on Preferred Shares and Other Expenses set forth in the Annual Fund Operating Expenses table are accurate, that the rate listed under Total Annual Fund Operating Expenses remains the same each year and that all dividends and distributions are reinvested at NAV. Actual expenses may be greater or less than those assumed. Moreover, the Fund’s actual rate of return may be greater or less than the hypothetical 5% annual return shown in the example. The example does not include commissions or estimated offering expenses, which would cause the expenses shown in the example to increase. In connection with an offering of common shares, the applicable prospectus supplement will set forth an example including sales load and estimated offering costs. |
| 10 | PIMCO CLOSED-END FUNDS |
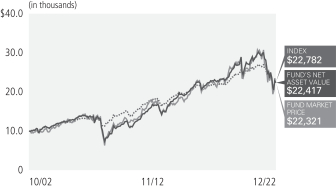
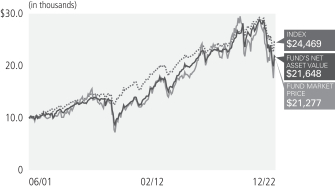
| Symbol on NYSE ‑ PMX |
| Municipal Bonds & Notes | ||||
| Health, Hospital & Nursing Home Revenue | 18.1% | |||
| Sales Tax Revenue | 6.9% | |||
| Ad Valorem Property Tax | 6.5% | |||
| Natural Gas Revenue | 6.0% | |||
| Local or Guaranteed Housing | 5.9% | |||
| Highway Revenue Tolls | 5.4% | |||
| Water Revenue | 5.2% | |||
| Electric Power & Light Revenue | 4.5% | |||
| Sewer Revenue | 4.4% | |||
| Industrial Revenue | 4.0% | |||
| Miscellaneous Revenue | 3.9% | |||
| Port, Airport & Marina Revenue | 3.5% | |||
| Tobacco Settlement Funded | 3.4% | |||
| Appropriations | 3.4% | |||
| College & University Revenue | 1.9% | |||
| Fuel Sales Tax Revenue | 1.7% | |||
| Lease (Appropriation) | 1.7% | |||
| Nuclear Revenue | 1.4% | |||
| Transit Revenue | 1.4% | |||
| General Fund | 1.4% | |||
| Miscellaneous Taxes | 1.1% | |||
| Income Tax Revenue | 1.1% | |||
| Other | 6.7% | |||
| Short-Term Instruments | 0.5% | |||
| † | % of Investments, at value. |
| § | Allocation Breakdown and % of investments exclude securities sold short and financial derivative instruments, if any. |
| Market Price | $8.71 | |||
| NAV | $8.02 | |||
| Premium/(Discount) to NAV | 8.60% | |||
Market Price Distribution Rate(2) | 6.34% | |||
NAV Distribution Rate(2) | 6.88% | |||
Total Effective Leverage(3) | 44.16% | |||
| Average Annual Total Return(1) for the period ended December 31, 2022 | ||||||||||||||||||
| 1 Year | 5 Year | 10 Year | Commencement of Operations (10/31/02) | |||||||||||||||
| Market Price | (27.40)% | (0.04)% | 2.83% | 4.06% | |||||||||||||
| NAV | (25.29)% | (0.63)% | 3.10% | 4.08% | |||||||||||||
| Bloomberg Long Municipal Bond Index | (15.58)% | 0.47% | 2.39% | 4.16% | |||||||||||||
| (1) | Performance quoted represents past performance. Past performance is not a guarantee or a reliable indicator of future results. Current performance may be lower or higher than performance shown. Investment return and the principal value of an investment will fluctuate. Returns shown do not reflect the deduction of taxes that a shareholder would pay on Fund distributions or the sale of Fund shares. Total return, market price, NAV, market price distribution rate, and NAV distribution rate will fluctuate with changes in market conditions. Performance current to the most recent month‑end is available at www.pimco.com or via (844) 33‑PIMCO. Performance is calculated assuming all dividends and distributions are reinvested at prices obtained under the Fund’s dividend reinvestment plan. Performance does not reflect any brokerage commissions in connection with the purchase or sale of Fund shares. |
| Performance of an index is shown in light of a requirement by the Securities and Exchange Commission that the performance of an appropriate broad-based securities market index be disclosed. However, the Fund is not managed to an index nor should the index be viewed as a “benchmark” for the Fund’s performance. The index is not intended to be indicative of the Fund’s investment strategies, portfolio components or past or future performance. Please see Additional Information Regarding the Funds for a description of the Fund’s principal investment strategies. |
| (2) | Distribution rates are not performance and are calculated by annualizing the most recent distribution per share and dividing by the NAV or Market Price, as applicable, as of the reported date. Distributions may be comprised of ordinary income, net capital gains, and/or a return of capital (“ROC”) of your investment in the Fund. Because the distribution rate may include a ROC, it should not be confused with yield or income. If the Fund estimates that a portion of its distribution may be comprised of amounts from sources other than net investment income in accordance with its policies and good accounting practices, the Fund will notify shareholders of the estimated composition of such distribution through a Section 19 Notice. Please refer to the most recent Section 19 Notice, if applicable, for additional information regarding the estimated composition of distributions. Please visit www.pimco.com for most recent Section 19 Notice, if applicable. Final determination of a distribution’s tax character will be provided to shareholders when such information is available. |
| (3) | Represents total effective leverage outstanding, as a percentage of total managed assets. Total effective leverage consists of preferred shares, reverse repurchase agreements and other borrowings, credit default swap notional and floating rate notes issued in tender option bond transactions, as applicable (collectively “Total Effective Leverage”). The Fund may engage in other transactions not included in Total Effective Leverage disclosed above that may give rise to a form of leverage, including certain derivative transactions. For the purpose of calculating Total Effective Leverage outstanding as a percentage of total managed assets, total managed assets refer to total assets (including assets attributable to Total Effective Leverage that may be outstanding) minus accrued liabilities (other than liabilities representing Total Effective Leverage). |
| » | Security selection within the taxable municipal bonds sector contributed to performance, as select securities posted positive returns. |
| » | Security selection within the resource recovery sector contributed to performance, as a select security posted positive returns. |
| » | There were no other material contributors for this Fund. |
| » | Exposure to the special tax sector detracted from performance, as the sector posted negative performance. |
| » | Exposure to the hospitals sector detracted from performance, as the sector posted negative performance. |
| » | Exposure to the industrial revenue sector detracted from performance, as the sector posted negative performance. |
| ANNUAL REPORT | | | DECEMBER 31, 2022 | 11 |
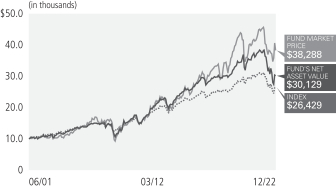
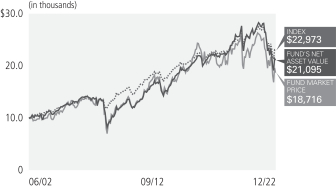
| Symbol on NYSE ‑ PCQ |
| Municipal Bonds & Notes | ||||
| Ad Valorem Property Tax | 21.3% | |||
| Health, Hospital & Nursing Home Revenue | 14.1% | |||
| College & University Revenue | 6.6% | |||
| Local or Guaranteed Housing | 6.5% | |||
| Natural Gas Revenue | 6.4% | |||
| Electric Power & Light Revenue | 6.2% | |||
| Lease (Abatement) | 6.0% | |||
| Sales Tax Revenue | 5.2% | |||
| Port, Airport & Marina Revenue | 5.0% | |||
| General Fund | 4.9% | |||
| Tobacco Settlement Funded | 4.6% | |||
| Lease (Non‑Terminable) | 2.2% | |||
| Sewer Revenue | 2.1% | |||
| Water Revenue | 1.9% | |||
| Special Assessment | 1.3% | |||
| Special Tax | 1.1% | |||
| Highway Revenue Tolls | 1.1% | |||
| Other | 2.5% | |||
| Short-Term Instruments | 1.0% | |||
| † | % of Investments, at value. |
| § | Allocation Breakdown and % of investments exclude securities sold short and financial derivative instruments, if any. |
| Market Price | $15.07 | |||
| NAV | $10.31 | |||
| Premium/(Discount) to NAV | 46.17% | |||
Market Price Distribution Rate(2) | 5.18% | |||
NAV Distribution Rate(2) | 7.57% | |||
Total Effective Leverage(3) | 44.49% | |||
| Average Annual Total Return(1) for the period ended December 31, 2022 | ||||||||||||||||||
| 1 Year | 5 Year | 10 Year | Commencement of Operations (06/29/01) | |||||||||||||||
| Market Price | (14.34)% | 2.49% | 5.32% | 6.44% | |||||||||||||
| NAV | (21.44)% | (0.07)% | 3.03% | 5.27% | |||||||||||||
| Bloomberg CA Muni 22+ Year Index | (14.94)% | 0.63% | 2.76% | 4.62% | ¨ | ||||||||||||
| (1) | Performance quoted represents past performance. Past performance is not a guarantee or a reliable indicator of future results. Current performance may be lower or higher than performance shown. Investment return and the principal value of an investment will fluctuate. Returns shown do not reflect the deduction of taxes that a shareholder would pay on Fund distributions or the sale of Fund shares. Total return, market price, NAV, market price distribution rate, and NAV distribution rate will fluctuate with changes in market conditions. Performance current to the most recent month‑end is available at www.pimco.com or via (844) 33‑PIMCO. Performance is calculated assuming all dividends and distributions are reinvested at prices obtained under the Fund’s dividend reinvestment plan. Performance does not reflect any brokerage commissions in connection with the purchase or sale of Fund shares. |
| Performance of an index is shown in light of a requirement by the Securities and Exchange Commission that the performance of an appropriate broad-based securities market index be disclosed. However, the Fund is not managed to an index nor should the index be viewed as a “benchmark” for the Fund’s performance. The index is not intended to be indicative of the Fund’s investment strategies, portfolio components or past or future performance. Please see Additional Information Regarding the Funds for a description of the Fund’s principal investment strategies. |
| (2) | Distribution rates are not performance and are calculated by annualizing the most recent distribution per share and dividing by the NAV or Market Price, as applicable, as of the reported date. Distributions may be comprised of ordinary income, net capital gains, and/or a return of capital (“ROC”) of your investment in the Fund. Because the distribution rate may include a ROC, it should not be confused with yield or income. If the Fund estimates that a portion of its distribution may be comprised of amounts from sources other than net investment income in accordance with its policies and good accounting practices, the Fund will notify shareholders of the estimated composition of such distribution through a Section 19 Notice. Please refer to the most recent Section 19 Notice, if applicable, for additional information regarding the estimated composition of distributions. Please visit www.pimco.com for most recent Section 19 Notice, if applicable. Final determination of a distribution’s tax character will be provided to shareholders when such information is available. |
| (3) | Represents total effective leverage outstanding, as a percentage of total managed assets. Total effective leverage consists of preferred shares, reverse repurchase agreements and other borrowings, credit default swap notional and floating rate notes issued in tender option bond transactions, as applicable (collectively “Total Effective Leverage”). The Fund may engage in other transactions not included in Total Effective Leverage disclosed above that may give rise to a form of leverage, including certain derivative transactions. For the purpose of calculating Total Effective Leverage outstanding as a percentage of total managed assets, total managed assets refer to total assets (including assets attributable to Total Effective Leverage that may be outstanding) minus accrued liabilities (other than liabilities representing Total Effective Leverage). |
| » | Security selection within the pre‑refunded segment contributed to performance, as a select security posted positive returns. |
| » | Security selection within the taxable municipal bonds sector contributed to performance, as select securities posted positive returns. |
| » | Security selection within the tobacco sector contributed to performance, as select securities posted positive returns. |
| » | Exposure to the general obligation sector detracted from performance, as the sector posted negative performance. |
| » | Exposure to the industrial revenue sector detracted from performance, as the sector posted negative performance. |
| » | Exposure to the special tax sector detracted from performance, as the sector posted negative performance. |
| 12 | PIMCO CLOSED-END FUNDS |
| Symbol on NYSE ‑ PCK |
| Municipal Bonds & Notes | ||||
| Ad Valorem Property Tax | 21.4% | |||
| Health, Hospital & Nursing Home Revenue | 11.4% | |||
| Natural Gas Revenue | 8.6% | |||
| Local or Guaranteed Housing | 6.9% | |||
| General Fund | 6.3% | |||
| Port, Airport & Marina Revenue | 5.9% | |||
| Tobacco Settlement Funded | 5.5% | |||
| Electric Power & Light Revenue | 5.5% | |||
| Sewer Revenue | 4.8% | |||
| College & University Revenue | 4.4% | |||
| Sales Tax Revenue | 4.2% | |||
| Lease (Abatement) | 3.6% | |||
| Highway Revenue Tolls | 2.4% | |||
| Lease (Non‑Terminable) | 2.1% | |||
| Water Revenue | 1.4% | |||
| Special Assessment | 1.3% | |||
| Special Tax | 1.1% | |||
| Other | 2.8% | |||
| Short-Term Instruments | 0.4% | |||
| † | % of Investments, at value. |
| § | Allocation Breakdown and % of investments exclude securities sold short and financial derivative instruments, if any. |
| Market Price | $6.79 | |||
| NAV | $6.53 | |||
| Premium/(Discount) to NAV | 3.98% | |||
Market Price Distribution Rate(2) | 5.66% | |||
NAV Distribution Rate(2) | 5.88% | |||
Total Effective Leverage(3) | 44.24% | |||
| Average Annual Total Return(1) for the period ended December 31, 2022 | ||||||||||||||||||
| 1 Year | 5 Year | 10 Year | Commencement of Operations (06/28/02) | |||||||||||||||
| Market Price | (23.32)% | (2.94)% | 1.55% | 2.83% | |||||||||||||
| NAV | (24.38)% | (0.60)% | 3.03% | 3.26% | |||||||||||||
| Bloomberg CA Muni 22+ Year Index | (14.94)% | 0.63% | 2.76% | 4.46% | ¨ | ||||||||||||
| (1) | Performance quoted represents past performance. Past performance is not a guarantee or a reliable indicator of future results. Current performance may be lower or higher than performance shown. Investment return and the principal value of an investment will fluctuate. Returns shown do not reflect the deduction of taxes that a shareholder would pay on Fund distributions or the sale of Fund shares. Total return, market price, NAV, market price distribution rate, and NAV distribution rate will fluctuate with changes in market conditions. Performance current to the most recent month‑end is available at www.pimco.com or via (844) 33‑PIMCO. Performance is calculated assuming all dividends and distributions are reinvested at prices obtained under the Fund’s dividend reinvestment plan. Performance does not reflect any brokerage commissions in connection with the purchase or sale of Fund shares. |
| Performance of an index is shown in light of a requirement by the Securities and Exchange Commission that the performance of an appropriate broad-based securities market index be disclosed. However, the Fund is not managed to an index nor should the index be viewed as a “benchmark” for the Fund’s performance. The index is not intended to be indicative of the Fund’s investment strategies, portfolio components or past or future performance. Please see Additional Information Regarding the Funds for a description of the Fund’s principal investment strategies. |
| (2) | Distribution rates are not performance and are calculated by annualizing the most recent distribution per share and dividing by the NAV or Market Price, as applicable, as of the reported date. Distributions may be comprised of ordinary income, net capital gains, and/or a return of capital (“ROC”) of your investment in the Fund. Because the distribution rate may include a ROC, it should not be confused with yield or income. If the Fund estimates that a portion of its distribution may be comprised of amounts from sources other than net investment income in accordance with its policies and good accounting practices, the Fund will notify shareholders of the estimated composition of such distribution through a Section 19 Notice. Please refer to the most recent Section 19 Notice, if applicable, for additional information regarding the estimated composition of distributions. Please visit www.pimco.com for most recent Section 19 Notice, if applicable. Final determination of a distribution’s tax character will be provided to shareholders when such information is available. |
| (3) | Represents total effective leverage outstanding, as a percentage of total managed assets. Total effective leverage consists of preferred shares, reverse repurchase agreements and other borrowings, credit default swap notional and floating rate notes issued in tender option bond transactions, as applicable (collectively “Total Effective Leverage”). The Fund may engage in other transactions not included in Total Effective Leverage disclosed above that may give rise to a form of leverage, including certain derivative transactions. For the purpose of calculating Total Effective Leverage outstanding as a percentage of total managed assets, total managed assets refer to total assets (including assets attributable to Total Effective Leverage that may be outstanding) minus accrued liabilities (other than liabilities representing Total Effective Leverage). |
| » | Security selection within the taxable municipal bonds sector contributed to performance, as select securities posted positive returns. |
| » | Security selection within the tobacco sector contributed to performance, as select securities posted positive returns. |
| » | There were no other material contributors for the Fund. |
| » | Exposure to the general obligation sector detracted from performance, as the sector posted negative performance. |
| » | Exposure to the industrial revenue sector detracted from performance, as the sector posted negative performance. |
| » | Exposure to the hospitals sector detracted from performance, as the sector posted negative performance. |
| ANNUAL REPORT | | | DECEMBER 31, 2022 | 13 |
| Symbol on NYSE ‑ PZC |
| Municipal Bonds & Notes | ||||
| Ad Valorem Property Tax | 20.8% | |||
| Health, Hospital & Nursing Home Revenue | 16.0% | |||
| Electric Power & Light Revenue | 7.8% | |||
| Tobacco Settlement Funded | 7.5% | |||
| Local or Guaranteed Housing | 7.0% | |||
| College & University Revenue | 5.6% | |||
| Port, Airport & Marina Revenue | 5.4% | |||
| Natural Gas Revenue | 4.5% | |||
| Sales Tax Revenue | 4.4% | |||
| General Fund | 3.9% | |||
| Lease (Abatement) | 3.4% | |||
| Highway Revenue Tolls | 2.8% | |||
| Sewer Revenue | 1.8% | |||
| Special Tax | 1.7% | |||
| Lease (Non‑Terminable) | 1.4% | |||
| Special Assessment | 1.3% | |||
| Water Revenue | 1.1% | |||
| Other | 3.1% | |||
| Short-Term Instruments | 0.5% | |||
| † | % of Investments, at value. |
| § | Allocation Breakdown and % of investments exclude securities sold short and financial derivative instruments, if any. |
| Market Price | $8.35 | |||
| NAV | $7.70 | |||
| Premium/(Discount) to NAV | 8.44% | |||
Market Price Distribution Rate(2) | 5.46% | |||
NAV Distribution Rate(2) | 5.92% | |||
Total Effective Leverage(3) | 43.75% | |||
| Average Annual Total Return(1) for the period ended December 31, 2022 | ||||||||||||||||||
| 1 Year | 5 Year | 10 Year | Commencement of Operations (10/31/02) | |||||||||||||||
| Market Price | (20.55)% | 0.51% | 2.88% | 3.52% | |||||||||||||
| NAV | (20.29)% | (0.12)% | 3.15% | 3.51% | |||||||||||||
| Bloomberg CA Muni 22+ Year Index | (14.94)% | 0.63% | 2.76% | 4.39% | |||||||||||||
| (1) | Performance quoted represents past performance. Past performance is not a guarantee or a reliable indicator of future results. Current performance may be lower or higher than performance shown. Investment return and the principal value of an investment will fluctuate. Returns shown do not reflect the deduction of taxes that a shareholder would pay on Fund distributions or the sale of Fund shares. Total return, market price, NAV, market price distribution rate, and NAV distribution rate will fluctuate with changes in market conditions. Performance current to the most recent month‑end is available at www.pimco.com or via (844) 33‑PIMCO. Performance is calculated assuming all dividends and distributions are reinvested at prices obtained under the Fund’s dividend reinvestment plan. Performance does not reflect any brokerage commissions in connection with the purchase or sale of Fund shares. |
| Performance of an index is shown in light of a requirement by the Securities and Exchange Commission that the performance of an appropriate broad-based securities market index be disclosed. However, the Fund is not managed to an index nor should the index be viewed as a “benchmark” for the Fund’s performance. The index is not intended to be indicative of the Fund’s investment strategies, portfolio components or past or future performance. Please see Additional Information Regarding the Funds for a description of the Fund’s principal investment strategies. |
| (2) | Distribution rates are not performance and are calculated by annualizing the most recent distribution per share and dividing by the NAV or Market Price, as applicable, as of the reported date. Distributions may be comprised of ordinary income, net capital gains, and/or a return of capital (“ROC”) of your investment in the Fund. Because the distribution rate may include a ROC, it should not be confused with yield or income. If the Fund estimates that a portion of its distribution may be comprised of amounts from sources other than net investment income in accordance with its policies and good accounting practices, the Fund will notify shareholders of the estimated composition of such distribution through a Section 19 Notice. Please refer to the most recent Section 19 Notice, if applicable, for additional information regarding the estimated composition of distributions. Please visit www.pimco.com for most recent Section 19 Notice, if applicable. Final determination of a distribution’s tax character will be provided to shareholders when such information is available. |
| (3) | Represents total effective leverage outstanding, as a percentage of total managed assets. Total effective leverage consists of preferred shares, reverse repurchase agreements and other borrowings, credit default swap notional and floating rate notes issued in tender option bond transactions, as applicable (collectively “Total Effective Leverage”). The Fund may engage in other transactions not included in Total Effective Leverage disclosed above that may give rise to a form of leverage, including certain derivative transactions. For the purpose of calculating Total Effective Leverage outstanding as a percentage of total managed assets, total managed assets refer to total assets (including assets attributable to Total Effective Leverage that may be outstanding) minus accrued liabilities (other than liabilities representing Total Effective Leverage). |
| » | Security selection within the taxable municipal bonds sector contributed to performance, as select securities posted positive returns. |
| » | Security selection within the pre‑refunded segment contributed to performance, as a select security posted positive returns. |
| » | Security selection within the tobacco sector contributed to performance, as select securities posted positive returns. |
| » | Exposure to the general obligation sector detracted from performance, as the sector posted negative performance. |
| » | Exposure to the industrial revenue sector detracted from performance, as the sector posted negative performance. |
| » | Exposure to the hospitals sector detracted from performance, as the sector posted negative performance. |
| 14 | PIMCO CLOSED-END FUNDS |
| Symbol on NYSE ‑ PNF |
| Municipal Bonds & Notes | ||||
| Income Tax Revenue | 17.0% | |||
| Health, Hospital & Nursing Home Revenue | 11.0% | |||
| Ad Valorem Property Tax | 10.2% | |||
| Water Revenue | 9.6% | |||
| Transit Revenue | 8.2% | |||
| Tobacco Settlement Funded | 7.9% | |||
| Sales Tax Revenue | 6.9% | |||
| Port, Airport & Marina Revenue | 6.4% | |||
| College & University Revenue | 6.3% | |||
| Local or Guaranteed Housing | 5.2% | |||
| Miscellaneous Revenue | 2.2% | |||
| Industrial Revenue | 2.2% | |||
| Highway Revenue Tolls | 2.0% | |||
| Electric Power & Light Revenue | 1.6% | |||
| Lease (Appropriation) | 1.3% | |||
| Other | 1.9% | |||
| Short-Term Instruments | 0.1% | |||
| † | % of Investments, at value. |
| § | Allocation Breakdown and % of investments exclude securities sold short and financial derivative instruments, if any. |
| Market Price | $9.03 | |||
| NAV | $8.70 | |||
| Premium/(Discount) to NAV | 3.79% | |||
Market Price Distribution Rate(2) | 5.58% | |||
NAV Distribution Rate(2) | 5.79% | |||
Total Effective Leverage(3) | 40.47% | |||
| Average Annual Total Return(1) for the period ended December 31, 2022 | ||||||||||||||||||
| 1 Year | 5 Year | 10 Year | Commencement of Operations (06/29/01) | |||||||||||||||
| Market Price | (22.47)% | (1.95)% | 2.36% | 3.57% | |||||||||||||
| NAV | (24.46)% | (1.49)% | 2.25% | 3.66% | |||||||||||||
| Bloomberg NY Muni 22+ Year Index | (16.16)% | 0.06% | 2.14% | 4.25%¨ | |||||||||||||
| (1) | Performance quoted represents past performance. Past performance is not a guarantee or a reliable indicator of future results. Current performance may be lower or higher than performance shown. Investment return and the principal value of an investment will fluctuate. Returns shown do not reflect the deduction of taxes that a shareholder would pay on Fund distributions or the sale of Fund shares. Total return, market price, NAV, market price distribution rate, and NAV distribution rate will fluctuate with changes in market conditions. Performance current to the most recent month‑end is available at www.pimco.com or via (844) 33‑PIMCO. Performance is calculated assuming all dividends and distributions are reinvested at prices obtained under the Fund’s dividend reinvestment plan. Performance does not reflect any brokerage commissions in connection with the purchase or sale of Fund shares. |
| Performance of an index is shown in light of a requirement by the Securities and Exchange Commission that the performance of an appropriate broad-based securities market index be disclosed. However, the Fund is not managed to an index nor should the index be viewed as a “benchmark” for the Fund’s performance. The index is not intended to be indicative of the Fund’s investment strategies, portfolio components or past or future performance. Please see Additional Information Regarding the Funds for a description of the Fund’s principal investment strategies. |
| (2) | Distribution rates are not performance and are calculated by annualizing the most recent distribution per share and dividing by the NAV or Market Price, as applicable, as of the reported date. Distributions may be comprised of ordinary income, net capital gains, and/or a return of capital (“ROC”) of your investment in the Fund. Because the distribution rate may include a ROC, it should not be confused with yield or income. If the Fund estimates that a portion of its distribution may be comprised of amounts from sources other than net investment income in accordance with its policies and good accounting practices, the Fund will notify shareholders of the estimated composition of such distribution through a Section 19 Notice. Please refer to the most recent Section 19 Notice, if applicable, for additional information regarding the estimated composition of distributions. Please visit www.pimco.com for most recent Section 19 Notice, if applicable. Final determination of a distribution’s tax character will be provided to shareholders when such information is available. |
| (3) | Represents total effective leverage outstanding, as a percentage of total managed assets. Total effective leverage consists of preferred shares, reverse repurchase agreements and other borrowings, credit default swap notional and floating rate notes issued in tender option bond transactions, as applicable (collectively “Total Effective Leverage”). The Fund may engage in other transactions not included in Total Effective Leverage disclosed above that may give rise to a form of leverage, including certain derivative transactions. For the purpose of calculating Total Effective Leverage outstanding as a percentage of total managed assets, total managed assets refer to total assets (including assets attributable to Total Effective Leverage that may be outstanding) minus accrued liabilities (other than liabilities representing Total Effective Leverage). |
| » | Security selection within the pre‑refunded segment contributed to performance, as a select security posted positive returns. |
| » | Security selection within the taxable municipal bonds sector contributed to performance, as select securities posted positive returns. |
| » | There were no other material contributors for this Fund. |
| » | Exposure to the special tax sector detracted from performance, as the sector posted negative performance. |
| » | Exposure to the transportation sector detracted from performance, as the sector posted negative performance. |
| » | Exposure to the industrial revenue sector detracted from performance, as the sector posted negative performance. |
| ANNUAL REPORT | | | DECEMBER 31, 2022 | 15 |
| Symbol on NYSE ‑ PNI |
| Municipal Bonds & Notes | ||||
| Health, Hospital & Nursing Home Revenue | 11.3% | |||
| Tobacco Settlement Funded | 11.3% | |||
| College & University Revenue | 11.0% | |||
| Income Tax Revenue | 10.4% | |||
| Water Revenue | 7.1% | |||
| Port, Airport & Marina Revenue | 6.5% | |||
| Sales Tax Revenue | 5.6% | |||
| Highway Revenue Tolls | 5.2% | |||
| Miscellaneous Revenue | 5.0% | |||
| Lease (Appropriation) | 4.8% | |||
| Transit Revenue | 4.6% | |||
| Local or Guaranteed Housing | 3.7% | |||
| Ad Valorem Property Tax | 3.7% | |||
| Electric Power & Light Revenue | 3.3% | |||
| Industrial Revenue | 2.9% | |||
| Miscellaneous Taxes | 1.6% | |||
| Other | 1.5% | |||
| Short-Term Instruments | 0.5% | |||
| † | % of Investments, at value. |
| § | Allocation Breakdown and % of investments exclude securities sold short and financial derivative instruments, if any. |
| Market Price | $7.95 | |||
| NAV | $8.29 | |||
| Premium/(Discount) to NAV | (4.10)% | |||
Market Price Distribution Rate(2) | 6.04% | |||
NAV Distribution Rate(2) | 5.80% | |||
Total Effective Leverage(3) | 43.95% | |||
| Average Annual Total Return(1) for the period ended December 31, 2022 | ||||||||||||||||||
| 1 Year | 5 Year | 10 Year | Commencement of Operations (06/28/02) | |||||||||||||||
| Market Price | (26.06)% | (3.33)% | 0.97% | 3.15% | |||||||||||||
| NAV | (25.12)% | (1.19)% | 2.40% | 3.71% | |||||||||||||
| Bloomberg NY Muni 22+ Year Index | (16.16)% | 0.06% | 2.14% | 4.14%¨ | |||||||||||||
| (1) | Performance quoted represents past performance. Past performance is not a guarantee or a reliable indicator of future results. Current performance may be lower or higher than performance shown. Investment return and the principal value of an investment will fluctuate. Returns shown do not reflect the deduction of taxes that a shareholder would pay on Fund distributions or the sale of Fund shares. Total return, market price, NAV, market price distribution rate, and NAV distribution rate will fluctuate with changes in market conditions. Performance current to the most recent month‑end is available at www.pimco.com or via (844) 33‑PIMCO. Performance is calculated assuming all dividends and distributions are reinvested at prices obtained under the Fund’s dividend reinvestment plan. Performance does not reflect any brokerage commissions in connection with the purchase or sale of Fund shares. |
| Performance of an index is shown in light of a requirement by the Securities and Exchange Commission that the performance of an appropriate broad-based securities market index be disclosed. However, the Fund is not managed to an index nor should the index be viewed as a “benchmark” for the Fund’s performance. The index is not intended to be indicative of the Fund’s investment strategies, portfolio components or past or future performance. Please see Additional Information Regarding the Funds for a description of the Fund’s principal investment strategies. |
| (2) | Distribution rates are not performance and are calculated by annualizing the most recent distribution per share and dividing by the NAV or Market Price, as applicable, as of the reported date. Distributions may be comprised of ordinary income, net capital gains, and/or a return of capital (“ROC”) of your investment in the Fund. Because the distribution rate may include a ROC, it should not be confused with yield or income. If the Fund estimates that a portion of its distribution may be comprised of amounts from sources other than net investment income in accordance with its policies and good accounting practices, the Fund will notify shareholders of the estimated composition of such distribution through a Section 19 Notice. Please refer to the most recent Section 19 Notice, if applicable, for additional information regarding the estimated composition of distributions. Please visit www.pimco.com for most recent Section 19 Notice, if applicable. Final determination of a distribution’s tax character will be provided to shareholders when such information is available. |
| (3) | Represents total effective leverage outstanding, as a percentage of total managed assets. Total effective leverage consists of preferred shares, reverse repurchase agreements and other borrowings, credit default swap notional and floating rate notes issued in tender option bond transactions, as applicable (collectively “Total Effective Leverage”). The Fund may engage in other transactions not included in Total Effective Leverage disclosed above that may give rise to a form of leverage, including certain derivative transactions. For the purpose of calculating Total Effective Leverage outstanding as a percentage of total managed assets, total managed assets refer to total assets (including assets attributable to Total Effective Leverage that may be outstanding) minus accrued liabilities (other than liabilities representing Total Effective Leverage). |
| » | Security selection within the taxable municipal bonds sector contributed to performance, as select securities posted positive returns. |
| » | There were no other material contributors for the Fund. |
| » | Exposure to the special tax sector detracted from performance, as the sector posted negative performance. |
| » | Exposure to the transportation sector detracted from performance, as the sector posted negative performance. |
| » | Exposure to the industrial revenue sector detracted from performance, as the sector posted negative performance. |
| 16 | PIMCO CLOSED-END FUNDS |
| Symbol on NYSE ‑ PYN |
| Municipal Bonds & Notes | ||||
| Income Tax Revenue | 13.4% | |||
| Tobacco Settlement Funded | 10.2% | |||
| Health, Hospital & Nursing Home Revenue | 9.8% | |||
| Ad Valorem Property Tax | 8.5% | |||
| College & University Revenue | 8.1% | |||
| Miscellaneous Revenue | 6.9% | |||
| Industrial Revenue | 6.9% | |||
| Port, Airport & Marina Revenue | 6.9% | |||
| Transit Revenue | 5.8% | |||
| Sales Tax Revenue | 5.7% | |||
| Local or Guaranteed Housing | 4.2% | |||
| Water Revenue | 3.3% | |||
| Electric Power & Light Revenue | 2.1% | |||
| Highway Revenue Tolls | 1.1% | |||
| Miscellaneous Taxes | 1.1% | |||
| Other | 2.1% | |||
| Short-Term Instruments | 3.9% | |||
| † | % of Investments, at value. |
| § | Allocation Breakdown and % of investments exclude securities sold short and financial derivative instruments, if any. |
| Market Price | $6.83 | |||
| NAV | $6.66 | |||
| Premium/(Discount) to NAV | 2.55% | |||
Market Price Distribution Rate(2) | 6.24% | |||
NAV Distribution Rate(2) | 6.39% | |||
Total Effective Leverage(3) | 43.51% | |||
| Average Annual Total Return(1) for the period ended December 31, 2022 | ||||||||||||||||||
| 1 Year | 5 Year | 10 Year | Commencement of Operations (10/31/02) | |||||||||||||||
| Market Price | (22.40)% | (2.38)% | 1.30% | 2.17% | |||||||||||||
| NAV | (23.35)% | (1.46)% | 2.14% | 2.33% | |||||||||||||
| Bloomberg NY Muni 22+ Year Index | (16.16)% | 0.06% | 2.14% | 4.01% | |||||||||||||
| (1) | Performance quoted represents past performance. Past performance is not a guarantee or a reliable indicator of future results. Current performance may be lower or higher than performance shown. Investment return and the principal value of an investment will fluctuate. Returns shown do not reflect the deduction of taxes that a shareholder would pay on Fund distributions or the sale of Fund shares. Total return, market price, NAV, market price distribution rate, and NAV distribution rate will fluctuate with changes in market conditions. Performance current to the most recent month‑end is available at www.pimco.com or via (844) 33‑PIMCO. Performance is calculated assuming all dividends and distributions are reinvested at prices obtained under the Fund’s dividend reinvestment plan. Performance does not reflect any brokerage commissions in connection with the purchase or sale of Fund shares. |
| Performance of an index is shown in light of a requirement by the Securities and Exchange Commission that the performance of an appropriate broad-based securities market index be disclosed. However, the Fund is not managed to an index nor should the index be viewed as a “benchmark” for the Fund’s performance. The index is not intended to be indicative of the Fund’s investment strategies, portfolio components or past or future performance. Please see Additional Information Regarding the Funds for a description of the Fund’s principal investment strategies. |
| (2) | Distribution rates are not performance and are calculated by annualizing the most recent distribution per share and dividing by the NAV or Market Price, as applicable, as of the reported date. Distributions may be comprised of ordinary income, net capital gains, and/or a return of capital (“ROC”) of your investment in the Fund. Because the distribution rate may include a ROC, it should not be confused with yield or income. If the Fund estimates that a portion of its distribution may be comprised of amounts from sources other than net investment income in accordance with its policies and good accounting practices, the Fund will notify shareholders of the estimated composition of such distribution through a Section 19 Notice. Please refer to the most recent Section 19 Notice, if applicable, for additional information regarding the estimated composition of distributions. Please visit www.pimco.com for most recent Section 19 Notice, if applicable. Final determination of a distribution’s tax character will be provided to shareholders when such information is available. |
| (3) | Represents total effective leverage outstanding, as a percentage of total managed assets. Total effective leverage consists of preferred shares, reverse repurchase agreements and other borrowings, credit default swap notional and floating rate notes issued in tender option bond transactions, as applicable (collectively “Total Effective Leverage”). The Fund may engage in other transactions not included in Total Effective Leverage disclosed above that may give rise to a form of leverage, including certain derivative transactions. For the purpose of calculating Total Effective Leverage outstanding as a percentage of total managed assets, total managed assets refer to total assets (including assets attributable to Total Effective Leverage that may be outstanding) minus accrued liabilities (other than liabilities representing Total Effective Leverage). |
| » | Security selection within the taxable municipal bonds sector contributed to performance, as select securities posted positive returns. |
| » | Security selection within the lease-backed sector contributed to performance, as a select security posted positive returns. |
| » | There were no other material contributors for the Fund. |
| » | Exposure to the special tax sector detracted from performance, as the sector posted negative performance. |
| » | Exposure to the industrial revenue sector detracted from performance, as the sector posted negative performance. |
| » | Exposure to the transportation sector detracted from performance, as the sector posted negative performance. |
| ANNUAL REPORT | | | DECEMBER 31, 2022 | 17 |
| Index Descriptions |
| Index* | Index Description | |
| Bloomberg Long Municipal Bond Index | Bloomberg Long Municipal Bond Index is a rules-based, market-value-weighted index engineered for the long-term tax‑exempt bond market. | |
| Bloomberg CA Muni 22+ Year Index | The Bloomberg CA Muni 22+ Year Index is the long maturity California component of the Bloomberg Municipal Bond Index, which consists of a broad selection of investment grade general obligation and revenue bonds. It is an unmanaged index representative of the tax‑exempt bond market. | |
| Bloomberg NY Muni 22+ Year Index | The Bloomberg NY Muni 22+ Year Index is the long maturity New York component of the Bloomberg Municipal Bond Index, which consists of a broad selection of investment grade general obligation and revenue bonds. It is an unmanaged index representative of the tax‑exempt bond market. | |
| 18 | PIMCO CLOSED-END FUNDS |
| ANNUAL REPORT | | | DECEMBER 31, 2022 | 19 |
| Financial Highlights |
| Investment Operations | Less Distributions to Preferred Shareholders(c) | Less Distributions to Common Shareholders(d) | ||||||||||||||||||||||||||||||||||||||||||||||||||
| Selected Per Share Data for the Year or Period Ended^: | Net Asset Value Beginning of Year or Period(a) | Net Investment Income (Loss)(b) | Net Realized/ Unrealized Gain (Loss) | From Net Investment Income | From Net Realized Capital Gains | Net Increase (Decrease) in Net Assets Applicable to Common Shareholders Resulting from Operations | From Net Investment Income | From Net Realized Capital Gains | Tax Basis Return of Capital | Total | Increase Resulting from Tender of ARPS(c) | Increase Resulting from Common Share Offering | Offering Cost Charged to Paid in Capital | |||||||||||||||||||||||||||||||||||||||
| PIMCO Municipal Income Fund | ||||||||||||||||||||||||||||||||||||||||||||||||||||
| 12/31/2022 | $ | 13.33 | $ | 0.68 | $ | (3.71 | ) | $ | (0.14 | ) | $ | 0.00 | $ | (3.17 | ) | $ | (0.65 | ) | $ | 0.00 | $ | 0.00 | $ | (0.65 | ) | $ | 0.00 | $ | N/A | $ | N/A | |||||||||||||||||||||
| 12/31/2021 | 13.22 | 0.71 | 0.06 | (0.01 | ) | 0.00 | 0.76 | (0.65 | ) | 0.00 | 0.00 | (0.65 | ) | 0.00 | N/A | N/A | ||||||||||||||||||||||||||||||||||||
| 12/31/2020 | 13.35 | 0.74 | (0.07 | ) | (0.07 | ) | 0.00 | 0.60 | (0.65 | ) | (0.08 | ) | 0.00 | (0.73 | ) | 0.00 | N/A | N/A | ||||||||||||||||||||||||||||||||||
| 12/31/2019 | 12.36 | 0.81 | 1.07 | (0.16 | ) | 0.00 | 1.72 | (0.72 | ) | (0.01 | ) | 0.00 | (0.73 | ) | 0.00 | N/A | N/A | |||||||||||||||||||||||||||||||||||
| 12/31/2018 | 12.87 | 0.89 | (0.65 | ) | (0.16 | ) | 0.00 | 0.08 | (0.72 | ) | 0.00 | 0.00 | (0.72 | ) | 0.13 | N/A | N/A | |||||||||||||||||||||||||||||||||||
| PIMCO Municipal Income Fund II | ||||||||||||||||||||||||||||||||||||||||||||||||||||
| 12/31/2022 | $ | 12.37 | $ | 0.60 | $ | (3.43 | ) | $ | (0.10 | ) | $ | 0.00 | $ | (2.93 | ) | $ | (0.60 | ) | $ | 0.00 | $ | (0.11 | ) | $ | (0.71 | ) | $ | 0.00 | $ | 0.03 | $ | 0.00 | ||||||||||||||||||||
| 12/31/2021 | 12.42 | 0.66 | 0.00 | 0.00 | 0.00 | 0.66 | (0.71 | ) | 0.00 | 0.00 | (0.71 | ) | 0.00 | N/A | N/A | |||||||||||||||||||||||||||||||||||||
| 12/31/2020 | 12.50 | 0.69 | (0.01 | ) | (0.05 | ) | 0.00 | 0.63 | (0.71 | ) | 0.00 | 0.00 | (0.71 | ) | 0.00 | N/A | N/A | |||||||||||||||||||||||||||||||||||
| 12/31/2019 | 11.62 | 0.77 | 1.01 | (0.12 | ) | 0.00 | 1.66 | (0.78 | ) | 0.00 | 0.00 | (0.78 | ) | 0.00 | N/A | N/A | ||||||||||||||||||||||||||||||||||||
| 12/31/2018 | 12.13 | 0.81 | (0.57 | ) | (0.13 | ) | 0.00 | 0.11 | (0.78 | ) | 0.00 | 0.00 | (0.78 | ) | 0.16 | N/A | N/A | |||||||||||||||||||||||||||||||||||
| 12/31/2017 | 11.81 | 0.81 | 0.37 | (0.08 | ) | 0.00 | 1.10 | (0.78 | ) | 0.00 | 0.00 | (0.78 | ) | 0.00 | N/A | N/A | ||||||||||||||||||||||||||||||||||||
| 12/31/2016 | 12.39 | 0.79 | (0.55 | ) | (0.04 | ) | 0.00 | 0.20 | (0.78 | ) | 0.00 | 0.00 | (0.78 | ) | 0.00 | N/A | N/A | |||||||||||||||||||||||||||||||||||
06/01/2015 - 12/31/2015(h) | 12.11 | 0.47 | 0.28 | (0.01 | ) | 0.00 | 0.74 | (0.46 | ) | 0.00 | 0.00 | (0.46 | )(i) | 0.00 | N/A | N/A | ||||||||||||||||||||||||||||||||||||
| 05/31/2015 | 11.94 | 0.81 | 0.15 | (0.01 | ) | 0.00 | 0.95 | (0.78 | ) | 0.00 | 0.00 | (0.78 | ) | 0.00 | N/A | N/A | ||||||||||||||||||||||||||||||||||||
| 05/31/2014 | 12.17 | 0.81 | (0.25 | ) | (0.01 | ) | 0.00 | 0.55 | (0.78 | ) | 0.00 | 0.00 | (0.78 | ) | 0.00 | N/A | N/A | |||||||||||||||||||||||||||||||||||
| 05/31/2013 | 11.91 | 0.82 | 0.23 | (0.01 | ) | 0.00 | 1.04 | (0.78 | ) | 0.00 | 0.00 | (0.78 | ) | 0.00 | N/A | N/A | ||||||||||||||||||||||||||||||||||||
| PIMCO Municipal Income Fund III | ||||||||||||||||||||||||||||||||||||||||||||||||||||
| 12/31/2022 | $ | 11.41 | $ | 0.57 | $ | (3.31 | ) | $ | (0.10 | ) | $ | 0.00 | $ | (2.84 | ) | $ | (0.55 | ) | $ | 0.00 | $ | 0.00 | $ | (0.55 | ) | $ | 0.00 | $ | N/A | $ | N/A | |||||||||||||||||||||
| 12/31/2021 | 11.36 | 0.59 | 0.01 | 0.00 | 0.00 | 0.60 | (0.55 | ) | 0.00 | 0.00 | (0.55 | ) | 0.00 | N/A | N/A | |||||||||||||||||||||||||||||||||||||
| 12/31/2020 | 11.34 | 0.62 | 0.01 | (0.05 | ) | 0.00 | 0.58 | (0.55 | ) | (0.01 | ) | 0.00 | (0.56 | ) | 0.00 | N/A | N/A | |||||||||||||||||||||||||||||||||||
| 12/31/2019 | 10.49 | 0.72 | 0.87 | (0.12 | ) | 0.00 | 1.47 | (0.62 | ) | 0.00 | 0.00 | (0.62 | ) | 0.00 | N/A | N/A | ||||||||||||||||||||||||||||||||||||
| 12/31/2018 | 11.06 | 0.76 | (0.57 | ) | (0.13 | ) | 0.00 | 0.06 | (0.67 | ) | (0.11 | ) | 0.00 | (0.78 | ) | 0.15 | N/A | N/A | ||||||||||||||||||||||||||||||||||
| PIMCO California Municipal Income Fund | ||||||||||||||||||||||||||||||||||||||||||||||||||||
| 12/31/2022 | $ | 14.08 | $ | 0.65 | $ | (3.48 | ) | $ | (0.14 | ) | $ | 0.00 | $ | (2.97 | ) | $ | (0.59 | ) | $ | (0.02 | ) | $ | (0.19 | ) | $ | (0.80 | ) | $ | 0.00 | $ | N/A | $ | N/A | |||||||||||||||||||
| 12/31/2021 | 14.28 | 0.71 | (0.12 | ) | (0.01 | ) | 0.00 | 0.58 | (0.78 | ) | 0.00 | 0.00 | (0.78 | ) | 0.00 | N/A | N/A | |||||||||||||||||||||||||||||||||||
| 12/31/2020 | 14.20 | 0.74 | 0.20 | (0.07 | ) | 0.00 | 0.87 | (0.78 | ) | (0.01 | ) | 0.00 | (0.79 | ) | 0.00 | N/A | N/A | |||||||||||||||||||||||||||||||||||
| 12/31/2019 | 13.32 | 0.80 | 1.16 | (0.16 | ) | 0.00 | 1.80 | (0.92 | ) | 0.00 | 0.00 | (0.92 | ) | 0.00 | N/A | N/A | ||||||||||||||||||||||||||||||||||||
| 12/31/2018 | 14.20 | 0.92 | (0.94 | ) | (0.17 | ) | 0.00 | (0.19 | ) | (0.92 | ) | 0.00 | 0.00 | (0.92 | ) | 0.23 | N/A | N/A | ||||||||||||||||||||||||||||||||||
| PIMCO California Municipal Income Fund II | ||||||||||||||||||||||||||||||||||||||||||||||||||||
| 12/31/2022 | $ | 9.11 | $ | 0.39 | $ | (2.50 | ) | $ | (0.09 | ) | $ | 0.00 | $ | (2.20 | ) | $ | (0.36 | ) | $ | 0.00 | $ | (0.02 | ) | $ | (0.38 | ) | $ | 0.00 | $ | N/A | $ | N/A | ||||||||||||||||||||
| 12/31/2021 | 9.13 | 0.40 | (0.04 | ) | 0.00 | 0.00 | 0.36 | (0.38 | ) | 0.00 | 0.00 | (0.38 | ) | 0.00 | N/A | N/A | ||||||||||||||||||||||||||||||||||||
| 12/31/2020 | 8.98 | 0.41 | 0.17 | (0.04 | ) | 0.00 | 0.54 | (0.38 | ) | (0.01 | ) | 0.00 | (0.39 | ) | 0.00 | N/A | N/A | |||||||||||||||||||||||||||||||||||
| 12/31/2019 | 8.29 | 0.50 | 0.87 | (0.10 | ) | 0.00 | 1.27 | (0.42 | ) | (0.16 | ) | 0.00 | (0.58 | ) | 0.00 | N/A | N/A | |||||||||||||||||||||||||||||||||||
| 12/31/2018 | 8.69 | 0.54 | (0.57 | ) | (0.11 | ) | 0.00 | (0.14 | ) | (0.42 | ) | 0.00 | 0.00 | (0.42 | ) | 0.16 | N/A | N/A | ||||||||||||||||||||||||||||||||||
| PIMCO California Municipal Income Fund III | ||||||||||||||||||||||||||||||||||||||||||||||||||||
| 12/31/2022 | $ | 10.20 | $ | 0.48 | $ | (2.43 | ) | $ | (0.09 | ) | $ | 0.00 | $ | (2.04 | ) | $ | (0.46 | ) | $ | 0.00 | $ | 0.00 | $ | (0.46 | ) | $ | 0.00 | $ | N/A | $ | N/A | |||||||||||||||||||||
| 12/31/2021 | 10.29 | 0.52 | (0.15 | ) | 0.00 | 0.00 | 0.37 | (0.46 | ) | 0.00 | 0.00 | (0.46 | ) | 0.00 | N/A | N/A | ||||||||||||||||||||||||||||||||||||
| 12/31/2020 | 10.20 | 0.52 | 0.09 | (0.05 | ) | 0.00 | 0.56 | (0.46 | ) | (0.01 | ) | 0.00 | (0.47 | ) | 0.00 | N/A | N/A | |||||||||||||||||||||||||||||||||||
| 12/31/2019 | 9.46 | 0.56 | 0.80 | (0.11 | ) | 0.00 | 1.25 | (0.51 | ) | 0.00 | 0.00 | (0.51 | ) | 0.00 | N/A | N/A | ||||||||||||||||||||||||||||||||||||
| 12/31/2018 | 9.98 | 0.64 | (0.68 | ) | (0.12 | ) | 0.00 | (0.16 | ) | (0.54 | ) | 0.00 | 0.00 | (0.54 | ) | 0.18 | N/A | N/A | ||||||||||||||||||||||||||||||||||
| PIMCO New York Municipal Income Fund | ||||||||||||||||||||||||||||||||||||||||||||||||||||
| 12/31/2022 | $ | 12.13 | $ | 0.48 | $ | (3.30 | ) | $ | (0.11 | ) | $ | 0.00 | $ | (2.93 | ) | $ | (0.40 | ) | $ | 0.00 | $ | (0.10 | ) | $ | (0.50 | ) | $ | 0.00 | $ | N/A | $ | N/A | ||||||||||||||||||||
| 12/31/2021 | 12.01 | 0.54 | 0.09 | (0.01 | ) | 0.00 | 0.62 | (0.50 | ) | 0.00 | 0.00 | (0.50 | ) | 0.00 | N/A | N/A | ||||||||||||||||||||||||||||||||||||
| 12/31/2020 | 12.15 | 0.60 | (0.17 | ) | (0.06 | ) | 0.00 | 0.37 | (0.50 | ) | (0.01 | ) | 0.00 | (0.51 | ) | 0.00 | N/A | N/A | ||||||||||||||||||||||||||||||||||
| 12/31/2019 | 11.29 | 0.68 | 0.96 | (0.13 | ) | 0.00 | 1.51 | (0.65 | ) | 0.00 | 0.00 | (0.65 | ) | 0.00 | N/A | N/A | ||||||||||||||||||||||||||||||||||||
| 12/31/2018 | 12.06 | 0.70 | (0.77 | ) | (0.13 | ) | 0.00 | (0.20 | ) | (0.68 | ) | 0.00 | 0.00 | (0.68 | ) | 0.11 | N/A | N/A | ||||||||||||||||||||||||||||||||||
| PIMCO New York Municipal Income Fund II | ||||||||||||||||||||||||||||||||||||||||||||||||||||
| 12/31/2022 | $ | 11.66 | $ | 0.47 | $ | (3.25 | ) | $ | (0.11 | ) | $ | 0.00 | $ | (2.89 | ) | $ | (0.48 | ) | $ | 0.00 | $ | 0.00 | $ | (0.48 | ) | $ | 0.00 | $ | N/A | $ | N/A | |||||||||||||||||||||
| 12/31/2021 | 11.50 | 0.48 | 0.17 | (0.01 | ) | 0.00 | 0.64 | (0.48 | ) | 0.00 | 0.00 | (0.48 | ) | 0.00 | N/A | N/A | ||||||||||||||||||||||||||||||||||||
| 12/31/2020 | 11.59 | 0.56 | (0.12 | ) | (0.05 | ) | 0.00 | 0.39 | (0.48 | ) | 0.00 | 0.00 | (0.48 | ) | 0.00 | N/A | N/A | |||||||||||||||||||||||||||||||||||
| 12/31/2019 | 10.67 | 0.63 | 0.93 | (0.13 | ) | 0.00 | 1.43 | (0.51 | ) | 0.00 | 0.00 | (0.51 | ) | 0.00 | N/A | N/A | ||||||||||||||||||||||||||||||||||||
| 12/31/2018 | 11.17 | 0.71 | (0.73 | ) | (0.15 | ) | 0.00 | (0.17 | ) | (0.57 | ) | 0.00 | (0.04 | ) | (0.61 | ) | 0.28 | N/A | N/A | |||||||||||||||||||||||||||||||||
| 20 | PIMCO CLOSED-END FUNDS | See Accompanying Notes |
| Common Share | Ratios/Supplemental Data | |||||||||||||||||||||||||||||||||||||
| Ratios to Average Net Assets Applicable to Common Shareholders | Portfolio Turnover Rate | |||||||||||||||||||||||||||||||||||||
| Net Asset Value End of Year or Period(a) | Market Price End of Year or Period | Total Investment Return(e) | Net Assets Applicable to Common Shareholders End of Year or Period (000s) | Expenses(f)(g) | Expenses Excluding Waivers(f)(g) | Expenses Excluding Interest Expense(f) | Expenses Excluding Interest Expense and Waivers(f) | Net Investment Income (Loss)(f) | ||||||||||||||||||||||||||||||
| $ | 9.51 | $ | 10.43 | (27.24 | )% | $ | 248,707 | 1.67 | % | 1.67 | % | 1.26 | % | 1.26 | % | 6.38 | % | 36 | % | |||||||||||||||||||
| 13.33 | 15.22 | 15.11 | 347,062 | 1.36 | 1.36 | 1.19 | 1.19 | 5.33 | 18 | |||||||||||||||||||||||||||||
| 13.22 | 13.85 | (2.99 | ) | 343,020 | 1.59 | 1.59 | 1.23 | 1.23 | 5.71 | 21 | ||||||||||||||||||||||||||||
| 13.35 | 15.10 | 26.76 | 345,113 | 1.92 | 1.92 | 1.18 | 1.18 | 6.20 | 16 | |||||||||||||||||||||||||||||
| 12.36 | 12.55 | 2.22 | 318,313 | 1.77 | 1.77 | 1.23 | 1.23 | 7.16 | 24 | |||||||||||||||||||||||||||||
| $ | 8.76 | $ | 9.04 | (33.71 | )% | $ | 578,039 | 1.77 | % | 1.77 | % | 1.14 | % | 1.14 | % | 6.08 | % | 33 | % | |||||||||||||||||||
| 12.37 | 14.61 | 7.47 | 783,316 | 1.30 | 1.30 | 1.08 | 1.08 | 5.32 | 13 | |||||||||||||||||||||||||||||
| 12.42 | 14.30 | (4.81 | ) | 782,327 | 1.59 | 1.59 | 1.11 | 1.11 | 5.70 | 20 | ||||||||||||||||||||||||||||
| 12.50 | 15.87 | 25.88 | 782,682 | 2.06 | 2.06 | 1.06 | 1.06 | 6.25 | 12 | |||||||||||||||||||||||||||||
| 11.62 | 13.31 | 7.57 | 723,713 | 1.93 | 1.93 | 1.13 | 1.13 | 6.94 | 23 | |||||||||||||||||||||||||||||
| 12.13 | 13.18 | 14.85 | 751,337 | 1.30 | 1.30 | 1.10 | 1.10 | 6.74 | 12 | |||||||||||||||||||||||||||||
| 11.81 | 12.22 | 3.90 | 727,513 | 1.16 | 1.16 | 1.08 | 1.08 | 6.27 | 12 | |||||||||||||||||||||||||||||
| 12.39 | 12.51 | 6.56 | 760,212 | 1.11 | * | 1.11 | * | 1.10 | * | 1.10 | * | 6.57 | * | 10 | ||||||||||||||||||||||||
| 12.11 | 12.19 | 6.15 | 742,133 | 1.16 | 1.16 | 1.11 | 1.11 | 6.65 | 10 | |||||||||||||||||||||||||||||
| 11.94 | 12.25 | 7.76 | 730,088 | 1.21 | 1.21 | 1.16 | 1.16 | 7.22 | 16 | |||||||||||||||||||||||||||||
| 12.17 | 12.19 | 3.41 | 741,368 | 1.16 | 1.17 | 1.11 | 1.12 | 6.74 | 16 | |||||||||||||||||||||||||||||
| $ | 8.02 | $ | 8.71 | (27.40 | )% | $ | 267,714 | 1.76 | % | 1.76 | % | 1.22 | % | 1.22 | % | 6.32 | % | 32 | % | |||||||||||||||||||
| 11.41 | 12.75 | 12.32 | 379,521 | 1.37 | 1.37 | 1.15 | 1.15 | 5.18 | 9 | |||||||||||||||||||||||||||||
| 11.36 | 11.89 | (0.54 | ) | 376,741 | 1.64 | 1.64 | 1.18 | 1.18 | 5.57 | 25 | ||||||||||||||||||||||||||||
| 11.34 | 12.58 | 19.03 | 374,805 | 2.04 | 2.04 | 1.14 | 1.14 | 6.48 | 14 | |||||||||||||||||||||||||||||
| 10.49 | 11.14 | 3.39 | 345,557 | 1.89 | 1.89 | 1.19 | 1.19 | 7.11 | 25 | |||||||||||||||||||||||||||||
| | | | ||||||||||||||||||||||||||||||||||||
| $ | 10.31 | $ | 15.07 | (14.34 | )% | $ | 195,462 | 1.78 | % | 1.78 | % | 1.26 | % | 1.26 | % | 5.73 | % | 28 | % | |||||||||||||||||||
| 14.08 | 18.58 | 7.99 | 266,321 | 1.44 | 1.44 | 1.20 | 1.20 | 5.05 | 11 | |||||||||||||||||||||||||||||
| 14.28 | 17.98 | (4.94 | ) | 269,561 | 1.67 | 1.67 | 1.22 | 1.22 | 5.28 | 15 | ||||||||||||||||||||||||||||
| 14.20 | 19.86 | 29.47 | 267,390 | 2.09 | 2.09 | 1.18 | 1.18 | 5.75 | 16 | |||||||||||||||||||||||||||||
| 13.32 | 16.15 | (0.66 | ) | 250,306 | 2.10 | 2.10 | 1.23 | 1.23 | 6.80 | 29 | ||||||||||||||||||||||||||||
| | | | ||||||||||||||||||||||||||||||||||||
| $ | 6.53 | $ | 6.79 | (23.32 | )% | $ | 210,581 | 1.77 | % | 1.77 | % | 1.29 | % | 1.29 | % | 5.49 | % | 27 | % | |||||||||||||||||||
| 9.11 | 9.35 | 7.99 | 293,165 | 1.41 | 1.41 | 1.21 | 1.21 | 4.44 | 11 | |||||||||||||||||||||||||||||
| 9.13 | 9.03 | (5.58 | ) | 293,591 | 1.62 | 1.62 | 1.23 | 1.23 | 4.68 | 19 | ||||||||||||||||||||||||||||
| 8.98 | 10.00 | 36.01 | 288,138 | 1.99 | 1.99 | 1.18 | 1.18 | 5.61 | 16 | |||||||||||||||||||||||||||||
| 8.29 | 7.83 | (19.01 | ) | 265,245 | 1.88 | 1.88 | 1.29 | 1.29 | 6.51 | 37 | ||||||||||||||||||||||||||||
| $ | 7.70 | $ | 8.35 | (20.55 | )% | $ | 172,972 | 1.80 | % | 1.80 | % | 1.27 | % | 1.27 | % | 5.71 | % | 28 | % | |||||||||||||||||||
| 10.20 | 11.10 | 13.11 | 228,733 | 1.45 | 1.45 | 1.21 | 1.21 | 5.06 | 13 | |||||||||||||||||||||||||||||
| 10.29 | 10.25 | (5.89 | ) | 230,271 | 1.68 | 1.68 | 1.23 | 1.23 | 5.13 | 13 | ||||||||||||||||||||||||||||
| 10.20 | 11.41 | 25.66 | 227,745 | 2.12 | 2.12 | 1.20 | 1.20 | 5.59 | 16 | |||||||||||||||||||||||||||||
| 9.46 | 9.53 | (3.49 | ) | 210,974 | 2.13 | 2.13 | 1.25 | 1.25 | 6.70 | 21 | ||||||||||||||||||||||||||||
| | | | ||||||||||||||||||||||||||||||||||||
| $ | 8.70 | $ | 9.03 | (22.47 | )% | $ | 68,397 | 1.49 | % | 1.49 | % | 1.24 | % | 1.24 | % | 4.90 | % | 45 | % | |||||||||||||||||||
| 12.13 | 12.29 | 9.70 | 95,190 | 1.25 | 1.25 | 1.20 | 1.20 | 4.44 | 23 | |||||||||||||||||||||||||||||
| 12.01 | 11.68 | (11.51 | ) | 94,059 | 1.52 | 1.52 | 1.23 | 1.23 | 5.13 | 26 | ||||||||||||||||||||||||||||
| 12.15 | 13.80 | 24.04 | 95,010 | 1.97 | 1.97 | 1.19 | 1.19 | 5.74 | 25 | |||||||||||||||||||||||||||||
| 11.29 | 11.70 | (2.90 | ) | 87,913 | 1.81 | 1.81 | 1.27 | 1.27 | 6.11 | 22 | ||||||||||||||||||||||||||||
| $ | 8.29 | $ | 7.95 | (26.06 | )% | $ | 92,937 | 1.93 | % | 1.93 | % | 1.38 | % | 1.38 | % | 5.10 | % | 42 | % | |||||||||||||||||||
| 11.66 | 11.35 | 8.87 | 130,581 | 1.57 | 1.57 | 1.31 | 1.31 | 4.18 | 14 | |||||||||||||||||||||||||||||
| 11.50 | 10.87 | (5.82 | ) | 128,709 | 1.84 | 1.84 | 1.35 | 1.35 | 4.97 | 22 | ||||||||||||||||||||||||||||
| 11.59 | 12.07 | 20.57 | 129,596 | 2.16 | 2.16 | 1.27 | 1.27 | 5.62 | 17 | |||||||||||||||||||||||||||||
| 10.67 | 10.47 | (7.67 | ) | 119,014 | 2.15 | 2.15 | 1.40 | 1.40 | 6.64 | 24 | ||||||||||||||||||||||||||||
| ANNUAL REPORT | | | DECEMBER 31, 2022 | 21 |
| Financial Highlights | (Cont.) |
| Investment Operations | Less Distributions to Preferred Shareholders(c) | Less Distributions to Common Shareholders(d) | ||||||||||||||||||||||||||||||||||||||||||||||||||
| Selected Per Share Data for the Year or Period Ended^: | Net Asset Value Beginning of Year or Period(a) | Net Investment Income (Loss)(b) | Net Realized/ Unrealized Gain (Loss) | From Net Investment Income | From Net Realized Capital Gains | Net Increase (Decrease) in Net Assets Applicable to Common Shareholders Resulting from Operations | From Net Investment Income | From Net Realized Capital Gains | Tax Basis Return of Capital | Total | Increase Resulting from Tender of ARPS(c) | Increase Resulting from Common Share Offering | Offering Cost Charged to Paid in Capital | |||||||||||||||||||||||||||||||||||||||
| PIMCO New York Municipal Income Fund III | ||||||||||||||||||||||||||||||||||||||||||||||||||||
| 12/31/2022 | $ | 9.20 | $ | 0.42 | $ | (2.42 | ) | $ | (0.11 | ) | $ | 0.00 | $ | (2.11 | ) | $ | (0.33 | ) | $ | 0.00 | $ | (0.10 | ) | $ | (0.43 | ) | $ | 0.00 | $ | N/A | $ | N/A | ||||||||||||||||||||
| 12/31/2021 | 9.15 | 0.44 | 0.05 | (0.01 | ) | 0.00 | 0.48 | (0.43 | ) | 0.00 | 0.00 | (0.43 | ) | 0.00 | N/A | N/A | ||||||||||||||||||||||||||||||||||||
| 12/31/2020 | 9.29 | 0.48 | (0.14 | ) | (0.05 | ) | 0.00 | 0.29 | (0.42 | ) | 0.00 | (0.01 | ) | (0.43 | ) | 0.00 | N/A | N/A | ||||||||||||||||||||||||||||||||||
| 12/31/2019 | 8.66 | 0.55 | 0.66 | (0.13 | ) | 0.00 | 1.08 | (0.41 | ) | 0.00 | (0.04 | ) | (0.45 | ) | 0.00 | N/A | N/A | |||||||||||||||||||||||||||||||||||
| 12/31/2018 | 9.27 | 0.57 | (0.61 | ) | (0.13 | ) | 0.00 | (0.17 | ) | (0.49 | ) | 0.00 | (0.02 | ) | (0.51 | ) | 0.07 | N/A | N/A | |||||||||||||||||||||||||||||||||
| 22 | PIMCO CLOSED-END FUNDS | See Accompanying Notes |
| Common Share | Ratios/Supplemental Data | |||||||||||||||||||||||||||||||||||||
| Ratios to Average Net Assets Applicable to Common Shareholders | Portfolio Turnover Rate | |||||||||||||||||||||||||||||||||||||
| Net Asset Value End of Year or Period(a) | Market Price End of Year or Period | Total Investment Return(e) | Net Assets Applicable to Common Shareholders End of Year or Period (000s) | Expenses(f)(g) | Expenses Excluding Waivers(f)(g) | Expenses Excluding Interest Expense(f) | Expenses Excluding Interest Expense and Waivers(f) | Net Investment Income (Loss)(f) | ||||||||||||||||||||||||||||||
| $ | 6.66 | $ | 6.83 | (22.40 | )% | $ | 38,240 | 1.69 | % | 1.69 | % | 1.55 | % | 1.55 | % | 5.64 | % | 38 | % | |||||||||||||||||||
| 9.20 | 9.31 | 8.99 | 52,786 | 1.62 | 1.62 | 1.49 | 1.49 | 4.78 | 16 | |||||||||||||||||||||||||||||
| 9.15 | 8.93 | (2.75 | ) | 52,414 | 1.80 | 1.80 | 1.49 | 1.49 | 5.32 | 27 | ||||||||||||||||||||||||||||
| 9.29 | 9.63 | 16.76 | 53,135 | 2.19 | 2.19 | 1.47 | 1.47 | 6.06 | 14 | |||||||||||||||||||||||||||||
| 8.66 | 8.65 | (7.67 | ) | 49,484 | 2.18 | 2.18 | 1.54 | 1.54 | 6.45 | 24 | ||||||||||||||||||||||||||||
| ANNUAL REPORT | | | DECEMBER 31, 2022 | 23 |
| Financial Highlights | (Cont.) |
| ARPS | RVMTP(5) | |||||||||||||||||||||||||||||||
| Selected Per Share Data for the Year or Period Ended^: | Total Amount Outstanding | Asset Coverage per Preferred Share(1) | Involuntary Liquidating Preference per Preferred Share(2) | Average Market Value per ARPS(3) | Total Amount Outstanding | Asset Coverage per Preferred Share(1) | Involuntary Liquidating Preference per Preferred Share(2) | Average Market Value per RVMTP(4) | ||||||||||||||||||||||||
| PIMCO Municipal Income Fund | ||||||||||||||||||||||||||||||||
| 12/31/2022 | $ | 166,700,000 | $ | 58,598 | $ | 25,000 | N/A | $ | 18,200,000 | $ | 234,390 | $ | 100,000 | N/A | ||||||||||||||||||
| 12/31/2021 | 166,700,000 | 70,665 | 25,000 | N/A | 23,300,000 | 282,660 | 100,000 | N/A | ||||||||||||||||||||||||
| 12/31/2020 | 166,700,000 | 70,133 | 25,000 | N/A | 23,300,000 | 280,530 | 100,000 | N/A | ||||||||||||||||||||||||
| 12/31/2019 | 166,700,000 | 70,395 | 25,000 | N/A | 23,300,000 | 281,580 | 100,000 | N/A | ||||||||||||||||||||||||
| 12/31/2018 | 166,700,000 | 66,868 | 25,000 | N/A | 23,300,000 | 267,440 | 100,000 | N/A | ||||||||||||||||||||||||
| PIMCO Municipal Income Fund II | ||||||||||||||||||||||||||||||||
| 12/31/2022 | $ | 298,275,000 | $ | 64,345 | $ | 25,000 | N/A | $ | 68,700,000 | $ | 257,380 | $ | 100,000 | N/A | ||||||||||||||||||
| 12/31/2021 | 298,275,000 | 78,363 | 25,000 | N/A | 68,700,000 | 313,450 | 100,000 | N/A | ||||||||||||||||||||||||
| 12/31/2020 | 298,275,000 | 78,293 | 25,000 | N/A | 68,700,000 | 313,170 | 100,000 | N/A | ||||||||||||||||||||||||
| 12/31/2019 | 298,275,000 | 78,308 | 25,000 | N/A | 68,700,000 | 313,230 | 100,000 | N/A | ||||||||||||||||||||||||
| 12/31/2018 | 298,275,000 | 74,285 | 25,000 | N/A | 68,700,000 | 297,110 | 100,000 | N/A | ||||||||||||||||||||||||
| 12/31/2017+ | 367,000,000 | 76,136 | 25,000 | N/A | N/A | N/A | 100,000 | N/A | ||||||||||||||||||||||||
| 12/31/2016+ | 367,000,000 | 74,548 | 25,000 | N/A | N/A | N/A | 100,000 | N/A | ||||||||||||||||||||||||
| 6/1/2015 ‑ 12/31/2015(h)+ | 367,000,000 | 76,782 | 25,000 | N/A | N/A | N/A | 100,000 | N/A | ||||||||||||||||||||||||
| 5/31/2015+ | 367,000,000 | 75,553 | 25,000 | N/A | N/A | N/A | 100,000 | N/A | ||||||||||||||||||||||||
| 5/31/2014+ | 367,000,000 | 74,733 | 25,000 | N/A | N/A | N/A | 100,000 | N/A | ||||||||||||||||||||||||
| 5/31/2013+ | 367,000,000 | 75,501 | 25,000 | N/A | N/A | N/A | 100,000 | N/A | ||||||||||||||||||||||||
| PIMCO Municipal Income Fund III | ||||||||||||||||||||||||||||||||
| 12/31/2022 | $ | 154,700,000 | $ | 60,383 | $ | 25,000 | N/A | $ | 34,300,000 | $ | 241,530 | $ | 100,000 | N/A | ||||||||||||||||||
| 12/31/2021 | 154,700,000 | 75,200 | 25,000 | N/A | 34,300,000 | 300,800 | 100,000 | N/A | ||||||||||||||||||||||||
| 12/31/2020 | 154,700,000 | 74,833 | 25,000 | N/A | 34,300,000 | 299,330 | 100,000 | N/A | ||||||||||||||||||||||||
| 12/31/2019 | 154,700,000 | 74,565 | 25,000 | N/A | 34,300,000 | 298,260 | 100,000 | N/A | ||||||||||||||||||||||||
| 12/31/2018 | 154,700,000 | 70,693 | 25,000 | N/A | 34,300,000 | 282,740 | 100,000 | N/A | ||||||||||||||||||||||||
| PIMCO California Municipal Income Fund | ||||||||||||||||||||||||||||||||
| 12/31/2022 | $ | 120,625,000 | $ | 58,655 | $ | 25,000 | N/A | $ | 24,400,000 | $ | 234,620 | $ | 100,000 | N/A | ||||||||||||||||||
| 12/31/2021 | 120,625,000 | 69,408 | 25,000 | N/A | 29,300,000 | 277,630 | 100,000 | N/A | ||||||||||||||||||||||||
| 12/31/2020 | 120,625,000 | 69,948 | 25,000 | N/A | 29,300,000 | 279,790 | 100,000 | N/A | ||||||||||||||||||||||||
| 12/31/2019 | 120,625,000 | 69,580 | 25,000 | N/A | 29,300,000 | 278,320 | 100,000 | N/A | ||||||||||||||||||||||||
| 12/31/2018 | 120,625,000 | 66,725 | 25,000 | N/A | 29,300,000 | 266,870 | 100,000 | N/A | ||||||||||||||||||||||||
| PIMCO California Municipal Income Fund II | ||||||||||||||||||||||||||||||||
| 12/31/2022 | $ | 128,675,000 | $ | 58,680 | $ | 25,000 | N/A | $ | 27,500,000 | $ | 234,720 | $ | 100,000 | N/A | ||||||||||||||||||
| 12/31/2021 | 128,675,000 | 69,970 | 25,000 | N/A | 34,300,000 | 279,880 | 100,000 | N/A | ||||||||||||||||||||||||
| 12/31/2020 | 128,675,000 | 70,035 | 25,000 | N/A | 34,300,000 | 280,140 | 100,000 | N/A | ||||||||||||||||||||||||
| 12/31/2019 | 128,675,000 | 69,188 | 25,000 | N/A | 34,300,000 | 276,750 | 100,000 | N/A | ||||||||||||||||||||||||
| 12/31/2018 | 128,675,000 | 65,675 | 25,000 | N/A | 34,300,000 | 262,670 | 100,000 | N/A | ||||||||||||||||||||||||
| PIMCO California Municipal Income Fund III | ||||||||||||||||||||||||||||||||
| 12/31/2022 | $ | 97,875,000 | $ | 59,578 | $ | 25,000 | N/A | $ | 27,100,000 | $ | 238,310 | $ | 100,000 | N/A | ||||||||||||||||||
| 12/31/2021 | 97,875,000 | 70,755 | 25,000 | N/A | 27,100,000 | 283,020 | 100,000 | N/A | ||||||||||||||||||||||||
| 12/31/2020 | 97,875,000 | 71,063 | 25,000 | N/A | 27,100,000 | 284,250 | 100,000 | N/A | ||||||||||||||||||||||||
| 12/31/2019 | 97,875,000 | 70,545 | 25,000 | N/A | 27,100,000 | 282,180 | 100,000 | N/A | ||||||||||||||||||||||||
| 12/31/2018 | 97,875,000 | 67,188 | 25,000 | N/A | 27,100,000 | 268,720 | 100,000 | N/A | ||||||||||||||||||||||||
| PIMCO New York Municipal Income Fund | ||||||||||||||||||||||||||||||||
| 12/31/2022 | $ | 41,025,000 | $ | 66,640 | $ | 25,000 | N/A | N/A | N/A | $ | 100,000 | N/A | ||||||||||||||||||||
| 12/31/2021 | 41,025,000 | 83,005 | 25,000 | N/A | N/A | N/A | 100,000 | N/A | ||||||||||||||||||||||||
| 12/31/2020 | 41,025,000 | 82,318 | 25,000 | N/A | N/A | N/A | 100,000 | N/A | ||||||||||||||||||||||||
| 12/31/2019 | 41,025,000 | 82,875 | 25,000 | N/A | N/A | N/A | 100,000 | N/A | ||||||||||||||||||||||||
| 12/31/2018 | 41,025,000 | 78,545 | 25,000 | N/A | N/A | N/A | 100,000 | N/A | ||||||||||||||||||||||||
| 24 | PIMCO CLOSED-END FUNDS | See Accompanying Notes |
| ARPS | RVMTP(5) | |||||||||||||||||||||||||||||||
| Selected Per Share Data for the Year or Period Ended^: | Total Amount Outstanding | Asset Coverage per Preferred Share(1) | Involuntary Liquidating Preference per Preferred Share(2) | Average Market Value per ARPS(3) | Total Amount Outstanding | Asset Coverage per Preferred Share(1) | Involuntary Liquidating Preference per Preferred Share(2) | Average Market Value per RVMTP(4) | ||||||||||||||||||||||||
| PIMCO New York Municipal Income Fund II | ||||||||||||||||||||||||||||||||
| 12/31/2022 | $ | 58,000,000 | $ | 56,845 | $ | 25,000 | N/A | $ | 14,900,000 | $ | 227,380 | $ | 100,000 | N/A | ||||||||||||||||||
| 12/31/2021 | 58,000,000 | 66,323 | 25,000 | N/A | 21,000,000 | 265,290 | 100,000 | N/A | ||||||||||||||||||||||||
| 12/31/2020 | 58,000,000 | 65,730 | 25,000 | N/A | 21,000,000 | 262,920 | 100,000 | N/A | ||||||||||||||||||||||||
| 12/31/2019 | 58,000,000 | 66,003 | 25,000 | N/A | 21,000,000 | 264,010 | 100,000 | N/A | ||||||||||||||||||||||||
| 12/31/2018 | 58,000,000 | 62,655 | 25,000 | N/A | 21,000,000 | 250,600 | 100,000 | N/A | ||||||||||||||||||||||||
| PIMCO New York Municipal Income Fund III | ||||||||||||||||||||||||||||||||
| 12/31/2022 | $ | 29,450,000 | $ | 57,425 | $ | 25,000 | N/A | N/A | N/A | $ | 100,000 | N/A | ||||||||||||||||||||
| 12/31/2021 | 29,450,000 | 69,808 | 25,000 | N/A | N/A | N/A | 100,000 | N/A | ||||||||||||||||||||||||
| 12/31/2020 | 29,450,000 | 69,493 | 25,000 | N/A | N/A | N/A | 100,000 | N/A | ||||||||||||||||||||||||
| 12/31/2019 | 29,450,000 | 70,100 | 25,000 | N/A | N/A | N/A | 100,000 | N/A | ||||||||||||||||||||||||
| 12/31/2018 | 29,450,000 | 66,985 | 25,000 | N/A | N/A | N/A | 100,000 | N/A | ||||||||||||||||||||||||
| ^ | A zero balance may reflect actual amounts rounding to less than $0.01 or 0.01%. |
| + | Unaudited. Information is presented in conformance with annual reporting requirements for funds that have filed a registration statement pursuant to General Instruction A.2 of Form N-2 (“Short Form N-2”). |
| * | Annualized, except for organization expense, if any. |
| (a) | Includes adjustments required by U.S. GAAP and may differ from net asset values and performance reported elsewhere by the Funds. |
| (b) | Per share amounts based on average number of common shares outstanding during the year or period. |
| (c) | Auction Rate Preferred Shareholders (“ARPS”). See Note 13, Auction Rate Preferred Shares, in the Notes to Financial Statements for more information. |
| (d) | The tax characterization of distributions is determined in accordance with Federal income tax regulations. See Note 2, Distributions — Common Shares, in the Notes to Financial Statements for more information. |
| (e) | Total investment return is calculated assuming a purchase of a common share at the market price on the first day and a sale of a common share at the market price on the last day of each year or period reported. Dividends and distributions, if any, are assumed, for purposes of this calculation, to be reinvested at prices obtained under the Funds’ dividend reinvestment plan. Total investment return does not reflect brokerage commissions in connection with the purchase or sale of Fund shares. |
| (f) | Calculated on the basis of income and expenses applicable to both common and preferred shares relative to the average net assets of common shareholders. The expense ratio and net investment income do not reflect the effects of dividend payments to preferred shareholders. |
| (g) | Ratio includes interest expense which primarily relates to participation in borrowing and financing transactions, interest paid to RVMTP shareholders and the amortization of debt issuance costs of RVMTP Shares. See Note 5, Borrowings and Other Financing Transactions and Note 13, Remarketable Variable Rate MuniFund Term Preferred Shares in the Notes to Financial Statements for more information. |
| (h) | Fiscal year end changed from May 31st to December 31st. |
| (i) | Total distributions for the period ended December 31, 2015 may be lower than prior fiscal years due to fiscal year end changes resulting in a reduction of the amount of days in the period ended December 31, 2015. |
| 1 | “Asset Coverage per Preferred Share” means the ratio that the value of the total assets of the Fund, less all liabilities and indebtedness not represented by ARPS or RVMTP, bears to the aggregate of the involuntary liquidation preference of ARPS or RVMTP, expressed as a dollar amount per ARPS or RVMTP. |
| 2 | “Involuntary Liquidating Preference” means the amount to which a holder of ARPS or RVMTP would be entitled upon the involuntary liquidation of the Fund in preference to the Common Shareholders, expressed as a dollar amount per Preferred Share. |
| 3 | The ARPS have no readily ascertainable market value. Auctions for the ARPS have failed since February 2008, there is currently no active trading market for the ARPS and the Fund is not able to reliably estimate what their value would be in a third-party market sale. The liquidation value of the ARPS represents its liquidation preference, which approximates fair value of the shares less any accumulated unpaid dividends. See Note 13, Auction Rate Preferred Shares, in the Notes to Financial Statements for more information. |
| 4 | The RVMTP have no readily ascertainable market value. The liquidation value of the RVMTP represents its liquidation preference, which approximates fair value of the shares less any unamortized debt issuance costs. See Note 13, Remarketable Variable Rate MuniFund Term Preferred Shares, in the Notes to Financial Statements for more information. |
| 5 | Prior to July 14, 2021, RVMTP Shares were VMTP Shares. See Note 13, Remarketable Variable Rate MuniFund Term Preferred Shares. |
| ANNUAL REPORT | | | DECEMBER 31, 2022 | 25 |
| Statements of Assets and Liabilities |
| (Amounts in thousands†, except per share amounts) | PIMCO Municipal Income Fund | PIMCO Municipal Income Fund II | PIMCO Municipal Income Fund III | PIMCO California Municipal Income Fund | ||||||||||||
| Assets: | ||||||||||||||||
| Investments, at value | ||||||||||||||||
| Investments in securities* | $ | 448,436 | $ | 1,016,189 | $ | 477,890 | $ | 349,222 | ||||||||
| Cash | 0 | 1 | 1 | 0 | ||||||||||||
| Receivable for investments sold | 0 | 0 | 0 | 0 | ||||||||||||
| Interest and/or dividends receivable | 5,189 | 11,625 | 5,611 | 4,471 | ||||||||||||
| Other assets | 52 | 85 | 52 | 108 | ||||||||||||
| Total Assets | 453,677 | 1,027,900 | 483,554 | 353,801 | ||||||||||||
| Liabilities: | ||||||||||||||||
| Borrowings & Other Financing Transactions | ||||||||||||||||
| Payable for tender option bond floating rate certificates | $ | 17,170 | $ | 77,027 | $ | 22,780 | $ | 11,686 | ||||||||
| Remarketable Variable Rate MuniFund Term Preferred Shares, at liquidation value** | 18,168 | 68,642 | 34,262 | 24,365 | ||||||||||||
| Payable for investments purchased | 1,032 | 1,032 | 2,063 | 0 | ||||||||||||
| Distributions payable to common shareholders | 1,412 | 3,894 | 1,536 | 1,233 | ||||||||||||
| Distributions payable to auction rate preferred shareholders | 160 | 286 | 147 | 161 | ||||||||||||
| Accrued management fees | 280 | 594 | 295 | 220 | ||||||||||||
| Other liabilities | 48 | 111 | 57 | 49 | ||||||||||||
| Total Liabilities | 38,270 | 151,586 | 61,140 | 37,714 | ||||||||||||
Auction Rate Preferred Shares^ | 166,700 | 298,275 | 154,700 | 120,625 | ||||||||||||
| Net Assets Applicable to Common Shareholders | $ | 248,707 | $ | 578,039 | $ | 267,714 | $ | 195,462 | ||||||||
| Net Assets Applicable to Common Shareholders Consist of: | ||||||||||||||||
Par value^^ | $ | 0 | $ | 1 | $ | 0 | $ | 0 | ||||||||
| Paid in capital in excess of par | 289,051 | 678,820 | 315,224 | 223,219 | ||||||||||||
| Distributable earnings (accumulated loss) | (40,344 | ) | (100,782 | ) | (47,510 | ) | (27,757 | ) | ||||||||
| Net Assets Applicable to Common Shareholders | $ | 248,707 | $ | 578,039 | $ | 267,714 | $ | 195,462 | ||||||||
Net Asset Value Per Common Share(a) | $ | 9.51 | $ | 8.76 | $ | 8.02 | $ | 10.31 | ||||||||
| Common Shares Outstanding | 26,148 | 65,990 | 33,386 | 18,967 | ||||||||||||
| Auction Rate Preferred Shares Issued and Outstanding | 7 | 12 | 6 | 5 | ||||||||||||
| Cost of investments in securities | $ | 467,255 | $ | 1,054,834 | $ | 500,040 | $ | 359,853 | ||||||||
| * Includes repurchase agreements of: | $ | 3,280 | $ | 1,357 | $ | 2,409 | $ | 3,434 | ||||||||
| ** Includes unamortized debt issuance cost of | $ | 32 | $ | 58 | $ | 38 | $ | 35 | ||||||||
| † | A zero balance may reflect actual amounts rounding to less than one thousand. |
| ^ | ($0.00001 par value and $25,000 liquidation preference per share) |
| ^^ | ($0.00001 per share) |
| (a) | Includes adjustments required by U.S. GAAP and may differ from net asset values and performance reported elsewhere by the Funds. |
| 26 | PIMCO CLOSED-END FUNDS | See Accompanying Notes |
| December 31, 2022 |
PIMCO California Municipal Income Fund II | PIMCO California Municipal Income Fund III | PIMCO New York Municipal Income Fund | PIMCO New York Municipal Income Fund II | PIMCO New York Municipal Income Fund III | ||||||||||||||
| $ | 374,720 | $ | 304,904 | $ | 114,960 | $ | 164,831 | $ | 67,705 | |||||||||
| 1 | 0 | 1 | 1 | 0 | ||||||||||||||
| 0 | 0 | 20 | 1,032 | 10 | ||||||||||||||
| 4,363 | 3,733 | 1,118 | 1,859 | 764 | ||||||||||||||
| 28 | 30 | 13 | 14 | 9 | ||||||||||||||
| 379,112 | 308,667 | 116,112 | 167,737 | 68,488 | ||||||||||||||
| $ | 10,955 | $ | 9,574 | $ | 5,480 | $ | 0 | $ | 0 | |||||||||
| 27,462 | 27,066 | 0 | 14,869 | 0 | ||||||||||||||
| 0 | 0 | 762 | 1,269 | 507 | ||||||||||||||
| 1,032 | 853 | 330 | 449 | 204 | ||||||||||||||
| 124 | 81 | 41 | 57 | 34 | ||||||||||||||
| 236 | 195 | 77 | 112 | 53 | ||||||||||||||
| 47 | 51 | 0 | 44 | 0 | ||||||||||||||
| 39,856 | 37,820 | 6,690 | 16,800 | 798 | ||||||||||||||
| 128,675 | 97,875 | 41,025 | 58,000 | 29,450 | ||||||||||||||
| $ | 210,581 | $ | 172,972 | $ | 68,397 | $ | 92,937 | $ | 38,240 | |||||||||
| $ | 0 | $ | 0 | $ | 0 | $ | 0 | $ | 0 | |||||||||
| 233,986 | 195,267 | 82,480 | 112,308 | 45,458 | ||||||||||||||
| (23,405 | ) | (22,295 | ) | (14,083 | ) | (19,371 | ) | (7,218 | ) | |||||||||
| $ | 210,581 | $ | 172,972 | $ | 68,397 | $ | 92,937 | $ | 38,240 | |||||||||
| $ | 6.53 | $ | 7.70 | $ | 8.70 | $ | 8.29 | $ | 6.66 | |||||||||
| 32,246 | 22,461 | 7,861 | 11,209 | 5,746 | ||||||||||||||
| 5 | 4 | 2 | 2 | 1 | ||||||||||||||
| $ | 380,873 | $ | 313,953 | $ | 120,998 | $ | 172,260 | $ | 70,315 | |||||||||
| $ | 1,323 | $ | 1,566 | $ | 153 | $ | 859 | $ | 2,639 | |||||||||
| $ | 38 | $ | 34 | $ | 0 | $ | 31 | $ | 0 | |||||||||
| ANNUAL REPORT | | | DECEMBER 31, 2022 | 27 |
| Statements of Operations |
| Year Ended December 31, 2022 | ||||||||||||||||
| (Amounts in thousands†) | PIMCO Municipal Income Fund | PIMCO Municipal Income Fund II | PIMCO Municipal Income Fund III | PIMCO California Municipal Income Fund | ||||||||||||
| Investment Income: | ||||||||||||||||
| Interest | $ | 22,450 | $ | 49,629 | $ | 24,425 | $ | 16,172 | ||||||||
| Total Income | 22,450 | 49,629 | 24,425 | 16,172 | ||||||||||||
| Expenses: | ||||||||||||||||
| Management fees | 3,298 | 6,839 | 3,464 | 2,569 | ||||||||||||
| Trustee fees and related expenses | 33 | 75 | 35 | 26 | ||||||||||||
| Interest expense | 1,156 | 3,973 | 1,629 | 1,120 | ||||||||||||
| Auction agent fees and commissions | 154 | 272 | 125 | 102 | ||||||||||||
| Auction rate preferred shares related expenses | 25 | 23 | 41 | 25 | ||||||||||||
| Miscellaneous expense | 7 | 14 | 7 | 5 | ||||||||||||
| Total Expenses | 4,673 | 11,196 | 5,301 | 3,847 | ||||||||||||
| Net Investment Income (Loss) | 17,777 | 38,433 | 19,124 | 12,325 | ||||||||||||
| Net Realized Gain (Loss): | ||||||||||||||||
| Investments in securities | (18,654 | ) | (49,732 | ) | (22,757 | ) | (17,271 | ) | ||||||||
| Net Realized Gain (Loss) | (18,654 | ) | (49,732 | ) | (22,757 | ) | (17,271 | ) | ||||||||
| Net Change in Unrealized Appreciation (Depreciation): | ||||||||||||||||
| Investments in securities | (78,341 | ) | (168,223 | ) | (87,689 | ) | (48,923 | ) | ||||||||
| Net Change in Unrealized Appreciation (Depreciation) | (78,341 | ) | (168,223 | ) | (87,689 | ) | (48,923 | ) | ||||||||
| Net Increase (Decrease) in Net Assets Resulting from Operations | $ | (79,218 | ) | $ | (179,522 | ) | $ | (91,322 | ) | $ | (53,869 | ) | ||||
| Distributions on Auction Rate Preferred Shares from Net Investment Income and/or Realized Capital Gains | $ | (3,548 | ) | $ | (6,348 | ) | $ | (3,291 | ) | $ | (2,654 | ) | ||||
| Net Increase (Decrease) in Net Assets Applicable to Common Shareholders Resulting from Operations | $ | (82,766 | ) | $ | (185,870 | ) | $ | (94,613 | ) | $ | (56,523 | ) | ||||
| † | A zero balance may reflect actual amounts rounding to less than one thousand. |
| 28 | PIMCO CLOSED-END FUNDS | See Accompanying Notes |
| PIMCO California Municipal Income Fund II | PIMCO California Municipal Income Fund III | PIMCO New York Municipal Income Fund | PIMCO New York Municipal Income Fund II | PIMCO New York Municipal Income Fund III | ||||||||||||||
| $ | 16,783 | $ | 14,117 | $ | 4,887 | $ | 7,290 | $ | 3,145 | |||||||||
| 16,783 | 14,117 | 4,887 | 7,290 | 3,145 | ||||||||||||||
| 2,773 | 2,238 | 905 | 1,337 | 622 | ||||||||||||||
| 28 | 22 | 8 | 13 | 4 | ||||||||||||||
| 1,120 | 994 | 189 | 568 | 61 | ||||||||||||||
| 142 | 78 | 35 | 52 | 23 | ||||||||||||||
| 25 | 41 | 1 | 25 | 14 | ||||||||||||||
| 5 | 4 | 2 | 3 | 1 | ||||||||||||||
| 4,093 | 3,377 | 1,140 | 1,998 | 725 | ||||||||||||||
| 12,690 | 10,740 | 3,747 | 5,292 | 2,420 | ||||||||||||||
| (15,771 | ) | (13,379 | ) | (6,413 | ) | (7,103 | ) | (4,298 | ) | |||||||||
| (15,771 | ) | (13,379 | ) | (6,413 | ) | (7,103 | ) | (4,298 | ) | |||||||||
| (64,772 | ) | (41,145 | ) | (19,399 | ) | (29,274 | ) | (9,675 | ) | |||||||||
| (64,772 | ) | (41,145 | ) | (19,399 | ) | (29,274 | ) | (9,675 | ) | |||||||||
| $ | (67,853 | ) | $ | (43,784 | ) | $ | (22,065 | ) | $ | (31,085 | ) | $ | (11,553 | ) | ||||
| $ | (2,738 | ) | $ | (2,094 | ) | $ | (879 | ) | $ | (1,226 | ) | $ | (628 | ) | ||||
| $ | (70,591 | ) | $ | (45,878 | ) | $ | (22,944 | ) | $ | (32,311 | ) | $ | (12,181 | ) | ||||
| ANNUAL REPORT | | | DECEMBER 31, 2022 | 29 |
| Statements of Changes in Net Assets |
PIMCO Municipal Income Fund | PIMCO Municipal Income Fund II | |||||||||||||||
| (Amounts in thousands†) | Year Ended December 31, 2022 | Year Ended December 31, 2021 | Year Ended December 31, 2022 | Year Ended December 31, 2021 | ||||||||||||
| Increase (Decrease) in Net Assets from: | ||||||||||||||||
| Operations: | ||||||||||||||||
| Net investment income (loss) | $ | 17,777 | $ | 18,394 | $ | 38,433 | $ | 41,674 | ||||||||
| Net realized gain (loss) | (18,654 | ) | 1,621 | (49,732 | ) | 1,889 | ||||||||||
| Net change in unrealized appreciation (depreciation) | (78,341 | ) | (163 | ) | (168,223 | ) | (2,294 | ) | ||||||||
| Net Increase (Decrease) in Net Assets Resulting from Operations | (79,218 | ) | 19,852 | (179,522 | ) | 41,269 | ||||||||||
| Distributions on auction rate preferred shares from net investment income and/or realized capital gains | (3,548 | ) | (172 | ) | (6,348 | ) | (294 | ) | ||||||||
| Net Increase (Decrease) in Net Assets Applicable to Common Shareholders Resulting from Operations | (82,766 | ) | 19,680 | (185,870 | ) | 40,975 | ||||||||||
| Distributions to Common Shareholders: | ||||||||||||||||
| From net investment income and/or net realized capital gains | (16,905 | ) | (16,840 | ) | (38,324 | ) | (44,718 | ) | ||||||||
| Tax basis return of capital | 0 | 0 | (6,891 | ) | 0 | |||||||||||
Total Distributions to Common Shareholders(a) | (16,905 | ) | (16,840 | ) | (45,215 | ) | (44,718 | ) | ||||||||
| Common Share Transactions*: | ||||||||||||||||
| Net proceeds from at‑the‑market offering | 0 | 0 | 20,978 | 0 | ||||||||||||
| Issued as reinvestment of distributions | 1,316 | 1,202 | 4,830 | 4,732 | ||||||||||||
| Total increase (decrease) in net assets applicable to common shareholders | (98,355 | ) | 4,042 | (205,277 | ) | 989 | ||||||||||
| Net Assets Applicable to Common Shareholders: | ||||||||||||||||
| Beginning of year | 347,062 | 343,020 | 783,316 | 782,327 | ||||||||||||
| End of year | $ | 248,707 | $ | 347,062 | $ | 578,039 | $ | 783,316 | ||||||||
| * Common Share Transactions: | ||||||||||||||||
| Shares sold | 0 | 0 | 2,216 | 0 | ||||||||||||
| Shares issued as reinvestment of distributions | 120 | 87 | 456 | 339 | ||||||||||||
| † | A zero balance may reflect actual amounts rounding to less than one thousand. |
| (a) | The tax characterization of distributions is determined in accordance with Federal income tax regulations. See Note 2, Distributions — Common Shares, in the Notes to Financial Statements for more information. |
| 30 | PIMCO CLOSED-END FUNDS | See Accompanying Notes |
PIMCO Municipal Income Fund III | PIMCO California Municipal Income Fund | PIMCO California Municipal Income Fund II | PIMCO California Municipal Income Fund III | |||||||||||||||||||||||||||
| Year Ended December 31, 2022 | Year Ended December 31, 2021 | Year Ended December 31, 2022 | Year Ended December 31, 2021 | Year Ended December 31, 2022 | Year Ended December 31, 2021 | Year Ended December 31, 2022 | Year Ended December 31, 2021 | |||||||||||||||||||||||
| $ | 19,124 | $ | 19,606 | $ | 12,325 | $ | 13,473 | $ | 12,690 | $ | 12,957 | $ | 10,740 | $ | 11,577 | |||||||||||||||
| (22,757 | ) | 652 | (17,271 | ) | 330 | (15,771 | ) | 168 | (13,379 | ) | 374 | |||||||||||||||||||
| (87,689 | ) | (195 | ) | (48,923 | ) | (2,908 | ) | (64,772 | ) | (1,478 | ) | (41,145 | ) | (3,580 | ) | |||||||||||||||
| (91,322 | ) | 20,063 | (53,869 | ) | 10,895 | (67,853 | ) | 11,647 | (43,784 | ) | 8,371 | |||||||||||||||||||
| (3,291 | ) | (154 | ) | (2,654 | ) | (121 | ) | (2,738 | ) | (127 | ) | (2,094 | ) | (96 | ) | |||||||||||||||
| (94,613 | ) | 19,909 | (56,523 | ) | 10,774 | (70,591 | ) | 11,520 | (45,878 | ) | 8,275 | |||||||||||||||||||
| (18,392 | ) | (18,331 | ) | (11,443 | ) | (14,739 | ) | (11,735 | ) | (12,353 | ) | (10,233 | ) | (10,215 | ) | |||||||||||||||
| 0 | 0 | (3,671 | ) | 0 | (634 | ) | 0 | 0 | 0 | |||||||||||||||||||||
| (18,392 | ) | (18,331 | ) | (15,114 | ) | (14,739 | ) | (12,369 | ) | (12,353 | ) | (10,233 | ) | (10,215 | ) | |||||||||||||||
| 0 | 0 | 0 | 0 | 0 | 0 | 0 | 0 | |||||||||||||||||||||||
| 1,198 | 1,202 | 778 | 725 | 376 | 407 | 350 | 402 | |||||||||||||||||||||||
| (111,807 | ) | 2,780 | (70,859 | ) | (3,240 | ) | (82,584 | ) | (426 | ) | (55,761 | ) | (1,538 | ) | ||||||||||||||||
| 379,521 | 376,741 | 266,321 | 269,561 | 293,165 | 293,591 | 228,733 | 230,271 | |||||||||||||||||||||||
| $ | 267,714 | $ | 379,521 | $ | 195,462 | $ | 266,321 | $ | 210,581 | $ | 293,165 | $ | 172,972 | $ | 228,733 | |||||||||||||||
| 0 | 0 | 0 | 0 | 0 | 0 | 0 | 0 | |||||||||||||||||||||||
| 130 | 101 | 52 | 42 | 55 | 44 | 42 | 38 | |||||||||||||||||||||||
| ANNUAL REPORT | | | DECEMBER 31, 2022 | 31 |
| Statements of Changes in Net Assets | (Cont.) |
| PIMCO New York Municipal Income Fund | PIMCO New York Municipal Income Fund II | PIMCO New York Municipal Income Fund III | ||||||||||||||||||||||
| (Amounts in thousands†) | Year Ended December 31, 2022 | Year Ended December 31, 2021 | Year Ended December 31, 2022 | Year Ended December 31, 2021 | Year Ended December 31, 2022 | Year Ended December 31, 2021 | ||||||||||||||||||
| Increase (Decrease) in Net Assets from: | ||||||||||||||||||||||||
| Operations: | ||||||||||||||||||||||||
| Net investment income (loss) | $ | 3,747 | $ | 4,198 | $ | 5,292 | $ | 5,418 | $ | 2,420 | $ | 2,516 | ||||||||||||
| Net realized gain (loss) | (6,413 | ) | (368 | ) | (7,103 | ) | (388 | ) | (4,298 | ) | (13 | ) | ||||||||||||
| Net change in unrealized appreciation (depreciation) | (19,399 | ) | 1,041 | (29,274 | ) | 2,106 | (9,675 | ) | 267 | |||||||||||||||
| Net Increase (Decrease) in Net Assets Resulting from Operations | (22,065 | ) | 4,871 | (31,085 | ) | 7,136 | (11,553 | ) | 2,770 | |||||||||||||||
| Distributions on auction rate preferred shares from net investment income and/or realized capital gains | (879 | ) | (40 | ) | (1,226 | ) | (57 | ) | (628 | ) | (29 | ) | ||||||||||||
| Net Increase (Decrease) in Net Assets Applicable to Common Shareholders Resulting from Operations | (22,944 | ) | 4,831 | (32,311 | ) | 7,079 | (12,181 | ) | 2,741 | |||||||||||||||
| Distributions to Common Shareholders: | ||||||||||||||||||||||||
| From net investment income and/or net realized capital gains | (3,155 | ) | (3,951 | ) | (5,385 | ) | (5,380 | ) | (1,858 | ) | (2,441 | ) | ||||||||||||
| Tax basis return of capital | (804 | ) | 0 | 0 | 0 | (587 | ) | 0 | ||||||||||||||||
Total Distributions to Common Shareholders(a) | (3,959 | ) | (3,951 | ) | (5,385 | ) | (5,380 | ) | (2,445 | ) | (2,441 | ) | ||||||||||||
| Common Share Transactions*: | ||||||||||||||||||||||||
| Receipts for shares sold | 0 | 0 | 0 | 0 | 0 | 0 | ||||||||||||||||||
| Issued as reinvestment of distributions | 110 | 251 | 52 | 173 | 80 | 72 | ||||||||||||||||||
| Total increase (decrease) in net assets applicable to common shareholders | (26,793 | ) | 1,131 | (37,644 | ) | 1,872 | (14,546 | ) | 372 | |||||||||||||||
| Net Assets Applicable to Common Shareholders: | ||||||||||||||||||||||||
| Beginning of year | 95,190 | 94,059 | 130,581 | 128,709 | 52,786 | 52,414 | ||||||||||||||||||
| End of year | $ | 68,397 | $ | 95,190 | $ | 92,937 | $ | 130,581 | $ | 38,240 | $ | 52,786 | ||||||||||||
| * Common Share Transactions: | ||||||||||||||||||||||||
| Shares sold | 0 | 0 | 0 | 0 | 0 | 0 | ||||||||||||||||||
| Shares issued as reinvestment of distributions | 11 | 21 | 6 | 14 | 10 | 8 | ||||||||||||||||||
| † | A zero balance may reflect actual amounts rounding to less than one thousand. |
| (a) | The tax characterization of distributions is determined in accordance with Federal income tax regulations. See Note 2, Distributions — Common Shares, in the Notes to Financial Statements for more information. |
| 32 | PIMCO CLOSED-END FUNDS | See Accompanying Notes |
| Statements of Cash Flows |
| (Amounts in thousands†) | PIMCO Municipal Income Fund | PIMCO Municipal Income Fund II | PIMCO Municipal Income Fund III | PIMCO California Municipal Income Fund | ||||||||||||
| Cash Flows Provided by (Used for) Operating Activities: | ||||||||||||||||
| Net increase (decrease) in net assets resulting from operations | $ | (79,218 | ) | $ | (179,522 | ) | $ | (91,322 | ) | $ | (53,869 | ) | ||||
| Adjustments to Reconcile Net Increase (Decrease) in Net Assets from Operations to Net Cash Provided by (Used for) Operating Activities: | ||||||||||||||||
| Purchases of long-term securities | (236,603 | ) | (541,501 | ) | (234,487 | ) | (161,721 | ) | ||||||||
| Proceeds from sales of long-term securities | 285,609 | 655,029 | 304,619 | 220,832 | ||||||||||||
| (Purchases) Proceeds from sales of short-term portfolio investments, net | 4,431 | 19,955 | (3,040 | ) | (4,076 | ) | ||||||||||
| (Increase) decrease in receivable for investments sold | 0 | 0 | 0 | 0 | ||||||||||||
| (Increase) decrease in interest and/or dividends receivable | 736 | 1,675 | 959 | 724 | ||||||||||||
| (Increase) decrease in other assets | 2 | 855 | 11 | 3 | ||||||||||||
| Increase (decrease) in payable for investments purchased | 1,032 | 1,032 | 2,063 | 0 | ||||||||||||
| Increase (decrease) in accrued management fees | (62 | ) | (118 | ) | (67 | ) | (45 | ) | ||||||||
| Increase (decrease) in other liabilities | (392 | ) | (113 | ) | (512 | ) | (373 | ) | ||||||||
| Net Realized (Gain) Loss | ||||||||||||||||
| Investments in securities | 18,654 | 49,732 | 22,757 | 17,271 | ||||||||||||
| Net Change in Unrealized (Appreciation) Depreciation | ||||||||||||||||
| Investments in securities | 78,341 | 168,223 | 87,689 | 48,923 | ||||||||||||
| Net amortization (accretion) on investments | (1,326 | ) | (1,292 | ) | (1,206 | ) | 674 | |||||||||
| Amortization of debt issuance cost | 12 | 13 | 13 | 13 | ||||||||||||
| Net Cash Provided by (Used for) Operating Activities | 71,216 | 173,968 | 87,477 | 68,356 | ||||||||||||
| Cash Flows Received from (Used for) Financing Activities: | ||||||||||||||||
| Proceeds from shares sold | 0 | 20,978 | 0 | 0 | ||||||||||||
| Cash distributions paid to common shareholders* | (15,582 | ) | (40,227 | ) | (17,188 | ) | (14,332 | ) | ||||||||
| Cash distributions paid to auction rate preferred shareholders | (3,392 | ) | (6,068 | ) | (3,147 | ) | (2,496 | ) | ||||||||
| Proceeds from tender option bond transactions | 57,073 | 142,932 | 66,284 | 21,170 | ||||||||||||
| Payments on tender option bond transactions | (104,223 | ) | (291,607 | ) | (133,437 | ) | (67,808 | ) | ||||||||
| Proceeds on Remarketable Variable Rate MuniFund Term Preferred Shares Net | (5,092 | ) | 24 | 12 | (4,890 | ) | ||||||||||
| Net Cash Received from (Used for) Financing Activities | (71,216 | ) | (173,968 | ) | (87,476 | ) | (68,356 | ) | ||||||||
| Net Increase (Decrease) in Cash and Foreign Currency | 0 | 0 | 1 | 0 | ||||||||||||
| Cash and Foreign Currency: | ||||||||||||||||
| Beginning of year | 0 | 1 | 0 | 0 | ||||||||||||
| End of year | $ | 0 | $ | 1 | $ | 1 | $ | 0 | ||||||||
| *Reinvestment of distributions to common shareholders | $ | 1,316 | $ | 4,830 | $ | 1,198 | $ | 778 | ||||||||
| Supplemental Disclosure of Cash Flow Information: | ||||||||||||||||
| Interest expense paid during the year | $ | 1,087 | $ | 3,558 | $ | 1,538 | $ | 1,113 | ||||||||
| † | A zero balance may reflect actual amounts rounding to less than one thousand. |
| ANNUAL REPORT | | | DECEMBER 31, 2022 | 33 |
| Statements of Cash Flows | (Cont.) |
| (Amounts in thousands†) | PIMCO California Municipal Income Fund II | PIMCO California Municipal Income Fund III | PIMCO New York Municipal Income Fund | PIMCO New York Municipal Income Fund II | ||||||||||||
| Cash Flows Provided by (Used for) Operating Activities: | ||||||||||||||||
| Net increase (decrease) in net assets resulting from operations | $ | (67,853 | ) | $ | (43,784 | ) | $ | (22,065 | ) | $ | (31,085 | ) | ||||
| Adjustments to Reconcile Net Increase (Decrease) in Net Assets from Operations to Net Cash Provided by (Used for) Operating Activities: | ||||||||||||||||
| Purchases of long-term securities | (151,485 | ) | (135,478 | ) | (80,883 | ) | (92,455 | ) | ||||||||
| Proceeds from sales of long-term securities | 189,981 | 171,175 | 99,227 | 111,084 | ||||||||||||
| (Purchases) Proceeds from sales of short-term portfolio investments, net | (820 | ) | 903 | 1,111 | 3,565 | |||||||||||
| (Increase) decrease in receivable for investments sold | 0 | 0 | (20 | ) | (1,032 | ) | ||||||||||
| (Increase) decrease in interest and/or dividends receivable | 563 | 456 | 206 | 91 | ||||||||||||
| (Increase) decrease in other assets | (1 | ) | (1 | ) | 799 | 0 | ||||||||||
| Increase (decrease) in payable for investments purchased | 0 | 0 | 762 | 1,269 | ||||||||||||
| Increase (decrease) in accrued management fees | (54 | ) | (33 | ) | (18 | ) | (28 | ) | ||||||||
| Increase (decrease) in other liabilities | (314 | ) | (291 | ) | (42 | ) | (550 | ) | ||||||||
| Net Realized (Gain) Loss | ||||||||||||||||
| Investments in securities | 15,771 | 13,379 | 6,413 | 7,103 | ||||||||||||
| Net Change in Unrealized (Appreciation) Depreciation | ||||||||||||||||
| Investments in securities | 64,772 | 41,145 | 19,399 | 29,274 | ||||||||||||
| Net amortization (accretion) on investments | 196 | 456 | 432 | 522 | ||||||||||||
| Amortization of debt issuance cost | 12 | 13 | 0 | 12 | ||||||||||||
| Net Cash Provided by (Used for) Operating Activities | 50,768 | 47,940 | 25,321 | 27,770 | ||||||||||||
| Cash Flows Received from (Used for) Financing Activities: | ||||||||||||||||
| Proceeds from shares sold | 0 | 0 | 0 | 0 | ||||||||||||
| Cash distributions paid to common shareholders* | (11,991 | ) | (9,882 | ) | (3,849 | ) | (5,333 | ) | ||||||||
| Cash distributions paid to auction rate preferred shareholders | (2,617 | ) | (2,015 | ) | (839 | ) | (1,170 | ) | ||||||||
| Proceeds from tender option bond transactions | 15,800 | 17,015 | 16,538 | 15,172 | ||||||||||||
| Payments on tender option bond transactions | (45,173 | ) | (53,067 | ) | (37,170 | ) | (30,347 | ) | ||||||||
| Proceeds on Remarketable Variable Rate MuniFund Term Preferred Shares Net | (6,787 | ) | 9 | 0 | (6,092 | ) | ||||||||||
| Net Cash Received from (Used for) Financing Activities | (50,768 | ) | (47,940 | ) | (25,320 | ) | (27,770 | ) | ||||||||
| Net Increase (Decrease) in Cash and Foreign Currency | 0 | 0 | 1 | 0 | ||||||||||||
| Cash and Foreign Currency: | ||||||||||||||||
| Beginning of year | 1 | 0 | 0 | 1 | ||||||||||||
| End of year | $ | 1 | $ | 0 | $ | 1 | $ | 1 | ||||||||
| *Reinvestment of distributions to common shareholders | $ | 376 | $ | 350 | $ | 110 | $ | 52 | ||||||||
| Supplemental Disclosure of Cash Flow Information: | ||||||||||||||||
| Interest expense paid during the year | $ | 1,075 | $ | 983 | $ | 188 | $ | 564 | ||||||||
| † | A zero balance may reflect actual amounts rounding to less than one thousand. |
| 34 | PIMCO CLOSED-END FUNDS | See Accompanying Notes |
| Schedule of Investments | PIMCO Municipal Income Fund | December 31, 2022 |
| PRINCIPAL AMOUNT (000S) | MARKET VALUE (000S) | |||||||||||
| INVESTMENTS IN SECURITIES 180.3% | ||||||||||||
| MUNICIPAL BONDS & NOTES 179.0% | ||||||||||||
| ALABAMA 5.5% | ||||||||||||
Jefferson County, Alabama Sewer Revenue Bonds, Series 2013 | ||||||||||||
| 0.000% due 10/01/2050 (d) | $ | 10,000 | $ | 10,216 | ||||||||
| 6.500% due 10/01/2053 | 750 | 801 | ||||||||||
Tuscaloosa County, Alabama Industrial Development Authority Revenue Bonds, Series 2019 | ||||||||||||
| 4.500% due 05/01/2032 | 1,282 | 1,160 | ||||||||||
| 5.250% due 05/01/2044 | 1,575 | 1,386 | ||||||||||
| 13,563 | ||||||||||||
| ALASKA 0.5% | ||||||||||||
Alaska Industrial Development & Export Authority Revenue Bonds, Series 2007 | ||||||||||||
| 6.000% due 12/01/2036 ^(b) | 900 | 2 | ||||||||||
Municipality of Anchorage, Alaska Solid Waste Services Revenue Bonds, Series 2022 | ||||||||||||
| 5.250% due 11/01/2062 | 1,080 | 1,136 | ||||||||||
| 1,138 | ||||||||||||
| ARIZONA 4.2% | ||||||||||||
Arizona Industrial Development Authority Revenue Bonds, Series 2019 | ||||||||||||
| 4.500% due 01/01/2049 | 900 | 521 | ||||||||||
| 5.000% due 01/01/2043 | 550 | 312 | ||||||||||
| 5.500% due 01/01/2054 | 1,500 | 819 | ||||||||||
Arizona Industrial Development Authority Revenue Bonds, Series 2020 | ||||||||||||
| 7.750% due 07/01/2050 | 1,100 | 770 | ||||||||||
Industrial Development Authority of the County, Arizona of Pima Revenue Bonds, Series 2020 | ||||||||||||
| 5.000% due 07/01/2055 | 1,100 | 940 | ||||||||||
Maricopa County, Arizona Industrial Development Authority Revenue Bonds, Series 2019 | ||||||||||||
| 4.000% due 01/01/2044 | 3,500 | 3,301 | ||||||||||
Phoenix Civic Improvement Corp., Arizona Revenue Bonds, Series 2019 | ||||||||||||
| 4.000% due 07/01/2049 | 2,295 | 2,103 | ||||||||||
| 5.000% due 07/01/2049 | 1,700 | 1,753 | ||||||||||
| 10,519 | ||||||||||||
| ARKANSAS 1.2% | ||||||||||||
Arkansas Development Finance Authority Revenue Bonds, (AMBAC Insured), Series 2006 | ||||||||||||
| 0.000% due 07/01/2036 (c) | 5,500 | 3,091 | ||||||||||
| CALIFORNIA 6.6% | ||||||||||||
Bay Area Toll Authority, California Revenue Bonds, Series 2014 | ||||||||||||
| 5.000% due 10/01/2054 | 3,000 | 3,119 | ||||||||||
California County Tobacco Securitization Agency Revenue Bonds, Series 2002 | ||||||||||||
| 6.000% due 06/01/2035 | 1,150 | 1,151 | ||||||||||
California Health Facilities Financing Authority Revenue Bonds, Series 2020 | ||||||||||||
| 4.000% due 04/01/2049 | 2,000 | 1,737 | ||||||||||
California State General Obligation Bonds, Series 2019 | ||||||||||||
| 5.000% due 04/01/2045 | 1,000 | 1,077 | ||||||||||
Golden State, California Tobacco Securitization Corp. Revenue Bonds, Series 2021 | ||||||||||||
| 0.000% due 06/01/2066 (c) | 2,500 | 291 | ||||||||||
Golden State, California Tobacco Securitization Corp. Revenue Bonds, Series 2022 | ||||||||||||
| 5.000% due 06/01/2051 | 1,000 | 1,028 | ||||||||||
Long Beach Bond Finance Authority, California Revenue Bonds, Series 2007 | ||||||||||||
| 5.500% due 11/15/2030 | 1,405 | 1,536 | ||||||||||
| PRINCIPAL AMOUNT (000S) | MARKET VALUE (000S) | |||||||||||
Los Angeles County, California Public Works Financing Authority Revenue Bonds, Series 2021 | ||||||||||||
| 4.000% due 12/01/2046 | $ | 1,385 | $ | 1,311 | ||||||||
Los Angeles Department of Airports, California Revenue Bonds, Series 2020 | ||||||||||||
| 4.000% due 05/15/2048 | 2,000 | 1,959 | ||||||||||
M‑S‑R Energy Authority, California Revenue Bonds, Series 2009 | ||||||||||||
| 6.125% due 11/01/2029 | 1,770 | 1,960 | ||||||||||
Morongo Band of Mission Indians, California Revenue Bonds, Series 2018 | ||||||||||||
| 5.000% due 10/01/2042 | 500 | 500 | ||||||||||
San Francisco, California City & County Public Utilities Commission Wastewater Revenue Bonds, Series 2021 | ||||||||||||
| 4.000% due 10/01/2048 | 675 | 642 | ||||||||||
| 16,311 | ||||||||||||
| COLORADO 7.5% | ||||||||||||
Colorado Health Facilities Authority Revenue Bonds, Series 2018 | ||||||||||||
| 4.000% due 11/15/2048 | 10,000 | 9,094 | ||||||||||
Colorado Health Facilities Authority Revenue Bonds, Series 2019 | ||||||||||||
| 4.000% due 01/01/2040 | 2,200 | 2,177 | ||||||||||
| 4.000% due 08/01/2049 | 2,000 | 1,680 | ||||||||||
Colorado International Center Metropolitan District No 7 General Obligation Bonds, Series 2021 | ||||||||||||
| 0.000% due 12/01/2051 (d) | 715 | 369 | ||||||||||
Colorado State Building Excellent School Certificates of Participation Bonds, Series 2018 | ||||||||||||
| 4.000% due 03/15/2043 | 1,015 | 971 | ||||||||||
Denver, Colorado Airport System City & County Revenue Bonds, Series 2022 | ||||||||||||
| 5.000% due 11/15/2029 | 1,000 | 1,082 | ||||||||||
Dominion Water & Sanitation District, Colorado Revenue Bonds, Series 2022 | ||||||||||||
| 5.875% due 12/01/2052 | 1,000 | 965 | ||||||||||
Harvest Crossing Metropolitan District No 4, Colorado General Obligation Bonds, Series 2022 | ||||||||||||
| 7.250% due 12/01/2052 | 1,250 | 1,174 | ||||||||||
Public Authority for Colorado Energy Revenue Bonds, Series 2008 | ||||||||||||
| 6.500% due 11/15/2038 | 500 | 587 | ||||||||||
Senac South Metropolitan District No 1, Colorado General Obligation Bonds, Series 2021 | ||||||||||||
| 5.250% due 12/01/2051 | 500 | 417 | ||||||||||
| 18,516 | ||||||||||||
| CONNECTICUT 0.9% | ||||||||||||
Connecticut Special Tax Revenue State Special Tax Bonds, Series 2020 | ||||||||||||
| 5.000% due 05/01/2035 | 2,000 | 2,247 | ||||||||||
| DELAWARE 2.1% | ||||||||||||
Affordable Housing Opportunities Trust, Delaware Revenue Bonds, Series 2022 | ||||||||||||
| 0.000% due 07/01/2037 | 4,940 | 4,437 | ||||||||||
| 7.120% due 07/01/2037 | 870 | 840 | ||||||||||
| 5,277 | ||||||||||||
| DISTRICT OF COLUMBIA 1.1% | ||||||||||||
District of Columbia Revenue Bonds, Series 2022 | ||||||||||||
| 5.500% due 02/29/2036 | 1,625 | 1,738 | ||||||||||
Metropolitan Washington Airports Authority Dulles Toll Road, District of Columbia Revenue Bonds, Series 2019 | ||||||||||||
| 4.000% due 10/01/2049 | 1,250 | 1,082 | ||||||||||
| 2,820 | ||||||||||||
| PRINCIPAL AMOUNT (000S) | MARKET VALUE (000S) | |||||||||||
| FLORIDA 4.9% | ||||||||||||
Hillsborough County, Florida Industrial Development Authority Revenue Bonds, Series 2020 | ||||||||||||
| 4.000% due 08/01/2050 | $ | 1,650 | $ | 1,397 | ||||||||
Miami-Dade County, Florida Transit System Revenue Bonds, Series 2018 | ||||||||||||
| 4.000% due 07/01/2044 | 1,000 | 965 | ||||||||||
| 4.000% due 07/01/2046 | 1,000 | 935 | ||||||||||
Miami-Dade County, Florida Water & Sewer System Revenue Bonds, Series 2019 | ||||||||||||
| 4.000% due 10/01/2049 | 2,500 | 2,272 | ||||||||||
Pasco County, Florida Water & Sewer Revenue Bonds, Series 2014 | ||||||||||||
| 4.000% due 10/01/2044 | 1,000 | 975 | ||||||||||
Pompano Beach, Florida Revenue Bonds, Series 2020 | ||||||||||||
| 4.000% due 09/01/2050 | 1,500 | 1,149 | ||||||||||
Putnam County Development Authority, Florida Revenue Bonds, Series 2018 | ||||||||||||
| 5.000% due 03/15/2042 | 1,000 | 1,069 | ||||||||||
St Johns County, Florida Industrial Development Authority Revenue Bonds, Series 2020 | ||||||||||||
| 4.000% due 08/01/2055 | 1,400 | 1,220 | ||||||||||
Tampa, Florida Revenue Bonds, Series 2016 | ||||||||||||
| 4.000% due 11/15/2046 | 2,500 | 2,286 | ||||||||||
| 12,268 | ||||||||||||
| GEORGIA 5.7% | ||||||||||||
Atlanta Development Authority, Georgia Revenue Bonds, Series 2017 | ||||||||||||
| 6.750% due 01/01/2035 ^(b) | 1,600 | 848 | ||||||||||
Burke County, Georgia Development Authority Revenue Bonds, Series 2017 | ||||||||||||
| 4.125% due 11/01/2045 | 2,000 | 1,712 | ||||||||||
Main Street Natural Gas, Inc., Georgia Revenue Bonds, Series 2019 | ||||||||||||
| 5.000% due 05/15/2043 | 2,000 | 2,001 | ||||||||||
Municipal Electric Authority of Georgia Revenue Bonds, Series 2015 | ||||||||||||
| 5.000% due 07/01/2060 | 9,000 | 8,713 | ||||||||||
Municipal Electric Authority of Georgia Revenue Bonds, Series 2022 | ||||||||||||
| 5.000% due 07/01/2052 | 1,000 | 986 | ||||||||||
| 14,260 | ||||||||||||
| HAWAII 0.6% | ||||||||||||
City & County Honolulu, Hawaii Wastewater System Revenue Bonds, Series 2018 | ||||||||||||
| 4.000% due 07/01/2042 | 1,485 | 1,456 | ||||||||||
| ILLINOIS 18.2% | ||||||||||||
Chicago Board of Education, Illinois General Obligation Bonds, Series 2018 | ||||||||||||
| 5.000% due 12/01/2046 | 3,000 | 2,857 | ||||||||||
Chicago O’Hare International Airport, Illinois Revenue Bonds, Series 2018 | ||||||||||||
| 5.000% due 01/01/2048 | 3,000 | 3,065 | ||||||||||
Chicago O’Hare International Airport, Illinois Revenue Bonds, Series 2022 | ||||||||||||
| 5.000% due 01/01/2055 | 2,330 | 2,348 | ||||||||||
Chicago, Illinois General Obligation Bonds, Series 2003 | ||||||||||||
| 5.500% due 01/01/2034 | 1,750 | 1,784 | ||||||||||
Chicago, Illinois General Obligation Bonds, Series 2007 | ||||||||||||
| 5.500% due 01/01/2042 | 2,400 | 2,427 | ||||||||||
Chicago, Illinois General Obligation Bonds, Series 2015 | ||||||||||||
| 5.375% due 01/01/2029 | 6,700 | 6,853 | ||||||||||
| 5.500% due 01/01/2034 | 2,300 | 2,345 | ||||||||||
Chicago, Illinois Revenue Bonds, Series 2002 | ||||||||||||
| 5.000% due 01/01/2028 | 2,000 | 2,088 | ||||||||||
Illinois Finance Authority Revenue Bonds, Series 2017 | ||||||||||||
| 5.000% due 02/15/2037 ^(b) | 945 | 425 | ||||||||||
| See Accompanying Notes | ANNUAL REPORT | | | DECEMBER 31, 2022 | 35 |
| Schedule of Investments | PIMCO Municipal Income Fund | (Cont.) |
| PRINCIPAL AMOUNT (000S) | MARKET VALUE (000S) | |||||||||||
Illinois Finance Authority Revenue Bonds, Series 2019 | ||||||||||||
| 5.000% due 11/01/2035 | $ | 1,000 | $ | 907 | ||||||||
Illinois State General Obligation Bonds, Series 2018 | ||||||||||||
| 4.625% due 05/01/2037 | 2,000 | 1,934 | ||||||||||
Illinois State General Obligation Notes, Series 2017 | ||||||||||||
| 5.000% due 11/01/2027 | 9,500 | 9,824 | ||||||||||
Metropolitan Pier & Exposition Authority, Illinois Revenue Bonds, (AGM Insured), Series 2010 | ||||||||||||
| 0.000% due 06/15/2045 (c) | 6,500 | 2,164 | ||||||||||
Metropolitan Pier & Exposition Authority, Illinois Revenue Bonds, (AGM/CR Insured), Series 2017 | ||||||||||||
| 0.000% due 12/15/2056 (c) | 2,445 | 443 | ||||||||||
Metropolitan Pier & Exposition Authority, Illinois Revenue Bonds, (AGM/CR/NPFGC Insured), Series 2002 | ||||||||||||
| 0.000% due 12/15/2040 (c) | 2,000 | 856 | ||||||||||
Metropolitan Pier & Exposition Authority, Illinois Revenue Bonds, Series 2012 | ||||||||||||
| 0.000% due 12/15/2051 (c) | 2,500 | 532 | ||||||||||
Metropolitan Pier & Exposition Authority, Illinois Revenue Bonds, Series 2022 | ||||||||||||
| 0.000% due 06/15/2036 (c) | 1,000 | 526 | ||||||||||
Regional Transportation Authority, Illinois Revenue Bonds, Series 2018 | ||||||||||||
| 5.000% due 06/01/2038 (e) | 3,500 | 3,812 | ||||||||||
| 45,190 | ||||||||||||
| INDIANA 1.7% | ||||||||||||
Indiana Finance Authority Revenue Bonds, Series 2019 | ||||||||||||
| 7.000% due 03/01/2039 | 1,250 | 938 | ||||||||||
Indiana Finance Authority Revenue Bonds, Series 2022 | ||||||||||||
| 4.500% due 12/15/2046 | 2,280 | 2,279 | ||||||||||
Indiana Health & Educational Facilities Financing Authority Revenue Bonds, Series 2006 | ||||||||||||
| 4.000% due 11/15/2046 | 1,000 | 919 | ||||||||||
| 4,136 | ||||||||||||
| IOWA 2.3% | ||||||||||||
Iowa Finance Authority Midwestern Disaster Area Revenue Refunding Bonds, Series 2022 | ||||||||||||
| 5.000% due 12/01/2050 | 2,530 | 2,364 | ||||||||||
Iowa Finance Authority Revenue Bonds, Series 2014 | ||||||||||||
| 5.400% due 11/15/2046 ^ | 2,562 | 2,661 | ||||||||||
Iowa Finance Authority Revenue Bonds, Series 2022 | ||||||||||||
| 8.000% due 01/01/2042 | 800 | 754 | ||||||||||
| 5,779 | ||||||||||||
| KANSAS 1.3% | ||||||||||||
Lenexa, Kansas Tax Allocation Bonds, Series 2007 | ||||||||||||
| 6.000% due 04/01/2027 ^(b) | 695 | 132 | ||||||||||
University of Kansas Hospital Authority Revenue Bonds, Series 2015 | ||||||||||||
| 4.000% due 09/01/2040 (e) | 3,085 | 3,040 | ||||||||||
| 3,172 | ||||||||||||
| LOUISIANA 5.0% | ||||||||||||
East Baton Rouge Sewerage Commission, Louisiana Revenue Bonds, Series 2019 | ||||||||||||
| 4.000% due 02/01/2045 | 3,000 | 2,866 | ||||||||||
Louisiana Gasoline & Fuels Tax State Revenue Bonds, Series 2017 | ||||||||||||
| 4.000% due 05/01/2045 | 4,000 | 3,738 | ||||||||||
Louisiana Public Facilities Authority Revenue Bonds, Series 2017 | ||||||||||||
| 5.000% due 05/15/2042 | 3,750 | 3,853 | ||||||||||
Louisiana Public Facilities Authority Revenue Bonds, Series 2020 | ||||||||||||
| 4.000% due 04/01/2050 | 750 | 693 | ||||||||||
| PRINCIPAL AMOUNT (000S) | MARKET VALUE (000S) | |||||||||||
Parish of St James, Louisiana Revenue Bonds, Series 2010 | ||||||||||||
| 6.350% due 07/01/2040 | $ | 1,250 | $ | 1,333 | ||||||||
| 12,483 | ||||||||||||
| MAINE 1.1% | ||||||||||||
Maine Health & Higher Educational Facilities Authority Revenue Bonds, Series 2013 | ||||||||||||
| 5.000% due 07/01/2043 | 1,000 | 1,009 | ||||||||||
Maine Health & Higher Educational Facilities Authority Revenue Bonds, Series 2020 | ||||||||||||
| 4.000% due 07/01/2045 | 2,000 | 1,809 | ||||||||||
| 2,818 | ||||||||||||
| MARYLAND 0.2% | ||||||||||||
Maryland Economic Development Corp. Revenue Bonds, Series 2020 | ||||||||||||
| 4.000% due 07/01/2040 | 500 | 456 | ||||||||||
| MASSACHUSETTS 3.2% | ||||||||||||
Commonwealth of Massachusetts General Obligation Bonds, Series 2018 | ||||||||||||
| 4.000% due 05/01/2040 | 1,000 | 982 | ||||||||||
Commonwealth of Massachusetts General Obligation Bonds, Series 2019 | ||||||||||||
| 5.000% due 05/01/2045 | 3,000 | 3,189 | ||||||||||
Massachusetts Development Finance Agency Revenue Bonds, Series 2016 | ||||||||||||
| 5.000% due 01/01/2047 | 1,000 | 1,000 | ||||||||||
Massachusetts School Building Authority Revenue Bonds, Series 2012 | ||||||||||||
| 5.250% due 02/15/2048 (e) | 2,500 | 2,657 | ||||||||||
| 7,828 | ||||||||||||
| MICHIGAN 4.8% | ||||||||||||
Detroit City School District, Michigan General Obligation Bonds, (AGM/Q‑SBLF Insured), Series 2001 | ||||||||||||
| 6.000% due 05/01/2029 | 1,405 | 1,546 | ||||||||||
Michigan Finance Authority Hospital Revenue Refunding Bonds, Series 2022 | ||||||||||||
| 4.000% due 04/15/2042 | 1,000 | 932 | ||||||||||
Michigan Finance Authority Revenue Bonds, Series 2017 | ||||||||||||
| 5.000% due 12/01/2031 (e) | 1,200 | 1,303 | ||||||||||
Michigan Finance Authority Revenue Bonds, Series 2019 | ||||||||||||
| 4.000% due 02/15/2047 | 3,500 | 3,208 | ||||||||||
| 4.000% due 12/01/2048 | 2,000 | 1,813 | ||||||||||
Michigan Finance Authority Revenue Bonds, Series 2021 | ||||||||||||
| 5.000% due 12/01/2046 (e) | 2,328 | 2,353 | ||||||||||
Michigan Finance Authority Revenue Notes, Series 2021 | ||||||||||||
| 5.000% due 06/01/2027 (e) | 72 | 79 | ||||||||||
Michigan Tobacco Settlement Finance Authority Revenue Bonds, Series 2008 | ||||||||||||
| 0.000% due 06/01/2058 (c) | 15,000 | 589 | ||||||||||
| 11,823 | ||||||||||||
| MINNESOTA 0.8% | ||||||||||||
Duluth Economic Development Authority Health Care Facilities, Minnesota Revenue Bonds, Series 2022 | ||||||||||||
| 5.250% due 06/15/2047 | 500 | 507 | ||||||||||
Rochester, Minnesota Revenue Bonds, Series 2018 | ||||||||||||
| 4.000% due 11/15/2048 | 1,500 | 1,434 | ||||||||||
| 1,941 | ||||||||||||
| PRINCIPAL AMOUNT (000S) | MARKET VALUE (000S) | |||||||||||
| MISSOURI 1.7% | ||||||||||||
Health & Educational Facilities Authority of the State of Missouri Revenue Bonds, Series 2018 | ||||||||||||
| 4.000% due 11/15/2048 | $ | 3,000 | $ | 2,677 | ||||||||
Health & Educational Facilities Authority of the State of Missouri Revenue Bonds, Series 2019 | ||||||||||||
| 4.000% due 02/15/2039 | 600 | 587 | ||||||||||
Missouri Development Finance Board Revenue Bonds, Series 2022 | ||||||||||||
| 5.250% due 05/01/2055 | 1,000 | 1,072 | ||||||||||
| 4,336 | ||||||||||||
| NEVADA 2.0% | ||||||||||||
Clark County, Nevada General Obligation Bonds, Series 2018 | ||||||||||||
| 4.000% due 07/01/2044 (e) | 4,200 | 4,037 | ||||||||||
Reno, Nevada Revenue Bonds, Series 2018 | ||||||||||||
| 0.000% due 07/01/2058 (c) | 10,500 | 1,018 | ||||||||||
| 5,055 | ||||||||||||
| NEW JERSEY 11.1% | ||||||||||||
Cherry Hill Township School District, New Jersey General Obligation Bonds, Series 2022 | ||||||||||||
| 4.000% due 08/01/2040 | 2,600 | 2,566 | ||||||||||
Federal Home Loan Mortgage Corp. Enhanced Receipt, New Jersey Revenue Bonds, Series 2019 | ||||||||||||
| 3.870% due 11/15/2035 (f) | 2,983 | 2,717 | ||||||||||
New Jersey Economic Development Authority Revenue Bonds, Series 2016 | ||||||||||||
| 5.000% due 06/15/2041 | 2,500 | 2,541 | ||||||||||
New Jersey Economic Development Authority Special Assessment Bonds, Series 2002 | ||||||||||||
| 5.750% due 04/01/2031 | 2,050 | 2,039 | ||||||||||
New Jersey Health Care Facilities Financing Authority Revenue Bonds, Series 2013 | ||||||||||||
| 5.500% due 07/01/2043 | 2,000 | 2,014 | ||||||||||
New Jersey Transportation Trust Fund Authority Revenue Bonds, (AGM Insured), Series 2006 | ||||||||||||
| 0.000% due 12/15/2034 (c) | 1,500 | 918 | ||||||||||
New Jersey Transportation Trust Fund Authority Revenue Bonds, Series 2019 | ||||||||||||
| 5.000% due 06/15/2044 | 2,000 | 2,035 | ||||||||||
| 5.250% due 06/15/2043 | 1,000 | 1,039 | ||||||||||
New Jersey Turnpike Authority Revenue Bonds, Series 2017 | ||||||||||||
| 5.000% due 01/01/2037 | 3,000 | 3,203 | ||||||||||
New Jersey Turnpike Authority Revenue Bonds, Series 2019 | ||||||||||||
| 5.000% due 01/01/2048 | 1,500 | 1,567 | ||||||||||
South Jersey Port Corp., New Jersey Revenue Bonds, Series 2017 | ||||||||||||
| 5.000% due 01/01/2049 | 250 | 250 | ||||||||||
Tobacco Settlement Financing Corp., New Jersey Revenue Bonds, Series 2018 | ||||||||||||
| 5.000% due 06/01/2031 | 1,000 | 1,050 | ||||||||||
| 5.000% due 06/01/2046 | 6,000 | 5,737 | ||||||||||
| 27,676 | ||||||||||||
| NEW YORK 22.1% | ||||||||||||
Battery Park City Authority, New York Revenue Bonds, Series 2019 | ||||||||||||
| 3.600% due 11/01/2038 | 2,485 | 2,485 | ||||||||||
Build NYC Resource Corp., New York Revenue Bonds, Series 2023 | ||||||||||||
| 5.250% due 07/01/2052 (a) | 1,000 | 1,017 | ||||||||||
Metropolitan Transportation Authority, New York Revenue Bonds, (AGM Insured), Series 2019 | ||||||||||||
| 4.000% due 11/15/2049 | 4,000 | 3,593 | ||||||||||
Metropolitan Transportation Authority, New York Revenue Bonds, Series 2020 | ||||||||||||
| 5.250% due 11/15/2055 | 2,000 | 2,002 | ||||||||||
| 36 | PIMCO CLOSED-END FUNDS | See Accompanying Notes |
| December 31, 2022 |
| PRINCIPAL AMOUNT (000S) | MARKET VALUE (000S) | |||||||||||
Nassau County, New York Industrial Development Agency Revenue Bonds, Series 2021 | ||||||||||||
| 5.000% due 01/01/2058 | $ | 2,867 | $ | 1,402 | ||||||||
New York City Transitional Finance Authority Future Tax Secured, New York Revenue Bonds, Series 2020 | ||||||||||||
| 4.000% due 05/01/2045 | 1,000 | 935 | ||||||||||
New York City, New York General Obligation Bonds, Series 2018 | ||||||||||||
| 5.000% due 12/01/2037 | 750 | 809 | ||||||||||
| 5.000% due 04/01/2045 | 2,300 | 2,414 | ||||||||||
New York City, New York General Obligation Bonds, Series 2019 | ||||||||||||
| 5.000% due 08/01/2039 | 1,000 | 1,068 | ||||||||||
New York City, New York Municipal Water Finance Authority Revenue Bonds, Series 2022 | ||||||||||||
| 5.000% due 06/15/2047 | 4,000 | 4,300 | ||||||||||
New York City, New York Transitional Finance Authority Future Tax Secured Revenue Bonds, Series 2022 | ||||||||||||
| 5.500% due 11/01/2045 | 2,000 | 2,252 | ||||||||||
New York Liberty Development Corp. Revenue Bonds, Series 2005 | ||||||||||||
| 5.250% due 10/01/2035 | 10,000 | 10,995 | ||||||||||
New York Liberty Development Corp. Revenue Bonds, Series 2007 | ||||||||||||
| 5.500% due 10/01/2037 | 3,000 | 3,327 | ||||||||||
New York Liberty Development Corp. Revenue Bonds, Series 2014 | ||||||||||||
| 5.000% due 11/15/2044 | 1,000 | 911 | ||||||||||
New York State Dormitory Authority Revenue Bonds, Series 2017 | ||||||||||||
| 4.000% due 02/15/2047 | 1,500 | 1,404 | ||||||||||
New York State Dormitory Authority Revenue Bonds, Series 2020 | ||||||||||||
| 4.000% due 02/15/2040 | 1,250 | 1,216 | ||||||||||
New York State Housing Finance Agency Revenue Bonds, (FHA Insured), Series 2020 | ||||||||||||
| 4.200% due 11/01/2054 (f) | 1,500 | 1,340 | ||||||||||
New York State Thruway Authority Revenue Bonds, (AGM Insured), Series 2019 | ||||||||||||
| 4.000% due 01/01/2053 | 460 | 413 | ||||||||||
New York State Thruway Authority Revenue Bonds, Series 2019 | ||||||||||||
| 4.000% due 01/01/2050 | 575 | 523 | ||||||||||
New York State Thruway Authority Revenue Bonds, Series 2021 | ||||||||||||
| 4.000% due 03/15/2047 | 2,000 | 1,878 | ||||||||||
New York State Thruway Authority Revenue Bonds, Series 2021 | ||||||||||||
| 4.000% due 03/15/2043 | 1,500 | 1,426 | ||||||||||
New York State Urban Development Corp. Revenue Bonds, Series 2021 | ||||||||||||
| 4.000% due 03/15/2047 | 2,750 | 2,586 | ||||||||||
Suffolk Tobacco Asset Securitization Corp., New York Revenue Bonds, Series 2021 | ||||||||||||
| 4.000% due 06/01/2050 | 1,500 | 1,254 | ||||||||||
Triborough Bridge & Tunnel Authority Sales Tax, New York Revenue Bonds, Series 2022 | ||||||||||||
| 4.000% due 05/15/2057 | 2,750 | 2,568 | ||||||||||
Triborough Bridge & Tunnel Authority, New York Revenue Bonds, Series 2021 | ||||||||||||
| 5.000% due 05/15/2051 | 2,635 | 2,790 | ||||||||||
| 54,908 | ||||||||||||
| NORTH DAKOTA 0.2% | ||||||||||||
Grand Forks County, North Dakota Revenue Bonds, Series 2021 | ||||||||||||
| 7.000% due 12/15/2043 ^(b) | 850 | 467 | ||||||||||
| OHIO 4.5% | ||||||||||||
American Municipal Power, Inc., Ohio Revenue Bonds, Series 2017 | ||||||||||||
| 4.000% due 02/15/2042 | 1,000 | 932 | ||||||||||
| PRINCIPAL AMOUNT (000S) | MARKET VALUE (000S) | |||||||||||
Buckeye Tobacco Settlement Financing Authority, Ohio Revenue Bonds, Series 2020 | ||||||||||||
| 0.000% due 06/01/2057 (c) | $ | 36,500 | $ | 4,191 | ||||||||
Montgomery County, Ohio Dayton Children’s Hospital Revenue Bonds, Series 2021 | ||||||||||||
| 4.000% due 08/01/2046 | 2,250 | 2,075 | ||||||||||
Ohio Air Quality Development Authority Dayton Power And Light Company Project Revenue Bonds , Series 2015 | ||||||||||||
| 4.250% due 11/01/2040 | 2,000 | 1,997 | ||||||||||
Ohio Water Development Authority Water Pollution Control Loan Fund Revenue Bonds, Series 2020 | ||||||||||||
| 5.000% due 12/01/2050 | 1,250 | 1,334 | ||||||||||
Southern Ohio Port Authority Revenue Notes, Series 2020 | ||||||||||||
| 6.500% due 12/01/2030 | 1,000 | 753 | ||||||||||
| 11,282 | ||||||||||||
| OKLAHOMA 0.2% | ||||||||||||
Oklahoma Development Finance Authority Revenue Bonds, Series 2021 | ||||||||||||
| 8.000% due 12/01/2041 | 750 | 586 | ||||||||||
| OREGON 1.9% | ||||||||||||
Columbia County, Oregon School District No 502 General Obligation Bonds, Series 2020 | ||||||||||||
| 5.000% due 06/15/2045 | 2,000 | 2,148 | ||||||||||
Medford Hospital Facilities Authority, Oregon Revenue Bonds, Series 2020 | ||||||||||||
| 4.000% due 08/15/2050 | 1,500 | 1,342 | ||||||||||
Salem Hospital Facility Authority, Oregon Revenue Bonds, Series 2022 | ||||||||||||
| 4.000% due 05/15/2047 | 875 | 665 | ||||||||||
Washington & Multnomah Counties School District No 48J Beaverton, Oregon General Obligation Bonds, Series 2022 | ||||||||||||
| 0.000% due 06/15/2048 (c) | 2,310 | 662 | ||||||||||
| 4,817 | ||||||||||||
| PENNSYLVANIA 6.9% | ||||||||||||
Berks County, Pennsylvania Industrial Development Authority Revenue Bonds, Series 2017 | ||||||||||||
| 4.000% due 11/01/2050 | 800 | 442 | ||||||||||
Pennsylvania Economic Development Financing Authority Revenue Bonds, (AGM Insured), Series 2022 | ||||||||||||
| 5.750% due 12/31/2062 | 3,000 | 3,146 | ||||||||||
Pennsylvania Economic Development Financing Authority Revenue Bonds, Series 2009 | ||||||||||||
| 6.400% due 12/01/2038 ^(b) | 1,150 | 575 | ||||||||||
Pennsylvania Economic Development Financing Authority Revenue Bonds, Series 2021 | ||||||||||||
| 9.000% due 04/01/2051 | 1,500 | 1,702 | ||||||||||
Pennsylvania Economic Development Financing Authority Revenue Bonds, Series 2022 | ||||||||||||
| 4.000% due 02/15/2041 | 1,750 | 1,605 | ||||||||||
Pennsylvania Higher Educational Facilities Authority Revenue Bonds, Series 2019 | ||||||||||||
| 5.000% due 08/15/2049 | 1,100 | 1,142 | ||||||||||
Pennsylvania Turnpike Commission Revenue Bonds, Series 2018 | ||||||||||||
| 5.000% due 12/01/2043 | 4,250 | 4,449 | ||||||||||
Pennsylvania Turnpike Commission Revenue Bonds, Series 2021 | ||||||||||||
| 5.000% due 12/01/2046 | 1,250 | 1,320 | ||||||||||
| 5.000% due 12/01/2051 | 1,750 | 1,837 | ||||||||||
Philadelphia Authority for Industrial Development, Pennsylvania Revenue Bonds, Series 2017 | ||||||||||||
| 5.500% due 12/01/2058 | 1,000 | 886 | ||||||||||
| 17,104 | ||||||||||||
| PRINCIPAL AMOUNT (000S) | MARKET VALUE (000S) | |||||||||||
| PUERTO RICO 7.1% | ||||||||||||
Children’s Trust Fund, Puerto Rico Revenue Bonds, Series 2008 | ||||||||||||
| 0.000% due 05/15/2057 (c) | $ | 28,000 | $ | 1,738 | ||||||||
Commonwealth of Puerto Rico Bonds, Series 2022 | ||||||||||||
| 0.000% due 11/01/2043 (c) | 3,908 | 1,714 | ||||||||||
| 0.000% due 11/01/2051 (c) | 2,815 | 1,028 | ||||||||||
Commonwealth of Puerto Rico General Obligation Bonds, Series 2021 | ||||||||||||
| 4.000% due 07/01/2041 | 1,700 | 1,336 | ||||||||||
Commonwealth of Puerto Rico General Obligation Notes, Series 2021 | ||||||||||||
| 0.000% due 07/01/2024 (c) | 139 | 129 | ||||||||||
| 5.625% due 07/01/2027 | 900 | 918 | ||||||||||
Puerto Rico Highway & Transportation Authority Revenue Bonds, Series 2022 | ||||||||||||
| 0.000% due 07/01/2032 (c) | 79 | 47 | ||||||||||
| 0.000% due 07/01/2053 (d) | 1,215 | 675 | ||||||||||
| 5.000% due 07/01/2062 | 122 | 112 | ||||||||||
Puerto Rico Sales Tax Financing Corp. Sales Tax Revenue Bonds, Series 2018 | ||||||||||||
| 0.000% due 07/01/2046 (c) | 9,650 | 2,390 | ||||||||||
| 0.000% due 07/01/2051 (c) | 10,000 | 1,813 | ||||||||||
Puerto Rico Sales Tax Financing Corp. Sales Tax Revenue Bonds, Series 2019 | ||||||||||||
| 4.784% due 07/01/2058 | 6,485 | 5,643 | ||||||||||
| 17,543 | ||||||||||||
| RHODE ISLAND 0.9% | ||||||||||||
Tobacco Settlement Financing Corp., Rhode Island Revenue Bonds, Series 2015 | ||||||||||||
| 5.000% due 06/01/2040 | 1,205 | 1,212 | ||||||||||
| 5.000% due 06/01/2050 | 1,000 | 990 | ||||||||||
| 2,202 | ||||||||||||
| SOUTH CAROLINA 2.5% | ||||||||||||
South Carolina Public Service Authority Revenue Obligations Revenue Bonds, Series 2013 | ||||||||||||
| 5.125% due 12/01/2043 | 5,000 | 5,021 | ||||||||||
| 5.500% due 12/01/2053 | 1,100 | 1,107 | ||||||||||
| 6,128 | ||||||||||||
| TENNESSEE 4.6% | ||||||||||||
Metropolitan Government of Nashville & Davidson County, Tennessee Health & Educational Facs Bd Revenue Bonds, Series 2020 | ||||||||||||
| 4.000% due 11/01/2055 | 1,000 | 748 | ||||||||||
Shelby County, Tennessee Health Educational & Housing Facilities Board Revenue Bonds, Series 2019 | ||||||||||||
| 5.750% due 10/01/2059 | 700 | 598 | ||||||||||
Tennessee Energy Acquisition Corp. Revenue Bonds, Series 2006 | ||||||||||||
| 5.000% due 02/01/2027 | 5,000 | 5,122 | ||||||||||
| 5.250% due 09/01/2024 | 5,000 | 5,077 | ||||||||||
| 11,545 | ||||||||||||
| TEXAS 17.6% | ||||||||||||
Angelina & Neches River Authority, Texas Revenue Bonds, Series 2021 | ||||||||||||
| 7.500% due 12/01/2045 | 590 | 388 | ||||||||||
| 12.000% due 12/01/2045 | 1,000 | 864 | ||||||||||
Austin, Texas Airport System Revenue Bonds, Series 2022 | ||||||||||||
| 5.000% due 11/15/2042 | 1,075 | 1,117 | ||||||||||
Austin, Texas Electric Utility Revenue Bonds, Series 2019 | ||||||||||||
| 5.000% due 11/15/2044 | 1,500 | 1,597 | ||||||||||
Board of Regents of the University of Texas System Revenue Bonds, Series 2022 | ||||||||||||
| 4.000% due 08/15/2052 | 2,500 | 2,393 | ||||||||||
| See Accompanying Notes | ANNUAL REPORT | | | DECEMBER 31, 2022 | 37 |
| Schedule of Investments | PIMCO Municipal Income Fund | (Cont.) |
| PRINCIPAL AMOUNT (000S) | MARKET VALUE (000S) | |||||||||||
Central Texas Turnpike System Revenue Bonds, Series 2015 | ||||||||||||
| 0.000% due 08/15/2036 (c) | $ | 1,250 | $ | 681 | ||||||||
| 0.000% due 08/15/2037 (c) | 3,500 | 1,787 | ||||||||||
Clifton Higher Education Finance Corp., Texas Revenue Bonds, Series 2018 | ||||||||||||
| 6.125% due 08/15/2048 | 1,000 | 1,015 | ||||||||||
Dallas Fort Worth International Airport, Texas Revenue Bonds, Series 2022 | ||||||||||||
| 5.000% due 11/01/2038 | 1,750 | 1,910 | ||||||||||
Grand Parkway Transportation Corp., Texas Revenue Bonds, Series 2013 | ||||||||||||
| 5.000% due 04/01/2053 | 5,500 | 5,586 | ||||||||||
Harris County, Texas Cultural Education Facilities Finance Corp. Revenue Bonds, Series 2021 | ||||||||||||
| 3.700% due 10/01/2041 | 5,000 | 5,000 | ||||||||||
New Hope Cultural Education Facilities Finance Corp., Texas Revenue Bonds, Series 2021 | ||||||||||||
| 5.500% due 01/01/2057 | 825 | 597 | ||||||||||
North Texas Tollway Authority Revenue Bonds, Series 2017 | ||||||||||||
| 4.000% due 01/01/2043 | 1,500 | 1,413 | ||||||||||
| 5.000% due 01/01/2048 | 1,250 | 1,280 | ||||||||||
Rockwall Independent School District, Texas General Obligation Bonds, (PSF Insured), Series 2022 | ||||||||||||
| 5.000% due 02/15/2052 | 4,000 | 4,308 | ||||||||||
San Jacinto College District, Texas General Obligation Bonds, Series 2019 | ||||||||||||
| 5.000% due 02/15/2044 | 1,000 | 1,075 | ||||||||||
Tarrant County, Texas Cultural Education Facilities Finance Corp. Revenue Bonds, Series 2017 | ||||||||||||
| 6.750% due 11/15/2047 | 500 | 503 | ||||||||||
Tarrant County, Texas Cultural Education Facilities Finance Corp. Revenue Bonds, Series 2022 | ||||||||||||
| 5.000% due 11/15/2051 | 1,380 | 1,435 | ||||||||||
Texas Municipal Gas Acquisition & Supply Corp. Revenue Bonds, Series 2006 | ||||||||||||
| 5.250% due 12/15/2023 | 3,500 | 3,554 | ||||||||||
Texas Municipal Gas Acquisition & Supply Corp. Revenue Bonds, Series 2008 | ||||||||||||
| 6.250% due 12/15/2026 | 3,580 | 3,769 | ||||||||||
Texas Water Development Board Revenue Bonds, Series 2022 | ||||||||||||
| 5.000% due 10/15/2057 | 2,380 | 2,566 | ||||||||||
West Harris County, Texas Regional Water Authority Revenue Bonds, (BAM Insured), Series 2021 | ||||||||||||
| 4.000% due 12/15/2060 | 1,160 | 1,006 | ||||||||||
| 43,844 | ||||||||||||
| PRINCIPAL AMOUNT (000S) | MARKET VALUE (000S) | |||||||||||
| U.S. VIRGIN ISLANDS 1.0% | ||||||||||||
Matching Fund Special Purpose Securitization Corp., U.S. Virgin Islands Revenue Bonds, Series 2022 | ||||||||||||
| 5.000% due 10/01/2039 | $ | 2,420 | $ | 2,427 | ||||||||
| UTAH 2.9% | ||||||||||||
County of Salt Lake, Utah Revenue Bonds, (AMBAC Insured), Series 2001 | ||||||||||||
| 5.125% due 02/15/2033 | 7,000 | 7,284 | ||||||||||
| VIRGINIA 3.8% | ||||||||||||
Virginia Commonwealth Transportation Board Revenue Bonds, Series 2018 | ||||||||||||
| 4.000% due 05/15/2041 (e) | 3,850 | 3,844 | ||||||||||
Virginia Small Business Financing Authority Revenue Bonds, Series 2019 | ||||||||||||
| 0.000% due 07/01/2061 (c) | 23,000 | 1,111 | ||||||||||
| 5.000% due 07/01/2034 | 1,500 | 1,417 | ||||||||||
Virginia Small Business Financing Authority Revenue Bonds, Series 2020 | ||||||||||||
| 4.000% due 12/01/2049 | 3,400 | 3,064 | ||||||||||
| 9,436 | ||||||||||||
| WASHINGTON 0.7% | ||||||||||||
Washington State Convention Center Public Facilities District Revenue Bonds, Series 2018 | ||||||||||||
| 4.000% due 07/01/2058 | 2,155 | 1,779 | ||||||||||
| WEST VIRGINIA 1.4% | ||||||||||||
Monongalia County, West Virginia Commission Special District Revenue Bonds, Series 2017 | ||||||||||||
| 5.500% due 06/01/2037 | 1,000 | 1,007 | ||||||||||
West Virginia Economic Development Authority Revenue Bonds, Series 2017 | ||||||||||||
| 4.000% due 06/15/2040 | 2,500 | 2,525 | ||||||||||
| 3,532 | ||||||||||||
| WISCONSIN 6.5% | ||||||||||||
Public Finance Authority, Wisconsin Revenue Bonds, Series 2017 | ||||||||||||
| 7.000% due 01/01/2050 | 2,500 | 2,721 | ||||||||||
Public Finance Authority, Wisconsin Revenue Bonds, Series 2018 | ||||||||||||
| 6.375% due 01/01/2048 | 3,000 | 1,845 | ||||||||||
| PRINCIPAL AMOUNT (000S) | MARKET VALUE (000S) | |||||||||||
Public Finance Authority, Wisconsin Revenue Bonds, Series 2020 | ||||||||||||
| 0.000% due 01/01/2060 (c) | $ | 7,500 | $ | 356 | ||||||||
Public Finance Authority, Wisconsin Revenue Bonds, Series 2021 | ||||||||||||
| 4.000% due 03/31/2056 | 1,100 | 831 | ||||||||||
| 4.000% due 07/01/2056 | 500 | 388 | ||||||||||
Wisconsin Center District Revenue Bonds, (AGM Insured), Series 2020 | ||||||||||||
| 0.000% due 12/15/2050 (c) | 10,000 | 2,454 | ||||||||||
Wisconsin Health & Educational Facilities Authority Revenue Bonds, Series 2016 | ||||||||||||
| 4.000% due 11/15/2046 | 695 | 717 | ||||||||||
Wisconsin Health & Educational Facilities Authority Revenue Bonds, Series 2017 | ||||||||||||
| 4.000% due 08/15/2042 (e) | 2,000 | 1,952 | ||||||||||
Wisconsin Health & Educational Facilities Authority Revenue Bonds, Series 2018 | ||||||||||||
| 5.000% due 04/01/2044 | 3,000 | 3,147 | ||||||||||
Wisconsin Health & Educational Facilities Authority Revenue Bonds, Series 2022 | ||||||||||||
| 4.000% due 12/01/2051 | 1,920 | 1,702 | ||||||||||
| 16,113 | ||||||||||||
Total Municipal Bonds & Notes (Cost $463,975) | 445,156 | |||||||||||
| SHORT-TERM INSTRUMENTS 1.3% | ||||||||||||
| REPURCHASE AGREEMENTS (g) 1.3% | ||||||||||||
| 3,280 | ||||||||||||
| Total Short-Term Instruments (Cost $3,280) | 3,280 | |||||||||||
| Total Investments in Securities (Cost $467,255) | 448,436 | |||||||||||
| Total Investments 180.3% (Cost $467,255) | $ | 448,436 | ||||||||||
| Auction Rate Preferred Shares (67.0)% | (166,700 | ) | ||||||||||
| Remarketable Variable Rate MuniFund Term Preferred Shares, at liquidation value (7.3)% | (18,168 | ) | ||||||||||
| Other Assets and Liabilities, net (6.0)% | (14,861 | ) | ||||||||||
| Net Assets Applicable to Common Shareholders 100.0% | $ | 248,707 | ||||||||||
| * | A zero balance may reflect actual amounts rounding to less than one thousand. |
| ^ | Security is in default. |
| (a) | When-issued security. |
| (b) | Security is not accruing income as of the date of this report. |
| (c) | Zero coupon security. |
| (d) | Security becomes interest bearing at a future date. |
| (e) | Represents an underlying municipal bond transferred to a tender option bond trust established in a tender option bond transaction in which the Fund sold, or caused the sale of, the underlying municipal bond and purchased the residual interest certificate. The security serves as collateral in a financing transaction. See Note 5, Tender Option Bond Transactions, in the Notes to Financial Statements for more information. |
| Issuer Description | Coupon | Maturity Date | Acquisition Date | Cost | Market Value | Market Value as Percentage of Net Assets Applicable to Common Shareholders | ||||||||||||||||
| Federal Home Loan Mortgage Corp. Enhanced Receipt, New Jersey Revenue Bonds, Series 2019 | 3.870% | 11/15/2035 | 10/26/2020 | $ 3,414 | $ | 2,717 | 1.09 | % | ||||||||||||||
| New York State Housing Finance Agency Revenue Bonds, (FHA Insured), Series 2020 | 4.200 | 11/01/2054 | 11/18/2021 | 1,693 | 1,340 | 0.54 | ||||||||||||||||
| $ 5,107 | $ | 4,057 | 1.63 | % | ||||||||||||||||||
| 38 | PIMCO CLOSED-END FUNDS | See Accompanying Notes |
| December 31, 2022 |
| Counterparty | Lending Rate | Settlement Date | Maturity Date | Principal Amount | Collateralized By | Collateral (Received) | Repurchase Agreements, at Value | Repurchase Agreement Proceeds to be Received(1) | ||||||||||||||||||||||
| FICC | 1.900 | % | 12/30/2022 | 01/03/2023 | $ | 3,280 | U.S. Treasury Bills 0.000% due 06/29/2023 | $ | (3,346 | ) | $ | 3,280 | $ | 3,280 | ||||||||||||||||
Total Repurchase Agreements | $ | (3,346 | ) | $ | 3,280 | $ | 3,280 | |||||||||||||||||||||||
| Counterparty | Repurchase Agreement Proceeds to be Received(1) | Payable for Reverse Repurchase Agreements | Payable for Sale‑Buyback Transactions | Total Borrowings and Other Financing Transactions | Collateral Pledged/(Received) | Net Exposure(2) | ||||||||||||||||||
| Global/Master Repurchase Agreement | ||||||||||||||||||||||||
| FICC | $ | 3,280 | $ | 0 | $ | 0 | $ | 3,280 | $ | (3,346 | ) | $ | (66 | ) | ||||||||||
Total Borrowings and Other Financing Transactions | $ | 3,280 | $ | 0 | $ | 0 | ||||||||||||||||||
| (1) | Includes accrued interest. |
| (2) | Net Exposure represents the net receivable/(payable) that would be due from/to the counterparty in the event of default. Exposure from borrowings and other financing transactions can only be netted across transactions governed under the same master agreement with the same legal entity. See Note 7, Master Netting Arrangements, in the Notes to Financial Statements for more information. |
| Category and Subcategory | Level 1 | Level 2 | Level 3 | Fair Value at 12/31/2022 | ||||||||||||
Investments in Securities, at Value | ||||||||||||||||
| Municipal Bonds & Notes | ||||||||||||||||
| Alabama | $ | 0 | $ | 13,563 | $ | 0 | $ | 13,563 | ||||||||
| Alaska | 0 | 1,138 | 0 | 1,138 | ||||||||||||
| Arizona | 0 | 10,519 | 0 | 10,519 | ||||||||||||
| Arkansas | 0 | 3,091 | 0 | 3,091 | ||||||||||||
| California | 0 | 16,311 | 0 | 16,311 | ||||||||||||
| Colorado | 0 | 18,516 | 0 | 18,516 | ||||||||||||
| Connecticut | 0 | 2,247 | 0 | 2,247 | ||||||||||||
| Delaware | 0 | 5,277 | 0 | 5,277 | ||||||||||||
| District of Columbia | 0 | 2,820 | 0 | 2,820 | ||||||||||||
| Florida | 0 | 12,268 | 0 | 12,268 | ||||||||||||
| Georgia | 0 | 14,260 | 0 | 14,260 | ||||||||||||
| Hawaii | 0 | 1,456 | 0 | 1,456 | ||||||||||||
| Illinois | 0 | 45,190 | 0 | 45,190 | ||||||||||||
| Indiana | 0 | 4,136 | 0 | 4,136 | ||||||||||||
| Iowa | 0 | 5,779 | 0 | 5,779 | ||||||||||||
| Kansas | 0 | 3,172 | 0 | 3,172 | ||||||||||||
| Louisiana | 0 | 12,483 | 0 | 12,483 | ||||||||||||
| Maine | 0 | 2,818 | 0 | 2,818 | ||||||||||||
| Maryland | 0 | 456 | 0 | 456 | ||||||||||||
| Massachusetts | 0 | 7,828 | 0 | 7,828 | ||||||||||||
| Michigan | 0 | 11,823 | 0 | 11,823 | ||||||||||||
| Minnesota | 0 | 1,941 | 0 | 1,941 | ||||||||||||
| Missouri | 0 | 4,336 | 0 | 4,336 | ||||||||||||
| Category and Subcategory | Level 1 | Level 2 | Level 3 | Fair Value at 12/31/2022 | ||||||||||||
| Nevada | $ | 0 | $ | 5,055 | $ | 0 | $ | 5,055 | ||||||||
| New Jersey | 0 | 27,676 | 0 | 27,676 | ||||||||||||
| New York | 0 | 54,908 | 0 | 54,908 | ||||||||||||
| North Dakota | 0 | 467 | 0 | 467 | ||||||||||||
| Ohio | 0 | 11,282 | 0 | 11,282 | ||||||||||||
| Oklahoma | 0 | 586 | 0 | 586 | ||||||||||||
| Oregon | 0 | 4,817 | 0 | 4,817 | ||||||||||||
| Pennsylvania | 0 | 17,104 | 0 | 17,104 | ||||||||||||
| Puerto Rico | 0 | 17,543 | 0 | 17,543 | ||||||||||||
| Rhode Island | 0 | 2,202 | 0 | 2,202 | ||||||||||||
| South Carolina | 0 | 6,128 | 0 | 6,128 | ||||||||||||
| Tennessee | 0 | 11,545 | 0 | 11,545 | ||||||||||||
| Texas | 0 | 43,844 | 0 | 43,844 | ||||||||||||
| U.S. Virgin Islands | 0 | 2,427 | 0 | 2,427 | ||||||||||||
| Utah | 0 | 7,284 | 0 | 7,284 | ||||||||||||
| Virginia | 0 | 9,436 | 0 | 9,436 | ||||||||||||
| Washington | 0 | 1,779 | 0 | 1,779 | ||||||||||||
| West Virginia | 0 | 3,532 | 0 | 3,532 | ||||||||||||
| Wisconsin | 0 | 16,113 | 0 | 16,113 | ||||||||||||
| Short-Term Instruments | ||||||||||||||||
| Repurchase Agreements | 0 | 3,280 | 0 | 3,280 | ||||||||||||
| Total Investments | $ | 0 | $ | 448,436 | $ | 0 | $ | 448,436 | ||||||||
| See Accompanying Notes | ANNUAL REPORT | | | DECEMBER 31, 2022 | 39 |
| Schedule of Investments | PIMCO Municipal Income Fund II |
| PRINCIPAL AMOUNT (000S) | MARKET VALUE (000S) | |||||||||||
| INVESTMENTS IN SECURITIES 175.8% | ||||||||||||
| MUNICIPAL BONDS & NOTES 175.6% | ||||||||||||
| ALABAMA 6.8% | ||||||||||||
Jefferson County, Alabama Sewer Revenue Bonds, Series 2013 | ||||||||||||
| 0.000% due 10/01/2050 (d) | $ | 14,750 | $ | 15,069 | ||||||||
| 6.500% due 10/01/2053 | 18,000 | 19,228 | ||||||||||
Tuscaloosa County, Alabama Industrial Development Authority Revenue Bonds, Series 2019 | ||||||||||||
| 4.500% due 05/01/2032 | 2,564 | 2,321 | ||||||||||
| 5.250% due 05/01/2044 | 3,300 | 2,903 | ||||||||||
| 39,521 | ||||||||||||
| ALASKA 0.4% | ||||||||||||
Municipality of Anchorage, Alaska Solid Waste Services Revenue Bonds, Series 2022 | ||||||||||||
| 5.250% due 11/01/2062 | 2,450 | 2,576 | ||||||||||
| ARIZONA 9.9% | ||||||||||||
Arizona Industrial Development Authority Revenue Bonds, Series 2019 | ||||||||||||
| 4.500% due 01/01/2033 | 740 | 470 | ||||||||||
| 4.750% due 01/01/2038 | 950 | 544 | ||||||||||
| 5.125% due 01/01/2054 | 1,500 | 825 | ||||||||||
| 5.500% due 01/01/2054 | 1,500 | 819 | ||||||||||
Arizona Industrial Development Authority Revenue Bonds, Series 2020 | ||||||||||||
| 7.750% due 07/01/2050 | 2,500 | 1,750 | ||||||||||
Industrial Development Authority of the County, Arizona of Pima Revenue Bonds, Series 2020 | ||||||||||||
| 5.000% due 07/01/2055 | 2,400 | 2,051 | ||||||||||
Maricopa County, Arizona Industrial Development Authority Revenue Bonds, Series 2019 | ||||||||||||
| 4.000% due 01/01/2044 | �� | 7,700 | 7,263 | |||||||||
Phoenix Civic Improvement Corp., Arizona Revenue Bonds, Series 2019 | ||||||||||||
| 4.000% due 07/01/2049 | 5,210 | 4,774 | ||||||||||
| 5.000% due 07/01/2049 | 3,000 | 3,093 | ||||||||||
Salt Verde Financial Corp., Arizona Revenue Bonds, Series 2007 | ||||||||||||
| 5.000% due 12/01/2032 | 12,430 | 12,999 | ||||||||||
| 5.000% due 12/01/2037 | 22,400 | 22,797 | ||||||||||
| 57,385 | ||||||||||||
| ARKANSAS 0.6% | ||||||||||||
Arkansas Development Finance Authority Revenue Bonds, Series 2019 | ||||||||||||
| 4.500% due 09/01/2049 | 3,450 | 3,018 | ||||||||||
Arkansas Development Finance Authority Revenue Bonds, Series 2022 | ||||||||||||
| 5.450% due 09/01/2052 | 350 | 340 | ||||||||||
| 3,358 | ||||||||||||
| CALIFORNIA 7.3% | ||||||||||||
Bay Area Toll Authority, California Revenue Bonds, Series 2014 | ||||||||||||
| 5.000% due 10/01/2054 | 2,000 | 2,080 | ||||||||||
California Health Facilities Financing Authority Revenue Bonds, Series 2011 | ||||||||||||
| 3.100% due 03/01/2047 | 1,000 | 1,000 | ||||||||||
California Health Facilities Financing Authority Revenue Bonds, Series 2016 | ||||||||||||
| 5.000% due 11/15/2046 (e) | 12,500 | 13,125 | ||||||||||
California Health Facilities Financing Authority Revenue Bonds, Series 2020 | ||||||||||||
| 4.000% due 04/01/2049 | 4,000 | 3,473 | ||||||||||
California State General Obligation Bonds, Series 2019 | ||||||||||||
| 5.000% due 04/01/2045 | 4,000 | 4,308 | ||||||||||
| PRINCIPAL AMOUNT (000S) | MARKET VALUE (000S) | |||||||||||
Golden State, California Tobacco Securitization Corp. Revenue Bonds, Series 2021 | ||||||||||||
| 0.000% due 06/01/2066 (c) | $ | 7,500 | $ | 874 | ||||||||
Golden State, California Tobacco Securitization Corp. Revenue Bonds, Series 2022 | ||||||||||||
| 5.000% due 06/01/2051 | 2,000 | 2,055 | ||||||||||
Los Angeles County, California Public Works Financing Authority Revenue Bonds, Series 2021 | ||||||||||||
| 4.000% due 12/01/2046 | 3,435 | 3,253 | ||||||||||
Los Angeles Department of Airports, California Revenue Bonds, Series 2020 | ||||||||||||
| 4.000% due 05/15/2048 | 4,500 | 4,407 | ||||||||||
M‑S‑R Energy Authority, California Revenue Bonds, Series 2009 | ||||||||||||
| 6.500% due 11/01/2039 | 1,750 | 2,096 | ||||||||||
Morongo Band of Mission Indians, California Revenue Bonds, Series 2018 | ||||||||||||
| 5.000% due 10/01/2042 | 1,250 | 1,250 | ||||||||||
San Francisco, California City & County Public Utilities Commission Wastewater Revenue Bonds, Series 2021 | ||||||||||||
| 4.000% due 10/01/2048 | 1,570 | 1,494 | ||||||||||
West Valley-Mission Community College District, California General Obligation Bonds, Series 2022 | ||||||||||||
| 4.000% due 08/01/2047 | 3,000 | 2,911 | ||||||||||
| 42,326 | ||||||||||||
| COLORADO 4.8% | ||||||||||||
Colorado Health Facilities Authority Revenue Bonds, Series 2018 | ||||||||||||
| 4.000% due 11/15/2048 | 2,555 | 2,324 | ||||||||||
Colorado Health Facilities Authority Revenue Bonds, Series 2019 | ||||||||||||
| 4.000% due 01/01/2040 | 5,300 | 5,245 | ||||||||||
| 4.000% due 08/01/2049 | 4,000 | 3,360 | ||||||||||
Colorado International Center Metropolitan District No 7 General Obligation Bonds, Series 2021 | ||||||||||||
| 0.000% due 12/01/2051 (d) | 1,615 | 834 | ||||||||||
Colorado State Building Excellent School Certificates of Participation Bonds, Series 2018 | ||||||||||||
| 4.000% due 03/15/2043 | 3,250 | 3,108 | ||||||||||
Denver, Colorado Airport System City & County Revenue Bonds, Series 2022 | ||||||||||||
| 5.000% due 11/15/2029 | 2,000 | 2,163 | ||||||||||
Denver, Colorado City & County Revenue Bonds, Series 2021 | ||||||||||||
| 4.000% due 08/01/2042 | 1,750 | 1,738 | ||||||||||
Dominion Water & Sanitation District, Colorado Revenue Bonds, Series 2022 | ||||||||||||
| 5.875% due 12/01/2052 | 2,500 | 2,413 | ||||||||||
Harvest Crossing Metropolitan District No 4, Colorado General Obligation Bonds, Series 2022 | ||||||||||||
| 7.250% due 12/01/2052 | 3,500 | 3,286 | ||||||||||
Public Authority for Colorado Energy Revenue Bonds, Series 2008 | ||||||||||||
| 6.500% due 11/15/2038 | 1,430 | 1,677 | ||||||||||
Senac South Metropolitan District No 1, Colorado General Obligation Bonds, Series 2021 | ||||||||||||
| 5.250% due 12/01/2051 | 1,000 | 834 | ||||||||||
Third Creek Metropolitan District No 1, Colorado General Obligation Bonds, Series 2022 | ||||||||||||
| 4.750% due 12/01/2051 | 775 | 582 | ||||||||||
| 27,564 | ||||||||||||
| CONNECTICUT 1.3% | ||||||||||||
Connecticut Special Tax Revenue State Special Tax Bonds, Series 2020 | ||||||||||||
| 4.000% due 05/01/2036 | 3,500 | 3,565 | ||||||||||
Connecticut State Health & Educational Facilities Authority Revenue Bonds, Series 2020 | ||||||||||||
| 4.000% due 07/01/2045 | 4,450 | 4,078 | ||||||||||
| 7,643 | ||||||||||||
| PRINCIPAL AMOUNT (000S) | MARKET VALUE (000S) | |||||||||||
| DELAWARE 1.0% | ||||||||||||
Affordable Housing Opportunities Trust, Delaware Revenue Bonds, Series 2022 | ||||||||||||
| 0.000% due 07/01/2037 | $ | 5,360 | $ | 4,815 | ||||||||
| 7.120% due 07/01/2037 | 945 | 912 | ||||||||||
| 5,727 | ||||||||||||
| DISTRICT OF COLUMBIA 0.9% | ||||||||||||
District of Columbia Revenue Bonds, Series 2022 | ||||||||||||
| 5.500% due 02/28/2037 | 1,850 | 1,950 | ||||||||||
Metropolitan Washington Airports Authority Dulles Toll Road, District of Columbia Revenue Bonds, Series 2019 | ||||||||||||
| 4.000% due 10/01/2049 | 3,500 | 3,030 | ||||||||||
| 4,980 | ||||||||||||
| FLORIDA 5.3% | ||||||||||||
Central Florida Expressway Authority Revenue Bonds, Series 2018 | ||||||||||||
| 5.000% due 07/01/2043 | 2,865 | 3,012 | ||||||||||
Hillsborough County, Florida Industrial Development Authority Revenue Bonds, Series 2020 | ||||||||||||
| 4.000% due 08/01/2050 | 3,700 | 3,132 | ||||||||||
Miami-Dade County, Florida Water & Sewer System Revenue Bonds, Series 2019 | ||||||||||||
| 4.000% due 10/01/2048 | 5,000 | 4,564 | ||||||||||
| 4.000% due 10/01/2049 | 5,000 | 4,545 | ||||||||||
Palm Beach County, Florida Health Facilities Authority Revenue Bonds, Series 2022 | ||||||||||||
| 5.000% due 11/01/2052 | 2,850 | 2,853 | ||||||||||
Pasco County, Florida Water & Sewer Revenue Bonds, Series 2014 | ||||||||||||
| 4.000% due 10/01/2044 | 2,500 | 2,439 | ||||||||||
Pompano Beach, Florida Revenue Bonds, Series 2020 | ||||||||||||
| 4.000% due 09/01/2050 | 3,500 | 2,682 | ||||||||||
Putnam County Development Authority, Florida Revenue Bonds, Series 2018 | ||||||||||||
| 5.000% due 03/15/2042 | 1,590 | 1,700 | ||||||||||
South Miami Health Facilities Authority, Florida Revenue Bonds, Series 2017 | ||||||||||||
| 5.000% due 08/15/2042 (e) | 3,000 | 3,060 | ||||||||||
St Johns County, Florida Industrial Development Authority Revenue Bonds, Series 2020 | ||||||||||||
| 4.000% due 08/01/2055 | 1,600 | 1,394 | ||||||||||
Tampa, Florida Revenue Bonds, Series 2020 | ||||||||||||
| 0.000% due 09/01/2049 (c) | 2,600 | 696 | ||||||||||
| 0.000% due 09/01/2053 (c) | 2,600 | 550 | ||||||||||
| 30,627 | ||||||||||||
| GEORGIA 6.3% | ||||||||||||
Atlanta Development Authority, Georgia Revenue Bonds, Series 2015 | ||||||||||||
| 5.000% due 07/01/2044 | 3,895 | 3,979 | ||||||||||
Atlanta Development Authority, Georgia Revenue Bonds, Series 2017 | ||||||||||||
| 6.750% due 01/01/2035 ^(b) | 3,750 | 1,988 | ||||||||||
Fayette County, Georgia Hospital Authority Revenue Bonds, Series 2016 | ||||||||||||
| 5.000% due 07/01/2046 (e) | 7,000 | 7,058 | ||||||||||
Main Street Natural Gas, Inc., Georgia Revenue Bonds, Series 2019 | ||||||||||||
| 5.000% due 05/15/2043 | 3,500 | 3,502 | ||||||||||
Municipal Electric Authority of Georgia Revenue Bonds, Series 2015 | ||||||||||||
| 5.000% due 07/01/2060 | 19,680 | 19,051 | ||||||||||
Municipal Electric Authority of Georgia Revenue Bonds, Series 2022 | ||||||||||||
| 5.000% due 07/01/2052 | 1,000 | 986 | ||||||||||
| 36,564 | ||||||||||||
| 40 | PIMCO CLOSED-END FUNDS | See Accompanying Notes |
| December 31, 2022 |
| PRINCIPAL AMOUNT (000S) | MARKET VALUE (000S) | |||||||||||
| ILLINOIS 20.3% | ||||||||||||
Chicago Board of Education, Illinois General Obligation Bonds, Series 2018 | ||||||||||||
| 5.000% due 12/01/2046 | $ | 8,000 | $ | 7,618 | ||||||||
Chicago O’Hare International Airport, Illinois Revenue Bonds, (AGM Insured), Series 2020 | ||||||||||||
| 4.000% due 01/01/2039 | 5,000 | 4,892 | ||||||||||
| 4.000% due 01/01/2040 | 1,765 | 1,711 | ||||||||||
Chicago O’Hare International Airport, Illinois Revenue Bonds, Series 2018 | ||||||||||||
| 4.000% due 01/01/2044 | 4,500 | 4,227 | ||||||||||
Chicago O’Hare International Airport, Illinois Revenue Bonds, Series 2022 | ||||||||||||
| 5.000% due 01/01/2055 | 4,840 | 4,877 | ||||||||||
Chicago Park District, Illinois General Obligation Bonds, Series 2020 | ||||||||||||
| 4.000% due 01/01/2036 | 1,300 | 1,251 | ||||||||||
Chicago, Illinois General Obligation Bonds, Series 2007 | ||||||||||||
| 5.500% due 01/01/2035 | 10,000 | 10,175 | ||||||||||
| 5.500% due 01/01/2042 | 1,250 | 1,264 | ||||||||||
Chicago, Illinois General Obligation Bonds, Series 2015 | ||||||||||||
| 5.375% due 01/01/2029 | 14,100 | 14,422 | ||||||||||
| 5.500% due 01/01/2034 | 5,200 | 5,301 | ||||||||||
Chicago, Illinois Revenue Bonds, Series 2002 | ||||||||||||
| 5.000% due 01/01/2029 | 2,000 | 2,089 | ||||||||||
Illinois Finance Authority Revenue Bonds, Series 2017 | ||||||||||||
| 5.000% due 02/15/2037 ^(b) | 2,155 | 970 | ||||||||||
Illinois Finance Authority Revenue Bonds, Series 2019 | ||||||||||||
| 5.000% due 11/01/2035 | 2,000 | 1,814 | ||||||||||
Illinois State General Obligation Bonds, Series 2017 | ||||||||||||
| 5.000% due 11/01/2029 | 1,000 | 1,025 | ||||||||||
Illinois State General Obligation Bonds, Series 2018 | ||||||||||||
| 4.625% due 05/01/2037 | 2,175 | 2,103 | ||||||||||
| 5.000% due 05/01/2041 | 1,500 | 1,477 | ||||||||||
Illinois State General Obligation Notes, Series 2017 | ||||||||||||
| 5.000% due 11/01/2025 | 12,590 | 12,909 | ||||||||||
| 5.000% due 11/01/2027 | 6,140 | 6,349 | ||||||||||
Illinois State Toll Highway Authority Revenue Bonds, Series 2016 | ||||||||||||
| 5.000% due 01/01/2041 (e) | 12,500 | 12,829 | ||||||||||
Metropolitan Pier & Exposition Authority, Illinois Revenue Bonds, (AGM Insured), Series 2010 | ||||||||||||
| 0.000% due 06/15/2045 (c) | 10,000 | 3,330 | ||||||||||
Metropolitan Pier & Exposition Authority, Illinois Revenue Bonds, (AGM/CR Insured), Series 2017 | ||||||||||||
| 0.000% due 12/15/2056 (c) | 5,540 | 1,004 | ||||||||||
Metropolitan Pier & Exposition Authority, Illinois Revenue Bonds, (AGM/CR/NPFGC Insured), Series 2002 | ||||||||||||
| 0.000% due 12/15/2040 (c) | 6,000 | 2,568 | ||||||||||
Metropolitan Pier & Exposition Authority, Illinois Revenue Bonds, Series 2012 | ||||||||||||
| 0.000% due 12/15/2051 (c) | 5,000 | 1,064 | ||||||||||
Metropolitan Pier & Exposition Authority, Illinois Revenue Bonds, Series 2022 | ||||||||||||
| 0.000% due 12/15/2036 (c) | 1,750 | 893 | ||||||||||
| 0.000% due 06/15/2037 (c) | 1,000 | 494 | ||||||||||
Regional Transportation Authority, Illinois Revenue Bonds, Series 2018 | ||||||||||||
| 5.000% due 06/01/2038 (e) | 8,000 | 8,714 | ||||||||||
Village of Channahon, Illinois Revenue Bonds, Series 2009 | ||||||||||||
| 3.650% due 12/01/2034 | 1,935 | 1,935 | ||||||||||
| 117,305 | ||||||||||||
| INDIANA 1.4% | ||||||||||||
Indiana Finance Authority Revenue Bonds, Series 2019 | ||||||||||||
| 7.000% due 03/01/2039 | 2,500 | 1,877 | ||||||||||
Indiana Finance Authority Revenue Bonds, Series 2022 | ||||||||||||
| 4.500% due 12/15/2046 | 5,170 | 5,167 | ||||||||||
| PRINCIPAL AMOUNT (000S) | MARKET VALUE (000S) | |||||||||||
Indiana Health & Educational Facilities Financing Authority Revenue Bonds, Series 2006 | ||||||||||||
| 4.000% due 11/15/2046 | $ | 1,000 | $ | 919 | ||||||||
| 7,963 | ||||||||||||
| IOWA 1.4% | ||||||||||||
Iowa Finance Authority Midwestern Disaster Area Revenue Refunding Bonds, Series 2022 | ||||||||||||
| 5.000% due 12/01/2050 | 5,715 | 5,341 | ||||||||||
Iowa Finance Authority Revenue Bonds, Series 2014 | ||||||||||||
| 5.400% due 11/15/2046 ^ | 694 | 721 | ||||||||||
Iowa Finance Authority Revenue Bonds, Series 2022 | ||||||||||||
| 8.000% due 01/01/2042 | 1,900 | 1,789 | ||||||||||
| 7,851 | ||||||||||||
| KANSAS 0.9% | ||||||||||||
University of Kansas Hospital Authority Revenue Bonds, Series 2015 | ||||||||||||
| 4.000% due 09/01/2040 (e) | 5,500 | 5,421 | ||||||||||
| 5,421 | ||||||||||||
| LOUISIANA 3.9% | ||||||||||||
East Baton Rouge Sewerage Commission, Louisiana Revenue Bonds, Series 2019 | ||||||||||||
| 4.000% due 02/01/2045 | 7,000 | 6,688 | ||||||||||
Louisiana Gasoline & Fuels Tax State Revenue Bonds, Series 2017 | ||||||||||||
| 4.000% due 05/01/2045 | 7,000 | 6,540 | ||||||||||
Louisiana Public Facilities Authority Revenue Bonds, Series 2017 | ||||||||||||
| 5.000% due 05/15/2046 | 5,000 | 5,114 | ||||||||||
Louisiana Public Facilities Authority Revenue Bonds, Series 2020 | ||||||||||||
| 4.000% due 04/01/2050 | 1,500 | 1,386 | ||||||||||
Parish of St James, Louisiana Revenue Bonds, Series 2010 | ||||||||||||
| 6.350% due 10/01/2040 | 2,800 | 2,985 | ||||||||||
| 22,713 | ||||||||||||
| MAINE 0.8% | ||||||||||||
Maine Health & Higher Educational Facilities Authority Revenue Bonds, Series 2013 | ||||||||||||
| 5.000% due 07/01/2043 | 2,715 | 2,739 | ||||||||||
Maine Health & Higher Educational Facilities Authority Revenue Bonds, Series 2020 | ||||||||||||
| 4.000% due 07/01/2050 | 2,000 | 1,774 | ||||||||||
| 4,513 | ||||||||||||
| MARYLAND 1.1% | ||||||||||||
Maryland Economic Development Corp. Revenue Bonds, Series 2020 | ||||||||||||
| 4.250% due 07/01/2050 | 1,400 | 1,238 | ||||||||||
Maryland Stadium Authority Revenue Bonds, Series 2016 | ||||||||||||
| 5.000% due 05/01/2041 | 5,000 | 5,383 | ||||||||||
| 6,621 | ||||||||||||
| MASSACHUSETTS 1.8% | ||||||||||||
Massachusetts Development Finance Agency Revenue Bonds, Series 2010 | ||||||||||||
| 7.625% due 10/15/2037 ^(b) | 482 | 72 | ||||||||||
Massachusetts Development Finance Agency Revenue Bonds, Series 2016 | ||||||||||||
| 5.000% due 01/01/2047 | 2,500 | 2,501 | ||||||||||
Massachusetts School Building Authority Revenue Bonds, Series 2012 | ||||||||||||
| 5.250% due 02/15/2048 (e) | 7,500 | 7,971 | ||||||||||
| 10,544 | ||||||||||||
| PRINCIPAL AMOUNT (000S) | MARKET VALUE (000S) | |||||||||||
| MICHIGAN 2.6% | ||||||||||||
Michigan Finance Authority Hospital Revenue Refunding Bonds, Series 2022 | ||||||||||||
| 4.000% due 04/15/2042 | $ | 2,000 | $ | 1,864 | ||||||||
Michigan Finance Authority Revenue Bonds, Series 2017 | ||||||||||||
| 5.000% due 12/01/2031 (e) | 2,600 | 2,824 | ||||||||||
Michigan Finance Authority Revenue Bonds, Series 2019 | ||||||||||||
| 4.000% due 12/01/2048 | 4,000 | 3,626 | ||||||||||
Michigan Finance Authority Revenue Bonds, Series 2020 | ||||||||||||
| 4.800% due 09/01/2040 | 185 | 152 | ||||||||||
| 5.000% due 09/01/2050 | 300 | 236 | ||||||||||
Michigan Finance Authority Revenue Bonds, Series 2021 | ||||||||||||
| 5.000% due 12/01/2046 (e) | 4,947 | 5,000 | ||||||||||
Michigan Finance Authority Revenue Notes, Series 2020 | ||||||||||||
| 4.300% due 09/01/2030 | 100 | 90 | ||||||||||
Michigan Finance Authority Revenue Notes, Series 2021 | ||||||||||||
| 5.000% due 06/01/2027 (e) | 153 | 168 | ||||||||||
Michigan Tobacco Settlement Finance Authority Revenue Bonds, Series 2008 | ||||||||||||
| 0.000% due 06/01/2058 (c) | 25,000 | 981 | ||||||||||
| 14,941 | ||||||||||||
| MINNESOTA 0.9% | ||||||||||||
Duluth Economic Development Authority Health Care Facilities, Minnesota Revenue Bonds, Series 2022 | ||||||||||||
| 5.250% due 06/15/2047 | 2,000 | 2,026 | ||||||||||
Rochester, Minnesota Revenue Bonds, Series 2018 | ||||||||||||
| 4.000% due 11/15/2048 | 3,500 | 3,346 | ||||||||||
| 5,372 | ||||||||||||
| MISSISSIPPI 0.0% | ||||||||||||
Mississippi Development Bank Revenue Bonds, (AMBAC Insured), Series 1999 | ||||||||||||
| 5.000% due 07/01/2024 | 40 | 40 | ||||||||||
| MISSOURI 2.4% | ||||||||||||
Health & Educational Facilities Authority of the State of Missouri Revenue Bonds, Series 2013 | ||||||||||||
| 5.000% due 11/15/2044 | 10,000 | 10,018 | ||||||||||
Health & Educational Facilities Authority of the State of Missouri Revenue Bonds, Series 2019 | ||||||||||||
| 4.000% due 02/15/2037 | 510 | 505 | ||||||||||
| 5.000% due 02/15/2036 | 425 | 452 | ||||||||||
Health & Educational Facilities Authority of the State of Missouri Revenue Bonds, Series 2021 | ||||||||||||
| 4.000% due 07/01/2046 | 1,000 | 935 | ||||||||||
Missouri Development Finance Board Revenue Bonds, Series 2022 | ||||||||||||
| 5.250% due 05/01/2055 | 2,000 | 2,145 | ||||||||||
| 14,055 | ||||||||||||
| NEVADA 2.0% | ||||||||||||
Clark County, Nevada General Obligation Bonds, Series 2018 | ||||||||||||
| 4.000% due 07/01/2044 (e) | 9,500 | 9,132 | ||||||||||
Reno, Nevada Revenue Bonds, Series 2018 | ||||||||||||
| 0.000% due 07/01/2058 (c) | 24,000 | 2,326 | ||||||||||
| 11,458 | ||||||||||||
| NEW JERSEY 9.2% | ||||||||||||
Cherry Hill Township School District, New Jersey General Obligation Bonds, Series 2022 | ||||||||||||
| 4.000% due 08/01/2040 | 6,400 | 6,316 | ||||||||||
| See Accompanying Notes | ANNUAL REPORT | | | DECEMBER 31, 2022 | 41 |
| Schedule of Investments | PIMCO Municipal Income Fund II | (Cont.) |
| PRINCIPAL AMOUNT (000S) | MARKET VALUE (000S) | |||||||||||
Federal Home Loan Mortgage Corp. Enhanced Receipt, New Jersey Revenue Bonds, Series 2019 | ||||||||||||
| 3.870% due 11/15/2035 (f) | $ | 6,749 | $ | 6,148 | ||||||||
New Jersey Economic Development Authority Revenue Bonds, Series 2016 | ||||||||||||
| 5.000% due 06/15/2041 | 5,000 | 5,082 | ||||||||||
New Jersey Health Care Facilities Financing Authority Revenue Bonds, Series 2013 | ||||||||||||
| 5.500% due 07/01/2043 | 4,000 | 4,029 | ||||||||||
New Jersey Transportation Trust Fund Authority Revenue Bonds, (AGM Insured), Series 2006 | ||||||||||||
| 0.000% due 12/15/2034 (c) | 2,500 | 1,530 | ||||||||||
New Jersey Transportation Trust Fund Authority Revenue Bonds, Series 2018 | ||||||||||||
| 5.000% due 12/15/2036 | 1,500 | 1,572 | ||||||||||
New Jersey Transportation Trust Fund Authority Revenue Bonds, Series 2019 | ||||||||||||
| 5.000% due 06/15/2044 | 3,500 | 3,561 | ||||||||||
| 5.250% due 06/15/2043 | 4,000 | 4,157 | ||||||||||
New Jersey Turnpike Authority Revenue Bonds, Series 2017 | ||||||||||||
| 5.000% due 01/01/2037 | 6,000 | 6,406 | ||||||||||
New Jersey Turnpike Authority Revenue Bonds, Series 2019 | ||||||||||||
| 5.000% due 01/01/2048 | 1,500 | 1,567 | ||||||||||
South Jersey Port Corp., New Jersey Revenue Bonds, Series 2017 | ||||||||||||
| 5.000% due 01/01/2049 | 1,010 | 1,010 | ||||||||||
Tobacco Settlement Financing Corp., New Jersey Revenue Bonds, Series 2018 | ||||||||||||
| 5.000% due 06/01/2046 | 12,300 | 11,760 | ||||||||||
| 53,138 | ||||||||||||
| NEW YORK 17.6% | ||||||||||||
Battery Park City Authority, New York Revenue Bonds, Series 2019 | ||||||||||||
| 3.600% due 11/01/2038 | 4,550 | 4,550 | ||||||||||
Build NYC Resource Corp., New York Revenue Bonds, Series 2023 | ||||||||||||
| 5.250% due 07/01/2052 (a) | 1,000 | 1,017 | ||||||||||
Metropolitan Transportation Authority, New York Revenue Bonds, (AGM Insured), Series 2019 | ||||||||||||
| 4.000% due 11/15/2049 | 7,000 | 6,287 | ||||||||||
Metropolitan Transportation Authority, New York Revenue Bonds, Series 2017 | ||||||||||||
| 4.000% due 11/15/2042 | 10,000 | 8,683 | ||||||||||
Nassau County, New York Industrial Development Agency Revenue Bonds, Series 2021 | ||||||||||||
| 5.000% due 01/01/2058 | 751 | 367 | ||||||||||
New York City Transitional Finance Authority Future Tax Secured, New York Revenue Bonds, Series 2020 | ||||||||||||
| 4.000% due 05/01/2045 | 2,000 | 1,871 | ||||||||||
New York City Water & Sewer System, New York Revenue Bonds, Series 2020 | ||||||||||||
| 4.000% due 06/15/2050 | 3,000 | 2,782 | ||||||||||
New York City, New York General Obligation Bonds, Series 2018 | ||||||||||||
| 5.000% due 12/01/2037 | 2,250 | 2,426 | ||||||||||
New York City, New York Municipal Water Finance Authority Revenue Bonds, Series 2022 | ||||||||||||
| 5.000% due 06/15/2047 | 6,000 | 6,451 | ||||||||||
New York City, New York Transitional Finance Authority Future Tax Secured Revenue Bonds, Series 2022 | ||||||||||||
| 5.500% due 11/01/2045 | 5,000 | 5,630 | ||||||||||
New York Liberty Development Corp. Revenue Bonds, Series 2005 | ||||||||||||
| 5.250% due 10/01/2035 (e) | 11,505 | 12,650 | ||||||||||
New York Liberty Development Corp. Revenue Bonds, Series 2014 | ||||||||||||
| 5.000% due 11/15/2044 | 9,250 | 8,424 | ||||||||||
New York State Dormitory Authority Revenue Bonds, Series 2017 | ||||||||||||
| 4.000% due 02/15/2047 | 4,000 | 3,745 | ||||||||||
| PRINCIPAL AMOUNT (000S) | MARKET VALUE (000S) | |||||||||||
New York State Dormitory Authority Revenue Bonds, Series 2020 | ||||||||||||
| 4.000% due 02/15/2040 | $ | 2,500 | $ | 2,432 | ||||||||
New York State Housing Finance Agency Revenue Bonds, (FHA Insured), Series 2020 | ||||||||||||
| 4.200% due 11/01/2054 (f) | 3,500 | 3,125 | ||||||||||
New York State Thruway Authority Revenue Bonds, (AGM Insured), Series 2019 | ||||||||||||
| 4.000% due 01/01/2053 | 1,040 | 933 | ||||||||||
New York State Thruway Authority Revenue Bonds, Series 2019 | ||||||||||||
| 4.000% due 01/01/2050 | 1,305 | 1,187 | ||||||||||
New York State Thruway Authority Revenue Bonds, Series 2021 | ||||||||||||
| 4.000% due 03/15/2047 | 5,375 | 5,046 | ||||||||||
New York State Urban Development Corp. Revenue Bonds, Series 2021 | ||||||||||||
| 4.000% due 03/15/2047 | 6,250 | 5,876 | ||||||||||
Port Authority of New York & New Jersey Revenue Bonds, Series 2017 | ||||||||||||
| 5.250% due 10/15/2057 | 3,300 | 3,443 | ||||||||||
Suffolk Tobacco Asset Securitization Corp., New York Revenue Bonds, Series 2021 | ||||||||||||
| 4.000% due 06/01/2050 | 2,920 | 2,441 | ||||||||||
Triborough Bridge & Tunnel Authority Sales Tax, New York Revenue Bonds, Series 2022 | ||||||||||||
| 4.000% due 05/15/2057 | 6,000 | 5,602 | ||||||||||
Triborough Bridge & Tunnel Authority, New York Revenue Bonds, Series 2021 | ||||||||||||
| 5.000% due 05/15/2051 | 6,125 | 6,486 | ||||||||||
| 101,454 | ||||||||||||
| NORTH CAROLINA 0.5% | ||||||||||||
North Carolina Turnpike Authority Revenue Bonds, Series 2018 | ||||||||||||
| 4.000% due 01/01/2039 | 3,000 | 2,970 | ||||||||||
| NORTH DAKOTA 0.2% | ||||||||||||
Grand Forks County, North Dakota Revenue Bonds, Series 2021 | ||||||||||||
| 7.000% due 12/15/2043 ^(b) | 1,950 | 1,073 | ||||||||||
| OHIO 6.4% | ||||||||||||
Akron Bath Copley Joint Township Hospital District, Ohio Revenue Bonds, Series 2020 | ||||||||||||
| 4.000% due 11/15/2038 | 1,500 | 1,344 | ||||||||||
Buckeye Tobacco Settlement Financing Authority, Ohio Revenue Bonds, Series 2020 | ||||||||||||
| 0.000% due 06/01/2057 (c) | 79,500 | 9,129 | ||||||||||
| 5.000% due 06/01/2055 | 2,495 | 2,169 | ||||||||||
Geisinger Authority, Ohio Revenue Bonds, Series 2017 | ||||||||||||
| 4.000% due 02/15/2047 | 11,000 | 9,994 | ||||||||||
Montgomery County, Ohio Dayton Children’s Hospital Revenue Bonds, Series 2021 | ||||||||||||
| 4.000% due 08/01/2046 | 5,500 | 5,073 | ||||||||||
Ohio Air Quality Development Authority Dayton Power And Light Company Project Revenue Bonds , Series 2015 | ||||||||||||
| 4.250% due 11/01/2040 | 3,000 | 2,995 | ||||||||||
Ohio State Revenue Bonds, Series 2019 | ||||||||||||
| 4.000% due 01/01/2040 | 1,500 | 1,499 | ||||||||||
Ohio Water Development Authority Water Pollution Control Loan Fund Revenue Bonds, Series 2020 | ||||||||||||
| 5.000% due 12/01/2050 | 2,500 | 2,667 | ||||||||||
Southern Ohio Port Authority Revenue Notes, Series 2020 | ||||||||||||
| 6.500% due 12/01/2030 | 2,600 | 1,957 | ||||||||||
| 36,827 | ||||||||||||
| PRINCIPAL AMOUNT (000S) | MARKET VALUE (000S) | |||||||||||
| OKLAHOMA 1.1% | ||||||||||||
Oklahoma Development Finance Authority Revenue Bonds, Series 2018 | ||||||||||||
| 5.500% due 08/15/2052 | $ | 2,000 | $ | 1,830 | ||||||||
Oklahoma Development Finance Authority Revenue Bonds, Series 2021 | ||||||||||||
| 8.000% due 12/01/2041 | 1,750 | 1,369 | ||||||||||
Oklahoma Water Resources Board Revenue Bonds, Series 2020 | ||||||||||||
| 4.000% due 10/01/2049 | 3,250 | 3,153 | ||||||||||
| 6,352 | ||||||||||||
| OREGON 0.8% | ||||||||||||
Columbia County, Oregon School District No 502 General Obligation Bonds, Series 2020 | ||||||||||||
| 5.000% due 06/15/2045 | 2,000 | 2,148 | ||||||||||
Salem Hospital Facility Authority, Oregon Revenue Bonds, Series 2022 | ||||||||||||
| 4.000% due 05/15/2057 | 1,000 | 709 | ||||||||||
Washington & Multnomah Counties School District No 48J Beaverton, Oregon General Obligation Bonds, Series 2022 | ||||||||||||
| 0.000% due 06/15/2048 (c) | 5,195 | 1,489 | ||||||||||
| 4,346 | ||||||||||||
| PENNSYLVANIA 7.3% | ||||||||||||
Berks County, Pennsylvania Industrial Development Authority Revenue Bonds, Series 2017 | ||||||||||||
| 4.000% due 11/01/2050 | 1,800 | 993 | ||||||||||
Bucks County, Pennsylvania Water and Sewer Authority Revenue Bonds, (AGM Insured), Series 2022 | ||||||||||||
| 4.250% due 12/01/2047 | 1,800 | 1,752 | ||||||||||
Monroeville Finance Authority, Pennsylvania Revenue Bonds, Series 2022 | ||||||||||||
| 4.000% due 02/15/2042 | 4,060 | 3,699 | ||||||||||
Pennsylvania Economic Development Financing Authority Revenue Bonds, (AGM Insured), Series 2022 | ||||||||||||
| 5.750% due 12/31/2062 | 7,000 | 7,342 | ||||||||||
Pennsylvania Economic Development Financing Authority Revenue Bonds, Series 2009 | ||||||||||||
| 6.400% due 12/01/2038 ^(b) | 2,500 | 1,250 | ||||||||||
Pennsylvania Economic Development Financing Authority Revenue Bonds, Series 2021 | ||||||||||||
| 9.000% due 04/01/2051 | 3,400 | 3,858 | ||||||||||
Pennsylvania Higher Educational Facilities Authority Revenue Bonds, Series 2018 | ||||||||||||
| 4.000% due 02/15/2043 | 4,800 | 4,729 | ||||||||||
Pennsylvania Higher Educational Facilities Authority Revenue Bonds, Series 2019 | ||||||||||||
| 5.000% due 08/15/2049 | 2,500 | 2,596 | ||||||||||
Pennsylvania Turnpike Commission Revenue Bonds, Series 2013 | ||||||||||||
| 5.000% due 12/01/2043 | 7,595 | 7,728 | ||||||||||
Pennsylvania Turnpike Commission Revenue Bonds, Series 2021 | ||||||||||||
| 5.000% due 12/01/2046 | 1,000 | 1,056 | ||||||||||
| 5.000% due 12/01/2051 | 6,000 | 6,299 | ||||||||||
Philadelphia Authority for Industrial Development, Pennsylvania Revenue Bonds, Series 2017 | ||||||||||||
| 5.500% due 12/01/2058 | 1,000 | 885 | ||||||||||
| 42,187 | ||||||||||||
| PUERTO RICO 7.0% | ||||||||||||
Children’s Trust Fund, Puerto Rico Revenue Bonds, Series 2008 | ||||||||||||
| 0.000% due 05/15/2057 (c) | 63,000 | 3,910 | ||||||||||
Commonwealth of Puerto Rico Bonds, Series 2022 | ||||||||||||
| 0.000% due 11/01/2043 | 8,744 | 3,837 | ||||||||||
| 0.000% due 11/01/2051 | 8,119 | 3,100 | ||||||||||
| 42 | PIMCO CLOSED-END FUNDS | See Accompanying Notes |
| December 31, 2022 |
| PRINCIPAL AMOUNT (000S) | MARKET VALUE (000S) | |||||||||||
Commonwealth of Puerto Rico General Obligation Bonds, Series 2021 | ||||||||||||
| 4.000% due 07/01/2041 | $ | 3,500 | $ | 2,750 | ||||||||
Commonwealth of Puerto Rico General Obligation Notes, Series 2021 | ||||||||||||
| 0.000% due 07/01/2024 (c) | 311 | 289 | ||||||||||
| 5.625% due 07/01/2027 | 2,008 | 2,048 | ||||||||||
Puerto Rico Highway & Transportation Authority Revenue Bonds, Series 2022 | ||||||||||||
| 0.000% due 07/01/2032 (c) | 363 | 216 | ||||||||||
| 0.000% due 07/01/2053 (d) | 3,131 | 1,738 | ||||||||||
| 5.000% due 07/01/2062 | 559 | 516 | ||||||||||
Puerto Rico Sales Tax Financing Corp. Sales Tax Revenue Bonds, Series 2018 | ||||||||||||
| 0.000% due 07/01/2051 (c) | 52,000 | 9,426 | ||||||||||
Puerto Rico Sales Tax Financing Corp. Sales Tax Revenue Bonds, Series 2019 | ||||||||||||
| 4.784% due 07/01/2058 | 14,205 | 12,360 | ||||||||||
| 40,190 | ||||||||||||
| RHODE ISLAND 3.2% | ||||||||||||
Tobacco Settlement Financing Corp., Rhode Island Revenue Bonds, Series 2015 | ||||||||||||
| 5.000% due 06/01/2050 | 18,450 | 18,264 | ||||||||||
| SOUTH CAROLINA 1.7% | ||||||||||||
South Carolina Public Service Authority Revenue Obligations Revenue Bonds, Series 2013 | ||||||||||||
| 5.500% due 12/01/2053 | 10,000 | 10,066 | ||||||||||
| TENNESSEE 1.9% | ||||||||||||
Metropolitan Government of Nashville & Davidson County, Tennessee Health & Educational Facs Bd Revenue Bonds, Series 2020 | ||||||||||||
| 4.000% due 11/01/2055 | 2,000 | 1,495 | ||||||||||
Metropolitan Nashville Airport Authority, Tennessee Revenue Bonds, Series 2019 | ||||||||||||
| 4.000% due 07/01/2049 | 2,000 | 1,818 | ||||||||||
Shelby County, Tennessee Health Educational & Housing Facilities Board Revenue Bonds, Series 2019 | ||||||||||||
| 5.750% due 10/01/2059 | 1,550 | 1,324 | ||||||||||
Tennessee Energy Acquisition Corp. Revenue Bonds, Series 2006 | ||||||||||||
| 5.000% due 02/01/2027 | 6,000 | 6,147 | ||||||||||
| 10,784 | ||||||||||||
| TEXAS 20.9% | ||||||||||||
Angelina & Neches River Authority, Texas Revenue Bonds, Series 2021 | ||||||||||||
| 7.500% due 12/01/2045 | 1,345 | 884 | ||||||||||
| 12.000% due 12/01/2045 | 2,250 | 1,945 | ||||||||||
Austin, Texas Airport System Revenue Bonds, Series 2022 | ||||||||||||
| 5.000% due 11/15/2042 | 2,425 | 2,520 | ||||||||||
Board of Regents of the University of Texas System Revenue Bonds, Series 2022 | ||||||||||||
| 4.000% due 08/15/2052 | 6,500 | 6,223 | ||||||||||
Calhoun County, Texas Navigation Industrial Development Authority Revenue Notes, Series 2021 | ||||||||||||
| 3.625% due 07/01/2026 | 2,600 | 2,340 | ||||||||||
Central Texas Turnpike System Revenue Bonds, Series 2015 | ||||||||||||
| 0.000% due 08/15/2036 (c) | 2,500 | 1,361 | ||||||||||
| 0.000% due 08/15/2037 (c) | 8,000 | 4,086 | ||||||||||
Clifton Higher Education Finance Corp., Texas Revenue Bonds, Series 2018 | ||||||||||||
| 6.125% due 08/15/2048 | 1,750 | 1,777 | ||||||||||
Dallas Fort Worth International Airport, Texas Revenue Bonds, Series 2022 | ||||||||||||
| 5.000% due 11/01/2038 | 3,500 | 3,821 | ||||||||||
| PRINCIPAL AMOUNT (000S) | MARKET VALUE (000S) | |||||||||||
Grand Parkway Transportation Corp., Texas Revenue Bonds, Series 2013 | ||||||||||||
| 5.000% due 04/01/2053 | $ | 21,000 | $ | 21,327 | ||||||||
Grand Parkway Transportation Corp., Texas Revenue Bonds, Series 2018 | ||||||||||||
| 5.000% due 10/01/2048 (e) | 7,500 | 7,786 | ||||||||||
Harris County, Texas Cultural Education Facilities Finance Corp. Revenue Bonds, Series 2020 | ||||||||||||
| 3.650% due 12/01/2059 | 3,000 | 3,000 | ||||||||||
Harris County, Texas Cultural Education Facilities Finance Corp. Revenue Bonds, Series 2021 | ||||||||||||
| 3.700% due 10/01/2041 | 10,000 | 10,000 | ||||||||||
Lower Colorado River Authority, Texas Revenue Bonds, Series 2019 | ||||||||||||
| 4.000% due 05/15/2049 | 2,500 | 2,226 | ||||||||||
New Hope Cultural Education Facilities Finance Corp., Texas Revenue Bonds, Series 2016 | ||||||||||||
| 5.000% due 07/01/2046 ^(b) | 1,030 | 721 | ||||||||||
New Hope Cultural Education Facilities Finance Corp., Texas Revenue Bonds, Series 2021 | ||||||||||||
| 5.500% due 01/01/2057 | 4,300 | 3,111 | ||||||||||
North Texas Tollway Authority Revenue Bonds, Series 2017 | ||||||||||||
| 4.000% due 01/01/2043 | 3,590 | 3,381 | ||||||||||
| 5.000% due 01/01/2048 | 3,500 | 3,585 | ||||||||||
North Texas Tollway Authority Revenue Bonds, Series 2018 | ||||||||||||
| 5.000% due 01/01/2048 | 1,000 | 1,030 | ||||||||||
Rockwall Independent School District, Texas General Obligation Bonds, (PSF Insured), Series 2022 | ||||||||||||
| 5.000% due 02/15/2052 | 6,000 | 6,462 | ||||||||||
San Antonio Public Facilities Corp., Texas Revenue Bonds, Series 2012 | ||||||||||||
| 4.000% due 09/15/2042 | 10,000 | 9,539 | ||||||||||
San Jacinto College District, Texas General Obligation Bonds, Series 2019 | ||||||||||||
| 5.000% due 02/15/2044 | 1,010 | 1,085 | ||||||||||
Tarrant County, Texas Cultural Education Facilities Finance Corp. Revenue Bonds, Series 2017 | ||||||||||||
| 6.750% due 11/15/2047 | 1,000 | 1,005 | ||||||||||
Tarrant County, Texas Cultural Education Facilities Finance Corp. Revenue Bonds, Series 2022 | ||||||||||||
| 5.000% due 11/15/2051 | 3,140 | 3,264 | ||||||||||
Texas Municipal Gas Acquisition & Supply Corp. Revenue Bonds, Series 2008 | ||||||||||||
| 6.250% due 12/15/2026 | 10,680 | 11,245 | ||||||||||
Texas Water Development Board Revenue Bonds, Series 2022 | ||||||||||||
| 5.000% due 10/15/2057 | 5,395 | 5,817 | ||||||||||
West Harris County, Texas Regional Water Authority Revenue Bonds, (BAM Insured), Series 2021 | ||||||||||||
| 4.000% due 12/15/2060 | 1,250 | 1,084 | ||||||||||
| 120,625 | ||||||||||||
| U.S. VIRGIN ISLANDS 0.9% | ||||||||||||
Matching Fund Special Purpose Securitization Corp., U.S. Virgin Islands Revenue Bonds, Series 2022 | ||||||||||||
| 5.000% due 10/01/2039 | 5,460 | 5,476 | ||||||||||
| UTAH 0.3% | ||||||||||||
Military Installation Development Authority, Utah Revenue Bonds, Series 2021 | ||||||||||||
| 4.000% due 06/01/2052 | 2,000 | 1,468 | ||||||||||
| VIRGINIA 4.0% | ||||||||||||
Fairfax County, Virginia Economic Development Authority Revenue Bonds, Series 2003 | ||||||||||||
| 3.450% due 12/01/2033 | 1,875 | 1,875 | ||||||||||
James City County, Virginia Economic Development Authority Revenue Bonds, Series 2013 | ||||||||||||
| 6.000% due 06/01/2043 | 1,182 | 1,195 | ||||||||||
| PRINCIPAL AMOUNT (000S) | MARKET VALUE (000S) | |||||||||||
Virginia Commonwealth Transportation Board Revenue Bonds, Series 2018 | ||||||||||||
| 4.000% due 05/15/2041 (e) | $ | 8,200 | $ | 8,187 | ||||||||
Virginia Small Business Financing Authority Revenue Bonds, Series 2019 | ||||||||||||
| 0.000% due 07/01/2061 (c) | 51,000 | 2,463 | ||||||||||
| 5.000% due 07/01/2034 | 2,500 | 2,362 | ||||||||||
Virginia Small Business Financing Authority Revenue Bonds, Series 2020 | ||||||||||||
| 4.000% due 12/01/2049 | 7,800 | 7,030 | ||||||||||
| 23,112 | ||||||||||||
| WASHINGTON 0.7% | ||||||||||||
Snohomish County, Washington Housing Authority Revenue Bonds, Series 2019 | ||||||||||||
| 4.000% due 04/01/2044 | 2,000 | 1,852 | ||||||||||
Washington State Convention Center Public Facilities District Revenue Bonds, Series 2018 | ||||||||||||
| 4.000% due 07/01/2058 | 2,960 | 2,443 | ||||||||||
| 4,295 | ||||||||||||
| WEST VIRGINIA 1.6% | ||||||||||||
Monongalia County, West Virginia Commission Special District Revenue Bonds, Series 2017 | ||||||||||||
| 5.500% due 06/01/2037 | 2,000 | 2,016 | ||||||||||
West Virginia Economic Development Authority Revenue Bonds, Series 2017 | ||||||||||||
| 4.000% due 06/15/2040 | 7,110 | 7,180 | ||||||||||
| 9,196 | ||||||||||||
| WISCONSIN 6.2% | ||||||||||||
Public Finance Authority, Wisconsin Revenue Bonds, Series 2017 | ||||||||||||
| 7.000% due 01/01/2050 | 4,500 | 4,897 | ||||||||||
Public Finance Authority, Wisconsin Revenue Bonds, Series 2018 | ||||||||||||
| 6.375% due 01/01/2048 | 4,000 | 2,460 | ||||||||||
Public Finance Authority, Wisconsin Revenue Bonds, Series 2020 | ||||||||||||
| 0.000% due 01/01/2060 (c) | 15,000 | 712 | ||||||||||
Public Finance Authority, Wisconsin Revenue Bonds, Series 2021 | ||||||||||||
| 4.000% due 09/30/2051 | 1,700 | 1,328 | ||||||||||
| 4.000% due 03/31/2056 | 900 | 680 | ||||||||||
| 4.000% due 07/01/2056 | 1,100 | 854 | ||||||||||
| 4.500% due 06/01/2056 | 1,000 | 727 | ||||||||||
Public Finance Authority, Wisconsin Revenue Bonds, Series 2022 | ||||||||||||
| 5.000% due 10/01/2052 | 7,500 | 7,754 | ||||||||||
Wisconsin Center District Revenue Bonds, (AGM Insured), Series 2020 | ||||||||||||
| 0.000% due 12/15/2050 (c) | 21,000 | 5,153 | ||||||||||
Wisconsin Health & Educational Facilities Authority Revenue Bonds, Series 2016 | ||||||||||||
| 4.000% due 11/15/2046 | 4,345 | 4,485 | ||||||||||
Wisconsin Health & Educational Facilities Authority Revenue Bonds, Series 2017 | ||||||||||||
| 4.000% due 08/15/2042 (e) | 3,000 | 2,928 | ||||||||||
Wisconsin Health & Educational Facilities Authority Revenue Bonds, Series 2022 | ||||||||||||
| 4.000% due 12/01/2051 | 4,470 | 3,963 | ||||||||||
| 35,941 | ||||||||||||
Total Municipal Bonds & Notes (Cost $1,053,477) | 1,014,832 | |||||||||||
| See Accompanying Notes | ANNUAL REPORT | | | DECEMBER 31, 2022 | 43 |
| Schedule of Investments | PIMCO Municipal Income Fund II | (Cont.) |
| MARKET VALUE (000S) | ||||||||||||
| SHORT-TERM INSTRUMENTS 0.2% | ||||||||||||
| REPURCHASE AGREEMENTS (g) 0.2% | ||||||||||||
| $ | 1,357 | |||||||||||
| Total Short-Term Instruments (Cost $1,357) | 1,357 | |||||||||||
| Total Investments in Securities (Cost $1,054,834) | 1,016,189 | |||||||||||
| Total Investments 175.8% (Cost $1,054,834) | $ | 1,016,189 | ||||||||||
| Auction Rate Preferred Shares (51.6)% | (298,275 | ) | ||||||||||
Remarketable Variable Rate MuniFund Term Preferred Shares, at liquidation value (11.9)% | (68,642 | ) | ||||||||||
| Other Assets and Liabilities, net (12.3)% | (71,233 | ) | ||||||||||
| Net Assets Applicable to Common Shareholders 100.0% | $ | 578,039 | ||||||||||
| * | A zero balance may reflect actual amounts rounding to less than one thousand. |
| ^ | Security is in default. |
| (a) | When-issued security. |
| (b) | Security is not accruing income as of the date of this report. |
| (c) | Zero coupon security. |
| (d) | Security becomes interest bearing at a future date. |
| (e) | Represents an underlying municipal bond transferred to a tender option bond trust established in a tender option bond transaction in which the Fund sold, or caused the sale of, the underlying municipal bond and purchased the residual interest certificate. The security serves as collateral in a financing transaction. See Note 5, Tender Option Bond Transactions, in the Notes to Financial Statements for more information. |
| Issuer Description | Coupon | Maturity Date | Acquisition Date | Cost | Market Value | Market Value as Percentage of Net Assets Applicable to Common Shareholders | ||||||||||||||||||
| Federal Home Loan Mortgage Corp. Enhanced Receipt, New Jersey Revenue Bonds, Series 2019 | 3.870 | % | 11/15/2035 | 10/26/2020 | $ | 7,724 | $ | 6,148 | 1.06 | % | ||||||||||||||
| New York State Housing Finance Agency Revenue Bonds, (FHA Insured), Series 2020 | 4.200 | 11/01/2054 | 11/18/2021 | 3,951 | 3,125 | 0.54 | ||||||||||||||||||
| $ | 11,675 | $ | 9,273 | 1.60 | % | |||||||||||||||||||
| Counterparty | Lending Rate | Settlement Date | Maturity Date | Principal Amount | Collateralized By | Collateral (Received) | Repurchase Agreements, at Value | Repurchase Agreement Proceeds to be Received(1) | ||||||||||||||||||||||
| FICC | 1.900 | % | 12/30/2022 | 01/03/2023 | $ | 1,357 | U.S. Treasury Bills 0.000% due 06/29/2023 | $ | (1,384 | ) | $ | 1,357 | $ | 1,357 | ||||||||||||||||
Total Repurchase Agreements | $ | (1,384 | ) | $ | 1,357 | $ | 1,357 | |||||||||||||||||||||||
| 44 | PIMCO CLOSED-END FUNDS | See Accompanying Notes |
| December 31, 2022 |
| Counterparty | Repurchase Agreement Proceeds to be Received(1) | Payable for Reverse Repurchase Agreements | Payable for Sale‑Buyback Transactions | Total Borrowings and Other Financing Transactions | Collateral Pledged/(Received) | Net Exposure(2) | ||||||||||||||||||
| Global/Master Repurchase Agreement | ||||||||||||||||||||||||
| FICC | $ | 1,357 | $ | 0 | $ | 0 | $ | 1,357 | $ | (1,384 | ) | $ | (27 | ) | ||||||||||
Total Borrowings and Other Financing Transactions | $ | 1,357 | $ | 0 | $ | 0 | ||||||||||||||||||
| (1) | Includes accrued interest. |
| (2) | Net Exposure represents the net receivable/(payable) that would be due from/to the counterparty in the event of default. Exposure from borrowings and other financing transactions can only be netted across transactions governed under the same master agreement with the same legal entity. See Note 7, Master Netting Arrangements, in the Notes to Financial Statements for more information. |
| Category and Subcategory | Level 1 | Level 2 | Level 3 | Fair Value at 12/31/2022 | ||||||||||||
Investments in Securities, at Value | ||||||||||||||||
| Municipal Bonds & Notes | ||||||||||||||||
| Alabama | $ | 0 | $ | 39,521 | $ | 0 | $ | 39,521 | ||||||||
| Alaska | 0 | 2,576 | 0 | 2,576 | ||||||||||||
| Arizona | 0 | 57,385 | 0 | 57,385 | ||||||||||||
| Arkansas | 0 | 3,358 | 0 | 3,358 | ||||||||||||
| California | 0 | 42,326 | 0 | 42,326 | ||||||||||||
| Colorado | 0 | 27,564 | 0 | 27,564 | ||||||||||||
| Connecticut | 0 | 7,643 | 0 | 7,643 | ||||||||||||
| Delaware | 0 | 5,727 | 0 | 5,727 | ||||||||||||
| District of Columbia | 0 | 4,980 | 0 | 4,980 | ||||||||||||
| Florida | 0 | 30,627 | 0 | 30,627 | ||||||||||||
| Georgia | 0 | 36,564 | 0 | 36,564 | ||||||||||||
| Illinois | 0 | 117,305 | 0 | 117,305 | ||||||||||||
| Indiana | 0 | 7,963 | 0 | 7,963 | ||||||||||||
| Iowa | 0 | 7,851 | 0 | 7,851 | ||||||||||||
| Kansas | 0 | 5,421 | 0 | 5,421 | ||||||||||||
| Louisiana | 0 | 22,713 | 0 | 22,713 | ||||||||||||
| Maine | 0 | 4,513 | 0 | 4,513 | ||||||||||||
| Maryland | 0 | 6,621 | 0 | 6,621 | ||||||||||||
| Massachusetts | 0 | 10,544 | 0 | 10,544 | ||||||||||||
| Michigan | 0 | 14,941 | 0 | 14,941 | ||||||||||||
| Minnesota | 0 | 5,372 | 0 | 5,372 | ||||||||||||
| Mississippi | 0 | 40 | 0 | 40 | ||||||||||||
| Missouri | 0 | 14,055 | 0 | 14,055 | ||||||||||||
| Category and Subcategory | Level 1 | Level 2 | Level 3 | Fair Value at 12/31/2022 | ||||||||||||
| Nevada | $ | 0 | $ | 11,458 | $ | 0 | $ | 11,458 | ||||||||
| New Jersey | 0 | 53,138 | 0 | 53,138 | ||||||||||||
| New York | 0 | 101,454 | 0 | 101,454 | ||||||||||||
| North Carolina | 0 | 2,970 | 0 | 2,970 | ||||||||||||
| North Dakota | 0 | 1,073 | 0 | 1,073 | ||||||||||||
| Ohio | 0 | 36,827 | 0 | 36,827 | ||||||||||||
| Oklahoma | 0 | 6,352 | 0 | 6,352 | ||||||||||||
| Oregon | 0 | 4,346 | 0 | 4,346 | ||||||||||||
| Pennsylvania | 0 | 42,187 | 0 | 42,187 | ||||||||||||
| Puerto Rico | 0 | 40,190 | 0 | 40,190 | ||||||||||||
| Rhode Island | 0 | 18,264 | 0 | 18,264 | ||||||||||||
| South Carolina | 0 | 10,066 | 0 | 10,066 | ||||||||||||
| Tennessee | 0 | 10,784 | 0 | 10,784 | ||||||||||||
| Texas | 0 | 120,625 | 0 | 120,625 | ||||||||||||
| U.S. Virgin Islands | 0 | 5,476 | 0 | 5,476 | ||||||||||||
| Utah | 0 | 1,468 | 0 | 1,468 | ||||||||||||
| Virginia | 0 | 23,112 | 0 | 23,112 | ||||||||||||
| Washington | 0 | 4,295 | 0 | 4,295 | ||||||||||||
| West Virginia | 0 | 9,196 | 0 | 9,196 | ||||||||||||
| Wisconsin | 0 | 35,941 | 0 | 35,941 | ||||||||||||
| Short-Term Instruments | ||||||||||||||||
| Repurchase Agreements | 0 | 1,357 | 0 | 1,357 | ||||||||||||
| Total Investments | $ | 0 | $ | 1,016,189 | $ | 0 | $ | 1,016,189 | ||||||||
| See Accompanying Notes | ANNUAL REPORT | | | DECEMBER 31, 2022 | 45 |
| Schedule of Investments | PIMCO Municipal Income Fund III |
| PRINCIPAL AMOUNT (000S) | MARKET VALUE (000S) | |||||||||||
| INVESTMENTS IN SECURITIES 178.5% | ||||||||||||
| MUNICIPAL BONDS & NOTES 177.6% | ||||||||||||
| ALABAMA 7.3% | ||||||||||||
Jefferson County, Alabama Sewer Revenue Bonds, Series 2013 | ||||||||||||
| 0.000% due 10/01/2050 (d) | $ | 9,000 | $ | 9,194 | ||||||||
| 6.500% due 10/01/2053 | 7,500 | 8,012 | ||||||||||
Tuscaloosa County, Alabama Industrial Development Authority Revenue Bonds, Series 2019 | ||||||||||||
| 4.500% due 05/01/2032 | 1,111 | 1,006 | ||||||||||
| 5.250% due 05/01/2044 | 1,625 | 1,429 | ||||||||||
| 19,641 | ||||||||||||
| ALASKA 0.5% | ||||||||||||
Municipality of Anchorage, Alaska Solid Waste Services Revenue Bonds, Series 2022 | ||||||||||||
| 5.250% due 11/01/2062 | 1,165 | 1,225 | ||||||||||
| ARIZONA 8.5% | ||||||||||||
Arizona Industrial Development Authority Revenue Bonds, Series 2019 | ||||||||||||
| 4.500% due 01/01/2031 | 675 | 456 | ||||||||||
| 4.500% due 01/01/2032 | 710 | 465 | ||||||||||
| 4.500% due 01/01/2049 | 750 | 434 | ||||||||||
Arizona Industrial Development Authority Revenue Bonds, Series 2020 | ||||||||||||
| 7.750% due 07/01/2050 | 1,200 | 840 | ||||||||||
Industrial Development Authority of the County, Arizona of Pima Revenue Bonds, Series 2020 | ||||||||||||
| 5.000% due 07/01/2055 | 1,200 | 1,026 | ||||||||||
Maricopa County, Arizona Industrial Development Authority Revenue Bonds, Series 2019 | ||||||||||||
| 4.000% due 01/01/2044 | 3,800 | 3,584 | ||||||||||
Phoenix Civic Improvement Corp., Arizona Revenue Bonds, Series 2019 | ||||||||||||
| 4.000% due 07/01/2049 | 2,495 | 2,286 | ||||||||||
| 5.000% due 07/01/2049 | 1,770 | 1,825 | ||||||||||
Salt Verde Financial Corp., Arizona Revenue Bonds, Series 2007 | ||||||||||||
| 5.000% due 12/01/2037 | 11,600 | 11,806 | ||||||||||
| 22,722 | ||||||||||||
| CALIFORNIA 8.1% | ||||||||||||
California Health Facilities Financing Authority Revenue Bonds, Series 2013 | ||||||||||||
| 5.000% due 08/15/2052 | 2,015 | 2,043 | ||||||||||
California Health Facilities Financing Authority Revenue Bonds, Series 2020 | ||||||||||||
| 4.000% due 04/01/2049 | 2,000 | 1,737 | ||||||||||
California State General Obligation Bonds, Series 2005 | ||||||||||||
| 3.200% due 05/01/2040 | 2,000 | 2,000 | ||||||||||
California State General Obligation Bonds, Series 2019 | ||||||||||||
| 5.000% due 04/01/2045 | 3,000 | 3,231 | ||||||||||
Folsom Cordova Unified School District, California General Obligation Bonds, (AGM Insured), Series 2019 | ||||||||||||
| 4.000% due 10/01/2044 | 1,810 | 1,755 | ||||||||||
Golden State, California Tobacco Securitization Corp. Revenue Bonds, Series 2021 | ||||||||||||
| 0.000% due 06/01/2066 (c) | 2,500 | 291 | ||||||||||
Golden State, California Tobacco Securitization Corp. Revenue Bonds, Series 2022 | ||||||||||||
| 5.000% due 06/01/2051 | 1,050 | 1,079 | ||||||||||
Los Angeles County, California Public Works Financing Authority Revenue Bonds, Series 2021 | ||||||||||||
| 4.000% due 12/01/2046 | 1,490 | 1,411 | ||||||||||
Los Angeles Department of Airports, California Revenue Bonds, Series 2020 | ||||||||||||
| 4.000% due 05/15/2048 | 2,000 | 1,959 | ||||||||||
| PRINCIPAL AMOUNT (000S) | MARKET VALUE (000S) | |||||||||||
M‑S‑R Energy Authority, California Revenue Bonds, Series 2009 | ||||||||||||
| 6.500% due 11/01/2039 | $ | 2,000 | $ | 2,395 | ||||||||
Morongo Band of Mission Indians, California Revenue Bonds, Series 2018 | ||||||||||||
| 5.000% due 10/01/2042 | 750 | 750 | ||||||||||
Northern California Energy Authority Revenue Bonds, Series 2018 | ||||||||||||
| 4.000% due 07/01/2049 | 2,250 | 2,248 | ||||||||||
San Francisco, California City & County Public Utilities Commission Wastewater Revenue Bonds, Series 2021 | ||||||||||||
| 4.000% due 10/01/2048 | 730 | 695 | ||||||||||
| 21,594 | ||||||||||||
| COLORADO 4.3% | ||||||||||||
Colorado Health Facilities Authority Revenue Bonds, Series 2019 | ||||||||||||
| 4.000% due 01/01/2040 | 2,500 | 2,474 | ||||||||||
| 4.000% due 08/01/2049 | 2,000 | 1,680 | ||||||||||
Colorado International Center Metropolitan District No 7 General Obligation Bonds, Series 2021 | ||||||||||||
| 0.000% due 12/01/2051 (d) | 1,615 | 834 | ||||||||||
Colorado State Building Excellent School Certificates of Participation Bonds, Series 2018 | ||||||||||||
| 4.000% due 03/15/2043 | 1,250 | 1,196 | ||||||||||
Denver, Colorado City & County Revenue Bonds, Series 2021 | ||||||||||||
| 4.000% due 08/01/2043 | 1,500 | 1,483 | ||||||||||
Dominion Water & Sanitation District, Colorado Revenue Bonds, Series 2022 | ||||||||||||
| 5.875% due 12/01/2052 | 1,250 | 1,206 | ||||||||||
Harvest Crossing Metropolitan District No 4, Colorado General Obligation Bonds, Series 2022 | ||||||||||||
| 7.250% due 12/01/2052 | 1,250 | 1,174 | ||||||||||
Public Authority for Colorado Energy Revenue Bonds, Series 2008 | ||||||||||||
| 6.500% due 11/15/2038 | 500 | 586 | ||||||||||
Senac South Metropolitan District No 1, Colorado General Obligation Bonds, Series 2021 | ||||||||||||
| 5.250% due 12/01/2051 | 550 | 459 | ||||||||||
Third Creek Metropolitan District No 1, Colorado General Obligation Bonds, Series 2022 | ||||||||||||
| 4.750% due 12/01/2051 | 500 | 375 | ||||||||||
| 11,467 | ||||||||||||
| CONNECTICUT 1.9% | ||||||||||||
Connecticut Special Tax Revenue State Special Tax Bonds, Series 2020 | ||||||||||||
| 5.000% due 05/01/2040 | 2,000 | 2,173 | ||||||||||
Connecticut State Health & Educational Facilities Authority Revenue Bonds, Series 2020 | ||||||||||||
| 4.000% due 07/01/2045 | 3,300 | 3,024 | ||||||||||
| 5,197 | ||||||||||||
| DELAWARE 4.4% | ||||||||||||
Affordable Housing Opportunities Trust, Delaware Revenue Bonds, Series 2022 | ||||||||||||
| 0.000% due 07/01/2037 | 11,120 | 9,989 | ||||||||||
| 7.120% due 07/01/2037 | 1,965 | 1,897 | ||||||||||
| 11,886 | ||||||||||||
| DISTRICT OF COLUMBIA 1.7% | ||||||||||||
District of Columbia General Obligation Bonds, Series 2019 | ||||||||||||
| 5.000% due 10/15/2044 | 650 | 695 | ||||||||||
District of Columbia Revenue Bonds, Series 2022 | ||||||||||||
| 5.500% due 08/31/2036 | 1,800 | 1,922 | ||||||||||
District of Columbia Water & Sewer Authority Revenue Bonds, Series 2019 | ||||||||||||
| 5.000% due 10/01/2044 | 500 | 534 | ||||||||||
| PRINCIPAL AMOUNT (000S) | MARKET VALUE (000S) | |||||||||||
Metropolitan Washington Airports Authority Dulles Toll Road, District of Columbia Revenue Bonds, Series 2019 | ||||||||||||
| 4.000% due 10/01/2049 | $ | 1,750 | $ | 1,515 | ||||||||
| 4,666 | ||||||||||||
| FLORIDA 10.0% | ||||||||||||
Greater Orlando Aviation Authority, Florida Revenue Bonds, Series 2010 | ||||||||||||
| 0.000% due 10/01/2039 (f) | 5,000 | 5,007 | ||||||||||
Hillsborough County, Florida Industrial Development Authority Revenue Bonds, Series 2020 | ||||||||||||
| 4.000% due 08/01/2050 | 1,800 | 1,524 | ||||||||||
Miami-Dade County, Florida Educational Facilities Authority Revenue Bonds, Series 2018 | ||||||||||||
| 4.000% due 04/01/2053 | 4,000 | 3,579 | ||||||||||
Miami-Dade County, Florida Transit System Revenue Bonds, Series 2018 | ||||||||||||
| 4.000% due 07/01/2044 | 1,000 | 965 | ||||||||||
Miami-Dade County, Florida Water & Sewer System Revenue Bonds, Series 2019 | ||||||||||||
| 4.000% due 10/01/2049 | 2,500 | 2,273 | ||||||||||
North Miami Beach, Florida Water Revenue Bonds, Series 2020 | ||||||||||||
| 5.000% due 08/01/2044 | 3,000 | 3,231 | ||||||||||
Pasco County, Florida Water & Sewer Revenue Bonds, Series 2014 | ||||||||||||
| 4.000% due 10/01/2044 | 1,500 | 1,463 | ||||||||||
Pompano Beach, Florida Revenue Bonds, Series 2020 | ||||||||||||
| 4.000% due 09/01/2050 | 1,750 | 1,341 | ||||||||||
Putnam County Development Authority, Florida Revenue Bonds, Series 2018 | ||||||||||||
| 5.000% due 03/15/2042 | 1,000 | 1,069 | ||||||||||
South Miami Health Facilities Authority, Florida Revenue Bonds, Series 2017 | ||||||||||||
| 4.000% due 08/15/2047 | 3,750 | 3,347 | ||||||||||
St Johns County, Florida Industrial Development Authority Revenue Bonds, Series 2020 | ||||||||||||
| 4.000% due 08/01/2055 | 3,500 | 3,049 | ||||||||||
| 26,848 | ||||||||||||
| GEORGIA 5.8% | ||||||||||||
Atlanta Development Authority, Georgia Revenue Bonds, Series 2017 | ||||||||||||
| 6.750% due 01/01/2035 ^(b) | 1,750 | 928 | ||||||||||
Fayette County, Georgia Hospital Authority Revenue Bonds, Series 2016 | ||||||||||||
| 5.000% due 07/01/2046 (e) | 3,000 | 3,025 | ||||||||||
Main Street Natural Gas, Inc., Georgia Revenue Bonds, Series 2019 | ||||||||||||
| 5.000% due 05/15/2043 | 2,000 | 2,001 | ||||||||||
Municipal Electric Authority of Georgia Revenue Bonds, Series 2015 | ||||||||||||
| 5.000% due 07/01/2060 | 10,000 | 9,680 | ||||||||||
| 15,634 | ||||||||||||
| ILLINOIS 19.9% | ||||||||||||
Chicago Board of Education, Illinois General Obligation Bonds, Series 2018 | ||||||||||||
| 5.000% due 12/01/2046 | 4,000 | 3,809 | ||||||||||
Chicago O’Hare International Airport, Illinois Revenue Bonds, Series 2018 | ||||||||||||
| 5.000% due 01/01/2048 | 2,800 | 2,861 | ||||||||||
| 5.000% due 01/01/2053 | 1,000 | 1,018 | ||||||||||
Chicago O’Hare International Airport, Illinois Revenue Bonds, Series 2022 | ||||||||||||
| 5.000% due 01/01/2055 | 2,330 | 2,348 | ||||||||||
Chicago Park District, Illinois General Obligation Bonds, Series 2020 | ||||||||||||
| 4.000% due 01/01/2038 | 1,435 | 1,364 | ||||||||||
| 46 | PIMCO CLOSED-END FUNDS | See Accompanying Notes |
| December 31, 2022 |
| PRINCIPAL AMOUNT (000S) | MARKET VALUE (000S) | |||||||||||
Chicago, Illinois General Obligation Bonds, Series 2007 | ||||||||||||
| 5.500% due 01/01/2035 | $ | 400 | $ | 407 | ||||||||
| 5.500% due 01/01/2042 | 1,000 | 1,011 | ||||||||||
Chicago, Illinois General Obligation Bonds, Series 2015 | ||||||||||||
| 5.375% due 01/01/2029 | 7,200 | 7,364 | ||||||||||
| 5.500% due 01/01/2034 | 2,665 | 2,717 | ||||||||||
Chicago, Illinois General Obligation Bonds, Series 2017 | ||||||||||||
| 6.000% due 01/01/2038 | 3,000 | 3,166 | ||||||||||
Chicago, Illinois Revenue Bonds, Series 2002 | ||||||||||||
| 5.000% due 01/01/2027 | 1,750 | 1,828 | ||||||||||
Illinois Finance Authority Revenue Bonds, Series 2017 | ||||||||||||
| 5.000% due 02/15/2037 ^(b) | 1,030 | 464 | ||||||||||
Illinois Finance Authority Revenue Bonds, Series 2019 | ||||||||||||
| 5.000% due 11/01/2035 | 1,010 | 916 | ||||||||||
Illinois State General Obligation Bonds, Series 2018 | ||||||||||||
| 4.625% due 05/01/2037 | 2,000 | 1,934 | ||||||||||
| 5.000% due 05/01/2041 | 1,500 | 1,477 | ||||||||||
Illinois State General Obligation Notes, Series 2017 | ||||||||||||
| 5.000% due 11/01/2025 | 1,150 | 1,179 | ||||||||||
| 5.000% due 11/01/2027 | 7,000 | 7,239 | ||||||||||
Metropolitan Pier & Exposition Authority, Illinois Revenue Bonds, (AGM Insured), Series 2010 | ||||||||||||
| 0.000% due 06/15/2045 (c) | 6,500 | 2,164 | ||||||||||
Metropolitan Pier & Exposition Authority, Illinois Revenue Bonds, (AGM/CR Insured), Series 2017 | ||||||||||||
| 0.000% due 12/15/2056 (c) | 2,685 | 487 | ||||||||||
Metropolitan Pier & Exposition Authority, Illinois Revenue Bonds, (AGM/CR/NPFGC Insured), Series 2002 | ||||||||||||
| 0.000% due 12/15/2040 (c) | 2,000 | 856 | ||||||||||
Metropolitan Pier & Exposition Authority, Illinois Revenue Bonds, Series 2012 | ||||||||||||
| 0.000% due 12/15/2051 (c) | 2,500 | 532 | ||||||||||
Regional Transportation Authority, Illinois Revenue Bonds, Series 2018 | ||||||||||||
| 5.000% due 06/01/2038 (e) | 3,900 | 4,248 | ||||||||||
Sales Tax Securitization Corp., Illinois Revenue Notes, Series 2020 | ||||||||||||
| 5.000% due 01/01/2029 | 3,500 | 3,790 | ||||||||||
| 53,179 | ||||||||||||
| INDIANA 2.1% | ||||||||||||
Indiana Finance Authority Revenue Bonds, Series 2019 | ||||||||||||
| 7.000% due 03/01/2039 | 1,250 | 938 | ||||||||||
Indiana Finance Authority Revenue Bonds, Series 2022 | ||||||||||||
| 4.500% due 12/15/2046 | 2,460 | 2,459 | ||||||||||
Indiana Health & Educational Facilities Financing Authority Revenue Bonds, Series 2006 | ||||||||||||
| 4.000% due 11/15/2046 | 2,500 | 2,297 | ||||||||||
| 5,694 | ||||||||||||
| IOWA 1.4% | ||||||||||||
Iowa Finance Authority Midwestern Disaster Area Revenue Refunding Bonds, Series 2022 | ||||||||||||
| 5.000% due 12/01/2050 | 2,755 | 2,575 | ||||||||||
Iowa Finance Authority Revenue Bonds, Series 2014 | ||||||||||||
| 5.400% due 11/15/2046 ^ | 364 | 378 | ||||||||||
Iowa Finance Authority Revenue Bonds, Series 2022 | ||||||||||||
| 8.000% due 01/01/2042 | 875 | 824 | ||||||||||
| 3,777 | ||||||||||||
| KANSAS 0.7% | ||||||||||||
University of Kansas Hospital Authority Revenue Bonds, Series 2015 | ||||||||||||
| 4.000% due 09/01/2040 (e) | 2,000 | 1,971 | ||||||||||
| 1,971 | ||||||||||||
| PRINCIPAL AMOUNT (000S) | MARKET VALUE (000S) | |||||||||||
| LOUISIANA 4.8% | ||||||||||||
East Baton Rouge Sewerage Commission, Louisiana Revenue Bonds, Series 2019 | ||||||||||||
| 4.000% due 02/01/2045 | $ | 3,100 | $ | 2,962 | ||||||||
Louisiana Gasoline & Fuels Tax State Revenue Bonds, Series 2017 | ||||||||||||
| 4.000% due 05/01/2045 | 4,000 | 3,738 | ||||||||||
Louisiana Public Facilities Authority Revenue Bonds, Series 2017 | ||||||||||||
| 5.000% due 05/15/2042 | 4,000 | 4,110 | ||||||||||
Louisiana Public Facilities Authority Revenue Bonds, Series 2020 | ||||||||||||
| 4.000% due 04/01/2050 | 750 | 693 | ||||||||||
Parish of St James, Louisiana Revenue Bonds, Series 2010 | ||||||||||||
| 6.350% due 07/01/2040 | 1,350 | 1,439 | ||||||||||
| 12,942 | ||||||||||||
| MAINE 0.6% | ||||||||||||
Maine Health & Higher Educational Facilities Authority Revenue Bonds, Series 2013 | ||||||||||||
| 5.000% due 07/01/2043 | 1,500 | 1,513 | ||||||||||
| MARYLAND 0.2% | ||||||||||||
Maryland Economic Development Corp. Revenue Bonds, Series 2020 | ||||||||||||
| 4.000% due 07/01/2040 | 500 | 456 | ||||||||||
| MASSACHUSETTS 3.3% | ||||||||||||
Commonwealth of Massachusetts General Obligation Bonds, Series 2018 | ||||||||||||
| 4.000% due 05/01/2040 | 1,000 | 982 | ||||||||||
Commonwealth of Massachusetts General Obligation Bonds, Series 2019 | ||||||||||||
| 5.000% due 05/01/2046 | 3,000 | 3,183 | ||||||||||
Massachusetts Development Finance Agency Revenue Bonds, Series 2010 | ||||||||||||
| 7.625% due 10/15/2037 ^(b) | 248 | 37 | ||||||||||
Massachusetts Development Finance Agency Revenue Bonds, Series 2016 | ||||||||||||
| 5.000% due 01/01/2047 | 1,000 | 1,000 | ||||||||||
Massachusetts Housing Finance Agency Revenue Bonds, Series 2003 | ||||||||||||
| 5.125% due 06/01/2043 | 525 | 526 | ||||||||||
Massachusetts School Building Authority Revenue Bonds, Series 2012 | ||||||||||||
| 5.250% due 02/15/2048 (e) | 3,000 | 3,189 | ||||||||||
| 8,917 | ||||||||||||
| MICHIGAN 4.1% | ||||||||||||
Michigan Finance Authority Revenue Bonds, Series 2017 | ||||||||||||
| 5.000% due 12/01/2031 (e) | 1,200 | 1,303 | ||||||||||
Michigan Finance Authority Revenue Bonds, Series 2019 | ||||||||||||
| 4.000% due 02/15/2050 | 2,000 | 1,806 | ||||||||||
Michigan Finance Authority Revenue Bonds, Series 2021 | ||||||||||||
| 5.000% due 12/01/2046 (e) | 2,425 | 2,451 | ||||||||||
Michigan Finance Authority Revenue Notes, Series 2021 | ||||||||||||
| 5.000% due 06/01/2027 (e) | 75 | 82 | ||||||||||
Michigan Tobacco Settlement Finance Authority Revenue Bonds, Series 2008 | ||||||||||||
| 0.000% due 06/01/2058 (c) | 12,500 | 491 | ||||||||||
Michigan Trunk Line State Revenue Bonds, Series 2021 | ||||||||||||
| 4.000% due 11/15/2044 | 5,000 | 4,756 | ||||||||||
| 10,889 | ||||||||||||
| PRINCIPAL AMOUNT (000S) | MARKET VALUE (000S) | |||||||||||
| MINNESOTA 0.6% | ||||||||||||
Rochester, Minnesota Revenue Bonds, Series 2018 | ||||||||||||
| 4.000% due 11/15/2048 | $ | 1,750 | $ | 1,673 | ||||||||
| MISSOURI 0.6% | ||||||||||||
Health & Educational Facilities Authority of the State of Missouri Revenue Bonds, Series 2019 | ||||||||||||
| 5.000% due 02/15/2035 | 500 | 535 | ||||||||||
Jennings, Missouri Revenue Bonds, Series 2006 | ||||||||||||
| 5.000% due 11/01/2023 | 130 | 68 | ||||||||||
Missouri Development Finance Board Revenue Bonds, Series 2022 | ||||||||||||
| 5.250% due 05/01/2055 | 1,000 | 1,072 | ||||||||||
| 1,675 | ||||||||||||
| NEVADA 2.0% | ||||||||||||
Clark County, Nevada General Obligation Bonds, Series 2018 | ||||||||||||
| 4.000% due 07/01/2044 (e) | 4,545 | 4,369 | ||||||||||
Reno, Nevada Revenue Bonds, Series 2018 | ||||||||||||
| 0.000% due 07/01/2058 (c) | 11,000 | 1,066 | ||||||||||
| 5,435 | ||||||||||||
| NEW JERSEY 10.9% | ||||||||||||
Cherry Hill Township School District, New Jersey General Obligation Bonds, Series 2022 | ||||||||||||
| 4.000% due 08/01/2040 | 3,000 | 2,961 | ||||||||||
Federal Home Loan Mortgage Corp. Enhanced Receipt, New Jersey Revenue Bonds, Series 2019 | ||||||||||||
| 3.870% due 11/15/2035 (g) | 3,256 | 2,966 | ||||||||||
New Jersey Economic Development Authority Revenue Bonds, Series 2016 | ||||||||||||
| 5.000% due 06/15/2041 | 5,000 | 5,082 | ||||||||||
New Jersey Economic Development Authority Special Assessment Bonds, Series 2002 | ||||||||||||
| 6.500% due 04/01/2028 | 3,949 | 3,919 | ||||||||||
New Jersey Health Care Facilities Financing Authority Revenue Bonds, Series 2013 | ||||||||||||
| 5.500% due 07/01/2043 | 2,000 | 2,014 | ||||||||||
New Jersey Transportation Trust Fund Authority Revenue Bonds, (AGM Insured), Series 2006 | ||||||||||||
| 0.000% due 12/15/2034 (c) | 3,200 | 1,958 | ||||||||||
New Jersey Transportation Trust Fund Authority Revenue Bonds, Series 2021 | ||||||||||||
| 4.000% due 06/15/2036 | 1,500 | 1,462 | ||||||||||
South Jersey Port Corp., New Jersey Revenue Bonds, Series 2017 | ||||||||||||
| 5.000% due 01/01/2049 | 900 | 900 | ||||||||||
Tobacco Settlement Financing Corp., New Jersey Revenue Bonds, Series 2018 | ||||||||||||
| 5.000% due 06/01/2031 | 1,200 | 1,259 | ||||||||||
| 5.000% due 06/01/2046 | 7,000 | 6,693 | ||||||||||
| 29,214 | ||||||||||||
| NEW YORK 16.2% | ||||||||||||
Build NYC Resource Corp., New York Revenue Bonds, Series 2023 | ||||||||||||
| 5.250% due 07/01/2052 (a) | 2,000 | 2,034 | ||||||||||
Metropolitan Transportation Authority, New York Revenue Bonds, (AGM Insured), Series 2019 | ||||||||||||
| 4.000% due 11/15/2049 | 2,120 | 1,904 | ||||||||||
Metropolitan Transportation Authority, New York Revenue Bonds, Series 2017 | ||||||||||||
| 4.000% due 11/15/2042 | 5,500 | 4,776 | ||||||||||
Nassau County, New York Industrial Development Agency Revenue Bonds, Series 2021 | ||||||||||||
| 5.000% due 01/01/2058 | 785 | 384 | ||||||||||
New York City Transitional Finance Authority Future Tax Secured, New York Revenue Bonds, Series 2019 | ||||||||||||
| 4.000% due 05/01/2041 | 1,110 | 1,064 | ||||||||||
| See Accompanying Notes | ANNUAL REPORT | | | DECEMBER 31, 2022 | 47 |
| Schedule of Investments | PIMCO Municipal Income Fund III | (Cont.) |
| PRINCIPAL AMOUNT (000S) | MARKET VALUE (000S) | |||||||||||
New York City Water & Sewer System, New York Revenue Bonds, Series 2020 | ||||||||||||
| 4.000% due 06/15/2050 | $ | 4,000 | $ | 3,710 | ||||||||
New York City, New York Housing Development Corp. Revenue Bonds, Series 2006 | ||||||||||||
| 3.630% due 10/15/2041 | 2,400 | 2,400 | ||||||||||
New York City, New York Transitional Finance Authority Future Tax Secured Revenue Bonds, Series 2022 | ||||||||||||
| 5.500% due 11/01/2045 | 2,250 | 2,534 | ||||||||||
New York Liberty Development Corp. Revenue Bonds, Series 2007 | ||||||||||||
| 5.500% due 10/01/2037 | 1,700 | 1,885 | ||||||||||
New York Liberty Development Corp. Revenue Bonds, Series 2014 | ||||||||||||
| 5.000% due 11/15/2044 | 1,000 | 911 | ||||||||||
New York State Dormitory Authority Northwell Health Obligated Group Revenue Bonds, Series 2022 | ||||||||||||
| 5.000% due 05/01/2052 | 2,000 | 2,041 | ||||||||||
New York State Dormitory Authority Revenue Bonds, Series 2017 | ||||||||||||
| 4.000% due 02/15/2047 | 500 | 468 | ||||||||||
New York State Dormitory Authority Revenue Bonds, Series 2020 | ||||||||||||
| 4.000% due 02/15/2040 | 1,250 | 1,216 | ||||||||||
New York State Housing Finance Agency Revenue Bonds, (FHA Insured), Series 2020 | ||||||||||||
| 4.200% due 11/01/2054 (g) | 1,500 | 1,339 | ||||||||||
New York State Thruway Authority Revenue Bonds, (AGM Insured), Series 2019 | ||||||||||||
| 4.000% due 01/01/2053 | 500 | 449 | ||||||||||
New York State Thruway Authority Revenue Bonds, Series 2019 | ||||||||||||
| 4.000% due 01/01/2041 | 5,500 | 5,228 | ||||||||||
| 4.000% due 01/01/2050 | 620 | 564 | ||||||||||
New York State Thruway Authority Revenue Bonds, Series 2021 | ||||||||||||
| 4.000% due 03/15/2047 | 2,000 | 1,877 | ||||||||||
New York State Urban Development Corp. Revenue Bonds, Series 2021 | ||||||||||||
| 4.000% due 03/15/2047 | 3,250 | 3,055 | ||||||||||
Triborough Bridge & Tunnel Authority Sales Tax, New York Revenue Bonds, Series 2022 | ||||||||||||
| 4.000% due 05/15/2057 | 2,750 | 2,568 | ||||||||||
Triborough Bridge & Tunnel Authority, New York Revenue Bonds, Series 2021 | ||||||||||||
| 5.000% due 05/15/2051 | 2,835 | 3,002 | ||||||||||
| 43,409 | ||||||||||||
| NORTH CAROLINA 0.9% | ||||||||||||
University of North Carolina Hospitals at Chapel Hill Revenue Bonds, Series 2016 | ||||||||||||
| 4.000% due 02/01/2046 | 2,500 | 2,373 | ||||||||||
| NORTH DAKOTA 0.2% | ||||||||||||
Grand Forks County, North Dakota Revenue Bonds, Series 2021 | ||||||||||||
| 7.000% due 12/15/2043 ^(b) | 940 | 517 | ||||||||||
| OHIO 6.3% | ||||||||||||
American Municipal Power, Inc., Ohio Revenue Bonds, Series 2017 | ||||||||||||
| 4.000% due 02/15/2042 | 1,000 | 932 | ||||||||||
Buckeye Tobacco Settlement Financing Authority, Ohio Revenue Bonds, Series 2020 | ||||||||||||
| 0.000% due 06/01/2057 (c) | 39,500 | 4,536 | ||||||||||
Geisinger Authority, Ohio Revenue Bonds, Series 2017 | ||||||||||||
| 4.000% due 02/15/2047 | 5,310 | 4,824 | ||||||||||
Montgomery County, Ohio Dayton Children’s Hospital Revenue Bonds, Series 2021 | ||||||||||||
| 4.000% due 08/01/2046 | 2,250 | 2,075 | ||||||||||
| PRINCIPAL AMOUNT (000S) | MARKET VALUE (000S) | |||||||||||
Ohio Air Quality Development Authority Dayton Power And Light Company Project Revenue Bonds, Series 2015 | ||||||||||||
| 4.250% due 11/01/2040 | $ | 2,000 | $ | 1,997 | ||||||||
Ohio Water Development Authority Water Pollution Control Loan Fund Revenue Bonds, Series 2020 | ||||||||||||
| 5.000% due 12/01/2050 | 1,250 | 1,334 | ||||||||||
Southern Ohio Port Authority Revenue Notes, Series 2020 | ||||||||||||
| 6.500% due 12/01/2030 | 1,400 | 1,054 | ||||||||||
| 16,752 | ||||||||||||
| OKLAHOMA 1.4% | ||||||||||||
Oklahoma Development Finance Authority Revenue Bonds, Series 2018 | ||||||||||||
| 5.500% due 08/15/2052 | 1,600 | 1,464 | ||||||||||
Oklahoma Development Finance Authority Revenue Bonds, Series 2021 | ||||||||||||
| 8.000% due 12/01/2041 | 1,000 | 782 | ||||||||||
Oklahoma Water Resources Board Revenue Bonds, Series 2020 | ||||||||||||
| 4.000% due 10/01/2049 | 1,500 | 1,455 | ||||||||||
| 3,701 | ||||||||||||
| OREGON 0.3% | ||||||||||||
Washington & Multnomah Counties School District No 48J Beaverton, Oregon General Obligation Bonds, Series 2022 | ||||||||||||
| 0.000% due 06/15/2048 (c) | 2,495 | 715 | ||||||||||
| PENNSYLVANIA 6.5% | ||||||||||||
Berks County, Pennsylvania Industrial Development Authority Revenue Bonds, Series 2017 | ||||||||||||
| 4.000% due 11/01/2050 | 900 | 497 | ||||||||||
Pennsylvania Economic Development Financing Authority Revenue Bonds, (AGM Insured), Series 2022 | ||||||||||||
| 5.750% due 12/31/2062 | 3,000 | 3,146 | ||||||||||
Pennsylvania Economic Development Financing Authority Revenue Bonds, Series 2009 | ||||||||||||
| 6.400% due 12/01/2038 ^(b) | 1,350 | 675 | ||||||||||
Pennsylvania Economic Development Financing Authority Revenue Bonds, Series 2021 | ||||||||||||
| 9.000% due 04/01/2051 | 1,650 | 1,872 | ||||||||||
Pennsylvania Economic Development Financing Authority Revenue Bonds, Series 2022 | ||||||||||||
| 4.000% due 02/15/2041 | 1,825 | 1,674 | ||||||||||
Pennsylvania Higher Educational Facilities Authority Revenue Bonds, Series 2019 | ||||||||||||
| 5.000% due 08/15/2049 | 1,350 | 1,402 | ||||||||||
Pennsylvania Turnpike Commission Revenue Bonds, Series 2013 | ||||||||||||
| 5.000% due 12/01/2043 | 3,800 | 3,866 | ||||||||||
Philadelphia Authority for Industrial Development, Pennsylvania Revenue Bonds, Series 2017 | ||||||||||||
| 5.500% due 12/01/2058 | 1,000 | 885 | ||||||||||
Philadelphia, Pennsylvania Water & Wastewater Revenue Bonds, Series 2019 | ||||||||||||
| 5.000% due 11/01/2054 | 3,100 | 3,236 | ||||||||||
| 17,253 | ||||||||||||
| PUERTO RICO 6.8% | ||||||||||||
Children’s Trust Fund, Puerto Rico Revenue Bonds, Series 2008 | ||||||||||||
| 0.000% due 05/15/2057 (c) | 31,000 | 1,922 | ||||||||||
Commonwealth of Puerto Rico Bonds, Series 2022 | ||||||||||||
| 0.000% due 11/01/2043 (c) | 4,156 | 1,824 | ||||||||||
| 0.000% due 11/01/2051 (c) | 4,255 | 1,643 | ||||||||||
Commonwealth of Puerto Rico General Obligation Bonds, Series 2021 | ||||||||||||
| 4.000% due 07/01/2041 | 1,700 | 1,336 | ||||||||||
| PRINCIPAL AMOUNT (000S) | MARKET VALUE (000S) | |||||||||||
Commonwealth of Puerto Rico General Obligation Notes, Series 2021 | ||||||||||||
| 0.000% due 07/01/2024 (c) | $ | 148 | $ | 137 | ||||||||
| 5.625% due 07/01/2027 | 952 | 972 | ||||||||||
Puerto Rico Highway & Transportation Authority Revenue Bonds, Series 2022 | ||||||||||||
| 0.000% due 07/01/2032 (c) | 209 | 124 | ||||||||||
| 0.000% due 07/01/2053 (d) | 1,523 | 845 | ||||||||||
| 5.000% due 07/01/2062 | 322 | 297 | ||||||||||
Puerto Rico Sales Tax Financing Corp. Sales Tax Revenue Bonds, Series 2018 | ||||||||||||
| 0.000% due 07/01/2046 (c) | 9,650 | 2,390 | ||||||||||
| 0.000% due 07/01/2051 (c) | 10,500 | 1,903 | ||||||||||
Puerto Rico Sales Tax Financing Corp. Sales Tax Revenue Bonds, Series 2019 | ||||||||||||
| 4.784% due 07/01/2058 | 5,460 | 4,751 | ||||||||||
| 18,144 | ||||||||||||
| SOUTH CAROLINA 2.5% | ||||||||||||
South Carolina Public Service Authority Revenue Obligations Revenue Bonds, Series 2013 | ||||||||||||
| 5.125% due 12/01/2043 | 5,000 | 5,021 | ||||||||||
| 5.500% due 12/01/2053 | 1,750 | 1,762 | ||||||||||
| 6,783 | ||||||||||||
| TENNESSEE 0.9% | ||||||||||||
Metropolitan Government of Nashville & Davidson County, Tennessee Health & Educational Facs Bd Revenue Bonds, Series 2020 | ||||||||||||
| 4.000% due 11/01/2055 | 1,000 | 748 | ||||||||||
Metropolitan Nashville Airport Authority, Tennessee Revenue Bonds, Series 2019 | ||||||||||||
| 4.000% due 07/01/2049 | 1,000 | 909 | ||||||||||
Shelby County, Tennessee Health Educational & Housing Facilities Board Revenue Bonds, Series 2019 | ||||||||||||
| 5.750% due 10/01/2059 | 750 | 640 | ||||||||||
| 2,297 | ||||||||||||
| TEXAS 18.6% | ||||||||||||
Angelina & Neches River Authority, Texas Revenue Bonds, Series 2021 | ||||||||||||
| 7.500% due 12/01/2045 | 650 | 427 | ||||||||||
| 12.000% due 12/01/2045 | 1,100 | 951 | ||||||||||
Austin, Texas Electric Utility Revenue Bonds, Series 2019 | ||||||||||||
| 5.000% due 11/15/2044 | 1,585 | 1,687 | ||||||||||
Bexar County Texas Hospital District, General Obligation Bonds, Series 2018 | ||||||||||||
| 4.000% due 02/15/2043 | 2,500 | 2,430 | ||||||||||
Calhoun County, Texas Navigation Industrial Development Authority Revenue Notes, Series 2021 | ||||||||||||
| 3.625% due 07/01/2026 | 1,250 | 1,125 | ||||||||||
Central Texas Turnpike System Revenue Bonds, Series 2015 | ||||||||||||
| 0.000% due 08/15/2036 (c) | 1,250 | 681 | ||||||||||
| 0.000% due 08/15/2037 (c) | 4,000 | 2,043 | ||||||||||
Clifton Higher Education Finance Corp., Texas Revenue Bonds, Series 2018 | ||||||||||||
| 6.125% due 08/15/2048 | 1,000 | 1,015 | ||||||||||
Dallas Fort Worth International Airport, Texas Revenue Bonds, Series 2022 | ||||||||||||
| 5.000% due 11/01/2038 | 1,750 | 1,910 | ||||||||||
Grand Parkway Transportation Corp., Texas Revenue Bonds, Series 2013 | ||||||||||||
| 5.000% due 04/01/2053 | 4,500 | 4,570 | ||||||||||
Grand Parkway Transportation Corp., Texas Revenue Bonds, Series 2018 | ||||||||||||
| 5.000% due 10/01/2048 (e) | 4,000 | 4,152 | ||||||||||
Harris County, Texas Cultural Education Facilities Finance Corp. Revenue Bonds, Series 2020 | ||||||||||||
| 3.650% due 12/01/2059 | 3,000 | 3,000 | ||||||||||
| 48 | PIMCO CLOSED-END FUNDS | See Accompanying Notes |
| December 31, 2022 |
| PRINCIPAL AMOUNT (000S) | MARKET VALUE (000S) | |||||||||||
Harris County, Texas Cultural Education Facilities Finance Corp. Revenue Bonds, Series 2021 | ||||||||||||
| 3.700% due 10/01/2041 | $ | 5,000 | $ | 5,000 | ||||||||
Houston, Texas Combined Utility System Revenue Bonds, Series 2019 | ||||||||||||
| 4.000% due 11/15/2044 | 1,500 | 1,435 | ||||||||||
New Hope Cultural Education Facilities Finance Corp., Texas Revenue Bonds, Series 2021 | ||||||||||||
| 5.500% due 01/01/2057 | 2,400 | 1,736 | ||||||||||
North Texas Tollway Authority Revenue Bonds, Series 2017 | ||||||||||||
| 4.000% due 01/01/2043 | 1,500 | 1,413 | ||||||||||
| 5.000% due 01/01/2048 | 1,250 | 1,280 | ||||||||||
Tarrant County, Texas Cultural Education Facilities Finance Corp. Revenue Bonds, Series 2017 | ||||||||||||
| 6.750% due 11/15/2047 | 500 | 503 | ||||||||||
Tarrant County, Texas Cultural Education Facilities Finance Corp. Revenue Bonds, Series 2022 | ||||||||||||
| 5.000% due 11/15/2051 | 1,480 | 1,539 | ||||||||||
Texas Municipal Gas Acquisition & Supply Corp. Revenue Bonds, Series 2006 | ||||||||||||
| 5.250% due 12/15/2026 | 150 | 158 | ||||||||||
Texas Municipal Gas Acquisition & Supply Corp. Revenue Bonds, Series 2008 | ||||||||||||
| 6.250% due 12/15/2026 | 5,295 | 5,575 | ||||||||||
Texas Water Development Board Revenue Bonds, Series 2022 | ||||||||||||
| 5.000% due 10/15/2057 | 2,560 | 2,760 | ||||||||||
University of North Texas System Revenue Bonds, Series 2018 | ||||||||||||
| 4.000% due 04/15/2050 | 2,200 | 2,073 | ||||||||||
West Harris County, Texas Regional Water Authority Revenue Bonds, (BAM Insured), Series 2021 | ||||||||||||
| 4.000% due 12/15/2060 | 2,700 | 2,342 | ||||||||||
| 49,805 | ||||||||||||
| U.S. VIRGIN ISLANDS 1.0% | ||||||||||||
Matching Fund Special Purpose Securitization Corp., U.S. Virgin Islands Revenue Bonds, Series 2022 | ||||||||||||
| 5.000% due 10/01/2039 | 2,635 | 2,643 | ||||||||||
| VIRGINIA 4.0% | ||||||||||||
James City County, Virginia Economic Development Authority Revenue Bonds, Series 2013 | ||||||||||||
| 6.000% due 06/01/2043 | 577 | 583 | ||||||||||
| PRINCIPAL AMOUNT (000S) | MARKET VALUE (000S) | |||||||||||
Virginia Commonwealth Transportation Board Revenue Bonds, Series 2018 | ||||||||||||
| 4.000% due 05/15/2041 (e) | $ | 4,000 | $ | 3,994 | ||||||||
Virginia Small Business Financing Authority Revenue Bonds, Series 2019 | ||||||||||||
| 0.000% due 07/01/2061 (c) | 25,000 | 1,207 | ||||||||||
| 5.000% due 07/01/2034 | 1,500 | 1,417 | ||||||||||
Virginia Small Business Financing Authority Revenue Bonds, Series 2020 | ||||||||||||
| 4.000% due 12/01/2049 | 3,800 | 3,425 | ||||||||||
| 10,626 | ||||||||||||
| WASHINGTON 2.4% | ||||||||||||
Seattle, Washington Municipal Light & Power Revenue Bonds, Series 2018 | ||||||||||||
| 4.000% due 01/01/2046 | 4,000 | 3,801 | ||||||||||
Snohomish County, Washington Housing Authority Revenue Bonds, Series 2019 | ||||||||||||
| 4.000% due 04/01/2044 | 1,000 | 926 | ||||||||||
Washington State Convention Center Public Facilities District Revenue Bonds, Series 2018 | ||||||||||||
| 4.000% due 07/01/2058 | 1,345 | 1,110 | ||||||||||
Washington State Housing Finance Commission Revenue Bonds, Series 2018 | ||||||||||||
| 5.000% due 07/01/2038 | 825 | 678 | ||||||||||
| 6,515 | ||||||||||||
| WEST VIRGINIA 0.4% | ||||||||||||
Monongalia County, West Virginia Commission Special District Revenue Bonds, Series 2017 | ||||||||||||
| 5.500% due 06/01/2037 | 1,000 | 1,008 | ||||||||||
| WISCONSIN 5.5% | ||||||||||||
Public Finance Authority, Wisconsin Revenue Bonds, Series 2017 | ||||||||||||
| 7.000% due 01/01/2050 | 2,500 | 2,721 | ||||||||||
Public Finance Authority, Wisconsin Revenue Bonds, Series 2018 | ||||||||||||
| 6.375% due 01/01/2048 | 2,500 | 1,538 | ||||||||||
Public Finance Authority, Wisconsin Revenue Bonds, Series 2020 | ||||||||||||
| 0.000% due 01/01/2060 (c) | 7,500 | 356 | ||||||||||
| PRINCIPAL AMOUNT (000S) | MARKET VALUE (000S) | |||||||||||
Public Finance Authority, Wisconsin Revenue Bonds, Series 2021 | ||||||||||||
| 4.000% due 09/30/2051 | $ | 1,260 | $ | 984 | ||||||||
| 4.000% due 07/01/2056 | 650 | 504 | ||||||||||
Wisconsin Center District Revenue Bonds, (AGM Insured), Series 2020 | ||||||||||||
| 0.000% due 12/15/2050 (c) | 9,410 | 2,309 | ||||||||||
Wisconsin Health & Educational Facilities Authority Revenue Bonds, Series 2016 | ||||||||||||
| 4.000% due 11/15/2046 | 415 | 428 | ||||||||||
Wisconsin Health & Educational Facilities Authority Revenue Bonds, Series 2017 | ||||||||||||
| 4.000% due 08/15/2042 (e) | 2,000 | 1,952 | ||||||||||
Wisconsin Health & Educational Facilities Authority Revenue Bonds, Series 2018 | ||||||||||||
| 5.000% due 04/01/2044 | 2,000 | 2,098 | ||||||||||
Wisconsin Health & Educational Facilities Authority Revenue Bonds, Series 2022 | ||||||||||||
| 4.000% due 12/01/2051 | 2,070 | 1,835 | ||||||||||
| 14,725 | ||||||||||||
Total Municipal Bonds & Notes (Cost $497,631) | 475,481 | |||||||||||
| SHORT-TERM INSTRUMENTS 0.9% | ||||||||||||
| REPURCHASE AGREEMENTS (h) 0.9% | ||||||||||||
| 2,409 | ||||||||||||
| Total Short-Term Instruments (Cost $2,409) | 2,409 | |||||||||||
| Total Investments in Securities (Cost $500,040) | 477,890 | |||||||||||
| Total Investments 178.5% (Cost $500,040) | $ | 477,890 | ||||||||||
| Auction Rate Preferred Shares (57.8)% | (154,700 | ) | ||||||||||
| Remarketable Variable Rate MuniFund Term Preferred Shares, at liquidation value (12.8)% | (34,262 | ) | ||||||||||
| Other Assets and Liabilities, net (7.9)% | (21,214 | ) | ||||||||||
| Net Assets Applicable to Common Shareholders 100.0% | $ | 267,714 | ||||||||||
| * | A zero balance may reflect actual amounts rounding to less than one thousand. |
| ^ | Security is in default. |
| (a) | When-issued security. |
| (b) | Security is not accruing income as of the date of this report. |
| (c) | Zero coupon security. |
| (d) | Security becomes interest bearing at a future date. |
| (e) | Represents an underlying municipal bond transferred to a tender option bond trust established in a tender option bond transaction in which the Fund sold, or caused the sale of, the underlying municipal bond and purchased the residual interest certificate. The security serves as collateral in a financing transaction. See Note 5, Tender Option Bond Transactions, in the Notes to Financial Statements for more information. |
| (f) | Represents an investment in a tender option bond residual interest certificate purchased in a secondary market transaction. The interest rate shown bears an inverse relationship to the interest rate on a tender option bond floating rate certificate. The interest rate disclosed reflects the rate in effect on December 31, 2022. |
| See Accompanying Notes | ANNUAL REPORT | | | DECEMBER 31, 2022 | 49 |
| Schedule of Investments | PIMCO Municipal Income Fund III | (Cont.) |
| Issuer Description | Coupon | Maturity Date | Acquisition Date | Cost | Market Value | Market Value as Percentage of Net Assets Applicable to Common Shareholders | ||||||||||||||||||
| Federal Home Loan Mortgage Corp. Enhanced Receipt, New Jersey Revenue Bonds, Series 2019 | 3.870 | % | 11/15/2035 | 10/26/2020 | $ 3,726 | $ | 2,966 | 1.11% | ||||||||||||||||
| New York State Housing Finance Agency Revenue Bonds, (FHA Insured), Series 2020 | 4.200 | 11/01/2054 | 11/18/2021 | 1,693 | 1,339 | 0.50 | ||||||||||||||||||
| $ 5,419 | $ | 4,305 | 1.61% | |||||||||||||||||||||
| Counterparty | Lending Rate | Settlement Date | Maturity Date | Principal Amount | Collateralized By | Collateral (Received) | Repurchase Agreements, at Value | Repurchase Agreement Proceeds to be Received(1) | ||||||||||||||||||||||
| FICC | 1.900 | % | 12/30/2022 | 01/03/2023 | $ | 2,409 | U.S. Treasury Bills 0.000% due 06/29/2023 | $ | (2,457 | ) | $ | 2,409 | $ | 2,409 | ||||||||||||||||
Total Repurchase Agreements | $ | (2,457 | ) | $ | 2,409 | $ | 2,409 | |||||||||||||||||||||||
| Counterparty | Repurchase Agreement Proceeds to be Received(1) | Payable for Reverse Repurchase Agreements | Payable for Sale‑Buyback Transactions | Total Borrowings and Other Financing Transactions | Collateral Pledged/(Received) | Net Exposure(2) | ||||||||||||||||||
| Global/Master Repurchase Agreement | ||||||||||||||||||||||||
| FICC | $ | 2,409 | $ | 0 | $ | 0 | $ | 2,409 | $ | (2,457 | ) | $ | (48 | ) | ||||||||||
Total Borrowings and Other Financing Transactions | $ | 2,409 | $ | 0 | $ | 0 | ||||||||||||||||||
| (1) | Includes accrued interest. |
| (2) | Net Exposure represents the net receivable/(payable) that would be due from/to the counterparty in the event of default. Exposure from borrowings and other financing transactions can only be netted across transactions governed under the same master agreement with the same legal entity. See Note 7, Master Netting Arrangements, in the Notes to Financial Statements for more information. |
| Category and Subcategory | Level 1 | Level 2 | Level 3 | Fair Value at 12/31/2022 | ||||||||||||
Investments in Securities, at Value | ||||||||||||||||
| Municipal Bonds & Notes | ||||||||||||||||
| Alabama | $ | 0 | $ | 19,641 | $ | 0 | $ | 19,641 | ||||||||
| Alaska | 0 | 1,225 | 0 | 1,225 | ||||||||||||
| Arizona | 0 | 22,722 | 0 | 22,722 | ||||||||||||
| California | 0 | 21,594 | 0 | 21,594 | ||||||||||||
| Colorado | 0 | 11,467 | 0 | 11,467 | ||||||||||||
| Connecticut | 0 | 5,197 | 0 | 5,197 | ||||||||||||
| Delaware | 0 | 11,886 | 0 | 11,886 | ||||||||||||
| District of Columbia | 0 | 4,666 | 0 | 4,666 | ||||||||||||
| Florida | 0 | 26,848 | 0 | 26,848 | ||||||||||||
| Georgia | 0 | 15,634 | 0 | 15,634 | ||||||||||||
| Illinois | 0 | 53,179 | 0 | 53,179 | ||||||||||||
| Indiana | 0 | 5,694 | 0 | 5,694 | ||||||||||||
| Iowa | 0 | 3,777 | 0 | 3,777 | ||||||||||||
| Kansas | 0 | 1,971 | 0 | 1,971 | ||||||||||||
| Louisiana | 0 | 12,942 | 0 | 12,942 | ||||||||||||
| Maine | 0 | 1,513 | 0 | 1,513 | ||||||||||||
| Category and Subcategory | Level 1 | Level 2 | Level 3 | Fair Value at 12/31/2022 | ||||||||||||
| Maryland | $ | 0 | $ | 456 | $ | 0 | $ | 456 | ||||||||
| Massachusetts | 0 | 8,917 | 0 | 8,917 | ||||||||||||
| Michigan | 0 | 10,889 | 0 | 10,889 | ||||||||||||
| Minnesota | 0 | 1,673 | 0 | 1,673 | ||||||||||||
| Missouri | 0 | 1,675 | 0 | 1,675 | ||||||||||||
| Nevada | 0 | 5,435 | 0 | 5,435 | ||||||||||||
| New Jersey | 0 | 29,214 | 0 | 29,214 | ||||||||||||
| New York | 0 | 43,409 | 0 | 43,409 | ||||||||||||
| North Carolina | 0 | 2,373 | 0 | 2,373 | ||||||||||||
| North Dakota | 0 | 517 | 0 | 517 | ||||||||||||
| Ohio | 0 | 16,752 | 0 | 16,752 | ||||||||||||
| Oklahoma | 0 | 3,701 | 0 | 3,701 | ||||||||||||
| Oregon | 0 | 715 | 0 | 715 | ||||||||||||
| Pennsylvania | 0 | 17,253 | 0 | 17,253 | ||||||||||||
| Puerto Rico | 0 | 18,144 | 0 | 18,144 | ||||||||||||
| South Carolina | 0 | 6,783 | 0 | 6,783 | ||||||||||||
| Tennessee | 0 | 2,297 | 0 | 2,297 | ||||||||||||
| Texas | 0 | 49,805 | 0 | 49,805 | ||||||||||||
| 50 | PIMCO CLOSED-END FUNDS | See Accompanying Notes |
| December 31, 2022 |
| Category and Subcategory | Level 1 | Level 2 | Level 3 | Fair Value at 12/31/2022 | ||||||||||||
| U.S. Virgin Islands | $ | 0 | $ | 2,643 | $ | 0 | $ | 2,643 | ||||||||
| Virginia | 0 | 10,626 | 0 | 10,626 | ||||||||||||
| Washington | 0 | 6,515 | 0 | 6,515 | ||||||||||||
| West Virginia | 0 | 1,008 | 0 | 1,008 | ||||||||||||
| Wisconsin | 0 | 14,725 | 0 | 14,725 | ||||||||||||
| Category and Subcategory | Level 1 | Level 2 | Level 3 | Fair Value at 12/31/2022 | ||||||||||||
| Short-Term Instruments | ||||||||||||||||
| Repurchase Agreements | $ | 0 | $ | 2,409 | $ | 0 | $ | 2,409 | ||||||||
| Total Investments | $ | 0 | $ | 477,890 | $ | 0 | $ | 477,890 | ||||||||
| See Accompanying Notes | ANNUAL REPORT | | | DECEMBER 31, 2022 | 51 |
| Schedule of Investments | PIMCO California Municipal Income Fund |
| PRINCIPAL AMOUNT (000S) | MARKET VALUE (000S) | |||||||||||
| INVESTMENTS IN SECURITIES 178.7% | ||||||||||||
| MUNICIPAL BONDS & NOTES 176.9% | ||||||||||||
| ARIZONA 0.3% | ||||||||||||
Arizona Industrial Development Authority Revenue Bonds, Series 2020 | ||||||||||||
| 7.750% due 07/01/2050 | $ | 850 | $ | 595 | ||||||||
| CALIFORNIA 157.8% | ||||||||||||
Alameda Corridor Transportation Authority, California Revenue Bonds, Series 2022 | ||||||||||||
| 0.000% due 10/01/2049 (c) | 2,890 | 1,379 | ||||||||||
Alhambra Unified School District, California General Obligation Bonds, Series 2022 | ||||||||||||
| 5.250% due 08/01/2047 | 870 | 979 | ||||||||||
Antelope Valley Community College District, California General Obligation Bonds, Series 2022 | ||||||||||||
| 0.000% due 08/01/2047 (b) | 680 | 190 | ||||||||||
Bay Area Toll Authority, California Revenue Bonds, Series 2017 | ||||||||||||
| 5.000% due 04/01/2056 | 1,750 | 1,931 | ||||||||||
California Community Housing Agency Revenue Bonds, Series 2019 | ||||||||||||
| 5.000% due 04/01/2049 | 3,925 | 3,437 | ||||||||||
| 5.000% due 08/01/2049 | 1,000 | 906 | ||||||||||
California Community Housing Agency Revenue Bonds, Series 2021 | ||||||||||||
| 4.000% due 02/01/2056 | 1,000 | 738 | ||||||||||
California Community Housing Agency Revenue Bonds, Series 2022 | ||||||||||||
| 4.500% due 08/01/2052 | 1,000 | 822 | ||||||||||
California County Tobacco Securitization Agency Revenue Bonds, Series 2002 | ||||||||||||
| 6.000% due 06/01/2035 | 2,290 | 2,291 | ||||||||||
California County Tobacco Securitization Agency Revenue Bonds, Series 2007 | ||||||||||||
| 0.000% due 06/01/2057 (b) | 7,000 | 995 | ||||||||||
California County Tobacco Securitization Agency Revenue Bonds, Series 2020 | ||||||||||||
| 0.000% due 06/01/2055 (b) | 4,700 | 866 | ||||||||||
California Educational Facilities Authority Revenue Bonds, Series 2017 | ||||||||||||
| 5.000% due 04/01/2047 | 800 | 818 | ||||||||||
California Educational Facilities Authority Revenue Bonds, Series 2018 | ||||||||||||
| 4.000% due 10/01/2039 | 1,250 | 1,216 | ||||||||||
| 5.000% due 10/01/2048 | 1,000 | 1,039 | ||||||||||
California Enterprise Development Authority Revenue Bonds, Series 2020 | ||||||||||||
| 5.000% due 08/01/2050 | 700 | 697 | ||||||||||
California Health Facilities Financing Authority Revenue Bonds, (CM Insured), Series 2020 | ||||||||||||
| 4.000% due 11/01/2040 | 1,195 | 1,180 | ||||||||||
California Health Facilities Financing Authority Revenue Bonds, Series 2013 | ||||||||||||
| 5.000% due 08/15/2052 | 1,675 | 1,698 | ||||||||||
California Health Facilities Financing Authority Revenue Bonds, Series 2015 | ||||||||||||
| 5.000% due 08/15/2054 | 1,300 | 1,330 | ||||||||||
California Health Facilities Financing Authority Revenue Bonds, Series 2016 | ||||||||||||
| 5.000% due 11/15/2046 (d) | 5,000 | 5,250 | ||||||||||
| 5.000% due 08/15/2055 | 6,000 | 6,116 | ||||||||||
California Health Facilities Financing Authority Revenue Bonds, Series 2017 | ||||||||||||
| 4.000% due 11/01/2038 | 1,400 | 1,409 | ||||||||||
California Health Facilities Financing Authority Revenue Bonds, Series 2020 | ||||||||||||
| 4.000% due 04/01/2049 | 3,500 | 3,039 | ||||||||||
| 4.000% due 06/01/2050 | 4,000 | 3,734 | ||||||||||
California Health Facilities Financing Authority Revenue Bonds, Series 2021 | ||||||||||||
| 4.000% due 08/15/2048 | 2,500 | 2,387 | ||||||||||
| PRINCIPAL AMOUNT (000S) | MARKET VALUE (000S) | |||||||||||
California Infrastructure & Economic Development Bank Revenue Bonds, Series 2013 | ||||||||||||
| 5.000% due 02/01/2039 | $ | 10,000 | $ | 10,015 | ||||||||
California Infrastructure & Economic Development Bank Revenue Bonds, Series 2020 | ||||||||||||
| 0.000% due 01/01/2060 (b) | 5,250 | 258 | ||||||||||
| 4.000% due 11/01/2055 | 915 | 773 | ||||||||||
California Municipal Finance Authority Certificates of Participation Bonds, (AGM Insured), Series 2022 | ||||||||||||
| 5.250% due 11/01/2052 | 1,700 | 1,793 | ||||||||||
California Municipal Finance Authority Revenue Bonds, (BAM Insured), Series 2021 | ||||||||||||
| 4.000% due 05/15/2046 | 700 | 636 | ||||||||||
California Municipal Finance Authority Revenue Bonds, Series 2018 | ||||||||||||
| 5.000% due 05/15/2043 | 500 | 502 | ||||||||||
| 5.000% due 06/01/2043 | 1,370 | 1,461 | ||||||||||
| 5.000% due 06/01/2048 | 1,370 | 1,450 | ||||||||||
California Municipal Finance Authority Revenue Bonds, Series 2021 | ||||||||||||
| 4.000% due 09/01/2050 (e) | 1,200 | 959 | ||||||||||
| 4.000% due 02/01/2051 | 1,650 | 1,481 | ||||||||||
California Public Finance Authority Revenue Bonds, Series 2019 | ||||||||||||
| 6.250% due 07/01/2054 | 1,350 | 1,434 | ||||||||||
California School Finance Authority Revenue Bonds, Series 2019 | ||||||||||||
| 5.000% due 07/01/2054 | 1,000 | 1,003 | ||||||||||
California State General Obligation Bonds, (AGM Insured), Series 2007 | ||||||||||||
| 5.250% due 08/01/2032 | 3,500 | 4,202 | ||||||||||
California State General Obligation Bonds, Series 2013 | ||||||||||||
| 5.000% due 11/01/2043 | 7,000 | 7,079 | ||||||||||
California State General Obligation Bonds, Series 2017 | ||||||||||||
| 4.000% due 11/01/2047 | 2,750 | 2,668 | ||||||||||
California State General Obligation Bonds, Series 2018 | ||||||||||||
| 5.000% due 10/01/2047 | 1,275 | 1,327 | ||||||||||
California State General Obligation Bonds, Series 2021 | ||||||||||||
| 5.000% due 09/01/2041 | 1,500 | 1,663 | ||||||||||
California State General Obligation Bonds, Series 2022 | ||||||||||||
| 4.000% due 04/01/2049 | 2,250 | 2,168 | ||||||||||
California State General Obligation Notes, Series 2021 | ||||||||||||
| 5.000% due 10/01/2029 | 2,700 | 3,103 | ||||||||||
California State University Revenue Bonds, Series 2015 | ||||||||||||
| 5.000% due 11/01/2047 | 8,000 | 8,277 | ||||||||||
California Statewide Communities Development Authority Revenue Bonds, (AGM Insured), Series 2022 | ||||||||||||
| 5.375% due 08/15/2057 | 1,000 | 1,055 | ||||||||||
California Statewide Communities Development Authority Revenue Bonds, (CM Insured), Series 2018 | ||||||||||||
| 4.000% due 07/01/2040 | 1,000 | 991 | ||||||||||
| 4.000% due 07/01/2043 | 350 | 345 | ||||||||||
| 4.000% due 07/01/2047 | 1,750 | 1,693 | ||||||||||
California Statewide Communities Development Authority Revenue Bonds, (CM Insured), Series 2021 | ||||||||||||
| 4.000% due 11/01/2051 | 800 | 763 | ||||||||||
California Statewide Communities Development Authority Revenue Bonds, Series 2016 | ||||||||||||
| 4.000% due 08/15/2051 | 225 | 216 | ||||||||||
| 5.000% due 12/01/2046 | 5,700 | 5,470 | ||||||||||
California Statewide Communities Development Authority Revenue Bonds, Series 2018 | ||||||||||||
| 4.000% due 07/01/2048 | 1,000 | 959 | ||||||||||
| 4.000% due 12/01/2057 | 2,000 | 1,884 | ||||||||||
| 5.000% due 03/01/2048 | 1,700 | 1,719 | ||||||||||
| 5.500% due 12/01/2058 | 1,775 | 1,788 | ||||||||||
California Statewide Financing Authority Revenue Bonds, Series 2002 | ||||||||||||
| 6.000% due 05/01/2037 | 2,400 | 2,437 | ||||||||||
Chino Valley Unified School District, California General Obligation Bonds, Series 2022 | ||||||||||||
| 0.000% due 08/01/2036 (b) | 1,395 | 808 | ||||||||||
| 0.000% due 08/01/2042 (b) | 1,500 | 630 | ||||||||||
| PRINCIPAL AMOUNT (000S) | MARKET VALUE (000S) | |||||||||||
CMFA Special Finance Agency VII, California Revenue Bonds, Series 2021 | ||||||||||||
| 3.000% due 08/01/2056 | $ | 2,500 | $ | 1,646 | ||||||||
| 4.000% due 08/01/2047 | 600 | 449 | ||||||||||
CMFA Special Finance Agency, California Revenue Bonds, Series 2021 | ||||||||||||
| 4.000% due 08/01/2045 | 750 | 592 | ||||||||||
CSCDA Community Improvement Authority, California Revenue Bonds, Series 2021 | ||||||||||||
| 3.000% due 02/01/2057 | 500 | 333 | ||||||||||
| 3.100% due 07/01/2045 | 1,000 | 753 | ||||||||||
| 3.400% due 10/01/2046 | 450 | 334 | ||||||||||
| 4.000% due 08/01/2056 | 250 | 191 | ||||||||||
| 4.000% due 10/01/2056 | 600 | 438 | ||||||||||
CSCDA Community Improvement Authority, California Revenue Bonds, Series 2022 | ||||||||||||
| 0.000% due 09/01/2062 (c) | 2,000 | 953 | ||||||||||
Department of Veterans Affairs Veteran’s Farm & Home Purchase Program, California Revenue Bonds, Series 2022 | ||||||||||||
| 4.950% due 12/01/2046 | 340 | 357 | ||||||||||
El Monte, California Certificates of Participation Bonds, (AMBAC Insured), Series 2001 | ||||||||||||
| 5.250% due 01/01/2034 | 13,625 | 13,648 | ||||||||||
Folsom Cordova Unified School District, California General Obligation Bonds, (AGM Insured), Series 2019 | ||||||||||||
| 4.000% due 10/01/2044 | 1,315 | 1,275 | ||||||||||
Foothill-Eastern Transportation Corridor Agency, California Revenue Bonds, Series 2014 | ||||||||||||
| 3.950% due 01/15/2053 | 860 | 765 | ||||||||||
Glendale Community College District, California General Obligation Bonds, Series 2020 | ||||||||||||
| 4.000% due 08/01/2050 | 1,500 | 1,440 | ||||||||||
Golden State, California Tobacco Securitization Corp. Revenue Bonds, Series 2018 | ||||||||||||
| 5.000% due 06/01/2030 | 2,000 | 2,254 | ||||||||||
Golden State, California Tobacco Securitization Corp. Revenue Bonds, Series 2021 | ||||||||||||
| 0.000% due 06/01/2066 (b) | 20,500 | 2,388 | ||||||||||
Hacienda La Puente Unified School District, California General Obligation Bonds, Series 2017 | ||||||||||||
| 4.000% due 08/01/2047 | 2,000 | 1,942 | ||||||||||
Hartnell Community College District, California General Obligation Bonds, Series 2017 | ||||||||||||
| 4.000% due 08/01/2042 | 3,400 | 3,353 | ||||||||||
Hastings Campus Housing Finance Authority, California Revenue Bonds, Series 2020 | ||||||||||||
| 5.000% due 07/01/2061 | 2,000 | 1,548 | ||||||||||
Hayward Unified School District, California General Obligation Bonds, Series 2015 | ||||||||||||
| 5.000% due 08/01/2038 | 6,000 | 6,217 | ||||||||||
Imperial Irrigation District Electric System, California Revenue Bonds, Series 2016 | ||||||||||||
| 5.000% due 11/01/2041 (d) | 6,000 | 6,348 | ||||||||||
Long Beach Bond Finance Authority, California Revenue Bonds, Series 2007 | ||||||||||||
| 5.500% due 11/15/2027 | 1,000 | 1,067 | ||||||||||
| 5.500% due 11/15/2030 | 415 | 454 | ||||||||||
Long Beach Community College District, California General Obligation Bonds, Series 2019 | ||||||||||||
| 4.000% due 08/01/2045 | 500 | 488 | ||||||||||
Los Angeles County, California Metropolitan Transportation Authority Revenue Bonds, Series 2019 | ||||||||||||
| 5.000% due 07/01/2044 | 2,500 | 2,680 | ||||||||||
Los Angeles County, California Metropolitan Transportation Authority Sales Tax Revenue Bonds, Series 2021 | ||||||||||||
| 4.000% due 06/01/2037 | 1,750 | 1,817 | ||||||||||
Los Angeles County, California Sanitation Districts Financing Authority Revenue Bonds, Series 2016 | ||||||||||||
| 4.000% due 10/01/2042 | 1,500 | 1,481 | ||||||||||
Los Angeles Department of Airports, California Revenue Bonds, Series 2021 | ||||||||||||
| 5.000% due 05/15/2048 | 2,500 | 2,707 | ||||||||||
| 52 | PIMCO CLOSED-END FUNDS | See Accompanying Notes |
| December 31, 2022 |
| PRINCIPAL AMOUNT (000S) | MARKET VALUE (000S) | |||||||||||
Los Angeles Department of Water & Power System, California Revenue Bonds, Series 2019 | ||||||||||||
| 5.000% due 07/01/2049 | $ | 1,000 | $ | 1,065 | ||||||||
Los Angeles Department of Water & Power Water System, California Revenue Bonds, Series 2022 | ||||||||||||
| 5.000% due 07/01/2052 | 1,335 | 1,446 | ||||||||||
Los Angeles Department of Water & Power, California Revenue Bonds, Series 2001 | ||||||||||||
| 3.000% due 07/01/2034 | 500 | 500 | ||||||||||
Los Angeles Department of Water & Power, California Revenue Bonds, Series 2014 | ||||||||||||
| 5.000% due 07/01/2043 | 2,000 | 2,030 | ||||||||||
Los Angeles Department of Water & Power, California Revenue Bonds, Series 2021 | ||||||||||||
| 5.000% due 07/01/2041 | 1,500 | 1,651 | ||||||||||
M‑S‑R Energy Authority, California Revenue Bonds, Series 2009 | ||||||||||||
| 6.500% due 11/01/2039 | 15,345 | 18,379 | ||||||||||
Metropolitan Water District of Southern California Revenue Bonds, Series 2020 | ||||||||||||
| 5.000% due 10/01/2049 | 2,000 | 2,170 | ||||||||||
Monterey Peninsula Unified School District, California General Obligation Bonds, Series 2019 | ||||||||||||
| 4.000% due 08/01/2040 | 3,000 | 2,973 | ||||||||||
Mount San Antonio Community College District, California General Obligation Bonds, Series 2019 | ||||||||||||
| 5.000% due 08/01/2044 | 1,700 | 1,835 | ||||||||||
Mount San Jacinto Community College District, California General Obligation Bonds, Series 2018 | ||||||||||||
| 4.000% due 08/01/2043 | 2,650 | 2,610 | ||||||||||
Municipal Improvement Corp. of Los Angeles, California Revenue Bonds, Series 2021 | ||||||||||||
| 5.000% due 11/01/2038 | 2,000 | 2,239 | ||||||||||
New Haven Unified School District, California General Obligation Bonds, Series 2008 | ||||||||||||
| 0.000% due 08/01/2030 (b) | 1,875 | 1,457 | ||||||||||
Newport Mesa Unified School District, California General Obligation Bonds, (NPFGC Insured), Series 2007 | ||||||||||||
| 0.000% due 08/01/2031 (b) | 1,750 | 1,323 | ||||||||||
Northern California Energy Authority Revenue Bonds, Series 2018 | ||||||||||||
| 4.000% due 07/01/2049 | 2,300 | 2,298 | ||||||||||
Oceanside Unified School District, California General Obligation Bonds, Series 2022 | ||||||||||||
| 4.000% due 08/01/2041 | 1,020 | 1,008 | ||||||||||
Orange County, California Community Facilities District Special Tax Bonds, Series 2022 | ||||||||||||
| 5.000% due 08/15/2052 | 1,275 | 1,284 | ||||||||||
Orange County, California Local Transportation Authority Revenue Bonds, Series 2019 | ||||||||||||
| 5.000% due 02/15/2041 | 1,000 | 1,083 | ||||||||||
Pacifica School District, California General Obligation Bonds, Series 2018 | ||||||||||||
| 4.000% due 08/01/2048 | 1,750 | 1,693 | ||||||||||
Regents of the University of California Medical Center Pooled Revenue Bonds, Series 2013 | ||||||||||||
| 5.000% due 05/15/2043 | 2,000 | 2,004 | ||||||||||
Rio Hondo Community College District, California General Obligation Bonds, Series 2022 | ||||||||||||
| 0.000% due 08/01/2045 (b) | 1,650 | 552 | ||||||||||
River Islands Public Financing Authority, California Special Tax, Series 2022 | ||||||||||||
| 4.250% due 09/01/2047 | 1,000 | 953 | ||||||||||
Riverside County, California Transportation Commission Revenue Bonds, Series 2021 | ||||||||||||
| 4.000% due 06/01/2038 | 1,125 | 1,102 | ||||||||||
Riverside, California Sewer Revenue Bonds, Series 2018 | ||||||||||||
| 4.000% due 08/01/2038 | 4,250 | 4,276 | ||||||||||
Riverside, California Water Revenue Bonds, Series 2019 | ||||||||||||
| 5.000% due 10/01/2048 | 3,250 | 3,474 | ||||||||||
Sacramento Area Flood Control Agency, California Special Assessment Bonds, Series 2016 | ||||||||||||
| 5.000% due 10/01/2041 (d) | 2,800 | 2,949 | ||||||||||
| 5.000% due 10/01/2047 (d) | 1,700 | 1,777 | ||||||||||
| PRINCIPAL AMOUNT (000S) | MARKET VALUE (000S) | |||||||||||
Sacramento County, California Sanitation Districts Financing Authority Revenue Bonds, Series 2020 | ||||||||||||
| 5.000% due 12/01/2050 | $ | 1,000 | $ | 1,076 | ||||||||
Sacramento County, California Special Tax Bonds, Series 2022 | ||||||||||||
| 5.000% due 09/01/2047 | 450 | 439 | ||||||||||
Sacramento Transportation Authority Sales Tax, California Revenue Bonds, Series 2009 | ||||||||||||
| 2.700% due 10/01/2038 | 1,900 | 1,900 | ||||||||||
Sacramento, California Special Tax Bonds, Series 2021 | ||||||||||||
| 4.000% due 09/01/2050 | 1,500 | 1,209 | ||||||||||
San Diego County, California Regional Airport Authority Revenue Bonds, Series 2021 | ||||||||||||
| 4.000% due 07/01/2051 | 750 | 687 | ||||||||||
| 5.000% due 07/01/2051 | 2,215 | 2,241 | ||||||||||
San Diego Public Facilities Financing Authority, California Revenue Bonds, Series 2020 | ||||||||||||
| 4.000% due 08/01/2045 | 2,750 | 2,670 | ||||||||||
San Diego Public Facilities Financing Authority, California Revenue Bonds, Series 2022 | ||||||||||||
| 5.000% due 05/15/2047 | 1,000 | 1,104 | ||||||||||
San Francisco Bay Area Rapid Transit District, California General Obligation Bonds, Series 2019 | ||||||||||||
| 4.000% due 08/01/2044 | 2,560 | 2,532 | ||||||||||
San Francisco, California City & County Airport Comm‑San Francisco International Airport Revenue Bonds, Series 2017 | ||||||||||||
| 5.000% due 05/01/2047 | 2,625 | 2,725 | ||||||||||
San Francisco, California City & County Airport Comm‑San Francisco International Airport Revenue Bonds, Series 2019 | ||||||||||||
| 5.000% due 05/01/2039 | 2,000 | 2,156 | ||||||||||
| 5.000% due 05/01/2049 | 2,000 | 2,111 | ||||||||||
| 5.000% due 05/01/2050 | 1,900 | 2,004 | ||||||||||
San Francisco, California City & County Certificates of Participation Bonds, Series 2015 | ||||||||||||
| 4.000% due 09/01/2033 | 2,000 | 2,016 | ||||||||||
San Francisco, California City & County General Obligation Bonds, Series 2022 | ||||||||||||
| 5.000% due 06/15/2042 | 2,750 | 3,024 | ||||||||||
San Francisco, California Public Utilities Commission Water Revenue Bonds, Series 2020 | ||||||||||||
| 5.000% due 11/01/2050 | 1,100 | 1,179 | ||||||||||
San Jose Evergreen Community College District, California General Obligation Bonds, Series 2014 | ||||||||||||
| 4.125% due 09/01/2043 | 1,000 | 1,023 | ||||||||||
San Jose Financing Authority, California Revenue Bonds, Series 2022 | ||||||||||||
| 5.000% due 11/01/2052 | 1,700 | 1,880 | ||||||||||
San Jose Unified School District, California General Obligation Bonds, Series 2019 | ||||||||||||
| 4.000% due 08/01/2042 | 1,000 | 996 | ||||||||||
San Mateo County, California Community College District General Obligation Bonds, (NPFGC Insured), Series 2006 | ||||||||||||
| 0.000% due 09/01/2034 (b) | 3,000 | 1,998 | ||||||||||
San Mateo County, California Community College District General Obligation Bonds, Series 2018 | ||||||||||||
| 5.000% due 09/01/2045 | 4,000 | 4,316 | ||||||||||
San Mateo Foster City Public Financing Authority, California Revenue Bonds, Series 2019 | ||||||||||||
| 4.000% due 08/01/2044 | 1,540 | 1,510 | ||||||||||
Santa Monica, California Community College District General Obligation Bonds, Series 2022 | ||||||||||||
| 4.000% due 08/01/2045 | 1,190 | 1,162 | ||||||||||
Silicon Valley Tobacco Securitization Authority, California Revenue Bonds, Series 2007 | ||||||||||||
| 0.000% due 06/01/2036 (b) | 1,000 | 475 | ||||||||||
Southwestern Community College District, California Revenue Bonds, Series 2021 | ||||||||||||
| 4.000% due 08/01/2046 | 4,300 | 4,196 | ||||||||||
State Center Community College District, California General Obligation Bonds, Series 2022 | ||||||||||||
| 5.000% due 08/01/2047 | 1,690 | 1,865 | ||||||||||
| PRINCIPAL AMOUNT (000S) | MARKET VALUE (000S) | |||||||||||
Tobacco Securitization Authority of Northern California Revenue Bonds, Series 2021 | ||||||||||||
| 0.000% due 06/01/2060 (b) | $ | 15,900 | $ | 2,479 | ||||||||
Tobacco Securitization Authority of Southern California Revenue Bonds, Series 2006 | ||||||||||||
| 0.000% due 06/01/2046 (b) | 4,000 | 592 | ||||||||||
University of California Revenue Bonds, Series 2013 | ||||||||||||
| 5.000% due 05/15/2048 | 2,250 | 2,267 | ||||||||||
University of California Revenue Bonds, Series 2017 | ||||||||||||
| 5.000% due 05/15/2047 | 5,000 | 5,250 | ||||||||||
University of California Revenue Bonds, Series 2019 | ||||||||||||
| 5.000% due 05/15/2049 | 2,500 | 2,670 | ||||||||||
Upland, California Certificates of Participation Bonds, Series 2017 | ||||||||||||
| 4.000% due 01/01/2042 | 3,250 | 2,940 | ||||||||||
Washington Township Health Care District, California General Obligation Bonds, Series 2015 | ||||||||||||
| 4.000% due 08/01/2045 | 2,500 | 2,325 | ||||||||||
West Valley-Mission Community College District, California General Obligation Bonds, Series 2022 | ||||||||||||
| 4.000% due 08/01/2047 | 2,000 | 1,941 | ||||||||||
| 308,464 | ||||||||||||
| DELAWARE 1.4% | ||||||||||||
Affordable Housing Opportunities Trust, Delaware Revenue Bonds, Series 2022 | ||||||||||||
| 3.167% due 10/01/2038 | 2,730 | 2,330 | ||||||||||
| 7.120% due 10/01/2038 | 480 | 460 | ||||||||||
| 2,790 | ||||||||||||
| ILLINOIS 5.7% | ||||||||||||
Chicago, Illinois General Obligation Bonds, Series 2007 | ||||||||||||
| 5.500% due 01/01/2042 | 2,000 | 2,022 | ||||||||||
Chicago, Illinois General Obligation Bonds, Series 2015 | ||||||||||||
| 5.250% due 01/01/2028 | 2,000 | 2,044 | ||||||||||
Chicago, Illinois General Obligation Bonds, Series 2017 | ||||||||||||
| 6.000% due 01/01/2038 | 2,500 | 2,639 | ||||||||||
Illinois State General Obligation Bonds, Series 2012 | ||||||||||||
| 5.000% due 08/01/2023 | 1,500 | 1,511 | ||||||||||
Illinois State General Obligation Bonds, Series 2020 | ||||||||||||
| 4.125% due 10/01/2036 | 2,000 | 1,844 | ||||||||||
Illinois State General Obligation Notes, Series 2017 | ||||||||||||
| 5.000% due 11/01/2027 | 1,000 | 1,034 | ||||||||||
| 11,094 | ||||||||||||
| INDIANA 0.9% | ||||||||||||
Indiana Finance Authority Revenue Bonds, Series 2022 | ||||||||||||
| 4.500% due 12/15/2046 | 1,790 | 1,789 | ||||||||||
| NORTH DAKOTA 0.2% | ||||||||||||
Grand Forks County, North Dakota Revenue Bonds, Series 2021 | ||||||||||||
| 7.000% due 12/15/2043 ^(a) | 650 | 357 | ||||||||||
| PENNSYLVANIA 0.7% | ||||||||||||
Pennsylvania Economic Development Financing Authority Revenue Bonds, Series 2021 | ||||||||||||
| 9.000% due 04/01/2051 | 1,170 | 1,328 | ||||||||||
| PUERTO RICO 7.8% | ||||||||||||
Children’s Trust Fund, Puerto Rico Revenue Bonds, Series 2008 | ||||||||||||
| 0.000% due 05/15/2057 (b) | 20,400 | 1,270 | ||||||||||
Commonwealth of Puerto Rico Bonds, Series 2022 | ||||||||||||
| 0.000% due 11/01/2043 (b) | 2,975 | 1,305 | ||||||||||
| 0.000% due 11/01/2051 (b) | 2,683 | 1,057 | ||||||||||
Commonwealth of Puerto Rico General Obligation Bonds, Series 2021 | ||||||||||||
| 4.000% due 07/01/2041 | 1,200 | 943 | ||||||||||
| See Accompanying Notes | ANNUAL REPORT | | | DECEMBER 31, 2022 | 53 |
| Schedule of Investments | PIMCO California Municipal Income Fund | (Cont.) |
| PRINCIPAL AMOUNT (000S) | MARKET VALUE (000S) | |||||||||||
Commonwealth of Puerto Rico General Obligation Notes, Series 2021 | ||||||||||||
| 0.000% due 07/01/2024 (b) | $ | 106 | $ | 98 | ||||||||
| 5.625% due 07/01/2027 | 684 | 698 | ||||||||||
Puerto Rico Highway & Transportation Authority Revenue Bonds, Series 2022 | ||||||||||||
| 0.000% due 07/01/2032 (b) | 153 | 91 | ||||||||||
| 0.000% due 07/01/2053 (c) | 1,106 | 614 | ||||||||||
| 5.000% due 07/01/2062 | 235 | 217 | ||||||||||
Puerto Rico Sales Tax Financing Corp. Sales Tax Revenue Bonds, Series 2018 | ||||||||||||
| 0.000% due 07/01/2051 (b) | 25,500 | 4,622 | ||||||||||
Puerto Rico Sales Tax Financing Corp. Sales Tax Revenue Bonds, Series 2019 | ||||||||||||
| 4.784% due 07/01/2058 | 4,951 | 4,308 | ||||||||||
| 15,223 | ||||||||||||
| TEXAS 0.5% | ||||||||||||
Angelina & Neches River Authority, Texas Revenue Bonds, Series 2021 | ||||||||||||
| 7.500% due 12/01/2045 | 460 | 302 | ||||||||||
| PRINCIPAL AMOUNT (000S) | MARKET VALUE (000S) | |||||||||||
| 12.000% due 12/01/2045 | $ | 800 | $ | 692 | ||||||||
| 994 | ||||||||||||
| U.S. VIRGIN ISLANDS 0.9% | ||||||||||||
Matching Fund Special Purpose Securitization Corp., U.S. Virgin Islands Revenue Bonds, Series 2022 | ||||||||||||
| 5.000% due 10/01/2039 | 1,860 | 1,865 | ||||||||||
| VIRGINIA 0.7% | ||||||||||||
Virginia Small Business Financing Authority Revenue Bonds, Series 2019 | ||||||||||||
| 0.000% due 07/01/2061 (b) | 17,000 | 821 | ||||||||||
| 5.500% due 07/01/2044 | 500 | 468 | ||||||||||
| 1,289 | ||||||||||||
| Total Municipal Bonds & Notes (Cost $356,419) | 345,788 | |||||||||||
| MARKET VALUE (000S) | ||||||||||||
| SHORT-TERM INSTRUMENTS 1.8% | ||||||||||||
| REPURCHASE AGREEMENTS (f) 1.8% | ||||||||||||
| $ | 3,434 | |||||||||||
| Total Short-Term Instruments (Cost $3,434) | 3,434 | |||||||||||
| Total Investments in Securities (Cost $359,853) | 349,222 | |||||||||||
| Total Investments 178.7% (Cost $359,853) | $ | 349,222 | ||||||||||
| Auction Rate Preferred Shares (61.7)% | (120,625 | ) | ||||||||||
| Remarketable Variable Rate MuniFund Term Preferred Shares, at liquidation value (12.5)% | (24,365 | ) | ||||||||||
| Other Assets and Liabilities, net (4.5)% | (8,770 | ) | ||||||||||
| Net Assets Applicable to Common Shareholders 100.0% | $ | 195,462 | ||||||||||
| * | A zero balance may reflect actual amounts rounding to less than one thousand. |
| ^ | Security is in default. |
| (a) | Security is not accruing income as of the date of this report. |
| (b) | Zero coupon security. |
| (c) | Security becomes interest bearing at a future date. |
| (d) | Represents an underlying municipal bond transferred to a tender option bond trust established in a tender option bond transaction in which the Fund sold, or caused the sale of, the underlying municipal bond and purchased the residual interest certificate. The security serves as collateral in a financing transaction. See Note 5, Tender Option Bond Transactions, in the Notes to Financial Statements for more information. |
| Issuer Description | Coupon | Maturity Date | Acquisition Date | Cost | Market Value | Market Value as Percentage of Net Assets Applicable to Common Shareholders | ||||||||||||||||||
| California Municipal Finance Authority Revenue Bonds, Series 2021 | 4.000% | 09/01/2050 | 08/03/2022 | $ | 1,086 | $ | 959 | 0.49% | ||||||||||||||||
| Counterparty | Lending Rate | Settlement Date | Maturity Date | Principal Amount | Collateralized By | Collateral (Received) | Repurchase Agreements, at Value | Repurchase Agreement Proceeds to be Received(1) | ||||||||||||||||||||||
| FICC | 1.900 | % | 12/30/2022 | 01/03/2023 | $ | 3,434 | U.S. Treasury Bills 0.000% due 06/29/2023 | $ | (3,503 | ) | $ | 3,434 | $ | 3,434 | ||||||||||||||||
Total Repurchase Agreements | $ | (3,503 | ) | $ | 3,434 | $ | 3,434 | |||||||||||||||||||||||
| 54 | PIMCO CLOSED-END FUNDS | See Accompanying Notes |
| December 31, 2022 |
| Counterparty | Repurchase Agreement Proceeds to be Received(1) | Payable for Reverse Repurchase Agreements | Payable for Sale‑Buyback Transactions | Total Borrowings and Other Financing Transactions | Collateral Pledged/(Received) | Net Exposure(2) | ||||||||||||||||||
| Global/Master Repurchase Agreement | ||||||||||||||||||||||||
| FICC | $ | 3,434 | $ | 0 | $ | 0 | $ | 3,434 | $ | (3,503 | ) | $ | (69 | ) | ||||||||||
Total Borrowings and Other Financing Transactions | $ | 3,434 | $ | 0 | $ | 0 | ||||||||||||||||||
| (1) | Includes accrued interest. |
| (2) | Net Exposure represents the net receivable/(payable) that would be due from/to the counterparty in the event of default. Exposure from borrowings and other financing transactions can only be netted across transactions governed under the same master agreement with the same legal entity. See Note 7, Master Netting Arrangements, in the Notes to Financial Statements for more information. |
| Category and Subcategory | Level 1 | Level 2 | Level 3 | Fair Value at 12/31/2022 | ||||||||||||
Investments in Securities, at Value | ||||||||||||||||
| Municipal Bonds & Notes | ||||||||||||||||
| Arizona | $ | 0 | $ | 595 | $ | 0 | $ | 595 | ||||||||
| California | 0 | 308,464 | 0 | 308,464 | ||||||||||||
| Delaware | 0 | 2,790 | 0 | 2,790 | ||||||||||||
| Illinois | 0 | 11,094 | 0 | 11,094 | ||||||||||||
| Indiana | 0 | 1,789 | 0 | 1,789 | ||||||||||||
| North Dakota | 0 | 357 | 0 | 357 | ||||||||||||
| Pennsylvania | 0 | 1,328 | 0 | 1,328 | ||||||||||||
| Category and Subcategory | Level 1 | Level 2 | Level 3 | Fair Value at 12/31/2022 | ||||||||||||
| Puerto Rico | $ | 0 | $ | 15,223 | $ | 0 | $ | 15,223 | ||||||||
| Texas | 0 | 994 | 0 | 994 | ||||||||||||
| U.S. Virgin Islands | 0 | 1,865 | 0 | 1,865 | ||||||||||||
| Virginia | 0 | 1,289 | 0 | 1,289 | ||||||||||||
| Short-Term Instruments | ||||||||||||||||
| Repurchase Agreements | 0 | 3,434 | 0 | 3,434 | ||||||||||||
| Total Investments | $ | 0 | $ | 349,222 | $ | 0 | $ | 349,222 | ||||||||
| See Accompanying Notes | ANNUAL REPORT | | | DECEMBER 31, 2022 | 55 |
| Schedule of Investments | PIMCO California Municipal Income Fund II |
| PRINCIPAL AMOUNT (000S) | MARKET VALUE (000S) | |||||||||||
| INVESTMENTS IN SECURITIES 177.9% | ||||||||||||
| MUNICIPAL BONDS & NOTES 177.3% | ||||||||||||
| ARIZONA 0.3% | ||||||||||||
Arizona Industrial Development Authority Revenue Bonds, Series 2020 | ||||||||||||
| 7.750% due 07/01/2050 | $ | 940 | $ | 658 | ||||||||
| CALIFORNIA 159.4% | ||||||||||||
Alameda Corridor Transportation Authority, California Revenue Bonds, Series 2022 | ||||||||||||
| 0.000% due 10/01/2049 (c) | 3,085 | 1,473 | ||||||||||
Antelope Valley Community College District, California General Obligation Bonds, Series 2022 | ||||||||||||
| 0.000% due 08/01/2047 (b) | 720 | 201 | ||||||||||
Bay Area Toll Authority, California Revenue Bonds, Series 2014 | ||||||||||||
| 5.000% due 10/01/2054 | 3,000 | 3,119 | ||||||||||
Bay Area Toll Authority, California Revenue Bonds, Series 2017 | ||||||||||||
| 4.000% due 04/01/2047 | 3,000 | 2,922 | ||||||||||
| 5.000% due 04/01/2056 | 2,000 | 2,207 | ||||||||||
California Community Housing Agency Revenue Bonds, Series 2019 | ||||||||||||
| 5.000% due 04/01/2049 | 4,400 | 3,853 | ||||||||||
| 5.000% due 08/01/2049 | 1,000 | 906 | ||||||||||
California Community Housing Agency Revenue Bonds, Series 2021 | ||||||||||||
| 4.000% due 02/01/2056 | 1,000 | 738 | ||||||||||
California Community Housing Agency Revenue Bonds, Series 2022 | ||||||||||||
| 4.500% due 08/01/2052 | 1,000 | 822 | ||||||||||
California County Tobacco Securitization Agency Revenue Bonds, Series 2002 | ||||||||||||
| 5.875% due 06/01/2043 | 1,120 | 1,120 | ||||||||||
| 6.125% due 06/01/2038 | 1,000 | 1,001 | ||||||||||
California County Tobacco Securitization Agency Revenue Bonds, Series 2007 | ||||||||||||
| 0.000% due 06/01/2057 (b) | 9,000 | 1,280 | ||||||||||
California County Tobacco Securitization Agency Revenue Bonds, Series 2020 | ||||||||||||
| 0.000% due 06/01/2055 (b) | 5,100 | 940 | ||||||||||
California Educational Facilities Authority Revenue Bonds, Series 2017 | ||||||||||||
| 5.000% due 04/01/2047 | 835 | 854 | ||||||||||
California Educational Facilities Authority Revenue Bonds, Series 2018 | ||||||||||||
| 5.000% due 10/01/2043 | 1,300 | 1,363 | ||||||||||
| 5.000% due 10/01/2048 | 1,320 | 1,371 | ||||||||||
California Enterprise Development Authority Revenue Bonds, Series 2020 | ||||||||||||
| 5.000% due 08/01/2050 | 750 | 746 | ||||||||||
California Health Facilities Financing Authority Revenue Bonds, (CM Insured), Series 2020 | ||||||||||||
| 4.000% due 11/01/2040 | 1,285 | 1,269 | ||||||||||
California Health Facilities Financing Authority Revenue Bonds, Series 2015 | ||||||||||||
| 5.000% due 08/15/2054 | 5,000 | 5,113 | ||||||||||
California Health Facilities Financing Authority Revenue Bonds, Series 2016 | ||||||||||||
| 4.000% due 10/01/2047 | 1,500 | 1,464 | ||||||||||
| 5.000% due 11/15/2046 | 1,000 | 1,050 | ||||||||||
| 5.000% due 08/15/2055 | 6,275 | 6,396 | ||||||||||
California Health Facilities Financing Authority Revenue Bonds, Series 2017 | ||||||||||||
| 4.000% due 11/01/2038 | 1,500 | 1,510 | ||||||||||
California Health Facilities Financing Authority Revenue Bonds, Series 2020 | ||||||||||||
| 4.000% due 06/01/2050 | 4,250 | 3,967 | ||||||||||
California Health Facilities Financing Authority Revenue Bonds, Series 2021 | ||||||||||||
| 4.000% due 08/15/2048 | 1,200 | 1,146 | ||||||||||
| PRINCIPAL AMOUNT (000S) | MARKET VALUE (000S) | |||||||||||
California Infrastructure & Economic Development Bank Revenue Bonds, Series 2013 | ||||||||||||
| 5.000% due 02/01/2039 | $ | 10,000 | $ | 10,015 | ||||||||
California Infrastructure & Economic Development Bank Revenue Bonds, Series 2020 | ||||||||||||
| 0.000% due 01/01/2060 (b) | 6,250 | 308 | ||||||||||
| 4.000% due 11/01/2045 | 850 | 760 | ||||||||||
California Municipal Finance Authority Certificates of Participation Bonds, (AGM Insured), Series 2022 | ||||||||||||
| 5.250% due 11/01/2052 | 1,800 | 1,898 | ||||||||||
California Municipal Finance Authority Revenue Bonds, Series 2017 | ||||||||||||
| 5.000% due 01/01/2042 | 1,750 | 1,763 | ||||||||||
California Municipal Finance Authority Revenue Bonds, Series 2018 | ||||||||||||
| 5.000% due 05/15/2043 | 1,000 | 1,004 | ||||||||||
| 5.000% due 06/01/2043 | 1,465 | 1,562 | ||||||||||
California Municipal Finance Authority Revenue Bonds, Series 2021 | ||||||||||||
| 4.000% due 11/01/2036 | 840 | 754 | ||||||||||
| 4.000% due 09/01/2050 (e) | 1,500 | 1,198 | ||||||||||
| 4.000% due 02/01/2051 | 850 | 763 | ||||||||||
California Public Finance Authority Revenue Bonds, Series 2019 | ||||||||||||
| 6.250% due 07/01/2054 | 1,650 | 1,753 | ||||||||||
California State General Obligation Bonds, Series 2013 | ||||||||||||
| 5.000% due 11/01/2043 | 7,000 | 7,079 | ||||||||||
California State General Obligation Bonds, Series 2017 | ||||||||||||
| 4.000% due 11/01/2047 | 3,250 | 3,153 | ||||||||||
California State General Obligation Bonds, Series 2018 | ||||||||||||
| 4.000% due 10/01/2039 | 4,500 | 4,512 | ||||||||||
| 5.000% due 10/01/2047 | 2,000 | 2,082 | ||||||||||
California State General Obligation Bonds, Series 2020 | ||||||||||||
| 4.000% due 03/01/2040 | 3,350 | 3,344 | ||||||||||
| 4.000% due 11/01/2040 | 1,500 | 1,498 | ||||||||||
| 4.000% due 03/01/2046 | 1,000 | 975 | ||||||||||
California State General Obligation Notes, Series 2020 | ||||||||||||
| 5.000% due 11/01/2028 | 2,105 | 2,381 | ||||||||||
California State General Obligation Notes, Series 2021 | ||||||||||||
| 5.000% due 10/01/2029 | 3,000 | 3,448 | ||||||||||
California State Public Works Board Revenue Bonds, Series 2013 | ||||||||||||
| 5.000% due 03/01/2038 | 2,500 | 2,507 | ||||||||||
California State University Revenue Bonds, Series 2015 | ||||||||||||
| 5.000% due 11/01/2047 | 5,000 | 5,173 | ||||||||||
California Statewide Communities Development Authority Revenue Bonds, (AGM Insured), Series 2022 | ||||||||||||
| 5.375% due 08/15/2057 | 1,100 | 1,160 | ||||||||||
California Statewide Communities Development Authority Revenue Bonds, (CM Insured), Series 2018 | ||||||||||||
| 4.000% due 07/01/2043 | 1,350 | 1,330 | ||||||||||
California Statewide Communities Development Authority Revenue Bonds, (CM Insured), Series 2021 | ||||||||||||
| 4.000% due 11/01/2051 | 900 | 859 | ||||||||||
California Statewide Communities Development Authority Revenue Bonds, Series 2016 | ||||||||||||
| 4.000% due 08/15/2051 | 225 | 215 | ||||||||||
| 5.000% due 06/01/2046 | 2,000 | 1,832 | ||||||||||
| 5.000% due 12/01/2046 | 2,000 | 1,919 | ||||||||||
| 5.250% due 12/01/2056 | 3,550 | 3,520 | ||||||||||
California Statewide Communities Development Authority Revenue Bonds, Series 2018 | ||||||||||||
| 4.000% due 07/01/2048 | 1,000 | 959 | ||||||||||
| 4.000% due 12/01/2053 | 230 | 219 | ||||||||||
| 4.000% due 12/01/2057 | 2,000 | 1,884 | ||||||||||
| 5.000% due 03/01/2048 | 2,800 | 2,831 | ||||||||||
| 5.500% due 12/01/2058 | 2,200 | 2,216 | ||||||||||
California Statewide Financing Authority Revenue Bonds, Series 2002 | ||||||||||||
| 6.000% due 05/01/2037 | 1,600 | 1,625 | ||||||||||
Chino Valley Unified School District, California General Obligation Bonds, Series 2022 | ||||||||||||
| 0.000% due 08/01/2037 (b) | 1,000 | 548 | ||||||||||
| 0.000% due 08/01/2040 (b) | 1,400 | 653 | ||||||||||
| PRINCIPAL AMOUNT (000S) | MARKET VALUE (000S) | |||||||||||
| 0.000% due 08/01/2043 (b) | $ | 1,750 | $ | 698 | ||||||||
| 0.000% due 08/01/2044 (b) | 1,405 | 531 | ||||||||||
City of California, Eureka City Schools, General Obligation Bonds, (BAM Insured), Series 2020 | ||||||||||||
| 4.000% due 08/01/2049 | 3,000 | 2,879 | ||||||||||
CMFA Special Finance Agency VII, California Revenue Bonds, Series 2021 | ||||||||||||
| 3.000% due 08/01/2056 | 1,000 | 658 | ||||||||||
| 4.000% due 08/01/2047 | 600 | 449 | ||||||||||
CMFA Special Finance Agency, California Revenue Bonds, Series 2021 | ||||||||||||
| 4.000% due 08/01/2045 | 750 | 592 | ||||||||||
CSCDA Community Improvement Authority, California Revenue Bonds, Series 2021 | ||||||||||||
| 3.000% due 02/01/2057 | 500 | 333 | ||||||||||
| 3.100% due 07/01/2045 | 1,000 | 752 | ||||||||||
| 3.400% due 10/01/2046 | 450 | 334 | ||||||||||
| 4.000% due 08/01/2056 | 250 | 191 | ||||||||||
| 4.000% due 10/01/2056 | 550 | 402 | ||||||||||
CSCDA Community Improvement Authority, California Revenue Bonds, Series 2022 | ||||||||||||
| 0.000% due 09/01/2062 (c) | 2,200 | 1,048 | ||||||||||
Department of Veterans Affairs Veteran’s Farm & Home Purchase Program, California Revenue Bonds, Series 2022 | ||||||||||||
| 4.950% due 12/01/2046 | 360 | 377 | ||||||||||
Folsom Cordova Unified School District, California General Obligation Bonds, (AGM Insured), Series 2019 | ||||||||||||
| 4.000% due 10/01/2044 | 1,415 | 1,372 | ||||||||||
Foothill-Eastern Transportation Corridor Agency, California Revenue Bonds, Series 2014 | ||||||||||||
| 3.950% due 01/15/2053 | 920 | 818 | ||||||||||
Fremont Community Facilities District No. 1, California Special Tax Bonds, Series 2015 | ||||||||||||
| 5.000% due 09/01/2045 | 1,400 | 1,414 | ||||||||||
Golden State, California Tobacco Securitization Corp. Revenue Bonds, Series 2018 | ||||||||||||
| 5.000% due 06/01/2030 | 1,500 | 1,691 | ||||||||||
| 5.000% due 06/01/2034 | 4,500 | 5,072 | ||||||||||
Golden State, California Tobacco Securitization Corp. Revenue Bonds, Series 2021 | ||||||||||||
| 0.000% due 06/01/2066 (b) | 20,000 | 2,330 | ||||||||||
Hacienda La Puente Unified School District, California General Obligation Bonds, Series 2017 | ||||||||||||
| 4.000% due 08/01/2047 | 3,000 | 2,914 | ||||||||||
Hartnell Community College District, California General Obligation Bonds, Series 2017 | ||||||||||||
| 4.000% due 08/01/2042 | 3,500 | 3,452 | ||||||||||
Hastings Campus Housing Finance Authority, California Revenue Bonds, Series 2020 | ||||||||||||
| 5.000% due 07/01/2061 | 2,650 | 2,051 | ||||||||||
Hayward Unified School District, California General Obligation Bonds, Series 2015 | ||||||||||||
| 5.000% due 08/01/2038 | 3,000 | 3,108 | ||||||||||
Long Beach Bond Finance Authority, California Revenue Bonds, Series 2007 | ||||||||||||
| 5.500% due 11/15/2030 | 460 | 503 | ||||||||||
| 5.500% due 11/15/2037 | 7,500 | 8,186 | ||||||||||
Long Beach Community College District, California General Obligation Bonds, Series 2019 | ||||||||||||
| 4.000% due 08/01/2045 | 550 | 537 | ||||||||||
Los Angeles County, California Facilities, Inc., Revenue Bonds, Series 2018 | ||||||||||||
| 4.000% due 12/01/2048 | 2,500 | 2,394 | ||||||||||
Los Angeles County, California Metropolitan Transportation Authority Sales Tax Revenue Bonds, Series 2021 | ||||||||||||
| 4.000% due 06/01/2037 | 2,000 | 2,076 | ||||||||||
Los Angeles County, California Sanitation Districts Financing Authority Revenue Bonds, Series 2016 | ||||||||||||
| 4.000% due 10/01/2042 | 2,000 | 1,974 | ||||||||||
Los Angeles Department of Airports, California Revenue Bonds, Series 2020 | ||||||||||||
| 4.000% due 05/15/2048 | 2,575 | 2,522 | ||||||||||
| 56 | PIMCO CLOSED-END FUNDS | See Accompanying Notes |
| December 31, 2022 |
| PRINCIPAL AMOUNT (000S) | MARKET VALUE (000S) | |||||||||||
Los Angeles Department of Airports, California Revenue Bonds, Series 2021 | ||||||||||||
| 5.000% due 05/15/2048 | $ | 2,500 | $ | 2,707 | ||||||||
Los Angeles Department of Water & Power Water System, California Revenue Bonds, Series 2022 | ||||||||||||
| 5.000% due 07/01/2052 | 1,475 | 1,597 | ||||||||||
Los Angeles Department of Water & Power, California Revenue Bonds, Series 2001 | ||||||||||||
| 3.000% due 07/01/2034 | 1,000 | 1,000 | ||||||||||
Los Angeles Department of Water & Power, California Revenue Bonds, Series 2014 | ||||||||||||
| 5.000% due 07/01/2043 | 3,000 | 3,045 | ||||||||||
Los Angeles Department of Water & Power, California Revenue Bonds, Series 2018 | ||||||||||||
| 5.000% due 07/01/2043 | 2,000 | 2,137 | ||||||||||
Los Angeles Department of Water & Power, California Revenue Bonds, Series 2021 | ||||||||||||
| 5.000% due 07/01/2041 | 3,900 | 4,293 | ||||||||||
Los Angeles, California Wastewater System Revenue Bonds, Series 2017 | ||||||||||||
| 5.000% due 06/01/2039 | 1,000 | 1,071 | ||||||||||
M‑S‑R Energy Authority, California Revenue Bonds, Series 2009 | ||||||||||||
| 6.500% due 11/01/2039 | 16,445 | 19,697 | ||||||||||
| 7.000% due 11/01/2034 | 1,000 | 1,237 | ||||||||||
Mount San Antonio Community College District, California General Obligation Bonds, Series 2019 | ||||||||||||
| 5.000% due 08/01/2044 | 1,850 | 1,997 | ||||||||||
Mount San Jacinto Community College District, California General Obligation Bonds, Series 2018 | ||||||||||||
| 4.000% due 08/01/2043 | 2,200 | 2,167 | ||||||||||
Municipal Improvement Corp. of Los Angeles, California Revenue Bonds, Series 2021 | ||||||||||||
| 5.000% due 11/01/2038 | 2,200 | 2,463 | ||||||||||
Newport Mesa Unified School District, California General Obligation Bonds, (NPFGC Insured), Series 2007 | ||||||||||||
| 0.000% due 08/01/2031 (b) | 1,900 | 1,436 | ||||||||||
Northern California Energy Authority Revenue Bonds, Series 2018 | ||||||||||||
| 4.000% due 07/01/2049 | 2,500 | 2,498 | ||||||||||
Orange County, California Community Facilities District Special Tax Bonds, Series 2022 | ||||||||||||
| 5.000% due 08/15/2052 | 1,360 | 1,370 | ||||||||||
Orange County, California Local Transportation Authority Revenue Bonds, Series 2019 | ||||||||||||
| 5.000% due 02/15/2041 | 3,000 | 3,249 | ||||||||||
Pacifica School District, California General Obligation Bonds, Series 2018 | ||||||||||||
| 4.000% due 08/01/2048 | 2,000 | 1,935 | ||||||||||
Poway Unified School District, California General Obligation Bonds, Series 2011 | ||||||||||||
| 0.000% due 08/01/2040 (b) | 11,000 | 4,984 | ||||||||||
| 0.000% due 08/01/2046 (b) | 16,000 | 5,009 | ||||||||||
Rio Hondo Community College District, California General Obligation Bonds, Series 2022 | ||||||||||||
| 0.000% due 08/01/2045 (b) | 1,850 | 619 | ||||||||||
River Islands Public Financing Authority, California Special Tax, Series 2022 | ||||||||||||
| 4.250% due 09/01/2047 | 1,100 | 1,048 | ||||||||||
Riverside, California Sewer Revenue Bonds, Series 2018 | ||||||||||||
| 4.000% due 08/01/2038 | 3,500 | 3,522 | ||||||||||
Riverside, California Water Revenue Bonds, Series 2019 | ||||||||||||
| 5.000% due 10/01/2048 | 3,540 | 3,784 | ||||||||||
Sacramento Area Flood Control Agency, California Special Assessment Bonds, Series 2016 | ||||||||||||
| 5.000% due 10/01/2041 (d) | 2,800 | 2,949 | ||||||||||
| 5.000% due 10/01/2047 (d) | 1,700 | 1,777 | ||||||||||
Sacramento County, California Sanitation Districts Financing Authority Revenue Bonds, Series 2020 | ||||||||||||
| 5.000% due 12/01/2050 | 1,200 | 1,292 | ||||||||||
Sacramento County, California Special Tax Bonds, Series 2022 | ||||||||||||
| 5.000% due 09/01/2047 | 500 | 487 | ||||||||||
| PRINCIPAL AMOUNT (000S) | MARKET VALUE (000S) | |||||||||||
San Diego County, California Regional Airport Authority Revenue Bonds, Series 2021 | ||||||||||||
| 4.000% due 07/01/2051 | $ | 1,000 | $ | 916 | ||||||||
| 5.000% due 07/01/2051 | 2,360 | 2,388 | ||||||||||
San Diego Public Facilities Financing Authority, California Revenue Bonds, Series 2020 | ||||||||||||
| 4.000% due 08/01/2038 | 1,610 | 1,640 | ||||||||||
| 4.000% due 08/01/2045 | 1,250 | 1,214 | ||||||||||
San Diego Public Facilities Financing Authority, California Revenue Bonds, Series 2022 | ||||||||||||
| 5.000% due 05/15/2047 | 1,000 | 1,104 | ||||||||||
San Francisco Bay Area Rapid Transit District, California General Obligation Bonds, Series 2017 | ||||||||||||
| 5.000% due 08/01/2047 | 1,000 | 1,058 | ||||||||||
San Francisco Bay Area Rapid Transit District, California General Obligation Bonds, Series 2019 | ||||||||||||
| 4.000% due 08/01/2044 | 2,780 | 2,749 | ||||||||||
San Francisco, California City & County Airport Comm‑San Francisco International Airport Revenue Bonds, Series 2017 | ||||||||||||
| 5.000% due 05/01/2047 | 2,750 | 2,854 | ||||||||||
San Francisco, California City & County Airport Comm‑San Francisco International Airport Revenue Bonds, Series 2019 | ||||||||||||
| 5.000% due 05/01/2049 | 4,000 | 4,052 | ||||||||||
| 5.000% due 05/01/2050 | 3,500 | 3,692 | ||||||||||
San Francisco, California City & County Certificates of Participation Bonds, Series 2015 | ||||||||||||
| 4.000% due 09/01/2033 | 1,530 | 1,542 | ||||||||||
San Francisco, California City & County Certificates of Participation Bonds, Series 2019 | ||||||||||||
| 4.000% due 04/01/2038 | 3,000 | 3,014 | ||||||||||
San Francisco, California City & County Public Utilities Commission Wastewater Revenue Bonds, Series 2018 | ||||||||||||
| 4.000% due 10/01/2043 (d) | 10,000 | 9,818 | ||||||||||
San Francisco, California Public Utilities Commission Water Revenue Bonds, Series 2020 | ||||||||||||
| 5.000% due 11/01/2050 | 1,200 | 1,286 | ||||||||||
San Jose Evergreen Community College District, California General Obligation Bonds, Series 2014 | ||||||||||||
| 4.125% due 09/01/2043 | 1,750 | 1,791 | ||||||||||
San Jose Financing Authority, California Revenue Bonds, Series 2022 | ||||||||||||
| 5.000% due 11/01/2052 | 1,800 | 1,991 | ||||||||||
San Jose Unified School District, California General Obligation Bonds, Series 2019 | ||||||||||||
| 4.000% due 08/01/2042 | 1,000 | 996 | ||||||||||
San Marcos Redevelopment Agency Successor Agency, California Tax Allocation Bonds, Series 2015 | ||||||||||||
| 5.000% due 10/01/2032 | 850 | 897 | ||||||||||
| 5.000% due 10/01/2033 | 1,125 | 1,186 | ||||||||||
San Mateo County, California Community College District General Obligation Bonds, (NPFGC Insured), Series 2006 | ||||||||||||
| 0.000% due 09/01/2034 (b) | 12,000 | 7,990 | ||||||||||
San Mateo Foster City Public Financing Authority, California Revenue Bonds, Series 2019 | ||||||||||||
| 4.000% due 08/01/2044 | 1,655 | 1,623 | ||||||||||
Santa Ana Unified School District, California General Obligation Bonds, Series 2019 | ||||||||||||
| 4.000% due 08/01/2048 | 1,750 | 1,688 | ||||||||||
Santa Monica, California Community College District General Obligation Bonds, Series 2022 | ||||||||||||
| 4.000% due 08/01/2045 | 1,270 | 1,241 | ||||||||||
Silicon Valley Tobacco Securitization Authority, California Revenue Bonds, Series 2007 | ||||||||||||
| 0.000% due 06/01/2036 (b) | 1,000 | 475 | ||||||||||
Southwestern Community College District, California Revenue Bonds, Series 2021 | ||||||||||||
| 4.000% due 08/01/2046 | 4,850 | 4,733 | ||||||||||
State Center Community College District, California General Obligation Bonds, Series 2022 | ||||||||||||
| 5.000% due 08/01/2047 | 1,815 | 2,003 | ||||||||||
| PRINCIPAL AMOUNT (000S) | MARKET VALUE (000S) | |||||||||||
Tobacco Securitization Authority of Northern California Revenue Bonds, Series 2021 | ||||||||||||
| 0.000% due 06/01/2060 (b) | $ | 19,480 | $ | 3,037 | ||||||||
Tobacco Securitization Authority of Southern California Revenue Bonds, Series 2006 | ||||||||||||
| 0.000% due 06/01/2046 (b) | 5,000 | 730 | ||||||||||
University of California Revenue Bonds, Series 2013 | ||||||||||||
| 5.000% due 05/15/2048 | 2,000 | 2,015 | ||||||||||
University of California Revenue Bonds, Series 2019 | ||||||||||||
| 5.000% due 05/15/2049 | 2,000 | 2,136 | ||||||||||
Upland, California Certificates of Participation Bonds, Series 2017 | ||||||||||||
| 4.000% due 01/01/2042 | 3,000 | 2,714 | ||||||||||
Val Verde Unified School District, California General Obligation Bonds, (AGM Insured), Series 2021 | ||||||||||||
| 4.000% due 08/01/2046 | 800 | 778 | ||||||||||
Washington Township Health Care District, California General Obligation Bonds, Series 2015 | ||||||||||||
| 4.000% due 08/01/2045 | 3,000 | 2,790 | ||||||||||
| 335,700 | ||||||||||||
| DELAWARE 1.4% | ||||||||||||
Affordable Housing Opportunities Trust, Delaware Revenue Bonds, Series 2022 | ||||||||||||
| 3.167% due 10/01/2038 | 2,935 | 2,505 | ||||||||||
| 7.120% due 10/01/2038 | 525 | 503 | ||||||||||
| 3,008 | ||||||||||||
| ILLINOIS 4.4% | ||||||||||||
Chicago, Illinois General Obligation Bonds, Series 2007 | ||||||||||||
| 5.500% due 01/01/2042 | 2,350 | 2,376 | ||||||||||
Chicago, Illinois General Obligation Bonds, Series 2015 | ||||||||||||
| 5.250% due 01/01/2028 | 2,835 | 2,897 | ||||||||||
Illinois State General Obligation Bonds, Series 2012 | ||||||||||||
| 5.000% due 08/01/2023 | 1,500 | 1,511 | ||||||||||
Illinois State General Obligation Bonds, Series 2018 | ||||||||||||
| 5.000% due 05/01/2035 | 1,000 | 1,008 | ||||||||||
Illinois State General Obligation Bonds, Series 2020 | ||||||||||||
| 4.125% due 10/01/2036 | 1,500 | 1,383 | ||||||||||
| 9,175 | ||||||||||||
| INDIANA 0.9% | ||||||||||||
Indiana Finance Authority Revenue Bonds, Series 2022 | ||||||||||||
| 4.500% due 12/15/2046 | 1,880 | 1,879 | ||||||||||
| NEW YORK 0.6% | ||||||||||||
New York Liberty Development Corp. Revenue Bonds, Series 2005 | ||||||||||||
| 5.250% due 10/01/2035 | 1,250 | 1,374 | ||||||||||
| NORTH DAKOTA 0.2% | ||||||||||||
Grand Forks County, North Dakota Revenue Bonds, Series 2021 | ||||||||||||
| 7.000% due 12/15/2043 ^(a) | 720 | 396 | ||||||||||
| PENNSYLVANIA 0.7% | ||||||||||||
Pennsylvania Economic Development Financing Authority Revenue Bonds, Series 2021 | ||||||||||||
| 9.000% due 04/01/2051 | 1,275 | 1,447 | ||||||||||
| PUERTO RICO 7.3% | ||||||||||||
Children’s Trust Fund, Puerto Rico Revenue Bonds, Series 2008 | ||||||||||||
| 0.000% due 05/15/2057 (b) | 24,300 | 1,493 | ||||||||||
Commonwealth of Puerto Rico Bonds, Series 2022 | ||||||||||||
| 0.000% due 11/01/2043 (b) | 3,269 | 1,434 | ||||||||||
| 0.000% due 11/01/2051 (b) | 2,855 | 1,125 | ||||||||||
| See Accompanying Notes | ANNUAL REPORT | | | DECEMBER 31, 2022 | 57 |
| Schedule of Investments | PIMCO California Municipal Income Fund II | (Cont.) |
| PRINCIPAL AMOUNT (000S) | MARKET VALUE (000S) | |||||||||||
Commonwealth of Puerto Rico General Obligation Bonds, Series 2021 | ||||||||||||
| 4.000% due 07/01/2041 | $ | 1,300 | $ | 1,022 | ||||||||
Commonwealth of Puerto Rico General Obligation Notes, Series 2021 | ||||||||||||
| 0.000% due 07/01/2024 (b) | 119 | 110 | ||||||||||
| 5.625% due 07/01/2027 | 767 | 782 | ||||||||||
Puerto Rico Highway & Transportation Authority Revenue Bonds, Series 2022 | ||||||||||||
| 0.000% due 07/01/2032 (b) | 163 | 97 | ||||||||||
| 0.000% due 07/01/2053 (c) | 1,189 | 660 | ||||||||||
| 5.000% due 07/01/2062 | 251 | 232 | ||||||||||
Puerto Rico Sales Tax Financing Corp. Sales Tax Revenue Bonds, Series 2018 | ||||||||||||
| 0.000% due 07/01/2051 (b) | 20,000 | 3,625 | ||||||||||
Puerto Rico Sales Tax Financing Corp. Sales Tax Revenue Bonds, Series 2019 | ||||||||||||
| 4.784% due 07/01/2058 | 5,425 | 4,720 | ||||||||||
| 15,300 | ||||||||||||
| PRINCIPAL AMOUNT (000S) | MARKET VALUE (000S) | |||||||||||
| TEXAS 0.5% | ||||||||||||
Angelina & Neches River Authority, Texas Revenue Bonds, Series 2021 | ||||||||||||
| 7.500% due 12/01/2045 | $ | 500 | $ | 329 | ||||||||
| 12.000% due 12/01/2045 | 850 | 735 | ||||||||||
| 1,064 | ||||||||||||
| U.S. VIRGIN ISLANDS 0.9% | ||||||||||||
Matching Fund Special Purpose Securitization Corp., U.S. Virgin Islands Revenue Bonds, Series 2022 | ||||||||||||
| 5.000% due 10/01/2039 | 2,005 | 2,011 | ||||||||||
| VIRGINIA 0.7% | ||||||||||||
Virginia Small Business Financing Authority Revenue Bonds, Series 2019 | ||||||||||||
| 0.000% due 07/01/2061 (b) | 19,000 | 917 | ||||||||||
| 5.500% due 07/01/2044 | 500 | 468 | ||||||||||
| 1,385 | ||||||||||||
| Total Municipal Bonds & Notes (Cost $379,550) | 373,397 | |||||||||||
| MARKET VALUE (000S) | ||||||||||||
| SHORT-TERM INSTRUMENTS 0.6% | ||||||||||||
| REPURCHASE AGREEMENTS (f) 0.6% | ||||||||||||
| $ | 1,323 | |||||||||||
| Total Short-Term Instruments (Cost $1,323) | 1,323 | |||||||||||
| Total Investments in Securities (Cost $380,873) | 374,720 | |||||||||||
| Total Investments 177.9% (Cost $380,873) | $ | 374,720 | ||||||||||
| Auction Rate Preferred Shares (61.1)% | (128,675 | ) | ||||||||||
| Remarketable Variable Rate MuniFund Term Preferred Shares, at liquidation value (13.0)% | (27,462 | ) | ||||||||||
| Other Assets and Liabilities, net (3.8)% | (8,002 | ) | ||||||||||
| Net Assets Applicable to Common Shareholders 100.0% | $ | 210,581 | ||||||||||
| * | A zero balance may reflect actual amounts rounding to less than one thousand. |
| ^ | Security is in default. |
| (a) | Security is not accruing income as of the date of this report. |
| (b) | Zero coupon security. |
| (c) | Security becomes interest bearing at a future date. |
| (d) | Represents an underlying municipal bond transferred to a tender option bond trust established in a tender option bond transaction in which the Fund sold, or caused the sale of, the underlying municipal bond and purchased the residual interest certificate. The security serves as collateral in a financing transaction. See Note 5, Tender Option Bond Transactions, in the Notes to Financial Statements for more information. |
| Issuer Description | Coupon | Maturity Date | Acquisition Date | Cost | Market Value | Market Value as Percentage of Net Assets Applicable to Common Shareholders | ||||||||||||||||
| California Municipal Finance Authority Revenue Bonds, Series 2021 | 4.000% | 09/01/2050 | 08/03/2022 | $ 1,357 | $ | 1,198 | 0.57% | |||||||||||||||
| Counterparty | Lending Rate | Settlement Date | Maturity Date | Principal Amount | Collateralized By | Collateral (Received) | Repurchase Agreements, at Value | Repurchase Agreement Proceeds to be Received(1) | ||||||||||||||||||||||
| FICC | 1.900 | % | 12/30/2022 | 01/03/2023 | $ | 1,323 | U.S. Treasury Bills 0.000% due 06/29/2023 | $ | (1,350 | ) | $ | 1,323 | $ | 1,323 | ||||||||||||||||
Total Repurchase Agreements | $ | (1,350 | ) | $ | 1,323 | $ | 1,323 | |||||||||||||||||||||||
| 58 | PIMCO CLOSED-END FUNDS | See Accompanying Notes |
| December 31, 2022 |
| Counterparty | Repurchase Agreement Proceeds to be Received(1) | Payable for Reverse Repurchase Agreements | Payable for Sale‑Buyback Transactions | Total Borrowings and Other Financing Transactions | Collateral Pledged/(Received) | Net Exposure(2) | ||||||||||||||||||
| Global/Master Repurchase Agreement | ||||||||||||||||||||||||
| FICC | $ | 1,323 | $ | 0 | $ | 0 | $ | 1,323 | $ | (1,350 | ) | $ | (27 | ) | ||||||||||
Total Borrowings and Other Financing Transactions | $ | 1,323 | $ | 0 | $ | 0 | ||||||||||||||||||
| (1) | Includes accrued interest. |
| (2) | Net Exposure represents the net receivable/(payable) that would be due from/to the counterparty in the event of default. Exposure from borrowings and other financing transactions can only be netted across transactions governed under the same master agreement with the same legal entity. See Note 7, Master Netting Arrangements, in the Notes to Financial Statements for more information. |
| Category and Subcategory | Level 1 | Level 2 | Level 3 | Fair Value at 12/31/2022 | ||||||||||||
Investments in Securities, at Value | ||||||||||||||||
| Municipal Bonds & Notes | ||||||||||||||||
| Arizona | $ | 0 | $ | 658 | $ | 0 | $ | 658 | ||||||||
| California | 0 | 335,700 | 0 | 335,700 | ||||||||||||
| Delaware | 0 | 3,008 | 0 | 3,008 | ||||||||||||
| Illinois | 0 | 9,175 | 0 | 9,175 | ||||||||||||
| Indiana | 0 | 1,879 | 0 | 1,879 | ||||||||||||
| New York | 0 | 1,374 | 0 | 1,374 | ||||||||||||
| North Dakota | 0 | 396 | 0 | 396 | ||||||||||||
| Pennsylvania | 0 | 1,447 | 0 | 1,447 | ||||||||||||
| Category and Subcategory | Level 1 | Level 2 | Level 3 | Fair Value at 12/31/2022 | ||||||||||||
| Puerto Rico | $ | 0 | $ | 15,300 | $ | 0 | $ | 15,300 | ||||||||
| Texas | 0 | 1,064 | 0 | 1,064 | ||||||||||||
| U.S. Virgin Islands | 0 | 2,011 | 0 | 2,011 | ||||||||||||
| Virginia | 0 | 1,385 | 0 | 1,385 | ||||||||||||
| Short-Term Instruments | ||||||||||||||||
| Repurchase Agreements | 0 | 1,323 | 0 | 1,323 | ||||||||||||
| Total Investments | $ | 0 | $ | 374,720 | $ | 0 | $ | 374,720 | ||||||||
| See Accompanying Notes | ANNUAL REPORT | | | DECEMBER 31, 2022 | 59 |
| Schedule of Investments | PIMCO California Municipal Income Fund III |
| PRINCIPAL AMOUNT (000S) | MARKET VALUE (000S) | |||||||||||
| INVESTMENTS IN SECURITIES 176.3% | ||||||||||||
| MUNICIPAL BONDS & NOTES 175.4% | ||||||||||||
| ARIZONA 0.3% | ||||||||||||
Arizona Industrial Development Authority Revenue Bonds, Series 2020 | ||||||||||||
| 7.750% due 07/01/2050 | $ | 730 | $ | 511 | ||||||||
| CALIFORNIA 157.3% | ||||||||||||
Alameda Corridor Transportation Authority, California Revenue Bonds, Series 2022 | ||||||||||||
| 0.000% due 10/01/2049 (c) | 2,525 | 1,205 | ||||||||||
Antelope Valley Community College District, California General Obligation Bonds, Series 2022 | ||||||||||||
| 0.000% due 08/01/2047 (b) | 600 | 168 | ||||||||||
Bay Area Toll Authority, California Revenue Bonds, Series 2013 | ||||||||||||
| 5.250% due 04/01/2048 | 8,000 | 8,047 | ||||||||||
California Community Housing Agency Revenue Bonds, Series 2019 | ||||||||||||
| 5.000% due 04/01/2049 | 3,700 | 3,240 | ||||||||||
| 5.000% due 08/01/2049 | 1,000 | 906 | ||||||||||
California Community Housing Agency Revenue Bonds, Series 2021 | ||||||||||||
| 4.000% due 02/01/2056 | 1,000 | 738 | ||||||||||
California Community Housing Agency Revenue Bonds, Series 2022 | ||||||||||||
| 4.500% due 08/01/2052 | 1,000 | 822 | ||||||||||
California County Tobacco Securitization Agency Revenue Bonds, Series 2002 | ||||||||||||
| 5.875% due 06/01/2035 | 3,935 | 3,993 | ||||||||||
| 6.000% due 06/01/2042 | 7,000 | 7,103 | ||||||||||
| 6.125% due 06/01/2038 | 1,000 | 1,001 | ||||||||||
California County Tobacco Securitization Agency Revenue Bonds, Series 2007 | ||||||||||||
| 0.000% due 06/01/2057 (b) | 4,000 | 569 | ||||||||||
California County Tobacco Securitization Agency Revenue Bonds, Series 2020 | ||||||||||||
| 0.000% due 06/01/2055 (b) | 4,000 | 737 | ||||||||||
California Educational Facilities Authority Revenue Bonds, Series 2017 | ||||||||||||
| 5.000% due 04/01/2047 | 700 | 716 | ||||||||||
California Educational Facilities Authority Revenue Bonds, Series 2018 | ||||||||||||
| 5.000% due 10/01/2043 | 1,000 | 1,049 | ||||||||||
California Enterprise Development Authority Revenue Bonds, Series 2020 | ||||||||||||
| 5.000% due 08/01/2050 | 600 | 597 | ||||||||||
California Health Facilities Financing Authority Revenue Bonds, (CM Insured), Series 2020 | ||||||||||||
| 4.000% due 11/01/2040 | 1,020 | 1,007 | ||||||||||
California Health Facilities Financing Authority Revenue Bonds, Series 2015 | ||||||||||||
| 5.000% due 08/15/2054 | 3,000 | 3,068 | ||||||||||
California Health Facilities Financing Authority Revenue Bonds, Series 2016 | ||||||||||||
| 4.000% due 10/01/2047 | 750 | 732 | ||||||||||
| 5.000% due 11/15/2046 (d) | 5,000 | 5,250 | ||||||||||
| 5.000% due 08/15/2055 | 5,000 | 5,097 | ||||||||||
California Health Facilities Financing Authority Revenue Bonds, Series 2017 | ||||||||||||
| 4.000% due 11/01/2038 | 1,220 | 1,228 | ||||||||||
California Health Facilities Financing Authority Revenue Bonds, Series 2020 | ||||||||||||
| 4.000% due 04/01/2049 | 2,750 | 2,388 | ||||||||||
| 4.000% due 06/01/2050 | 3,750 | 3,501 | ||||||||||
California Health Facilities Financing Authority Revenue Bonds, Series 2021 | ||||||||||||
| 4.000% due 08/15/2048 | 2,300 | 2,196 | ||||||||||
California Infrastructure & Economic Development Bank Revenue Bonds, Series 2013 | ||||||||||||
| 5.000% due 02/01/2039 | 10,000 | 10,015 | ||||||||||
| PRINCIPAL AMOUNT (000S) | MARKET VALUE (000S) | |||||||||||
California Infrastructure & Economic Development Bank Revenue Bonds, Series 2020 | ||||||||||||
| 0.000% due 01/01/2060 (b) | $ | 5,000 | $ | 246 | ||||||||
| 4.000% due 11/01/2050 | 860 | 746 | ||||||||||
California Municipal Finance Authority Certificates of Participation Bonds, (AGM Insured), Series 2022 | ||||||||||||
| 5.250% due 11/01/2052 | 1,500 | 1,582 | ||||||||||
California Municipal Finance Authority Revenue Bonds, Series 2018 | ||||||||||||
| 5.000% due 06/01/2043 | 1,165 | 1,242 | ||||||||||
| 5.000% due 06/01/2048 | 1,100 | 1,164 | ||||||||||
California Municipal Finance Authority Revenue Bonds, Series 2021 | ||||||||||||
| 4.000% due 11/01/2036 | 655 | 588 | ||||||||||
| 4.000% due 09/01/2050 (e) | 1,200 | 958 | ||||||||||
| 4.000% due 02/01/2051 | 1,500 | 1,346 | ||||||||||
California Public Finance Authority Revenue Bonds, Series 2019 | ||||||||||||
| 6.250% due 07/01/2054 | 1,250 | 1,328 | ||||||||||
California School Finance Authority Revenue Bonds, Series 2017 | ||||||||||||
| 5.000% due 07/01/2047 | 1,115 | 1,123 | ||||||||||
California State General Obligation Bonds, Series 2013 | ||||||||||||
| 5.000% due 11/01/2043 | 5,000 | 5,056 | ||||||||||
California State General Obligation Bonds, Series 2017 | ||||||||||||
| 4.000% due 11/01/2047 | 1,500 | 1,455 | ||||||||||
California State General Obligation Bonds, Series 2018 | ||||||||||||
| 5.000% due 10/01/2047 | 2,000 | 2,082 | ||||||||||
California State General Obligation Bonds, Series 2020 | ||||||||||||
| 4.000% due 11/01/2040 | 850 | 849 | ||||||||||
California State General Obligation Bonds, Series 2021 | ||||||||||||
| 5.000% due 09/01/2041 | 1,500 | 1,663 | ||||||||||
California State General Obligation Bonds, Series 2022 | ||||||||||||
| 4.000% due 04/01/2049 | 1,750 | 1,686 | ||||||||||
California State General Obligation Notes, Series 2019 | ||||||||||||
| 5.000% due 04/01/2027 | 1,615 | 1,776 | ||||||||||
California State General Obligation Notes, Series 2021 | ||||||||||||
| 5.000% due 10/01/2029 | 2,000 | 2,299 | ||||||||||
California State Public Works Board Revenue Bonds, Series 2013 | ||||||||||||
| 5.000% due 03/01/2038 | 2,500 | 2,507 | ||||||||||
California State University Revenue Bonds, Series 2015 | ||||||||||||
| 5.000% due 11/01/2047 | 6,750 | 6,984 | ||||||||||
California Statewide Communities Development Authority Revenue Bonds, (AGM Insured), Series 2022 | ||||||||||||
| 5.375% due 08/15/2057 | 950 | 1,002 | ||||||||||
California Statewide Communities Development Authority Revenue Bonds, (CM Insured), Series 2018 | ||||||||||||
| 4.000% due 07/01/2047 | 250 | 242 | ||||||||||
California Statewide Communities Development Authority Revenue Bonds, (CM Insured), Series 2021 | ||||||||||||
| 4.000% due 11/01/2051 | 750 | 715 | ||||||||||
California Statewide Communities Development Authority Revenue Bonds, Series 2016 | ||||||||||||
| 4.000% due 08/15/2051 | 200 | 192 | ||||||||||
| 5.000% due 06/01/2046 | 1,000 | 916 | ||||||||||
| 5.000% due 12/01/2046 | 3,100 | 2,975 | ||||||||||
| 5.250% due 12/01/2056 | 3,750 | 3,718 | ||||||||||
California Statewide Communities Development Authority Revenue Bonds, Series 2018 | ||||||||||||
| 4.000% due 03/01/2042 | 2,500 | 2,267 | ||||||||||
| 4.000% due 07/01/2048 | 850 | 816 | ||||||||||
| 4.000% due 12/01/2057 | 2,000 | 1,884 | ||||||||||
| 5.000% due 03/01/2048 | 1,505 | 1,522 | ||||||||||
Chino Valley Unified School District, California General Obligation Bonds, Series 2022 | ||||||||||||
| 0.000% due 08/01/2038 (b) | 1,300 | 674 | ||||||||||
| 0.000% due 08/01/2039 (b) | 1,600 | 787 | ||||||||||
| 0.000% due 08/01/2041 (b) | 1,935 | 854 | ||||||||||
| 0.000% due 08/01/2046 (b) | 1,500 | 511 | ||||||||||
Chino Valley Unified School District, California General Obligation Notes, Series 2022 | ||||||||||||
| 0.000% due 08/01/2030 (b) | 1,135 | 881 | ||||||||||
| PRINCIPAL AMOUNT (000S) | MARKET VALUE (000S) | |||||||||||
City of California, Eureka City Schools, General Obligation Bonds, (BAM Insured), Series 2020 | ||||||||||||
| 4.000% due 08/01/2049 | $ | 2,000 | $ | 1,919 | ||||||||
CMFA Special Finance Agency VII, California Revenue Bonds, Series 2021 | ||||||||||||
| 3.000% due 08/01/2056 | 1,500 | 987 | ||||||||||
| 4.000% due 08/01/2047 | 600 | 449 | ||||||||||
CMFA Special Finance Agency, California Revenue Bonds, Series 2021 | ||||||||||||
| 4.000% due 08/01/2045 | 750 | 592 | ||||||||||
CSCDA Community Improvement Authority, California Revenue Bonds, Series 2021 | ||||||||||||
| 3.000% due 02/01/2057 | 500 | 333 | ||||||||||
| 3.100% due 07/01/2045 | 1,000 | 752 | ||||||||||
| 3.400% due 10/01/2046 | 350 | 260 | ||||||||||
| 4.000% due 08/01/2056 | 500 | 381 | ||||||||||
| 4.000% due 10/01/2056 | 750 | 548 | ||||||||||
CSCDA Community Improvement Authority, California Revenue Bonds, Series 2022 | ||||||||||||
| 0.000% due 09/01/2062 (c) | 1,800 | 858 | ||||||||||
Department of Veterans Affairs Veteran’s Farm & Home Purchase Program, California Revenue Bonds, Series 2022 | ||||||||||||
| 4.950% due 12/01/2046 | 300 | 315 | ||||||||||
Folsom Cordova Unified School District, California General Obligation Bonds, (AGM Insured), Series 2019 | ||||||||||||
| 4.000% due 10/01/2044 | 1,160 | 1,125 | ||||||||||
Foothill-Eastern Transportation Corridor Agency, California Revenue Bonds, Series 2014 | ||||||||||||
| 3.950% due 01/15/2053 | 720 | 641 | ||||||||||
Fremont Community Facilities District No. 1, California Special Tax Bonds, Series 2015 | ||||||||||||
| 5.000% due 09/01/2045 | 1,400 | 1,414 | ||||||||||
Glendale Community College District, California General Obligation Bonds, Series 2020 | ||||||||||||
| 4.000% due 08/01/2050 | 1,000 | 960 | ||||||||||
Golden State, California Tobacco Securitization Corp. Revenue Bonds, Series 2018 | ||||||||||||
| 5.000% due 06/01/2030 | 1,500 | 1,691 | ||||||||||
Golden State, California Tobacco Securitization Corp. Revenue Bonds, Series 2021 | ||||||||||||
| 0.000% due 06/01/2066 (b) | 20,500 | 2,388 | ||||||||||
Hartnell Community College District, California General Obligation Bonds, Series 2017 | ||||||||||||
| 4.000% due 08/01/2042 | 1,150 | 1,134 | ||||||||||
Hastings Campus Housing Finance Authority, California Revenue Bonds, Series 2020 | ||||||||||||
| 5.000% due 07/01/2061 | 2,000 | 1,548 | ||||||||||
Hayward Unified School District, California General Obligation Bonds, Series 2015 | ||||||||||||
| 5.000% due 08/01/2038 | 5,000 | 5,181 | ||||||||||
Imperial Irrigation District Electric System, California Revenue Bonds, Series 2016 | ||||||||||||
| 5.000% due 11/01/2041 (d) | 4,000 | 4,232 | ||||||||||
Long Beach Bond Finance Authority, California Revenue Bonds, Series 2007 | ||||||||||||
| 5.500% due 11/15/2030 | 360 | 394 | ||||||||||
Long Beach Community College District, California General Obligation Bonds, Series 2019 | ||||||||||||
| 4.000% due 08/01/2045 | 450 | 439 | ||||||||||
Long Beach Unified School District, California General Obligation Bonds, Series 2009 | ||||||||||||
| 5.750% due 08/01/2033 | 305 | 306 | ||||||||||
Los Angeles County, California Facilities, Inc., Revenue Bonds, Series 2018 | ||||||||||||
| 4.000% due 12/01/2048 | 2,000 | 1,915 | ||||||||||
Los Angeles County, California Metropolitan Transportation Authority Revenue Bonds, Series 2019 | ||||||||||||
| 5.000% due 07/01/2044 | 2,200 | 2,358 | ||||||||||
Los Angeles County, California Metropolitan Transportation Authority Sales Tax Revenue Bonds, Series 2021 | ||||||||||||
| 4.000% due 06/01/2037 | 1,500 | 1,557 | ||||||||||
| 60 | PIMCO CLOSED-END FUNDS | See Accompanying Notes |
| December 31, 2022 |
| PRINCIPAL AMOUNT (000S) | MARKET VALUE (000S) | |||||||||||
Los Angeles County, California Sanitation Districts Financing Authority Revenue Bonds, Series 2016 | ||||||||||||
| 4.000% due 10/01/2042 | $ | 1,185 | $ | 1,170 | ||||||||
Los Angeles Department of Water & Power System, California Revenue Bonds, Series 2019 | ||||||||||||
| 5.000% due 07/01/2049 | 1,500 | 1,598 | ||||||||||
Los Angeles Department of Water & Power Water System, California Revenue Bonds, Series 2022 | ||||||||||||
| 5.000% due 07/01/2052 | 1,190 | 1,289 | ||||||||||
Los Angeles Department of Water & Power, California Revenue Bonds, Series 2001 | ||||||||||||
| 3.000% due 07/01/2034 | 500 | 500 | ||||||||||
Los Angeles Department of Water & Power, California Revenue Bonds, Series 2014 | ||||||||||||
| 5.000% due 07/01/2043 | 1,000 | 1,015 | ||||||||||
Los Angeles Department of Water & Power, California Revenue Bonds, Series 2021 | ||||||||||||
| 5.000% due 07/01/2041 | 3,175 | 3,495 | ||||||||||
M‑S‑R Energy Authority, California Revenue Bonds, Series 2009 | ||||||||||||
| 6.500% due 11/01/2039 | 7,190 | 8,612 | ||||||||||
| 7.000% due 11/01/2034 | 2,285 | 2,826 | ||||||||||
Manteca Financing Authority, California Revenue Bonds, Series 2009 | ||||||||||||
| 5.750% due 12/01/2036 | 1,000 | 1,013 | ||||||||||
Monterey Peninsula Unified School District, California General Obligation Bonds, Series 2019 | ||||||||||||
| 4.000% due 08/01/2040 | 2,545 | 2,522 | ||||||||||
Mount San Antonio Community College District, California General Obligation Bonds, Series 2019 | ||||||||||||
| 5.000% due 08/01/2044 | 1,450 | 1,565 | ||||||||||
Mount San Jacinto Community College District, California General Obligation Bonds, Series 2018 | ||||||||||||
| 4.000% due 08/01/2043 | 3,650 | 3,596 | ||||||||||
Municipal Improvement Corp. of Los Angeles, California Revenue Bonds, Series 2021 | ||||||||||||
| 5.000% due 11/01/2038 | 1,790 | 2,004 | ||||||||||
Newport Mesa Unified School District, California General Obligation Bonds, (NPFGC Insured), Series 2007 | ||||||||||||
| 0.000% due 08/01/2031 (b) | 1,485 | 1,122 | ||||||||||
Northern California Energy Authority Revenue Bonds, Series 2018 | ||||||||||||
| 4.000% due 07/01/2049 | 2,000 | 1,999 | ||||||||||
Oakland Redevelopment Agency Successor Agency, California Tax Allocation Bonds, (AGM Insured), Series 2015 | ||||||||||||
| 5.000% due 09/01/2036 | 800 | 838 | ||||||||||
Orange County, California Community Facilities District Special Tax Bonds, Series 2022 | ||||||||||||
| 5.000% due 08/15/2052 | 1,115 | 1,123 | ||||||||||
Orange County, California Local Transportation Authority Revenue Bonds, Series 2019 | ||||||||||||
| 5.000% due 02/15/2041 | 1,000 | 1,083 | ||||||||||
Pacifica School District, California General Obligation Bonds, Series 2018 | ||||||||||||
| 4.000% due 08/01/2048 | 1,250 | 1,209 | ||||||||||
Regents of the University of California Medical Center Pooled Revenue Bonds, Series 2013 | ||||||||||||
| 5.000% due 05/15/2043 | 5,000 | 5,009 | ||||||||||
Rio Hondo Community College District, California General Obligation Bonds, Series 2022 | ||||||||||||
| 0.000% due 08/01/2045 (b) | 1,500 | 502 | ||||||||||
River Islands Public Financing Authority, California Special Tax, Series 2022 | ||||||||||||
| 4.250% due 09/01/2047 | 900 | 858 | ||||||||||
Riverside, California Sewer Revenue Bonds, Series 2018 | ||||||||||||
| 4.000% due 08/01/2038 | 2,000 | 2,012 | ||||||||||
Riverside, California Water Revenue Bonds, Series 2019 | ||||||||||||
| 5.000% due 10/01/2048 | 1,500 | 1,603 | ||||||||||
Sacramento Area Flood Control Agency, California Special Assessment Bonds, Series 2016 | ||||||||||||
| 5.000% due 10/01/2041 (d) | 2,200 | 2,317 | ||||||||||
| 5.000% due 10/01/2047 (d) | 1,500 | 1,568 | ||||||||||
| PRINCIPAL AMOUNT (000S) | MARKET VALUE (000S) | |||||||||||
Sacramento County, California Sanitation Districts Financing Authority Revenue Bonds, Series 2020 | ||||||||||||
| 5.000% due 12/01/2050 | $ | 1,000 | $ | 1,076 | ||||||||
Sacramento County, California Special Tax Bonds, Series 2022 | ||||||||||||
| 5.000% due 09/01/2047 | 400 | 390 | ||||||||||
Sacramento Municipal Utility District, California Revenue Bonds, Series 2013 | ||||||||||||
| 5.000% due 08/15/2037 | 3,000 | 3,036 | ||||||||||
San Diego County, California Regional Airport Authority Revenue Bonds, Series 2013 | ||||||||||||
| 5.000% due 07/01/2043 | 1,325 | 1,339 | ||||||||||
San Diego County, California Regional Airport Authority Revenue Bonds, Series 2021 | ||||||||||||
| 4.000% due 07/01/2051 | 550 | 504 | ||||||||||
| 5.000% due 07/01/2051 | 1,925 | 1,948 | ||||||||||
San Diego Public Facilities Financing Authority, California Revenue Bonds, Series 2022 | ||||||||||||
| 5.000% due 05/15/2047 | 1,000 | 1,104 | ||||||||||
San Francisco Bay Area Rapid Transit District, California General Obligation Bonds, Series 2019 | ||||||||||||
| 4.000% due 08/01/2044 | 2,160 | 2,136 | ||||||||||
San Francisco, California City & County Airport Comm‑San Francisco International Airport Revenue Bonds, Series 2017 | ||||||||||||
| 5.000% due 05/01/2047 | 2,125 | 2,206 | ||||||||||
San Francisco, California City & County Airport Comm‑San Francisco International Airport Revenue Bonds, Series 2019 | ||||||||||||
| 5.000% due 05/01/2049 | 3,750 | 3,799 | ||||||||||
| 5.000% due 05/01/2050 | 4,100 | 4,324 | ||||||||||
San Francisco, California City & County Certificates of Participation Bonds, Series 2015 | ||||||||||||
| 4.000% due 09/01/2033 | 1,500 | 1,512 | ||||||||||
San Francisco, California City & County General Obligation Bonds, Series 2022 | ||||||||||||
| 5.000% due 06/15/2042 | 2,265 | 2,491 | ||||||||||
San Francisco, California City & County Redevelopment Agency Special Tax Bonds, Series 2013 | ||||||||||||
| 5.000% due 08/01/2028 | 1,505 | 1,507 | ||||||||||
San Francisco, California Public Utilities Commission Water Revenue Bonds, Series 2020 | ||||||||||||
| 5.000% due 11/01/2050 | 1,500 | 1,607 | ||||||||||
San Jose Evergreen Community College District, California General Obligation Bonds, Series 2014 | ||||||||||||
| 4.125% due 09/01/2043 | 1,250 | 1,279 | ||||||||||
San Jose Financing Authority, California Revenue Bonds, Series 2022 | ||||||||||||
| 5.000% due 11/01/2052 | 1,500 | 1,659 | ||||||||||
San Jose Unified School District, California General Obligation Bonds, Series 2019 | ||||||||||||
| 4.000% due 08/01/2042 | 1,000 | 996 | ||||||||||
San Marcos Redevelopment Agency Successor Agency, California Tax Allocation Bonds, Series 2015 | ||||||||||||
| 5.000% due 10/01/2034 | 885 | 932 | ||||||||||
San Mateo County, California Community College District General Obligation Bonds, (NPFGC Insured), Series 2006 | ||||||||||||
| 0.000% due 09/01/2034 (b) | 2,530 | 1,685 | ||||||||||
San Mateo County, California Community College District General Obligation Bonds, Series 2018 | ||||||||||||
| 5.000% due 09/01/2045 | 2,000 | 2,158 | ||||||||||
San Mateo Foster City Public Financing Authority, California Revenue Bonds, Series 2019 | ||||||||||||
| 4.000% due 08/01/2044 | 1,290 | 1,265 | ||||||||||
Santa Ana Unified School District, California General Obligation Bonds, Series 2019 | ||||||||||||
| 4.000% due 08/01/2048 | 1,250 | 1,205 | ||||||||||
Santa Monica, California Community College District General Obligation Bonds, Series 2022 | ||||||||||||
| 4.000% due 08/01/2045 | 1,040 | 1,016 | ||||||||||
Silicon Valley Tobacco Securitization Authority, California Revenue Bonds, Series 2007 | ||||||||||||
| 0.000% due 06/01/2036 (b) | 1,000 | 475 | ||||||||||
| PRINCIPAL AMOUNT (000S) | MARKET VALUE (000S) | |||||||||||
Southwestern Community College District, California Revenue Bonds, Series 2021 | ||||||||||||
| 4.000% due 08/01/2046 | $ | 3,850 | $ | 3,757 | ||||||||
State Center Community College District, California General Obligation Bonds, Series 2022 | ||||||||||||
| 5.000% due 08/01/2047 | 1,495 | 1,650 | ||||||||||
Tobacco Securitization Authority of Northern California Revenue Bonds, Series 2021 | ||||||||||||
| 0.000% due 06/01/2060 (b) | 20,000 | 3,118 | ||||||||||
Tobacco Securitization Authority of Southern California Revenue Bonds, Series 2006 | ||||||||||||
| 0.000% due 06/01/2046 (b) | 3,995 | 591 | ||||||||||
University of California Revenue Bonds, Series 2013 | ||||||||||||
| 5.000% due 05/15/2048 | 1,750 | 1,763 | ||||||||||
University of California Revenue Bonds, Series 2017 | ||||||||||||
| 5.000% due 05/15/2042 | 2,500 | 2,650 | ||||||||||
University of California Revenue Bonds, Series 2018 | ||||||||||||
| 4.000% due 05/15/2043 | 1,050 | 1,032 | ||||||||||
University of California Revenue Bonds, Series 2019 | ||||||||||||
| 5.000% due 05/15/2049 | 1,500 | 1,602 | ||||||||||
Upland, California Certificates of Participation Bonds, Series 2017 | ||||||||||||
| 4.000% due 01/01/2042 | 2,250 | 2,035 | ||||||||||
Val Verde Unified School District, California General Obligation Bonds, (AGM Insured), Series 2021 | ||||||||||||
| 4.000% due 08/01/2046 | 775 | 754 | ||||||||||
Washington Township Health Care District, California General Obligation Bonds, Series 2015 | ||||||||||||
| 4.000% due 08/01/2045 | 2,500 | 2,325 | ||||||||||
| 272,060 | ||||||||||||
| DELAWARE 1.4% | ||||||||||||
Affordable Housing Opportunities Trust, Delaware Revenue Bonds, Series 2022 | ||||||||||||
| 3.167% due 10/01/2038 | 2,380 | 2,031 | ||||||||||
| 7.120% due 10/01/2038 | 420 | 403 | ||||||||||
| 2,434 | ||||||||||||
| ILLINOIS 4.8% | ||||||||||||
Chicago, Illinois General Obligation Bonds, Series 2007 | ||||||||||||
| 5.500% due 01/01/2035 | 3,000 | 3,052 | ||||||||||
Chicago, Illinois General Obligation Bonds, Series 2015 | ||||||||||||
| 5.250% due 01/01/2028 | 1,700 | 1,737 | ||||||||||
| 5.500% due 01/01/2033 | 2,500 | 2,551 | ||||||||||
Illinois State General Obligation Notes, Series 2017 | ||||||||||||
| 5.000% due 11/01/2027 | 1,000 | 1,034 | ||||||||||
| 8,374 | ||||||||||||
| INDIANA 0.9% | ||||||||||||
Indiana Finance Authority Revenue Bonds, Series 2022 | ||||||||||||
| 4.500% due 12/15/2046 | 1,580 | 1,579 | ||||||||||
| NORTH DAKOTA 0.2% | ||||||||||||
Grand Forks County, North Dakota Revenue Bonds, Series 2021 | ||||||||||||
| 7.000% due 12/15/2043 ^(a) | 570 | 314 | ||||||||||
| PENNSYLVANIA 0.7% | ||||||||||||
Pennsylvania Economic Development Financing Authority Revenue Bonds, Series 2021 | ||||||||||||
| 9.000% due 04/01/2051 | 1,005 | 1,140 | ||||||||||
| PUERTO RICO 7.2% | ||||||||||||
Children’s Trust Fund, Puerto Rico Revenue Bonds, Series 2008 | ||||||||||||
| 0.000% due 05/15/2057 (b) | 18,000 | 1,119 | ||||||||||
Commonwealth of Puerto Rico Bonds, Series 2022 | ||||||||||||
| 0.000% due 11/01/2043 (b) | 2,587 | 1,135 | ||||||||||
| 0.000% due 11/01/2051 (b) | 2,688 | 1,066 | ||||||||||
| See Accompanying Notes | ANNUAL REPORT | | | DECEMBER 31, 2022 | 61 |
| Schedule of Investments | PIMCO California Municipal Income Fund III | (Cont.) |
| PRINCIPAL AMOUNT (000S) | MARKET VALUE (000S) | |||||||||||
Commonwealth of Puerto Rico General Obligation Bonds, Series 2021 | ||||||||||||
| 4.000% due 07/01/2041 | $ | 1,000 | $ | 786 | ||||||||
Commonwealth of Puerto Rico General Obligation Notes, Series 2021 | ||||||||||||
| 0.000% due 07/01/2024 (b) | 92 | 85 | ||||||||||
| 5.625% due 07/01/2027 | 594 | 606 | ||||||||||
Puerto Rico Highway & Transportation Authority Revenue Bonds, Series 2022 | ||||||||||||
| 0.000% due 07/01/2032 (b) | 160 | 95 | ||||||||||
| 0.000% due 07/01/2053 (c) | 1,019 | 566 | ||||||||||
| 5.000% due 07/01/2062 | 247 | 228 | ||||||||||
Puerto Rico Sales Tax Financing Corp. Sales Tax Revenue Bonds, Series 2018 | ||||||||||||
| 0.000% due 07/01/2046 (b) | 7,700 | 1,907 | ||||||||||
| 0.000% due 07/01/2051 (b) | 6,630 | 1,202 | ||||||||||
Puerto Rico Sales Tax Financing Corp. Sales Tax Revenue Bonds, Series 2019 | ||||||||||||
| 4.784% due 07/01/2058 | 4,280 | 3,724 | ||||||||||
| 12,519 | ||||||||||||
| TEXAS 0.5% | ||||||||||||
Angelina & Neches River Authority, Texas Revenue Bonds, Series 2021 | ||||||||||||
| 7.500% due 12/01/2045 | 390 | 256 | ||||||||||
| PRINCIPAL AMOUNT (000S) | MARKET VALUE (000S) | |||||||||||
| 12.000% due 12/01/2045 | $ | 650 | $ | 562 | ||||||||
| 818 | ||||||||||||
| U.S. VIRGIN ISLANDS 0.9% | ||||||||||||
Matching Fund Special Purpose Securitization Corp., U.S. Virgin Islands Revenue Bonds, Series 2022 | ||||||||||||
| 5.000% due 10/01/2039 | 1,615 | 1,620 | ||||||||||
| VIRGINIA 0.7% | ||||||||||||
Virginia Small Business Financing Authority Revenue Bonds, Series 2019 | ||||||||||||
| 0.000% due 07/01/2061 (b) | 15,000 | 724 | ||||||||||
| 5.500% due 07/01/2044 | 500 | 468 | ||||||||||
| 1,192 | ||||||||||||
| WISCONSIN 0.5% | ||||||||||||
Wisconsin Center District Revenue Bonds, (AGM Insured), Series 2020 | ||||||||||||
| 0.000% due 12/15/2060 (b) | 5,500 | 777 | ||||||||||
Total Municipal Bonds & Notes (Cost $312,387) | 303,338 | |||||||||||
| MARKET VALUE (000S) | ||||||||||||
| SHORT-TERM INSTRUMENTS 0.9% | ||||||||||||
| REPURCHASE AGREEMENTS (f) 0.9% | ||||||||||||
| $ | 1,566 | |||||||||||
| Total Short-Term Instruments (Cost $1,566) | 1,566 | |||||||||||
| Total Investments in Securities (Cost $313,953) | 304,904 | |||||||||||
| Total Investments 176.3% (Cost $313,953) | $ | 304,904 | ||||||||||
| Auction Rate Preferred Shares (56.6)% | (97,875 | ) | ||||||||||
Remarketable Variable Rate MuniFund Term Preferred Shares, at liquidation value (15.6)% | (27,066 | ) | ||||||||||
| Other Assets and Liabilities, net (4.1)% | (6,991 | ) | ||||||||||
| Net Assets Applicable to Common Shareholders 100.0% | $ | 172,972 | ||||||||||
| * | A zero balance may reflect actual amounts rounding to less than one thousand. |
| ^ | Security is in default. |
| (a) | Security is not accruing income as of the date of this report. |
| (b) | Zero coupon security. |
| (c) | Security becomes interest bearing at a future date. |
| (d) | Represents an underlying municipal bond transferred to a tender option bond trust established in a tender option bond transaction in which the Fund sold, or caused the sale of, the underlying municipal bond and purchased the residual interest certificate. The security serves as collateral in a financing transaction. See Note 5, Tender Option Bond Transactions, in the Notes to Financial Statements for more information. |
| Issuer Description | Coupon | Maturity Date | Acquisition Date | Cost | Market Value | Market Value as Percentage of Net Assets Applicable to Common Shareholders | ||||||||||||||||||
| California Municipal Finance Authority Revenue Bonds, Series 2021 | 4.000% | 09/01/2050 | 08/03/2022 | $ | 1,086 | $ | 958 | 0.55% | ||||||||||||||||
| Counterparty | Lending Rate | Settlement Date | Maturity Date | Principal Amount | Collateralized By | Collateral (Received) | Repurchase Agreements, at Value | Repurchase Agreement Proceeds to be Received(1) | ||||||||||||||||||||||
| FICC | 1.900 | % | 12/30/2022 | 01/03/2023 | $ | 1,566 | U.S. Treasury Notes 0.125% due 05/15/2023 | $ | (1,597 | ) | $ | 1,566 | $ | 1,566 | ||||||||||||||||
Total Repurchase Agreements | $ | (1,597 | ) | $ | 1,566 | $ | 1,566 | |||||||||||||||||||||||
| 62 | PIMCO CLOSED-END FUNDS | See Accompanying Notes |
| December 31, 2022 |
| Counterparty | Repurchase Agreement Proceeds to be Received(1) | Payable for Reverse Repurchase Agreements | Payable for Sale‑Buyback Transactions | Total Borrowings and Other Financing Transactions | Collateral Pledged/(Received) | Net Exposure(2) | ||||||||||||||||||
| Global/Master Repurchase Agreement | ||||||||||||||||||||||||
| FICC | $ | 1,566 | $ | 0 | $ | 0 | $ | 1,566 | $ | (1,597 | ) | $ | (31 | ) | ||||||||||
Total Borrowings and Other Financing Transactions | $ | 1,566 | $ | 0 | $ | 0 | ||||||||||||||||||
| (1) | Includes accrued interest. |
| (2) | Net Exposure represents the net receivable/(payable) that would be due from/to the counterparty in the event of default. Exposure from borrowings and other financing transactions can only be netted across transactions governed under the same master agreement with the same legal entity. See Note 7, Master Netting Arrangements, in the Notes to Financial Statements for more information. |
| Category and Subcategory | Level 1 | Level 2 | Level 3 | Fair Value at 12/31/2022 | ||||||||||||
Investments in Securities, at Value | ||||||||||||||||
| Municipal Bonds & Notes | ||||||||||||||||
| Arizona | $ | 0 | $ | 511 | $ | 0 | $ | 511 | ||||||||
| California | 0 | 272,060 | 0 | 272,060 | ||||||||||||
| Delaware | 0 | 2,434 | 0 | 2,434 | ||||||||||||
| Illinois | 0 | 8,374 | 0 | 8,374 | ||||||||||||
| Indiana | 0 | 1,579 | 0 | 1,579 | ||||||||||||
| North Dakota | 0 | 314 | 0 | 314 | ||||||||||||
| Pennsylvania | 0 | 1,140 | 0 | 1,140 | ||||||||||||
| Puerto Rico | 0 | 12,519 | 0 | 12,519 | ||||||||||||
| Category and Subcategory | Level 1 | Level 2 | Level 3 | Fair Value at 12/31/2022 | ||||||||||||
| Texas | $ | 0 | $ | 818 | $ | 0 | $ | 818 | ||||||||
| U.S. Virgin Islands | 0 | 1,620 | 0 | 1,620 | ||||||||||||
| Virginia | 0 | 1,192 | 0 | 1,192 | ||||||||||||
| Wisconsin | 0 | 777 | 0 | 777 | ||||||||||||
| Short-Term Instruments | ||||||||||||||||
| Repurchase Agreements | 0 | 1,566 | 0 | 1,566 | ||||||||||||
| Total Investments | $ | 0 | $ | 304,904 | $ | 0 | $ | 304,904 | ||||||||
| See Accompanying Notes | ANNUAL REPORT | | | DECEMBER 31, 2022 | 63 |
| Schedule of Investments | PIMCO New York Municipal Income Fund |
| PRINCIPAL AMOUNT (000S) | MARKET VALUE (000S) | |||||||||||
| INVESTMENTS IN SECURITIES 168.1% | ||||||||||||
| MUNICIPAL BONDS & NOTES 167.9% | ||||||||||||
| ARIZONA 0.3% | ||||||||||||
Arizona Industrial Development Authority Revenue Bonds, Series 2020 | ||||||||||||
| 7.750% due 07/01/2050 | $ | 300 | $ | 210 | ||||||||
| CALIFORNIA 2.8% | ||||||||||||
California Health Facilities Financing Authority Revenue Bonds, Series 2016 | ||||||||||||
| 5.000% due 11/15/2046 (e) | 1,500 | 1,575 | ||||||||||
Los Angeles County, California Public Works Financing Authority Revenue Bonds, Series 2021 | ||||||||||||
| 4.000% due 12/01/2046 | 380 | 360 | ||||||||||
| 1,935 | ||||||||||||
| DELAWARE 1.5% | ||||||||||||
Affordable Housing Opportunities Trust, Delaware Revenue Bonds, Series 2022 | ||||||||||||
| 3.167% due 10/01/2038 | 980 | 836 | ||||||||||
| 7.120% due 10/01/2038 | 175 | 168 | ||||||||||
| 1,004 | ||||||||||||
| INDIANA 1.0% | ||||||||||||
Indiana Finance Authority Revenue Bonds, Series 2022 | ||||||||||||
| 4.500% due 12/15/2046 | 650 | 650 | ||||||||||
| NEW YORK 149.3% | ||||||||||||
Brookhaven Local Development Corp., New York Revenue Bonds, Series 2020 | ||||||||||||
| 4.000% due 11/01/2055 | 600 | 471 | ||||||||||
Broome County, New York Local Development Corp. Revenue Bonds, (AGM Insured), Series 2020 | ||||||||||||
| 4.000% due 04/01/2050 | 750 | 659 | ||||||||||
Build NYC Resource Corp., New York Revenue Bonds, Series 2018 | ||||||||||||
| 5.625% due 12/01/2050 | 1,205 | 1,135 | ||||||||||
Build NYC Resource Corp., New York Revenue Bonds, Series 2023 | ||||||||||||
| 5.250% due 07/01/2062 (a) | 750 | 753 | ||||||||||
Dutchess County, New York Local Development Corp. Revenue Bonds, Series 2020 | ||||||||||||
| 5.000% due 07/01/2045 | 410 | 435 | ||||||||||
Dutchess County, New York Local Development Corp. Revenue Bonds, Series 2022 | ||||||||||||
| 4.000% due 07/01/2049 | 765 | 709 | ||||||||||
Housing Development Corp., New York Revenue Bonds, Series 2017 | ||||||||||||
| 3.700% due 11/01/2047 | 1,000 | 821 | ||||||||||
Hudson Yards Infrastructure Corp., New York Revenue Bonds, Series 2021 | ||||||||||||
| 4.000% due 02/15/2039 | 1,000 | 970 | ||||||||||
Huntington Local Development Corp., New York Revenue Bonds, Series 2021 | ||||||||||||
| 5.250% due 07/01/2056 | 500 | 383 | ||||||||||
Long Island Power Authority, New York Revenue Bonds, Series 2020 | ||||||||||||
| 4.000% due 09/01/2039 | 500 | 495 | ||||||||||
Metropolitan Transportation Authority, New York Revenue Bonds, Series 2014 | ||||||||||||
| 5.000% due 11/15/2039 | 1,000 | 995 | ||||||||||
Metropolitan Transportation Authority, New York Revenue Bonds, Series 2016 | ||||||||||||
| 5.000% due 11/15/2031 (e) | 6,500 | 6,691 | ||||||||||
Metropolitan Transportation Authority, New York Revenue Bonds, Series 2017 | ||||||||||||
| 4.000% due 11/15/2035 | 1,000 | 922 | ||||||||||
| 4.000% due 11/15/2042 | 1,000 | 868 | ||||||||||
| PRINCIPAL AMOUNT (000S) | MARKET VALUE (000S) | |||||||||||
Monroe County Industrial Development Corp., New York Revenue Bonds, Series 2020 | ||||||||||||
| 4.000% due 12/01/2046 | $ | 825 | $ | 718 | ||||||||
Nassau County, New York General Obligation Bonds, (AGM Insured), Series 2018 | ||||||||||||
| 5.000% due 04/01/2036 | 2,000 | 2,158 | ||||||||||
Nassau County, New York Industrial Development Agency Revenue Bonds, Series 2021 | ||||||||||||
| 5.000% due 01/01/2058 | 1,092 | 534 | ||||||||||
Nassau County, New York Tobacco Settlement Corp. Revenue Bonds, Series 2006 | ||||||||||||
| 5.125% due 06/01/2046 | 1,230 | 1,128 | ||||||||||
New York City Transitional Finance Authority Building Aid, New York Revenue Bonds, Series 2018 | ||||||||||||
| 5.250% due 07/15/2036 | 1,000 | 1,100 | ||||||||||
New York City Transitional Finance Authority Future Tax Secured, New York Revenue Bonds, Series 2019 | ||||||||||||
| 4.000% due 05/01/2044 | 2,500 | 2,353 | ||||||||||
| 5.000% due 11/01/2043 | 1,030 | 1,100 | ||||||||||
New York City Water & Sewer System, New York Revenue Bonds, Series 2003 | ||||||||||||
| 3.350% due 06/15/2035 | 4,750 | 4,750 | ||||||||||
New York City Water & Sewer System, New York Revenue Bonds, Series 2016 | ||||||||||||
| 4.000% due 06/15/2046 | 830 | 781 | ||||||||||
New York City Water & Sewer System, New York Revenue Bonds, Series 2019 | ||||||||||||
| 5.000% due 06/15/2049 | 2,000 | 2,117 | ||||||||||
New York City, New York General Obligation Bonds, Series 2010 | ||||||||||||
| 3.620% due 03/01/2039 | 855 | 855 | ||||||||||
New York City, New York General Obligation Bonds, Series 2013 | ||||||||||||
| 5.000% due 08/01/2031 | 2,000 | 2,020 | ||||||||||
New York City, New York General Obligation Bonds, Series 2016 | ||||||||||||
| 3.580% due 08/01/2044 | 1,000 | 1,000 | ||||||||||
New York City, New York General Obligation Bonds, Series 2018 | ||||||||||||
| 5.000% due 04/01/2043 | 1,500 | 1,579 | ||||||||||
| 5.000% due 04/01/2045 | 1,300 | 1,365 | ||||||||||
New York City, New York General Obligation Bonds, Series 2019 | ||||||||||||
| 5.000% due 08/01/2039 | 1,000 | 1,068 | ||||||||||
New York City, New York Health and Hospitals Corp. Revenue Bonds, Series 2021 | ||||||||||||
| 4.000% due 02/15/2048 | 880 | 845 | ||||||||||
New York City, New York Housing Development Corp. Revenue Bonds, Series 2006 | ||||||||||||
| 3.630% due 03/15/2036 | 300 | 300 | ||||||||||
New York City, New York Transitional Finance Authority Future Tax Secured Revenue Bonds, Series 2022 | ||||||||||||
| 5.250% due 11/01/2048 | 3,500 | 3,828 | ||||||||||
| 5.500% due 11/01/2045 | 500 | 563 | ||||||||||
New York City, New York Water & Sewer System Revenue Bonds, Series 2007 | ||||||||||||
| 3.600% due 06/15/2036 | 1,000 | 1,000 | ||||||||||
New York County, New York Tobacco Trust Revenue Bonds, Series 2005 | ||||||||||||
| 0.000% due 06/01/2050 (c) | 20,000 | 3,967 | ||||||||||
| 0.000% due 06/01/2055 (c) | 7,000 | 496 | ||||||||||
New York Liberty Development Corp. Revenue Bonds, Series 2005 | ||||||||||||
| 5.250% due 10/01/2035 | 770 | 847 | ||||||||||
New York Liberty Development Corp. Revenue Bonds, Series 2014 | ||||||||||||
| 5.000% due 11/15/2044 | 1,900 | 1,730 | ||||||||||
New York Power Authority Revenue Bonds, Series 2020 | ||||||||||||
| 4.000% due 11/15/2055 | 1,500 | 1,357 | ||||||||||
New York State Dormitory Authority Memorial Sloan-Kettering Cancer Revenue Bonds, Series 2022 | ||||||||||||
| 4.000% due 07/01/2051 | 1,200 | 1,123 | ||||||||||
| PRINCIPAL AMOUNT (000S) | MARKET VALUE (000S) | |||||||||||
New York State Dormitory Authority Revenue Bonds, (AGM/CR Insured), Series 2022 | ||||||||||||
| 4.250% due 05/01/2052 | $ | 850 | $ | 820 | ||||||||
New York State Dormitory Authority Revenue Bonds, Series 2013 | ||||||||||||
| 5.000% due 02/15/2029 | 1,000 | 1,002 | ||||||||||
New York State Dormitory Authority Revenue Bonds, Series 2017 | ||||||||||||
| 4.000% due 02/15/2047 | 500 | 468 | ||||||||||
| 5.000% due 12/01/2031 | 500 | 512 | ||||||||||
New York State Dormitory Authority Revenue Bonds, Series 2018 | ||||||||||||
| 4.000% due 03/15/2043 | 1,000 | 953 | ||||||||||
| 5.000% due 03/15/2037 | 3,000 | 3,219 | ||||||||||
New York State Dormitory Authority Revenue Bonds, Series 2019 | ||||||||||||
| 5.000% due 03/15/2041 | 2,000 | 2,118 | ||||||||||
New York State Dormitory Authority Revenue Bonds, Series 2020 | ||||||||||||
| 4.000% due 07/01/2050 | 3,855 | 3,563 | ||||||||||
New York State Dormitory Authority Revenue Bonds, Series 2021 | ||||||||||||
| 4.000% due 03/15/2042 | 1,000 | 960 | ||||||||||
New York State Dormitory Authority Revenue Bonds, Series 2022 | ||||||||||||
| 4.000% due 07/01/2049 | 345 | 304 | ||||||||||
| 5.000% due 07/15/2050 | 345 | 347 | ||||||||||
New York State Environmental Facilities Corp. Revenue Bonds, Series 2022 | ||||||||||||
| 4.000% due 06/15/2047 | 1,750 | 1,706 | ||||||||||
New York State Housing Finance Agency Revenue Bonds, (FHA Insured), Series 2020 | ||||||||||||
| 4.200% due 11/01/2054 (f) | 2,000 | 1,786 | ||||||||||
New York State Housing Finance Agency Revenue Bonds, Series 2010 | ||||||||||||
| 3.610% due 05/01/2044 | 1,000 | 1,000 | ||||||||||
New York State Urban Development Corp. Revenue Bonds, Series 2004 | ||||||||||||
| 3.640% due 03/15/2033 | 3,500 | 3,500 | ||||||||||
New York State Urban Development Corp. Revenue Bonds, Series 2019 | ||||||||||||
| 5.000% due 03/15/2041 | 500 | 535 | ||||||||||
New York State Urban Development Corp. Revenue Bonds, Series 2020 | ||||||||||||
| 5.000% due 03/15/2047 | 1,500 | 1,589 | ||||||||||
New York State Urban Development Corp. Revenue Bonds, Series 2021 | ||||||||||||
| 4.000% due 03/15/2047 | 1,000 | 940 | ||||||||||
New York Transportation Development Corp. Revenue Bonds, Series 2016 | ||||||||||||
| 5.250% due 01/01/2050 | 855 | 832 | ||||||||||
New York Transportation Development Corp. Revenue Bonds, Series 2022 | ||||||||||||
| 4.000% due 12/01/2042 | 1,670 | 1,482 | ||||||||||
Onondaga County, New York Trust for Cultural Resources Revenue Bonds, Series 2019 | ||||||||||||
| 4.000% due 12/01/2049 | 1,300 | 1,215 | ||||||||||
| 5.000% due 12/01/2040 | 350 | 383 | ||||||||||
Port Authority of New York & New Jersey Revenue Bonds, Series 2017 | ||||||||||||
| 5.250% due 10/15/2057 | 4,500 | 4,695 | ||||||||||
Port Authority of New York & New Jersey Revenue Bonds, Series 2020 | ||||||||||||
| 4.000% due 07/15/2060 | 350 | 299 | ||||||||||
Schenectady County Capital Resource Corp. Union College Project, New York Revenue Bonds Series 2022 | ||||||||||||
| 5.000% due 07/01/2032 | 340 | 393 | ||||||||||
Suffolk County, New York Economic Development Corp. Revenue Bonds, Series 2021 | ||||||||||||
| 5.125% due 11/01/2041 | 350 | 275 | ||||||||||
Suffolk Tobacco Asset Securitization Corp., New York Revenue Bonds, Series 2021 | ||||||||||||
| 0.000% due 06/01/2066 (c) | 5,000 | 518 | ||||||||||
| 4.000% due 06/01/2050 | 500 | 418 | ||||||||||
| 64 | PIMCO CLOSED-END FUNDS | See Accompanying Notes |
| December 31, 2022 |
| PRINCIPAL AMOUNT (000S) | MARKET VALUE (000S) | |||||||||||
The Genesee County Funding Corporation Tax‑Exempt, New York Revenue Bonds, Series 2022 | ||||||||||||
| 5.250% due 12/01/2052 | $ | 1,000 | $ | 1,013 | ||||||||
Triborough Bridge & Tunnel Authority Sales Tax, New York Revenue Bonds, Series 2022 | ||||||||||||
| 4.000% due 05/15/2057 | 1,250 | 1,167 | ||||||||||
Triborough Bridge & Tunnel Authority, New York Revenue Bonds, Series 2018 | ||||||||||||
| 4.000% due 11/15/2048 | 1,000 | 919 | ||||||||||
Triborough Bridge & Tunnel Authority, New York Revenue Bonds, Series 2019 | ||||||||||||
| 5.000% due 11/15/2041 | 840 | 897 | ||||||||||
| 5.000% due 11/15/2043 | 500 | 532 | ||||||||||
Triborough Bridge & Tunnel Authority, New York Revenue Bonds, Series 2021 | ||||||||||||
| 5.000% due 05/15/2051 | 1,000 | 1,062 | ||||||||||
Troy Capital Resource Corp., New York Revenue Bonds, Series 2020 | ||||||||||||
| 5.000% due 09/01/2034 | 1,200 | 1,292 | ||||||||||
TSASC, Inc., New York Revenue Bonds, Series 2017 | ||||||||||||
| 5.000% due 06/01/2041 | 2,000 | 2,019 | ||||||||||
Ulster County, New York Capital Resource Corp. Revenue Bonds, Series 2017 | ||||||||||||
| 5.250% due 09/15/2047 | 500 | 379 | ||||||||||
| 102,101 | ||||||||||||
| NORTH DAKOTA 0.2% | ||||||||||||
Grand Forks County, North Dakota Revenue Bonds, Series 2021 | ||||||||||||
| 7.000% due 12/15/2043 ^(b) | 230 | 126 | ||||||||||
| PENNSYLVANIA 0.7% | ||||||||||||
Pennsylvania Economic Development Financing Authority Revenue Bonds, Series 2021 | ||||||||||||
| 9.000% due 04/01/2051 | 425 | 482 | ||||||||||
| PRINCIPAL AMOUNT (000S) | MARKET VALUE (000S) | |||||||||||
| PUERTO RICO 7.8% | ||||||||||||
Children’s Trust Fund, Puerto Rico Revenue Bonds, Series 2008 | ||||||||||||
| 0.000% due 05/15/2057 (c) | $ | 7,700 | $ | 474 | ||||||||
Commonwealth of Puerto Rico Bonds, Series 2022 | ||||||||||||
| 0.000% due 11/01/2043 (c) | 1,063 | 466 | ||||||||||
| 0.000% due 11/01/2051 (c) | 1,283 | 513 | ||||||||||
Commonwealth of Puerto Rico General Obligation Bonds, Series 2021 | ||||||||||||
| 4.000% due 07/01/2041 | 450 | 354 | ||||||||||
Commonwealth of Puerto Rico General Obligation Notes, Series 2021 | ||||||||||||
| 0.000% due 07/01/2024 (c) | 38 | 35 | ||||||||||
| 5.625% due 07/01/2027 | 245 | 250 | ||||||||||
Puerto Rico Highway & Transportation Authority Revenue Bonds, Series 2022 | ||||||||||||
| 0.000% due 07/01/2032 (c) | 81 | 48 | ||||||||||
| 0.000% due 07/01/2053 (d) | 434 | 241 | ||||||||||
| 5.000% due 07/01/2062 | 125 | 115 | ||||||||||
Puerto Rico Sales Tax Financing Corp. Sales Tax Revenue Bonds, Series 2018 | ||||||||||||
| 0.000% due 07/01/2051 (c) | 2,580 | 468 | ||||||||||
Puerto Rico Sales Tax Financing Corp. Sales Tax Revenue Bonds, Series 2019 | ||||||||||||
| 4.784% due 07/01/2058 | 2,760 | 2,401 | ||||||||||
| 5,365 | ||||||||||||
| TEXAS 1.5% | ||||||||||||
Angelina & Neches River Authority, Texas Revenue Bonds, Series 2021 | ||||||||||||
| 7.500% due 12/01/2045 | 160 | 105 | ||||||||||
| 12.000% due 12/01/2045 | 275 | 238 | ||||||||||
Texas Water Development Board Revenue Bonds, Series 2022 | ||||||||||||
| 5.000% due 10/15/2057 | 650 | 701 | ||||||||||
| 1,044 | ||||||||||||
| PRINCIPAL AMOUNT (000S) | MARKET VALUE (000S) | |||||||||||
| U.S. VIRGIN ISLANDS 1.0% | ||||||||||||
Matching Fund Special Purpose Securitization Corp., U.S. Virgin Islands Revenue Bonds, Series 2022 | ||||||||||||
| 5.000% due 10/01/2039 | $ | 665 | $ | 667 | ||||||||
| VIRGINIA 1.1% | ||||||||||||
Virginia Small Business Financing Authority Revenue Bonds, Series 2019 | ||||||||||||
| 0.000% due 07/01/2061 (c) | 6,000 | 290 | ||||||||||
| 5.500% due 07/01/2044 | 500 | 468 | ||||||||||
| 758 | ||||||||||||
| WISCONSIN 0.7% | ||||||||||||
Wisconsin Health & Educational Facilities Authority Revenue Bonds, Series 2022 | ||||||||||||
| 4.000% due 12/01/2051 | 525 | 465 | ||||||||||
Total Municipal Bonds & Notes (Cost $120,845) | 114,807 | |||||||||||
| SHORT-TERM INSTRUMENTS 0.2% | ||||||||||||
| REPURCHASE AGREEMENTS (g) 0.2% | ||||||||||||
| 153 | ||||||||||||
| Total Short-Term Instruments (Cost $153) | 153 | |||||||||||
| Total Investments in Securities (Cost $120,998) | 114,960 | |||||||||||
| Total Investments 168.1% (Cost $120,998) | $ | 114,960 | ||||||||||
Auction Rate Preferred Shares (60.0)% | (41,025 | ) | ||||||||||
| Other Assets and Liabilities, net (8.1)% | (5,538 | ) | ||||||||||
| Net Assets Applicable to Common Shareholders 100.0% | $ | 68,397 | ||||||||||
| * | A zero balance may reflect actual amounts rounding to less than one thousand. |
| ^ | Security is in default. |
| (a) | When-issued security. |
| (b) | Security is not accruing income as of the date of this report. |
| (c) | Zero coupon security. |
| (d) | Security becomes interest bearing at a future date. |
| (e) | Represents an underlying municipal bond transferred to a tender option bond trust established in a tender option bond transaction in which the Fund sold, or caused the sale of, the underlying municipal bond and purchased the residual interest certificate. The security serves as collateral in a financing transaction. See Note 5, Tender Option Bond Transactions, in the Notes to Financial Statements for more information. |
| Issuer Description | Coupon | Maturity Date | Acquisition Date | Cost | Market Value | Market Value as Percentage of Net Assets Applicable to Common Shareholders | ||||||||||||||||||
| New York State Housing Finance Agency Revenue Bonds, (FHA Insured), Series 2020 | 4.200% | 11/01/2054 | 11/18/2021 | $ | 2,258 | $ | 1,786 | 2.61% | ||||||||||||||||
| See Accompanying Notes | ANNUAL REPORT | | | DECEMBER 31, 2022 | 65 |
| Schedule of Investments | PIMCO New York Municipal Income Fund | (Cont.) | December 31, 2022 |
| Counterparty | Lending Rate | Settlement Date | Maturity Date | Principal Amount | Collateralized By | Collateral (Received) | Repurchase Agreements, at Value | Repurchase Agreement Proceeds to be Received(1) | ||||||||||||||||||||||
| FICC | 1.900 | % | 12/30/2022 | 01/03/2023 | $ | 153 | U.S. Treasury Notes 0.125% due 05/15/2023 | $ | (156 | ) | $ | 153 | $ | 153 | ||||||||||||||||
Total Repurchase Agreements | $ | (156 | ) | $ | 153 | $ | 153 | |||||||||||||||||||||||
| Counterparty | Repurchase Agreement Proceeds to be Received(1) | Payable for Reverse Repurchase Agreements | Payable for Sale‑Buyback Transactions | Total Borrowings and Other Financing Transactions | Collateral Pledged/(Received) | Net Exposure(2) | ||||||||||||||||||
| Global/Master Repurchase Agreement | ||||||||||||||||||||||||
| FICC | $ | 153 | $ | 0 | $ | 0 | $ | 153 | $ | (156 | ) | $ | (3 | ) | ||||||||||
Total Borrowings and Other Financing Transactions | $ | 153 | $ | 0 | $ | 0 | ||||||||||||||||||
| (1) | Includes accrued interest. |
| (2) | Net Exposure represents the net receivable/(payable) that would be due from/to the counterparty in the event of default. Exposure from borrowings and other financing transactions can only be netted across transactions governed under the same master agreement with the same legal entity. See Note 7, Master Netting Arrangements, in the Notes to Financial Statements for more information. |
| Category and Subcategory | Level 1 | Level 2 | Level 3 | Fair Value at 12/31/2022 | ||||||||||||
Investments in Securities, at Value | ||||||||||||||||
| Municipal Bonds & Notes | ||||||||||||||||
| Arizona | $ | 0 | $ | 210 | $ | 0 | $ | 210 | ||||||||
| California | 0 | 1,935 | 0 | 1,935 | ||||||||||||
| Delaware | 0 | 1,004 | 0 | 1,004 | ||||||||||||
| Indiana | 0 | 650 | 0 | 650 | ||||||||||||
| New York | 0 | 102,101 | 0 | 102,101 | ||||||||||||
| North Dakota | 0 | 126 | 0 | 126 | ||||||||||||
| Pennsylvania | 0 | 482 | 0 | 482 | ||||||||||||
| Puerto Rico | 0 | 5,365 | 0 | 5,365 | ||||||||||||
| Category and Subcategory | Level 1 | Level 2 | Level 3 | Fair Value at 12/31/2022 | ||||||||||||
| Texas | $ | 0 | $ | 1,044 | $ | 0 | $ | 1,044 | ||||||||
| U.S. Virgin Islands | 0 | 667 | 0 | 667 | ||||||||||||
| Virginia | 0 | 758 | 0 | 758 | ||||||||||||
| Wisconsin | 0 | 465 | 0 | 465 | ||||||||||||
| Short-Term Instruments | ||||||||||||||||
| Repurchase Agreements | 0 | 153 | 0 | 153 | ||||||||||||
| Total Investments | $ | 0 | $ | 114,960 | $ | 0 | $ | 114,960 | ||||||||
| 66 | PIMCO CLOSED-END FUNDS | See Accompanying Notes |
| Schedule of Investments | PIMCO New York Municipal Income Fund II | December 31, 2022 |
| PRINCIPAL AMOUNT (000S) | MARKET VALUE (000S) | |||||||||||
| INVESTMENTS IN SECURITIES 177.4% | ||||||||||||
| MUNICIPAL BONDS & NOTES 176.5% | ||||||||||||
| ARIZONA 0.3% | ||||||||||||
Arizona Industrial Development Authority Revenue Bonds, Series 2020 | ||||||||||||
| 7.750% due 07/01/2050 | $ | 400 | $ | 280 | ||||||||
| CALIFORNIA 0.5% | ||||||||||||
Los Angeles County, California Public Works Financing Authority Revenue Bonds, Series 2021 | ||||||||||||
| 4.000% due 12/01/2046 | 515 | 488 | ||||||||||
| DELAWARE 1.5% | ||||||||||||
Affordable Housing Opportunities Trust, Delaware Revenue Bonds, Series 2022 | ||||||||||||
| 3.167% due 10/01/2038 | 1,330 | 1,135 | ||||||||||
| 7.120% due 10/01/2038 | 235 | 225 | ||||||||||
| 1,360 | ||||||||||||
| ILLINOIS 3.4% | ||||||||||||
Chicago, Illinois General Obligation Bonds, Series 2017 | ||||||||||||
| 6.000% due 01/01/2038 | 2,000 | 2,111 | ||||||||||
Illinois State General Obligation Notes, Series 2017 | ||||||||||||
| 5.000% due 11/01/2025 | 1,000 | 1,025 | ||||||||||
| 3,136 | ||||||||||||
| INDIANA 0.9% | ||||||||||||
Indiana Finance Authority Revenue Bonds, Series 2022 | ||||||||||||
| 4.500% due 12/15/2046 | 850 | 850 | ||||||||||
| NEW YORK 157.4% | ||||||||||||
Battery Park City Authority, New York Revenue Bonds, Series 2019 | ||||||||||||
| 3.600% due 11/01/2038 | 995 | 995 | ||||||||||
Brookhaven Local Development Corp., New York Revenue Bonds, Series 2020 | ||||||||||||
| 4.000% due 11/01/2055 | 800 | 629 | ||||||||||
Build NYC Resource Corp., New York Revenue Bonds, Series 2018 | ||||||||||||
| 5.625% due 12/01/2050 | 1,770 | 1,667 | ||||||||||
Build NYC Resource Corp., New York Revenue Bonds, Series 2023 | ||||||||||||
| 5.250% due 07/01/2062 (a) | 1,250 | 1,254 | ||||||||||
Dutchess County, New York Local Development Corp. Revenue Bonds, Series 2015 | ||||||||||||
| 5.000% due 07/01/2045 | 3,000 | 3,063 | ||||||||||
Dutchess County, New York Local Development Corp. Revenue Bonds, Series 2016 | ||||||||||||
| 4.000% due 07/01/2041 | 3,200 | 2,802 | ||||||||||
| 5.000% due 07/01/2046 | 1,000 | 1,001 | ||||||||||
Housing Development Corp., New York Revenue Bonds, Series 2017 | ||||||||||||
| 3.700% due 11/01/2047 | 1,000 | 821 | ||||||||||
Hudson Yards Infrastructure Corp., New York Revenue Bonds, Series 2021 | ||||||||||||
| 4.000% due 02/15/2039 | 1,500 | 1,455 | ||||||||||
Huntington Local Development Corp., New York Revenue Bonds, Series 2021 | ||||||||||||
| 5.250% due 07/01/2056 | 700 | 536 | ||||||||||
Long Island Power Authority, New York Revenue Bonds, Series 2014 | ||||||||||||
| 5.000% due 09/01/2044 | 3,500 | 3,546 | ||||||||||
Metropolitan Transportation Authority, New York Revenue Bonds, Series 2005 | ||||||||||||
| 3.620% due 11/01/2035 | 1,700 | 1,700 | ||||||||||
Metropolitan Transportation Authority, New York Revenue Bonds, Series 2014 | ||||||||||||
| 5.000% due 11/15/2039 | 1,500 | 1,492 | ||||||||||
| PRINCIPAL AMOUNT (000S) | MARKET VALUE (000S) | |||||||||||
Metropolitan Transportation Authority, New York Revenue Bonds, Series 2016 | ||||||||||||
| 5.250% due 11/15/2056 | $ | 1,200 | $ | 1,201 | ||||||||
Metropolitan Transportation Authority, New York Revenue Bonds, Series 2017 | ||||||||||||
| 4.000% due 11/15/2035 | 3,500 | 3,226 | ||||||||||
Monroe County Industrial Development Corp., New York Revenue Bonds, Series 2013 | ||||||||||||
| 5.000% due 07/01/2043 | 1,750 | 1,768 | ||||||||||
Monroe County Industrial Development Corp., New York Revenue Bonds, Series 2017 | ||||||||||||
| 4.000% due 12/01/2041 | 1,400 | 1,242 | ||||||||||
Monroe County Industrial Development Corp., New York Revenue Bonds, Series 2020 | ||||||||||||
| 4.000% due 12/01/2046 | 1,140 | 991 | ||||||||||
Nassau County, New York General Obligation Bonds, Series 2022 | ||||||||||||
| 4.250% due 04/01/2052 | 2,245 | 2,114 | ||||||||||
Nassau County, New York Industrial Development Agency Revenue Bonds, Series 1999 | ||||||||||||
| 3.450% due 01/01/2034 | 1,975 | 1,975 | ||||||||||
Nassau County, New York Industrial Development Agency Revenue Bonds, Series 2021 | ||||||||||||
| 5.000% due 01/01/2058 | 1,638 | 801 | ||||||||||
Nassau County, New York Tobacco Settlement Corp. Revenue Bonds, Series 2006 | ||||||||||||
| 5.125% due 06/01/2046 | 4,000 | 3,669 | ||||||||||
New York City Municipal Water Finance Authority, New York Revenue Bonds, (BABs), Series 2009 | ||||||||||||
| 3.620% due 06/15/2041 | 1,300 | 1,300 | ||||||||||
New York City Transitional Finance Authority Building Aid, New York Revenue Bonds, Series 2016 | ||||||||||||
| 4.000% due 07/15/2040 | 1,000 | 969 | ||||||||||
New York City Transitional Finance Authority Future Tax Secured, New York Revenue Bonds, Series 2017 | ||||||||||||
| 4.000% due 02/01/2044 | 2,000 | 1,884 | ||||||||||
New York City Transitional Finance Authority Future Tax Secured, New York Revenue Bonds, Series 2018 | ||||||||||||
| 4.000% due 08/01/2041 | 685 | 656 | ||||||||||
New York City Transitional Finance Authority Future Tax Secured, New York Revenue Bonds, Series 2019 | ||||||||||||
| 4.000% due 05/01/2044 | 1,500 | 1,412 | ||||||||||
New York City Transitional Finance Authority Future Tax Secured, New York Revenue Bonds, Series 2020 | ||||||||||||
| 4.000% due 05/01/2047 | 1,550 | 1,431 | ||||||||||
New York City Water & Sewer System, New York Revenue Bonds, Series 2016 | ||||||||||||
| 4.000% due 06/15/2046 | 1,130 | 1,063 | ||||||||||
New York City Water & Sewer System, New York Revenue Bonds, Series 2018 | ||||||||||||
| 5.000% due 06/15/2040 | 2,300 | 2,441 | ||||||||||
New York City Water & Sewer System, New York Revenue Bonds, Series 2019 | ||||||||||||
| 5.000% due 06/15/2049 | 2,645 | 2,800 | ||||||||||
New York City, New York Housing Development Corp. Revenue Bonds, Series 2006 | ||||||||||||
| 3.630% due 03/15/2036 | 300 | 300 | ||||||||||
New York City, New York Municipal Water Finance Authority Revenue Bonds, Series 2022 | ||||||||||||
| 4.000% due 06/15/2033 | 1,000 | 1,000 | ||||||||||
New York City, New York Transitional Finance Authority Future Tax Secured Revenue Bonds, Series 2022 | ||||||||||||
| 5.500% due 11/01/2045 | 750 | 845 | ||||||||||
New York Convention Center Development Corp. Revenue Bonds, Series 2015 | ||||||||||||
| 4.000% due 11/15/2045 | 230 | 217 | ||||||||||
| 5.000% due 11/15/2045 | 1,000 | 989 | ||||||||||
New York County, New York Tobacco Trust Revenue Bonds, Series 2005 | ||||||||||||
| 0.000% due 06/01/2050 (c) | 30,000 | 5,951 | ||||||||||
| 0.000% due 06/01/2055 (c) | 9,000 | 637 | ||||||||||
New York County, New York Tobacco Trust Revenue Bonds, Series 2016 | ||||||||||||
| 5.000% due 06/01/2036 | 1,000 | 1,014 | ||||||||||
| 5.000% due 06/01/2041 | 1,000 | 1,010 | ||||||||||
| PRINCIPAL AMOUNT (000S) | MARKET VALUE (000S) | |||||||||||
New York Liberty Development Corp. Revenue Bonds, Series 2005 | ||||||||||||
| 5.250% due 10/01/2035 | $ | 3,130 | $ | 3,441 | ||||||||
New York Liberty Development Corp. Revenue Bonds, Series 2014 | ||||||||||||
| 5.000% due 11/15/2044 | 4,000 | 3,643 | ||||||||||
New York Power Authority Revenue Bonds, Series 2020 | ||||||||||||
| 4.000% due 11/15/2055 | 2,135 | 1,931 | ||||||||||
New York State Dormitory Authority Memorial Sloan-Kettering Cancer Revenue Bonds, Series 2022 | ||||||||||||
| 4.000% due 07/01/2051 | 1,500 | 1,404 | ||||||||||
New York State Dormitory Authority Revenue Bonds, (AMBAC Insured), Series 2005 | ||||||||||||
| 5.500% due 05/15/2031 | 3,490 | 4,118 | ||||||||||
New York State Dormitory Authority Revenue Bonds, Series 2017 | ||||||||||||
| 4.000% due 02/15/2047 | 750 | 702 | ||||||||||
| 5.000% due 12/01/2030 | 1,000 | 1,023 | ||||||||||
| 5.000% due 12/01/2033 | 800 | 804 | ||||||||||
New York State Dormitory Authority Revenue Bonds, Series 2018 | ||||||||||||
| 4.000% due 08/01/2037 | 2,750 | 2,431 | ||||||||||
| 4.000% due 03/15/2043 | 2,000 | 1,907 | ||||||||||
| 5.000% due 03/15/2044 | 2,625 | 2,751 | ||||||||||
New York State Dormitory Authority Revenue Bonds, Series 2019 | ||||||||||||
| 5.000% due 03/15/2041 | 1,000 | 1,059 | ||||||||||
| 5.000% due 07/01/2042 | 1,000 | 1,081 | ||||||||||
| 5.000% due 03/15/2047 | 2,000 | 2,095 | ||||||||||
New York State Dormitory Authority Revenue Bonds, Series 2020 | ||||||||||||
| 4.000% due 02/15/2040 | 1,500 | 1,459 | ||||||||||
| 4.000% due 07/01/2050 | 4,665 | 4,311 | ||||||||||
New York State Dormitory Authority Revenue Bonds, Series 2022 | ||||||||||||
| 4.000% due 07/01/2049 | 465 | 410 | ||||||||||
| 5.000% due 07/15/2050 | 465 | 467 | ||||||||||
New York State Environmental Facilities Corp. Revenue Bonds, Series 2022 | ||||||||||||
| 4.000% due 06/15/2047 | 2,250 | 2,194 | ||||||||||
New York State Housing Finance Agency Revenue Bonds, (FHA Insured), Series 2020 | ||||||||||||
| 4.200% due 11/01/2054 (e) | 2,600 | 2,322 | ||||||||||
New York State Thruway Authority Revenue Bonds, Series 2016 | ||||||||||||
| 5.250% due 01/01/2056 | 1,480 | 1,530 | ||||||||||
New York State Thruway Authority Revenue Bonds, Series 2018 | ||||||||||||
| 4.000% due 01/01/2036 | 1,000 | 1,006 | ||||||||||
New York State Thruway Authority Revenue Bonds, Series 2019 | ||||||||||||
| 4.000% due 01/01/2050 | 1,775 | 1,614 | ||||||||||
New York State Urban Development Corp. Revenue Bonds, Series 2004 | ||||||||||||
| 3.640% due 03/15/2033 | 900 | 900 | ||||||||||
New York State Urban Development Corp. Revenue Bonds, Series 2019 | ||||||||||||
| 5.000% due 03/15/2041 | 2,500 | 2,677 | ||||||||||
New York State Urban Development Corp. Revenue Bonds, Series 2020 | ||||||||||||
| 4.000% due 03/15/2049 | 2,000 | 1,833 | ||||||||||
New York State Urban Development Corp. Revenue Bonds, Series 2021 | ||||||||||||
| 4.000% due 03/15/2047 | 1,250 | 1,175 | ||||||||||
New York Transportation Development Corp. Revenue Bonds, Series 2016 | ||||||||||||
| 5.250% due 01/01/2050 | 1,165 | 1,134 | ||||||||||
New York Transportation Development Corp. Revenue Bonds, Series 2022 | ||||||||||||
| 4.000% due 12/01/2042 | 2,290 | 2,032 | ||||||||||
Niagara Tobacco Asset Securitization Corp., New York Revenue Bonds, Series 2014 | ||||||||||||
| 5.250% due 05/15/2034 | 500 | 503 | ||||||||||
| 5.250% due 05/15/2040 | 500 | 502 | ||||||||||
| See Accompanying Notes | ANNUAL REPORT | | | DECEMBER 31, 2022 | 67 |
| Schedule of Investments | PIMCO New York Municipal Income Fund II | (Cont.) |
| PRINCIPAL AMOUNT (000S) | MARKET VALUE (000S) | |||||||||||
Onondaga County, New York Trust for Cultural Resources Revenue Bonds, Series 2019 | ||||||||||||
| 5.000% due 12/01/2040 | $ | 1,450 | $ | 1,586 | ||||||||
| 5.000% due 12/01/2043 | 1,000 | 1,086 | ||||||||||
Port Authority of New York & New Jersey Revenue Bonds, Series 2017 | ||||||||||||
| 5.250% due 10/15/2057 | 6,865 | 7,162 | ||||||||||
Port Authority of New York & New Jersey Revenue Bonds, Series 2020 | ||||||||||||
| 4.000% due 07/15/2060 | 400 | 342 | ||||||||||
Schenectady County Capital Resource Corp. Union College Project, New York Revenue Bonds Series 2022 | ||||||||||||
| 5.000% due 07/01/2032 | 470 | 544 | ||||||||||
Suffolk County, New York Economic Development Corp. Revenue Bonds, Series 2021 | ||||||||||||
| 5.125% due 11/01/2041 | 475 | 373 | ||||||||||
Suffolk Tobacco Asset Securitization Corp., New York Revenue Bonds, Series 2021 | ||||||||||||
| 0.000% due 06/01/2066 (c) | 5,000 | 518 | ||||||||||
| 4.000% due 06/01/2050 | 750 | 627 | ||||||||||
Triborough Bridge & Tunnel Authority Sales Tax, New York Revenue Bonds, Series 2022 | ||||||||||||
| 4.000% due 05/15/2057 | 1,500 | 1,401 | ||||||||||
Triborough Bridge & Tunnel Authority, New York Revenue Bonds, Series 2018 | ||||||||||||
| 4.000% due 11/15/2048 | 2,800 | 2,574 | ||||||||||
Triborough Bridge & Tunnel Authority, New York Revenue Bonds, Series 2019 | ||||||||||||
| 5.000% due 11/15/2041 | 1,000 | 1,068 | ||||||||||
| 5.000% due 11/15/2043 | 750 | 798 | ||||||||||
Triborough Bridge & Tunnel Authority, New York Revenue Bonds, Series 2022 | ||||||||||||
| 5.000% due 05/15/2057 | 2,510 | 2,641 | ||||||||||
Troy Capital Resource Corp., New York Revenue Bonds, Series 2020 | ||||||||||||
| 5.000% due 09/01/2034 | 1,800 | 1,937 | ||||||||||
TSASC, Inc., New York Revenue Bonds, Series 2017 | ||||||||||||
| 5.000% due 06/01/2035 | 3,000 | 3,064 | ||||||||||
| 5.000% due 06/01/2041 | 500 | 505 | ||||||||||
Ulster County, New York Capital Resource Corp. Revenue Bonds, Series 2017 | ||||||||||||
| 5.250% due 09/15/2047 | 1,000 | 758 | ||||||||||
Westchester County, New York Local Development Corp. Revenue Bonds, Series 2014 | ||||||||||||
| 5.500% due 05/01/2042 | 1,000 | 1,004 | ||||||||||
| 146,314 | ||||||||||||
| PRINCIPAL AMOUNT (000S) | MARKET VALUE (000S) | |||||||||||
| NORTH DAKOTA 0.2% | ||||||||||||
Grand Forks County, North Dakota Revenue Bonds, Series 2021 | ||||||||||||
| 7.000% due 12/15/2043 ^(b) | $ | 320 | $ | 176 | ||||||||
| PENNSYLVANIA 0.7% | ||||||||||||
Pennsylvania Economic Development Financing Authority Revenue Bonds, Series 2021 | ||||||||||||
| 9.000% due 04/01/2051 | 560 | 635 | ||||||||||
| PUERTO RICO 7.4% | ||||||||||||
Children’s Trust Fund, Puerto Rico Revenue Bonds, Series 2008 | ||||||||||||
| 0.000% due 05/15/2057 (c) | 10,200 | 632 | ||||||||||
Commonwealth of Puerto Rico Bonds, Series 2022 | ||||||||||||
| 0.000% due 11/01/2043 (c) | 1,438 | 631 | ||||||||||
| 0.000% due 11/01/2051 (c) | 944 | 348 | ||||||||||
Commonwealth of Puerto Rico General Obligation Bonds, Series 2021 | ||||||||||||
| 4.000% due 07/01/2041 | 550 | 432 | ||||||||||
Commonwealth of Puerto Rico General Obligation Notes, Series 2021 | ||||||||||||
| 0.000% due 07/01/2024 (c) | 51 | 47 | ||||||||||
| 5.625% due 07/01/2027 | 329 | 335 | ||||||||||
Puerto Rico Highway & Transportation Authority Revenue Bonds, Series 2022 | ||||||||||||
| 0.000% due 07/01/2032 (c) | 30 | 18 | ||||||||||
| 0.000% due 07/01/2053 (d) | 456 | 253 | ||||||||||
| 5.000% due 07/01/2062 | 46 | 43 | ||||||||||
Puerto Rico Sales Tax Financing Corp. Sales Tax Revenue Bonds, Series 2018 | ||||||||||||
| 0.000% due 07/01/2051 (c) | 3,900 | 707 | ||||||||||
Puerto Rico Sales Tax Financing Corp. Sales Tax Revenue Bonds, Series 2019 | ||||||||||||
| 4.784% due 07/01/2058 | 3,950 | 3,437 | ||||||||||
| 6,883 | ||||||||||||
| TEXAS 1.6% | ||||||||||||
Angelina & Neches River Authority, Texas Revenue Bonds, Series 2021 | ||||||||||||
| 7.500% due 12/01/2045 | 220 | 145 | ||||||||||
| 12.000% due 12/01/2045 | 400 | 346 | ||||||||||
Texas Water Development Board Revenue Bonds, Series 2022 | ||||||||||||
| 5.000% due 10/15/2057 | 890 | 959 | ||||||||||
| 1,450 | ||||||||||||
| PRINCIPAL AMOUNT (000S) | MARKET VALUE (000S) | |||||||||||
| U.S. VIRGIN ISLANDS 1.0% | ||||||||||||
Matching Fund Special Purpose Securitization Corp., U.S. Virgin Islands Revenue Bonds, Series 2022 | ||||||||||||
| 5.000% due 10/01/2039 | $ | 905 | $ | 908 | ||||||||
| VIRGINIA 0.9% | ||||||||||||
Virginia Small Business Financing Authority Revenue Bonds, Series 2019 | ||||||||||||
| 0.000% due 07/01/2061 (c) | 8,000 | 386 | ||||||||||
| 5.500% due 07/01/2044 | 500 | 468 | ||||||||||
| 854 | ||||||||||||
| WISCONSIN 0.7% | ||||||||||||
Wisconsin Health & Educational Facilities Authority Revenue Bonds, Series 2022 | ||||||||||||
| 4.000% due 12/01/2051 | 720 | 638 | ||||||||||
Total Municipal Bonds & Notes (Cost $171,401) | 163,972 | |||||||||||
| SHORT-TERM INSTRUMENTS 0.9% | ||||||||||||
| REPURCHASE AGREEMENTS (f) 0.9% | ||||||||||||
| 859 | ||||||||||||
| Total Short-Term Instruments (Cost $859) | 859 | |||||||||||
| Total Investments in Securities (Cost $172,260) | 164,831 | |||||||||||
| Total Investments 177.4% (Cost $172,260) | $ | 164,831 | ||||||||||
| Auction Rate Preferred Shares (62.4)% | (58,000 | ) | ||||||||||
| Remarketable Variable Rate MuniFund Term Preferred Shares, at liquidation value (16.0)% | (14,869 | ) | ||||||||||
| Other Assets and Liabilities, net 1.0% | 975 | |||||||||||
| Net Assets Applicable to Common Shareholders 100.0% | $ | 92,937 | ||||||||||
| * | A zero balance may reflect actual amounts rounding to less than one thousand. |
| ^ | Security is in default. |
| (a) | When-issued security. |
| (b) | Security is not accruing income as of the date of this report. |
| (c) | Zero coupon security. |
| (d) | Security becomes interest bearing at a future date. |
| Issuer Description | Coupon | Maturity Date | Acquisition Date | Cost | Market Value | Market Value as Percentage of Net Assets Applicable to Common Shareholders | ||||||||||||||||||
| New York State Housing Finance Agency Revenue Bonds, (FHA Insured), Series 2020 | 4.200% | 11/01/2054 | 11/18/2021 | $ | 2,935 | $ | 2,322 | 2.50% | ||||||||||||||||
| 68 | PIMCO CLOSED-END FUNDS | See Accompanying Notes |
| December 31, 2022 |
| Counterparty | Lending Rate | Settlement Date | Maturity Date | Principal Amount | Collateralized By | Collateral (Received) | Repurchase Agreements, at Value | Repurchase Agreement Proceeds to be Received(1) | ||||||||||||||||||||||
| FICC | 1.900 | % | 12/30/2022 | 01/03/2023 | $ | 859 | U.S. Treasury Bills 0.000% due 06/29/2023 | $ | (876 | ) | $ | 859 | $ | 859 | ||||||||||||||||
| �� | ||||||||||||||||||||||||||||||
Total Repurchase Agreements | $ | (876 | ) | $ | 859 | $ | 859 | |||||||||||||||||||||||
| Counterparty | Repurchase Agreement Proceeds to be Received(1) | Payable for Reverse Repurchase Agreements | Payable for Sale‑Buyback Transactions | Total Borrowings and Other Financing Transactions | Collateral Pledged/(Received) | Net Exposure(2) | ||||||||||||||||||
| Global/Master Repurchase Agreement | ||||||||||||||||||||||||
| FICC | $ | 859 | $ | 0 | $ | 0 | $ | 859 | $ | (876 | ) | $ | (17 | ) | ||||||||||
Total Borrowings and Other Financing Transactions | $ | 859 | $ | 0 | $ | 0 | ||||||||||||||||||
| (1) | Includes accrued interest. |
| (2) | Net Exposure represents the net receivable/(payable) that would be due from/to the counterparty in the event of default. Exposure from borrowings and other financing transactions can only be netted across transactions governed under the same master agreement with the same legal entity. See Note 7, Master Netting Arrangements, in the Notes to Financial Statements for more information. |
| Category and Subcategory | Level 1 | Level 2 | Level 3 | Fair Value at 12/31/2022 | ||||||||||||
Investments in Securities, at Value | ||||||||||||||||
| Municipal Bonds & Notes | ||||||||||||||||
| Arizona | $ | 0 | $ | 280 | $ | 0 | $ | 280 | ||||||||
| California | 0 | 488 | 0 | 488 | ||||||||||||
| Delaware | 0 | 1,360 | 0 | 1,360 | ||||||||||||
| Illinois | 0 | 3,136 | 0 | 3,136 | ||||||||||||
| Indiana | 0 | 850 | 0 | 850 | ||||||||||||
| New York | 0 | 146,314 | 0 | 146,314 | ||||||||||||
| North Dakota | 0 | 176 | 0 | 176 | ||||||||||||
| Pennsylvania | 0 | 635 | 0 | 635 | ||||||||||||
| Puerto Rico | 0 | 6,883 | 0 | 6,883 | ||||||||||||
| Category and Subcategory | Level 1 | Level 2 | Level 3 | Fair Value at 12/31/2022 | ||||||||||||
| Texas | $ | 0 | $ | 1,450 | $ | 0 | $ | 1,450 | ||||||||
| U.S. Virgin Islands | 0 | 908 | 0 | 908 | ||||||||||||
| Virginia | 0 | 854 | 0 | 854 | ||||||||||||
| Wisconsin | 0 | 638 | 0 | 638 | ||||||||||||
| Short-Term Instruments | ||||||||||||||||
| Repurchase Agreements | 0 | 859 | 0 | 859 | ||||||||||||
| Total Investments | $ | 0 | $ | 164,831 | $ | 0 | $ | 164,831 | ||||||||
| See Accompanying Notes | ANNUAL REPORT | | | DECEMBER 31, 2022 | 69 |
| Schedule of Investments | PIMCO New York Municipal Income Fund III |
| PRINCIPAL AMOUNT (000S) | MARKET VALUE (000S) | |||||||||||
| INVESTMENTS IN SECURITIES 177.1% | ||||||||||||
| MUNICIPAL BONDS & NOTES 170.2% | ||||||||||||
| ARIZONA 0.3% | ||||||||||||
Arizona Industrial Development Authority Revenue Bonds, Series 2020 | ||||||||||||
| 7.750% due 07/01/2050 | $ | 150 | $ | 105 | ||||||||
| DELAWARE 1.5% | ||||||||||||
Affordable Housing Opportunities Trust, Delaware Revenue Bonds, Series 2022 | ||||||||||||
| 3.167% due 10/01/2038 | 550 | 469 | ||||||||||
| 7.120% due 10/01/2038 | 95 | 91 | ||||||||||
| 560 | ||||||||||||
| ILLINOIS 1.0% | ||||||||||||
Illinois State General Obligation Bonds, Series 2012 | ||||||||||||
| 5.000% due 08/01/2023 | 400 | 403 | ||||||||||
| INDIANA 0.9% | ||||||||||||
Indiana Finance Authority Revenue Bonds, Series 2022 | ||||||||||||
| 4.500% due 12/15/2046 | 350 | 350 | ||||||||||
| NEW YORK 153.4% | ||||||||||||
Brookhaven Local Development Corp., New York Revenue Bonds, Series 2020 | ||||||||||||
| 4.000% due 11/01/2055 | 400 | 314 | ||||||||||
Broome County, New York Local Development Corp. Revenue Bonds, (AGM Insured), Series 2020 | ||||||||||||
| 4.000% due 04/01/2050 | 250 | 220 | ||||||||||
Build NYC Resource Corp., New York Revenue Bonds, Series 2018 | ||||||||||||
| 5.625% due 12/01/2050 | 740 | 697 | ||||||||||
Build NYC Resource Corp., New York Revenue Bonds, Series 2023 | ||||||||||||
| 5.250% due 07/01/2062 (a) | 500 | 502 | ||||||||||
Dutchess County, New York Local Development Corp. Revenue Bonds, Series 2016 | ||||||||||||
| 5.000% due 07/01/2046 | 750 | 751 | ||||||||||
Dutchess County, New York Local Development Corp. Revenue Bonds, Series 2022 | ||||||||||||
| 4.000% due 07/01/2049 | 435 | 403 | ||||||||||
Housing Development Corp., New York Revenue Bonds, Series 2017 | ||||||||||||
| 3.700% due 11/01/2047 | 500 | 410 | ||||||||||
Hudson Yards Infrastructure Corp., New York Revenue Bonds, Series 2021 | ||||||||||||
| 4.000% due 02/15/2039 | 750 | 728 | ||||||||||
Huntington Local Development Corp., New York Revenue Bonds, Series 2021 | ||||||||||||
| 5.250% due 07/01/2056 | 300 | 230 | ||||||||||
Long Island Power Authority, New York Revenue Bonds, Series 2020 | ||||||||||||
| 4.000% due 09/01/2039 | 500 | 495 | ||||||||||
Metropolitan Transportation Authority, New York Revenue Bonds, Series 2013 | ||||||||||||
| 5.000% due 11/15/2042 | 2,000 | 1,958 | ||||||||||
Metropolitan Transportation Authority, New York Revenue Bonds, Series 2014 | ||||||||||||
| 5.000% due 11/15/2039 | 2,000 | 1,989 | ||||||||||
Monroe County Industrial Development Corp., New York Revenue Bonds, Series 2013 | ||||||||||||
| 5.000% due 07/01/2043 | 1,750 | 1,768 | ||||||||||
Monroe County Industrial Development Corp., New York Revenue Bonds, Series 2020 | ||||||||||||
| 4.000% due 12/01/2046 | 465 | 404 | ||||||||||
Nassau County, New York General Obligation Bonds, Series 2022 | ||||||||||||
| 4.250% due 04/01/2052 | 950 | 894 | ||||||||||
| PRINCIPAL AMOUNT (000S) | MARKET VALUE (000S) | |||||||||||
Nassau County, New York Industrial Development Agency Revenue Bonds, Series 2021 | ||||||||||||
| 5.000% due 01/01/2058 | $ | 341 | $ | 167 | ||||||||
New York City Industrial Development Agency, New York Revenue Bonds, (AGM Insured), Series 2021 | ||||||||||||
| 4.000% due 01/01/2032 | 1,000 | 1,047 | ||||||||||
New York City Transitional Finance Authority Building Aid, New York Revenue Bonds, Series 2018 | ||||||||||||
| 5.250% due 07/15/2036 | 1,000 | 1,100 | ||||||||||
New York City Transitional Finance Authority Future Tax Secured, New York Revenue Bonds, Series 2013 | ||||||||||||
| 5.000% due 11/01/2042 | 2,000 | 2,015 | ||||||||||
New York City Transitional Finance Authority Future Tax Secured, New York Revenue Bonds, Series 2020 | ||||||||||||
| 4.000% due 05/01/2047 | 500 | 462 | ||||||||||
New York City Trust for Cultural Resources, New York Revenue Bonds, Series 2014 | ||||||||||||
| 5.000% due 08/01/2043 | 2,000 | 2,024 | ||||||||||
New York City Water & Sewer System, New York Revenue Bonds, Series 2016 | ||||||||||||
| 4.000% due 06/15/2046 | 465 | 437 | ||||||||||
New York City, New York General Obligation Bonds, Series 2013 | ||||||||||||
| 5.000% due 08/01/2031 | 2,590 | 2,616 | ||||||||||
New York City, New York General Obligation Bonds, Series 2017 | ||||||||||||
| 3.400% due 10/01/2046 | 400 | 400 | ||||||||||
New York City, New York General Obligation Bonds, Series 2018 | ||||||||||||
| 5.000% due 04/01/2045 | 900 | 945 | ||||||||||
New York City, New York Housing Development Corp. Revenue Bonds, Series 2006 | ||||||||||||
| 3.630% due 10/15/2041 | 400 | 400 | ||||||||||
New York City, New York Municipal Water Finance Authority Revenue Bonds, Series 2022 | ||||||||||||
| 5.000% due 06/15/2047 | 750 | 806 | ||||||||||
New York City, New York Transitional Finance Authority Future Tax Secured Revenue Bonds, Series 2022 | ||||||||||||
| 5.250% due 11/01/2048 | 1,500 | 1,640 | ||||||||||
| 5.500% due 11/01/2045 | 250 | 281 | ||||||||||
New York Convention Center Development Corp. Revenue Bonds, Series 2015 | ||||||||||||
| 5.000% due 11/15/2045 | 500 | 495 | ||||||||||
New York County, New York Tobacco Trust Revenue Bonds, Series 2001 | ||||||||||||
| 5.750% due 06/01/2043 | 330 | 336 | ||||||||||
New York County, New York Tobacco Trust Revenue Bonds, Series 2005 | ||||||||||||
| 0.000% due 06/01/2050 (c) | 10,000 | 1,984 | ||||||||||
| 0.000% due 06/01/2055 (c) | 7,500 | 531 | ||||||||||
New York Liberty Development Corp. Revenue Bonds, Series 2007 | ||||||||||||
| 5.500% due 10/01/2037 | 2,400 | 2,661 | ||||||||||
New York Liberty Development Corp. Revenue Bonds, Series 2014 | ||||||||||||
| 5.000% due 11/15/2044 | 1,750 | 1,594 | ||||||||||
New York Power Authority Revenue Bonds, Series 2020 | ||||||||||||
| 4.000% due 11/15/2055 | 1,000 | 904 | ||||||||||
New York State Dormitory Authority Memorial Sloan-Kettering Cancer Revenue Bonds, Series 2022 | ||||||||||||
| 4.000% due 07/01/2051 | 750 | 702 | ||||||||||
New York State Dormitory Authority Revenue Bonds, Series 2013 | ||||||||||||
| 5.000% due 02/15/2029 | 750 | 752 | ||||||||||
New York State Dormitory Authority Revenue Bonds, Series 2017 | ||||||||||||
| 4.000% due 02/15/2047 | 250 | 234 | ||||||||||
| 5.000% due 12/01/2036 | 1,000 | 987 | ||||||||||
New York State Dormitory Authority Revenue Bonds, Series 2018 | ||||||||||||
| 5.000% due 03/15/2037 | 1,000 | 1,073 | ||||||||||
New York State Dormitory Authority Revenue Bonds, Series 2019 | ||||||||||||
| 5.000% due 03/15/2047 | 2,500 | 2,619 | ||||||||||
| PRINCIPAL AMOUNT (000S) | MARKET VALUE (000S) | |||||||||||
New York State Dormitory Authority Revenue Bonds, Series 2020 | ||||||||||||
| 4.000% due 07/01/2050 | $ | 1,980 | $ | 1,832 | ||||||||
New York State Dormitory Authority Revenue Bonds, Series 2022 | ||||||||||||
| 4.000% due 07/01/2049 | 190 | 167 | ||||||||||
| 5.000% due 07/15/2050 | 190 | 191 | ||||||||||
New York State Environmental Facilities Corp. Revenue Bonds, Series 2022 | ||||||||||||
| 4.000% due 06/15/2047 | 1,000 | 975 | ||||||||||
New York State Housing Finance Agency Revenue Bonds, (FHA Insured), Series 2020 | ||||||||||||
| 4.200% due 11/01/2054 (e) | 1,000 | 893 | ||||||||||
New York State Urban Development Corp. Revenue Bonds, Series 2021 | ||||||||||||
| 4.000% due 03/15/2047 | 500 | 470 | ||||||||||
New York Transportation Development Corp. Revenue Bonds, Series 2016 | ||||||||||||
| 5.250% due 01/01/2050 | 480 | 467 | ||||||||||
New York Transportation Development Corp. Revenue Bonds, Series 2022 | ||||||||||||
| 4.000% due 12/01/2042 | 940 | 834 | ||||||||||
Niagara Tobacco Asset Securitization Corp., New York Revenue Bonds, Series 2014 | ||||||||||||
| 5.250% due 05/15/2034 | 500 | 503 | ||||||||||
| 5.250% due 05/15/2040 | 500 | 502 | ||||||||||
Onondaga County, New York Trust for Cultural Resources Revenue Bonds, Series 2019 | ||||||||||||
| 5.000% due 12/01/2040 | 350 | 383 | ||||||||||
| 5.000% due 12/01/2043 | 500 | 543 | ||||||||||
Port Authority of New York & New Jersey Revenue Bonds, Series 2017 | ||||||||||||
| 5.250% due 10/15/2057 | 2,500 | 2,608 | ||||||||||
Port Authority of New York & New Jersey Revenue Bonds, Series 2018 | ||||||||||||
| 5.000% due 07/15/2036 | 500 | 543 | ||||||||||
Port Authority of New York & New Jersey Revenue Bonds, Series 2020 | ||||||||||||
| 4.000% due 07/15/2060 | 250 | 214 | ||||||||||
Schenectady County Capital Resource Corp. Union College Project, New York Revenue Bonds Series 2022 | ||||||||||||
| 5.000% due 07/01/2032 | 190 | 220 | ||||||||||
Suffolk County, New York Economic Development Corp. Revenue Bonds, Series 2021 | ||||||||||||
| 5.125% due 11/01/2041 | 200 | 157 | ||||||||||
Suffolk Tobacco Asset Securitization Corp., New York Revenue Bonds, Series 2021 | ||||||||||||
| 0.000% due 06/01/2066 (c) | 5,000 | 518 | ||||||||||
| 4.000% due 06/01/2050 | 250 | 209 | ||||||||||
The Genesee County Funding Corporation Tax‑Exempt, New York Revenue Bonds, Series 2022 | ||||||||||||
| 5.250% due 12/01/2052 | 500 | 507 | ||||||||||
Triborough Bridge & Tunnel Authority Sales Tax, New York Revenue Bonds, Series 2022 | ||||||||||||
| 4.000% due 05/15/2057 | 750 | 700 | ||||||||||
Triborough Bridge & Tunnel Authority, New York Revenue Bonds, Series 2019 | ||||||||||||
| 5.000% due 11/15/2043 | 750 | 798 | ||||||||||
Triborough Bridge & Tunnel Authority, New York Revenue Bonds, Series 2021 | ||||||||||||
| 5.000% due 05/15/2051 | 405 | 429 | ||||||||||
Troy Capital Resource Corp., New York Revenue Bonds, Series 2020 | ||||||||||||
| 5.000% due 09/01/2034 | 585 | 630 | ||||||||||
TSASC, Inc., New York Revenue Bonds, Series 2017 | ||||||||||||
| 5.000% due 06/01/2041 | 2,000 | 2,019 | ||||||||||
Ulster County, New York Capital Resource Corp. Revenue Bonds, Series 2017 | ||||||||||||
| 5.250% due 09/15/2047 | 500 | 379 | ||||||||||
| 58,666 | ||||||||||||
| 70 | PIMCO CLOSED-END FUNDS | See Accompanying Notes |
| December 31, 2022 |
| PRINCIPAL AMOUNT (000S) | MARKET VALUE (000S) | |||||||||||
| NORTH DAKOTA 0.2% | ||||||||||||
Grand Forks County, North Dakota Revenue Bonds, Series 2021 | ||||||||||||
| 7.000% due 12/15/2043 ^(b) | $ | 130 | $ | 72 | ||||||||
| PENNSYLVANIA 0.7% | ||||||||||||
Pennsylvania Economic Development Financing Authority Revenue Bonds, Series 2021 | ||||||||||||
| 9.000% due 04/01/2051 | 225 | 255 | ||||||||||
| PUERTO RICO 8.2% | ||||||||||||
Children’s Trust Fund, Puerto Rico Revenue Bonds, Series 2008 | ||||||||||||
| 0.000% due 05/15/2057 (c) | 4,400 | 270 | ||||||||||
Commonwealth of Puerto Rico Bonds, Series 2022 | ||||||||||||
| 0.000% due 11/01/2043 (c) | 576 | 253 | ||||||||||
| 0.000% due 11/01/2051 (c) | 829 | 332 | ||||||||||
Commonwealth of Puerto Rico General Obligation Bonds, Series 2021 | ||||||||||||
| 4.000% due 07/01/2041 | 250 | 196 | ||||||||||
Commonwealth of Puerto Rico General Obligation Notes, Series 2021 | ||||||||||||
| 0.000% due 07/01/2024 (c) | 21 | 19 | ||||||||||
| 5.625% due 07/01/2027 | 69 | 70 | ||||||||||
Puerto Rico Highway & Transportation Authority Revenue Bonds, Series 2022 | ||||||||||||
| 0.000% due 07/01/2032 (c) | 53 | 31 | ||||||||||
| 0.000% due 07/01/2053 (d) | 255 | 142 | ||||||||||
| 5.000% due 07/01/2062 | 81 | 75 | ||||||||||
| PRINCIPAL AMOUNT (000S) | MARKET VALUE (000S) | |||||||||||
Puerto Rico Sales Tax Financing Corp. Sales Tax Revenue Bonds, Series 2018 | ||||||||||||
| 0.000% due 07/01/2046 (c) | $ | 3,850 | $ | 953 | ||||||||
Puerto Rico Sales Tax Financing Corp. Sales Tax Revenue Bonds, Series 2019 | ||||||||||||
| 4.784% due 07/01/2058 | 900 | 783 | ||||||||||
| 3,124 | ||||||||||||
| TEXAS 0.5% | ||||||||||||
Angelina & Neches River Authority, Texas Revenue Bonds, Series 2021 | ||||||||||||
| 7.500% due 12/01/2045 | 90 | 59 | ||||||||||
| 12.000% due 12/01/2045 | 150 | 130 | ||||||||||
| 189 | ||||||||||||
| U.S. VIRGIN ISLANDS 1.0% | ||||||||||||
Matching Fund Special Purpose Securitization Corp., U.S. Virgin Islands Revenue Bonds, Series 2022 | ||||||||||||
| 5.000% due 10/01/2039 | 370 | 371 | ||||||||||
| VIRGINIA 1.1% | ||||||||||||
Virginia Small Business Financing Authority Revenue Bonds, Series 2019 | ||||||||||||
| 0.000% due 07/01/2061 (c) | 4,000 | 193 | ||||||||||
| 5.500% due 07/01/2044 | 250 | 234 | ||||||||||
| 427 | ||||||||||||
| PRINCIPAL AMOUNT (000S) | MARKET VALUE (000S) | |||||||||||
| WISCONSIN 1.4% | ||||||||||||
Wisconsin Center District Revenue Bonds, (AGM Insured), Series 2020 | ||||||||||||
| 0.000% due 12/15/2060 (c) | $ | 2,000 | $ | 283 | ||||||||
Wisconsin Health & Educational Facilities Authority Revenue Bonds, Series 2022 | ||||||||||||
| 4.000% due 12/01/2051 | 295 | 261 | ||||||||||
| 544 | ||||||||||||
Total Municipal Bonds & Notes (Cost $67,676) | 65,066 | |||||||||||
| SHORT-TERM INSTRUMENTS 6.9% | ||||||||||||
| REPURCHASE AGREEMENTS (f) 6.9% | ||||||||||||
| 2,639 | ||||||||||||
| Total Short-Term Instruments (Cost $2,639) | 2,639 | |||||||||||
| Total Investments in Securities (Cost $70,315) | 67,705 | |||||||||||
| Total Investments 177.1% (Cost $70,315) | $ | 67,705 | ||||||||||
| Auction Rate Preferred Shares (77.0)% | (29,450 | ) | ||||||||||
| Other Assets and Liabilities, net (0.1)% | (15 | ) | ||||||||||
| Net Assets Applicable to Common Shareholders 100.0% | $ | 38,240 | ||||||||||
| * | A zero balance may reflect actual amounts rounding to less than one thousand. |
| ^ | Security is in default. |
| (a) | When-issued security. |
| (b) | Security is not accruing income as of the date of this report. |
| (c) | Zero coupon security. |
| (d) | Security becomes interest bearing at a future date. |
| Issuer Description | Coupon | Maturity Date | Acquisition Date | Cost | Market Value | Market Value as Percentage of Net Assets Applicable to Common Shareholders | ||||||||||||||||||
| New York State Housing Finance Agency Revenue Bonds, (FHA Insured), Series 2020 | 4.200% | 11/01/2054 | 11/18/2021 | $ | 1,129 | $ | 893 | 2.34% | ||||||||||||||||
| Counterparty | Lending Rate | Settlement Date | Maturity Date | Principal Amount | Collateralized By | Collateral (Received) | Repurchase Agreements, at Value | Repurchase Agreement Proceeds to be Received(1) | ||||||||||||||||||||||
| FICC | 1.900 | % | 12/30/2022 | 01/03/2023 | $ | 2,639 | U.S. Treasury Bills 0.000% due 06/29/2023 | $ | (2,692 | ) | $ | 2,639 | $ | 2,639 | ||||||||||||||||
Total Repurchase Agreements | $ | (2,692 | ) | $ | 2,639 | $ | 2,639 | |||||||||||||||||||||||
| See Accompanying Notes | ANNUAL REPORT | | | DECEMBER 31, 2022 | 71 |
| Schedule of Investments | PIMCO New York Municipal Income Fund III | (Cont.) | December 31, 2022 |
| Counterparty | Repurchase Agreement Proceeds to be Received(1) | Payable for Reverse Repurchase Agreements | Payable for Sale‑Buyback Transactions | Total Borrowings and Other Financing Transactions | Collateral Pledged/(Received) | Net Exposure(2) | ||||||||||||||||||
| Global/Master Repurchase Agreement | ||||||||||||||||||||||||
| FICC | $ | 2,639 | $ | 0 | $ | 0 | $ | 2,639 | $ | (2,692 | ) | $ | (53 | ) | ||||||||||
Total Borrowings and Other Financing Transactions | $ | 2,639 | $ | 0 | $ | 0 | ||||||||||||||||||
| (1) | Includes accrued interest. |
| (2) | Net Exposure represents the net receivable/(payable) that would be due from/to the counterparty in the event of default. Exposure from borrowings and other financing transactions can only be netted across transactions governed under the same master agreement with the same legal entity. See Note 7, Master Netting Arrangements, in the Notes to Financial Statements for more information. |
| Category and Subcategory | Level 1 | Level 2 | Level 3 | Fair Value at 12/31/2022 | ||||||||||||
Investments in Securities, at Value | ||||||||||||||||
| Municipal Bonds & Notes | ||||||||||||||||
| Arizona | $ | 0 | $ | 105 | $ | 0 | $ | 105 | ||||||||
| Delaware | 0 | 560 | 0 | 560 | ||||||||||||
| Illinois | 0 | 403 | 0 | 403 | ||||||||||||
| Indiana | 0 | 350 | 0 | 350 | ||||||||||||
| New York | 0 | 58,666 | 0 | 58,666 | ||||||||||||
| North Dakota | 0 | 72 | 0 | 72 | ||||||||||||
| Pennsylvania | 0 | 255 | 0 | 255 | ||||||||||||
| Puerto Rico | 0 | 3,124 | 0 | 3,124 | ||||||||||||
| Category and Subcategory | Level 1 | Level 2 | Level 3 | Fair Value at 12/31/2022 | ||||||||||||
| Texas | $ | 0 | $ | 189 | $ | 0 | $ | 189 | ||||||||
| U.S. Virgin Islands | 0 | 371 | 0 | 371 | ||||||||||||
| Virginia | 0 | 427 | 0 | 427 | ||||||||||||
| Wisconsin | 0 | 544 | 0 | 544 | ||||||||||||
| Short-Term Instruments | ||||||||||||||||
| Repurchase Agreements | 0 | 2,639 | 0 | 2,639 | ||||||||||||
| Total Investments | $ | 0 | $ | 67,705 | $ | 0 | $ | 67,705 | ||||||||
| 72 | PIMCO CLOSED-END FUNDS | See Accompanying Notes |
| Notes to Financial Statements | December 31, 2022 |
| Fund Name | Formation Date | |||||||
| PIMCO Municipal Income Fund | May 9, 2001 | |||||||
| PIMCO Municipal Income Fund II | March 29, 2002 | |||||||
| PIMCO Municipal Income Fund III | August 20, 2002 | |||||||
| PIMCO California Municipal Income Fund | May 10, 2001 | |||||||
| PIMCO California Municipal Income Fund II | March 29, 2002 | |||||||
| PIMCO California Municipal Income Fund III | August 20, 2002 | |||||||
| PIMCO New York Municipal Income Fund | May 10, 2001 | |||||||
| PIMCO New York Municipal Income Fund II | March 29, 2002 | |||||||
| PIMCO New York Municipal Income Fund III | August 20, 2002 | |||||||
| Distribution Frequency | ||||||||||||
| Fund Name | Declared | Distributed | ||||||||||
| PIMCO Municipal Income Fund | Monthly | Monthly | ||||||||||
| PIMCO Municipal Income Fund II | Monthly | Monthly | ||||||||||
| PIMCO Municipal Income Fund III | Monthly | Monthly | ||||||||||
| PIMCO California Municipal Income Fund | Monthly | Monthly | ||||||||||
| PIMCO California Municipal Income Fund II | Monthly | Monthly | ||||||||||
| PIMCO California Municipal Income Fund III | Monthly | Monthly | ||||||||||
| PIMCO New York Municipal Income Fund | Monthly | Monthly | ||||||||||
| PIMCO New York Municipal Income Fund II | Monthly | Monthly | ||||||||||
| PIMCO New York Municipal Income Fund III | Monthly | Monthly | ||||||||||
| ANNUAL REPORT | | | DECEMBER 31, 2022 | 73 |
| Notes to Financial Statements | (Cont.) |
| 74 | PIMCO CLOSED-END FUNDS |
| December 31, 2022 |
| ANNUAL REPORT | | | DECEMBER 31, 2022 | 75 |
| Notes to Financial Statements | (Cont.) |
| ∎ | Level 1 — Quoted prices (unadjusted) in active markets or exchanges for identical assets and liabilities. |
| ∎ | Level 2 — Significant other observable inputs, which may include, but are not limited to, quoted prices for similar assets or liabilities in markets that are active, quoted prices for identical or similar assets or liabilities in markets that are not active, inputs other than quoted prices that are observable for the assets or liabilities (such as interest rates, yield curves, volatilities, prepayment speeds, loss severities, credit risks and default rates) or other market corroborated inputs. |
| ∎ | Level 3 — Significant unobservable inputs based on the best information available in the circumstances, to the extent observable inputs are not available, which may include assumptions made by the Valuation Designee that are used in determining the fair value of investments. |
| 76 | PIMCO CLOSED-END FUNDS |
| December 31, 2022 |
| ANNUAL REPORT | | | DECEMBER 31, 2022 | 77 |
| Notes to Financial Statements | (Cont.) |
| 78 | PIMCO CLOSED-END FUNDS |
| December 31, 2022 |
| ANNUAL REPORT | | | DECEMBER 31, 2022 | 79 |
| Notes to Financial Statements | (Cont.) |
| Fund Name | Average Leverage Outstanding (000s) | Weighted Average Interest Rate | ||||||||||
| PIMCO Municipal Income Fund | $ | 47,690 | 1.35% | |||||||||
| PIMCO Municipal Income Fund II | 169,365 | 1.43% | ||||||||||
| PIMCO Municipal Income Fund III | 63,910 | 1.34% | ||||||||||
| PIMCO California Municipal Income Fund | 37,300 | 1.30% | ||||||||||
| PIMCO California Municipal Income Fund II | 28,430 | 1.36% | ||||||||||
| PIMCO California Municipal Income Fund III | 29,532 | 1.31% | ||||||||||
| PIMCO New York Municipal Income Fund | 18,402 | 1.01% | ||||||||||
| PIMCO New York Municipal Income Fund II** | 8,933 | 1.37% | ||||||||||
| PIMCO New York Municipal Income Fund III** | 5,945 | 1.02% | ||||||||||
| ** | As of December 31, 2022, the Fund does not hold any tender option bonds. |
| PIMCO Municipal Income Fund (PMF) | PIMCO Municipal Income Fund II (PML) | PIMCO Municipal Income Fund III (PMX) | PIMCO California Municipal Income Fund (PCQ) | PIMCO California Municipal Income Fund II (PCK) | PIMCO California Municipal Income Fund III (PZC) | PIMCO New York Municipal Income Fund (PNF) | PIMCO New York Municipal Income Fund II (PNI) | PIMCO New York Municipal Income Fund III (PYN) | ||||||||||||
| AMT Bonds Risk | X | X | X | X | X | X | X | X | X | |||||||||||
| Asset Allocation Risk | X | X | X | X | X | X | X | X | X | |||||||||||
| California State Specific Risk | X | X | X | X | X | X | — | — | — | |||||||||||
| Call Risk | X | X | X | X | X | X | X | X | X | |||||||||||
| Counterparty Risk | X | X | X | X | X | X | X | X | X | |||||||||||
| Credit Risk | X | X | X | X | X | X | X | X | X | |||||||||||
| Cyber Security Risk | X | X | X | X | X | X | X | X | X | |||||||||||
| Derivatives Risk | X | X | X | X | X | X | X | X | X | |||||||||||
| Distribution Rate Risk | X | X | X | X | X | X | X | X | X | |||||||||||
| High Yield Securities Risk | X | X | X | X | X | X | X | X | X | |||||||||||
| Illinois State Specific Risk | X | X | X | — | — | — | — | — | — | |||||||||||
| Inflation/Deflation Risk | X | X | X | X | X | X | X | X | X | |||||||||||
| Insurance Risk | X | X | X | X | X | X | X | X | X | |||||||||||
| Interest Rate Risk | X | X | X | X | X | X | X | X | X | |||||||||||
| Issuer Risk | X | X | X | X | X | X | X | X | X | |||||||||||
| Leverage Risk | X | X | X | X | X | X | X | X | X | |||||||||||
| Liquidity Risk | X | X | X | X | X | X | X | X | X | |||||||||||
| Management Risk | X | X | X | X | X | X | X | X | X | |||||||||||
| Market Disruptions Risk | X | X | X | X | X | X | X | X | X | |||||||||||
| Market Discount Risk | X | X | X | X | X | X | X | X | X | |||||||||||
| Market Risk | X | X | X | X | X | X | X | X | X | |||||||||||
| Mortgage-Related and Other Asset-Backed Instruments Risk | X | X | X | X | X | X | X | X | X | |||||||||||
| Municipal Bond Market Risk | X | X | X | X | X | X | X | X | X | |||||||||||
| Municipal Bond Risk | X | X | X | X | X | X | X | X | X | |||||||||||
| Municipal Project-Specific Risk | X | X | X | X | X | X | X | X | X | |||||||||||
| New York State-Specific Risk | X | X | X | — | — | — | X | X | X | |||||||||||
| Non‑Diversification Risk | — | — | — | — | — | — | X | — | X | |||||||||||
| Operational Risk | X | X | X | X | X | X | X | X | X | |||||||||||
| Other Investment Companies Risk | X | X | X | X | X | X | X | X | X | |||||||||||
| 80 | PIMCO CLOSED-END FUNDS |
| December 31, 2022 |
| PIMCO Municipal Income Fund (PMF) | PIMCO Municipal Income Fund II (PML) | PIMCO Municipal Income Fund III (PMX) | PIMCO California Municipal Income Fund (PCQ) | PIMCO California Municipal Income Fund II (PCK) | PIMCO California Municipal Income Fund III (PZC) | PIMCO New York Municipal Income Fund (PNF) | PIMCO New York Municipal Income Fund II (PNI) | PIMCO New York Municipal Income Fund III (PYN) | ||||||||||||
| Portfolio Turnover Risk | X | X | X | X | X | X | X | X | X | |||||||||||
| Potential Conflicts of Interest Risk — Allocation of Investment Opportunities | X | X | X | X | X | X | X | X | X | |||||||||||
| Private Placement and Restricted Securities Risk | X | X | X | X | X | X | X | X | X | |||||||||||
| Puerto Rico Specific Risk | X | X | X | X | X | X | X | X | X | |||||||||||
| Regulatory Changes Risk | X | X | X | X | X | X | X | X | X | |||||||||||
| Regulatory Risk — LIBOR | X | X | X | X | X | X | X | X | X | |||||||||||
| Reinvestment Risk | X | X | X | X | X | X | X | X | X | |||||||||||
| Repurchase Agreements Risk | X | X | X | X | X | X | X | X | X | |||||||||||
| Securities Lending Risk | X | X | X | X | X | X | X | X | X | |||||||||||
| Short Exposure Risk | X | X | X | X | X | X | X | X | X | |||||||||||
| Structured Investments Risk | X | X | X | X | X | X | X | X | X | |||||||||||
| Tax Risk | X | X | X | X | X | X | X | X | X | |||||||||||
| U.S. Government Securities Risk | X | X | X | X | X | X | X | X | X | |||||||||||
| Valuation Risk | X | X | X | X | X | X | X | X | X | |||||||||||
| ANNUAL REPORT | | | DECEMBER 31, 2022 | 81 |
| Notes to Financial Statements | (Cont.) |
| 82 | PIMCO CLOSED-END FUNDS |
| December 31, 2022 |
| ANNUAL REPORT | | | DECEMBER 31, 2022 | 83 |
| Notes to Financial Statements | (Cont.) |
| 84 | PIMCO CLOSED-END FUNDS |
| December 31, 2022 |
| ANNUAL REPORT | | | DECEMBER 31, 2022 | 85 |
| Notes to Financial Statements | (Cont.) |
| Fund Name | Annual Rate(1) | |||||||
| PIMCO Municipal Income Fund | 0.705% | |||||||
| PIMCO Municipal Income Fund II | 0.685% | |||||||
| PIMCO Municipal Income Fund III | 0.705% | |||||||
| PIMCO California Municipal Income Fund | 0.705% | |||||||
| PIMCO California Municipal Income Fund II | 0.705% | |||||||
| PIMCO California Municipal Income Fund III | 0.715% | |||||||
| PIMCO New York Municipal Income Fund | 0.770% | |||||||
| PIMCO New York Municipal Income Fund II | 0.735% | |||||||
| PIMCO New York Municipal Income Fund III | 0.860% | |||||||
| (1) | Management fees calculated based on the Fund’s average daily NAV (including daily net assets attributable to any preferred shares of the Fund that may be outstanding). |
| 86 | PIMCO CLOSED-END FUNDS |
| December 31, 2022 |
| Fund Name | Purchases | Sales | Realized Gain/Loss | |||||||||||||
| PIMCO Municipal Income Fund | $ | 20,020 | $ | 38,847 | $ | (2,373 | ) | |||||||||
| PIMCO Municipal Income Fund II | 24,599 | 69,665 | (5,029 | ) | ||||||||||||
| PIMCO Municipal Income Fund III | 12,595 | 24,272 | (1,889 | ) | ||||||||||||
| PIMCO California Municipal Income Fund | 10,375 | 11,445 | (1,047 | ) | ||||||||||||
| Fund Name | Purchases | Sales | Realized Gain/Loss | |||||||||||||
| PIMCO California Municipal Income Fund II | $ | 7,662 | $ | 9,278 | $ | (1,045 | ) | |||||||||
| PIMCO California Municipal Income Fund III | 6,445 | 8,431 | (667 | ) | ||||||||||||
| PIMCO New York Municipal Income Fund | 4,160 | 5,488 | (506 | ) | ||||||||||||
| PIMCO New York Municipal Income Fund II | 5,504 | 7,229 | (615 | ) | ||||||||||||
| PIMCO New York Municipal Income Fund III | 1,902 | 1,790 | (275 | ) | ||||||||||||
| † | A zero balance may reflect actual amounts rounding to less than one thousand. |
| U.S. Government/Agency | All Other | |||||||||||||||||||
| Fund Name | Purchases | Sales | Purchases | Sales | ||||||||||||||||
| PIMCO Municipal Income Fund | $ | 0 | $ | 0 | $ | 184,057 | $ | 209,906 | ||||||||||||
| PIMCO Municipal Income Fund II | 0 | 0 | 380,420 | 437,127 | ||||||||||||||||
| PIMCO Municipal Income Fund III | 0 | 0 | 173,732 | 207,954 | ||||||||||||||||
| PIMCO California Municipal Income Fund | 0 | 0 | 111,804 | 166,934 | ||||||||||||||||
| PIMCO California Municipal Income Fund II | 0 | 0 | 112,091 | 148,701 | ||||||||||||||||
| PIMCO California Municipal Income Fund III | 0 | 0 | 94,957 | 127,223 | ||||||||||||||||
| PIMCO New York Municipal Income Fund | 0 | 0 | 60,084 | 74,413 | ||||||||||||||||
| PIMCO New York Municipal Income Fund II | 0 | 0 | 78,594 | 87,813 | ||||||||||||||||
| PIMCO New York Municipal Income Fund III | 0 | 0 | 29,268 | 39,350 | ||||||||||||||||
| † | A zero balance may reflect actual amounts rounding to less than one thousand. |
| ANNUAL REPORT | | | DECEMBER 31, 2022 | 87 |
| Notes to Financial Statements | (Cont.) |
Year Ended 12/31/2022 | Year Ended 12/31/2021 | |||||||||||
| Common Shares registered (aggregate $) | $ | 225,000,000 | $ | 0 | ||||||||
| Common Shares sold | 2,215,907 | 0 | ||||||||||
| Offering proceeds (net of offering costs) | $ | 20,977,865 | $ | 0 | ||||||||
| Fund Name | Shares Issued and Outstanding | High | Low | As of December 31, 2022 | ||||||||||||||||
| PIMCO Municipal Income Fund | ||||||||||||||||||||
| Series A | 1,310 | 6.050% | 0.078% | 5.940% | ||||||||||||||||
| Series B | 1,367 | 6.384% | 0.078% | 6.050% | ||||||||||||||||
| Series C | 1,294 | 6.096% | 0.078% | 6.050% | ||||||||||||||||
| Series D | 1,388 | 6.338% | 0.078% | 6.050% | ||||||||||||||||
| Series E | 1,309 | 6.035% | 0.078% | 5.940% | ||||||||||||||||
| PIMCO Municipal Income Fund II | ||||||||||||||||||||
| Series A | 2,279 | 6.050% | 0.078% | 5.940% | ||||||||||||||||
| Series B | 2,577 | 6.384% | 0.078% | 6.050% | ||||||||||||||||
| Series C | 2,422 | 6.096% | 0.078% | 6.050% | ||||||||||||||||
| Series D | 2,300 | 6.338% | 0.078% | 6.050% | ||||||||||||||||
| Series E | 2,353 | 6.035% | 0.078% | 5.940% | ||||||||||||||||
| PIMCO Municipal Income Fund III | ||||||||||||||||||||
| Series A | 1,018 | 6.050% | 0.078% | 5.940% | ||||||||||||||||
| Series B | 1,190 | 6.384% | 0.078% | 6.050% | ||||||||||||||||
| Series C | 1,350 | 6.096% | 0.078% | 6.050% | ||||||||||||||||
| Series D | 1,334 | 6.338% | 0.078% | 6.050% | ||||||||||||||||
| Series E | 1,296 | 6.035% | 0.078% | 5.940% | ||||||||||||||||
| PIMCO California Municipal Income Fund | ||||||||||||||||||||
| Series A | 1,575 | 8.250% | 0.078% | 5.940% | ||||||||||||||||
| Series B | 1,547 | 8.250% | 0.078% | 6.050% | ||||||||||||||||
| Series C | 1,703 | 8.229% | 0.078% | 5.940% | ||||||||||||||||
| 88 | PIMCO CLOSED-END FUNDS |
| December 31, 2022 |
| Fund Name | Shares Issued and Outstanding | High | Low | As of December 31, 2022 | ||||||||||||||||
| PIMCO California Municipal Income Fund II | ||||||||||||||||||||
| Series A | 1,154 | 6.050% | 0.078% | 5.940% | ||||||||||||||||
| Series B | 879 | 6.384% | 0.078% | 6.050% | ||||||||||||||||
| Series C | 1,235 | 6.096% | 0.078% | 6.050% | ||||||||||||||||
| Series D | 926 | 6.338% | 0.078% | 6.050% | ||||||||||||||||
| Series E | 953 | 6.035% | 0.078% | 5.940% | ||||||||||||||||
| PIMCO California Municipal Income Fund III | ||||||||||||||||||||
| Series A | 1,920 | 6.384% | 0.078% | 6.050% | ||||||||||||||||
| Series B | 1,995 | 6.338% | 0.078% | 6.050% | ||||||||||||||||
| PIMCO New York Municipal Income Fund | ||||||||||||||||||||
| Series A | 1,641 | 6.384% | 0.078% | 6.050% | ||||||||||||||||
| PIMCO New York Municipal Income Fund II | ||||||||||||||||||||
| Series A | 1,178 | 6.096% | 0.078% | 6.050% | ||||||||||||||||
| Series B | 1,142 | 6.035% | 0.078% | 5.940% | ||||||||||||||||
| PIMCO New York Municipal Income Fund III | ||||||||||||||||||||
| Series A | 1,178 | 6.050% | 0.078% | 5.940% | ||||||||||||||||
| Applicable % | Reference Rate | Maximum Rate | ||||||||||||
| The higher of 30‑day “AA” Financial Composite Commercial Paper Rates | ||||||||||||||
| 110%1 | x | OR | = | Maximum Rate for the Funds | ||||||||||
| The Taxable Equivalent of the Short-Term Municipal Obligation Rate2 | ||||||||||||||
| 1 | 150% if all or part of the dividend consists of taxable income or capital gain. |
| 2 | “Taxable Equivalent of the Short-Term Municipal Obligation Rate” means 90% of the quotient of (A) the per annum rate expressed on an interest equivalent basis equal to the S&P 7 Day Index divided by (B) 1.00 minus the Marginal Tax Rate (expressed as a decimal). |
| ANNUAL REPORT | | | DECEMBER 31, 2022 | 89 |
| Notes to Financial Statements | (Cont.) |
| Fund Name | RVMTP Shares Outstanding | Interest Expense† | Weighted Average Interest Rate* | |||||||||||||
| PIMCO Municipal Income Fund | 182 | $ | 501 | 2.21 | % | |||||||||||
| PIMCO Municipal Income Fund II | 687 | 1517 | 2.21 | |||||||||||||
| PIMCO Municipal Income Fund III | 343 | 763 | 2.22 | |||||||||||||
| PIMCO California Municipal Income Fund | 244 | 628 | 2.19 | |||||||||||||
| PIMCO California Municipal Income Fund II | 275 | 728 | 2.18 | |||||||||||||
| PIMCO California Municipal Income Fund III | 271 | 602 | 2.22 | |||||||||||||
| PIMCO New York Municipal Income Fund II | 149 | 444 | 2.20 | |||||||||||||
| † | Amounts in thousands. |
| * | The rate presented is inclusive of the amortized debt issuance cost. As a result, the rate shown may not fall into the range presented in the table below. |
| Fund Name | Shares Issued and Outstanding | High | Low | As of December 31, 2022 | ||||||||||||||||
| PIMCO Municipal Income Fund | ||||||||||||||||||||
| Series 2051 | 182 | 4.720% | 0.960% | 4.580% | ||||||||||||||||
| PIMCO Municipal Income Fund II | ||||||||||||||||||||
| Series 2051 | 687 | 4.720% | 0.960% | 4.580% | ||||||||||||||||
| PIMCO Municipal Income Fund III | ||||||||||||||||||||
| Series 2051 | 343 | 4.720% | 0.960% | 4.580% | ||||||||||||||||
| PIMCO California Municipal Income Fund | ||||||||||||||||||||
| Series 2051 | 244 | 4.720% | 0.960% | 4.580% | ||||||||||||||||
| PIMCO California Municipal Income Fund II | ||||||||||||||||||||
| Series 2051 | 275 | 4.720% | 0.960% | 4.580% | ||||||||||||||||
| PIMCO California Municipal Income Fund III | ||||||||||||||||||||
| Series 2051 | 271 | 4.720% | 0.960% | 4.580% | ||||||||||||||||
| PIMCO New York Municipal Income Fund II | ||||||||||||||||||||
| Series 2051 | 149 | 4.720% | 0.960% | 4.580% | ||||||||||||||||
| 90 | PIMCO CLOSED-END FUNDS |
| December 31, 2022 |
| ANNUAL REPORT | | | DECEMBER 31, 2022 | 91 |
| Notes to Financial Statements | (Cont.) |
| Dividend Rate | Rate Period Fraction | Liquidation Preference | Dividend | |||||||||||||||||
| Number of days in the Rate Period (or a part thereof) | ||||||||||||||||||||
| Dividend Rate | x | Divided by | x | 100,000 | = | Dividends per RVMTP Share | ||||||||||||||
| Total number of days in the year | ||||||||||||||||||||
| 1 | The Index Rate is determined by reference to a weekly, high-grade index comprised of seven‑day, tax‑exempt variable rate demand notes, generally the Securities Industry and Financial Markets Association Municipal Swap Index. |
| 2 | The Applicable Spread for a Rate Period is a percentage per year that is based on the long-term rating most recently assigned by the applicable ratings agency to the RVMTP Shares. |
| 3 | In connection with a failed remarketing related to an Early Term Redemption, the Failed Remarketing Spread is (i) 0.75% for the first 59 days following the applicable Early Term Redemption Date, (ii) 1.00% for the 60th to the 89th day following such Early Term Redemption Date, (iii) 1.25% for the 90th to the 119th day following such Early Term Redemption Date, (iv) 1.50% for the 120th to the 149th day following such Early Term Redemption Date, and (v) 1.75% for the 150th day following such Early Term Redemption Date to the date of the associated mandatory redemption of the RVMTP Shares. In connection with a failed remarketing related to a Special Terms Period (each a “Failed Special Terms Period Remarketing”), the Failed Remarketing Spread means (i) for so long as two or more Failed Special Terms Period Remarketings have not occurred, 0.05%, and (ii) following the second occurrence of a Failed Special Terms Period Remarketing, 0.10% multiplied by the number of Failed Special Terms Period Remarketings that have occurred after the first Failed Special Terms Period Remarketing. |
| 4 | The Applicable Multiplier for a Rate Period is a percentage that is based on the long-term rating most recently assigned by the applicable ratings agency to the RVMTP Shares. |
| 5 | The Dividend Rate will in no event exceed 15% per year. |
| 92 | PIMCO CLOSED-END FUNDS |
| Undistributed Tax Exempt Income | Undistributed Ordinary Income(1) | Undistributed Long-Term Capital Gains | Net Tax Basis Unrealized Appreciation/ (Depreciation)(2) | Other Book‑to‑Tax Accounting Differences(3) | Accumulated Capital Losses(4) | Qualified Late‑Year Loss Deferral - Capital(5) | Qualified Late-Year Loss Deferral - Ordinary(6) | Total Components of Distributable Earnings | ||||||||||||||||||||||||||||||||
| PIMCO Municipal Income Fund | $ | 598 | $ | 0 | $ | 0 | $ | (19,416 | ) | $ | 0 | $ | (21,526 | ) | $ | 0 | $ | 0 | $ | (40,344 | ) | |||||||||||||||||||
| PIMCO Municipal Income Fund II | 0 | 0 | 0 | (37,407 | ) | (4,180 | ) | (59,195 | ) | 0 | 0 | (100,782 | ) | |||||||||||||||||||||||||||
| PIMCO Municipal Income Fund III | 0 | 0 | 0 | (21,967 | ) | (710 | ) | (24,833 | ) | 0 | 0 | (47,510 | ) | |||||||||||||||||||||||||||
| PIMCO California Municipal Income Fund | 0 | 0 | 0 | (10,151 | ) | (1,055 | ) | (16,551 | ) | 0 | 0 | (27,757 | ) | |||||||||||||||||||||||||||
| PIMCO California Municipal Income Fund II | 0 | 0 | 0 | (5,835 | ) | (1,156 | ) | (16,414 | ) | 0 | 0 | (23,405 | ) | |||||||||||||||||||||||||||
| PIMCO California Municipal Income Fund III | 828 | 0 | 0 | (8,661 | ) | 0 | (14,462 | ) | 0 | 0 | (22,295 | ) | ||||||||||||||||||||||||||||
| PIMCO New York Municipal Income Fund | 0 | 0 | 0 | (6,027 | ) | (371 | ) | (7,685 | ) | 0 | 0 | (14,083 | ) | |||||||||||||||||||||||||||
| PIMCO New York Municipal Income Fund II | 0 | 0 | 0 | (7,429 | ) | (256 | ) | (11,686 | ) | 0 | 0 | (19,371 | ) | |||||||||||||||||||||||||||
| PIMCO New York Municipal Income Fund III | 0 | 0 | 0 | (2,832 | ) | (238 | ) | (4,148 | ) | 0 | 0 | (7,218 | ) | |||||||||||||||||||||||||||
| † | A zero balance may reflect actual amounts rounding to less than one thousand. |
| (1) | Includes undistributed short-term capital gains, if any. |
| (2) | Adjusted for open wash sale loss deferrals. Also adjusted for differences between book and tax realized and unrealized gain (loss) on inverse floaters, RIB/TOB adjustments, interest accrued on defaulted securities, and other interest adjustments. |
| (3) | Represents differences in income tax regulations and financial accounting principles generally accepted in the United States of America mainly for distributions payable at fiscal year end. |
| (4) | Capital losses available to offset future net capital gains as shown below. |
| (5) | Capital losses realized during the period November 1, 2022 through December 31, 2022 which the Funds elected to defer to the following taxable year pursuant to income tax regulations. |
| (6) | Specified losses realized during the period November 1, 2022 through December 31, 2022 which the Funds elected to defer to the following taxable year pursuant to income tax regulations. |
| Short‑Term | Long‑Term | |||||||||||
| PIMCO Municipal Income Fund | $ | 12,729 | $ | 8,797 | ||||||||
| PIMCO Municipal Income Fund II | 30,726 | 28,469 | ||||||||||
| PIMCO Municipal Income Fund III | 12,481 | 12,352 | ||||||||||
| PIMCO California Municipal Income Fund | 9,107 | 7,444 | ||||||||||
| PIMCO California Municipal Income Fund II | 10,049 | 6,365 | ||||||||||
| PIMCO California Municipal Income Fund III | 7,962 | 6,500 | ||||||||||
| PIMCO New York Municipal Income Fund | 2,275 | 5,410 | ||||||||||
| PIMCO New York Municipal Income Fund II | 5,611 | 6,075 | ||||||||||
| PIMCO New York Municipal Income Fund III | 934 | 3,214 | ||||||||||
| † | A zero balance may reflect actual amounts rounding to less than one thousand. |
Federal Tax Cost | Unrealized Appreciation | Unrealized (Depreciation) | Net Unrealized Appreciation/ (Depreciation)(7) | |||||||||||||||||
| PIMCO Municipal Income Fund | $ | 468,061 | $ | 10,058 | $ | (29,683 | ) | $ | (19,625 | ) | ||||||||||
| PIMCO Municipal Income Fund II | 1,053,261 | 20,866 | (57,938 | ) | (37,702 | ) | ||||||||||||||
| PIMCO Municipal Income Fund III | 499,987 | 8,810 | (30,907 | ) | (22,097 | ) | ||||||||||||||
| PIMCO California Municipal Income Fund | 358,435 | 3,802 | (13,015 | ) | (9,213 | ) | ||||||||||||||
| ANNUAL REPORT | | | DECEMBER 31, 2022 | 93 |
| Notes to Financial Statements | (Cont.) | December 31, 2022 |
Federal Tax Cost | Unrealized Appreciation | Unrealized (Depreciation) | Net Unrealized Appreciation/ (Depreciation)(7) | |||||||||||||||||
| PIMCO California Municipal Income Fund II | $ | 379,868 | $ | 8,633 | $ | (13,781 | ) | $ | (5,148 | ) | ||||||||||
| PIMCO California Municipal Income Fund III | 313,539 | 3,530 | (12,165 | ) | (8,635 | ) | ||||||||||||||
| PIMCO New York Municipal Income Fund | 120,856 | 1,312 | (7,208 | ) | (5,896 | ) | ||||||||||||||
| PIMCO New York Municipal Income Fund II | 172,162 | 3,100 | (10,431 | ) | (7,331 | ) | ||||||||||||||
| PIMCO New York Municipal Income Fund III | 70,519 | 1,029 | (3,843 | ) | (2,814 | ) | ||||||||||||||
| † | A zero balance may reflect actual amounts rounding to less than one thousand. |
| (7) | Adjusted for open wash sale loss deferrals. Also adjusted for differences between book and tax realized and unrealized gain (loss) on inverse floaters, interest accrued on defaulted securities, and other interest adjustments. |
| December 31, 2022 | December 31, 2021 | |||||||||||||||||||||||||||||||||||
| Tax‑Exempt Income Distributions | Ordinary Income Distributions(8) | Long-Term Capital Gain Distributions | Return of Capital(9) | Tax‑Exempt Income Distributions | Ordinary Income Distributions(8) | Long-Term Capital Gain Distributions | Return of Capital(9) | |||||||||||||||||||||||||||||
| PIMCO Municipal Income Fund | $ | 19,763 | $ | 690 | $ | 0 | $ | 0 | $ | 16,634 | $ | 378 | $ | 0 | $ | 0 | ||||||||||||||||||||
| PIMCO Municipal Income Fund II | 43,708 | 964 | 0 | 6,891 | 44,708 | 304 | 0 | 0 | ||||||||||||||||||||||||||||
| PIMCO Municipal Income Fund III | 21,683 | 0 | 0 | 0 | 18,343 | 142 | 0 | 0 | ||||||||||||||||||||||||||||
| PIMCO California Municipal Income Fund | 13,546 | 427 | 124 | 3,671 | 14,772 | 88 | 0 | 0 | ||||||||||||||||||||||||||||
| PIMCO California Municipal Income Fund II | 14,231 | 242 | 0 | 634 | 12,387 | 93 | 0 | 0 | ||||||||||||||||||||||||||||
| PIMCO California Municipal Income Fund III | 12,155 | 172 | 0 | 0 | 10,264 | 47 | 0 | 0 | ||||||||||||||||||||||||||||
| PIMCO New York Municipal Income Fund | 3,935 | 99 | 0 | 804 | 3,964 | 27 | 0 | 0 | ||||||||||||||||||||||||||||
| PIMCO New York Municipal Income Fund II | 6,457 | 154 | 0 | 0 | 5,380 | 57 | 0 | 0 | ||||||||||||||||||||||||||||
| PIMCO New York Municipal Income Fund III | 2,425 | 61 | 0 | 587 | 2,451 | 19 | 0 | 0 | ||||||||||||||||||||||||||||
| † | A zero balance may reflect actual amounts rounding to less than one thousand. |
| (8) | Includes short-term capital gains distributed, if any. |
| (9) | A portion of the distributions made represents a tax return of capital. Return of capital distributions have been reclassified from undistributed net investment income to paid‑in capital to more appropriately conform financial accounting to tax accounting. |
| PIMCO Municipal Income Fund | $ | 0.042000 per common share | ||||||
| PIMCO Municipal Income Fund II | $ | 0.039500 per common share | ||||||
| PIMCO Municipal Income Fund III | $ | 0.033000 per common share | ||||||
| PIMCO California Municipal Income Fund | $ | 0.036000 per common share | ||||||
| PIMCO California Municipal Income Fund II | $ | 0.021500 per common share | ||||||
| PIMCO California Municipal Income Fund III | $ | 0.029500 per common share | ||||||
| PIMCO New York Municipal Income Fund | $ | 0.033500 per common share | ||||||
| PIMCO New York Municipal Income Fund II | $ | 0.029500 per common share | ||||||
| PIMCO New York Municipal Income Fund III | $ | 0.024800 per common share | ||||||
| 94 | PIMCO CLOSED-END FUNDS |
| Report of Independent Registered Public Accounting Firm |
| ANNUAL REPORT | | | DECEMBER 31, 2022 | 95 |
| Glossary: | (abbreviations that may be used in the preceding statements) | (Unaudited) |
Counterparty Abbreviations: | ||||||||||
| FICC | Fixed Income Clearing Corporation | |||||||||
Currency Abbreviations: | ||||||||||
| USD (or $) | United States Dollar | |||||||||
Exchange Abbreviations: | ||||||||||
| OTC | Over the Counter | |||||||||
Municipal Bond or Agency Abbreviations: | ||||||||||
| AGM | Assured Guaranty Municipal | CM | California Mortgage Insurance | PSF | Public School Fund | |||||
| AMBAC | American Municipal Bond Assurance Corp. | FHA | Federal Housing Administration | Q‑SBLF | Qualified School Bond Loan Fund | |||||
| BAM | Build America Mutual Assurance | NPFGC | National Public Finance Guarantee Corp. | |||||||
Other Abbreviations: | ||||||||||
| BABs | Build America Bonds | TBA | To‑Be‑Announced | |||||||
| 96 | PIMCO CLOSED-END FUNDS |
| Federal Income Tax Information | (Unaudited) |
Dividend Received Deduction % | Qualified Dividend Income % | Qualified Interest Income (000s)† | Qualified Short‑Term Capital Gains (000s)† | 163(j) Interest Dividends (000s)† | ||||||||||||||||||||
| PIMCO Municipal Income Fund | 0% | 0% | $ | 20,453 | $ | 0 | $ | 0 | ||||||||||||||||
| PIMCO Municipal Income Fund II | 0% | 0% | 51,563 | 0 | 0 | |||||||||||||||||||
| PIMCO Municipal Income Fund III | 0% | 0% | 21,683 | 0 | 0 | |||||||||||||||||||
| PIMCO California Municipal Income Fund | 0% | 0% | 17,428 | 188 | 0 | |||||||||||||||||||
| PIMCO California Municipal Income Fund II | 0% | 0% | 15,107 | 0 | 0 | |||||||||||||||||||
| PIMCO California Municipal Income Fund III | 0% | 0% | 12,327 | 0 | 0 | |||||||||||||||||||
| PIMCO New York Municipal Income Fund | 0% | 0% | 4,838 | 0 | 0 | |||||||||||||||||||
| PIMCO New York Municipal Income Fund II | 0% | 0% | 6,611 | 0 | 0 | |||||||||||||||||||
| PIMCO New York Municipal Income Fund III | 0% | 0% | 3,073 | 0 | 0 | |||||||||||||||||||
| † | A zero balance may reflect actual amounts rounding to less than one thousand. |
| 199A Dividends | ||||||||
| PIMCO Municipal Income Fund | 0% | |||||||
| PIMCO Municipal Income Fund II | 0% | |||||||
| PIMCO Municipal Income Fund III | 0% | |||||||
| PIMCO California Municipal Income Fund | 0% | |||||||
| PIMCO California Municipal Income Fund II | 0% | |||||||
| PIMCO California Municipal Income Fund III | 0% | |||||||
| PIMCO New York Municipal Income Fund | 0% | |||||||
| PIMCO New York Municipal Income Fund II | 0% | |||||||
| PIMCO New York Municipal Income Fund III | 0% | |||||||
| ANNUAL REPORT | | | JUNE 30, 2022 | 97 |
| Distribution Information |
| Municipal Income Fund | Net Investment Income* | Net Realized Capital Gains* | Paid‑in Surplus or Other Capital Sources** | Total (per common share) | ||||||||||||||||
| July 2022 | $ | 0.0540 | $ | 0.0000 | $ | 0.0000 | $ | 0.0540 | ||||||||||||
| August 2022 | $ | 0.0540 | $ | 0.0000 | $ | 0.0000 | $ | 0.0540 | ||||||||||||
| September 2022 | $ | 0.0540 | $ | 0.0000 | $ | 0.0000 | $ | 0.0540 | ||||||||||||
| October 2022 | $ | 0.0540 | $ | 0.0000 | $ | 0.0000 | $ | 0.0540 | ||||||||||||
| November 2022 | $ | 0.0540 | $ | 0.0000 | $ | 0.0000 | $ | 0.0540 | ||||||||||||
| December 2022 | $ | 0.0448 | $ | 0.0000 | $ | 0.0092 | $ | 0.0540 | ||||||||||||
| Municipal Income Fund II | Net Investment Income* | Net Realized Capital Gains* | Paid‑in Surplus or Other Capital Sources** | Total (per common share) | ||||||||||||||||
| July 2022 | $ | 0.0387 | $ | 0.0000 | $ | 0.0203 | $ | 0.0590 | ||||||||||||
| August 2022 | $ | 0.0381 | $ | 0.0000 | $ | 0.0209 | $ | 0.0590 | ||||||||||||
| September 2022 | $ | 0.0375 | $ | 0.0000 | $ | 0.0215 | $ | 0.0590 | ||||||||||||
| October 2022 | $ | 0.0263 | $ | 0.0000 | $ | 0.0327 | $ | 0.0590 | ||||||||||||
| November 2022 | $ | 0.0367 | $ | 0.0000 | $ | 0.0223 | $ | 0.0590 | ||||||||||||
| December 2022 | $ | 0.0250 | $ | 0.0000 | $ | 0.0340 | $ | 0.0590 | ||||||||||||
| Municipal Income Fund III | Net Investment Income* | Net Realized Capital Gains* | Paid‑in Surplus or Other Capital Sources** | Total (per common share) | ||||||||||||||||
| July 2022 | $ | 0.0460 | $ | 0.0000 | $ | 0.0000 | $ | 0.0460 | ||||||||||||
| August 2022 | $ | 0.0460 | $ | 0.0000 | $ | 0.0000 | $ | 0.0460 | ||||||||||||
| September 2022 | $ | 0.0460 | $ | 0.0000 | $ | 0.0000 | $ | 0.0460 | ||||||||||||
| October 2022 | $ | 0.0321 | $ | 0.0000 | $ | 0.0139 | $ | 0.0460 | ||||||||||||
| November 2022 | $ | 0.0309 | $ | 0.0000 | $ | 0.0151 | $ | 0.0460 | ||||||||||||
| December 2022 | $ | 0.0236 | $ | 0.0000 | $ | 0.0224 | $ | 0.0460 | ||||||||||||
| California Municipal Income Fund | Net Investment Income* | Net Realized Capital Gains* | Paid‑in Surplus or Other Capital Sources** | Total (per common share) | ||||||||||||||||
| July 2022 | $ | 0.0371 | $ | 0.0000 | $ | 0.0279 | $ | 0.0650 | ||||||||||||
| August 2022 | $ | 0.0345 | $ | 0.0000 | $ | 0.0305 | $ | 0.0650 | ||||||||||||
| September 2022 | $ | 0.0354 | $ | 0.0000 | $ | 0.0296 | $ | 0.0650 | ||||||||||||
| October 2022 | $ | 0.0237 | $ | 0.0000 | $ | 0.0413 | $ | 0.0650 | ||||||||||||
| November 2022 | $ | 0.0313 | $ | 0.0000 | $ | 0.0337 | $ | 0.0650 | ||||||||||||
| December 2022 | $ | 0.0123 | $ | 0.0000 | $ | 0.0527 | $ | 0.0650 | ||||||||||||
| California Municipal Income Fund II | Net Investment Income* | Net Realized Capital Gains* | Paid‑in Surplus or Other Capital Sources** | Total (per common share) | ||||||||||||||||
| July 2022 | $ | 0.0240 | $ | 0.0000 | $ | 0.0080 | $ | 0.0320 | ||||||||||||
| August 2022 | $ | 0.0220 | $ | 0.0000 | $ | 0.0100 | $ | 0.0320 | ||||||||||||
| September 2022 | $ | 0.0232 | $ | 0.0000 | $ | 0.0088 | $ | 0.0320 | ||||||||||||
| October 2022 | $ | 0.0153 | $ | 0.0000 | $ | 0.0167 | $ | 0.0320 | ||||||||||||
| November 2022 | $ | 0.0196 | $ | 0.0000 | $ | 0.0124 | $ | 0.0320 | ||||||||||||
| December 2022 | $ | 0.0105 | $ | 0.0000 | $ | 0.0215 | $ | 0.0320 | ||||||||||||
| 98 | PIMCO CLOSED-END FUNDS |
| (Unaudited) |
| California Municipal Income Fund III | Net Investment Income* | Net Realized Capital Gains* | Paid‑in Surplus or Other Capital Sources** | Total (per common share) | ||||||||||||||||
| July 2022 | $ | 0.0380 | $ | 0.0000 | $ | 0.0000 | $ | 0.0380 | ||||||||||||
| August 2022 | $ | 0.0380 | $ | 0.0000 | $ | 0.0000 | $ | 0.0380 | ||||||||||||
| September 2022 | $ | 0.0380 | $ | 0.0000 | $ | 0.0000 | $ | 0.0380 | ||||||||||||
| October 2022 | $ | 0.0380 | $ | 0.0000 | $ | 0.0000 | $ | 0.0380 | ||||||||||||
| November 2022 | $ | 0.0380 | $ | 0.0000 | $ | 0.0000 | $ | 0.0380 | ||||||||||||
| December 2022 | $ | 0.0380 | $ | 0.0000 | $ | 0.0000 | $ | 0.0380 | ||||||||||||
| New York Municipal Income Fund | Net Investment Income* | Net Realized Capital Gains* | Paid‑in Surplus or Other Capital Sources** | Total (per common share) | ||||||||||||||||
| July 2022 | $ | 0.0271 | $ | 0.0000 | $ | 0.0149 | $ | 0.0420 | ||||||||||||
| August 2022 | $ | 0.0251 | $ | 0.0000 | $ | 0.0169 | $ | 0.0420 | ||||||||||||
| September 2022 | $ | 0.0262 | $ | 0.0000 | $ | 0.0158 | $ | 0.0420 | ||||||||||||
| October 2022 | $ | 0.0168 | $ | 0.0000 | $ | 0.0252 | $ | 0.0420 | ||||||||||||
| November 2022 | $ | 0.0211 | $ | 0.0000 | $ | 0.0209 | $ | 0.0420 | ||||||||||||
| December 2022 | $ | 0.0165 | $ | 0.0000 | $ | 0.0255 | $ | 0.0420 | ||||||||||||
| New York Municipal Income Fund II | Net Investment Income* | Net Realized Capital Gains* | Paid‑in Surplus or Other Capital Sources** | Total (per common share) | ||||||||||||||||
| July 2022 | $ | 0.0400 | $ | 0.0000 | $ | 0.0000 | $ | 0.0400 | ||||||||||||
| August 2022 | $ | 0.0400 | $ | 0.0000 | $ | 0.0000 | $ | 0.0400 | ||||||||||||
| September 2022 | $ | 0.0304 | $ | 0.0000 | $ | 0.0096 | $ | 0.0400 | ||||||||||||
| October 2022 | $ | 0.0188 | $ | 0.0000 | $ | 0.0212 | $ | 0.0400 | ||||||||||||
| November 2022 | $ | 0.0237 | $ | 0.0000 | $ | 0.0163 | $ | 0.0400 | ||||||||||||
| December 2022 | $ | 0.0168 | $ | 0.0000 | $ | 0.0232 | $ | 0.0400 | ||||||||||||
| New York Municipal Income Fund III | Net Investment Income* | Net Realized Capital Gains* | Paid‑in Surplus or Other Capital Sources** | Total (per common share) | ||||||||||||||||
| July 2022 | $ | 0.0221 | $ | 0.0000 | $ | 0.0134 | $ | 0.0355 | ||||||||||||
| August 2022 | $ | 0.0220 | $ | 0.0000 | $ | 0.0135 | $ | 0.0355 | ||||||||||||
| September 2022 | $ | 0.0219 | $ | 0.0000 | $ | 0.0136 | $ | 0.0355 | ||||||||||||
| October 2022 | $ | 0.0151 | $ | 0.0000 | $ | 0.0204 | $ | 0.0355 | ||||||||||||
| November 2022 | $ | 0.0178 | $ | 0.0000 | $ | 0.0177 | $ | 0.0355 | ||||||||||||
| December 2022 | $ | 0.0148 | $ | 0.0000 | $ | 0.0207 | $ | 0.0355 | ||||||||||||
| * | The source of dividends provided in the table differs, in some respects, from information presented in this report prepared in accordance with generally accepted accounting principles, or U.S. GAAP. For example, net earnings from certain interest rate swap contracts are included as a source of net investment income for purposes of Section 19(a). Accordingly, the information in the table may differ from information in the accompanying financial statements that are presented on the basis of U.S. GAAP and may differ from tax information presented in the footnotes. Amounts shown may include accumulated, as well as fiscal period net income and net profits. |
| ** | Occurs when a fund distributes an amount greater than its accumulated net income and net profits. Amounts are not reflective of a fund’s net income, yield, earnings or investment performance. |
| ANNUAL REPORT | | | DECEMBER 31, 2022 | 99 |
| Shareholder Meeting Results |
| Affirmative | Withheld Authority | |||||||||||
| Re‑election of Deborah DeCotis — Class II to serve until the annual meeting held during the 2025 fiscal year | 17,536,877 | 781,330 | ||||||||||
| Election of Kathleen McCartney — Class II to serve until the annual meeting held during the 2025 fiscal year | 17,536,877 | 781,330 | ||||||||||
| Re‑Election of Sarah E. Cogan — Class II to serve until the annual meeting held during the 2025 fiscal year | 6,258 | 175 | ||||||||||
| Affirmative | Withheld Authority | |||||||||||
| Re‑election of Deborah DeCotis — Class II to serve until the annual meeting held during the 2025 fiscal year | 46,260,771 | 1,849,350 | ||||||||||
| Election of Kathleen McCartney — Class II to serve until the annual meeting held during the 2025 fiscal year | 46,260,771 | 1,849,350 | ||||||||||
| Re‑Election of Sarah E. Cogan — Class II to serve until the annual meeting held during the 2025 fiscal year | 10,430 | 844 | ||||||||||
| Affirmative | Withheld Authority | |||||||||||
| Re‑election of Alan Rappaport — Class II to serve until the annual meeting held during the 2025 fiscal year | 21,745,364 | 1,329,602 | ||||||||||
| Election of Kathleen McCartney — Class II to serve until the annual meeting held during the 2025 fiscal year | 21,745,364 | 1,329,602 | ||||||||||
| Re‑election of Joseph B. Kittredge, Jr. — Class II to serve until the annual meeting held during the 2025 fiscal year | 5,303 | 573 | ||||||||||
| 100 | PIMCO CLOSED-END FUNDS |
| (Unaudited) |
| Affirmative | Withheld Authority | |||||||||||
| Re‑election of Deborah DeCotis — Class II to serve until the annual meeting held during the 2025 fiscal year | 12,197,351 | 482,457 | ||||||||||
| Election of Kathleen McCartney — Class II to serve until the annual meeting held during the 2025 fiscal year | 12,197,351 | 482,457 | ||||||||||
| Re‑Election of Sarah E. Cogan — Class II to serve until the annual meeting held during the 2025 fiscal year | 4,403 | 204 | ||||||||||
| Affirmative | Withheld Authority | |||||||||||
| Re‑election of Deborah DeCotis — Class II to serve until the annual meeting held during the 2025 fiscal year | 18,799,595 | 1,135,378 | ||||||||||
| Election of Kathleen McCartney — Class II to serve until the annual meeting held during the 2025 fiscal year | 18,799,595 | 1,135,378 | ||||||||||
| Re‑Election of Sarah E. Cogan — Class II to serve until the annual meeting held during the 2025 fiscal year | 3,789 | 856 | ||||||||||
| Affirmative | Withheld Authority | |||||||||||
| Re‑election of Alan Rappaport — Class II to serve until the annual meeting held during the 2025 fiscal year | 13,103,812 | 508,897 | ||||||||||
| Election of Kathleen McCartney — Class II to serve until the annual meeting held during the 2025 fiscal year | 13,103,812 | 508,897 | ||||||||||
| Re‑election of Joseph B. Kittredge, Jr. — Class II to serve until the annual meeting held during the 2025 fiscal year | 3,364 | 323 | ||||||||||
| Affirmative | Withheld Authority | |||||||||||
| Re‑election of Deborah DeCotis — Class II to serve until the annual meeting held during the 2025 fiscal year | 5,804,899 | 94,034 | ||||||||||
| Election of Kathleen McCartney — Class II to serve until the annual meeting held during the 2025 fiscal year | 5,804,899 | 94,034 | ||||||||||
| Re‑Election of Sarah E. Cogan — Class II to serve until the annual meeting held during the 2025 fiscal year | 1,305 | 82 | ||||||||||
| ANNUAL REPORT | | | DECEMBER 31, 2022 | 101 |
| Shareholder Meeting Results | (Cont.) | (Unaudited) |
| Affirmative | Withheld Authority | |||||||||||
| Re‑election of Deborah DeCotis — Class II to serve until the annual meeting held during the 2025 fiscal year | 6,948,573 | 284,019 | ||||||||||
| Election of Kathleen McCartney — Class II to serve until the annual meeting held during the 2025 fiscal year | 6,948,573 | 284,019 | ||||||||||
| Re‑Election of Sarah E. Cogan — Class II to serve until the annual meeting held during the 2025 fiscal year | 2,015 | 62 | ||||||||||
| Affirmative | Withheld Authority | |||||||||||
Re‑election of David Fisher† — Class II to serve until the annual meeting held during the 2025 fiscal year | 3,770,438 | 176,351 | ||||||||||
| Election of Kathleen McCartney — Class II to serve until the annual meeting held during the 2025 fiscal year | 3,770,438 | 176,351 | ||||||||||
| Re‑election of Sarah E. Cogan — Class II to serve until the annual meeting held during the 2025 fiscal year | 1,043 | 25 | ||||||||||
| † | Interested Trustee |
| 102 | PIMCO CLOSED-END FUNDS |
| Changes to Boards of Trustees | (Unaudited) |
| ANNUAL REPORT | | | DECEMBER 31, 2022 | 103 |
| Dividend Reinvestment Plan |
| 104 | PIMCO CLOSED-END FUNDS |
| (Unaudited) |
| ANNUAL REPORT | | | DECEMBER 31, 2022 | 105 |
| Additional Information Regarding the Funds | (Unaudited) |
| 1. | The Board of Trustees approved the elimination of a non‑fundamental investment guideline governing the amount of leverage each Fund can maintain and related asset segregation and coverage requirements that are no longer applicable to the Fund. Effective December 22, 2022, the following non‑fundamental guideline was removed and, accordingly, disclosure was removed from each Fund’s registration statement and is not included in the “Use of Leverage” section of this annual report: |
| Fund Name | Total Commission Paid | Total Commission Paid to Affiliated Brokers | ||||||||||
| Municipal Income Fund | $ | 0 | $ | 0 | ||||||||
| Municipal Income Fund II | $ | 0 | $ | 0 | ||||||||
| Municipal Income Fund III | $ | 0 | $ | 0 | ||||||||
| California Municipal Income Fund | $ | 0 | $ | 0 | ||||||||
| California Municipal Income Fund II | $ | 0 | $ | 0 | ||||||||
| California Municipal Income Fund III | $ | 0 | $ | 0 | ||||||||
| New York Municipal Income Fund | $ | 0 | $ | 0 | ||||||||
| New York Municipal Income Fund II | $ | 0 | $ | 0 | ||||||||
| New York Municipal Income Fund III | $ | 0 | $ | 0 | ||||||||
| † | A zero balance may reflect actual amounts rounding to less than one thousand. |
| 106 | PIMCO CLOSED-END FUNDS |
| Principal Investment Strategies | (Unaudited) |
| ANNUAL REPORT | | | DECEMBER 31, 2022 | 107 |
| Principal Investment Strategies | (Cont.) |
| 108 | PIMCO CLOSED-END FUNDS |
| (Unaudited) |
| ANNUAL REPORT | | | DECEMBER 31, 2022 | 109 |
| Principal Investment Strategies | (Cont.) | (Unaudited) |
| 110 | PIMCO CLOSED-END FUNDS |
| Principal Risks of the Funds | (Unaudited) |
| ANNUAL REPORT | | | DECEMBER 31, 2022 | 111 |
| Principal Risks of the Funds | (Cont.) |
| 112 | PIMCO CLOSED-END FUNDS |
| (Unaudited) |
| ANNUAL REPORT | | | DECEMBER 31, 2022 | 113 |
| Principal Risks of the Funds | (Cont.) |
| 114 | PIMCO CLOSED-END FUNDS |
| (Unaudited) |
| ANNUAL REPORT | | | DECEMBER 31, 2022 | 115 |
| Principal Risks of the Funds | (Cont.) |
| 116 | PIMCO CLOSED-END FUNDS |
| (Unaudited) |
| ANNUAL REPORT | | | DECEMBER 31, 2022 | 117 |
| Principal Risks of the Funds | (Cont.) |
| ∎ | the likelihood of greater volatility of NAV and market price of Common Shares, and of the investment return to Common Shareholders, than a comparable portfolio without leverage; |
| ∎ | the possibility either that Common Share dividends will fall if the interest and other costs of leverage rise, or that dividends paid on Common Shares will fluctuate because such costs vary over time; and |
| ∎ | the effects of leverage in a declining market or a rising interest rate environment, as leverage is likely to cause a greater decline in the NAV of the Common Shares than if a Fund were not leveraged and may result in a greater decline in the market value of the Common Shares. |
| 118 | PIMCO CLOSED-END FUNDS |
| (Unaudited) |
| 1 | The types of leverage on which fees are received by the Investment Manager with respect to the Fund are discussed in Note 8 in the Notes to Financial Statements. |
| ANNUAL REPORT | | | DECEMBER 31, 2022 | 119 |
| Principal Risks of the Funds | (Cont.) |
| 120 | PIMCO CLOSED-END FUNDS |
| (Unaudited) |
| ANNUAL REPORT | | | DECEMBER 31, 2022 | 121 |
| Principal Risks of the Funds | (Cont.) |
| 122 | PIMCO CLOSED-END FUNDS |
| (Unaudited) |
| ANNUAL REPORT | | | DECEMBER 31, 2022 | 123 |
| Principal Risks of the Funds | (Cont.) |
| 124 | PIMCO CLOSED-END FUNDS |
| (Unaudited) |
| ANNUAL REPORT | | | DECEMBER 31, 2022 | 125 |
| Principal Risks of the Funds | (Cont.) |
| 126 | PIMCO CLOSED-END FUNDS |
| (Unaudited) |
| ANNUAL REPORT | | | DECEMBER 31, 2022 | 127 |
| Principal Risks of the Funds | (Cont.) |
| 128 | PIMCO CLOSED-END FUNDS |
| (Unaudited) |
| ANNUAL REPORT | | | DECEMBER 31, 2022 | 129 |
| Principal Risks of the Funds | (Cont.) |
| 130 | PIMCO CLOSED-END FUNDS |
| (Unaudited) |
| ANNUAL REPORT | | | DECEMBER 31, 2022 | 131 |
| Principal Risks of the Funds | (Cont.) |
| 132 | PIMCO CLOSED-END FUNDS |
| (Unaudited) |
| ANNUAL REPORT | | | DECEMBER 31, 2022 | 133 |
| How Each Fund Manages Risk | (Unaudited) |
| 134 | PIMCO CLOSED-END FUNDS |
| Effects of Leverage | (Unaudited) |
Municipal Income Fund (PMF) | Municipal Income Fund II (PML) | Municipal Income Fund III (PMX) | California Municipal Income Fund (PCQ) | California Municipal Income Fund II (PCK) | California Municipal Income Fund III (PZC) | New York Municipal Income Fund (PNF) | New York Municipal Income Fund II (PNI) | New York Municipal Income Fund III (PYN) | ||||||||||||||||||||||||||||||||
| Preferred Shares as a Percentage of Total Managed Assets (Including Assets Attributable to Preferred Shares and TOBs) | 36.22 | % | 31.42 | % | 34.03 | % | 36.54 | % | 37.63 | % | 36.48 | % | 30.17 | % | 39.45 | % | 37.62 | % | ||||||||||||||||||||||
| Estimated Annual Effective Preferred Share Dividend Rate | 6.01 | % | 6.01 | % | 6.01 | % | 5.98 | % | 6.01 | % | 6.05 | % | 6.05 | % | 6.00 | % | 5.94 | % | ||||||||||||||||||||||
| TOBs as a Percentage of Total Managed Assets (Including Assets Attributable to Preferred Shares and TOBs) | 9.34 | % | 14.50 | % | 11.51 | % | 9.40 | % | 6.85 | % | 8.62 | % | 13.53 | % | 4.83 | % | 7.59 | % | ||||||||||||||||||||||
| Estimated Annual Effective Interest Expense Rate Payable by Fund on TOBs | 1.35 | % | 1.43 | % | 1.34 | % | 1.30 | % | 1.36 | % | 1.31 | % | 1.01 | % | 1.37 | % | 1.02 | % | ||||||||||||||||||||||
| Annual Return Fund Portfolio Must Experience (net of expenses) to Cover Estimated Annual Effective Preferred Share Dividend Rate and Interest Expense Rate on TOBs | 2.25 | % | 1.99 | % | 2.11 | % | 2.22 | % | 2.26 | % | 2.20 | % | 1.96 | % | 2.32 | % | 2.31 | % | ||||||||||||||||||||||
| Common Share Total Return for (10.00)% Assumed Portfolio Total Return | (22.50 | )% | (22.17 | )% | (22.23 | )% | (22.61 | )% | (22.08 | )% | (22.23 | )% | (21.25 | )% | (22.11 | )% | (22.47 | )% | ||||||||||||||||||||||
| Common Share Total Return for (5.00)% Assumed Portfolio Total Return | (13.32 | )% | (12.92 | )% | (13.05 | )% | (13.36 | )% | (13.07 | )% | (13.12 | )% | (12.37 | )% | (13.13 | )% | (13.35 | )% | ||||||||||||||||||||||
| Common Share Total Return for 0.00% Assumed Portfolio Total Return | (4.13 | )% | (3.68 | )% | (3.87 | )% | (4.11 | )% | (4.07 | )% | (4.01 | )% | (3.49 | )% | (4.16 | )% | (4.22 | )% | ||||||||||||||||||||||
| Common Share Total Return for 5.00% Assumed Portfolio Total Return | 5.05 | % | 5.57 | % | 5.31 | % | 5.14 | % | 4.94 | % | 5.09 | % | 5.40 | % | 4.82 | % | 4.91 | % | ||||||||||||||||||||||
| Common Share Total Return for 10.00% Assumed Portfolio Total Return | 14.23 | % | 14.81 | % | 14.49 | % | 14.39 | % | 13.94 | % | 14.20 | % | 14.28 | % | 13.79 | % | 14.03 | % | ||||||||||||||||||||||
| ANNUAL REPORT | | | DECEMBER 31, 2022 | 135 |
| Fundamental Investment Restrictions |
| (1) | Concentrate its investments in a particular “industry,” as that term is used in the Investment Company Act of 1940, as amended, and as interpreted, modified, or otherwise permitted by regulatory authority having jurisdiction, from time to time. |
| (2) | With respect to 75% of the Fund’s total assets, purchase the securities of any issuer, except securities issued or guaranteed by the U.S. Government or any of its agencies or instrumentalities or securities issued by other investment companies, if, as a result, (i) more than 5% of the Fund’s total assets would be invested in the securities of that issuer, or (ii) the Fund would hold more than 10% of the outstanding voting securities of that issuer. For the purpose of this restriction, each state and each separate political subdivision, agency, authority or instrumentality of such state, each multi-state agency or authority, and each obligor, if any, is treated as a separate issuer of municipal bonds. |
| (3) | Purchase or sell real estate, although it may purchase securities (including municipal bonds) secured by real estate or interests therein, or securities issued by companies which invest in real estate, or interests therein. |
| (4) | Purchase or sell commodities or commodities contracts or oil, gas or mineral programs. This restriction shall not prohibit the Fund (as described in the “Portfolio Contents” section above) from purchasing, selling or entering into futures contracts, options on futures contracts, forward contracts, or any interest rate, securities-related or other hedging instrument, including swap agreements and other derivative instruments, subject to compliance with any applicable provisions of the federal securities or commodities laws. |
| (5) | Borrow money or issue any senior security, except to the extent permitted under the Investment Company Act of 1940, as amended, and as interpreted, modified, or otherwise permitted by regulatory authority having jurisdiction, from time to time. |
| (6) | Make loans, except to the extent permitted under the Investment Company Act of 1940, as amended, and as interpreted, modified, or otherwise permitted by regulatory authority having jurisdiction, from time to time. |
| (7) | Act as an underwriter of securities of other issuers, except to the extent that in connection with the disposition of portfolio securities, it may be deemed to be an underwriter under the federal securities laws. |
| (1) | Concentrate its investments in a particular “industry,” as that term is used in the Investment Company Act of 1940, as amended, and as interpreted, modified, or otherwise permitted by regulatory authority having jurisdiction, from time to time. |
| (2) | With respect to 75% of the Fund’s total assets, purchase the securities of any issuer, except securities issued or guaranteed by the U.S. Government or any of its agencies or instrumentalities or securities issued by other investment companies, if, as a result, (i) more than 5% of the Fund’s total assets would be invested in the securities of that issuer, or (ii) the Fund would hold more than 10% of the outstanding voting securities of that issuer. For the purpose of this restriction, each state and each separate political subdivision, agency, authority or instrumentality of such state, each multi-state agency or authority, and each obligor, if any, is treated as a separate issuer of municipal bonds. |
| (3) | Purchase or sell real estate, although it may purchase securities (including municipal bonds) secured by real estate or interests |
| 136 | PIMCO CLOSED-END FUNDS |
| (Unaudited) |
| therein, or securities issued by companies which invest in real estate, or interests therein. |
| (4) | Purchase or sell commodities or commodities contracts or oil, gas or mineral programs. This restriction shall not prohibit the Fund (as described in the “Portfolio Contents” section above) from purchasing, selling or entering into futures contracts, options on futures contracts, forward contracts, or any interest rate, securities-related or other hedging instrument, including swap agreements and other derivative instruments, subject to compliance with any applicable provisions of the federal securities or commodities laws. |
| (5) | Borrow money or issue any senior security, except to the extent permitted under the Investment Company Act of 1940, as amended, and as interpreted, modified, or otherwise permitted by regulatory authority having jurisdiction, from time to time. |
| (6) | Make loans, except to the extent permitted under the Investment Company Act of 1940, as amended, and as interpreted, modified, or otherwise permitted by regulatory authority having jurisdiction, from time to time. |
| (7) | Act as an underwriter of securities of other issuers, except to the extent that in connection with the disposition of portfolio securities, it may be deemed to be an underwriter under the federal securities laws. |
| (8) | Make an investment if, at the time of such investment, the Fund has invested less than 80% of its “assets” (as that term is defined in Rule 35d‑1 under the Investment Company Act of 1940, as amended) in investments the income from which is, in the opinion of bond counsel to the issuer (or on the basis of other authority believed by the Fund’s portfolio manager to be reliable), exempt from federal income tax (not including, for these purposes, the federal alternative minimum tax). |
| (1) | Concentrate its investments in a particular “industry,” as that term is used in the Investment Company Act of 1940, as amended, and as interpreted, modified, or otherwise permitted by regulatory authority having jurisdiction, from time to time. |
| (2) | With respect to 75% of the Fund’s total assets, purchase the securities of any issuer, except securities issued or guaranteed by the U.S. Government or any of its agencies or instrumentalities or securities issued by other investment companies, if, as a result, (i) more than 5% of the Fund’s total assets would be invested in the securities of that issuer, or (ii) the Fund would hold more than 10% of the outstanding voting securities of that issuer. For the purpose of this restriction, each state and each separate political subdivision, agency, authority or instrumentality of such state, each multi-state agency or authority, and each obligor, if any, is treated as a separate issuer of municipal bonds. |
| (3) | Purchase or sell real estate, although it may purchase securities (including municipal bonds) secured by real estate or interests therein, or securities issued by companies which invest in real estate, or interests therein. |
| (4) | Purchase or sell commodities or commodities contracts or oil, gas or mineral programs. This restriction shall not prohibit the Fund (as described in the “Portfolio Contents” section above) from purchasing, selling or entering into futures contracts, options on futures contracts, forward contracts, or any interest rate, securities-related or other hedging instrument, including swap agreements and other derivative instruments, subject to compliance with any applicable provisions of the federal securities or commodities laws. |
| (5) | Borrow money or issue any senior security, except to the extent permitted under the Investment Company Act of 1940, as amended, and as interpreted, modified, or otherwise permitted by regulatory authority having jurisdiction, from time to time. |
| (6) | Make loans, except to the extent permitted under the Investment Company Act of 1940, as amended, and as interpreted, modified, or otherwise permitted by regulatory authority having jurisdiction, from time to time. |
| (7) | Act as an underwriter of securities of other issuers, except to the extent that in connection with the disposition of portfolio securities, it may be deemed to be an underwriter under the federal securities laws. |
| ANNUAL REPORT | | | DECEMBER 31, 2022 | 137 |
| Fundamental Investment Restrictions | (Cont.) |
| (1) | Concentrate its investments in a particular “industry,” as that term is used in the Investment Company Act of 1940, as amended, and as interpreted, modified, or otherwise permitted by regulatory authority having jurisdiction, from time to time. |
| (2) | Purchase or sell real estate, although it may purchase securities (including municipal bonds) secured by real estate or interests therein, or securities issued by companies which invest in real estate, or interests therein. |
| (3) | Purchase or sell commodities or commodities contracts or oil, gas or mineral programs. This restriction shall not prohibit the Fund (as described in the “Portfolio Contents” section above) from purchasing, selling or entering into futures contracts, options on futures contracts, forward contracts, or any interest rate, securities-related or other hedging instrument, including swap agreements and other derivative instruments, subject to compliance with any applicable provisions of the federal securities or commodities laws. |
| (4) | Borrow money or issue any senior security, except to the extent permitted under the Investment Company Act of 1940, as amended, and as interpreted, modified, or otherwise permitted by regulatory authority having jurisdiction, from time to time. |
| (5) | Make loans, except to the extent permitted under the Investment Company Act of 1940, as amended, and as interpreted, modified, or otherwise permitted by regulatory authority having jurisdiction, from time to time. |
| (6) | Act as an underwriter of securities of other issuers, except to the extent that in connection with the disposition of portfolio securities, it may be deemed to be an underwriter under the federal securities laws. |
| (1) | Concentrate its investments in a particular “industry,” as that term is used in the Investment Company Act of 1940, as amended, and as interpreted, modified, or otherwise permitted by regulatory authority having jurisdiction, from time to time. |
| (2) | Purchase or sell real estate, although it may purchase securities (including municipal bonds) secured by real estate or interests therein, or securities issued by companies which invest in real estate, or interests therein. |
| (3) | Purchase or sell commodities or commodities contracts or oil, gas or mineral programs. This restriction shall not prohibit the Fund (as described in the “Portfolio Contents” section above) from purchasing, selling or entering into futures contracts, options on futures contracts, forward contracts, or any interest rate, securities-related or other hedging instrument, including swap agreements and other derivative instruments, subject to compliance with any applicable provisions of the federal securities or commodities laws. |
| (4) | Borrow money or issue any senior security, except to the extent permitted under the Investment Company Act of 1940, as amended, and as interpreted, modified, or otherwise permitted by regulatory authority having jurisdiction, from time to time. |
| 138 | PIMCO CLOSED-END FUNDS |
| (Unaudited) |
| (5) | Make loans, except to the extent permitted under the Investment Company Act of 1940, as amended, and as interpreted, modified, or otherwise permitted by regulatory authority having jurisdiction, from time to time. |
| (6) | Act as an underwriter of securities of other issuers, except to the extent that in connection with the disposition of portfolio securities, it may be deemed to be an underwriter under the federal securities laws. |
| (1) | Concentrate its investments in a particular “industry,” as that term is used in the Investment Company Act of 1940, as amended, and as interpreted, modified, or otherwise permitted by regulatory authority having jurisdiction, from time to time. |
| (2) | Purchase or sell real estate, although it may purchase securities (including municipal bonds) secured by real estate or interests therein, or securities issued by companies which invest in real estate, or interests therein. |
| (3) | Purchase or sell commodities or commodities contracts or oil, gas or mineral programs. This restriction shall not prohibit the Fund (as described in the “Portfolio Contents” section above) from purchasing, selling or entering into futures contracts, options on futures contracts, forward contracts, or any interest rate, securities-related or other hedging instrument, including swap agreements and other derivative instruments, subject to compliance with any applicable provisions of the federal securities or commodities laws. |
| (4) | Borrow money or issue any senior security, except to the extent permitted under the Investment Company Act of 1940, as amended, and as interpreted, modified, or otherwise permitted by regulatory authority having jurisdiction, from time to time. |
| (5) | Make loans, except to the extent permitted under the Investment Company Act of 1940, as amended, and as interpreted, modified, or otherwise permitted by regulatory authority having jurisdiction, from time to time. |
| (6) | Act as an underwriter of securities of other issuers, except to the extent that in connection with the disposition of portfolio securities, it may be deemed to be an underwriter under the federal securities laws. |
| ANNUAL REPORT | | | DECEMBER 31, 2022 | 139 |
| Fundamental Investment Restrictions | (Cont.) |
| (1) | Concentrate its investments in a particular “industry,” as that term is used in the Investment Company Act of 1940, as amended, and as interpreted, modified, or otherwise permitted by regulatory authority having jurisdiction, from time to time. |
| (2) | Purchase or sell real estate, although it may purchase securities (including municipal bonds) secured by real estate or interests therein, or securities issued by companies which invest in real estate, or interests therein. |
| (3) | Purchase or sell commodities or commodities contracts or oil, gas or mineral programs. This restriction shall not prohibit the Fund (as described in the “Portfolio Contents” section above) from purchasing, selling or entering into futures contracts, options on futures contracts, forward contracts, or any interest rate, securities-related or other hedging instrument, including swap agreements and other derivative instruments, subject to compliance with any applicable provisions of the federal securities or commodities laws. |
| (4) | Borrow money or issue any senior security, except to the extent permitted under the Investment Company Act of 1940, as amended, and as interpreted, modified, or otherwise permitted by regulatory authority having jurisdiction, from time to time. |
| (5) | Make loans, except to the extent permitted under the Investment Company Act of 1940, as amended, and as interpreted, modified, or otherwise permitted by regulatory authority having jurisdiction, from time to time. |
| (6) | Act as an underwriter of securities of other issuers, except to the extent that in connection with the disposition of portfolio securities, it may be deemed to be an underwriter under the federal securities laws. |
| (1) | Concentrate its investments in a particular “industry,” as that term is used in the Investment Company Act of 1940, as amended, and as interpreted, modified, or otherwise permitted by regulatory authority having jurisdiction, from time to time. |
| (2) | Purchase or sell real estate, although it may purchase securities (including municipal bonds) secured by real estate or interests therein, or securities issued by companies which invest in real estate, or interests therein. |
| (3) | Purchase or sell commodities or commodities contracts or oil, gas or mineral programs. This restriction shall not prohibit the Fund (as described in the “Portfolio Contents” section above) from purchasing, selling or entering into futures contracts, options on futures contracts, forward contracts, or any interest rate, securities-related or other hedging instrument, including swap agreements and other derivative instruments, subject to compliance with any applicable provisions of the federal securities or commodities laws. |
| (4) | Borrow money or issue any senior security, except to the extent permitted under the Investment Company Act of 1940, as amended, and as interpreted, modified, or otherwise permitted by regulatory authority having jurisdiction, from time to time. |
| (5) | Make loans, except to the extent permitted under the Investment Company Act of 1940, as amended, and as interpreted, modified, or otherwise permitted by regulatory authority having jurisdiction, from time to time. |
| (6) | Act as an underwriter of securities of other issuers, except to the extent that in connection with the disposition of portfolio securities, it may be deemed to be an underwriter under the federal securities laws. |
| 140 | PIMCO CLOSED-END FUNDS |
| (Unaudited) |
| (1) | Concentrate its investments in a particular “industry,” as that term is used in the Investment Company Act of 1940, as amended, and as interpreted, modified, or otherwise permitted by regulatory authority having jurisdiction, from time to time. |
| (2) | Purchase or sell real estate, although it may purchase securities (including municipal bonds) secured by real estate or interests therein, or securities issued by companies which invest in real estate, or interests therein. |
| (3) | Purchase or sell commodities or commodities contracts or oil, gas or mineral programs. This restriction shall not prohibit the Fund (as described in the “Portfolio Contents” section above) from purchasing, selling or entering into futures contracts, options on futures contracts, forward contracts, or any interest rate, securities-related or other hedging instrument, including swap agreements and other derivative instruments, subject to compliance with any applicable provisions of the federal securities or commodities laws. |
| (4) | Borrow money or issue any senior security, except to the extent permitted under the Investment Company Act of 1940, as amended, and as interpreted, modified, or otherwise permitted by regulatory authority having jurisdiction, from time to time. |
| (5) | Make loans, except to the extent permitted under the Investment Company Act of 1940, as amended, and as interpreted, modified, or otherwise permitted by regulatory authority having jurisdiction, from time to time. |
| (6) | Act as an underwriter of securities of other issuers, except to the extent that in connection with the disposition of portfolio securities, it may be deemed to be an underwriter under the federal securities laws. |
| ANNUAL REPORT | | | DECEMBER 31, 2022 | 141 |
| Management of the Funds |
| Name and Year of Birth | Position(s) Held with the Funds | Term of Office and Length of Time Served* | Principal Occupation(s) During the Past 5 Years | Number of Portfolios in Fund Complex Overseen by Trustee | Other Directorships Held by Trustee During the Past 5 Years | |||||
| Independent Trustees | ||||||||||
Deborah A. DeCotis 1952 | Chair of the Board, Trustee | Trustee of the Funds since 2011, expected to stand for re‑election at the annual meeting of shareholders during the 2025 fiscal year for PMF, PCQ, PNF, PML, PCK, and PNI and during the 2023 fiscal year for PMX, PZC and PYN. | Advisory Director, Morgan Stanley & Co., Inc. (since 1996); Member, Circle Financial Group (since 2009); Member, Council on Foreign Relations (since 2013); Trustee, Smith College (since 2017); and Director, Watford Re (since 2017). Formerly, Co‑Chair Special Projects Committee, Memorial Sloan Kettering (2005-2015); Trustee, Stanford University (2010-2015); Principal, LaLoop LLC, a retail accessories company (1999-2014); Director, Helena Rubenstein Foundation (1997-2010); and Director, Armor Holdings (2002-2010). | 26 | Trustee, Allianz Funds (2011‑2021); Trustee, Virtus Funds (2021‑Present). | |||||
Sarah E. Cogan 1956 | Trustee | Trustee of the Funds since 2019, expected to stand for election at the annual meeting of the shareholders during the 2025 fiscal year for PMF, PCQ, PNF, PML, PCK, PNI and PYN and during the 2024 fiscal year for PMX and PZC. | Retired Partner, Simpson Thacher & Bartlett LLP (law firm) (1989-2018); Director, Girl Scouts of Greater New York, Inc. (since 2016); and Trustee, Natural Resources Defense Council, Inc. (since 2013). | 26 | Trustee, Allianz Funds (2019-2021); Trustee, Virtus Funds (2021-Present). | |||||
Joseph B. Kittredge, Jr. 1954 | Trustee | Trustee of the Funds since 2020, expected to stand for re‑election at the annual meeting of shareholders during the 2025 fiscal year for PMX and PZC and during the 2023 fiscal year for PMF, PCQ, PNF, PML, PCK, PNI and PYN. | Trustee (since 2019) and Governance Committee (since 2020), Vermont Law School; Director and Treasurer, Center for Reproductive Rights (since 2015); Formerly, Director (2013-2020) and Chair (2018-2020), ACLU of Massachusetts; General Counsel, Grantham, Mayo, Van Otterloo & Co. LLC (2005-2018) and Partner (2007-2018); President, GMO Trust (institutional mutual funds) (2009-2018); Chief Executive Officer, GMO Trust (2009‑2015); President and Chief Executive Officer, GMO Series Trust (platform based mutual funds) (2011‑2013). | 26 | Trustee, GMO Trust (2010-2018); Chairman of the Board of Trustees, GMO Series Trust (2011‑2018). | |||||
Kathleen McCartney 1956 | Trustee | Trustee of the Funds since 2022, expected to stand for re‑election at the annual meeting of shareholders during the 2025 fiscal year for PMF, PCQ, PNF, PML, PCK, PMX, PZC and PYN. | President, Smith College (since 2013); Director (since 2013) and President (since 2020), Five Colleges, Inc., consortium of liberal arts colleges and universities (since 2013); Formerly, Director, American Council on Education Board of Directors, (2015-2019); Director, Consortium on Financing Higher Education Board of Directors (2015-2019); Director, edX Board of Directors, online course provider (2012-2013); Director, Bellwether Education Partners Board, national nonprofit organization (2010-2013); Dean, Harvard Graduate School of Education (2006-2013); Trustee, Tufts University (2007-2013). | 26 | None. | |||||
| 142 | PIMCO CLOSED-END FUNDS |
| (Unaudited) |
| Name and Year of Birth | Position(s) Held with the Funds | Term of Office and Length of Time Served* | Principal Occupation(s) During the Past 5 Years | Number of Portfolios in Fund Complex Overseen by Trustee | Other Directorships Held by Trustee During the Past 5 Years | |||||
Alan Rappaport 1953 | Trustee | Trustee of the Funds since 2010, expected to stand for re‑election at the annual meeting of shareholders during the 2024 fiscal year for PMF, PCQ, PNF, PML, PCK, PNI and PYN and during the 2025 fiscal year for PMX and PZC. | Director, Victory Capital Holdings, Inc., an asset management firm (since 2013). Formerly, Adjunct Professor, New York University Stern School of Business (2011-2020); Lecturer, Stanford University Graduate School of Business (2013-2020); Advisory Director (formerly Vice Chairman), Roundtable Investment Partners (2009-2018); Member of Board of Overseers, NYU Langone Medical Center (2015-2016); Trustee, American Museum of Natural History (2005-2015); Trustee, NYU Langone Medical Center (2007-2015); and Vice Chairman (formerly, Chairman and President), U.S. Trust (formerly, Private Bank of Bank of America, the predecessor entity of U.S. Trust) (2001-2008). | 26 | Trustee, Allianz Funds (2010-2021); Chairman of the Board of Trustees, Virtus Closed‑End Funds (2021‑Present) | |||||
E. Grace Vandecruze 1963 | Trustee | Trustee of the Funds since 2021, expected to stand for re‑election at the annual meeting of shareholders during the 2024 fiscal year for each Fund. | Founder and Managing Director, Grace Global Capital LLC, a strategic advisory firm to the insurance industry (since 2006); Director, The Doctors Company, a medical malpractice insurance company (since 2020); Chief Financial Officer, Athena Technology Acquisition Corp, a special purpose acquisition company (since 2021); Director, Link Logistics REIT, a real estate company (since 2021); Director and Member of the Investment & Risk Committee, Resolution Life Group Holdings, a global life insurance group (since 2021); and Director, Wharton Graduate Executive Board. Formerly, Director, Resolution Holdings (2015-2019). Formerly, Director and Member of the Audit Committee and the Wealth Solutions Advisory Committee, M Financial Group, a life insurance company (2015-2021); Director, SBLI USA, a life insurance company (2015-2018). | 26 | None | |||||
| Interested Trustees | ||||||||||
David N. Fisher** 1968 | Trustee | Trustee of the Funds since 2019, expected to stand for election at the annual meeting of the shareholders during the 2023 fiscal year for each Fund. | Managing Director and Co‑Head of U.S. Global Wealth Management Strategic Accounts, PIMCO (since 2021); Managing Director and Head of Traditional Product Strategies, PIMCO (2015-2021); and Director, Court Appointed Special Advocates (CASA) of Orange County, a non‑profit organization (since 2015). Formerly, Global Bond Strategist, PIMCO (2008-2015); and Managing Director and Head of Global Fixed Income, HSBC Global Asset Management (2005-2008). | 26 | None | |||||
John C. Maney*** 1959 | Trustee | Trustee of the Funds since 2006, expected to stand for re‑election at the annual meeting of shareholders during the 2024 fiscal year for each Fund. | Senior Advisor to PIMCO (since June 2021); Non‑Executive Director and a member of the Compensation Committee of PIMCO Europe Ltd (since December 2017). Formerly, Consultant to PIMCO (January 2020-June 2021); Managing Director of Allianz Asset Management of America L.P. (2005-2019); member of the Management Board and Chief Operating Officer of Allianz Asset Management of America L.P (2006-2019); Member of the Management Board of Allianz Global Investors Fund Management LLC (2007-2014) and Managing Director of Allianz Global Investors Fund Management LLC (2011-2014). | 26 | None | |||||
| * | Under the Fund’s Amended and Restated Agreement and Declaration of Trust, a Trustee serves until his or her retirement, resignation or replacement. |
| ** | Mr. Fisher is an “interested person” of the Fund, as defined in Section 2(a)(19) of the Act, due to his affiliation with PIMCO and its affiliates. Mr. Fisher’s address is 650 Newport Center Drive, Newport Beach, California 92660. |
| *** | Mr. Maney is an “interested person” of the Fund, as defined in Section 2(a)(19) of the Act, due to his affiliation with PIMCO and its affiliates. Mr. Maney’s address is 650 Newport Center Drive, Newport Beach, California 92660. |
| ANNUAL REPORT | | | DECEMBER 31, 2022 | 143 |
| Management of the Funds | (Cont.) | (Unaudited) |
| Name, Address and Year of Birth | Position(s) Held with Funds | Term of Office and Length of Time Served | Principal Occupation(s) During the Past 5 Years | |||
Eric D. Johnson1 1970 | President | Since 2019 | Executive Vice President and Head of Funds Business Group Americas, PIMCO. President, PIMCO-Managed Funds, PIMCO Funds, PIMCO Variable Insurance Trust, PIMCO ETF Trust, PIMCO Equity Series, PIMCO Equity Series VIT and PIMCO Flexible Real Estate Income Fund. | |||
Keisha Audain-Pressley 1975 | Chief Compliance Officer | Since 2018 | Executive Vice President and Deputy Chief Compliance Officer, PIMCO. Chief Compliance Officer, PIMCO-Managed Funds, PIMCO Funds, PIMCO Variable Insurance Trust, PIMCO ETF Trust, PIMCO Equity Series, PIMCO Equity Series VIT, PIMCO Capital Solutions BDC Corp. and PIMCO Flexible Real Estate Income Fund. | |||
Ryan G. Leshaw1 1980 | Chief Legal Officer | Since 2019 | Executive Vice President and Senior Counsel, PIMCO. Chief Legal Officer, PIMCO-Managed Funds, PIMCO Capital Solutions BDC Corp. and PIMCO Flexible Real Estate Income Fund. Chief Legal Officer and Secretary, PIMCO Funds, PIMCO Variable Insurance Trust, PIMCO ETF Trust, PIMCO Equity Series and PIMCO Equity Series VIT. Formerly, Associate, Willkie Farr & Gallagher LLP. | |||
Joshua D. Ratner 1976 | Senior Vice President | Since 2019 | Executive Vice President and Head of Americas Operations, PIMCO. Senior Vice President, PIMCO-Managed Funds, PIMCO Funds, PIMCO Variable Insurance Trust, PIMCO ETF Trust, PIMCO Equity Series and PIMCO Equity Series VIT. | |||
Peter G. Strelow1 1970 | Senior Vice President | Since 2019 | Managing Director and Co‑Chief Operating Officer, PIMCO. Senior Vice President, PIMCO-Managed Funds, PIMCO Funds, PIMCO Variable Insurance Trust, PIMCO ETF Trust, PIMCO Equity Series and PIMCO Equity Series VIT. Formerly, Chief Administrative Officer, PIMCO. | |||
Wu‑Kwan Kit1 1981 | Vice President, Senior Counsel and Secretary | Since 2018 | Senior Vice President and Senior Counsel, PIMCO. Vice President, Senior Counsel and Secretary, PIMCO-Managed Funds, PIMCO Capital Solutions BDC Corp. and PIMCO Flexible Real Estate Income Fund. Assistant Secretary, PIMCO Funds, PIMCO Variable Insurance Trust, PIMCO ETF Trust, PIMCO Equity Series and PIMCO Equity Series VIT. Formerly, Assistant General Counsel, VanEck Associates Corp. | |||
Douglas B. Burrill 1980 | Vice President | Since August 2022 | Senior Vice President, PIMCO. Vice President, PIMCO-Managed Funds, PIMCO Funds, PIMCO Variable Insurance Trust, PIMCO ETF Trust, PIMCO Equity Series, PIMCO Equity Series VIT, PIMCO Capital Solutions BDC Corp. and PIMCO Flexible Real Estate Income Fund. | |||
Elizabeth A. Duggan1 1964 | Vice President | Since March 2021 | Executive Vice President, PIMCO. Vice President, PIMCO-Managed Funds, PIMCO Funds, PIMCO Variable Insurance Trust, PIMCO ETF Trust, PIMCO Equity Series, PIMCO Equity Series VIT, PIMCO Capital Solutions BDC Corp. and PIMCO Flexible Real Estate Income Fund. | |||
Mark A. Jelic1 1981 | Vice President | Since 2021 | Senior Vice President, PIMCO. Vice President, PIMCO-Managed Funds, PIMCO Funds, PIMCO Variable Insurance Trust, PIMCO ETF Trust, PIMCO Equity Series, PIMCO Equity Series VIT, PIMCO Capital Solutions BDC Corp. and PIMCO Flexible Real Estate Income Fund. | |||
Kenneth W. Lee1 1972 | Vice President | Since August 2022 | Senior Vice President, PIMCO. Vice President, PIMCO-Managed Funds, PIMCO Funds, PIMCO Variable Insurance Trust, PIMCO ETF Trust, PIMCO Equity Series, PIMCO Equity Series VIT, PIMCO Capital Solutions BDC Corp. and PIMCO Flexible Real Estate Income Fund. | |||
Brian J. Pittluck1 1977 | Vice President | Since 2020 | Senior Vice President, PIMCO. Vice President, PIMCO-Managed Funds, PIMCO Funds, PIMCO Variable Insurance Trust, PIMCO ETF Trust, PIMCO Equity Series, PIMCO Equity Series VIT, PIMCO Capital Solutions BDC Corp. and PIMCO Flexible Real Estate Income Fund. | |||
Keith A. Werber1 1973 | Vice President | Since June 2022 | Executive Vice President, PIMCO. Vice President, PIMCO-Managed Funds, PIMCO Funds, PIMCO Variable Insurance Trust, PIMCO ETF Trust, PIMCO Equity Series, PIMCO Equity Series VIT, PIMCO Capital Solutions BDC Corp. and PIMCO Flexible Real Estate Income Fund. | |||
Bijal Y. Parikh1 1978 | Treasurer | Since 2021 | Executive Vice President, PIMCO. Treasurer, PIMCO-Managed Funds, PIMCO Funds, PIMCO Variable Insurance Trust, PIMCO ETF Trust, PIMCO Equity Series, PIMCO Equity Series VIT and PIMCO Flexible Real Estate Income Fund. | |||
Brandon T. Evans1 1982 | Deputy Treasurer | Since March 2022 | Senior Vice President, PIMCO. Deputy Treasurer, PIMCO-Managed Funds. Assistant Treasurer, PIMCO Funds, PIMCO Variable Insurance Trust, PIMCO ETF Trust, PIMCO Equity Series, PIMCO Equity Series VIT and PIMCO Flexible Real Estate Income Fund. | |||
Erik C. Brown2 1967 | Assistant Treasurer | Since 2015 | Executive Vice President, PIMCO. Assistant Treasurer, PIMCO-Managed Funds, PIMCO Funds, PIMCO Variable Insurance Trust, PIMCO ETF Trust, PIMCO Equity Series, PIMCO Equity Series VIT, PIMCO Capital Solutions BDC Corp. and PIMCO Flexible Real Estate Income Fund. | |||
| 1 | The address of these officers is Pacific Investment Management Company LLC, 650 Newport Center Drive, Newport Beach, California 92660. |
| 2 | The address of these officers is Pacific Investment Management Company LLC, 401 Congress Ave., Austin, Texas 78701. |
| 144 | PIMCO CLOSED-END FUNDS |
| Privacy Policy1 | (Unaudited) |
| ANNUAL REPORT | | | DECEMBER 31, 2022 | 145 |

Item 2. Code of Ethics.
As of the end of the period covered by this report, the Registrant has adopted a code of ethics (the “Code”) that applies to the Registrant’s principal executive officer and principal financial officer. The Registrant did not grant any waivers, including implicit waivers, from any provisions of the Code to the principal executive officer or principal financial officer during the period covered by this report.
A copy of the Code is included as an exhibit to this report.
Item 3. Audit Committee Financial Expert.
The Board of Trustees has determined that Joseph B. Kittredge, Jr., who serves on the Board’s Audit Oversight Committee, qualifies as an “audit committee financial expert” as such term is defined in the instructions to this Item 3. The Board has also determined that Mr. Kittredge is “independent” as such term is interpreted under this Item 3.
Item 4. Principal Accountant Fees and Services.
| (a) | Fiscal Year Ended | Audit Fees | ||||
| December 31, 2022 | $ 56,772 | |||||
| December 31, 2021 | $ 56,691 | |||||
| (b) | Fiscal Year Ended | Audit-Related Fees | ||||
| December 31, 2022 | $ 11,083 | |||||
| December 31, 2021 | $ 10,500 | |||||
| (c) | Fiscal Year Ended | Tax Fees (1) | ||||
| December 31, 2022 | $ — | |||||
| December 31, 2021 | $ — | |||||
| (d) | Fiscal Year Ended | All Other Fees (2) | ||||
| December 31, 2022 | $ — | |||||
| December 31, 2021 | $ — | |||||
“Audit Fees” represents fees billed for each of the last two fiscal years for professional services rendered for the audit and review of the Registrant’s annual financial statements for those fiscal years or services that are normally provided by the accountant in connection with statutory or regulatory filings or engagements for those fiscal years.
“Audit-Related Fees” represents fees billed for each of the last two fiscal years for assurance and related services that are reasonably related to the performance of the audit or review of the Registrant’s financial statements, but not reported under “Audit Fees” above, and that include accounting consultations, agreed-upon procedure reports (inclusive of annual review of basic maintenance testing associated with the Preferred Shares), attestation reports and comfort letters for those fiscal years.
“Tax Fees” represents fees billed for each of the last two fiscal years for professional services related to tax compliance, tax advice and tax planning, including services relating to the filing or amendment of federal, state or local income tax returns, regulated investment company qualification reviews, and tax distribution and analysis reviews.
“All Other Fees” represents fees, if any, billed for other products and services rendered by the principal accountant to the Registrant other than those reported above under “Audit Fees,” “Audit-Related Fees” and “Tax Fees” for the last two fiscal years.
(1) There were no “Tax Fees” for the last two fiscal years.
(2) There were no “All Other Fees” for the last two fiscal years.
| (e) | Pre-approval policies and procedures |
(1) The Registrant’s Audit Oversight Committee has adopted pre-approval policies and procedures (the “Procedures”) to govern the Audit Oversight Committee’s pre-approval of (i) all audit services and permissible non-audit services to be provided to the Registrant by its independent accountant, and (ii) all permissible non-audit services to be provided by such independent accountant to the Registrant’s investment adviser and to any entity controlling, controlled by, or under common control with the investment adviser that provides ongoing services to the Registrant (collectively, the “Service Affiliates”) if the services provided directly relate to the Registrant’s operations and financial reporting. In accordance with the Procedures, the Audit Oversight Committee is responsible for the engagement of the independent accountant to certify the Registrant’s financial statements for each fiscal year. With respect to the pre-approval of non-audit services provided to the Registrant and its Service Affiliates, the Procedures provide that the Audit Oversight Committee may annually pre-approve a list of types or categories of non-audit services that may be provided to the Registrant or its Service Affiliates, or the Audit Oversight Committee may pre-approve such services on a project-by-project basis as they arise. Unless a type of service has received general pre-approval, it will require specific pre-approval by the Audit Oversight Committee if it is to be provided by the independent accountant. The Procedures also permit the Audit Oversight Committee to delegate authority to one or more of its members to pre-approve any proposed non-audit services that have not been previously pre-approved by the Audit Oversight Committee, subject to the ratification by the full Audit Oversight Committee no later than its next scheduled meeting.
(2) With respect to the services described in paragraphs (b) through (d) of this Item 4, no amount was approved by the Audit Oversight Committee pursuant to paragraph (c)(7)(i)(C) of Rule 2-01 of Regulation S-X.
| (f) | Not applicable. |
| (g) |
| Aggregate Non-Audit Fees Billed to Entity |
| |||||||||
|
| |||||||||
| Entity | December 31, 2022 | December 31, 2021 | ||||||||
|
|
| ||||||||
PIMCO California Municipal Income Fund | $ | 11,083 | $ | 10,500 | ||||||
Pacific Investment Management Company LLC (“PIMCO”) | 20,915,827 | 14,971,260 | ||||||||
|
| |||||||||
Totals | $ | 20,926,910 | $ | 14,981,760 | ||||||
|
|
|
| |||||||
| (h) | The Registrant’s Audit Oversight Committee has considered whether the provision of non-audit services that were rendered to the Registrant’s investment adviser, and any entity controlling, controlled by, or under common control with the investment adviser that provides ongoing services to the Registrant which were not pre-approved (not requiring pre-approval) is compatible with maintaining the principal accountant’s independence. |
Item 5. Audit Committee of Listed Registrants.
The Registrant has a separately-designated standing audit committee (known as the Audit Oversight Committee) established in accordance with Section 3(a)(58)(A) of the Securities Exchange Act of 1934, as amended. The Audit Oversight Committee is comprised of:
Sarah E. Cogan
Deborah A. DeCotis
Joseph B. Kittredge, Jr.
Alan Rappaport
E. Grace Vandecruze
Kathleen A. McCartney
Item 6. Schedule of Investments.
The information required by this Item 6 is included as part of the annual report to shareholders filed under Item 1 of this Form N-CSR.
Item 7. Disclosure of Proxy Voting Policies and Procedures for Closed-End Management Investment Companies.
Policy Statement: PIMCO adopted a written proxy voting policy (“Proxy Policy”) as required by Rule 206(4)-6 under the Advisers Act. The Proxy Policy is intended to foster PIMCO’s compliance with its fiduciary obligations and applicable law. The Proxy Policy applies to any voting or consent rights with respect to securities held in accounts over which PIMCO has discretionary voting authority. The Proxy Policy is designed in a manner reasonably expected to ensure that voting and consent rights are exercised in the best interests of PIMCO’s clients.
Overview: As a general matter, PIMCO will adhere to its fiduciary obligations for any proxies it has the authority to vote on behalf of its clients. Each proxy is voted on a case-by-case basis, taking into account relevant facts and circumstances. When considering client proxies1, PIMCO may determine not to vote a proxy in limited circumstances.
Equity Securities.2 PIMCO has retained an Industry Service Provider (“ISP”)3 to provide research and voting recommendations for proxies relating to Equity Securities in accordance with the ISP’s guidelines. By following the guidelines of an independent third party, PIMCO seeks to mitigate potential conflicts of interest PIMCO may have with respect to proxies covered by the ISP. PIMCO will follow the recommendations of the ISP unless: (i) the ISP does not provide a voting recommendation; or (ii) a PM/Analyst decides to override the ISP’s voting recommendation. In each case as described above, the Legal and Compliance department will review the proxy to determine whether an actual or potential conflict of interest exists. When the ISP does not provide a voting recommendation, the relevant PM/Analyst will make a determination regarding how, or if, the proxy will be voted by completing required documentation.
Fixed Income Securities. Fixed income securities can be processed as proxy ballots or corporate action-consents4 at the discretion of the issuer/ custodian. When processed as proxy ballots, the ISP generally does not provide a voting recommendation and their role is limited to election processing and recordkeeping. In such instances, any elections would follow the standard process discussed above for Equity Securities. When processed as corporate action-consents, the Legal and Compliance department will review all election forms to determine whether an actual or potential conflict of interest exists with respect to the PM’s consent election. PIMCO’s Credit Research and Portfolio Management Groups are responsible for issuing recommendations on how to vote proxy ballots and corporation action-consents with respect to fixed income securities.
Resolution of potential/identified conflicts of interest. The Proxy Policy permits PIMCO to seek to resolve material conflicts of interest by pursuing any one of several courses of action. With respect to material conflicts of interest between PIMCO and a client account, the Proxy Policy permits PIMCO to either: (i) convene a working group to assess and resolve the conflict (the “Proxy Working Group”); or (ii) vote in accordance with protocols previously established by the Proxy Policy, the Proxy Working Group and/or other relevant procedures approved by PIMCO’s Legal and Compliance department or PIMCO’s Conflict Committee with respect to specific types of conflicts.
PIMCO will supervise and periodically review its proxy voting activities and the implementation of the Proxy Policy. PIMCO’s Proxy Policy, and information about how PIMCO voted a client’s proxies, is available upon request.
ISP Oversight: Consistent with its fiduciary obligations, PIMCO will perform periodic due diligence and oversight of ISP’s engaged to provide PIMCO with proxy voting research and recommendations. PIMCO’s due diligence and oversight process includes, but is not limited to, the evaluation of: the ISP’s capacity and competency to provide proxy voting research and recommendations5 and the ISP’s compliance program.
Sub-Adviser Engagement: As an investment manager, PIMCO may exercise its discretion to engage a Sub-Adviser to provide portfolio management services to certain PIMCO-affiliated Funds. Consistent with its management responsibilities, the Sub-Adviser will assume the authority for voting proxies on behalf of PIMCO for these Funds. Sub-Advisers may utilize third parties to perform certain services related to their portfolio management responsibilities. As a fiduciary, PIMCO will maintain oversight of the investment management responsibilities (which may include proxy voting) performed by the Sub-Adviser and contracted third parties.
1Proxies generally describe corporate action consent rights (relative to fixed income securities) and proxy voting ballots (relative to fixed income or equity securities) as determined by the issuer or custodian.
2 The term “Equity Securities” means common and preferred stock, including common and preferred shares issued by investment companies; it does not include debt securities convertible into equity securities.
3 The ISP for Equity Securities proxy voting is Institutional Shareholder Services (“ISS”), Inc., 1177 Avenue of the Americas 2nd Floor, New York NY 10036.
4 Voting or consent rights shall not include matters which are primarily decisions to buy or sell investments, such as tender offers, exchange offers, conversions, put options, redemptions, and Dutch auctions.
5 This includes the adequacy and quality of the ISP’s operational infrastructure as it relates to its process for seeking timely input from issuers and its voting methodologies.
Item 8. Portfolio Managers of Closed-End Management Investment Companies.
(a)(1)
As of March 8, 2023, the following individual has primary responsibility for the day-to-day management of the California Municipal Income Fund (the “Fund”):
David Hammer
Mr. Hammer has been the portfolio manager of the Fund since August 2015. Mr. Hammer is a Managing Director and municipal bond portfolio manager in the Newport Beach office. He rejoined PIMCO in 2015 from Morgan Stanley, where he was managing director and head of municipal trading, risk management and research. Previously at PIMCO, he was a senior vice president and municipal bond portfolio manager, and prior to joining PIMCO in 2012, he was an executive director and head of the high yield and distressed municipal bond trading group at Morgan Stanley.
(a)(2)
The following summarizes information regarding each of the accounts, excluding the Fund, managed by the portfolio manager as of December 31, 2022, including accounts managed by a team, committee, or other group that includes the portfolio manager. Unless mentioned otherwise, the advisory fee charged for managing each of the accounts listed below is not based on performance.
Registered Investment Companies
| Other Pooled Investment Vehicles
| Other Accounts
| ||||||||||||
Portfolio Manager
| #
| AUM($million)
| #
| AUM($million)
| #
| AUM($million)
| ||||||||
David Hammer | 28 | $12,381.25 | 8 | $31,220.35 | 163 | $12,882.61 | ||||||||
From time to time, potential and actual conflicts of interest may arise between a portfolio manager’s management of the investments of the Fund, on the one hand, and the management of other accounts, on the other. Potential and actual conflicts of interest may also arise as a result of PIMCO’s other business activities and PIMCO’s possession of material non-public information (“MNPI”) about an issuer. Other accounts managed by a portfolio manager might have similar investment objectives or strategies as the Fund, track the same index the Fund tracks or otherwise hold, purchase, or sell securities that are eligible to be held, purchased or sold by the Fund. The other accounts might also have different investment objectives or strategies than the Fund. Potential and actual conflicts of interest may also arise as a result of PIMCO serving as investment adviser to accounts that invest in the Fund. In this case, such conflicts of interest could in theory give rise to incentives for PIMCO to, among other things, vote proxies of the Fund in a manner beneficial to the investing account but detrimental to the Fund. Conversely, PIMCO’s duties to the Fund, as well as regulatory or other limitations applicable to the Fund, may affect the courses of action available to PIMCO-advised accounts (including certain funds) that invest in the Fund in a manner that is detrimental to such investing accounts.
Because PIMCO is affiliated with Allianz SE, a large multi-national financial institution (together with its affiliates, “Allianz”), conflicts similar to those described below may occur between the Fund or other accounts managed by PIMCO and PIMCO’s affiliates or accounts managed by those affiliates. Those affiliates (or their clients), which generally operate
autonomously from PIMCO, may take actions that are adverse to the Fund or other accounts managed by PIMCO. In many cases, PIMCO will not be in a position to mitigate those actions or address those conflicts, which could adversely affect client performance or the performance of the Fund or other accounts managed by PIMCO (each a “Client,” and collectively, the “Clients”). In addition, because certain Clients are affiliates of PIMCO or have investors who are affiliates or employees of PIMCO, PIMCO may have incentives to resolve conflicts of interest in favor of these Clients over other Clients.
Knowledge and Timing of Fund Trades. A potential conflict of interest may arise as a result of a portfolio manager’s day-to-day management of the Fund. Because of their positions with the Fund, the portfolio managers know the size, timing and possible market impact of the Fund’s trades. It is theoretically possible that the portfolio managers could use this information to the advantage of other accounts they manage and to the possible detriment of the Fund.
Cross Trades. A potential conflict of interest may arise in instances where the Fund buys an instrument from a Client or sells an instrument to a Client (each, a “cross trade”). Such conflicts of interest may arise, among other reasons, as a result of PIMCO representing the interests of both the buying party and the selling party in the cross trade or because the price at which the instrument is bought or sold through a cross trade may not be as favorable as the price that might have been obtained had the trade been executed in the open market. PIMCO effects cross trades when appropriate pursuant to procedures adopted under applicable rules and SEC guidance. Among other things, such procedures require that the cross trade is consistent with the respective investment policies and investment restrictions of both parties and is in the best interests of both the buying and selling accounts.
Investment Opportunities. A potential conflict of interest may arise as a result of a portfolio manager’s management of a number of accounts with varying investment guidelines. Often, an investment opportunity may be suitable for one or more Clients, but may not be available in sufficient quantities for all accounts to participate fully. Similarly, there may be limited opportunity to sell an investment held by the Fund and another Client. PIMCO has adopted policies and procedures reasonably designed to allocate investment opportunities on a fair and equitable basis over time. In addition, regulatory issues applicable to PIMCO or one or more funds, or other accounts may result in certain funds, not receiving securities that may otherwise be appropriate for them.
PIMCO seeks to allocate orders across eligible Client accounts with similar investment guidelines and investment styles fairly and equitably, taking into consideration relevant factors including, among others, applicable investment restrictions and guidelines, regulatory requirements, risk tolerances and available cash. As part of PIMCO’s trade allocation process, portions of new fixed income investment opportunities are distributed among Client account categories where the relevant portfolio managers seek to participate in the investment. Those portions are then further allocated among the Client accounts within such categories pursuant to PIMCO’s trade allocation policy. Portfolio managers managing quantitative strategies and specialized accounts, such as those focused on international securities, mortgage-backed securities, bank loans, or other specialized asset classes, will likely receive an increased distribution of new fixed income investment opportunities where the investment involves a quantitative strategy or specialized asset class that matches the investment objective or focus of the Client account category.
Any particular allocation decision among Client accounts may be more or less advantageous to any one Client or group of Clients, and certain allocations will, to the extent consistent with PIMCO’s fiduciary obligations, deviate from a pro rata basis among Clients in order to address for example, differences in legal, tax, regulatory, risk management, concentration, exposure, Client guideline limitations and/or mandate or strategy considerations for the relevant Clients. PIMCO may determine that an investment opportunity or particular purchases or sales are appropriate for one or more Clients, but not appropriate for other Clients, or are appropriate or suitable for, or available to, Clients but in different sizes, terms, or timing than is appropriate or suitable for other Clients. For example, some Clients have higher risk tolerances than other Clients, such as private funds, which, in turn, allows PIMCO to allocate a wider variety and/or greater percentage of certain types of investments (which may or may not outperform other types of investments) to such Clients. Those Clients receiving an increased allocation as a result of the effect of their respective risk tolerance may be Clients that pay higher investment management fees or that pay incentive fees. In addition, certain Client account categories focusing on certain types of investments or asset classes will be given priority in new issue distribution and allocation with respect to the investments or asset classes that are the focus of their investment mandate. Legal, contractual, or regulatory issues and/or related expenses applicable to PIMCO or one or more Clients may result in certain Clients not receiving securities that may otherwise be appropriate for them or may result in PIMCO selling securities out of Client accounts even if it might otherwise be beneficial to continue to hold them. Additional factors that are taken into account in the distribution and allocation of investment opportunities to Client accounts include, without limitation: ability to utilize leverage and risk tolerance of the Client account; the amount of discretion and trade authority given to PIMCO by the Client; availability of other similar investment opportunities; the Client account’s investment horizon and objectives;
hedging, cash and liquidity needs of the portfolio; minimum increments and lot sizes; and underlying benchmark factors. Given all of the foregoing factors, the amount, timing, structuring, or terms of an investment by a Client, including the Fund, may differ from, and performance may be lower than, investments and performance of other Clients, including those that may provide greater fees or other compensation (including performance-based fees or allocations) to PIMCO. PIMCO has also adopted additional procedures to complement the general trade allocation policy that are designed to address potential conflicts of interest due to the side-by-side management of the Fund and certain pooled investment vehicles, including investment opportunity allocation issues.
From time to time, PIMCO may take an investment position or action for one or more Clients that may be different from, or inconsistent with, an action or position taken for one or more other Clients having similar or differing investment objectives. These positions and actions may adversely impact, or in some instances may benefit, one or more affected Clients, including Clients that are PIMCO affiliates, in which PIMCO has an interest, or which pays PIMCO higher fees or a performance fee. For example, a Client may buy a security and another Client may establish a short position in that same security. The subsequent short sale may result in a decrease in the price of the security that the other Client holds. Similarly, transactions or investments by one or more Clients may have the effect of diluting or otherwise disadvantaging the values, prices or investment strategies of another Client.
When PIMCO implements for one Client a portfolio decision or strategy ahead of, or contemporaneously with, similar portfolio decisions or strategies of another Client, market impact, liquidity constraints or other factors could result in one or more Clients receiving less favorable trading results, the costs of implementing such portfolio decisions or strategies could be increased or such Clients could otherwise be disadvantaged. On the other hand, potential conflicts may also arise because portfolio decisions regarding a Client may benefit other Clients. For example, the sale of a long position or establishment of a short position for a Client may decrease the price of the same security sold short by (and therefore benefit) other Clients, and the purchase of a security or covering of a short position in a security for a Client may increase the price of the same security held by (and therefore benefit) other Clients.
Under certain circumstances, a Client may invest in a transaction in which one or more other Clients are expected to participate, or already have made or will seek to make, an investment. In addition, to the extent permitted by applicable law, a Client may also engage in investment transactions that may result in other Clients being relieved of obligations, or that may cause other Clients to divest certain investments (e.g., a Client may make a loan to, or directly or indirectly acquire securities or indebtedness of, a company that uses the proceeds to refinance or reorganize its capital structure, which could result in repayment of debt held by another Client). Such Clients (or groups of Clients) may have conflicting interests and objectives in connection with such investments, including with respect to views on the operations or activities of the issuer involved, the targeted returns from the investment and the timeframe for, and method of, exiting the investment. When making such investments, PIMCO may do so in a way that favors one Client over another Client, even if both Clients are investing in the same security at the same time. Certain Clients may invest on a “parallel” basis (i.e., proportionately in all transactions at substantially the same time and on substantially the same terms and conditions). In addition, other accounts may expect to invest in many of the same types of investments as another account. However, there may be investments in which one or more of such accounts does not invest (or invests on different terms or on a non-pro rata basis) due to factors such as legal, tax, regulatory, business, contractual or other similar considerations or due to the provisions of a Client’s governing documents. Decisions as to the allocation of investment opportunities among such Clients present numerous conflicts of interest, which may not be resolved in a manner that is favorable to a Client’s interests. To the extent an investment is not allocated pro rata among such entities, a Client could incur a disproportionate amount of income or loss related to such investment relative to such other Client.
In addition, Clients may invest alongside one another in the same underlying investments or otherwise pursuant to a substantially similar investment strategy as one or more other Clients. In such cases, certain Clients may have preferential liquidity and information rights relative to other Clients holding the same investments, with the result that such Clients will be able to withdraw their interests in underlying investments in priority to Clients who may have more limited access to information or more restrictive withdrawal rights. Clients with more limited information rights or more restrictive liquidity may therefore be adversely affected in the event of a downturn in the markets.
Further, potential conflicts may be inherent in PIMCO’s use of multiple strategies. For example, conflicts will arise in cases where different Clients invest in different parts of an issuer’s capital structure, including circumstances in which one or more Clients may own private securities or obligations of an issuer and other Clients may own or seek to acquire private securities of the same issuer. For example, a Client may acquire a loan, loan participation or a loan assignment of a particular borrower in which one or more other Clients have an equity investment, or may invest in senior debt obligations of an issuer for one Client and junior debt obligations or equity of the same issuer for another Client.
PIMCO may also, for example, direct a Client to invest in a tranche of a structured finance vehicle, such as a CLO or CDO, where PIMCO is also, at the same or different time, directing another Client to make investments in a different tranche of the same vehicle, which tranche’s interests may be adverse to other tranches. PIMCO may also cause a Client to purchase from, or sell assets to, an entity, such as a structured finance vehicle, in which other Clients may have an interest, potentially in a manner that will have an adverse effect on the other Clients. There may also be conflicts where, for example, a Client holds certain debt or equity securities of an issuer, and that same issuer has issued other debt, equity or other instruments that are owned by other Clients or by an entity, such as a structured finance vehicle, in which other Clients have an interest.
In each of the situations described above, PIMCO may take actions with respect to the assets held by one Client that are adverse to the other Clients, for example, by foreclosing on loans, by putting an issuer into default, or by exercising rights to purchase or sell to an issuer, causing an issuer to take actions adverse to certain classes of securities, or otherwise. In negotiating the terms and conditions of any such investments, or any subsequent amendments or waivers or taking any other actions, PIMCO may find that the interests of a Client and the interests of one or more other Clients could conflict. In these situations, decisions over items such as whether to make the investment or take an action, proxy voting, corporate reorganization, how to exit an investment, or bankruptcy or similar matters (including, for example, whether to trigger an event of default or the terms of any workout) may result in conflicts of interest. Similarly, if an issuer in which a Client and one or more other Clients directly or indirectly hold different classes of securities (or other assets, instruments or obligations issued by such issuer or underlying investments of such issuer) encounters financial problems, decisions over the terms of any workout will raise conflicts of interests (including, for example, conflicts over proposed waivers and amendments to debt covenants). For example, a debt holder may be better served by a liquidation of the issuer in which it may be paid in full, whereas an equity or junior bond holder might prefer a reorganization that holds the potential to create value for the equity holders. In some cases PIMCO may refrain from taking certain actions or making certain investments on behalf of Clients in order to avoid or mitigate certain conflicts of interest or to prevent adverse regulatory or other effects on PIMCO, or may sell investments for certain Clients (in each case potentially disadvantaging the Clients on whose behalf the actions are not taken, investments not made, or investments sold). In other cases, PIMCO may not refrain from taking actions or making investments on behalf of certain Clients that have the potential to disadvantage other Clients. In addition, PIMCO may take actions or refrain from taking actions in order to mitigate legal risks to PIMCO or its affiliates or its Clients even if disadvantageous to a Client’s account. Moreover, a Client may invest in a transaction in which one or more other Clients are expected to participate, or already have made or will seek to make, an investment.
Additionally, certain conflicts may exist with respect to portfolio managers who make investment decisions on behalf of several different types of Clients. Such portfolio managers may have an incentive to allocate trades, time or resources to certain Clients, including those Clients who pay higher investment management fees or that pay incentive fees or allocations, over other Clients. These conflicts may be heightened with respect to portfolio managers who are eligible to receive a performance allocation under certain circumstances as part of their compensation.
From time to time, PIMCO personnel may come into possession of MNPI which, if disclosed, might affect an investor’s decision to buy, sell or hold a security. Should a PIMCO employee come into possession of MNPI with respect to an issuer, he or she generally will be prohibited from communicating such information to, or using such information for the benefit of, Clients, which could limit the ability of Clients to buy, sell or hold certain investments, thereby limiting the investment opportunities or exit strategies available to Clients. In addition, holdings in the securities or other instruments of an issuer by PIMCO or its affiliates may affect the ability of a Client to make certain acquisitions of or enter into certain transactions with such issuer. PIMCO has no obligation or responsibility to disclose such information to, or use such information for the benefit of, any person (including Clients).
PIMCO maintains one or more restricted lists of companies whose securities are subject to certain trading prohibitions due to PIMCO’s business activities. PIMCO may restrict trading in an issuer’s securities if the issuer is on a restricted list or if PIMCO has MNPI about that issuer. In some situations, PIMCO may restrict Clients from trading in a particular issuer’s securities in order to allow PIMCO to receive MNPI on behalf of other Clients. A Client may be unable to buy or sell certain securities until the restriction is lifted, which could disadvantage the Client. PIMCO may also be restricted from making (or divesting of) investments in respect of some Clients but not others. In some cases PIMCO may not initiate or recommend certain types of transactions, or may otherwise restrict or limit its advice relating to certain securities if a security is restricted due to MNPI or if PIMCO is seeking to limit receipt of MNPI.
PIMCO may conduct litigation or engage in other legal actions on behalf of one or more Clients. In such cases, Clients may be required to bear certain fees, costs, expenses and liabilities associated with the litigation. Other Clients that
are or were investors in, or otherwise involved with, the subject investments may or may not (depending on the circumstances) be parties to such litigation actions, with the result that certain Clients may participate in litigation actions in which not all Clients with similar investments may participate, and such non-participating Clients may benefit from the results of such litigation actions without bearing or otherwise being subject to the associated fees, costs, expenses and liabilities. PIMCO, for example, typically does not pursue legal claims on behalf of its separate accounts. Furthermore, in certain situations, litigation or other legal actions pursued by PIMCO on behalf of a Client may be brought against or be otherwise adverse to a portfolio company or other investment held by a Client.
The foregoing is not a complete list of conflicts to which PIMCO or Clients may be subject. PIMCO seeks to review conflicts on a case-by-case basis as they arise. Any review will take into consideration the interests of the relevant Clients, the circumstances giving rise to the conflict, applicable PIMCO policies and procedures, and applicable laws. Clients (and investors in the Fund) should be aware that conflicts will not necessarily be resolved in favor of their interests and may in fact be resolved in a manner adverse to their interests. PIMCO will attempt to resolve such matters fairly, but even so, matters may be resolved in favor of other Clients which pay PIMCO higher fees or performance fees or in which PIMCO or its affiliates have a significant proprietary interest. There can be no assurance that any actual or potential conflicts of interest will not result in a particular Client or group of Clients receiving less favorable investment terms in or returns from certain investments than if such conflicts of interest did not exist.
Conflicts like those described above may also occur between Clients, on the one hand, and PIMCO or its affiliates, on the other. These conflicts will not always be resolved in favor of the Client. In addition, because PIMCO is affiliated with Allianz, a large multi-national financial institution, conflicts similar to those described above may occur between clients of PIMCO and PIMCO’s affiliates or accounts managed by those affiliates. Those affiliates (or their clients), which generally operate autonomously from PIMCO, may take actions that are adverse to PIMCO’s Clients. In many cases PIMCO will have limited or no ability to mitigate those actions or address those conflicts, which could adversely affect Client performance. In addition, certain regulatory or internal restrictions may prohibit PIMCO from using certain brokers or investing in certain companies (even if such companies are not affiliated with Allianz) because of the applicability of certain laws and regulations or internal Allianz policies applicable to PIMCO, Allianz SE or their affiliates. An account’s willingness to negotiate terms or take actions with respect to an investment may also be, directly or indirectly, constrained or otherwise impacted to the extent Allianz SE, PIMCO, and/or their affiliates, directors, partners, managers, members, officers or personnel are also invested therein or otherwise have a connection to the subject investment (e.g., serving as a trustee or board member thereof).
Certain service providers to the Fund are expected to be owned by or otherwise related to or affiliated with a Client, the Fund or other account managed by PIMCO and in certain cases, such service providers are expected to be, or are owned by, employed by, or otherwise related to, PIMCO, Allianz, their affiliates and/or their respective employees, consultants and other personnel. PIMCO may, in its sole discretion, determine to provide, or engage or recommend an affiliate of PIMCO to provide, certain services to the Fund, instead of engaging or recommending one or more third parties to provide such services. Subject to the governance requirements of the Fund and applicable law, PIMCO or its affiliates, as applicable, will receive compensation in connection with the provision of such services. As a result, PIMCO faces a conflict of interest when selecting or recommending service providers for the Fund. Fees paid to an affiliated service provider will be determined in PIMCO’s commercially reasonable discretion, taking into account the relevant facts and circumstances, and consistent with PIMCO’s responsibilities. Although PIMCO has adopted various policies and procedures intended to mitigate or otherwise manage conflicts of interest with respect to affiliated service providers, there can be no guarantee that such policies and procedures (which may be modified or terminated at any time in PIMCO’s sole discretion) will be successful.
Performance Fees. A portfolio manager may advise certain accounts with respect to which the management fee is based entirely or partially on performance. Performance fee arrangements may create a conflict of interest for the portfolio manager in that the portfolio manager may have an incentive to allocate the investment opportunities that he or she believes might be the most profitable to such other accounts instead of allocating them to the Fund. PIMCO has adopted policies and procedures reasonably designed to allocate investment opportunities between the Fund and certain pooled investment vehicles on a fair and equitable basis over time.
PIMCO has implemented policies and procedures relating to, among other things, portfolio management and trading practices, personal investment transactions, insider trading, gifts and entertainment, and political contributions that seek to identify, manage and/or mitigate actual or potential conflicts of interest and resolve such conflicts appropriately if they occur. PIMCO seeks to resolve any actual or potential conflicts in each client’s best interest.
(a)(3)
As of December 31, 2022, the following explains the compensation structure of the individuals who have primary responsibility for day-to-day portfolio management of the Fund:
Portfolio Manager Compensation
PIMCO’s approach to compensation seeks to provide professionals with a Total Compensation Plan and process that is driven by PIMCO’s mission and CORE values of collaboration, openness, responsibility and excellence. Key Principles on Compensation Philosophy include:
| ● | PIMCO’s compensation practices are designed to attract and retain high performers; |
| ● | PIMCO’s compensation philosophy embraces a corporate culture of rewarding behaviors aligned to our CORE values; |
| ● | PIMCO’s goal is to ensure key professionals are aligned to PIMCO’s long-term success through awards linked to firm performance; and |
| ● | PIMCO’s “Discern and Differentiate” discipline incorporates individual performance rating to guide total compensation outcomes. |
The Total Compensation Plan consists of three components. The compensation program for portfolio managers is designed to align with clients’ interests, emphasizing each portfolio manager’s ability to generate long-term investment success for PIMCO’s clients. A portfolio manager’s compensation is not based solely on the performance of any Fund or any other account managed by that portfolio manager:
Base Salary – Base salary is determined based on core job responsibilities, positions/levels and market factors. Base salary levels are reviewed annually, when there is a significant change in job responsibilities or position, or a significant change in market levels.
Performance Bonus – Performance bonuses are designed to reward risk-adjusted performance and contributions to PIMCO’s broader investment process. The compensation process is not formulaic and the following non-exhaustive list of qualitative and quantitative criteria are considered when determining the total compensation for portfolio managers:
| ● | Performance measured over a variety of longer- and shorter-term periods, including 5-year, 4-year, 3-year, 2-year and 1-year dollar-weighted and account-weighted, pre-tax total and risk-adjusted investment performance as judged against the applicable benchmarks (which may include internal investment performance-related benchmarks) for each account managed by a portfolio manager (including the Fund) and relative to applicable industry peer groups; greatest emphasis is placed on 5-year and 3-year performance, followed by 1-year performance; |
| ● | Consistency of investment performance across portfolios of similar mandate and guidelines, rewarding low dispersion and consistency of outperformance; |
| ● | Appropriate risk positioning and risk management mindset which includes consistency with PIMCO’s investment philosophy, the Investment Committee’s positioning guidance, absence of defaults, and appropriate alignment with client objectives; |
| ● | Contributions to mentoring, coaching and/or supervising members of team; |
| ● | Collaboration, idea generation, and contribution of investment ideas in the context of PIMCO’s investment process, Investment Committee meetings, and day-to-day management of portfolios; |
| ● | With much lesser importance than the aforementioned factors: amount and nature of assets managed by the portfolio manager, contributions to asset retention, and client satisfaction. |
PIMCO’s partnership culture further rewards strong long term risk adjusted returns with promotion decisions almost entirely tied to long term contributions to the investment process. 10-year performance can also be considered, though not explicitly as part of the compensation process.
Deferred Compensation – Deferred compensation is awarded to key professionals under the Long Term Incentive Plan (“LTIP”). Employees who reach a total compensation threshold are delivered their annual compensation in a mix of cash and/or deferred compensation. PIMCO incorporates a progressive allocation of deferred compensation as a percentage of total compensation, which is in line with market practices.
| ● | The LTIP provides participants with deferred cash awards that appreciate or depreciate based on PIMCO’s operating earnings over a rolling three-year period. The plan provides a link between longer term company performance and participant pay, further motivating participants to make a long-term commitment to PIMCO’s success. |
Eligibility to participate in the LTIP is contingent upon continued employment at PIMCO and all other applicable eligibility requirements.
Profit Sharing Plan. Portfolio managers who are Managing Directors of PIMCO receive compensation from a non-qualified profit sharing plan consisting of a portion of PIMCO’s net profits. Portfolio managers who are Managing Directors receive an amount determined by the Compensation Committee, based upon an individual’s overall contribution to the firm.
(a)(4)
The following summarizes the dollar range of securities of the Fund the portfolio manager beneficially owned as of December 31, 2022:
| Portfolio Manager | Dollar Range of Equity Securities of the
|
| ||
David Hammer | None
|
Item 9. Purchases of Equity Securities by Closed-End Management Investment Company and Affiliated Purchasers.
None.
Item 10. Submission of Matters to a Vote of Security Holders.
There have been no material changes to the procedures by which shareholders may recommend nominees to the Fund’s Board of Trustees since the Fund last provided disclosure in response to this item.
Item 11. Controls and Procedures.
| (a) | The principal executive officer and principal financial & accounting officer have concluded as of a date within 90 days of the filing date of this report, based on their evaluation of the Registrant’s disclosure controls and procedures (as defined in Rule 30a-3(c) under the 1940 Act), that the design of such procedures is effective to provide reasonable assurance that material information required to be disclosed by the Registrant on Form N-CSR is recorded, processed, summarized and reported within the time periods specified in the Commission’s rules and forms. |
| (b) | There were no changes in the Registrant’s internal control over financial reporting (as defined in Rule 30a-3(d) under the 1940 Act (17 CFR 270.30a-3(d))) that occurred during the period covered by this report that have materially affected, or are reasonably likely to materially affect, the Registrant’s internal control over financial reporting. |
Item 12. Disclosure of Securities Lending Activities for Closed-End Management Investment Companies.
None.
Item 13. Exhibits.
| (a)(1) | Exhibit 99.CODE—Code of Ethics pursuant to Section 406 of the Sarbanes-Oxley Act of 2002. | ||
| (a)(2) | Exhibit 99.CERT—Certifications pursuant to Section 302 of the Sarbanes-Oxley Act of 2002. | |||
| (a)(3) | None. | |||
| (a)(4) | There was no change in the registrant’s independent public accountant for the period covered by the report. | |||
Signatures
Pursuant to the requirements of the Securities Exchange Act of 1934 and the Investment Company Act of 1940, the registrant has duly caused this report to be signed on its behalf by the undersigned, thereunto duly authorized.
PIMCO California Municipal Income Fund | ||
By: | /s/ Eric D. Johnson | |
| ||
| Eric D. Johnson | ||
| President (Principal Executive Officer) | ||
Date: | March 8, 2023 | |
Pursuant to the requirements of the Securities Exchange Act of 1934 and the Investment Company Act of 1940, this report has been signed below by the following persons on behalf of the registrant and in the capacities and on the dates indicated.
By: | /s/ Eric D. Johnson | |
| ||
| Eric D. Johnson | ||
| President (Principal Executive Officer) | ||
Date: | March 8, 2023 | |
By: | /s/ Bijal Y. Parikh | |
| ||
| Bijal Y. Parikh | ||
| Treasurer (Principal Financial & Accounting Officer) | ||
Date: | March 8, 2023 | |