Exhibit 99.2
willistowerswatson.com Willis Towers Watson 2018 Fourth Quarter and Full Year Financial Results Supplemental Materials February 7, 2019 © 2019 Willis Towers Watson. All rights reserved.
willistowerswatson.com Willis Towers Watson Forward Looking Statements © 2019 Willis Towers Watson. All rights reserved. This document contains “forward - looking statements” within the meaning of the Private Securities Litigation Reform Act of 1995. You can identify these statements and other forward - looking statements in this document by words such as “may”, “will”, “would”, “expect”, “anticipate”, “believe”, “estimate”, “ pla n”, “intend”, “continue”, or similar words, expressions or the negative of such terms or other comparable terminology. These statements include, but are not limited to, the benefits of the bu siness combination transaction involving Towers Watson and Willis, including the combined company’s future financial and operating results, plans, objectives, expectations a nd intentions, the impact of changes to tax laws on our financial results and other statements that are not historical facts. Such statements are based upon the current beliefs and exp ectations of Willis Towers Watson’s management and are subject to significant risks and uncertainties. Actual results may differ from those set forth in the forward - looking statem ents. All forward - looking disclosure is speculative by its nature. There are important risks, uncertainties, events and factors that could cause our actual results or performance to differ mat eri ally from those in the forward - looking statements contained herein, including the following: the ability of the company to successfully establish, execute and achieve its glob al business strategy as it evolves; changes in demand for our services, including any decline in defined benefit pension plans or the purchasing of insurance; changes in general econo mic , business and political conditions, including changes in the financial markets; significant competition that the company faces and the potential for loss of market share and/or pr ofi tability; the impact of seasonality and differences in timing of renewals; the risk of increased liability or new legal claims arising from our new and existing products and servic es, and expectations, intentions and outcomes relating to outstanding litigation; the risk the Stanford litigation settlement approval will be overturned on appeal, the risk that the Sta nford bar order may be challenged in other jurisdictions, and the risk that the charge related to the Stanford settlement may not be deductible; the risk of material adverse outcomes on e xis ting litigation or investigation matters; changes in the regulatory environment in which the company operates, including, among other risks, the impact of pending competition law and re gulatory investigations; various claims, government inquiries or investigations or the potential for regulatory action; the company’s ability to make divestitures or acquisition s a nd its ability to integrate or manage such acquired businesses; failure to protect client data or breaches of information systems; the ability to comply with complex and evolvin g r egulations related to data privacy and cyber security; the potential impact of Brexit; the ability of the company to properly identify and manage conflicts of interest; reputational da mag e; reliance on third - party services; the loss of key employees; the ability to successfully manage ongoing organizational changes; disasters or business continuity problems; doin g b usiness internationally, including the impact of exchange rates; compliance with extensive government regulation; the risk of sanctions imposed by governments, or changes to ass ociated sanction regulations; technological change; changes and developments in the insurance industry or the United States healthcare system; the risk that the company may not be able to repurchase the intended number of outstanding shares due to M&A activity or investment opportunities, market or business conditions, or other factors; the i nab ility to protect the company’s intellectual property rights, or the potential infringement upon the intellectual property rights of others; fluctuations in the company’s pension liabilit ies ; the ability of the company to meet its financial guidance, the company’s capital structure, including indebtedness amounts, the limitations imposed by the covenants in the documents go ver ning such indebtedness and the maintenance of the financial and disclosure controls and procedures of each; the ability of the company to obtain financing on favorable ter ms or at all; adverse changes in the credit ratings of the company; the impact of recent changes to U.S. tax laws, including on our effective tax rate, and the enactment of additional, or the revision of existing, state, federal, and/or foreign regulatory and tax laws and regulations; U.S. federal income tax consequences to U.S. persons owning at least 10% of the comp any ’s shares; changes in accounting principles, estimates or assumptions; fluctuation in revenue against the company’s relatively fixed expenses; the laws of Ireland being d iff erent from the laws of the United States and potentially affording less protections to the holders of our securities; and the company's holding company structure potentially preventi ng it from being able to receive dividends or other distributions in needed amounts from our subsidiaries. These factors also include those described under “Risk Factors” in the co mpany’s most recent 10 - K filing and subsequent filings filed with the SEC. Although we believe that the assumptions underlying our forward - looking statements are reasonable, any of these assumptions, and therefore also the forward - looking statements based on these assumptions, could themselves prove to be inaccurate. In light of the significant uncertainties inherent in th e f orward - looking statements included in this document, our inclusion of this information is not a representation or guarantee by us that our objectives and plans will be achieved. Our forward - looking statements speak only as of the date made and we will not update these forward - looking statements unless the securities laws require us to do so. In light of these risks, uncertainties and assumptions, the forward - looking events discussed in this document may not occur, and we caution you against relying on these forward - looking statements. 1

willistowerswatson.com Willis Towers Watson Non - GAAP Measures © 2019 Willis Towers Watson. All rights reserved. In order to assist readers of our consolidated financial statements in understanding the core operating results that Willis T owe rs Watson’s management uses to evaluate the business and for financial planning, we present the following non - GAAP measures: (1) Constant Currency Change, (2) Organic Change, (3) Adjusted O perating Income, (4) Adjusted EBITDA, (5) Adjusted Net Income, (6) Adjusted Diluted Earnings Per Share, (7) Adjusted Income Before Taxes, (8) Adjusted Income Taxes/Tax Rate and (9) Fr ee Cash Flow. The Company believes that these measures are relevant and provide useful information widely used by analysts, investors and o the r interested parties in our industry to provide a baseline for evaluating and comparing our operating performance, and in the case of free cash flow, our liquidity results. Additionally, in 2018, we adopted ASC 606, which had a material impact on the amount, timing and classification of certain re ven ue and costs included in our consolidated financial statements. Since the Company adopted the guidance using the modified retrospective method, it has provided the impact to the affected fi nan cial statement line items within the consolidated financial statements for 2018; the 2017 comparative financial statement line items have not been restated in accordance with the new st and ard. In an effort to help the reader better understand the impact that this guidance had on our non - GAAP measures, we have presented these measures as reported, as well as without the adoption o f ASC 606. Furthermore, the compensation for senior executives under certain long - term incentive programs is determined based on the result s of our non - GAAP measures for the period 2016 through 2018 calculated without the adoption of ASC 606. Therefore, to ensure transparency, we consider it necessary to also provide the n on - GAAP measures without the adoption of ASC 606. This will enable financial statement users the ability to evaluate management’s performance based on the same elements utilized for performanc e - b ased remuneration. Within these measures referred to as “adjusted”, we adjust for significant items which will not be settled in cash, or which we believe to be items that are not core to our current or future operations. Some of these items may not be applicable for the current quarter, however they are expected to be part of our full - year results . These items include the following: • Restructuring costs and transaction and integration expenses - Management believes it is appropriate to adjust for restructuring costs and transaction and integration expenses when they relate to a specific significant program with a defined set of activities and costs that are not expected to continue beyond a d efined period of time, or one - time Merger - related transaction expenses. We believe the adjustment is necessary to present how the Company is performing, both now and in the future when th ese programs will have concluded. • Gains and losses on disposals of operations - Adjustment to remove the gain or loss resulting from disposed operations. • Pension settlement and curtailment gains and losses - Adjustment to remove significant pension settlement and curtailment gains and losses to better present how the Company is performing. • Provisions for significant litigation - We will include provisions for litigation matters which we believe are not representativ e of our core business operations. • Venezuelan currency devaluation - Foreign exchange losses incurred as a consequence of the Venezuelan government’s enforced chan ges to exchange rate mechanisms. • Tax effects of internal reorganization - Relates to the U.S. income tax expense resulting from the completion of internal reorga nizations of the ownership of certain businesses that reduced the investments held by our U.S. - controlled subsidiaries. • Tax effect of U.S. Tax Reform - Relates to the (1) U.S. income tax adjustment of deferred taxes upon the change in the federal c orporate tax rate, (2) the impact of the one - time transition tax on accumulated foreign earnings net of foreign tax credits, and (3) the re - measurement of our net deferred tax liabilities assoc iated with the U.S. tax on certain foreign earnings offset with a write - off of deferred tax assets that will no longer be realizable under U.S. Tax Reform. We evaluate our revenue on an as reported (U.S. GAAP), constant currency and organic basis. We believe presenting constant cu rre ncy and organic information provides valuable supplemental information regarding our comparable results, consistent with how we evaluate our performance internally. Willis Towers Watson considers Constant Currency Change, Organic Change, Adjusted Operating Income, Adjusted EBITDA, Adjusted Ne t Income, Adjusted Diluted Earnings Per Share, Adjusted Income Before Taxes, Adjusted Income Taxes/Rate and Free Cash Flow to be important financial measures, which are used to inte rna lly evaluate and assess our core operations and to benchmark our operating and liquidity results against our competitors. These non - GAAP measures are important in illustrating wha t Willis Towers Watson’s comparable operating and liquidity results would have been had Willis Towers Watson not incurred transaction - related and non - recurring items. Willis Towers Watson’ s non - GAAP measures and their accompanying definitions are presented as follows: • Constant Currency Change – represents the year - over - year change in revenue excluding the impact of foreign currency fluctuations . To calculate this impact, the prior year local currency results are first translated using the current year monthly average exchange rates. The change is calculated by comparing the pr ior year revenue, translated at the current year monthly average exchange rates, to the current year as reported revenue, for the same period. We believe constant currency measures p rov ide useful information to investors because they provide transparency to performance by excluding the effects that foreign currency exchange rate fluctuations have on period - over - period comparability given volatility in foreign currency exchange markets. 2
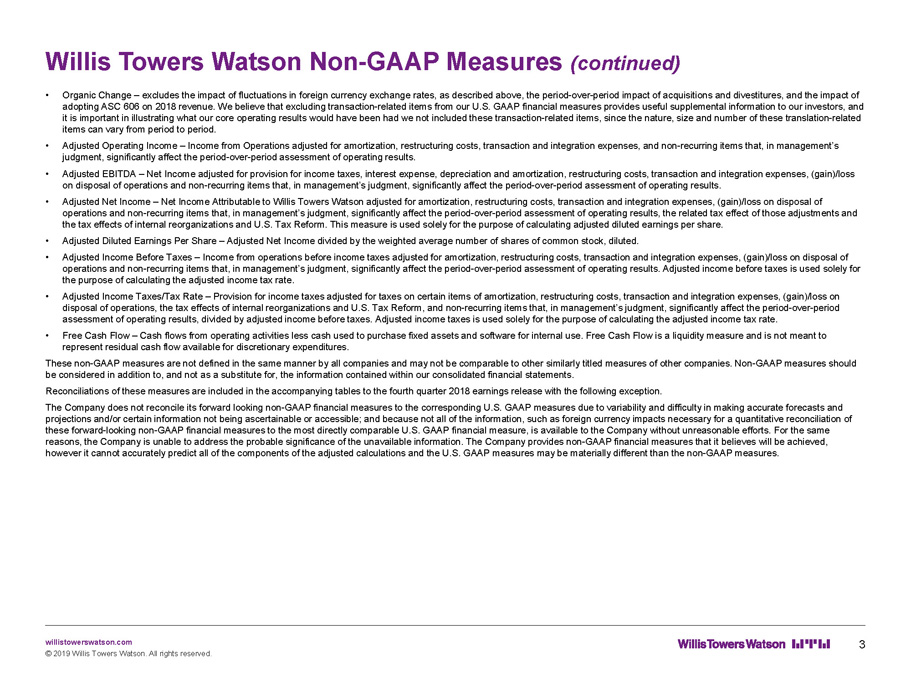
willistowerswatson.com Willis Towers Watson Non - GAAP Measures (continued) © 2019 Willis Towers Watson. All rights reserved. • Organic Change – excludes the impact of fluctuations in foreign currency exchange rates, as described above, the period - over - per iod impact of acquisitions and divestitures, and the impact of adopting ASC 606 on 2018 revenue. We believe that excluding transaction - related items from our U.S. GAAP financial measures prov ides useful supplemental information to our investors, and it is important in illustrating what our core operating results would have been had we not included these transaction - related it ems, since the nature, size and number of these translation - related items can vary from period to period. • Adjusted Operating Income – Income from Operations adjusted for amortization, restructuring costs, transaction and integration e xpenses, and non - recurring items that, in management’s judgment, significantly affect the period - over - period assessment of operating results. • Adjusted EBITDA – Net Income adjusted for provision for income taxes, interest expense, depreciation and amortization, restructu ring costs, transaction and integration expenses, (gain)/loss on disposal of operations and non - recurring items that, in management’s judgment, significantly affect the period - over - period as sessment of operating results. • Adjusted Net Income – Net Income Attributable to Willis Towers Watson adjusted for amortization, restructuring costs, transactio n and integration expenses, (gain)/loss on disposal of operations and non - recurring items that, in management’s judgment, significantly affect the period - over - period assessment of ope rating results, the related tax effect of those adjustments and the tax effects of internal reorganizations and U.S. Tax Reform. This measure is used solely for the purpose of calculating a dju sted diluted earnings per share. • Adjusted Diluted Earnings Per Share – Adjusted Net Income divided by the weighted average number of shares of common stock, dilu ted. ��� Adjusted Income Before Taxes – Income from operations before income taxes adjusted for amortization, restructuring costs, transa ction and integration expenses, (gain)/loss on disposal of operations and non - recurring items that, in management’s judgment, significantly affect the period - over - period assessment of ope rating results. Adjusted income before taxes is used solely for the purpose of calculating the adjusted income tax rate. • Adjusted Income Taxes/Tax Rate – Provision for income taxes adjusted for taxes on certain items of amortization, restructuring c osts, transaction and integration expenses, (gain)/loss on disposal of operations, the tax effects of internal reorganizations and U.S. Tax Reform, and non - recurring items that, in manage ment’s judgment, significantly affect the period - over - period assessment of operating results, divided by adjusted income before taxes. Adjusted income taxes is used solely for the purpos e o f calculating the adjusted income tax rate. • Free Cash Flow – Cash flows from operating activities less cash used to purchase fixed assets and software for internal use. Fre e Cash Flow is a liquidity measure and is not meant to represent residual cash flow available for discretionary expenditures. These non - GAAP measures are not defined in the same manner by all companies and may not be comparable to other similarly titled measures of other companies. Non - GAAP measures should be considered in addition to, and not as a substitute for, the information contained within our consolidated financial statem ent s. Reconciliations of these measures are included in the accompanying tables to the fourth quarter 2018 earnings release with th e f ollowing exception. The Company does not reconcile its forward looking non - GAAP financial measures to the corresponding U.S. GAAP measures due to va riability and difficulty in making accurate forecasts and projections and/or certain information not being ascertainable or accessible; and because not all of the information, such as fo reign currency impacts necessary for a quantitative reconciliation of these forward - looking non - GAAP financial measures to the most directly comparable U.S. GAAP financial measure, is available to t he Company without unreasonable efforts. For the same reasons, the Company is unable to address the probable significance of the unavailable information. The Company provides non - GAA P financial measures that it believes will be achieved, however it cannot accurately predict all of the components of the adjusted calculations and the U.S. GAAP measures may be mat eri ally different than the non - GAAP measures. 3
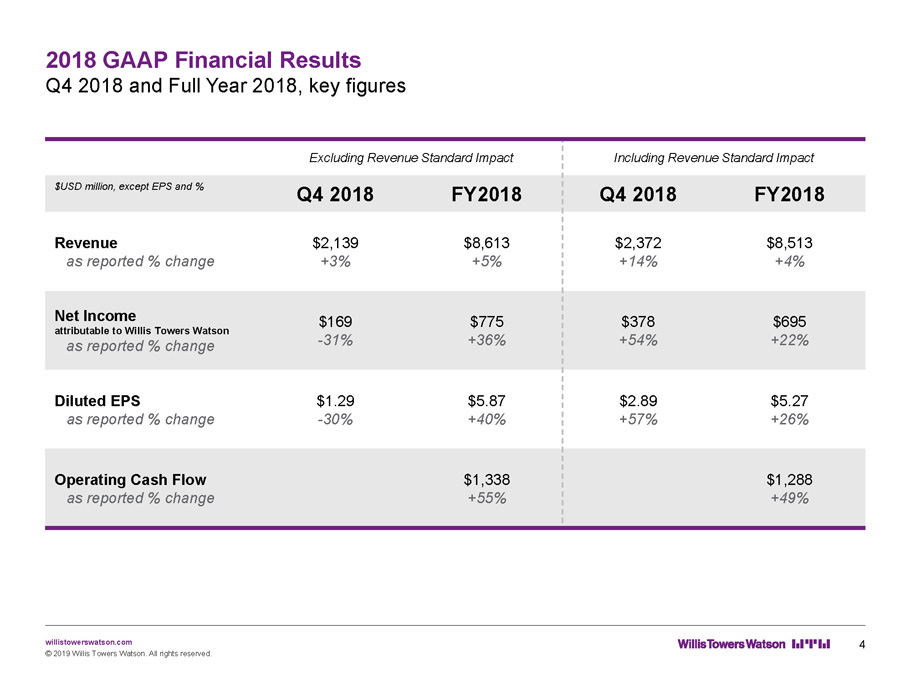
willistowerswatson.com 2018 GAAP Financial Results Q4 2018 and Full Year 2018, key figures © 2019 Willis Towers Watson. All rights reserved. Excluding Revenue Standard Impact Including Revenue Standard Impact $USD million, except EPS and % Q4 2018 FY2018 Q4 2018 FY2018 Revenue as reported % change $2,139 +3% $8,613 +5% $2,372 +14% $8,513 +4% Net Income attributable to Willis Towers Watson as reported % change $169 - 31% $775 +36% $378 +54% $695 +22% Diluted EPS as reported % change $1.29 - 30% $ 5.87 +40% $2.89 +57% $5.27 +26% Operating Cash Flow as reported % change $1,338 +55% $1,288 +49% 4

willistowerswatson.com Willis Towers Watson Reports Strong Results for Q4 and Full Year 2018 Includes Non - GAAP financial results, key figures © 2019 Willis Towers Watson. All rights reserved. $ 8.6 B FY2018 full year revenue excluding revenue standard impact Total Revenue + 5 % FY2018 + 6 % Q4 2018 Organic Revenue Growth Achieved another strong quarter with challenging comparable of 6% organic growth in Q4 2017. 5% organic growth in FY2018 is the strongest since the merger Delivering a client winning experience across 140 countries with the combined strength of the firm $ 1.1 B FY2018 full year free cash flow excluding revenue standard impact Free Cash Flow + 90 % FY2018 Almost doubled compared to last year Free cash flow is up 90% compared to FY2017 due to profit expansion and continued working capital management efforts $526m of in - quarter free cash flow generation is the highest free cash flow generation since the merger, and up 66% compared to Q4 2017 $ 10.33 FY2018 full year Adj. Diluted EPS excluding revenue standard impact Adj. Diluted EPS Milestone A significant milestone three years into our historic merger. Delivering on our commitment to shareholders. Continued strong focus on shareholder value creation 25.1 % FY2018 full year Adj. EBITDA margin excluding revenue standard impact Adj. EBITDA Margin Margin Improvement Strong organic growth coupled with prudent expense management creating profit flow through. Strong margin improvement with core business margin improvements across all Segments + 21 % FY2018 $ 2.40 Q4 2018 + 190 bps FY2018 24.5 % Q4 2018 5
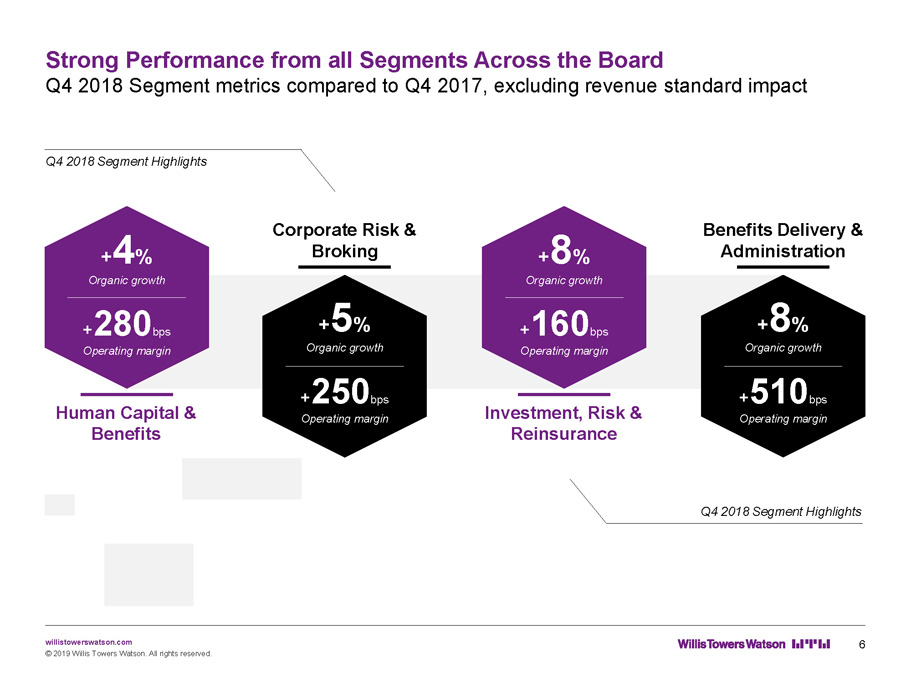
willistowerswatson.com Q4 2018 Segment Highlights Q4 2018 Segment Highlights Strong Performance from all Segments Across the Board Q4 2018 Segment metrics compared to Q4 2017, excluding revenue standard impact © 2019 Willis Towers Watson. All rights reserved. Corporate Risk & Broking + 5 % Organic growth + 250 bps Operating margin Benefits Delivery & Administration + 8 % Organic growth + 510 bps Operating margin + 4 % Organic growth + 280 bps Operating margin Human Capital & Benefits + 8 % Organic growth + 160 bps Operating margin Investment, Risk & Reinsurance 6
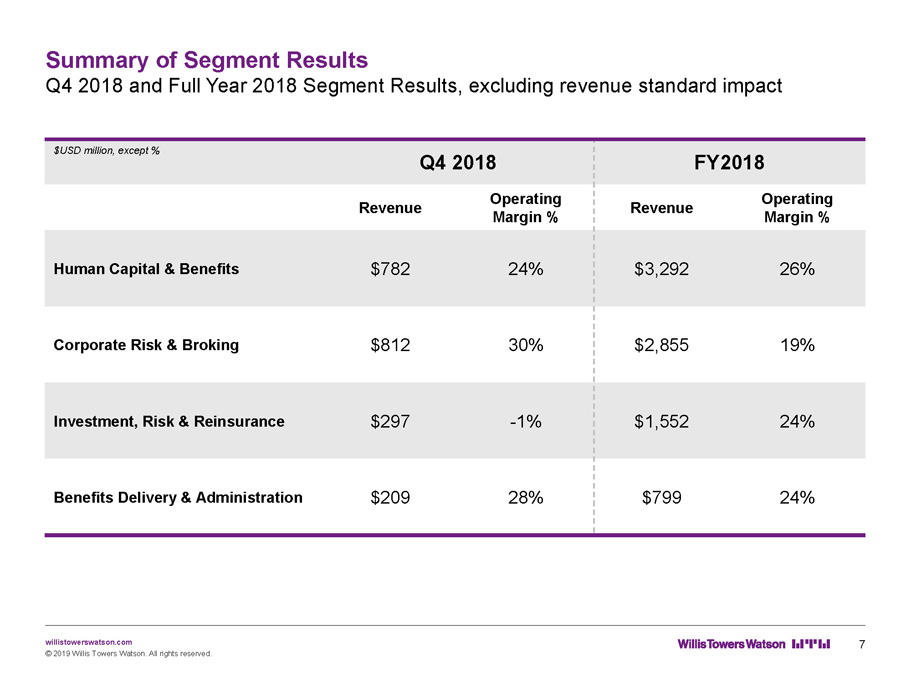
willistowerswatson.com Summary of Segment Results Q4 2018 and Full Year 2018 Segment Results, excluding revenue standard impact © 2019 Willis Towers Watson. All rights reserved. $USD million, except % Q4 2018 FY2018 Revenue Operating Margin % Revenue Operating Margin % Human Capital & Benefits $782 24% $3,292 26% Corporate Risk & Broking $812 30% $2,855 19% Investment, Risk & Reinsurance $297 - 1% $1,552 24% Benefits Delivery & Administration $209 28% $799 24% 7
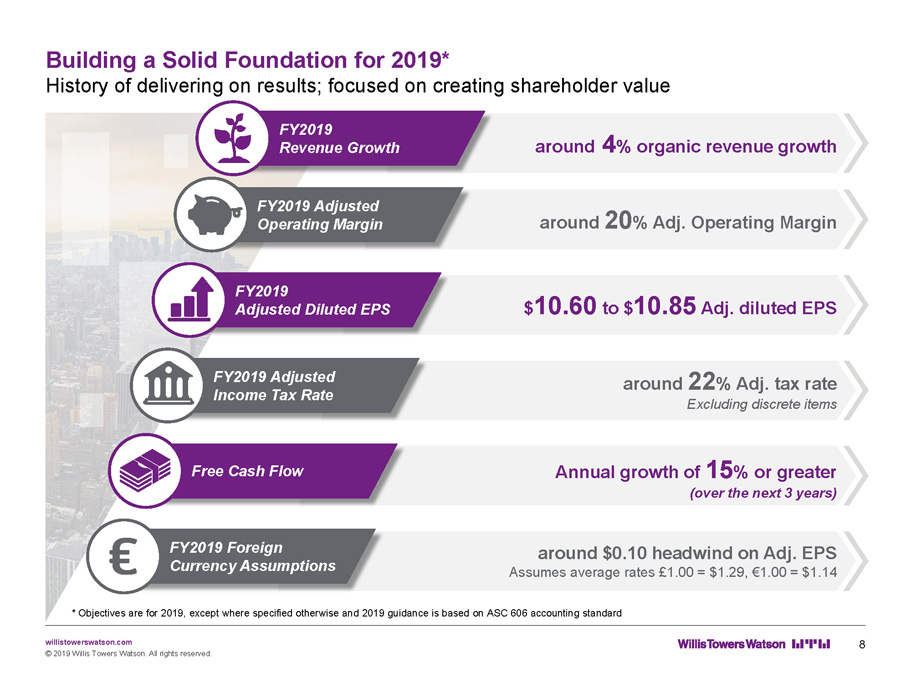
willistowerswatson.com © 2019 Willis Towers Watson. All rights reserved. around 4 % organic revenue growth FY2019 Revenue Growth around 20 % Adj. Operating Margin FY2019 Adjusted Operating Margin $ 10.60 to $ 10.85 Adj. diluted EPS FY2019 Adjusted Diluted EPS around 22 % Adj. tax rate Excluding discrete items FY2019 Adjusted Income Tax Rate Annual growth of 15 % or greater (over the next 3 years) Free Cash Flow around $0.10 headwind on Adj. EPS Assumes average rates £1.00 = $1.29, €1.00 = $1.14 FY2019 Foreign Currency Assumptions * Objectives are for 2019, except where specified otherwise and 2019 guidance is based on ASC 606 accounting standard 8 Building a Solid Foundation for 2019* History of delivering on results; focused on creating shareholder value

willistowerswatson.com Appendix © 2019 Willis Towers Watson. All rights reserved. 9

willistowerswatson.com Appendix: Other Income, Net 2018 10 - K Consolidated Financial Statements Note 16 © 2019 Willis Towers Watson. All rights reserved. $USD million Q1 2018 Q2 2018 Q3 2018 Q4 2018 FY18 Net periodic pension and postretirement benefits income $79 $81 $73 $71 $304 Foreign exchange (loss)/gain, net (16) 1 (8) (1) (24) Interest in earnings of associates income 2 1 1 - 3 Adjusted Other Income, net $65 $83 $66 $69 $283 Pension settlements and curtailment (loss)/gain - (20) 4 (8) (24) Loss on disposal of operations (9) - - - (9) Other Income, net (GAAP) $56 $63 $70 $61 $250 Net periodic pension and postretirement benefits: as a result of the retrospective adoption of ASU 2017 - 07 within the consolidated statement of comprehensive income, the service - cost component of net periodic benefit income / (loss) remained within salaries and benefits expense, while the remainder of the components are now included within Other Income, net Interest in earnings of associates: beginning in 2018, Willis Towers Watson retrospectively reclassified the gross effect of its interest in earnings of associates from its own line item to Other Income, net within its consolidated statements of comprehensive income Based on our annual review estimate, Other Income, net is expected to decrease by $60m in 2019, or equivalent to 65 to 70 basis point of adj. EBITDA margin headwind. This estimate is driven primarily by a decrease in expected return on pension assets, which is a non - cash item and therefore has no impact on our 2019 free cash flow. Numbers presented in this table may not add up to the total indicated due to rounding 10
willistowerswatson.com © 2019 Willis Towers Watson. All rights reserved. About Willis Towers Watson Willis Towers Watson (NASDAQ: WLTW) is a leading global advisory, broking and solutions company that helps clients around the world turn risk into a path for growth. With roots dating to 1828, Willis Towers Watson has over 40,000 employees serving more than 140 countries. We design and deliver solutions that manage risk, optimize benefits, cultivate talent, and expand the power of capital to protect and strengthen institutions and individuals. Our unique perspective allows us to see the critical intersections between talent, assets and ideas — the dynamic formula that drives business performance. Together, we unlock potential. Learn more at willistowerswatson.com.