Exhibit 99.2
willistowerswatson.com willistowerswatson.com Willis Towers Watson Earnings Release Supplemental Materials 2020 Fourth Quarter and Full Year Financial Results February 9, 2021 © 2021 Willis Towers Watson. All rights reserved.

willistowerswatson.com Willis Towers Watson Forward Looking Statements © 2021 Willis Towers Watson. All rights reserved. This document contains “forward - looking statements” within the meaning of the Private Securities Litigation Reform Act of 1995. You can identify these statements and other forward - looking statements in this document by words such as “may”, “will”, “would”, “expect”, “anticipate”, “believe”, “estimate”, “plan”, “intend”, “cont inu e”, or similar words, expressions or the negative of such terms or other comparable terminology. These statements include, but are not limited to, such things as our outlook, the impact of the COVID - 19 pandemic on our business, our pending business combination with Aon plc, future capital expenditures, ongoing working capital efforts, future share repurchases, financial results (including our re venue), the impact of changes to tax laws on our financial results, existing and evolving business strategies and acquisitions and dispositions, demand for our services and competitive strengths, goals, the be nefits of new initiatives, growth of our business and operations, our ability to successfully manage ongoing organizational and technology changes, including investments in improving systems and processe s, and plans and references to future successes, including our future financial and operating results, plans, objectives, expectations and intentions and other statements that are not historical fac ts. Such statements are based upon the current beliefs and expectations of Willis Towers Watson’s management and are subject to significant risks and uncertainties. Actual results may differ from thos e s et forth in the forward - looking statements. All forward - looking disclosure is speculative by its nature. There are important risks, uncertainties, events and factors that could cause our actual results or performance to differ mat eri ally from those in the forward - looking statements contained herein, including the following: the risks relating to or arising from our pending business combination with Aon plc announced in March 2020, i ncl uding, among others, our ability to consummate the transaction, including on the terms of the business combination agreement, on the anticipated timeline, and/or with the required regulatory approval s; our ability to successfully establish, execute and achieve our global business strategy as it evolves; the risk that the COVID - 19 pandemic substantially and negatively impacts the demand for our pro ducts and services and cash flows, and/or continues to materially impact our business operations, including increased demand on our information technology resources and systems and related risks of cyb ersecurity breaches or incidents; changes in demand for our services, including any decline in consulting services, defined benefit pension plans or the purchasing of insurance; changes in genera l e conomic, business and political conditions, including changes in the financial markets; significant competition that we face and the potential for loss of market share and/or profitability; the imp act of seasonality and differences in timing of renewals; the failure to protect client data or breaches of information systems or insufficient safeguards against cybersecurity breaches or incidents; the ri sk of increased liability or new legal claims arising from our new and existing products and services, and expectations, intentions and outcomes relating to outstanding litigation; the risk that the Stanfo rd bar order may be challenged in other jurisdictions, and the risk that the charge related to the Stanford settlement may not be deductible; the risk of substantial negative outcomes on existing litigation or in vestigation matters; changes in the regulatory environment in which we operate, including, among other risks, the impact of pending competition law and regulatory investigations; various claims, g ove rnment inquiries or investigations or the potential for regulatory action; our ability to make divestitures or acquisitions and our ability to integrate or manage such acquired businesses; our ability to suc cessfully hedge against fluctuations in foreign currency rates; our ability to integrate direct - to - consumer sales and marketing solutions with our existing offerings and solutions; successfully manage ongoin g organizational changes, including investments in improving systems and processes; disasters or business continuity problems; the impact of Brexit; risks relating to the U.S. 2020 election, includi ng a potential increase in the corporate tax rate; our ability to successfully enhance our billing, collection and other working capital efforts, and thereby increase our free cash flow; the potential imp act of the anticipated replacement of LIBOR; our ability to properly identify and manage conflicts of interest; reputational damage, including from association with third parties; reliance on third - party servic es; the loss of key employees; our ability to effectively apply technology, data and analytics changes for internal operations, maintaining industry standards and meeting client preferences; changes and dev elo pments in the insurance industry; the ability to comply with complex and evolving regulations related to data privacy and cyber security; doing business internationally, including the impact of exch ang e rates; compliance with extensive government regulation; the risk of sanctions imposed by governments, or changes to associated sanction regulations; changes and developments in the United State s h ealthcare system, including those related to Medicare and any policy changes from the new Presidential administration and legislative actions from the current U.S. Congress; the inability to pro tec t our intellectual property rights, or the potential infringement upon the intellectual property rights of others; the laws of Ireland being different from the laws of the United States and potentiall y a ffording less protections to the holders of our securities; fluctuations in our pension assets and liabilities; our capital structure, including indebtedness amounts, the limitations imposed by the covenan ts in the documents governing such indebtedness and the maintenance of the financial and disclosure controls and procedures of each; our ability to obtain financing on favorable terms or at all; adver se changes in our credit ratings; the impact of recent changes to U.S. tax laws, including on our effective tax rate, and the enactment of additional, or the revision of existing, state, federal, and/or for eig n regulatory and tax laws and regulations and any policy changes from the new Presidential administration and legislative actions from the current U.S. Congress; U.S. federal income tax consequences to U .S. persons owning at least 10% of our shares; changes in accounting principles, estimates or assumptions; fluctuation in revenue against our relatively fixed or higher than expected expenses; a nd our holding company structure potentially preventing us from being able to receive dividends or other distributions in needed amounts from our subsidiaries. These factors also include those described und er “Risk Factors” in the company’s most recent 10 - K filing and subsequent filings filed with the SEC, including definitive additional materials, the merger proxy statement and other filings generally ap plicable to significant transactions and related integrations that are or will be filed with the SEC. Copies are available online at http://www.sec.gov or www.willistowerswatson.com . Although we believe that the assumptions underlying our forward - looking statements are reasonable, any of these assumptions, and therefore also the forward - looking statements based on these assumptions, could themselves prove to be inaccurate. In light of the significant uncertainties inherent in the forward - looking statements included in this document, our inclusion of this information is not a representation or guarantee by us that our objectives and plans will be achieved. Our forward - looking statements speak only as of the date made and we will not update these forward - looking statements unless the securities laws require us to do so. In light of these risks, uncertainties and assumptions, the forward - looking events discussed in this document may not occur, and we caution you against relying on thes e forward - looking statements. 1

willistowerswatson.com Willis Towers Watson Non - GAAP Measures © 2021 Willis Towers Watson. All rights reserved. In order to assist readers of our consolidated financial statements in understanding the core operating results that Willis T owe rs Watson’s management uses to evaluate the business and for financial planning, we present the following non - GAAP measures: (1) Constant Currency Change, (2) Organic Change, (3) Adjusted O perating Income/Margin, (4) Adjusted EBITDA/Margin, (5) Adjusted Net Income, (6) Adjusted Diluted Earnings Per Share, (7) Adjusted Income Before Taxes, (8) Adjusted Income Taxes/Tax Ra te and (9) Free Cash Flow. The Company believes that these measures are relevant and provide useful information widely used by analysts, investors and o the r interested parties in our industry to provide a baseline for evaluating and comparing our operating performance, and in the case of free cash flow, our liquidity results. Reconciliations of these measures are included in the accompanying appendix of these earning release supplemental materials. The Company does not reconcile its forward - looking non - GAAP financial measures to the corresponding U.S. GAAP measures, due to v ariability and difficulty in making accurate forecasts and projections and/or certain information not being ascertainable or accessible; and because not all of the information, such as fo reign currency impacts necessary for a quantitative reconciliation of these forward - looking non - GAAP financial measures to the most directly comparable U.S. GAAP financial measure, is available to t he Company without unreasonable efforts. For the same reasons, the Company is unable to address the probable significance of the unavailable information. The Company provides non - GAA P financial measures that it believes will be achieved, however it cannot accurately predict all of the components of the adjusted calculations and the U.S. GAAP measures may be mat eri ally different than the non - GAAP measures. 2
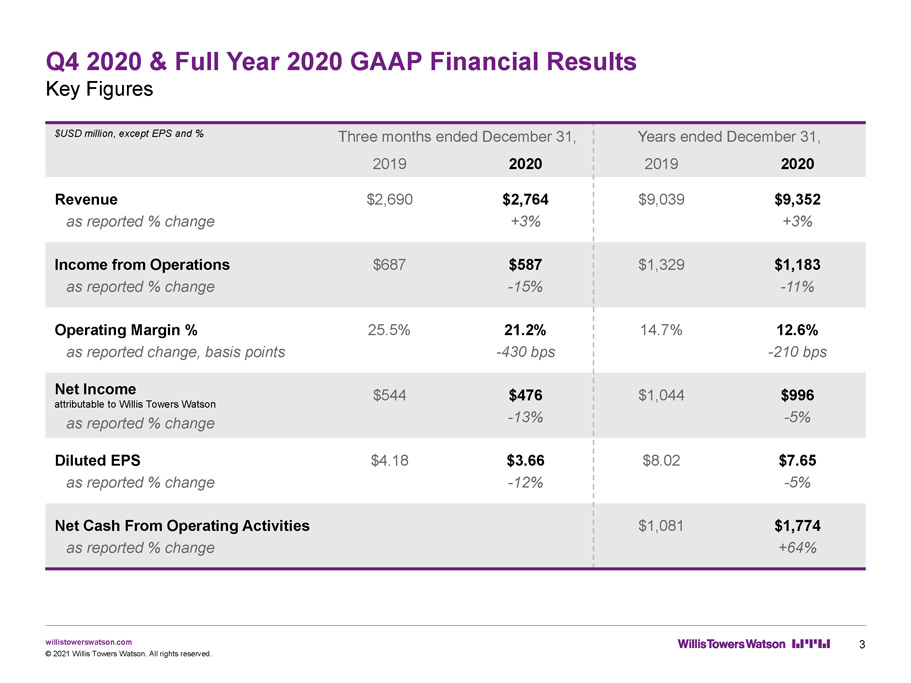
willistowerswatson.com Q4 2020 & Full Year 2020 GAAP Financial Results Key Figures © 2021 Willis Towers Watson. All rights reserved. 3 $USD million, except EPS and % Three months ended December 31, Years ended December 31, 2019 2020 2019 2020 Revenue as reported % change $2,690 $2,764 +3% $9,039 $9,352 +3% Income from Operations as reported % change $687 $587 - 15% $1,329 $1,183 - 11% Operating Margin % as reported change, basis points 25.5% 21.2% - 430 bps 14.7% 12.6% - 210 bps Net Income attributable to Willis Towers Watson as reported % change $544 $476 - 13% $1,044 $996 - 5% Diluted EPS as reported % change $4.18 $3.66 - 12% $8.02 $7.65 - 5% Net Cash From Operating Activities as reported % change $1,081 $1,774 +64%
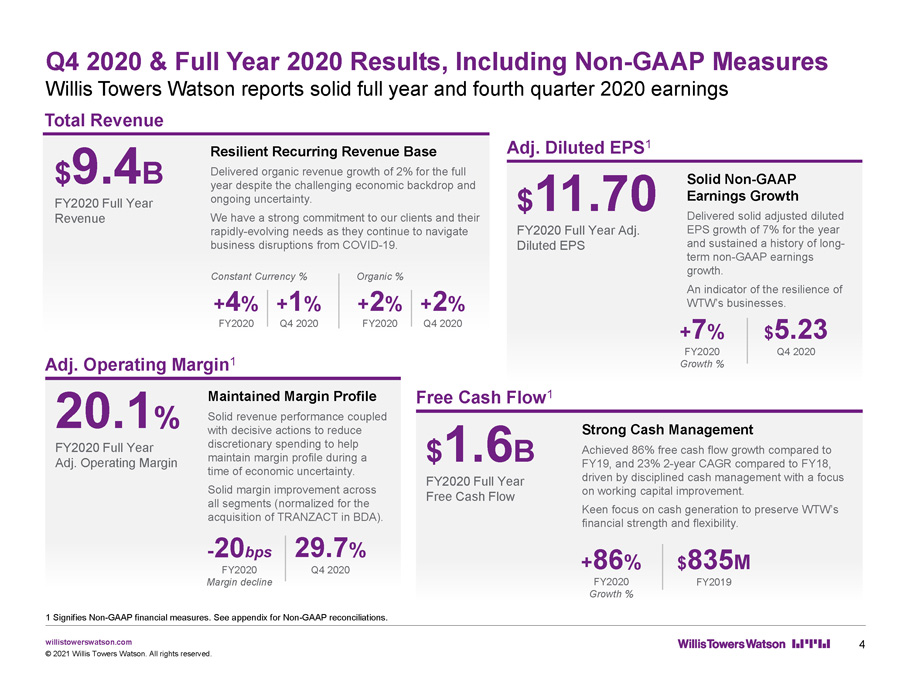
willistowerswatson.com Q4 2020 & Full Year 2020 Results, Including Non - GAAP Measures Willis Towers Watson reports solid full year and fourth quarter 2020 earnings © 2021 Willis Towers Watson. All rights reserved. $ 9.4 B FY2020 Full Year Revenue Total Revenue Resilient Recurring Revenue Base Delivered organic revenue growth of 2% for the full year despite the challenging economic backdrop and ongoing uncertainty. We have a strong commitment to our clients and their rapidly - evolving needs as they continue to navigate business disruptions from COVID - 19. $ 1.6 B FY2020 Full Year Free Cash Flow Free Cash Flow 1 + 86 % FY2020 Growth % Strong Cash Management Achieved 86% free cash flow growth compared to FY19, and 23% 2 - year CAGR compared to FY18, driven by disciplined cash management with a focus on working capital improvement. Keen focus on cash generation to preserve WTW’s financial strength and flexibility. $ 11.70 FY2020 Full Year Adj. Diluted EPS Adj. Diluted EPS 1 Solid Non - GAAP Earnings Growth Delivered solid adjusted diluted EPS growth of 7% for the year and sustained a history of long - term non - GAAP earnings growth. An indicator of the resilience of WTW’s businesses. 20.1 % FY2020 Full Year Adj. Operating Margin Adj. Operating Margin 1 Maintained Margin Profile Solid revenue performance coupled with decisive actions to reduce discretionary spending to help maintain margin profile during a time of economic uncertainty. Solid margin improvement across all segments (normalized for the acquisition of TRANZACT in BDA). + 7 % FY2020 Growth % $ 5.23 Q4 2020 29.7 % Q4 2020 4 $ 835 M FY2019 1 Signifies Non - GAAP financial measures. See appendix for Non - GAAP reconciliations. - 20 bps FY2020 Margin decline + 4 % FY2020 + 1 % Q4 2020 Constant Currency % + 2 % FY2020 + 2 % Q4 2020 Organic %
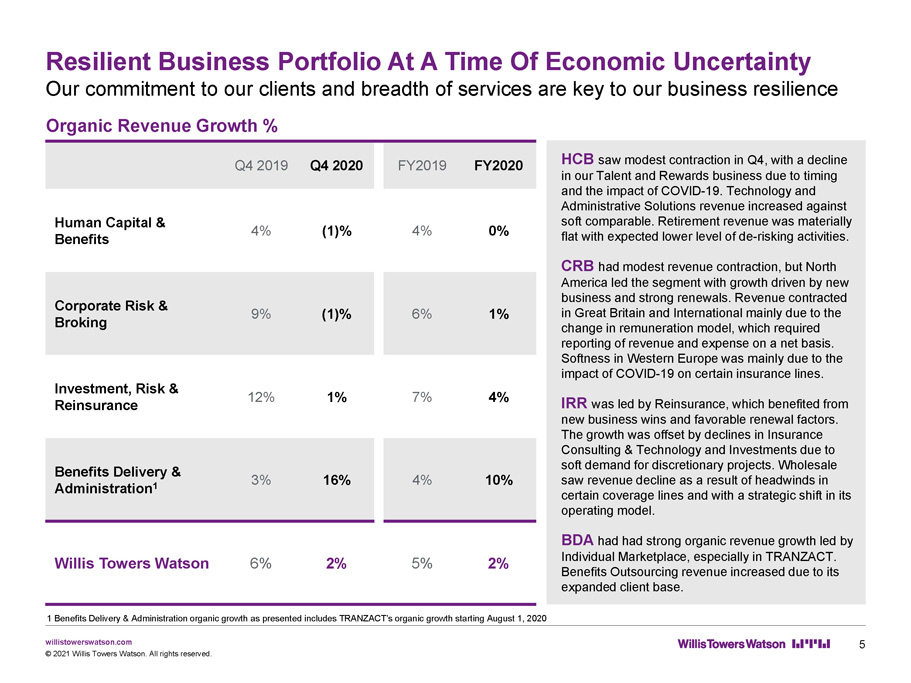
willistowerswatson.com Organic Revenue Growth % Resilient Business Portfolio At A Time Of Economic Uncertainty Our commitment to our clients and breadth of services are key to our business resilience © 2021 Willis Towers Watson. All rights reserved. 5 HCB saw modest contraction in Q4, with a decline in our Talent and Rewards business due to timing and the impact of COVID - 19. Technology and Administrative Solutions revenue increased against soft comparable. Retirement revenue was materially flat with expected lower level of de - risking activities. CRB had modest revenue contraction, but North America led the segment with growth driven by new business and strong renewals. Revenue contracted in Great Britain and International mainly due to the change in remuneration model, which required reporting of revenue and expense on a net basis. Softness in Western Europe was mainly due to the impact of COVID - 19 on certain insurance lines. IRR was led by Reinsurance, which benefited from new business wins and favorable renewal factors . The growth was offset by declines in Insurance Consulting & Technology and Investments due to soft demand for discretionary projects. Wholesale saw revenue decline as a result of headwinds in certain coverage lines and with a strategic shift in its operating model . BDA had had strong organic revenue growth led by Individual Marketplace, especially in TRANZACT. Benefits Outsourcing revenue increased due to its expanded client base. 1 Benefits Delivery & Administration organic growth as presented includes TRANZACT’s organic growth starting August 1, 2020 Q4 2019 Q4 2020 FY2019 FY2020 Human Capital & Benefits 4% (1)% 4% 0% Corporate Risk & Broking 9% (1)% 6% 1% Investment, Risk & Reinsurance 12% 1% 7% 4% Benefits Delivery & Administration 1 3% 16% 4% 10% Willis Towers Watson 6% 2% 5% 2%

willistowerswatson.com Summary of Segment Financial Results Q4 2020 and full year 2020 segment results compared to full year 2019 © 2021 Willis Towers Watson. All rights reserved. 6 1 The Operating Margin percentage is rounded.. As reported, $USD million, except % Q4 2020 FY2020 Revenue Operating Margin % 1 Revenue Operating Margin % 1 Margin Year - over - year Human Capital & Benefits 865 31% 3,278 26% +30 bps Corporate Risk & Broking 888 32% 2,977 21% +160 bps Investment, Risk & Reinsurance 292 11% 1,651 28% +200 bps Benefits Delivery & Administration 693 51% 1,359 24% - 10 bps
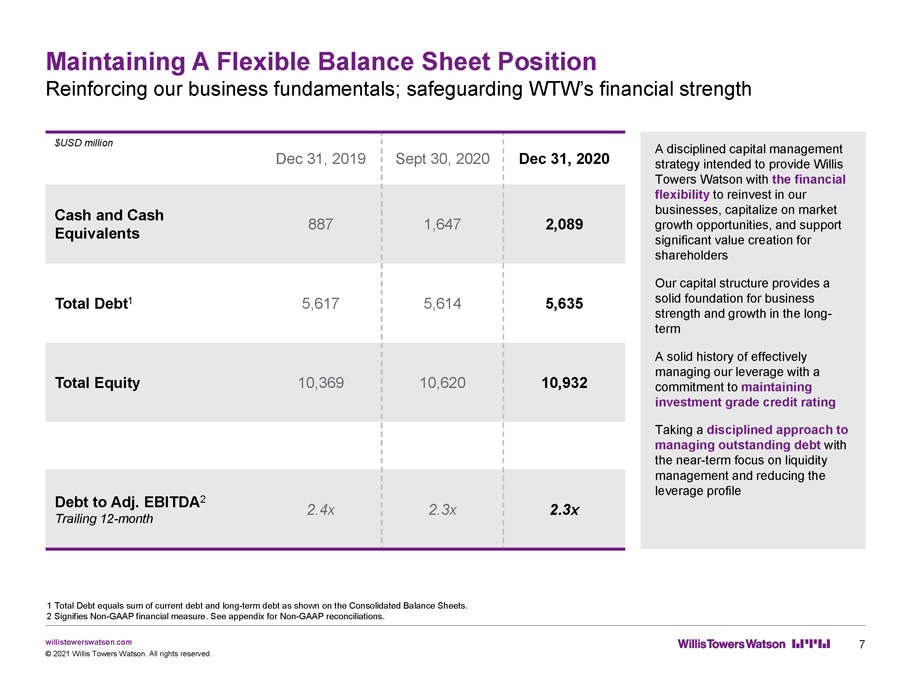
willistowerswatson.com Maintaining A Flexible Balance Sheet Position Reinforcing our business fundamentals; safeguarding WTW’s financial strength 7 © 2021 Willis Towers Watson. All rights reserved. A disciplined capital management strategy intended to provide Willis Towers Watson with the financial flexibility to reinvest in our businesses, capitalize on market growth opportunities, and support significant value creation for shareholders Our capital structure provides a solid foundation for business strength and growth in the long - term A solid history of effectively managing our leverage with a commitment to maintaining investment grade credit rating Taking a disciplined approach to managing outstanding debt with the near - term focus on liquidity management and reducing the leverage profile 1 Total Debt equals sum of current debt and long - term debt as shown on the Consolidated Balance Sheets. 2 Signifies Non - GAAP financial measure. See appendix for Non - GAAP reconciliations. $USD million Dec 31, 2019 Sept 30, 2020 Dec 31, 2020 Cash and Cash Equivalents 887 1,647 2,089 Total Debt 1 5,617 5,614 5,635 Total Equity 10,369 10,620 10,932 Debt to Adj. EBITDA 2 Trailing 12 - month 2.4x 2.3x 2.3x
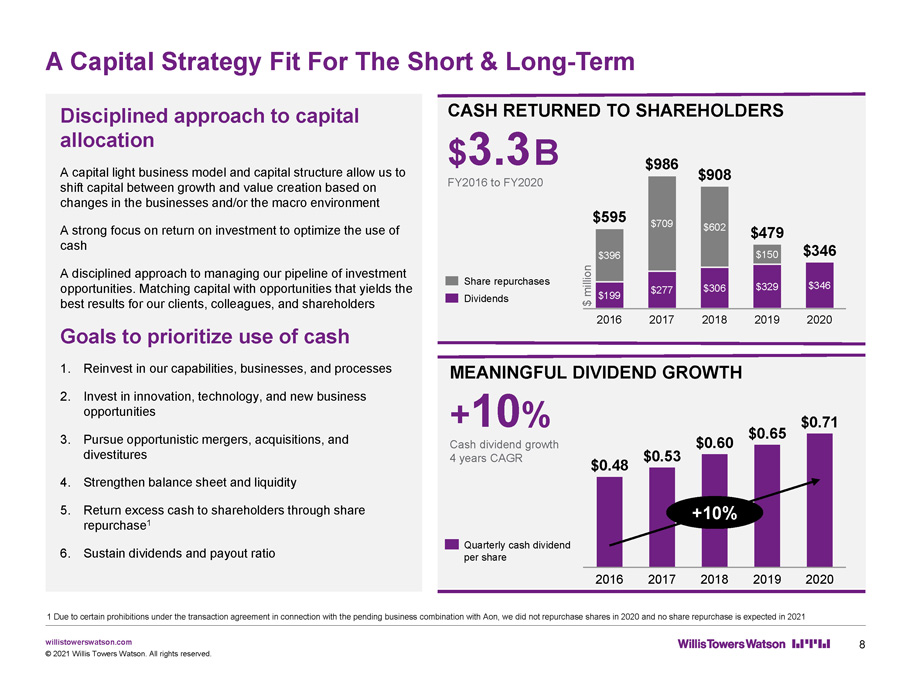
willistowerswatson.com A Capital Strategy Fit For The Short & Long - Term 8 © 2021 Willis Towers Watson. All rights reserved. CASH RETURNED TO SHAREHOLDERS $ 3.3 B FY2016 to FY2020 $ 306 $ 709 $ 199 $ 277 $ 396 2016 2018 2017 $ 329 $ 602 $ 479 $ 346 $ 150 2019 2020 $ 595 $ 986 $ 908 $ 346 MEANINGFUL DIVIDEND GROWTH + 10 % Cash dividend growth 4 years CAGR $ 0.60 2018 $ 0.48 2016 2020 2017 2019 $ 0.53 $ 0.65 $ 0.71 Share repurchases Dividends Quarterly cash dividend per share +10% $ million Disciplined approach to capital allocation A capital light business model and capital structure allow us to shift capital between growth and value creation based on changes in the businesses and/or the macro environment A strong focus on return on investment to optimize the use of cash A disciplined approach to managing our pipeline of investment opportunities. Matching capital with opportunities that yields the best results for our clients, colleagues, and shareholders Goals to prioritize use of cash 1. Reinvest in our capabilities, businesses, and processes 2. Invest in innovation, technology, and new business opportunities 3. Pursue opportunistic mergers, acquisitions, and divestitures 4. Strengthen balance sheet and liquidity 5. Return excess cash to shareholders through share repurchase 1 6. Sustain dividends and payout ratio 1 Due to certain prohibitions under the transaction agreement in connection with the pending business combination with Aon, we did not repurchase shares in 2020 and no share repurchase is expected in 2021
willistowerswatson.com willistowerswatson.com Appendix: Reconciliation of Non - GAAP Measures 9 © 2021 Willis Towers Watson. All rights reserved.
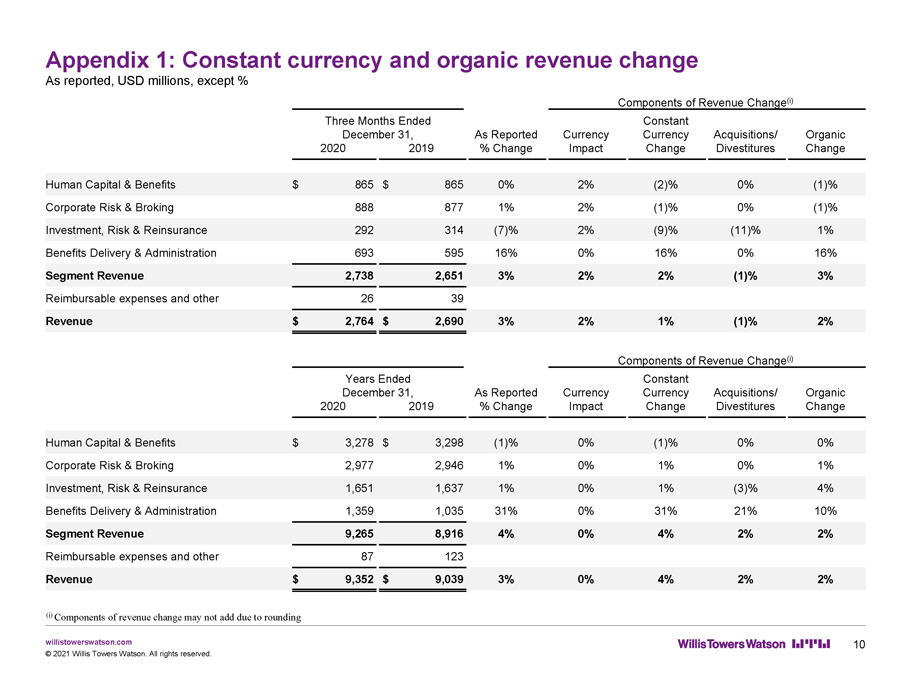
willistowerswatson.com Appendix 1: Constant currency and organic revenue change As reported, USD millions, except % 10 © 2021 Willis Towers Watson. All rights reserved. ( i ) Components of revenue change may not add due to rounding Components of Revenue Change ( i ) Three Months Ended December 31, As Reported Currency Constant Currency Acquisitions/ Organic 2020 2019 % Change Impact Change Divestitures Change Human Capital & Benefits $ 865 $ 865 0% 2% (2)% 0% (1)% Corporate Risk & Broking 888 877 1% 2% (1)% 0% (1)% Investment, Risk & Reinsurance 292 314 (7)% 2% (9)% (11)% 1% Benefits Delivery & Administration 693 595 16% 0% 16% 0% 16% Segment Revenue 2,738 2,651 3% 2% 2% (1)% 3% Reimbursable expenses and other 26 39 Revenue $ 2,764 $ 2,690 3% 2% 1% (1)% 2% Components of Revenue Change ( i ) Years Ended December 31, As Reported Currency Constant Currency Acquisitions/ Organic 2020 2019 % Change Impact Change Divestitures Change Human Capital & Benefits $ 3,278 $ 3,298 (1)% 0% (1)% 0% 0% Corporate Risk & Broking 2,977 2,946 1% 0% 1% 0% 1% Investment, Risk & Reinsurance 1,651 1,637 1% 0% 1% (3)% 4% Benefits Delivery & Administration 1,359 1,035 31% 0% 31% 21% 10% Segment Revenue 9,265 8,916 4% 0% 4% 2% 2% Reimbursable expenses and other 87 123 Revenue $ 9,352 $ 9,039 3% 0% 4% 2% 2%

willistowerswatson.com Appendix 2: Adjusted operating income and margin, adjusted EBITDA and margin As reported, USD millions, except % 11 © 2021 Willis Towers Watson. All rights reserved. Three Months Ended December 31, 2020 2019 Income from operations $ 587 21.2 % $ 687 25.5 % Adjusted for certain items: Amortization 114 121 Restructuring costs 24 — Transaction and integration expenses 45 1 Provision for significant litigation ( i ) 50 — Adjusted operating income $ 820 29.7 % $ 809 30.1 % Three Months Ended December 31, 2020 2019 Net Income $ 483 17.5 % $ 551 20.5 % Provision for income taxes 119 124 Interest expense 60 62 Depreciation 70 69 Amortization 114 121 Restructuring costs 24 — Transaction and integration expenses 45 1 Provision for significant litigation ( i ) 50 — Loss on disposal of operations 2 2 Adjusted EBITDA and Adjusted EBITDA Margin $ 967 35.0 % $ 930 34.6 % Years Ended December 31, 2020 2019 Income from operations $ 1,183 12.6 % $ 1,329 14.7 % Adjusted for certain items: Abandonment of long - lived asset 35 — Amortization 462 489 Restructuring costs 24 — Transaction and integration expenses 110 13 Provision for significant litigation ( i ) 65 — Adjusted operating income $ 1,879 20.1 % $ 1,831 20.3 % Years Ended December 31, 2020 2019 Net Income $ 1,020 10.9 % $ 1,073 11.9 % Provision for income taxes 318 249 Interest expense 244 234 Depreciation (ii) 308 240 Amortization 462 489 Restructuring costs 24 — Transaction and integration expenses 110 13 Provision for significant litigation ( i ) 65 — (Gain)/loss on disposal of operations (81) 2 Adjusted EBITDA and Adjusted EBITDA Margin $ 2,470 26.4 % $ 2,300 25.4 % ( i ) In the fourth quarter of 2020, the Company agreed in principle to settle both the federal litigation and the Delaware litigat ion associated with the 2016 Willis/Towers Watson merger for aggregate payments of $90 million. The Company subsequently filed definitive settlement agreements with both courts in January 2021. We de scribed this litigation in the Company’s Periodic Report on Form 10 - Q for the quarter ended September 30, 2020, and we will provide an update regarding the settlements in the Company’s 2020 Ann ual Report on Form 10 - K. As a result of the settlements, the Company increased its provision for such litigation (net of insurance and other recoveries) from $15 million to $65 million d uri ng the fourth quarter of 2020. The settlements are contingent upon final approval by the courts in both the federal litigation and the Delaware litigation. The Company agreed to the settlements and the payment of the settlement amounts to eliminate the distraction, burden, expense and uncertainty of further litigation. Further, in reaching the settlements, the parties understood and agreed that t her e is no admission of liability or wrongdoing by the Company or any of the other defendants. (ii) Includes abandonment of long - lived asset of $35 million for the year ended December 31, 2020.

willistowerswatson.com Appendix 3: Adjusted net income and adjusted diluted earnings per share As reported, USD millions, except % and EPS 12 © 2021 Willis Towers Watson. All rights reserved. Three Months Ended December 31, 2020 2019 Net Income attributable to Willis Towers Watson $ 476 $ 544 Adjusted for certain items: Amortization 114 121 Restructuring costs 24 — Transaction and integration expenses 45 1 Provision for significant litigation ( i ) 50 — Loss on disposal of operations 2 2 Tax effect on certain items listed above (ii) (53) (31) Tax effect of the CARES Act 23 — Adjusted Net Income $ 681 $ 637 Weighted - average shares of common stock, diluted 130 130 Diluted Earnings Per Share $ 3.66 $ 4.18 Adjusted for certain items: (iii) Amortization 0.87 0.93 Restructuring costs 0.18 — Transaction and integration expenses 0.35 0.01 Provision for significant litigation ( i ) 0.38 — Loss on disposal of operations 0.02 0.02 Tax effect on certain items listed above (ii) (0.41) (0.24) Tax effect of the CARES Act 0.18 — Adjusted Diluted Earnings Per Share $ 5.23 $ 4.90 Years Ended December 31, 2020 2019 Net Income attributable to Willis Towers Watson $ 996 $ 1,044 Adjusted for certain items: Abandonment of long - lived asset 35 — Amortization 462 489 Restructuring costs 24 — Transaction and integration expenses 110 13 Provision for significant litigation ( i ) 65 — (Gain)/loss on disposal of operations (81) 2 Tax effect on certain items listed above (ii) (149) (121) Tax effect of the CARES Act 61 — Adjusted Net Income $ 1,523 $ 1,427 Weighted - average shares of common stock, diluted 130 130 Diluted Earnings Per Share $ 7.65 $ 8.02 Adjusted for certain items: (iii) Abandonment of long - lived asset 0.27 — Amortization 3.55 3.75 Restructuring costs 0.18 — Transaction and integration expenses 0.84 0.10 Provision for significant litigation ( i ) 0.50 — (Gain)/loss on disposal of operations (0.62) 0.02 Tax effect on certain items listed above (ii) (1.14) (0.93) Tax effect of the CARES Act 0.47 — Adjusted Diluted Earnings Per Share $ 11.70 $ 10.96 ( i ) In the fourth quarter of 2020, the Company agreed in principle to settle both the federal litigation and the Delaware litigat ion associated with the 2016 Willis/Towers Watson merger for aggregate payments of $90 million. The Company subsequently filed definitive settlement agreements with both courts in January 2021. We de scribed this litigation in the Company’s Periodic Report on Form 10 - Q for the quarter ended September 30, 2020, and we will provide an update regarding the settlements in the Company’s 2020 Ann ual Report on Form 10 - K. As a result of the settlements, the Company increased its provision for such litigation (net of insurance and other recoveries) from $15 million to $65 million d uri ng the fourth quarter of 2020. The settlements are contingent upon final approval by the courts in both the federal litigation and the Delaware litigation. The Company agreed to the settlements and the payment of the settlement amounts to eliminate the distraction, burden, expense and uncertainty of further litigation. Further, in reaching the settlements, the parties understood and agreed that t her e is no admission of liability or wrongdoing by the Company or any of the other defendants. (ii) The tax effect was calculated using an effective tax rate for each item. (iii) Per share values and totals may differ due to rounding.
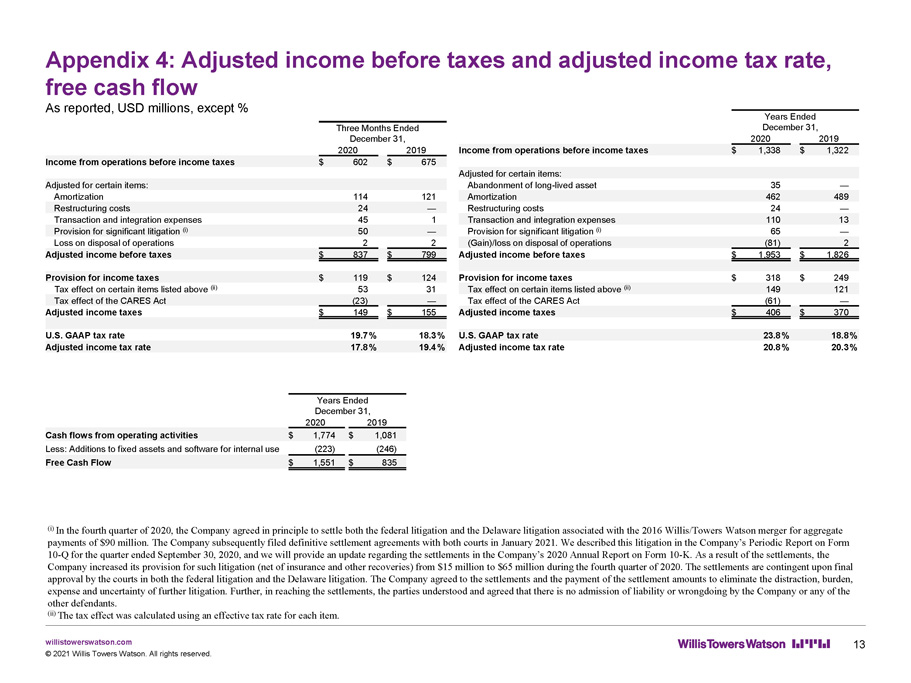
willistowerswatson.com Appendix 4: Adjusted income before taxes and adjusted income tax rate, free cash flow As reported, USD millions, except % 13 © 2021 Willis Towers Watson. All rights reserved. Three Months Ended December 31, 2020 2019 Income from operations before income taxes $ 602 $ 675 Adjusted for certain items: Amortization 114 121 Restructuring costs 24 — Transaction and integration expenses 45 1 Provision for significant litigation ( i ) 50 — Loss on disposal of operations 2 2 Adjusted income before taxes $ 837 $ 799 Provision for income taxes $ 119 $ 124 Tax effect on certain items listed above (ii) 53 31 Tax effect of the CARES Act (23) — Adjusted income taxes $ 149 $ 155 U.S. GAAP tax rate 19.7 % 18.3 % Adjusted income tax rate 17.8 % 19.4 % Years Ended December 31, 2020 2019 Income from operations before income taxes $ 1,338 $ 1,322 Adjusted for certain items: Abandonment of long - lived asset 35 — Amortization 462 489 Restructuring costs 24 — Transaction and integration expenses 110 13 Provision for significant litigation ( i ) 65 — (Gain)/loss on disposal of operations (81) 2 Adjusted income before taxes $ 1,953 $ 1,826 Provision for income taxes $ 318 $ 249 Tax effect on certain items listed above (ii) 149 121 Tax effect of the CARES Act (61) — Adjusted income taxes $ 406 $ 370 U.S. GAAP tax rate 23.8 % 18.8 % Adjusted income tax rate 20.8 % 20.3 % ( i ) In the fourth quarter of 2020, the Company agreed in principle to settle both the federal litigation and the Delaware litigat ion associated with the 2016 Willis/Towers Watson merger for aggregate payments of $90 million. The Company subsequently filed definitive settlement agreements with both courts in January 2021. We de scribed this litigation in the Company’s Periodic Report on Form 10 - Q for the quarter ended September 30, 2020, and we will provide an update regarding the settlements in the Company’s 2020 Ann ual Report on Form 10 - K. As a result of the settlements, the Company increased its provision for such litigation (net of insurance and other recoveries) from $15 million to $65 million d uri ng the fourth quarter of 2020. The settlements are contingent upon final approval by the courts in both the federal litigation and the Delaware litigation. The Company agreed to the settlements and the payment of the settlement amounts to eliminate the distraction, burden, expense and uncertainty of further litigation. Further, in reaching the settlements, the parties understood and agreed that t her e is no admission of liability or wrongdoing by the Company or any of the other defendants. (ii) The tax effect was calculated using an effective tax rate for each item. Years Ended December 31, 2020 2019 Cash flows from operating activities $ 1,774 $ 1,081 Less: Additions to fixed assets and software for internal use (223) (246) Free Cash Flow $ 1,551 $ 835
willistowerswatson.com About Willis Towers Watson Willis Towers Watson (NASDAQ: WLTW) is a leading global advisory, broking and solutions company that helps clients around the world turn risk into a path for growth. With roots dating to 1828, Willis Towers Watson has more than 46,000 employees and services clients in more than 140 countries. We design and deliver solutions that manage risk, optimize benefits, cultivate talent, and expand the power of capital to protect and strengthen institutions and individuals. Our unique perspective allows us to see the critical intersections between talent, assets and ideas — the dynamic formula that drives business performance. Together, we unlock potential. Learn more at willistowerswatson.com. © 2021 Willis Towers Watson. All rights reserved. 14