Exhibit 99.2

WT Earning First Qua April 28, 202 W s Release Supplemental Materials rter Financial Results 2 wtwco.com © 2022 WTW. All rights reserved.
WTW Forward - Looking Statements wtwco.com © 2022 WTW. All rights reserved. This document contains ‘forward - looking statements’ within the meaning of Section 27A of the Securities Act of 1933, and Section 21E of the Securities Exchange Act of 1934, which are intended to be covered by the safe harbors created by those laws. These forward - looking statements include information about possible or assumed future results of our operations. All statements, other than statements of historical facts, that address activities, events or developments that we expect or anticipate may occur in the future, including such things as our outlook, the impact of the global pandemic on our business, future capital expenditures, ongoing working capital efforts, future share repurchases, financial results (including our revenue, costs or margins), the impact of changes to tax laws on our financial results, existing and evolving business strategies and acquisitions and dispositions, including the sale of Willis Re to Arthur J. Gallagher & Co. (‘Gallagher’), demand for our services and competitive strengths, goals, the benefits of new initiatives, growth of our business and operations, our ability to successfully manage ongoing leadership, organizational and technology changes, including investments in improving systems and processes, our ability to implement and realize anticipated benefits of any cost - savings initiatives including the multi - year operational Transformation program, and plans and references to future successes, including our future financial and operating results, plans, objectives, expectations and intentions are forward - looking statements. Also, when we use words such as ‘may,’ ‘will,’ ‘would,’ ‘anticipate,’ ‘believe,’ ‘estimate,’ ‘expect,’ ‘intend,’ ‘plan,’ ‘continues,’ ‘seek,’ ‘target,’ ‘focus,’ ‘probably,’ or similar expressions, we are making forward - looking statements. Such statements are based upon the current beliefs and expectations of the Company’s management and are subject to significant risks and uncertainties. Actual results may differ from those set forth in the forward - looking statements. All forward - looking disclosure is speculative by its nature. There are important risks, uncertainties, events and factors that could cause our actual results or performance to differ materially from those in the forward - looking statements contained in this document, including the following: our ability to successfully establish, execute and achieve our global business strategy as it evolves; our ability to fully realize anticipated benefits of our growth strategy; our ability to successfully deploy cost - mitigation measures and achieve longer - term offsets; the risks related to changes in general economic, business and political conditions, including changes in the financial markets and inflation; the risks to our business, financial condition and results of operations that may be materially adversely affected by any negative impact on the global economy and capital markets resulting from the conflict in Ukraine or any other geopolitical tensions and the intended withdrawal from our businesses in Russia; the risks relating to the adverse impacts of the ongoing COVID - 19 pandemic, including supply chain, workforce availability, vaccination rates, new or emerging variants and further social - distancing orders in jurisdictions where we do business, on the demand for our products and services, our cash flows and our business operations, including increased demand on our information technology resources and systems and related risks of cybersecurity breaches or incidents; the risks relating to the sale of Willis Re to Gallagher, including incremental business, operational and regulatory risks created by transitional arrangements and pending transactions; significant competition that we face and the potential for loss of market share and/or profitability; the impact of seasonality and differences in timing of renewals and non - recurring revenue increases from disposals and book - of - business sales; the failure to protect client data or breaches of information systems or insufficient safeguards against cybersecurity breaches or incidents; the risk of increased liability or new legal claims arising from our new and existing products and services, and expectations, intentions and outcomes relating to outstanding litigation; the risk of substantial negative outcomes on existing litigation or investigation matters; changes in the regulatory environment in which we operate, including, among other risks, the impacts of pending competition law and regulatory investigations; various claims, government inquiries or investigations or the potential for regulatory action; our ability to make divestitures or acquisitions and our ability to integrate or manage such acquired businesses; our ability to successfully hedge against fluctuations in foreign currency rates; our ability to integrate direct - to - consumer sales and marketing solutions with our existing offerings and solutions; our ability to comply with complex and evolving regulations related to data privacy and cyber security; our ability to successfully manage ongoing organizational changes, including investments in improving systems and processes; disasters or business continuity problems; the impact of Brexit; our ability to successfully enhance our billing, collection and other working capital efforts, and thereby increase our free cash flow; the impact of the anticipated replacement of the London Interbank Offered Rate (‘LIBOR’); our ability to properly identify and manage conflicts of interest; reputational damage, including from association with third parties; reliance on third - party services; risks relating to changes in our management structures and in senior leadership; the loss of key employees or a large number of employees; doing business internationally, including the impact of exchange rates; compliance with extensive government regulation; the risk of sanctions imposed by governments, or changes to associated sanction regulations (such as sanctions imposed on Russia) and related counter - sanctions; our ability to effectively apply technology, data and analytics changes for internal operations, maintaining industry standards and meeting client preferences; changes and developments in the insurance industry or the U.S. healthcare system, including those related to Medicare and any legislative actions from the current U.S. Congress; the inability to protect the Company’s intellectual property rights, or the potential infringement upon the intellectual property rights of others; fluctuations in our pension assets and liabilities; our capital structure, including indebtedness amounts, the limitations imposed by the covenants in the documents governing such indebtedness and the maintenance of the financial and disclosure controls and procedures of each; our ability to obtain financing on favorable terms or at all; adverse changes in our credit ratings; the impact of recent or potential changes to U.S. or foreign tax laws, including on our effective tax rate, and the enactment of additional, or the revision of existing, state, federal, and/or foreign regulatory and tax laws and regulations, development of case law, other regulations and any policy changes and legislative actions; U.S. federal income tax consequences to U.S. persons owning at least 10% of our shares; changes in accounting principles, estimates or assumptions; risks relating to or arising from environmental, social and governance (‘ESG’) practices; fluctuation in revenue against our relatively fixed or higher than expected expenses; the laws of Ireland being different from the laws of the U.S. and potentially affording less protections to the holders of our securities; and our holding company structure potentially preventing us from being able to receive dividends or other distributions in needed amounts from our subsidiaries. The foregoing list of factors is not exhaustive and new factors may emerge from time to time that could also affect actual performance and results. For more information, please see Part I, Item 1A in our Annual Report on Form 10 - K, and our subsequent filings with the SEC. Copies are available online at http://www.sec.gov or www.wtwco.com. Although we believe that the assumptions underlying our forward - looking statements are reasonable, any of these assumptions, and therefore also the forward - looking statements based on these assumptions, could themselves prove to be inaccurate. Given the significant uncertainties inherent in the forward - looking statements included in this document, our inclusion of this information is not a representation or guarantee by us that our objectives and plans will be achieved. Our forward - looking statements speak only as of the date made, and we will not update these forward - looking statements unless the securities laws require us to do so. With regard to these risks, uncertainties and assumptions, the forward - looking events discussed in this document may not occur, and we caution you against unduly relying on these forward - looking statements.
WTW Non - GAAP Measures wtwco.com © 2022 WTW. All rights reserved. See “WTW Forward - Looking Statements“ above for information about forward - looking statements and cautionary language, including how actual results may differ materially from those in the slide presentation. In order to assist readers of our consolidated financial statements in understanding the core operating results that WTW’s management uses to evaluate the business and for financial planning, we present the following non - GAAP measures: (1) Constant Currency Change, (2) Organic Change, (3) Adjusted Operating Income/Margin, (4) Adjusted EBITDA/Margin, (5) Adjusted Net Income, (6) Adjusted Diluted Earnings Per Share, (7) Adjusted Income Before Taxes, (8) Adjusted Income Taxes/Tax Rate and (9) Free Cash Flow. The Company believes that these measures are relevant and provide useful information widely used by analysts, investors and other interested parties in our industry to provide a baseline for evaluating and comparing our operating performance, and in the case of free cash flow, our liquidity results. Reconciliations of these measures are included in the accompanying appendix of these earning release supplemental materials. The Company does not reconcile its forward - looking non - GAAP financial measures to the corresponding U.S. GAAP measures, due to variability and difficulty in making accurate forecasts and projections and/or certain information not being ascertainable or accessible; and because not all of the information, such as foreign currency impacts necessary for a quantitative reconciliation of these forward - looking non - GAAP financial measures to the most directly comparable U.S. GAAP financial measure, is available to the Company without unreasonable efforts. For the same reasons, the Company is unable to address the probable significance of the unavailable information. The Company provides non - GAAP financial measures that it believes will be achieved, however it cannot accurately predict all of the components of the adjusted calculations and the U.S. GAAP measures may be materially different than the non - GAAP measures.

Strategy and Operating Performance wtwco.com © 2022 WTW. All rights reserved. See “WTW Forward - Looking Statements“ above for information about forward - looking statements and cautionary language, including how actual results may differ materially from those in the slide presentation.
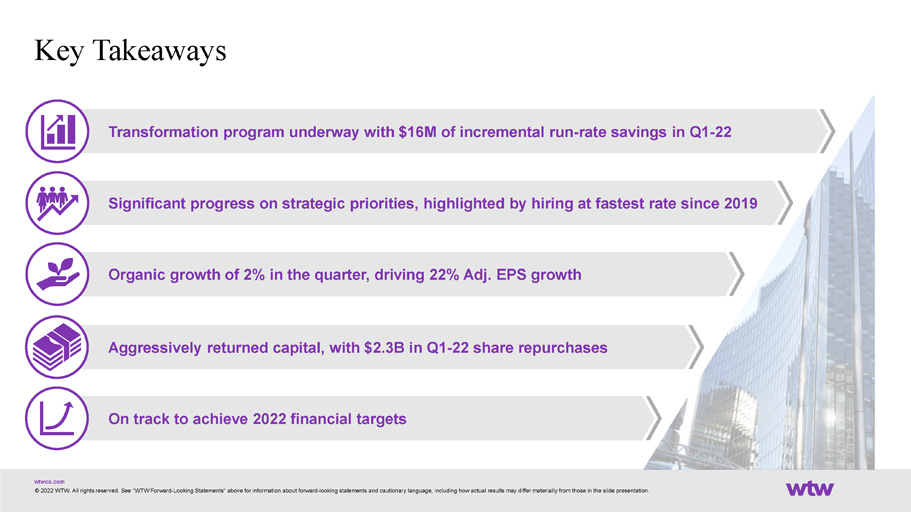
On track to achieve 2022 financial targets Aggressively returned capital, with $2.3B in Q1 - 22 share repurchases Organic growth of 2% in the quarter, driving 22% Adj. EPS growth Significant progress on strategic priorities, highlighted by hiring at fastest rate since 2019 Key Takeaways Transformation program underway with $16M of incremental run - rate savings in Q1 - 22 wtwco.com © 2022 WTW. All rights reserved. See “WTW Forward - Looking Statements“ above for information about forward - looking statements and cautionary language, including how actual results may differ materially from those in the slide presentation.
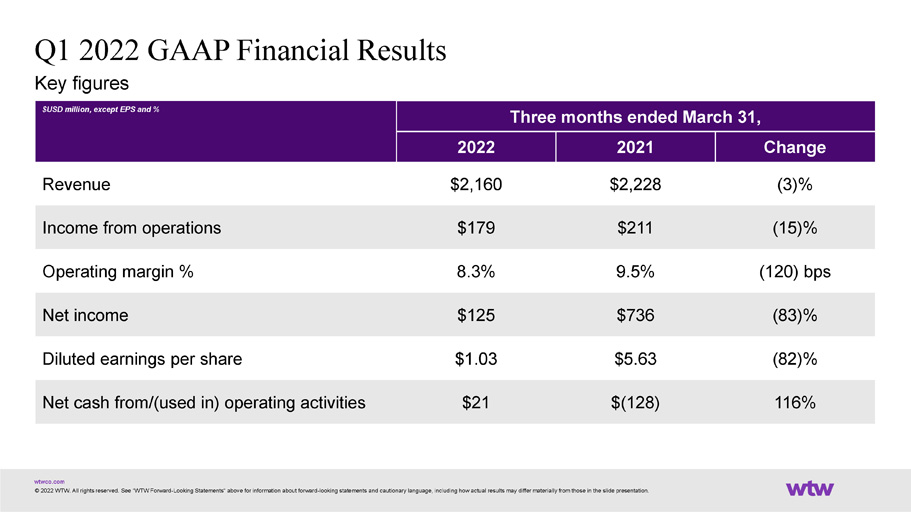
Q1 2022 GAAP Financial Results Key figures wtwco.com © 2022 WTW. All rights reserved. See “WTW Forward - Looking Statements“ above for information about forward - looking statements and cautionary language, including how actual results may differ materially from those in the slide presentation. $USD million, except EPS and % Three months ended March 31, 2022 2021 Change Revenue $2,160 $2,228 (3)% Income from operations $179 $211 (15)% Operating margin % 8.3% 9.5% (120) bps Net income $125 $736 (83)% Diluted earnings per share $1.03 $5.63 (82)% Net cash from/(used in) operating activities $21 $(128) 116%
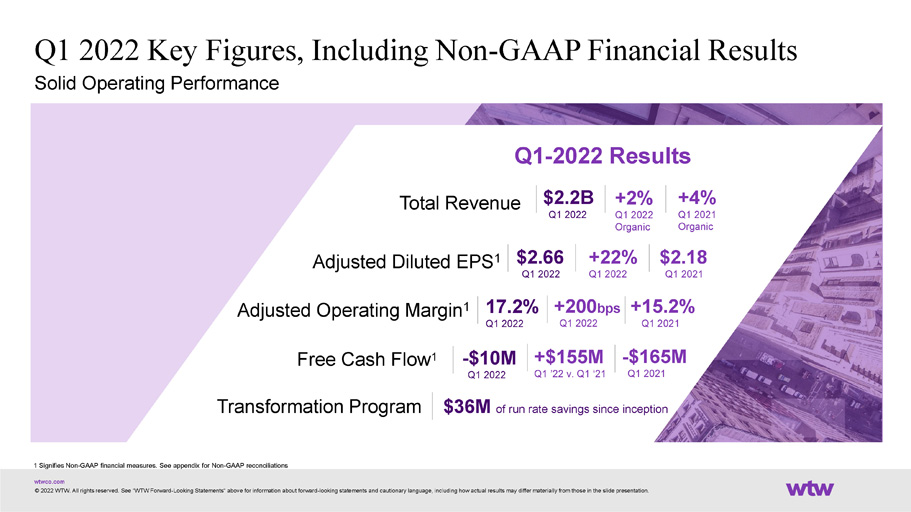
Q1 2022 Key Figures, Including Non - GAAP Financial Results Solid Operating Performance Total Revenue +2% Q1 2022 Organic wtwco.com © 2022 WTW. All rights reserved. See “WTW Forward - Looking Statements“ above for information about forward - looking statements and cautionary language, including how actual results may differ materially from those in the slide presentation. +4% Q1 2021 Organic Adjusted Diluted EPS 1 Q1 - 2022 Results Adjusted Operating Margin 1 Transformation Program $36M of run rate savings since inception Free Cash Flow 1 $2.2B Q1 2022 $2.66 Q1 2022 $2.18 Q1 2021 - $10M Q1 2022 +22% Q1 2022 17.2% Q1 2022 +200 bps Q1 2022 +15.2% Q1 2021 +$155M Q1 ’22 v. Q1 ‘21 - $165M Q1 2021 1 Signifies Non - GAAP financial measures. See appendix for Non - GAAP reconciliations
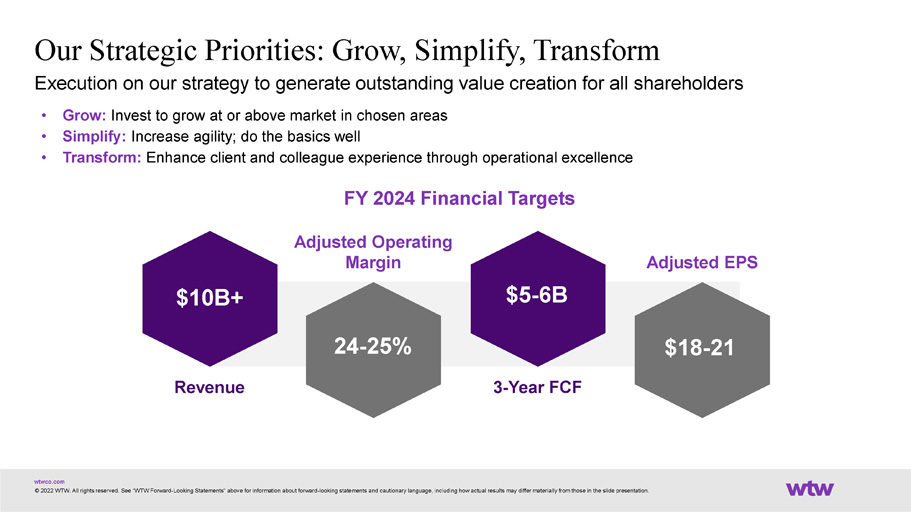
Execution on our strategy to generate outstanding value creation for all shareholders • Grow: Invest to grow at or above market in chosen areas • Simplify: Increase agility; do the basics well • Transform: Enhance client and colleague experience through operational excellence FY 2024 Financial Targets Our Strategic Priorities: Grow, Simplify, Transform Adjusted Operating Margin Adjusted EPS $10B+ Revenue 3 - Year FCF wtwco.com © 2022 WTW. All rights reserved. See “WTW Forward - Looking Statements“ above for information about forward - looking statements and cautionary language, including how actual results may differ materially from those in the slide presentation. 24 - 25% $5 - 6B $18 - 21
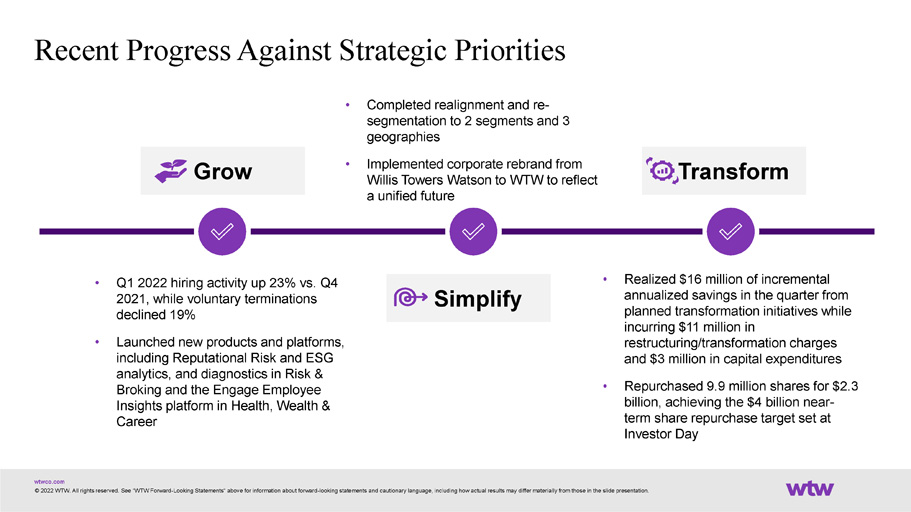
Recent Progress Against Strategic Priorities Grow Simplify Transform • Q1 2022 hiring activity up 23% vs. Q4 2021, while voluntary terminations declined 19% wtwco.com © 2022 WTW. All rights reserved. See “WTW Forward - Looking Statements“ above for information about forward - looking statements and cautionary language, including how actual results may differ materially from those in the slide presentation. • Launched new products and platforms, including Reputational Risk and ESG analytics, and diagnostics in Risk & Broking and the Engage Employee Insights platform in Health, Wealth & Career • Completed realignment and re - segmentation to 2 segments and 3 geographies • Implemented corporate rebrand from Willis Towers Watson to WTW to reflect a unified future • Realized $16 million of incremental annualized savings in the quarter from planned transformation initiatives while incurring $11 million in restructuring/transformation charges and $3 million in capital expenditures • Repurchased 9.9 million shares for $2.3 billion, achieving the $4 billion near - term share repurchase target set at Investor Day
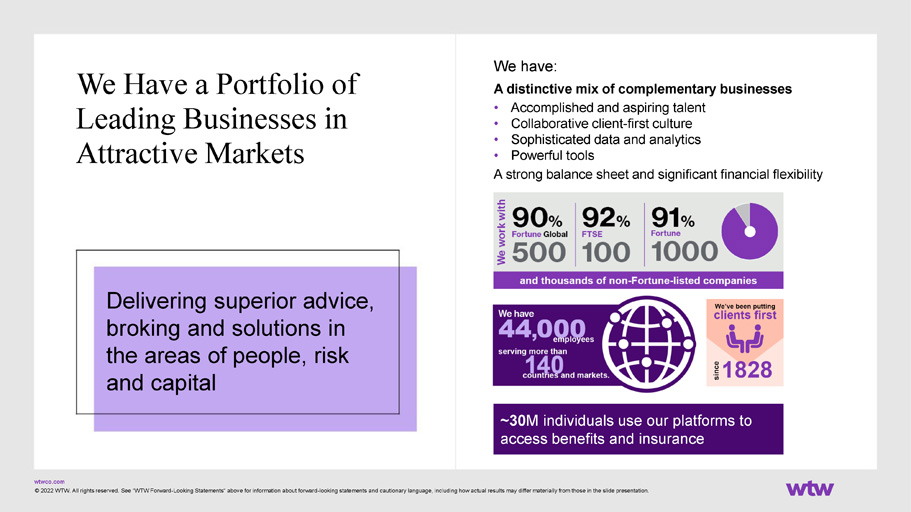
Delivering superior advice, broking and solutions in the areas of people, risk and capital We Have a Portfolio of Leading Businesses in Attractive Markets We have: A distinctive mix of complementary businesses • Accomplished and aspiring talent • Collaborative client - first culture • Sophisticated data and analytics • Powerful tools A strong balance sheet and significant financial flexibility ~30 M individuals use our platforms to access benefits and insurance wtwco.com © 2022 WTW. All rights reserved. See “WTW Forward - Looking Statements“ above for information about forward - looking statements and cautionary language, including how actual results may differ materially from those in the slide presentation.
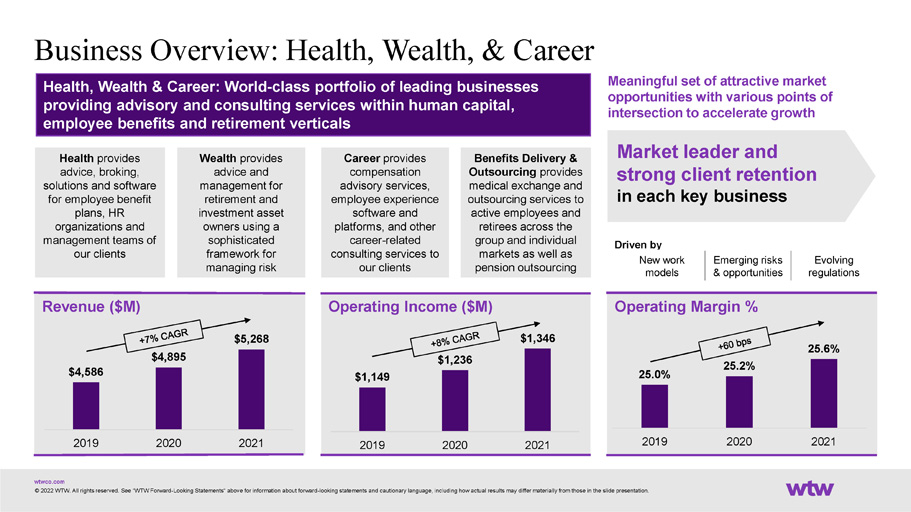
$4,586 $4,895 $5,268 2019 2020 2021 $1,149 $1,236 $1,346 2019 2020 2021 25.0% 25.2% 25.6% 2019 2020 2021 Business Overview: Health, Wealth, & Career Revenue ($M) Operating Income ($M) Operating Margin % Health, Wealth & Career: World - class portfolio of leading businesses providing advisory and consulting services within human capital, employee benefits and retirement verticals Benefits Delivery & Outsourcing provides medical exchange and outsourcing services to active employees and retirees across the group and individual markets as well as pension outsourcing Health provides advice, broking, solutions and software for employee benefit plans, HR organizations and management teams of our clients Wealth provides advice and management for retirement and investment asset owners using a sophisticated framework for managing risk Meaningful set of attractive market opportunities with various points of intersection to accelerate growth Market leader and strong client retention in each key business wtwco.com © 2022 WTW. All rights reserved. See “WTW Forward - Looking Statements“ above for information about forward - looking statements and cautionary language, including how actual results may differ materially from those in the slide presentation. Driven by New work models Emerging risks & opportunities Evolving regulations Career provides compensation advisory services, employee experience software and platforms, and other career - related consulting services to our clients

$3,282 $3,316 $3,564 2019 2020 2021 $650 $714 $835 2019 2020 2021 19.8% 21.6% 23.4% 2019 2020 2021 Business Overview: Risk & Broking Risk & Broking: Risk advisory and solutions business delivering innovative, integrated solutions tailored to client needs and underpinned by cutting edge data and analytics, technology and experienced risk thinkers Insurance Consulting and Technology provides advice and technology solutions to the insurance industry to help clients measure and manage risk and capita and improve performance Corporate Risk & Broking provides a broad range of risk advice insurance brokerage and consulting services to clients worldwide ranging from small businesses to multinational corporations Strongly positioned in a large, attractive and growing market … Top 3 Property & casualty broking wtwco.com © 2022 WTW. All rights reserved. See “WTW Forward - Looking Statements“ above for information about forward - looking statements and cautionary language, including how actual results may differ materially from those in the slide presentation. ~$ 32 B Driven by Ongoing hard market Rebounding exposures Changing nature of risk broking revenue globally Revenue ($M) Operating Income ($M) Operating Margin %
Value Creation Framework wtwco.com © 2022 WTW. All rights reserved. See “WTW Forward - Looking Statements“ above for information about forward - looking statements and cautionary language, including how actual results may differ materially from those in the slide presentation. 1. Seek profitable growth through innovation in attractive markets 2. Target superior shareholder returns through buybacks and prudent investments 3. Defensive business model with historically lower volatility than other financial services subsectors 4. Acceleration of operational transformation; resulting in meaningful improved margins 5. Experienced, diverse management and global leadership team focused on achieving targets
Financial Review wtwco.com © 2022 WTW. All rights reserved. See “WTW Forward - Looking Statements“ above for information about forward - looking statements and cautionary language, including how actual results may differ materially from those in the slide presentation.
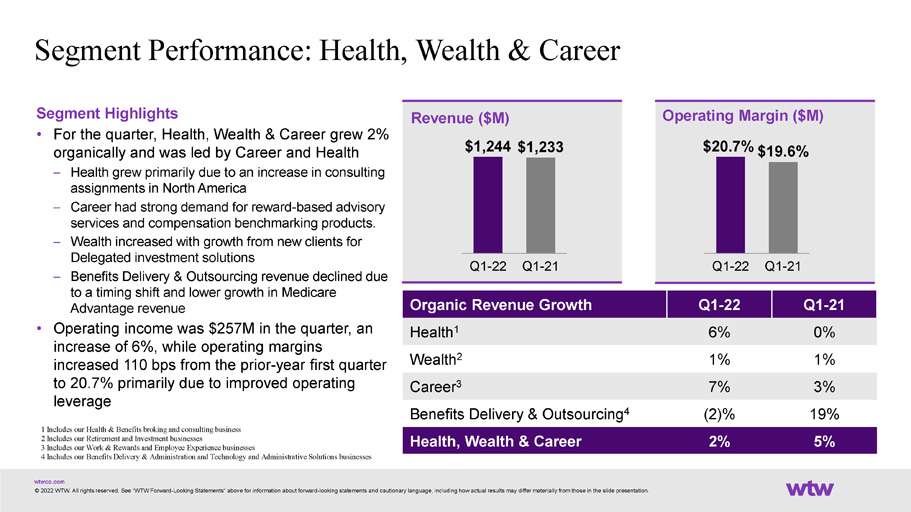
Segment Highlights • For the quarter, Health, Wealth & Career grew 2% organically and was led by Career and Health – Health grew primarily due to an increase in consulting assignments in North America – Career had strong demand for reward - based advisory services and compensation benchmarking products. – Wealth increased with growth from new clients for Delegated investment solutions – Benefits Delivery & Outsourcing revenue declined due to a timing shift and lower growth in Medicare Advantage revenue • Operating income was $257M in the quarter, an increase of 6%, while operating margins increased 110 bps from the prior - year first quarter to 20.7% primarily due to improved operating leverage Segment Performance: Health, Wealth & Career Revenue ($M) $1,244 $1,233 Q1 - 22 Q1 - 21 Operating Margin ($M) $20.7% $19.6% Q1 - 22 Q1 - 21 Organic Revenue Growth Q1 - 22 Q1 - 21 Health 1 6% 0% Wealth 2 1% 1% Career 3 7% 3% Benefits Delivery & Outsourcing 4 (2)% 19% Health, Wealth & Career 2% 5% 1 Includes our Health & Benefits broking and consulting business 2 Includes our Retirement and Investment businesses 3 Includes our Work & Rewards and Employee Experience businesses 4 Includes our Benefits Delivery & Administration and Technology and Administrative Solutions businesses wtwco.com © 2022 WTW. All rights reserved. See “WTW Forward - Looking Statements“ above for information about forward - looking statements and cautionary language, including how actual results may differ materially from those in the slide presentation.
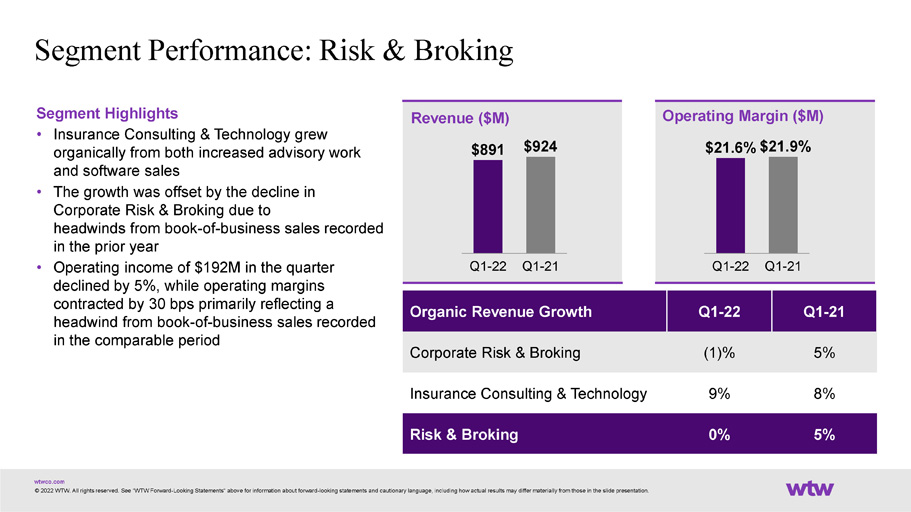
Segment Highlights • Insurance Consulting & Technology grew organically from both increased advisory work and software sales • The growth was offset by the decline in Corporate Risk & Broking due to headwinds from book - of - business sales recorded in the prior year • Operating income of $192M in the quarter declined by 5%, while operating margins contracted by 30 bps primarily reflecting a headwind from book - of - business sales recorded in the comparable period Segment Performance: Risk & Broking Q1 - 22 Q1 - 21 $891 $924 Revenue ($M) Operating Margin ($M) $21.6% $21.9% Q1 - 22 Q1 - 21 Organic Revenue Growth Q1 - 22 Q1 - 21 Corporate Risk & Broking (1)% 5% Insurance Consulting & Technology 9% 8% Risk & Broking 0% 5% wtwco.com © 2022 WTW. All rights reserved. See “WTW Forward - Looking Statements“ above for information about forward - looking statements and cautionary language, including how actual results may differ materially from those in the slide presentation.
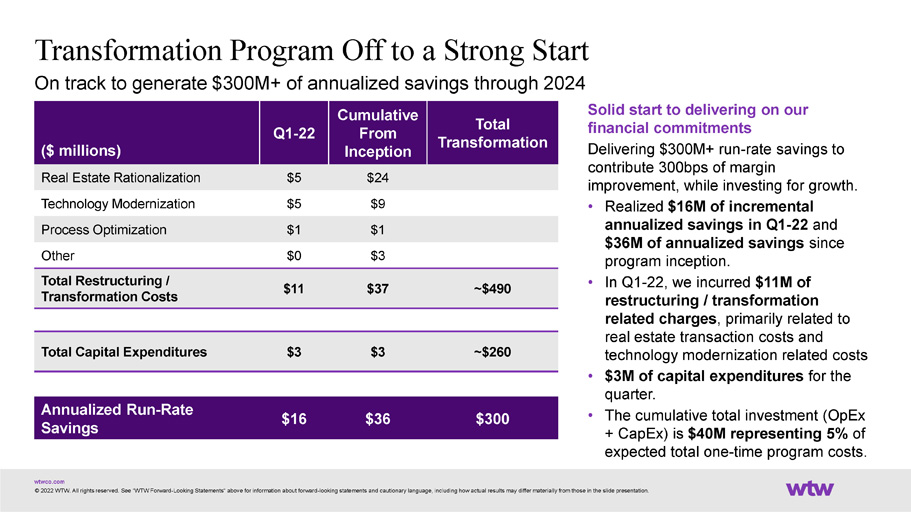
Transformation Program Off to a Strong Start On track to generate $300M+ of annualized savings through 2024 wtwco.com © 2022 WTW. All rights reserved. See “WTW Forward - Looking Statements“ above for information about forward - looking statements and cautionary language, including how actual results may differ materially from those in the slide presentation. ($ millions) Q1 - 22 Cumulative From Inception Total Transformation Real Estate Rationalization $5 $24 Technology Modernization $5 $9 Process Optimization $1 $1 Other $0 $3 Total Restructuring / Transformation Costs $11 $37 ~$490 Total Capital Expenditures $3 $3 ~$260 Annualized Run - Rate Savings $16 $36 $300 Solid start to delivering on our financial commitments Delivering $300M+ run - rate savings to contribute 300bps of margin improvement, while investing for growth. • Realized $16M of incremental annualized savings in Q1 - 22 and $36M of annualized savings since program inception. • In Q1 - 22, we incurred $11M of restructuring / transformation related charges , primarily related to real estate transaction costs and technology modernization related costs • $3M of capital expenditures for the quarter. • The cumulative total investment (OpEx + CapEx) is $40M representing 5% of expected total one - time program costs.

Maintaining a Flexible Balance Sheet wtwco.com © 2022 WTW. All rights reserved. See “WTW Forward - Looking Statements“ above for information about forward - looking statements and cautionary language, including how actual results may differ materially from those in the slide presentation. 1 Total Debt equals sum of current debt and long - term debt as shown on the Consolidated Balance Sheets. 2 Signifies Non - GAAP financial measure. See appendix for Non - GAAP reconciliations. Dec 31, 2021 Mar 31, 2022 ($ millions) Cash and Cash Equivalents 4,486 2,198 Total Debt 1 4,587 4,574 Total Equity 13,308 11,075 Debt to Adj. EBITDA 2 Trailing 12 - month 1.9x 1.9x Reinforcing our business fundamentals; safeguarding WTW’s financial strengths Disciplined capital management strategy Provides WTW with the financial flexibility to reinvest in our businesses, capitalize on market growth opportunities and support significant value creation for shareholders • Our capital structure provides a solid foundation of business strength and reinforces our ability to capture long - term growth • History of effectively managing our leverage with a commitment to maintaining our investment grade credit rating • Committed to a disciplined approach to managing outstanding debt and successfully reduced our leverage profile
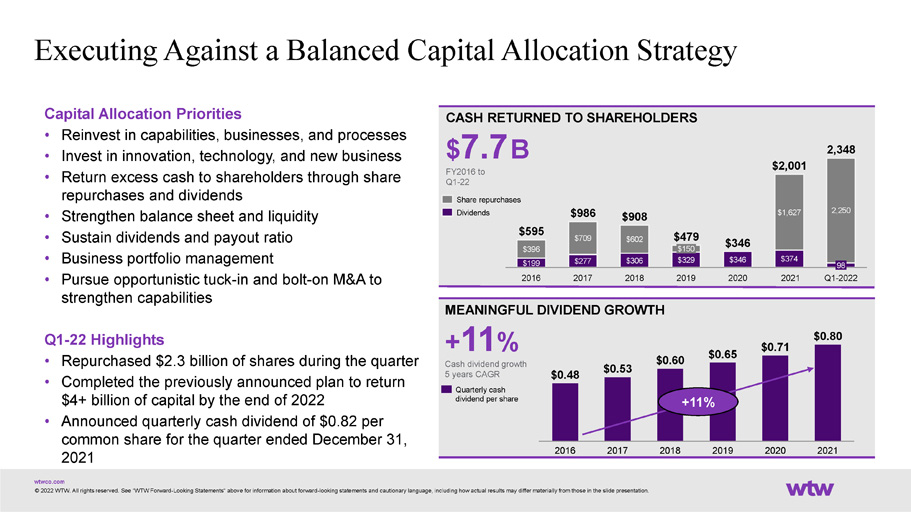
Executing Against a Balanced Capital Allocation Strategy CASH RETURNED TO SHAREHOLDERS $ 7.7 B FY2016 to Q1 - 22 2,250 2017 $602 $908 $277 $709 $306 2018 2019 2020 $1,627 $374 2021 98 Q1 - 2022 $595 $396 $199 2016 $986 $479 $150 $329 $346 $346 $2,001 2,348 Share repurchases Dividends 2016 2021 2020 2017 $0.53 2018 $0.60 2019 $0.48 $0.65 $0.71 $0.80 MEANINGFUL DIVIDEND GROWTH + 11 % Cash dividend growth 5 years CAGR Quarterly cash dividend per share +11% wtwco.com © 2022 WTW. All rights reserved. See “WTW Forward - Looking Statements“ above for information about forward - looking statements and cautionary language, including how actual results may differ materially from those in the slide presentation. Capital Allocation Priorities • Reinvest in capabilities, businesses, and processes • Invest in innovation, technology, and new business • Return excess cash to shareholders through share repurchases and dividends • Strengthen balance sheet and liquidity • Sustain dividends and payout ratio • Business portfolio management • Pursue opportunistic tuck - in and bolt - on M&A to strengthen capabilities Q1 - 22 Highlights • Repurchased $2.3 billion of shares during the quarter • Completed the previously announced plan to return $4+ billion of capital by the end of 2022 • Announced quarterly cash dividend of $0.82 per common share for the quarter ended December 31, 2021
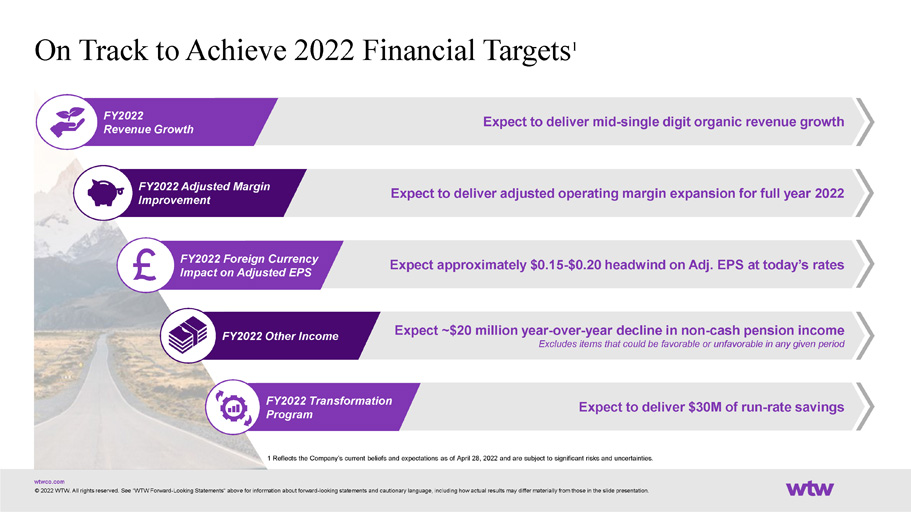
On Track to Achieve 2022 Financial Targets 1 Expect to deliver adjusted operating margin expansion for full year 2022 FY2022 Adjusted Margin Improvement Expect approximately $0.15 - $0.20 headwind on Adj. EPS at today’s rates FY2022 Foreign Currency Impact on Adjusted EPS Expect ~$20 million year - over - year decline in non - cash pension income Excludes items that could be favorable or unfavorable in any given period FY2022 Other Income Expect to deliver $30M of run - rate savings FY2022 Transformation Program Expect to deliver mid - single digit organic revenue growth FY2022 Revenue Growth 1 Reflects the Company’s current beliefs and expectations as of April 28, 2022 and are subject to significant risks and uncertainties. wtwco.com © 2022 WTW. All rights reserved. See “WTW Forward - Looking Statements“ above for information about forward - looking statements and cautionary language, including how actual results may differ materially from those in the slide presentation.
Appendix: Reconciliation of Non - GAAP Measures wtwco.com © 2022 WTW. All rights reserved. See “WTW Forward - Looking Statements“ above for information about forward - looking statements and cautionary language, including how actual results may differ materially from those in the slide presentation.

Appendix 1: Constant Currency and Organic Revenue Change As reported, USD millions except % Components of Revenue Change (i) Less: Less: Three Months Ended March 31, As Reported Currency Constant Currency Acquisitions/ Organic 2022 2021 % Change Impact Change Divestitures Change Health, Wealth & Career $ 1,244 $ 1,233 1% (2)% 3% 0% 2% Risk & Broking 891 924 (4)% (4)% 0% 0% 0% Segment Revenue 2,135 2,157 (1)% 2% 1% 0% 1% Divested businesses and other 25 71 Revenue $ 2,160 $ 2,228 (3)% (2)% (1)% (2)% 2% (i) Components of revenue change may not add due to rounding wtwco.com © 2022 WTW. All rights reserved. See “WTW Forward - Looking Statements“ above for information about forward - looking statements and cautionary language, including how actual results may differ materially from those in the slide presentation.
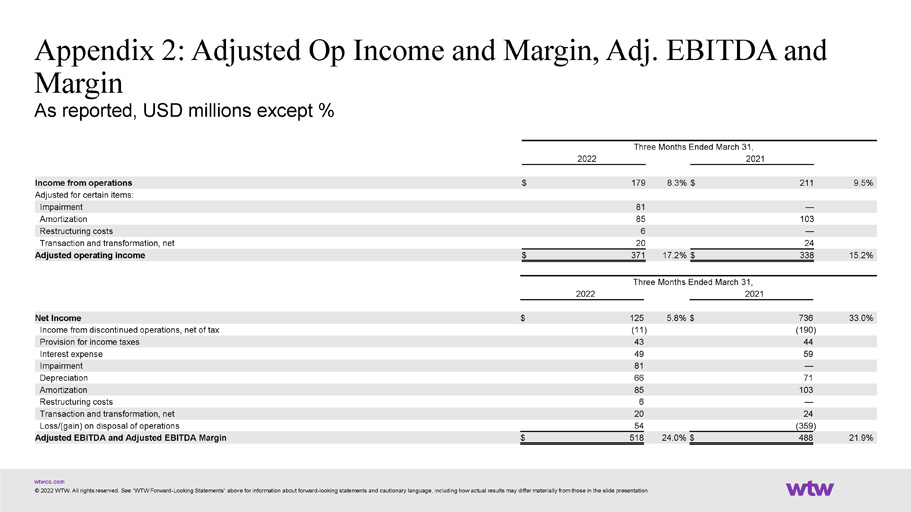
Appendix 2: Adjusted Op Income and Margin, Adj. EBITDA and Margin As reported, USD millions except % Three Months Ended March 31, 2022 2021 Income from operations $ 179 8.3 % $ 211 9.5 % Adjusted for certain items: Impairment 81 — Amortization 85 103 Restructuring costs 6 — Transaction and transformation, net 20 24 Adjusted operating income $ 371 17.2 % $ 338 15.2 % Three Months Ended March 31, 2022 2021 Net Income $ 125 5.8 % $ 736 33.0 % Income from discontinued operations, net of tax (11 ) (190 ) Provision for income taxes 43 44 Interest expense 49 59 Impairment 81 — Depreciation 66 71 Amortization 85 103 Restructuring costs 6 — Transaction and transformation, net 20 24 Loss/(gain) on disposal of operations 54 (359 ) Adjusted EBITDA and Adjusted EBITDA Margin $ 518 24.0 % $ 488 21.9 % wtwco.com © 2022 WTW. All rights reserved. See “WTW Forward - Looking Statements“ above for information about forward - looking statements and cautionary language, including how actual results may differ materially from those in the slide presentation.
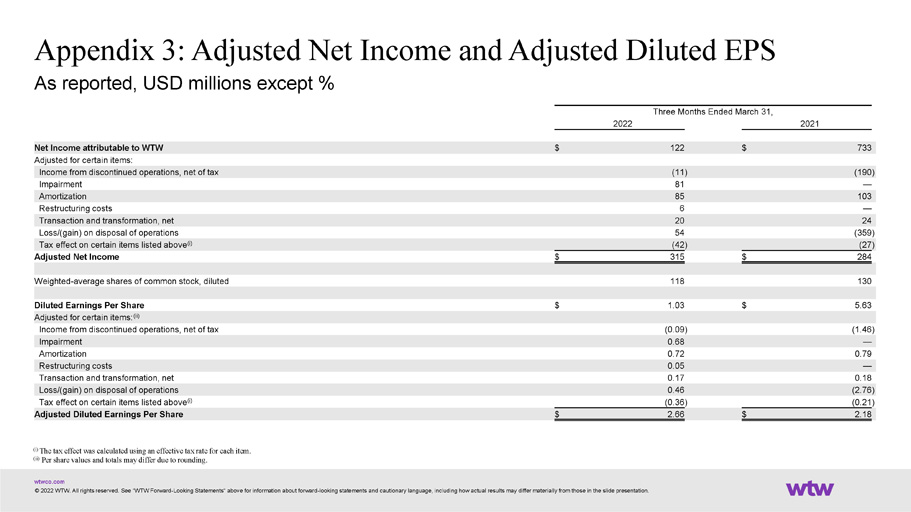
Appendix 3: Adjusted Net Income and Adjusted Diluted EPS As reported, USD millions except % ) wtwco.com © 2022 WTW. All rights reserved. See “WTW Forward - Looking Statements“ above for information about forward - looking statements and cautionary language, including how actual results may differ materially from those in the slide presentation. ) ) ) ) ) Three Months Ended March 31, 2022 2021 Net Income attributable to WTW $ 122 $ 733 Adjusted for certain items: Income from discontinued operations, net of tax (11 ) (190 Impairment 81 — Amortization 85 103 Restructuring costs 6 — Transaction and transformation, net 20 24 Loss/(gain) on disposal of operations 54 (359 Tax effect on certain items listed above (i) (42 ) (27 Adjusted Net Income $ 315 $ 284 Weighted - average shares of common stock, diluted 118 130 Diluted Earnings Per Share $ 1.03 $ 5.63 Adjusted for certain items: (ii) Income from discontinued operations, net of tax (0.09 ) (1.46 Impairment 0.68 — Amortization 0.72 0.79 Restructuring costs 0.05 — Transaction and transformation, net 0.17 0.18 Loss/(gain) on disposal of operations 0.46 (2.76 Tax effect on certain items listed above (i) (0.36 ) (0.21 Adjusted Diluted Earnings Per Share $ 2.66 $ 2.18 (i) The tax effect was calculated using an effective tax rate for each item. (ii) Per share values and totals may differ due to rounding.
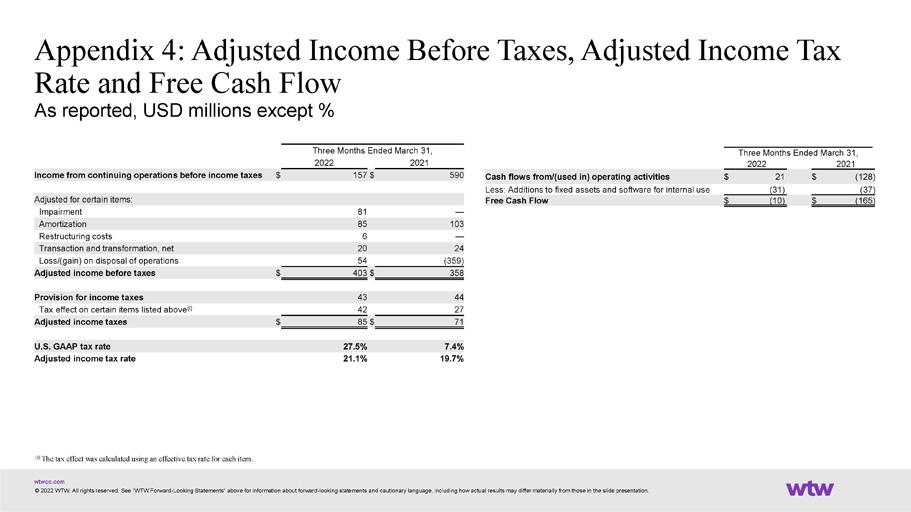
Appendix 4: Adjusted Income Before Taxes, Adjusted Income Tax Rate and Free Cash Flow As reported, USD millions except % Three Months Ended March 31, 2022 2021 Income from continuing operations before income taxes $ 157 $ 590 Adjusted for certain items: Impairment 81 — Amortization 85 103 Restructuring costs 6 — Transaction and transformation, net 20 24 Loss/(gain) on disposal of operations 54 (359) Adjusted income before taxes $ 403 $ 358 Provision for income taxes 43 44 Tax effect on certain items listed above (i) 42 27 Adjusted income taxes $ 85 $ 71 U.S. GAAP tax rate 27.5% 7.4% Adjusted income tax rate 21.1% 19.7% ) ) wtwco.com © 2022 WTW. All rights reserved. See “WTW Forward - Looking Statements“ above for information about forward - looking statements and cautionary language, including how actual results may differ materially from those in the slide presentation. Three Months Ended March 31, 2022 2021 Cash flows from/(used in) operating activities $ 21 $ (128 Less: Additions to fixed assets and software for internal use (31) (37 Free Cash Flow $ (10) $ (165) (i) The tax effect was calculated using an effective tax rate for each item.
About WTW wtwco.com © 2022 WTW. All rights reserved. See “WTW Forward - Looking Statements“ above for information about forward - looking statements and cautionary language, including how actual results may differ materially from those in the slide presentation. At WTW (NASDAQ: WTW), we provide data - driven, insight - led solutions in the areas of people, risk and capital. Leveraging the global view and local expertise of our colleagues serving 140 countries and markets, we help organizations sharpen their strategy, enhance organizational resilience, motivate their workforce and maximize performance. Working shoulder to shoulder with our clients, we uncover opportunities for sustainable success — and provide perspective that moves you. Learn more at www.wtwco.com .