Exhibit 99.2

Willis Group Holdings
SECOND QUARTER 2013 RESULTS
July, 2013
Important disclosures regarding forward-looking statements
This presentation contains certain “forward-looking statements” within the meaning of Section 27A of the Securities Act of 1933, and Section 21E of the Securities Exchange Act of 1934, which are intended to be covered by the safe harbors created by those laws. These forward-looking statements include information about possible or assumed future results of our operations.
All statements, other than statements of historical facts, included in this document that address activities, events or developments that we expect or anticipate may occur in the future, including such things as our outlook, potential cost savings and accelerated adjusted operating margin and adjusted earnings per share growth, future capital expenditures, growth in commissions and fees, business strategies, competitive strengths, goals, the benefits of new initiatives, growth of our business and operations, plans, and references to future successes are forward-looking statements. Also, when we use the words such as ‘anticipate’, ‘believe’, ‘estimate’, ‘expect’, ‘intend’, ‘plan’, ‘probably’, or similar expressions, we are making forward-looking statements.
There are important uncertainties, events and factors that could cause our actual results or performance to differ materially from those in the forward-looking statements contained in this document, including the following: the impact of any regional, national or global political, economic, business, competitive, market, environmental or regulatory conditions on our global business operations; the impact of current financial market conditions on our results of operations and financial condition, including as a result of those associated with the current Eurozone crisis, any insolvencies of or other difficulties experienced by our clients, insurance companies or financial institutions; our ability to implement and realize anticipated benefits of any expense reduction initiative, charge or any revenue generating initiatives; volatility or declines in insurance markets and premiums on which our commissions are based, but which we do not control; our ability to continue to manage our significant indebtedness; our ability to compete effectively in our industry, including the impact of our refusal to accept contingent commissions from carriers in the non-Human Capital areas of our retail brokerage business; material changes in commercial property and casualty markets generally or the availability of insurance products or changes in premiums resulting from a catastrophic event, such as a hurricane; our ability to retain key employees and clients and attract new business; the timing or ability to carry out share repurchases and redemptions; the timing or ability to carry out refinancing or take other steps to manage our capital and the limitations in our long term debt agreements that may restrict our ability to take these actions; fluctuations in our earnings as a result of potential changes to our valuation allowance(s) on our deferred tax assets; any fluctuations in exchange and interest rates that could affect expenses and revenue; the potential costs and difficulties in complying with a wide variety of foreign laws and regulations and any related changes, given the global scope of our operations; rating agency actions that could inhibit our ability to borrow funds or the pricing thereof; a significant decline in the value of investments that fund our pension plans or changes in our pension plan liabilities or funding obligations; our ability to achieve the expected strategic benefits of transactions, including any growth from associates; further impairment of the goodwill of one of our reporting units, in which case we may be required to record additional significant charges to earnings; our ability to receive dividends or other distributions in needed amounts from our subsidiaries; changes in the tax or accounting treatment of our operations and fluctuations in our tax rate; any potential impact from the US healthcare reform legislation; our involvements in and the results of any regulatory investigations, legal proceedings and other contingencies; underwriting, advisory or reputational risks associated with non-core operations as well as the potential significant impact our non-core operations (including the Willis Capital Markets & Advisory operations) can have on our financial results; our exposure to potential liabilities arising from errors and omissions and other potential claims against us; and the interruption or loss of our information processing systems or failure to maintain secure information systems.
The foregoing list of factors is not exhaustive and new factors may emerge from time to time that could also affect actual performance and results. For additional information see also Part I, Item 1A “Risk Factors” included in Willis’ Form 10-K for the year ended December 31, 2012, and our subsequent filings with the Securities and Exchange Commission. Copies are available online at http://www.sec.gov or on request from the Company.
Although we believe that the assumptions underlying our forward-looking statements are reasonable, any of these assumptions, and therefore also the forward-looking statements based on these assumptions, could themselves prove to be inaccurate. In light of the significant uncertainties inherent in the forward-looking statements included in this presentation, our inclusion of this information is not a representation or guarantee by us that our objectives and plans will be achieved. Our forward-looking statements speak only as of the date made and we will not update these forward-looking statements unless the securities laws require us to do so. In light of these risks, uncertainties and assumptions, the forward-looking events discussed in this presentation may not occur, and we caution you against unduly relying on these forward-looking statements.
1
Important disclosures regarding non-GAAP measures
This presentation contains references to “non-GAAP financial measures” as defined in Regulation G of SEC rules. We present these measures because we believe they are of interest to the investment community and they provide additional meaningful methods of evaluating certain aspects of the Company’s operating performance from period to period on a basis that may not be otherwise apparent on a generally accepted accounting principles (GAAP) basis. These financial measures should be viewed in addition to, not in lieu of, the Company’s condensed consolidated income statements and balance sheet as of the relevant date. Consistent with Regulation G, a description of such information is provided below and a reconciliation of certain of such items to GAAP information can be found in our periodic filings with the SEC. Our method of calculating these non-GAAP financial measures may differ from other companies and therefore comparability may be limited.
2
Summary financial results
Q2 2013 Q2 2012
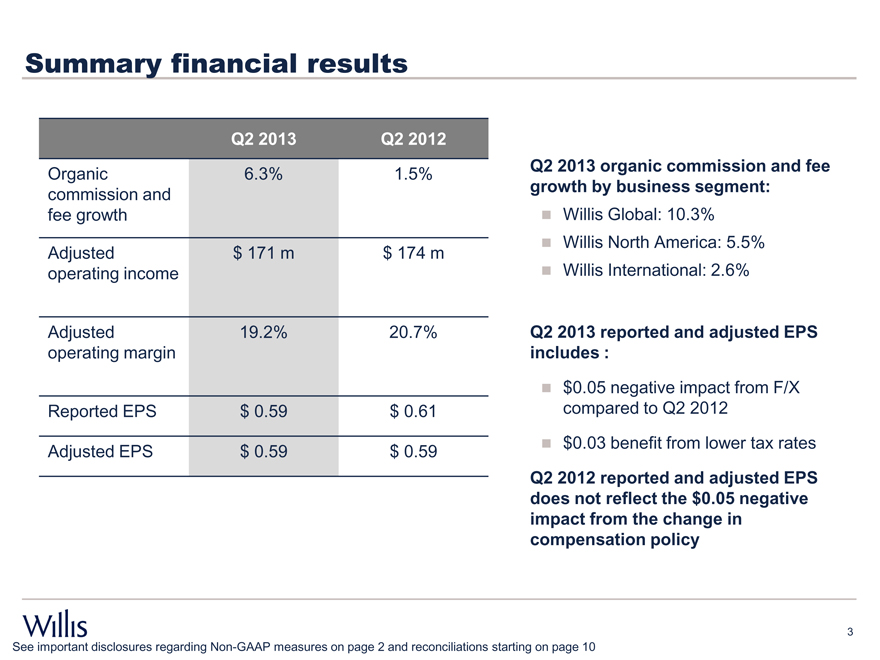
Organic 6.3% 1.5%
commission and
fee growth
Adjusted $ 171 m $ 174 m
operating income
Adjusted 19.2% 20.7%
operating margin
Reported EPS $ 0.59 $ 0.61
Adjusted EPS $ 0.59 $ 0.59
Q2 2013 organic commission and fee growth by business segment:
Willis Global: 10.3%
Willis North America: 5.5%
Willis International: 2.6%
Q2 2013 reported and adjusted EPS includes :
$0.05 negative impact from F/X compared to Q2 2012
$0.03 benefit from lower tax rates
Q2 2012 reported and adjusted EPS does not reflect the $0.05 negative impact from the change in compensation policy
3
See important disclosures regarding Non-GAAP measures on page 2 and reconciliations starting on page 10
Total expenses
Q2 Q2
$ millions 2013 2012
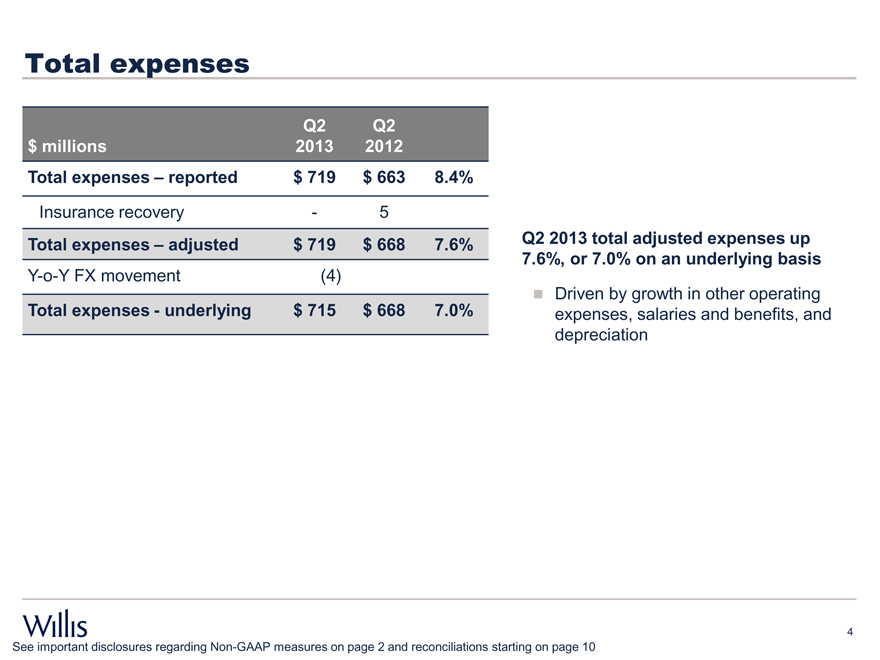
Total expenses – reported $ 719 $ 663 8.4%
Insurance recovery — 5
Total expenses – adjusted $ 719 $ 668 7.6% Q2 2013 total adjusted expenses up
7.6%, or 7.0% on an underlying basis
Y-o-Y FX movement (4)
??Driven by growth in other operating
Total expenses—underlying $ 715 $ 668 7.0% expenses, salaries and benefits, and
depreciation
4
See important disclosures regarding Non-GAAP measures on page 2 and reconciliations starting on page 10
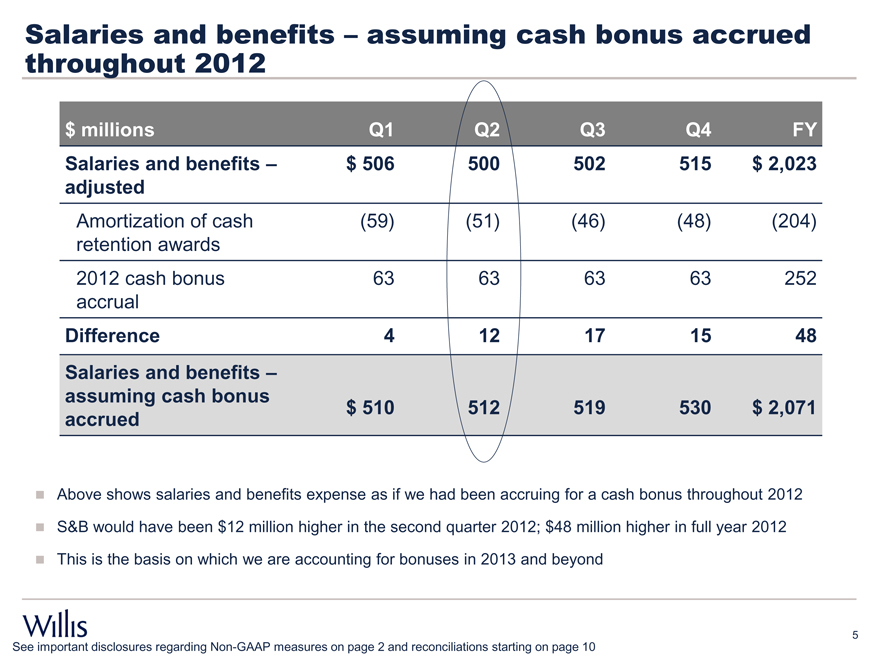
Salaries throughout and 2012 benefits – assuming cash bonus accrued
$ millions Q1 Q2 Q3 Q4 FY
Salaries and benefits – $ 506 500 502 515 $ 2,023
adjusted
Amortization of cash (59) (51) (46) (48) (204)
retention awards
2012 cash bonus 63 63 63 63 252
accrual
Difference 4 12 17 15 48
Salaries and benefits –
assuming cash bonus $ 510 512 519 530 $ 2,071
accrued
Above shows salaries and benefits expense as if we had been accruing for a cash bonus throughout 2012
S&B would have been $12 million higher in the second quarter 2012; $48 million higher in full year 2012
This is the basis on which we are accounting for bonuses in 2013 and beyond
5
See important disclosures regarding Non-GAAP measures on page 2 and reconciliations starting on page 10
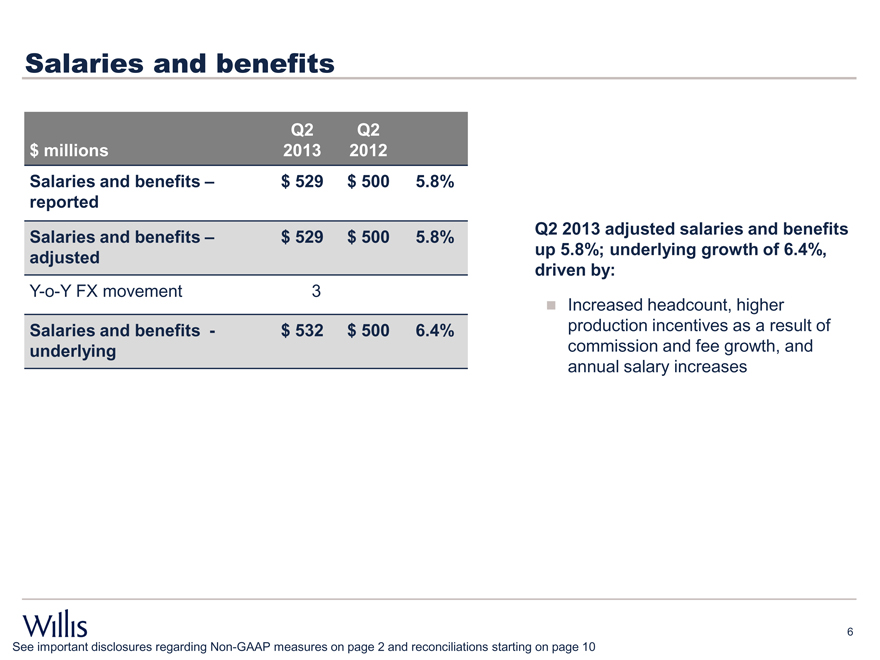
Salaries and benefits
Q2 Q2
$ millions 2013 2012
Salaries and benefits – $ 529 $ 500 5.8%
reported
Salaries and benefits – $ 529 $ 500 5.8%
adjusted
Y-o-Y FX movement 3
Salaries and benefits— $ 532 $ 500 6.4%
underlying
Q2 2013 adjusted salaries and benefits up 5.8%; underlying growth of 6.4%, driven by:
Increased headcount, higher production incentives as a result of commission and fee growth, and annual salary increases
6
See important disclosures regarding Non-GAAP measures on page 2 and reconciliations starting on page 10
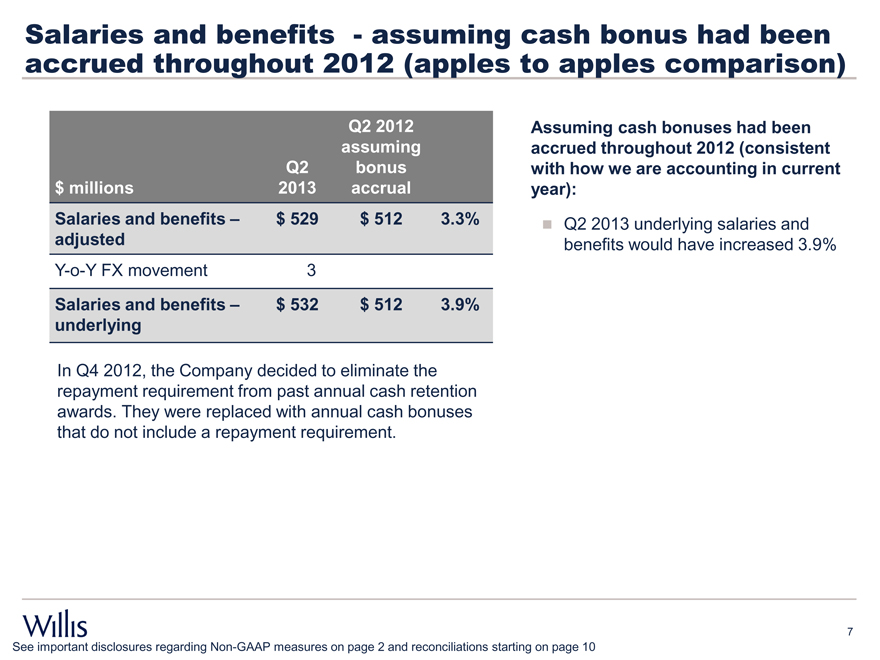
Salaries accrued throughout and benefits 2012 —assuming (apples to cash apples bonus comparison) had been
Q2 2012 Assuming cash bonuses had been
assuming accrued throughout 2012 (consistent
Q2 bonus with how we are accounting in current
$ millions 2013 accrual year):
Salaries and benefits – $ 529 $ 512 3.3% Q2 2013 underlying salaries and
adjusted benefits would have increased 3.9%
Y-o-Y FX movement 3
Salaries and benefits – $ 532 $ 512 3.9%
underlying
In Q4 2012, the Company decided to eliminate the
repayment requirement from past annual cash retention
awards. They were replaced with annual cash bonuses
that do not include a repayment requirement.
7
See important disclosures regarding Non-GAAP measures on page 2 and reconciliations starting on page 10
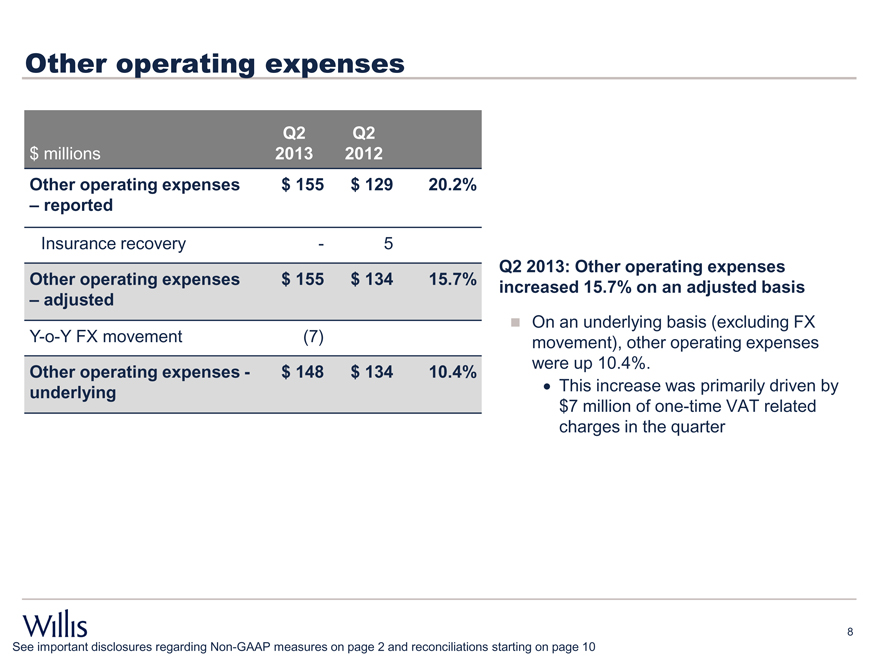
Other operating expenses
Q2 Q2
$ millions 2013 2012
Other operating expenses $ 155 $ 129 20.2%
– reported
Insurance recovery — 5
Other operating expenses $ 155 $ 134 15.7%
– adjusted
Y-o-Y FX movement (7)
Other operating expenses— $ 148 $ 134 10.4%
underlying
Q2 2013: Other operating expenses increased 15.7% on an adjusted basis
On an underlying basis (excluding FX movement), other operating expenses were up 10.4%.
This increase was primarily driven by $7 million of one-time VAT related charges in the quarter
8
See important disclosures regarding Non-GAAP measures on page 2 and reconciliations starting on page 10

APPENDICES
Important disclosures regarding non-GAAP measures
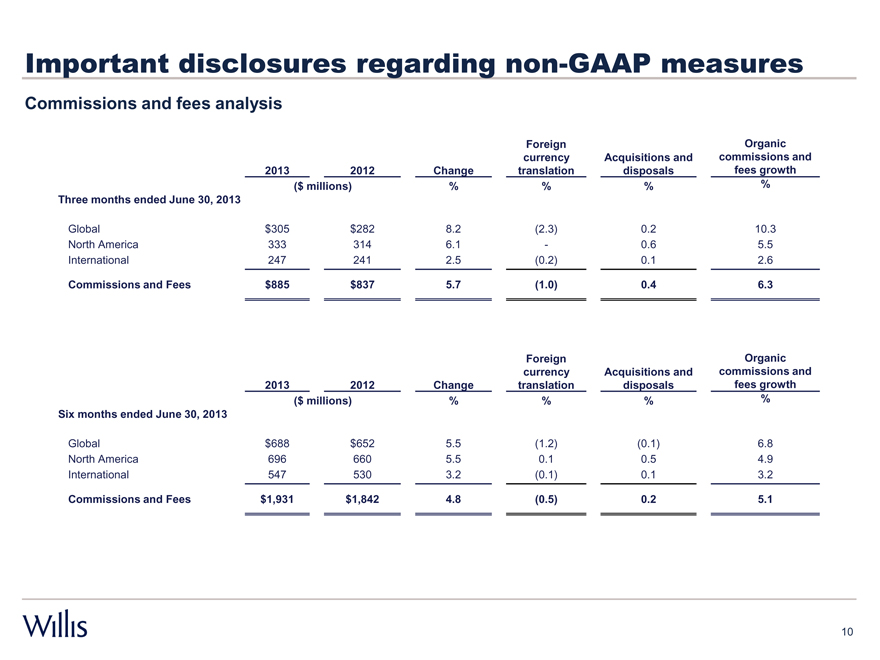
Commissions and fees analysis
Foreign Organic
currency Acquisitions and commissions and
2013 2012 Change translation disposals fees growth
($ millions) % % % %
Three months ended June 30, 2013
Global $305 $282 8.2 (2.3) 0.2 10.3
North America 333 314 6.1 — 0.6 5.5
International 247 241 2.5 (0.2) 0.1 2.6
Commissions and Fees $885 $837 5.7 (1.0) 0.4 6.3
Foreign Organic
currency Acquisitions and commissions and
2013 2012 Change translation disposals fees growth
($ millions) % % % %
Six months ended June 30, 2013
Global $688 $652 5.5 (1.2) (0.1) 6.8
North America 696 660 5.5 0.1 0.5 4.9
International 547 530 3.2 (0.1) 0.1 3.2
Commissions and Fees $1,931 $1,842 4.8 (0.5) 0.2 5.1
10
Important disclosures regarding non-GAAP measures
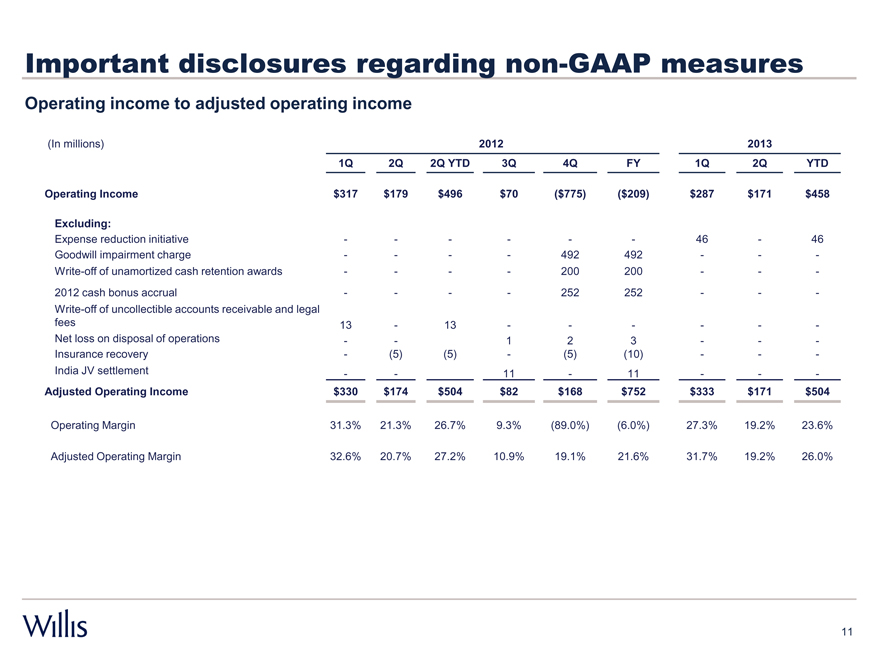
Operating income to adjusted operating income
(In millions) 2012 2013
1Q 2Q 2Q YTD 3Q 4Q FY 1Q 2Q YTD
Operating Income $ 317 $ 179 $ 496 $70 ($775) ($209) $ 287 $ 171 $ 458
Excluding:
Expense reduction initiative — — ———— 46 — 46
Goodwill impairment charge — — —— 492 492 — — -
Write-off of unamortized cash retention awards — — —— 200 200 — — -
2012 cash bonus accrual — — —— 252 252 — — -
Write-off of uncollectible accounts receivable and legal
fees 13 — 13 ——— — — -
Net loss on disposal of operations — — 1 2 3 — — -
Insurance recovery — (5) (5) — (5) (10) — — -
India JV settlement — — 11 — 11 — — -
Adjusted Operating Income $ 330 $ 174 $ 504 $82 $168 $752 $ 333 $ 171 $ 504
Operating Margin 31.3% 21.3% 26.7% 9.3% (89.0%) (6.0%) 27.3% 19.2% 23.6%
Adjusted Operating Margin 32.6% 20.7% 27.2% 10.9% 19.1% 21.6% 31.7% 19.2% 26.0%
11
Important disclosures regarding non-GAAP measures
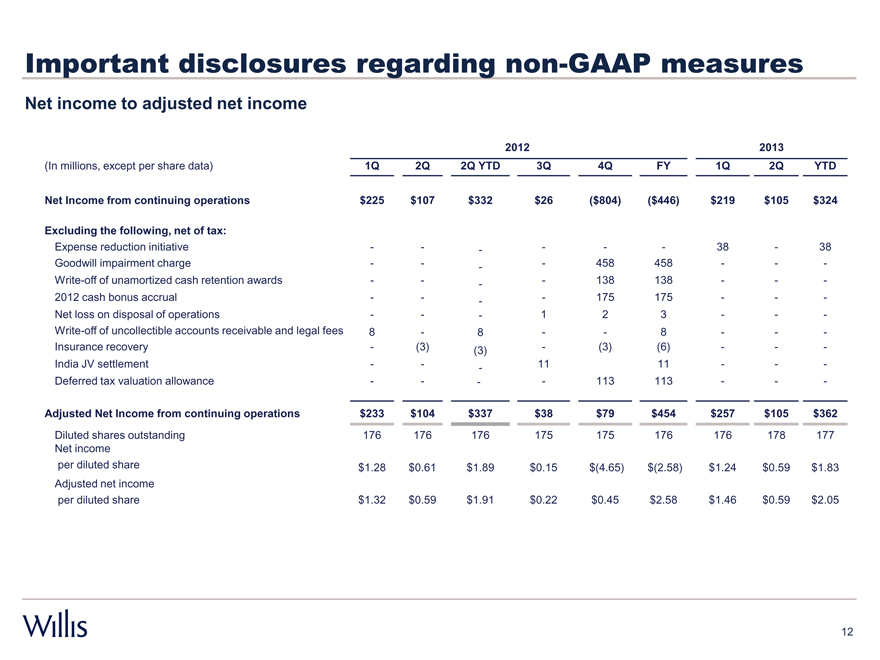
Net income to adjusted net income
2012 2013
(In millions, except per share data) 1Q 2Q 2Q YTD 3Q 4Q FY 1Q 2Q YTD
Net Income from continuing operations $225 $107 $332 $26 ($804) ($446) $219 $105 $324
Excluding the following, net of tax:
Expense reduction initiative ——— ——— 38 — 38
Goodwill impairment charge ——— — 458 458 —— -
Write-off of unamortized cash retention awards ——— — 138 138 —— -
2012 cash bonus accrual ——— — 175 175 —— -
Net loss on disposal of operations ——— 1 2 3 —— -
Write-off of uncollectible accounts receivable and legal fees 8 — 8 —— 8 —— -
Insurance recovery — (3) (3) — (3) (6) —— -
India JV settlement ——— 11 11 —— -
Deferred tax valuation allowance ——— — 113 113 —— -
Adjusted Net Income from continuing operations $233 $104 $337 $38 $79 $454 $257 $105 $362
Diluted shares outstanding 176 176 176 175 175 176 176 178 177
Net income
per diluted share $1.28 $0.61 $1.89 $0.15 $(4.65) $(2.58) $1.24 $0.59 $1.83
Adjusted net income
per diluted share $1.32 $0.59 $1.91 $0.22 $0.45 $2.58 $1.46 $0.59 $2.05
12
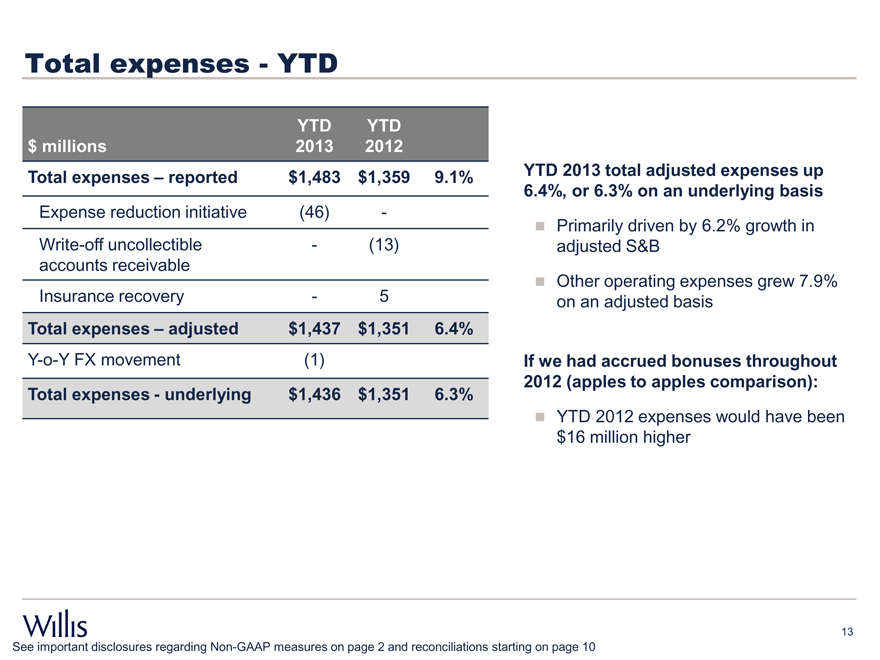
Total expenses—YTD
YTD YTD
$ millions 2013 2012
Total expenses – reported $ 1,483 $ 1,359 9.1%
Expense reduction initiative (46) —
Write-off uncollectible — (13)
accounts receivable
Insurance recovery — 5
Total expenses – adjusted $ 1,437 $1,351 6.4%
Y-o-Y FX movement (1)
Total expenses—underlying $ 1,436 $ 1,351 6.3%
YTD 2013 total adjusted expenses up 6.4%, or 6.3% on an underlying basis
Primarily driven by 6.2% growth in adjusted S&B
Other operating expenses grew 7.9% on an adjusted basis
If we had accrued bonuses throughout 2012 (apples to apples comparison):
YTD 2012 expenses would have been $16 million higher
13
See important disclosures regarding Non-GAAP measures on page 2 and reconciliations starting on page 10
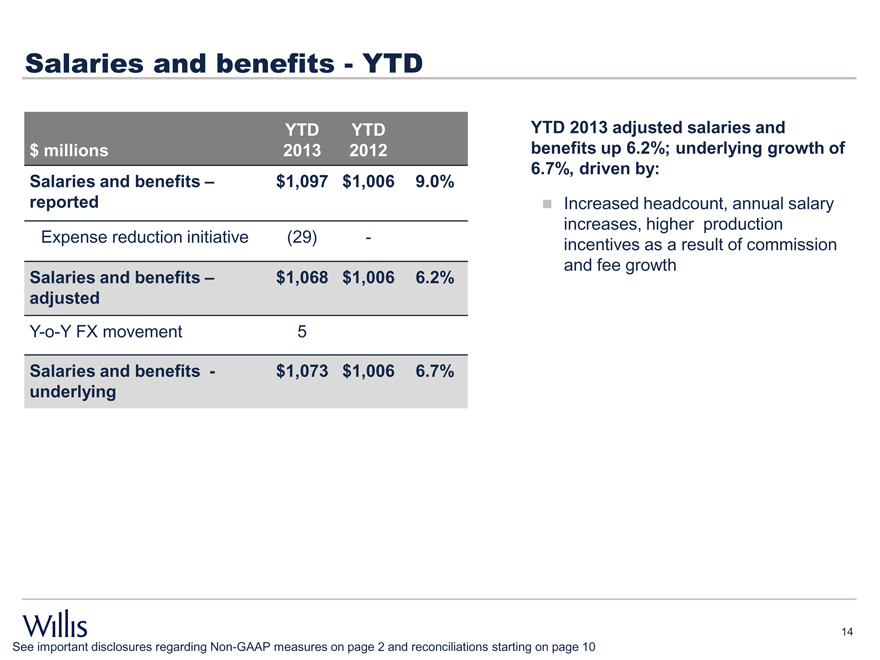
Salaries and benefits—YTD
YTD YTD
$ millions 2013 2012
Salaries and benefits – $ 1,097 $ 1,006 9.0%
reported
Expense reduction initiative (29) —
Salaries and benefits – $ 1,068 $ 1,006 6.2%
adjusted
Y-o-Y FX movement 5
Salaries and benefits— $ 1,073 $ 1,006 6.7%
underlying
YTD 2013 adjusted salaries and benefits up 6.2%; underlying growth of 6.7%, driven by:
Increased headcount, annual salary increases, higher production incentives as a result of commission and fee growth
14
See important disclosures regarding Non-GAAP measures on page 2 and reconciliations starting on page 10
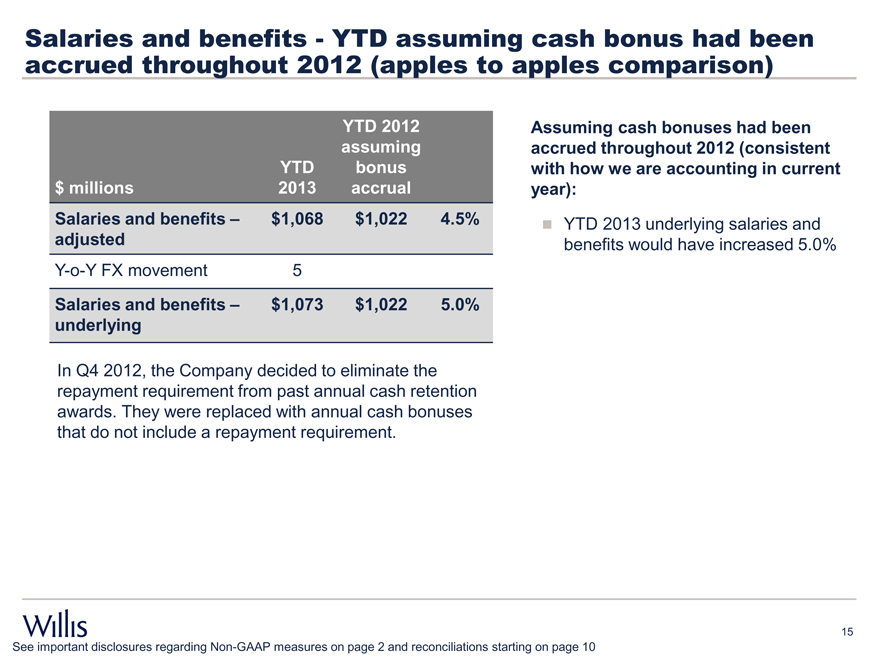
Salaries accrued and throughout benefits 2012 —YTD (apples assuming to apples cash bonus comparison) had been
YTD 2012 Assuming cash bonuses had been
assuming accrued throughout 2012 (consistent
YTD bonus with how we are accounting in current
$ millions 2013 accrual year):
Salaries and benefits – $ 1,068 $ 1,022 4.5% YTD 2013 underlying salaries and
adjusted benefits would have increased 5.0%
Y-o-Y FX movement 5
Salaries and benefits – $ 1,073 $ 1,022 5.0%
underlying
In Q4 2012, the Company decided to eliminate the
repayment requirement from past annual cash retention
awards. They were replaced with annual cash bonuses
that do not include a repayment requirement.
15
See important disclosures regarding Non-GAAP measures on page 2 and reconciliations starting on page 10
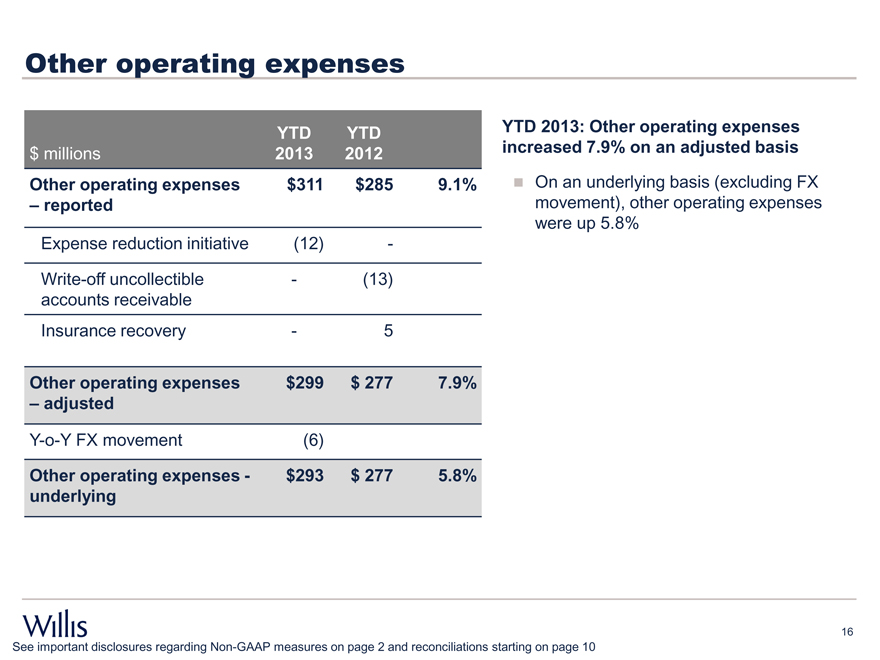
Other operating expenses
YTD YTD
$ millions 2013 2012
Other operating expenses $311 $285 9.1%
– reported
Expense reduction initiative (12) —
Write-off uncollectible — (13)
accounts receivable
Insurance recovery — 5
YTD 2013: Other operating expenses increased 7.9% on an adjusted basis
On an underlying basis (excluding FX movement), other operating expenses were up 5.8%
Other operating expenses $ 299 $ 277 7.9%
– adjusted
Y-o-Y FX movement (6)
Other operating expenses— $ 293 $ 277 5.8%
underlying
16
See important disclosures regarding Non-GAAP measures on page 2 and reconciliations starting on page 10
IR Contacts
Peter Poillon
Tel: +1 212 915-8084
Email: peter.poillon@willis.com
Mark Jones
Tel: +1 212 915-8796
Email: mark.p.jones@willis.com
17

Willis Group Holdings
SECOND QUARTER 2013 RESULTS
July, 2013