 Investor Conference July 30, 2013 I New York Willis Group Holdings plc. Exhibit 99.1 |
 Disclaaimer Important disclosures regarding forward-looking statements Investor Conference, New York, July 30, 2013 2 These presentations contain certain “forward-looking statements” within the meaning of Section 27A of the Securities Act of 1933, and Section 21E of the Securities Exchange Act of 1934, which are intended to be covered by the safe harbors created by those laws. These forward- looking statements include information about possible or assumed future results of our operations. All statements, other than statements of historical facts, included in this document that address activities, events or developments that we expect or anticipate may occur in the future, including such things as our outlook, potential cost savings and accelerated adjusted operating margin and adjusted earnings per share growth, future capital expenditures, growth in commissions and fees, business strategies, competitive strengths, goals, the benefits of new initiatives, growth of our business and operations, plans, and references to future successes are forward-looking statements. Also, when we use the words such as ‘aim’, ‘anticipate’, ‘believe’, ‘estimate’, ‘expect’, ‘intend’, ‘plan’, ‘probably’, or similar expressions, we are making forward- looking statements. There are important uncertainties, events and factors that could cause our actual results or performance to differ materially from those in the forward-looking statements contained in this document, including the following: the impact of any regional, national or global political, economic, business, competitive, market, environmental or regulatory conditions on our global business operations; the impact of current financial market conditions on our results of operations and financial condition, including as a result of those associated with the current Eurozone crisis, any insolvencies of or other difficulties experienced by our clients, insurance companies or financial institutions; our ability to implement and realize anticipated benefits of any expense reduction initiative, charge or any revenue generating initiatives; volatility or declines in insurance markets and premiums on which our commissions are based, but which we do not control; our ability to continue to manage our significant indebtedness; our ability to compete effectively in our industry, including the impact of our refusal to accept contingent commissions from carriers in the non- Human Capital areas of our retail brokerage business; material changes in commercial property and casualty markets generally or the availability of insurance products or changes in premiums resulting from a catastrophic event, such as a hurricane; our ability to retain key employees and clients and attract new business; the timing or ability to carry out share repurchases and redemptions; the timing or ability to carry out refinancing or take other steps to manage our capital and the limitations in our long term debt agreements that may restrict our ability to take these actions; fluctuations in our earnings as a result of potential changes to our valuation allowance(s) on our deferred tax assets; |
 Disclaimer Important disclosures regarding forward-looking statements continued Investor Conference, New York, July 30, 2013 3 any fluctuations in exchange and interest rates that could affect expenses and revenue; the potential costs and difficulties in complying with a wide variety of foreign laws and regulations and any related changes, given the global scope of our operations; rating agency actions that could inhibit our ability to borrow funds or the pricing thereof; a significant decline in the value of investments that fund our pension plans or changes in our pension plan liabilities or funding obligations; our ability to achieve the expected strategic benefits of transactions, including any growth from associates; further impairment of the goodwill of one of our reporting units, in which case we may be required to record additional significant charges to earnings; our ability to receive dividends or other distributions in needed amounts from our subsidiaries; changes in the tax or accounting treatment of our operations and fluctuations in our tax rate; any potential impact from the US healthcare reform legislation; our involvements in and the results of any regulatory investigations, legal proceedings and other forward-looking statements are reasonable, any of these assumptions, and therefore also the forward-looking statements based on these assumptions, could themselves prove to be inaccurate. In light of the significant uncertainties inherent in the forward-looking statements included in this presentation, our inclusion of this information is not a representation or guarantee by us that our objectives and plans will be achieved. Our forward- looking statements speak only as of the date made and we will not update these forward-looking statements unless the securities laws require us to do so. In light of these risks, uncertainties and assumptions, the forward-looking events discussed in this presentation may not occur, and we caution you against unduly relying on these forward-looking statements. contingencies; underwriting, advisory or reputational risks associated with non-core operations as well as the potential significant impact our non-core operations (including the Willis Capital Markets & Advisory operations) can have on our financial results; our exposure to potential liabilities arising from errors and omissions and other potential claims against us; and the interruption or loss of our information processing systems or failure to maintain secure information systems. The foregoing list of factors is not exhaustive and new factors may emerge from time to time that could also affect actual performance and results. For additional information see also Part I, Item 1A “Risk Factors” included in Willis’ Form 10-K for the year ended December 31, 2012, and our subsequent filings with the Securities and Exchange Commission. Copies are available online at http://www.sec.gov or on request from the Company. Although we believe that the assumptions underlying our |
 Disclaimer Important disclosures regarding non-GAAP measures Investor Conference, New York, July 30, 2013 4 This presentation contains references to “non-GAAP financial measures" as defined in Regulation G of SEC rules. We present these measures because we believe they are of interest to the investment community and they provide additional meaningful methods of evaluating certain aspects of the Company’s operating performance from period to period on a basis that may not be otherwise apparent on a generally accepted accounting principles (GAAP) basis. These financial measures should be viewed in addition to, not in lieu of, the Company’s condensed consolidated income statements and balance sheet as of the relevant date. Consistent with Regulation G, a description of such information is provided below and a reconciliation of certain of such items to GAAP information can be found in our periodic filings with the SEC. Our method of calculating these non -GAAP financial measures may differ from other companies and therefore comparability may be limited. |
 Overview Dominic Casserley CEO Willis Group Holdings plc Investor Conference, New York, July 30, 2013 5 |
 Global risk advisor and broker POTENTIAL Solid fundamentals and room for growth Where and How to compete EXECUTION SUCCESS Growing revenues with positive operating leverage to improve cash flow and deliver compelling shareholder returns Investor Conference, New York, July 30, 2013 6 1 2 3 |
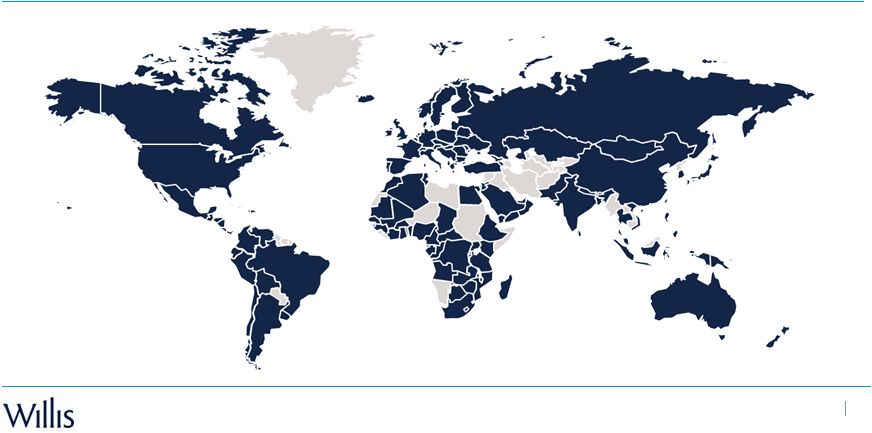 Global risk advisor and broker Investor Conference, New York, July 30, 2013 7 |
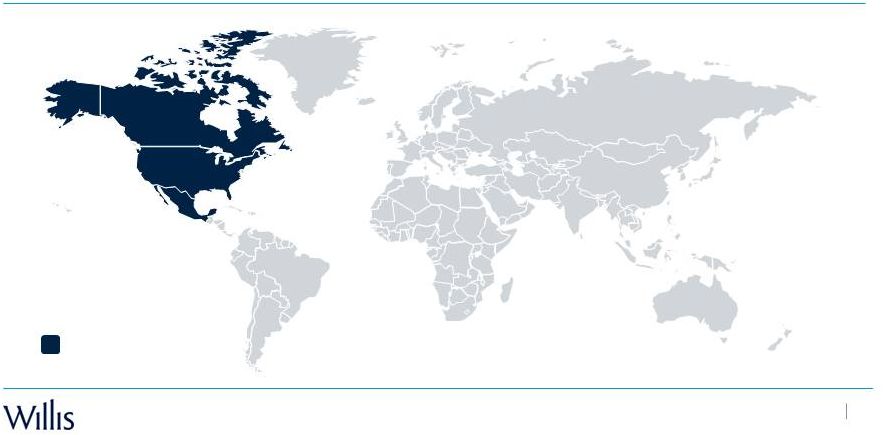
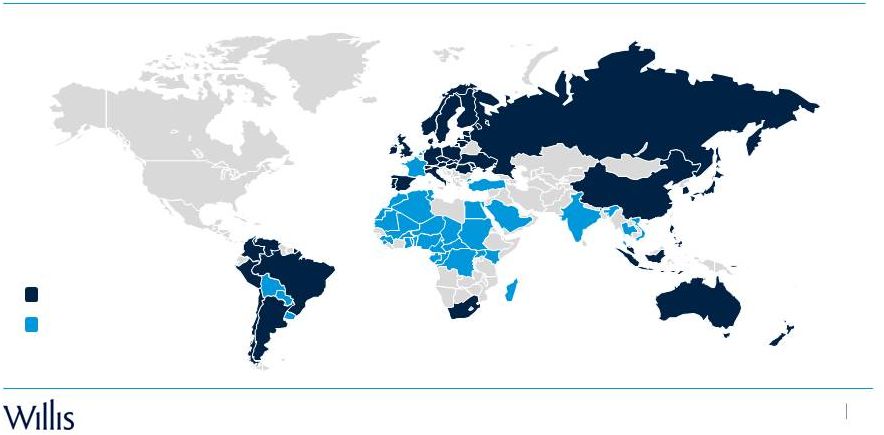
 Global risk advisor and broker $3.5 billion in revenues globally 17,500 associates 400 offices 90 countries Investor Conference, New York, July 30, 2013 8 |
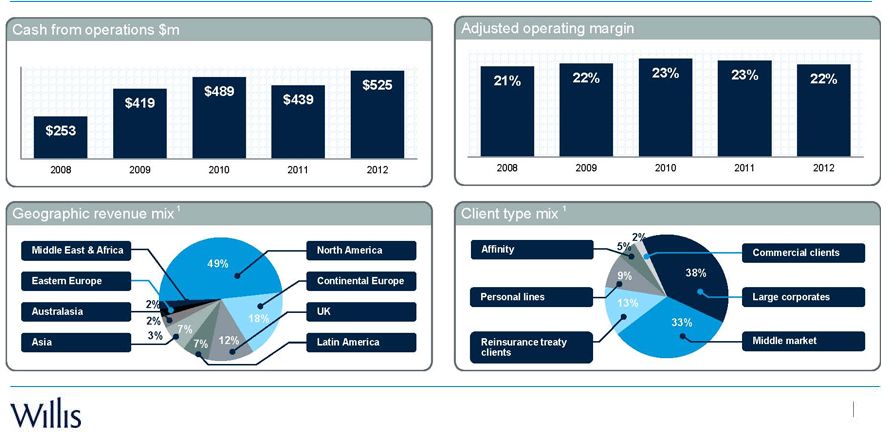
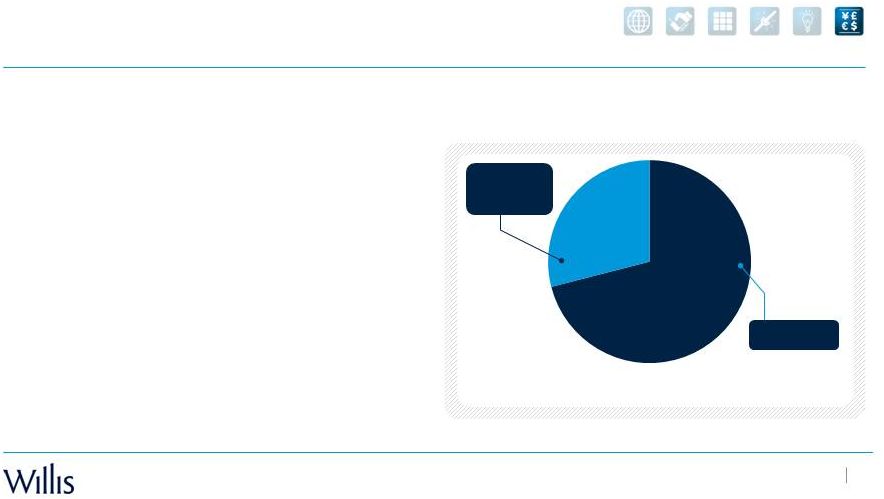
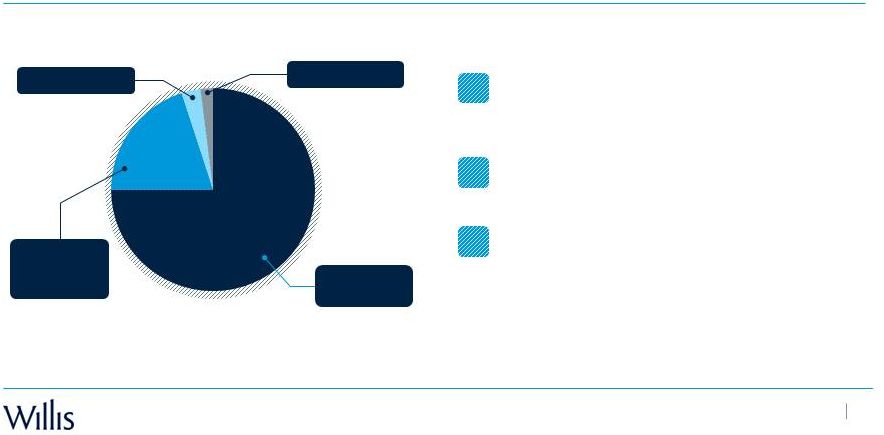
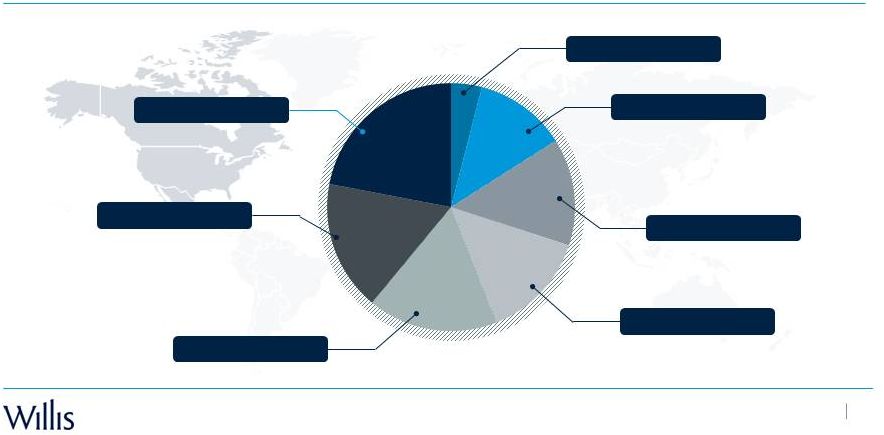
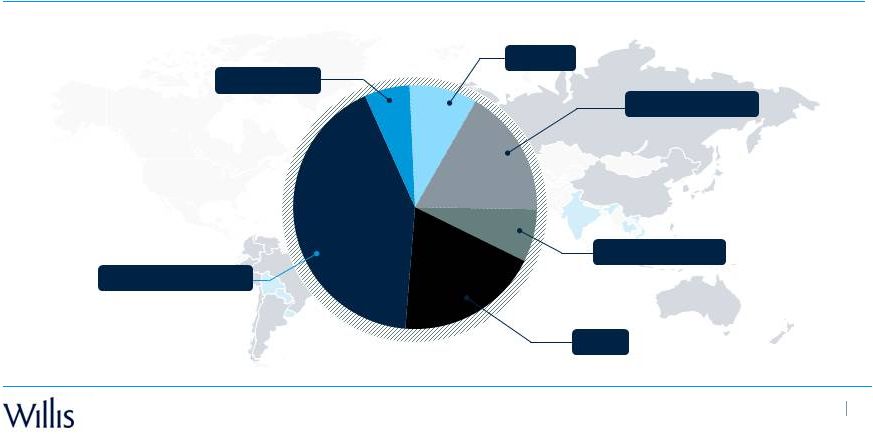
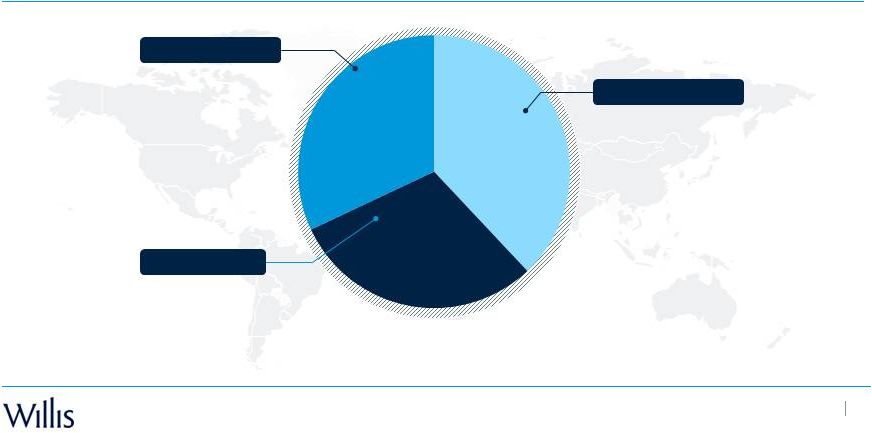 Global risk advisor and broker 2012 revenue - $3.48 billion Investor Conference, New York, July 30, 2013 9 North America International Global 38% 32% 30% |
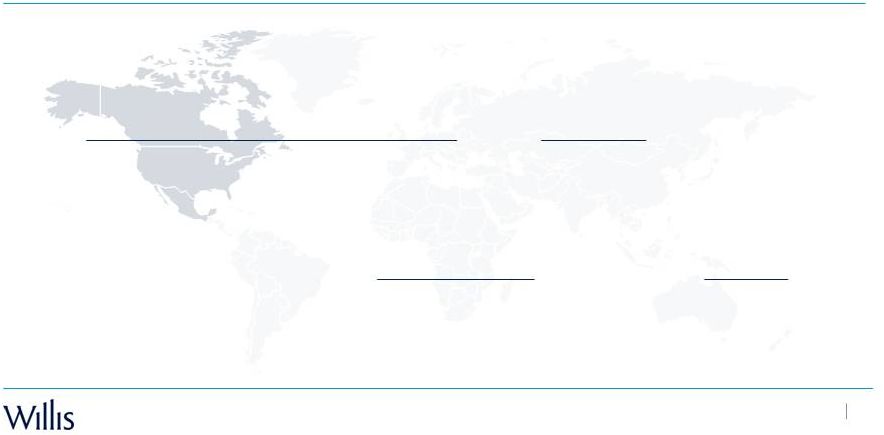
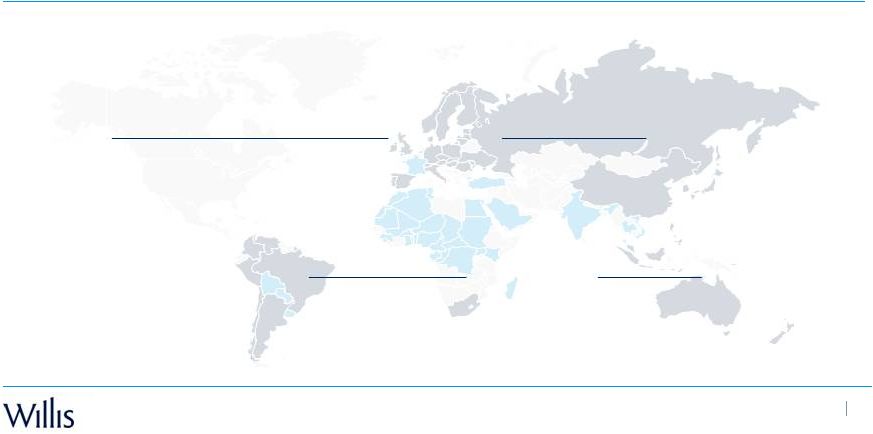
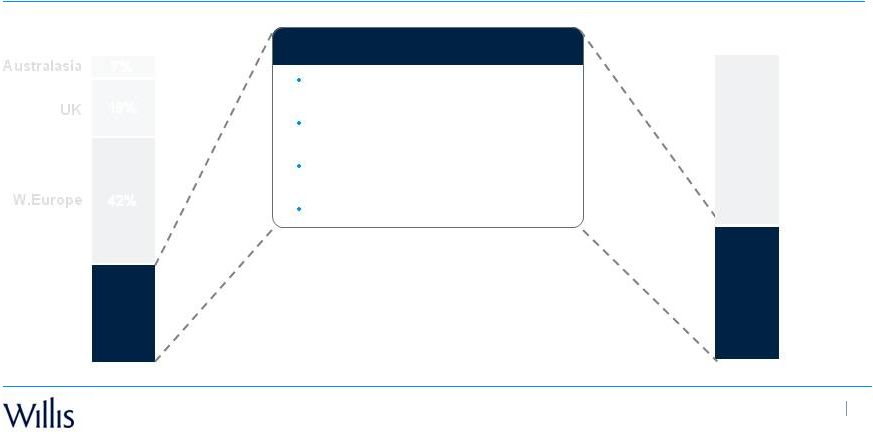
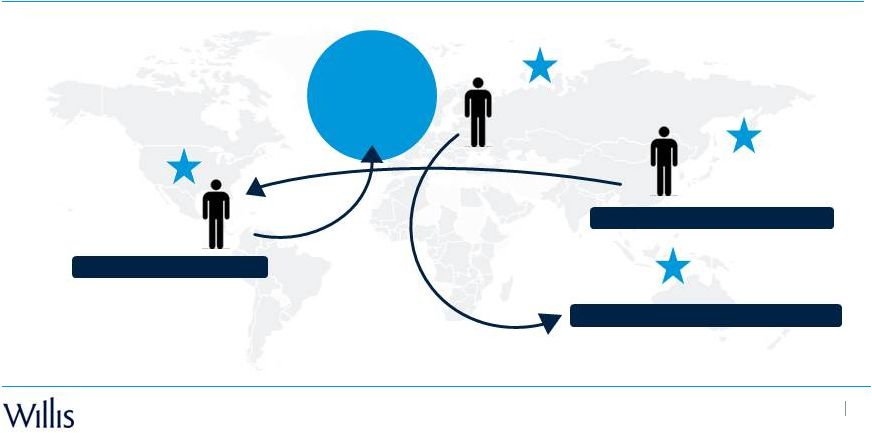 Global interconnected core North American Client Covers specialty risk International Client Energy Specialty Client Served by an international office Covers North American risk Investor Conference, New York, July 30, 2013 10 GLOBAL SPECIALTY |
 Agenda 13:00 – 13:40 13:40 – 14:00 14:00 – 14:15 14:15 – 14:30 14:30 – 15:00 15:00 – 15:30 15:30 – 16:00 16:00 – 16:45 Overview: Dominic Casserley Finance Overview: Michael Neborak Q&A Break Willis North America: Todd Jones Willis International: Tim Wright Willis Global: Steve Hearn Wrap up and Q&A Investor Conference, New York, July 30, 2013 11 |
 Why risk? Why risk? Setting the context Why risk advisory and broking? Why Willis? 12 Investor Conference, New York, July 30, 2013 |
 Attractive long-term structural drivers for the sector Source: UN, EIA, Munich Re Expanding middle class TODAY 2030 4.8 billion 5% CAGR Urbanization TODAY 2030 4.9 billion 2% CAGR World GDP $139 trillion TODAY 2030 3% CAGR Property & Casualty market $2.4 trillion 2012 2020 5% CAGR Total insurance market $6.5 trillion 2012 2020 5.9% CAGR Investor Conference, New York, July 30, 2013 13 |
 An expanding set of risks Supply chain uncertainty Investor Conference, New York, July 30, 2013 14 |
 An expanding set of risks Cyber security Investor Conference, New York, July 30, 2013 15 |
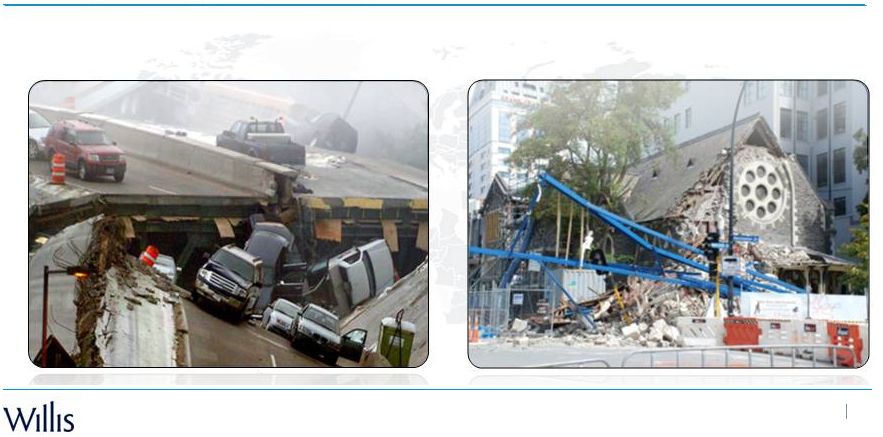 An expanding set of risks Seismic activity Investor Conference, New York, July 30, 2013 16 |
 An expanding set of risks Extreme weather Investor Conference, New York, July 30, 2013 17 |
 An expanding set of risks Income statement Balance sheet Cash flow Boardroom Investor Conference, New York, July 30, 2013 18 |
 Setting the context Investor Conference, New York, July 30, 2013 19 Why risk? Why risk advisory and broking? Why Willis? |
 From product provider to risk advisor Client Insurer Client Insurer Investor Conference, New York, July 30, 2013 20 Advisor Broker Broker |
 Setting the context Why risk advisory and broking? Why Willis? Why risk? Why Willis? Investor Conference, New York, July 30, 2013 21 |
 Willis has strong fundamentals Investor Conference, New York, July 30, 2013 22 (1) 2011 figures |
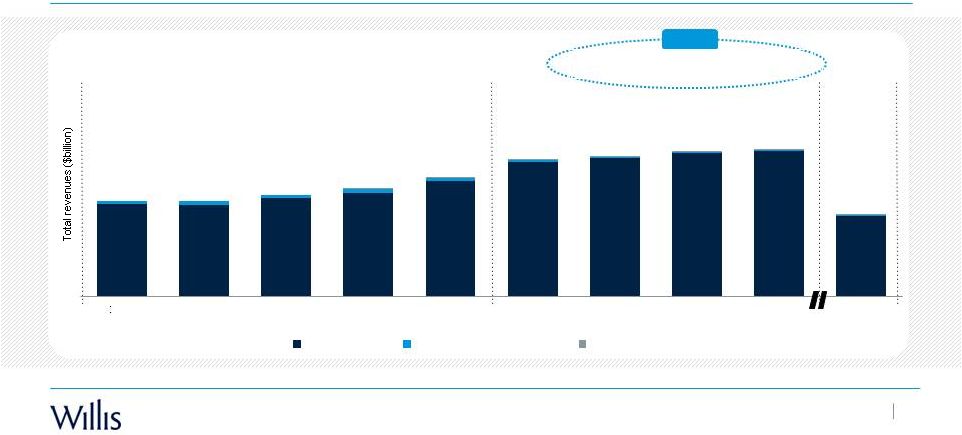 Our potential 5% Average = 3% Average = 5% Organic C&F growth Investor Conference, New York, July 30, 2013 23 C&F Interest income Other income $2.3 $2.3 $2.4 $2.6 $2.8 $3.3 $3.3 $3.4 $3.5 $1.9 2004 2005 2006 2007 2008 2009 2010 2011 2012 H1 2013 23% |
 What is the plan? Where to compete Investor Conference, New York, July 30, 2013 24 |
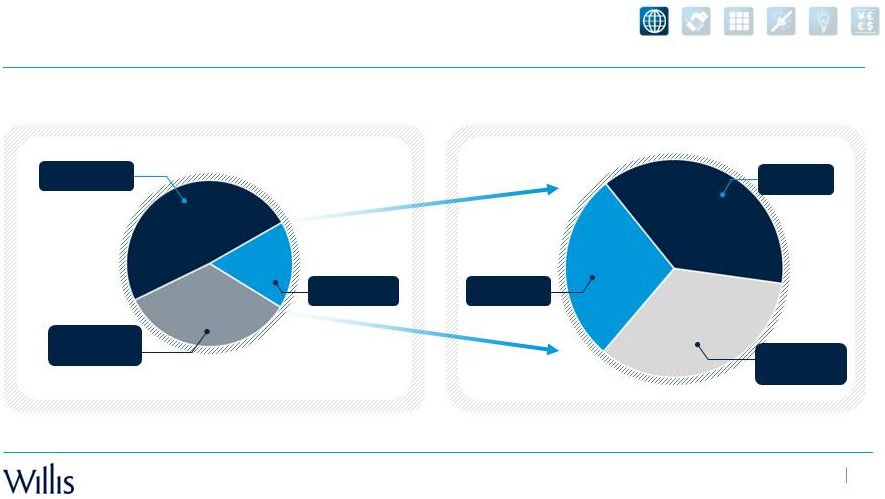 We will rebalance towards faster growth geographies and sectors Illustrative and not to scale. Revenue is region of origin not BU reporting. Geographic revenue mix 2012 Potential geographic revenue mix 2017 Other developed markets Developing markets North America North America Other developed markets Developing markets Investor Conference, New York, July 30, 2013 25 49% 17% 34% 38% 28% 34% |
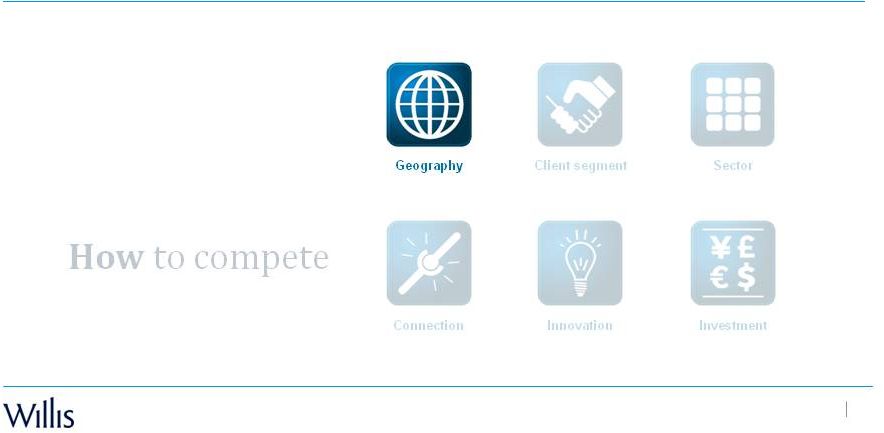
 Innovation Connection Investment What is the plan? Where to compete Investor Conference, New York, July 30, 2013 26 Geography Sector Client segment |
 We will segment our client offering, focusing on value SME Accounts, Affinity, Personal • Dedicated operations • Commercial network • Product to meet needs Large Corporate Accounts • Growing priority • Global proposition • Industry expertise and analytics • Trusted advisor • Product and solution neutral • Deep analytical understanding of Risk Insurers Investor Conference, New York, July 30, 2013 27 Mid-Market Corporate Accounts • Continued development • Local delivery of global expertise |
 Geography Client segment Innovation Connection Investment What is the plan? Where to compete Investor Conference, New York, July 30, 2013 28 Sector |
 We will build business lines around our sector strength Aerospace Energy Healthcare Mining Leisure Construction Financial Services Marine Real Estate Utilities Renewables Life Sciences Reinsurance Tech Media Telecom Agribusiness Investor Conference, New York, July 30, 2013 29 |
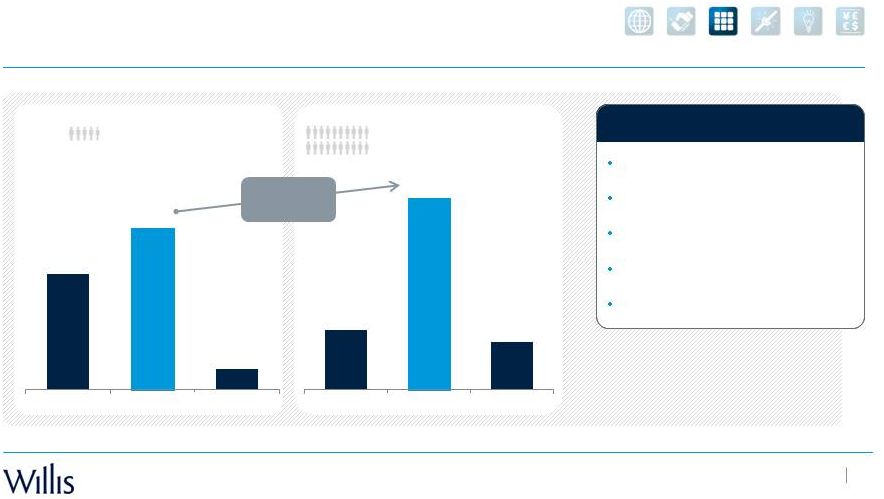 The opportunity in human capital / employee benefits Source : United Nations Department of Economic and Social Affairs/Population Division World Population to 230 Diabetes Cancer Obesity Dementia Healthcare innovation Aging population Investor Conference, New York, July 30, 2013 30 39% 54% 7% 0-14 25-64 65 2000 20% 64% 16% 0-14 25-64 65 2050 Challenges |
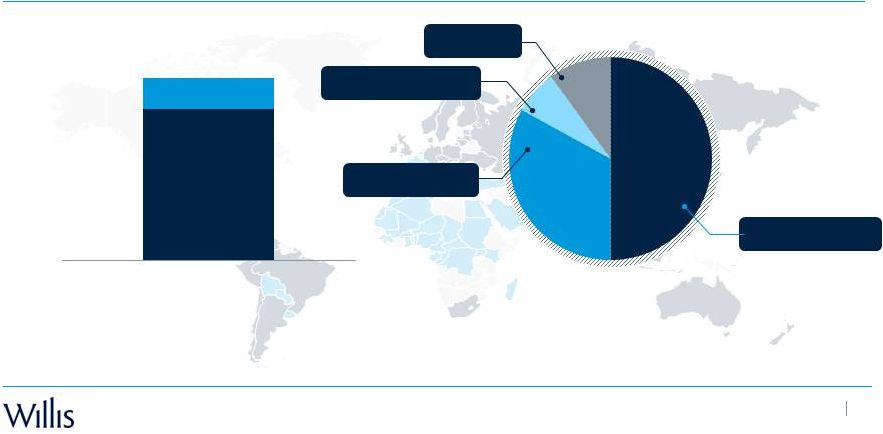
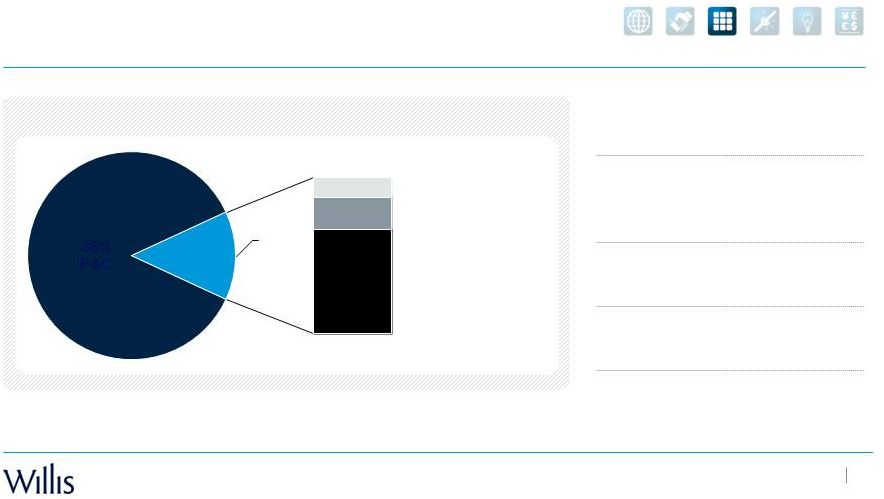 The opportunity in human capital / employee benefits Very strong middle market and selected large corporate franchise in North America Strong position in other markets Significant multinational client base Growing well in our focused areas Healthcare focused business globally 3% Developing markets 2% Developed markets 9% North America We estimate global market to be ~$29 billion Willis line of business breakdown Investor Conference, New York, July 30, 2013 31 86% P&C 14% EB |
 What is the plan? Sector Geography Client segment Innovation Connection Investment Where to compete How to compete Investor Conference, New York, July 30, 2013 32 |
 Connection – leading to more cross-selling Improved cross-sales targets Offer incentives Training and development Relocation of skills Retail network use global specialties Increased geography: geography cross-sales Improved retention Client wins from a connected offering Investor Conference, New York, July 30, 2013 33 The opportunities Improving connectivity |
 What is the plan? Investor Conference, New York, July 30, 2013 34 Sector Geography Client segment Connection Investment How to compete Innovation |
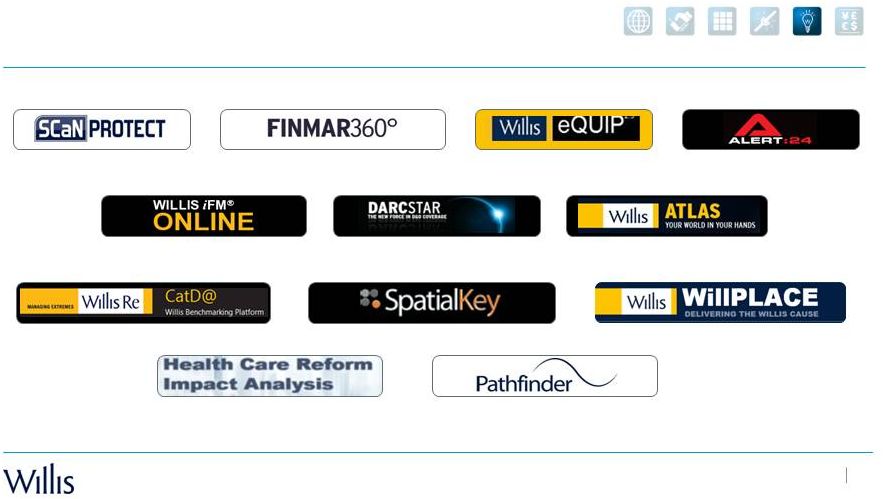 Investor Conference, New York, July 30, 2013 35 Competing on analytics and innovation |
 What is the plan? Sector Geography Client segment Innovation Connection Where to compete How to compete Investor Conference, New York, July 30, 2013 36 Investment |
 Investment criteria Economics • Revenue Growth • NPV • Earnings accretion • Little or no capital risk Competitive position • Strong and leading competitive positions • Link to Willis value add • Sustainable talent proposition Fit • Operational fit • Sustainable business – managed regulatory / reputational risk • Cultural fit Inorganic • Prioritize our growth geographies, segments and industries • Seek and maintain strong competitive positions • Exit lower performing / lower growth businesses Organic • Redeploy resources to higher growth areas • Build new products with clear returns • Recruit and train required talent Focus on NPV and earnings accretion Investor Conference, New York, July 30, 2013 37 |
 Gras Savoye – an attractive option Investor Conference, New York, July 30, 2013 38 Geographical revenues 2012 revenue: ~$430m France Rest of world Company overview • Market leader for over 25 years • 28 offices in France • Offices in 44 countries • 3,800 employees worldwide • Willis has a 30% ownership stake with an option to acquire 100% in 2016 Source :Gras Savoye, Swiss Re, Munich Re 71% 29% |
 Gras Savoye – an attractive option Investor Conference, New York, July 30, 2013 39 Source :Gras Savoye, Swiss Re, Munich Re Option decision April 2015 – exercisable June 2016 Increase stake from 30 to 100% NPV Earnings accretion Decision process • ~$430m revenue • Recovery of French economy short term and long term prospects • Growth in International business • Management turnaround plan • Revenue and cost synergies • Leadership position in France • Strong in Paris and most successful regional broker • ~30% ex-France footprint in growing markets (Eastern Europe, Africa, Middle East and Asia) • France is a top-5 insurance market • Working together for over 35 years • Utilize Willis network in more than 120 countries • Cross business line coverage • Large client relationships • Ownership stake for 16 years Economics Competitive position Fit |
 Executing our strategy on the ground Where to compete How to compete NORTH AMERICA GLOBAL INTERNATIONAL Investor Conference, New York, July 30, 2013 40 Geography Client segment Sector Connection Innovation Investment |
 Management incentives aligned to shareholder value creation Long-term incentive program Annual incentive program Profit over 3 year period Investor Conference, New York, July 30, 2013 41 Adjusted EBITDA $ growth By excluding depreciation and amortization, avoids “in year” impact from decisions taken years previously Adjusted EBIT $ growth with cost of capital modifier for acquisitions / divestitures Excludes M&A impact within 12 months % organic commission and fee growth Revenue % organic commission and fee growth Revenue over 3 year period Profit |
 Growth with discipline Mid-single digits revenue growth Mid-teens total shareholder return Positive margin Investor Conference, New York, July 30, 2013 42 Expense growth 70+ bps Revenue growth |
 Cash allocation strategies Invest in the business for growth M&A Generate a steadily rising dividend Repurchase shares Maintain investment grade Investor Conference, New York, July 30, 2013 43 |
 Global risk advisor and broker Solid fundamentals and room for growth 1 Where and How to compete 2 Growing revenues with positive operating leverage to improve cash flow and deliver compelling shareholder returns 3 Investor Conference, New York, July 30, 2013 44 POTENTIAL EXECUTION SUCCESS |
 Financial Overview Michael Neborak Group CFO Willis Group Holdings plc Investor Conference, New York, July 30, 2013 |
 Key takeaways 2 Investor Conference, New York, July 30, 2013 Key takeaways Willis Group is a growing, highly profitable, cash generative business 1 Accelerating earnings growth should generate an increasing amount of capital for value-creating opportunities 3 We have a disciplined approach to cost management that will drive operating margins 2 Clear priorities for capital allocation 5 4 We have a healthy balance sheet to support our expected growth |
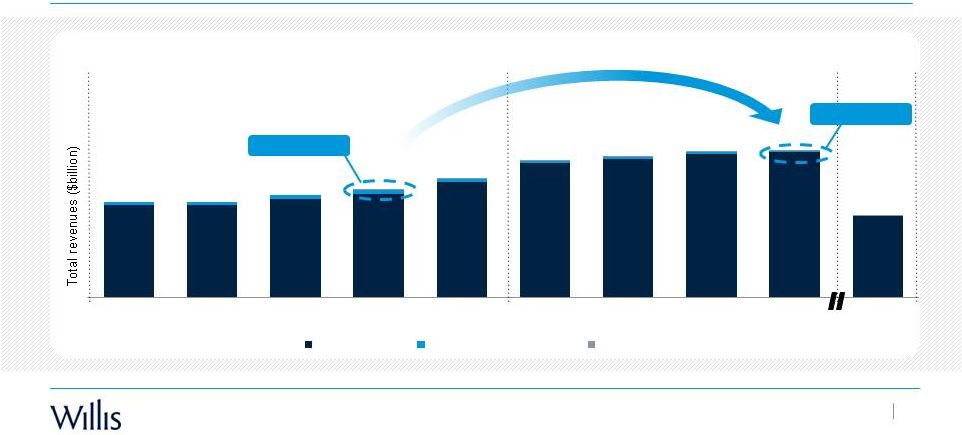 Willis is a growing company 3 Investor Conference, New York, July 30, 2013 5% Average = 3% Average = 5% Organic C&F growth Interest income declines 80% $18 million $96 million $2.3 $2.3 $2.4 $2.6 $2.8 $3.3 $3.3 $3.4 $3.5 $1.9 2004 2005 2006 2007 2008 2009 2010 2011 2012 H1 2013 C&F Interest income Other income Willis is a growing company Interest income declines 80% |
 4 Investor Conference, New York, July 30, 2013 Target at least 70 basis points spread between revenue and cost growth Strategic framework 2012 adjusted expenses Amortization Depreciation Other operating expenses Salaries & benefits Cost discipline Collaboration between key business leaders and monthly review of expenses 1 3 2 Productivity improvements Increased utilization of low-cost hubs Prioritization of investment Invest in high growth areas and scale back in low growth areas 75% 20% 3% 2% Disciplined cost management |
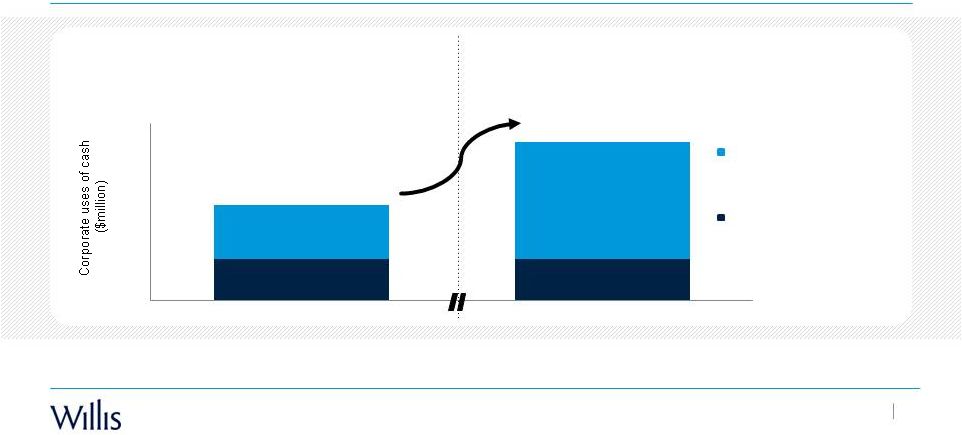 5 Investor Conference, New York, July 30, 2013 Cashflow available for shareholder value creation Revenue Cash from Op. activities before pension funding $3,480 $668 Flattening of capital expenditures and pension funding Potential (1) For illustrative purposes only; not drawn to scale. Organic investment, M&A, dividends, debt management and share repurchases Funding of defined benefit plans and capital expenditures 2012 2017 E ¹ 0 200 400 600 800 1000 1200 Large and growing pool of capital available to create shareholder value |
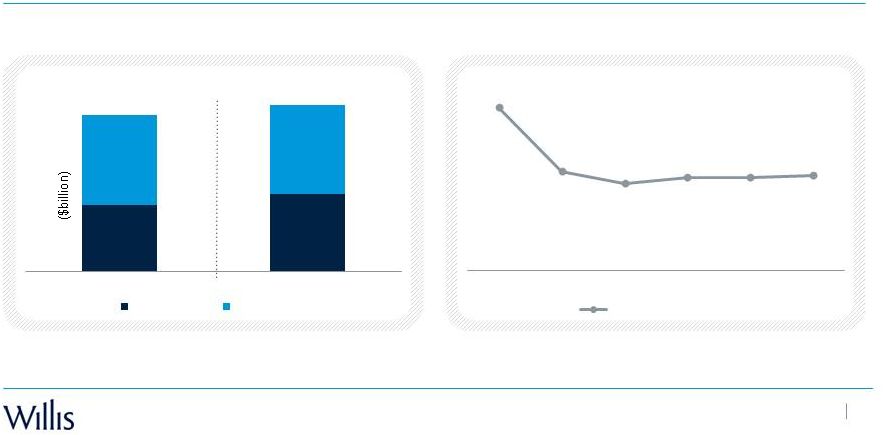 6 Investor Conference, New York, July 30, 2013 Committed to maintaining our investment grade rating Capital structure Leverage ratio (1) Includes impact from acquisition of HRH as of 10/1/2008. $1.7 $2.0 $2.3 $2.3 Dec. 31, 2012 Jun. 30, 2013 Total equity Long-term debt 3.8 2.7 2.5 2.6 2.6 2.6 2008 ¹ 2009 2010 2011 2012 LTM 2013 Debt / adjusted EBITDA Capitalization |
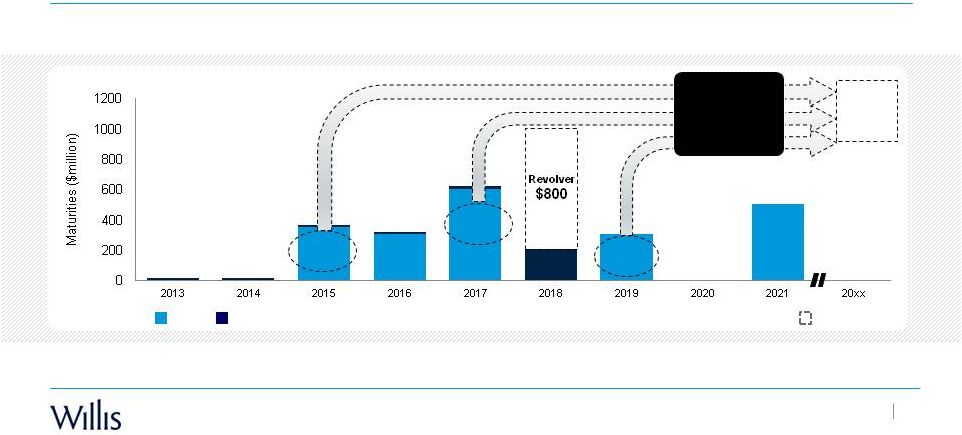 7 Investor Conference, New York, July 30, 2013 Maturity profile Enhanced flexibility from extending maturities 5-year term loan, scheduled amortization: $15m annually 2013-2016, $23m in 2017, balance due in 2018 Revolver Notes $500 $207 $300 $500 $600 $300 $350 Scheduled debt maturities Opportunity to extend maturities to later years at lower rates |
 8 Investor Conference, New York, July 30, 2013 Invest in the business for growth M&A Generate a steadily rising dividend Repurchase shares Maintain investment grade Cash allocation strategies |
 9 Investor Conference, New York, July 30, 2013 1 2 3 4 5 Willis Group is a growing, highly profitable, cash generative business We have a disciplined approach to cost management that will drive operating margins Accelerating earnings growth should generate an increasing amount of capital for value-creating opportunities We have a healthy balance sheet to support our expected growth Clear priorities for capital allocation Key takeaways |
 Willis North America Investor Conference, New York, July 30, 2013 Todd Jones CEO Willis North America |
 Key takeaways Investor Conference, New York, July 30, 2013 2 Business has stabilized and returned to consistent performance Strong foundations Significant opportunity in North America for Willis Growth with discipline Significant opportunity working more closely with global specialty Unique positioning in growing fragmented human capital market 1 2 3 4 5 6 Key takeaways |
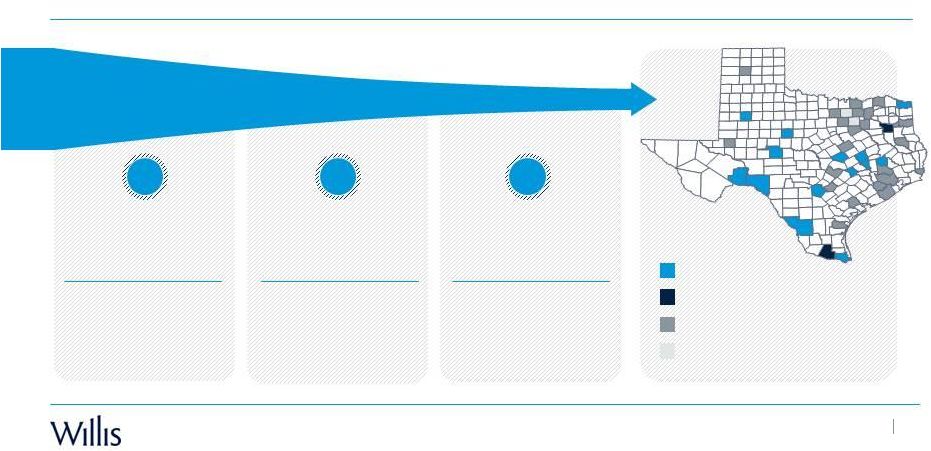
 3 Investor Conference, New York, July 30, 2013 Willis North America presence Overview |
 4 Investor Conference, New York, July 30, 2013 $1.3 billion in revenues 6,000 associates 110 locations 8 regions Overview |
 5 Investor Conference, New York, July 30, 2013 12% 22% 17% 17% 14% 4% 14% % of 2012 C&F Regional contribution to North America Atlantic South Midwest Other CAPPPs ¹ Metro (New York) West (1) CAPPPs: Captives, Actuarial, Programs, Pooling, and Personal Lines Overview |
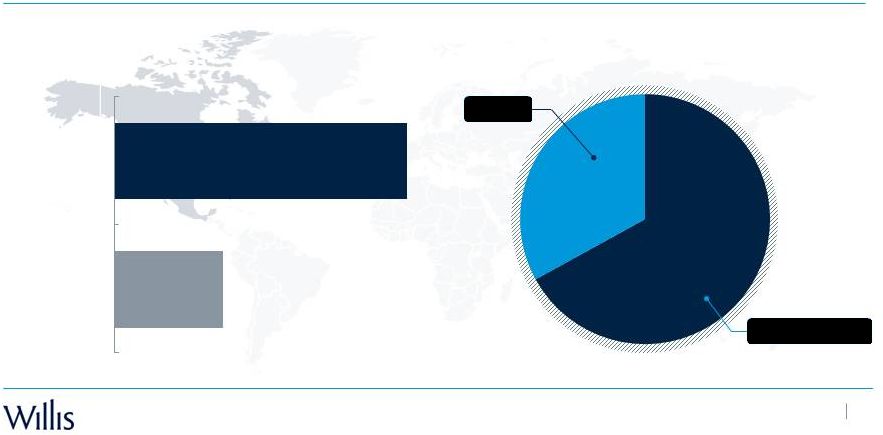 Overview 6 Investor Conference, New York, July 30, 2013 Product line contribution to North America 33% 67% Commission Fees Approximate revenue split % of 2012 C&F Overview 24% 76% Human Capital P&C |
 Q1 – ‘11 Q2 – ‘11 Q3 – ‘11 Q4 – ‘11 Q1 – ‘12 Q2 – ‘12 Q3 – ‘12 Q4 – ‘12 Q1 – ‘13 Q2 – ‘13 % YoY change Returning to form Revenue growth $m 358 328 318 319 349 315 318 331 365 335 Revenue $m Operating income 23.7% 18.6% 19.5% 19.7% 23.5% 15.2% 16.7% 17.2% 24.4% 17.0% (% of revenue) Investor Conference, New York, July 30, 2013 7 Returning to form - 2.7% - 1.5% - 4.8% - 8.9% - 2.5% - 4.0% 0.0% 3.8% 4.6% 5.7% 85 61 62 63 82 48 53 57 89 57 |
 Opportunity Willis is well positioned to compete and win Focused on client needs through an expertise-based model Expertise and depth in our growth industries Global expertise delivered locally Construction Financial inst. Marine Energy Selected Willis industry practices Right geographies ~ 800 producers, 6,000 associates delivering industry and product specific solutions to our clients 110 locations, broad geographic reach with ability to connect with Willis International network. Investor Conference, New York, July 30, 2013 8 Aerospace Real estate / hotels Retail Healthcare |
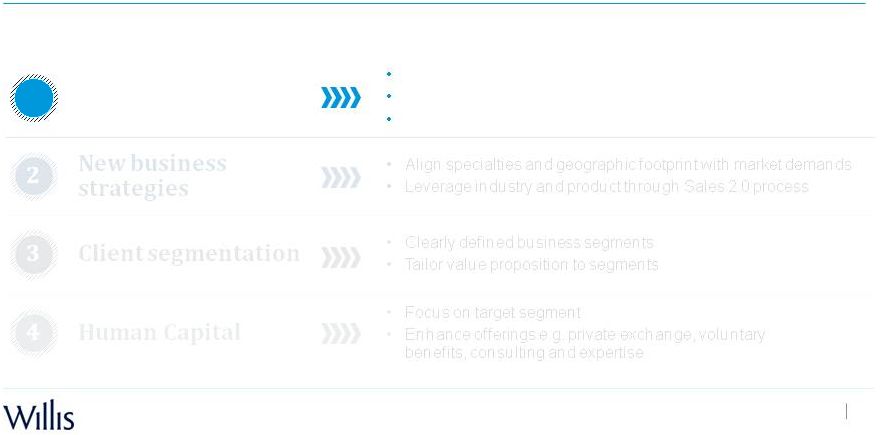
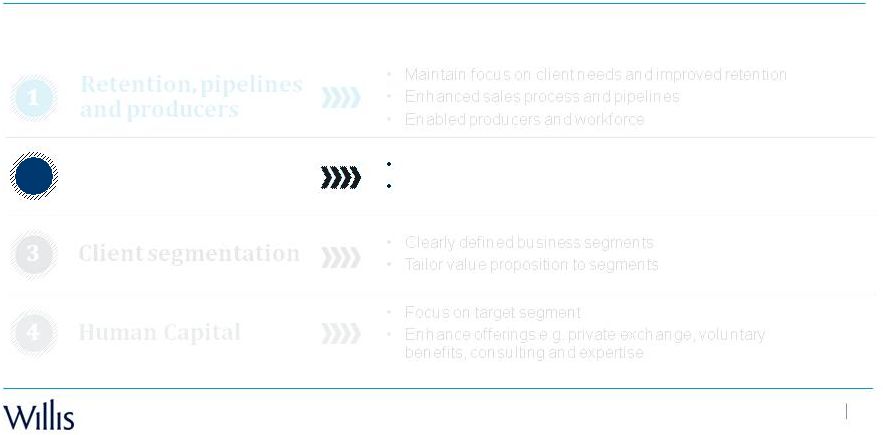
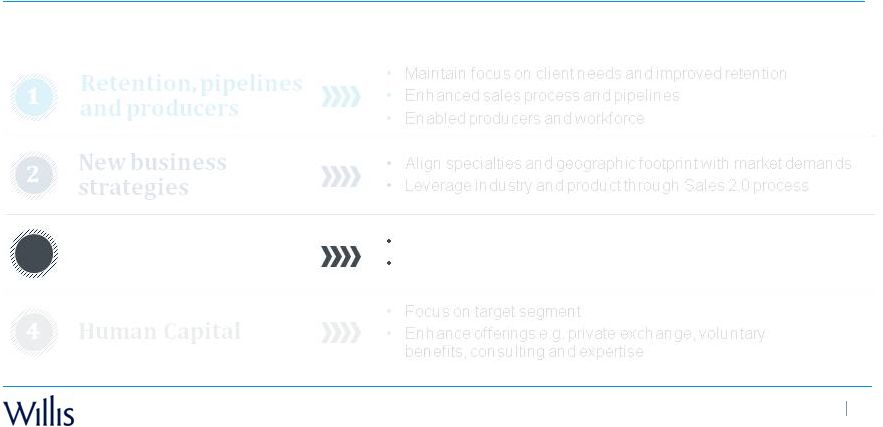
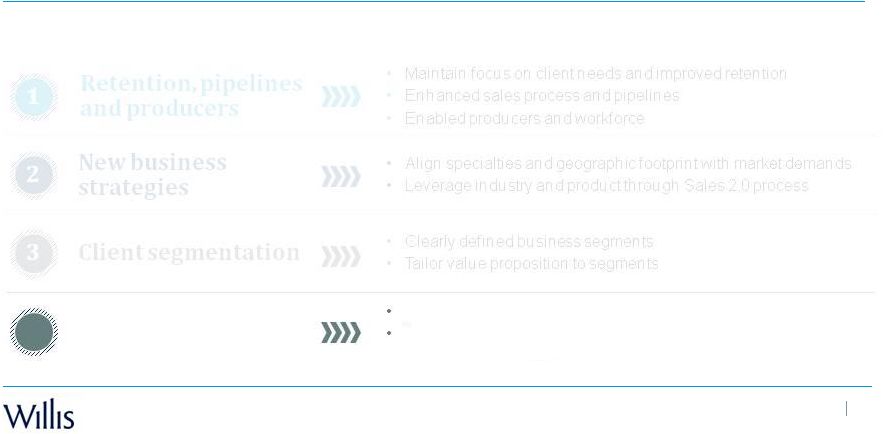
 Sustaining and building upon recent performance Our strategy consists of four key levers: Retention, pipelines and producers Maintain focus on client needs and improved retention Enhanced sales process and pipelines Enabled producers and workforce 1 New business strategies Align specialties and geographic footprint with market demands Leverage industry and product through Sales 2.0 process 2 Client segmentation Clearly defined business segments Tailor value proposition to segments 3 Human Capital Focus on target segment Enhance offerings e.g. private exchange, voluntary benefits, consulting and expertise 4 Investor Conference, New York, July 30, 2013 9 |
 Sustaining and building upon recent performance Our strategy consists of four key levers: Investor Conference, New York, July 30, 2013 10 Retention, pipelines and producers Maintain focus on client needs and improved retention Enhanced sales process and pipelines Enabled producers and workforce 1 |
 Strengthening the basics of our business Client retention Service excellence Responsive and collaborative Accuracy and timeliness Pipelines Robust pipelines Meaningful sales metrics and reporting Producers Improved sourcing Enhanced onboarding Strong sales leadership Sales process Expertise management Investor Conference, New York, July 30, 2013 11 |
 New business strategies • Align specialties and geographic footprint with market demands • Leverage industry and product through Sales 2.0 process 2 Sustaining and building upon recent performance Our strategy consists of four key levers: Investor Conference, New York, July 30, 2013 12 |
 Comprehensive listing of industries and sub-industries Investor Conference, New York, July 30, 2013 13 Growth potential Industries and sub- industries that will drive highest future growth in the market Expertise as key differentiator Industries where expertise is critical to compete successfully Competitive position & current capabilities Prioritization based on current competitive position and current capabilities …within selected geographies Industry A Industry B Industry C Industry D Illustrative Analysis of industry looking at growth, expertise and our competitive positioning, and geographies A B C |
 Client segmentation Clearly defined business segments Tailor value proposition to segments Our strategy consists of four key levers: Investor Conference, New York, July 30, 2013 14 Sustaining and building upon recent performance 3 |
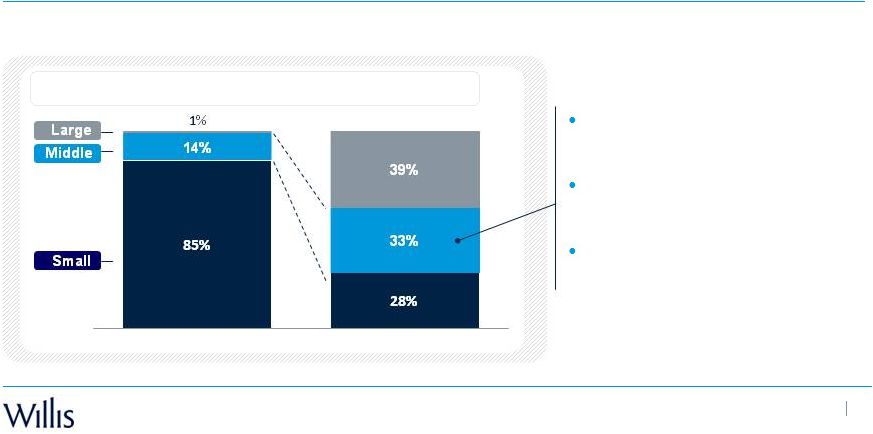
 Key growth levers: Deepen value proposition and expertise delivery in large and middle market accounts in major growth areas Bring more expertise through the specialties to the middle market segment Manage small and large / middle market account businesses with more distinctive value propositions Raise aspirations and focus in Human Capital Investor Conference, New York, July 30, 2013 15 Client-focused segmentation and enhanced expertise delivery will drive continued growth 1 3 2 4 |
 Human Capital Focus on target segment Enhance offerings e.g. private exchange, voluntary benefits, consulting and expertise Sustaining and building upon recent performance Our strategy consists of four key levers: Investor Conference, New York, July 30, 2013 16 Sustaining and building upon recent performance 4 |
 Annual market opportunity: Revenues Employers Willis HCP has ~1.5% to 2% of a highly fragmented market Of the middle market, Willis has ~3% to 4% penetration Focus of effort is on the ~$5 to $6b middle-market segment Investor Conference, New York, July 30, 2013 17 (1) Employers of 10+ employees Source: US Census Bureau of Labor Statistics & Willis management analysis Position in the ~$18 to $20b human capital market provides significant opportunity 100% = $18-$20b 1.2m 1 |
 Small 25 - 99 Middle 100 - 2.9K Large 3K - 10K Very large 10K+ Very small 0 - 24 Current clients A growth business uniquely positioned to win Client headcount A strong foundation… • Global footprint / strong local market presence • Regional subject matter experts in partnership with local service teams Expanded consulting value proposition to address mid-market human capital risks… • Significant HR consulting services • Strong expertise on healthcare reform • Data analytics and reporting • Health outcomes strategies to address rising healthcare costs Differentiated delivery model… • Repeatable, efficient delivery model that provides an expanded offering for the cost • Innovative e.g. private exchange, Xchange app, Willis advantage Why Willis is positioned to win Growth focus Investor Conference, New York, July 30, 2013 18 1 2 3 A growth business uniquely positioned to win |
 Key takeaways Business has stabilized and returned to consistent performance Strong foundations Significant opportunity in North America for Willis Growth with discipline Significant opportunity working more closely with global specialty Unique positioning in growing fragmented human capital market Investor Conference, New York, July 30, 2013 19 Key takeaways 1 2 3 4 5 6 |
 Willis International Tim Wright CEO Willis International Investor Conference, New York, July 30, 2013 |
 Key points 2 Investor Conference, New York, July 30, 2013 Questions Answers Improving margins Goals Consistent revenue growth in the 4-6% range Quarterly volatility Growth in challenged markets Expanding margin while growing Annual growth Turnaround Share gain Portfolio mix Portfolio mix Productivity Shared services Key points |
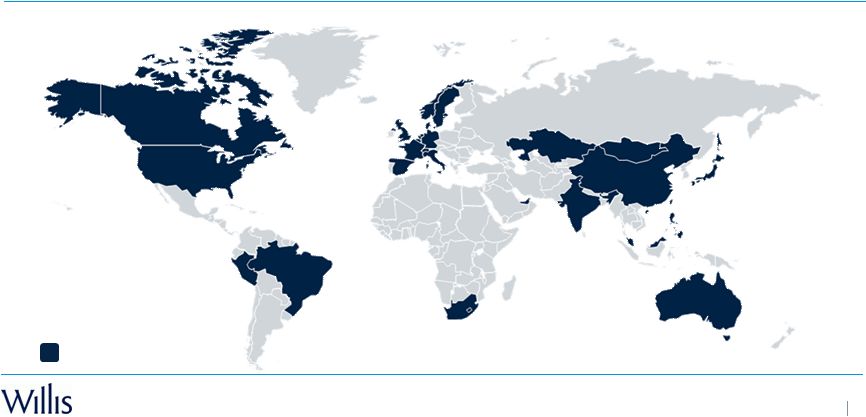
 Overview 3 Investor Conference, New York, July 30, 2013 Willis International Associates and correspondents Overview |
 4 Investor Conference, New York, July 30, 2013 $1 billion in revenues 7,000 associates 170 locations 43 countries Overview |
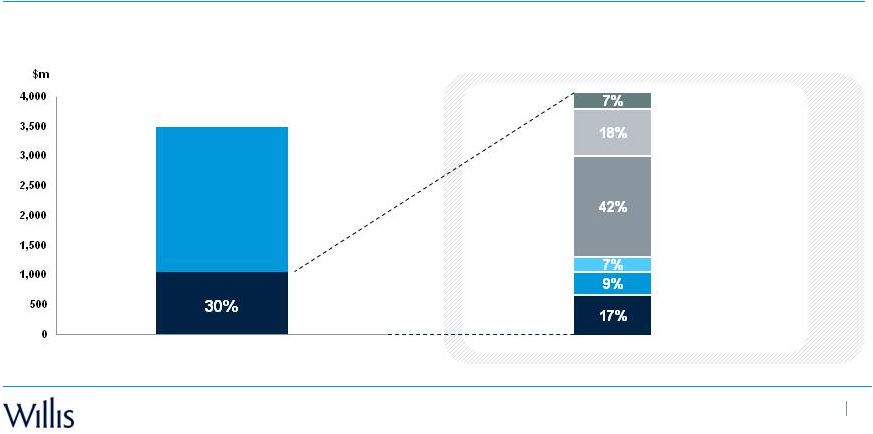
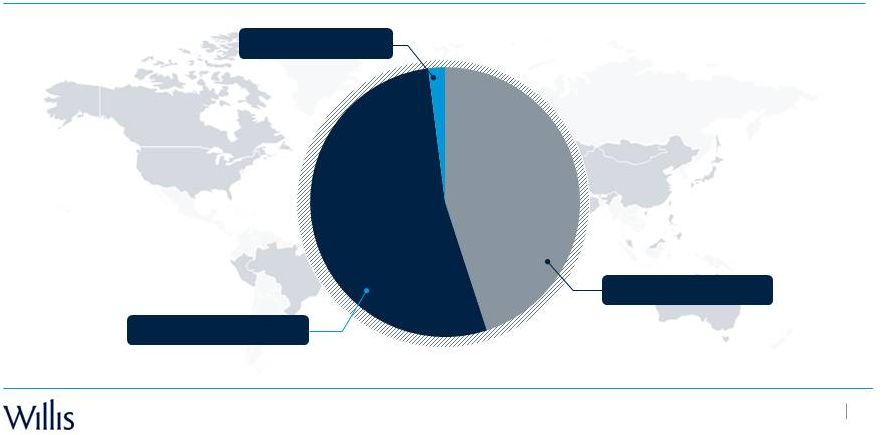
 Overview 5 Investor Conference, New York, July 30, 2013 International C&F 2012: $1 billion Overview CEMEA Western Europe Asia Latin America Australasia UK 7% 18% 17% 42% 7% 9% |
 6 Investor Conference, New York, July 30, 2013 Overview Property & casualty Employee benefits 83% 17% Affinity Small commercial Middle market Large accounts 7% 10% 50% 33% Consistent growth Expert capabilities |
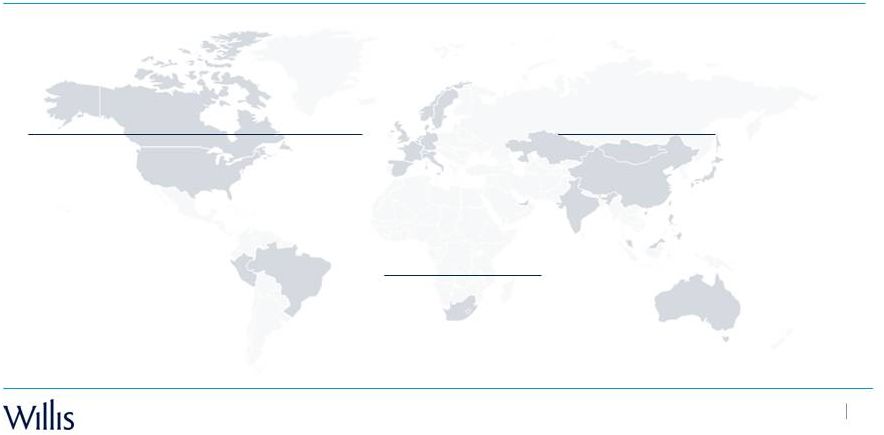
 International share of Group revenue 2012 Contribution to Group 7 Investor Conference, New York, July 30, 2013 W.Europe Asia Latin America Australasia UK CEMEA Contribution to Group |
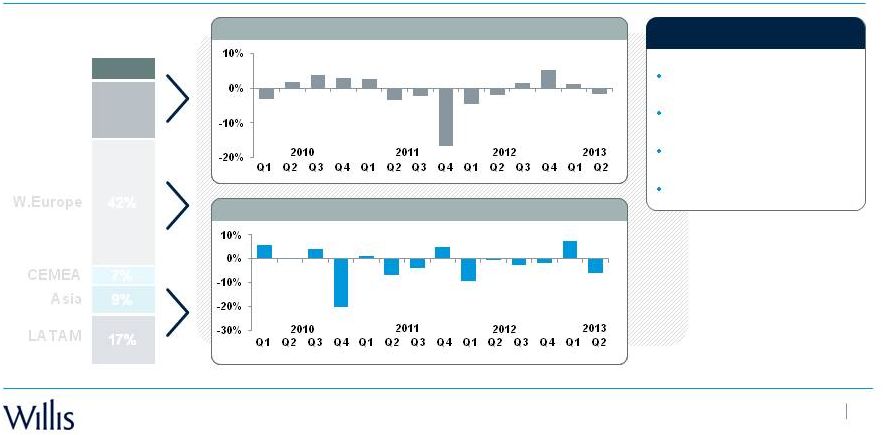
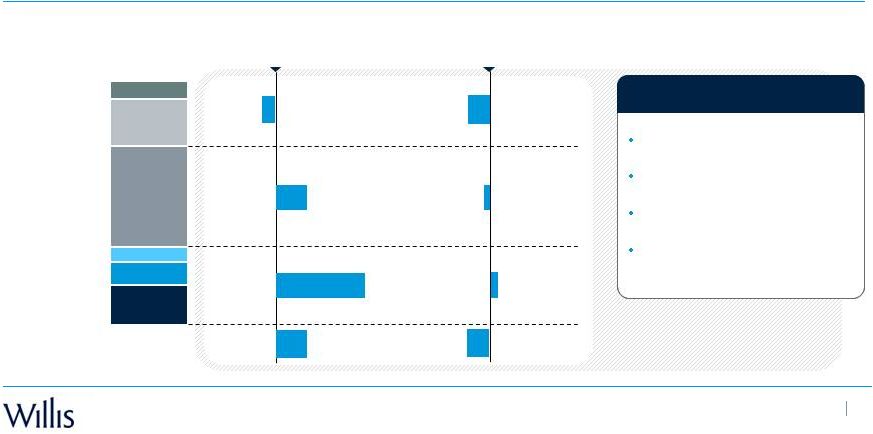 8 Investor Conference, New York, July 30, 2013 -2% +4% +17% +5% -3% -1% +1% Total -3% W.Europe Asia Latin America Australasia UK CEMEA % C&F growth 2008-12 Change in operating margin 2008-12 Segmentation / productivity Shared services / hubbing Centers of excellence Portfolio review 18% 42% 9% 17% Margin actions 2012 Mix 1 (1) Internal reporting basis, which excludes foreign exchange movements, stock-based compensation, and certain other items 7% 7% Financial performance |
 Growth strategies 9 Investor Conference, New York, July 30, 2013 Turnaround Share gain Portfolio mix Australasia UK 7% 18% Asia LATAM CEMEA 7% 9% 17% 42% W.Europe 2012 Mix |
 Growing through turnaround 10 Investor Conference, New York, July 30, 2013 Australasia UK 7% 18% 2012 Mix Leadership changes Portfolio review Retention & sales Selective hires Turnaround actions UK C&F growth (%) Australasia C&F growth (%) |
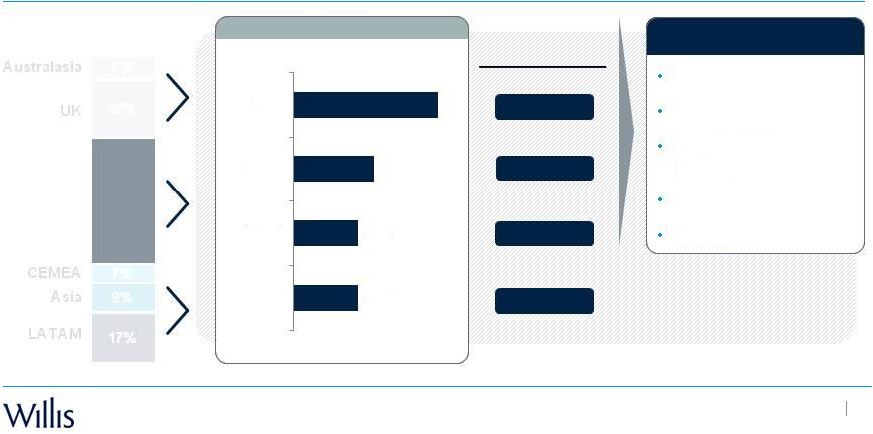 11 Investor Conference, New York, July 30, 2013 W.Europe 42% 3% 5% 10% 23% Est. Market share 2012 Mix Source: Finaccord and Willis management analysis Growth through share gain Leadership Connecting with Group Selective hires / investments Affinity Innovation Average 2008-2012 C&F growth (%) Share gain actions 4% 4% 5% 9% Denmark Germany Spain Italy |
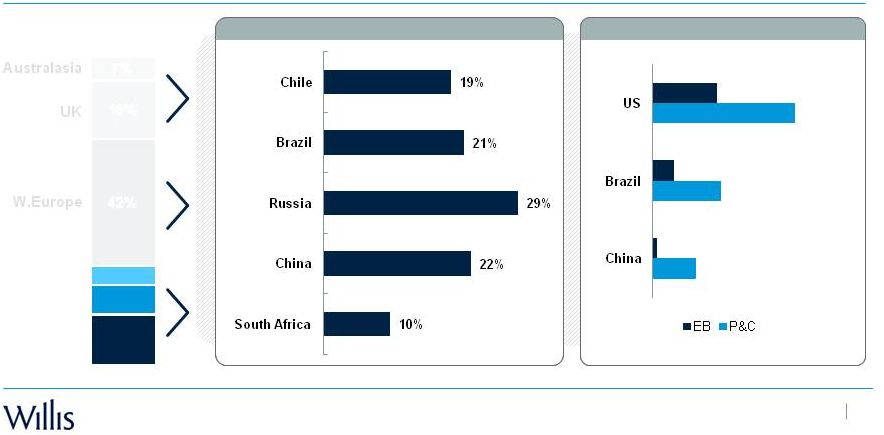 Growth through portfolio mix 12 Investor Conference, New York, July 30, 2013 Asia LATAM CEMEA 7% 9% 17% Insurance penetration (% GDP) 3.3% 1.5% 0.5% 1.6% 1.0% 0.1% 2012 Mix Source: AXCO, Insurance Intelligence Centre, Willis Management Analysis Average 2008-2012 C&F growth (%) |
 13 Investor Conference, New York, July 30, 2013 Growth through portfolio mix Build out infrastructure Joint planning with specialisms Selective acquisitions Investment hires 32% LATAM Asia LATAM CEMEA 45%+ Portfolio mix actions Indicative 2017 2012 Mix Asia CEMEA |
 14 Investor Conference, New York, July 30, 2013 Growth strategy Themes Turnaround Share gain Portfolio mix Connecting Innovating Investing Key takeaways 1 2 3 3 2 1 |
 Willis Global Steve Hearn Chairman and Chief Executive Officer, Willis Global, Deputy CEO Willis Group Holdings plc Investor Conference, New York, July 30, 2013 |
 Key takeaways Targeted investment Capitalizing on analytical broker Connection Investor Conference, New York, July 30, 2013 2 |
 Willis Global – a strong diversified business Willis Global presence Investor Conference, New York, July 30, 2013 3 |
 Willis Global – a strong diversified business $1.1 billion in revenues globally 3,600 associates 170+ countries Investor Conference, New York, July 30, 2013 4 |
 Broad complementary businesses Capital markets Specialty insurance Treaty reinsurance Investor Conference, New York, July 30, 2013 5 45% 53% 2% |
 Organic C&F growth Operating margin Strong performance record Investor Conference, New York, July 30, 2013 6 2% 4% 7% 7% 6% 7% 2008 2009 2010 2011 2012 H1 2013 29% 31% 32% 33% 33% 40% 2008 2009 2010 2011 2012 H1 2013 |
 Building on leadership positions • One of the world’s largest reinsurance brokers • Ability to take share countering cyclical rate softening • Significant player in major markets, but room to grow • Complete range of transactional capabilities, including new capital intermediation • Cutting edge integrated analytical and advisory services • Willis Research Network – intellectual capital and connections from insurance industry’s largest partnership with leading academics Investor Conference, New York, July 30, 2013 7 |
 Talent Technology M&A Targeted investment Investor Conference, New York, July 30, 2013 8 |
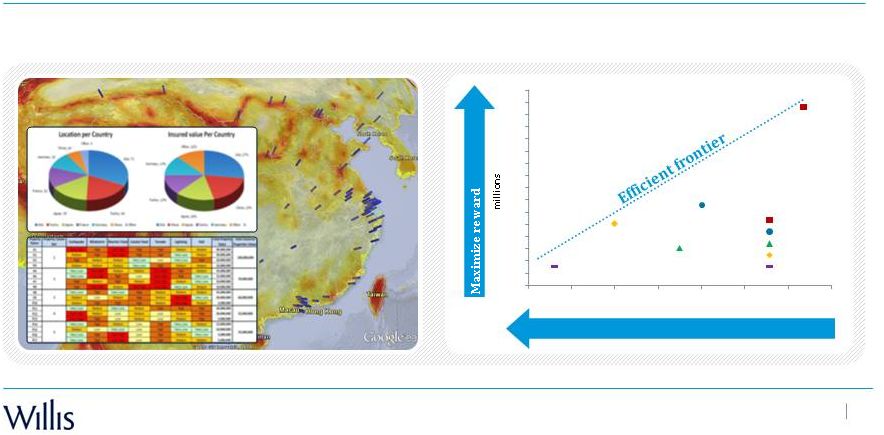 Innovation through analytics Investor Conference, New York, July 30, 2013 9 Example natural hazards assessment Minimize risk 1.00 1.25 1.50 1.75 2.00 2.25 2.50 0.00 0.25 0.50 0.75 -1.00 -0.75 -0.50 -0.25 15.00 17.50 20.00 22.50 25.00 27.50 millions Gross 1: xs $3m 2: xs $2m swing 3: xs $2m 4: xs $1.5m |
 Terrorism scenarios Innovation through analytics • Ad hoc Realistic Disaster Scenarios (RDS) • Created around client exposure • Transparency on assumptions Investor Conference, New York, July 30, 2013 10 |
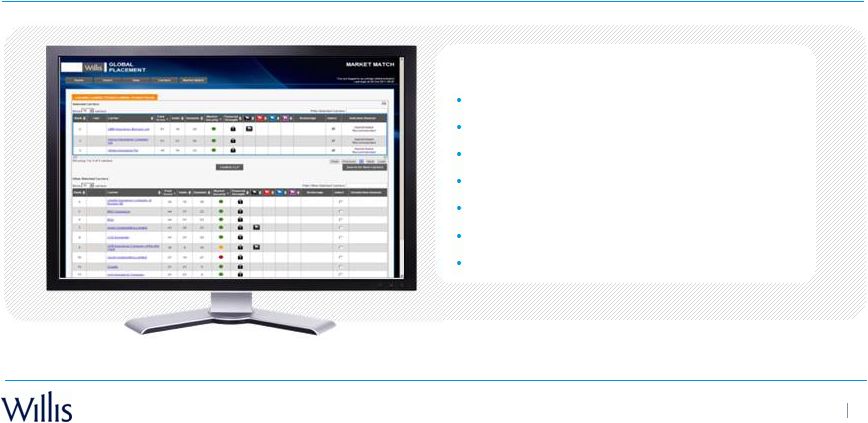 Analytical broker: WillPLACE What makes WillPLACE different? Client-centric Carrier appetite Market security Willis Quality Index Factors beyond price Trading history Peer group knowledge Investor Conference, New York, July 30, 2013 11 |
 New capital Investor Conference, New York, July 30, 2013 12 |
        Connection Global Airline Client Marine & energy Construction Financial & executive risks Financial solutions Wholesale and facultative solutions Fine art, jewelry and specie, bloodstock and kidnap & ransom Aerospace Willis Aerospace Hull Insurance Investor Conference, New York, July 30, 2013 13 Car fleets Human capital Board D&O risks Real estate |
 Key takeaways Targeted investment Capitalizing on analytical broker Connection Investor Conference, New York, July 30, 2013 14 |
 Investor Conference July 30, 2013 I New York Willis Group Holdings plc. |
 Appendix Investor Conference, New York, July 30, 2013 |
 Important disclosures regarding Non-GAAP measures These presentations contain references to "non-GAAP financial measures" as defined in Regulation G of SEC rules. We present these measures because we believe they are of interest to the investment community and they provide additional meaningful methods of evaluating certain aspects of the Company’s operating performance from period to period on a basis that may not be otherwise apparent on a generally accepted accounting principles (GAAP) basis. These financial measures should be viewed in addition to, not in lieu of, the Company’s condensed consolidated income statements and balance sheet as of the relevant date. Consistent with Regulation G, a description of such information is provided below and a reconciliation of certain of such items to GAAP information can be found in our periodic filings with the SEC. Our method of calculating these non-GAAP financial measures may differ from other companies and therefore comparability may be limited. Adjusted operating income is defined as operating income, excluding certain items as set out on page 3. Adjusted operating margin is defined as the percentage of adjusted operating income to total revenues. Adjusted net income is defined as net income, excluding certain items. Adjusted earnings per share (Adjusted EPS) is defined as adjusted net income per diluted share. Adjusted EBITDA is defined as Adjusted operating income, excluding depreciation and amortization as set out on page 4. Organic commissions & fees growth excludes: (i) the impact of foreign currency translation; (ii) the first twelve months of net commission and fee revenues generated from acquisitions; and (iii) the net commission and fee revenues related to operations disposed of in each period presented, as set out on pages 7 and 8. Reconciliations to GAAP measures are provided for selected non-GAAP measures. Investor Conference, New York, July 30, 2013 2 |
 See related footnotes on page 24 Important disclosures regarding Non-GAAP measures (cont) Operating Income (loss) to Adjusted Operating Income (In millions) 2007 FY 2008 FY 2009 FY 2010 FY 2011 FY 2012 FY Operating Income $620 $503 $690 $753 $566 ($209) - Excluding: - Goodwill impairment charge (a) - - - - - 492 - Write-off of unamortized cash retention awards (b) - - - - - 200 - 2012 cash bonus accrual (c) - - - - - 252 - Insurance recovery (d) - - - - - (10) - Write-off of uncollectible accounts receivable and legal fees (e) - - - - 22 13 - India JV settlement (f) - - - - - 11 - 2011 Operational review (g) - - - - 180 - - Financial Services Authority regulatory settlement - - - - 11 - - Venezuela currency devaluation (h) - - - 12 - - - Net (gain)/loss on disposal of operations (2) - (13) 2 (4) 3 - Salaries and benefits – severance programs (i) - 24 - - - - - Salaries and benefits – other (j) - 42 - - - - - HRH integration costs (k) - 5 18 - - - - Other operating expenses (l) - 26 - - - - - Accelerated amortization of intangibles assets (m) - - 7 - - - - Redomicile costs (n) - - 6 - - - Adjusted Operating Income $618 $600 $708 $767 $775 $752 Operating Margin 24.0% 17.8% 21.2% 22.6% 16.4% (6.0%) Adjusted Operating Margin 24.0% 21.2% 21.8% 23.0% 22.5% 21.6% Investor Conference, New York, July 30, 2013 3 |
 Important disclosures regarding Non-GAAP measures (cont) Adjusted EBITDA and Debt/Adjusted EBITDA Operating Income $620 $503 $690 $753 $566 ($209) ($247) - Excluding: - Expense reduction initiative - - - - - - 46 - Goodwill impairment charge (a) - - - - - 492 492 - Write-off of unamortized cash retention awards (b) - - - - - 200 200 - 2012 cash bonus accrual (c) - - - - - 252 252 - Insurance recovery (d) - - - - - (10) -5 - Write-off of uncollectible accounts receivable and legal fees (e) - - - - 22 13 - - India JV settlement (f) - - - - - 11 11 - 2011 Operational review (g) - - - - 180 - - - Financial Services Authority regulatory settlement - - - - 11 - - - Venezuela currency devaluation (h) - - - 12 - - - - Net (gain)/loss on disposal of operations (2) - (13) 2 (4) 3 3 - Salaries and benefits - severance programs (i) - 24 - - - - - - Salaries and benefits – other (j) - 42 - - - - - - HRH integration costs (k) - 5 18 - - - - - Other operating expenses (l) - 26 - - - - - - Accelerated amortization of intangibles assets (m) - - 7 - - - - - Redomicile costs (n) - - 6 - - - - Adjusted Operating Income $618 $600 $708 $767 $775 $752 $752 Add back Depreciation 52 54 64 63 69 79 83 Amortization of intangibles 14 36 93 82 68 59 57 Adjusted EBITDA $684 $690 $865 $912 $912 $890 $892 Debt 1,250 2,650 2,374 2,267 2,369 2,353 2,343 Debt / Adjusted EBITDA 1.8x 3.8x 2.7x 2.5x 2.6x 2.6x 2.6x Investor Conference, New York, July 30, 2013 4 See related footnotes on page 24 (In millions) 2007 FY 2008 FY 2009 FY 2010 FY 2011 FY 2012 FY 1H13 LTM |
 (a) Impairment charge to reduce carrying value of North America segment goodwill. (b) Charge to write-off unamortized balance of past cash retention awards related to change in remuneration policy (c) Accrual for 2012 bonuses paid in 2013 related to change in remuneration policy (d) Insurance recovery related to (e) below (e) Write-off of uncollectible accounts receivable balance, together with associated legal costs (f) Settlement with former partners related to the termination of a joint venture arrangement in India. (g) $180 million pre-tax charge in FY2011 relating to the 2011 operational review, including $98 million of severance costs relating to the elimination of approximately 1,200 positions in FY2011. (h) With effect from January 1, 2010, the Venezuelan economy was designated as hyper-inflationary. The Venezuelan government also devalued the Bolivar Fuerte in January 2010. As a result of these actions, the Company recorded a one-time charge in other expenses to reflect the re-measurement of its net assets denominated in Venezuelan Bolivar Fuerte. Notes to the GAAP to non-GAAP reconciliations i) Severance costs excluded from adjusted operating income and adjusted net income in 2008 relate to approximately 350 positions through the year ended December 31, 2008 that were eliminated as part of the 2008 expense review. Severance costs also arise in the normal course of business and these charges (pre-tax) amounted to $6 million, $nil, $15 million, $24 million and $2 million for the years ended December 31, 2012, 2011, 2010, 2009 and 2008, respectively. j) Other 2008 expense review salaries and benefits costs relate primarily to contract buyouts. k) 2009 HRH integration costs include $nil million severance costs ($2 million in 2008). l) Other operating expenses primarily relate to property and systems rationalization. m) The charge for the accelerated amortization for intangibles relates to the HRH brand name. Following the successful integration of HRH into our North American operations, we announced on October 1, 2009 that our North America retail operations would change their name from Willis HRH to Willis North America. Consequently, the intangible asset recognized on the acquisition of HRH relating to the HRH brand has been fully amortized. n) These are legal and professional fees incurred as part of the Company’s redomicile of its parent Company from Bermuda to Ireland. Investor Conference, New York, July 30, 2013 5 |
 Important disclosures regarding Non-GAAP measures (cont) Cash flow from operating activities before pension funding (In millions) 2007 2008 2009 2010 2011 2012 Cash from operating activities before pension funding 478 407 501 619 574 668 Funding of defined pension benefit plans (203) (154) (82) (130) (135) (143) Cash flow from operating activities 275 253 419 489 439 525 Investor Conference, New York, July 30, 2013 6 |
 (In millions) 2004 2005 2006 2007 2008 2009 2010 2011 2012 Reported growth 10% 0% 7% 6% 12% 17% 3% 4% 1% Acquisitions & Disposals / other 4% 1% 1% 1% 7% 19% 0% 0% 0% Foreign Currency Movements 2% 0% 0% 2% 1% (4)% (1)% 2% (2)% Organic growth 4% (1)% 8% 3% 4% 2% 4% 2% 3% Investor Conference, New York, July 30, 2013 7 Important disclosures regarding Non-GAAP measures (cont) Willis Group Commissions and Fees Growth |
 Important disclosures regarding Non-GAAP measures (cont) Commissions and Fees Growth by Segment 2008 2009 2010 2011 2012 H1-13 Willis Global Reported Growth 5% 5% 7% 9% 5% 6% Acquisitions & Disposals / other 3% 4% - - - - Foreign Currency Movements - -3% - 2% -1% -1% Organic Growth 2% 4% 7% 7% 6% 7% Willis International Reported Growth 10% -3% 4% 10% - 3% Acquisitions & Disposals / other - 1% 1% - - - Foreign Currency Movements 1% -8% -2% 5% -5% - Organic Growth 9% 4% 5% 5% 5% 3% Willis North America Reported Growth 21% 51% -1% -4% -1% 6% Acquisitions & Disposals / other 22% 54% -1% - - 1% Foreign Currency Movements - - - - - - Organic Growth -1% -3% - -4% -1% 5% Investor Conference, New York, July 30, 2013 8 See related footnotes on page 24 |