|
Exhibit 99.2 
|
Exhibit 99.2
Willis Group Holdings
SECOND QUARTER 2014
RESULTS
July, 2014
Important disclosures regarding forward-looking statements
This presentation contains certain “forward-looking statements” within the meaning of Section 27A of the Securities Act of 1933, and Section 21E of the Securities Exchange Act of 1934,
hi h i d d b db h f h b db h which are intended to be covered by the safe harbors created by those laws. These forward-looking statements include information about possible or assumed future results of our
operations.
All statements, other than statements of historical facts, included in this document that address activities, events or developments that we expect or anticipate may occur in the future,
including such things as our outlook, potential cost savings and accelerated adjusted operating margin and adjusted earnings per share growth, future capital expenditures, growth in
commissions and fees, business strategies, competitive strengths, goals, the benefits of new initiatives, growth of our business and operations, plans, and references to future successes
are forward-looking statements. Also, when we use the words such as ‘anticipate’, ‘believe’, ‘estimate’, ‘expect’, ‘intend’, ‘plan’, ‘probably’, or similar expressions, we are making forwardlooking
statements.
There are important uncertainties, events and factors that could cause our actual results or performance to differ materially from those in the forward-looking statements contained in this
document, including the following: the impact of any regional, national or global political, economic, business, competitive, market, environmental or regulatory conditions on our global
business operations; the impact of current global economic conditions on our results of operations and financial condition, including as a result of those associated with the Eurozone, any
insolvencies of or other difficulties experienced by our clients, insurance companies or financial institutions; our ability to implement and fully realize anticipated benefits of our new growth
strategy and revenue generating initiatives; our ability to implement and realize anticipated benefits of any expense reduction initiative, including our ability to achieve expected savings
from the multi-year operational improvement program as a result of unexpected costs or delays and demand on managerial, operational and administrative resources and/or
macroeconomic factors affecting the program; changes in the tax or accounting treatment of our operations and fluctuations in our tax rate; volatility or declines in insurance markets and
premiums on which our commissions are based, but which we do not control; our ability to develop and implement technology solutions and invest in innovative product offerings in an
efficient and effective manner; our ability to continue to manage our significant indebtedness; our ability to compete in our industry; our ability to develop new products and services;
material changes in commercial property and casualty markets generally or the availability of insurance products or changes in premiums resulting from a catastrophic event, such as a
hurricane; our ability to retain key employees and clients and attract new business; the timing or ability to carry out share repurchases and redemptions; the timing or ability to carry out
refinancing or take other steps to manage our capital and the limitations in our long-term debt agreements that may restrict our ability to take these actions; fluctuations in our earnings as a
result of potential changes to our valuation allowance(s) on our deferred tax assets; any fluctuations in exchange and interest rates that could affect expenses and revenue; the potential
costs and difficulties in complying with a wide variety of foreign laws and regulations and any related changes, given the global scope of our operations; rating agency actions, including a
downgrade to our credit rating, that could inhibit our ability to borrow funds or the pricing thereof and in certain circumstances cause us to offer to buy back some of our debt; a significant
decline in the value of investments that fund our pension plans or changes in our pension plan liabilities or funding obligations; •our ability to achieve anticipated benefits of any acquisition
or other transactions in which we may engage, including any revenue growth or operational efficiencies; our ability to effectively integrate any acquisition into our business; our inability to
exercise full management control over our associates, such as Gras Savoye; our ability to receive dividends or other distributions in needed amounts from our subsidiaries; any potential
impact from the US healthcare reform legislation; our involvement in and the results of any regulatory investigations, legal proceedings and other contingencies; underwriting, advisory or
reputational risks associated with non-core operations as well as the potential significant impact our non-core operations (including the Willis Capital Markets & Advisory operations) can
have on our financial results; our exposure to potential liabilities arising from errors and omissions and other potential claims against us; the interruption or loss of our information
processing systems, data security breaches or failure to maintain secure information systems; and impairment of the goodwill in one of our reporting units, in which case we may be
required to record significant charges to earnings.
The foregoing list of factors is not exhaustive and new factors may emerge from time to time that could also affect actual performance and results. For additional information see also
Part I, Item 1A “Risk Factors” included in Willis’ Form 10-K for the year ended December 31, 2013, and our subsequent filings with the Securities and Exchange Commission. Copies are
available online at http://www.sec.gov or on request from the Company.
Although we believe that the assumptions underlying our forward-looking statements are reasonable, any of these assumptions, and therefore also the forward-looking statements based
on these assumptions, could themselves prove to be inaccurate. In light of the significant uncertainties inherent in the forward-looking statements included in this presentation, our inclusion
of this information is not a representation or guarantee by us that our objectives and plans will be achieved. Our forward-looking statements speak only as of the date made and we will not
pdate for ard statements nless the sec rities la s req ire s to do so In light of these risks ncertainties and ass mptions for ard e ents disc ssed 1
update these forward-looking unless securities laws require us so. risks, uncertainties assumptions, the forward-looking events discussed in this
presentation may not occur, and we caution you against unduly relying on these forward-looking statements.
Important disclosures regarding non-GAAP measures
This presentation contains references to “non-GAAP financial measures” as defined in Regulation G of SEC rules. We present these measures because we believe they are of interest to the investment community and they provide additional meaningful methods of evaluating certain aspects of the Company’s operating performance from period to period on a basis that may not be otherwise apparent on a generally accepted accounting principles (GAAP) basis. These financial measures should be viewed in addition to, not in lieu of, the Company’s condensed consolidated income statements and balance sheet as of the relevant date. Consistent with Regulation G, a description of such information is provided below and a reconciliation of certain of such items to GAAP information can be found in our periodic filings with the SEC. Our method of calculating these non-GAAP financial measures may differ from other companies and therefore comparability may be limited.
Definitions of non-GAAP financial measures
We believe that investors’ understanding of the Company’s performance is enhanced by our disclosure of the following non-GAAP financial measures. Our method of calculating these measures may differ from those used by other companies and therefore comparability may be limited.
Organic commissions and fees growth
Organic commissions and fees growth excludes: (i) the impact of foreign currency translation; (ii) the first twelve months of net commission and fee revenues generated from acquisitions; and (iii) the net commission and fee revenues related to operations disposed of in each period presented, from reported commissions and fees growth.
We believe organic growth in commissions and fees provides a measure that the investment community may find helpful in assessing the performance of operations that were part of our operations in both the current and prior periods, and provides a measure against which our businesses may be assessed in the future.
Underlying operating income, underlying EBITDA, underlying net income and underlying net income per diluted share
Underlying operating income, underlying EBITDA, underlying net income and underlying net income per diluted share are calculated by excluding the impact of certain items, including foreign currency translation, from operating income, net income and net income per diluted share, respectively, the most directly comparable GAAP measures. We believe that excluding these items, as applicable, from operating income and net income, provides a more complete and consistent comparative analysis of our results of operations.
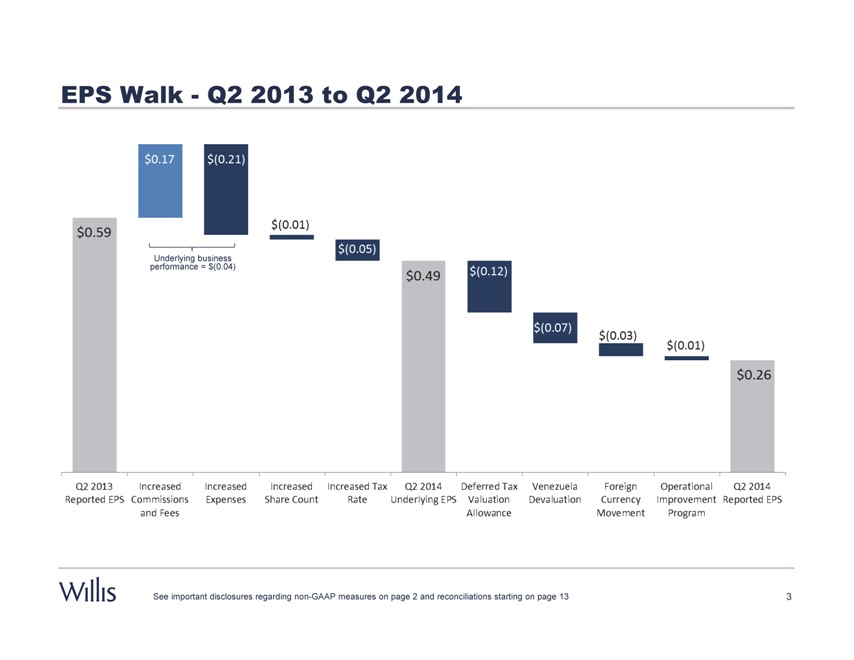
EPS Walk—Q2 2013 to Q2 2014
$0.59 $0.17 $(0.21) $(0.01) $(0.49) $(0.12) $(0.07) $(0.03) $(0.01)$0.26
Underlying business performance s = $(0.04)
Q2 2013 Reported EPS Increased commissions and Fees Increased Expenses Increased Tax Rate Q2 2014 Underlying EPS Deferred Tax Allowance Venezuela Devaluation Foreign Currency Movement Operational Improvement Program Q2 2014 Reported EPS
See important disclosures regarding non-GAAP measures on page 2 and reconciliations starting on page 13
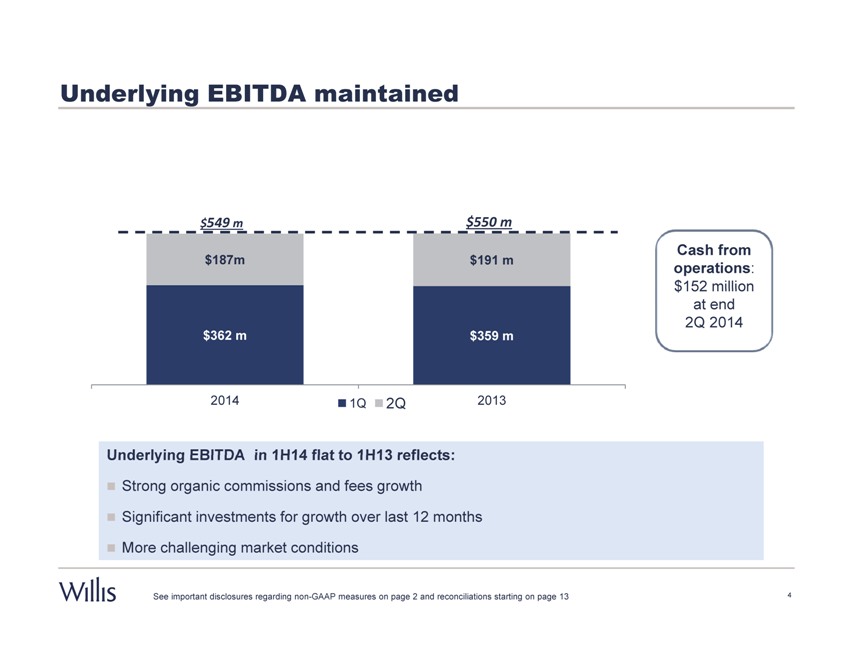
Underlying EBITDA maintained
$549 m $550 m
Cash from
$187m $191 m operations:
$152 million
at end
2Q 2014
$362 m $359 m
2014 1Q 2Q 2013
Underlying EBITDA in 1H14 flat to 1H13 reflects:
Strong organic commissions and fees growth
Significant investments for growth over last 12 months
More challenging market conditions
See important disclosures regarding non-GAAP measures on page 2 and reconciliations starting on page 13
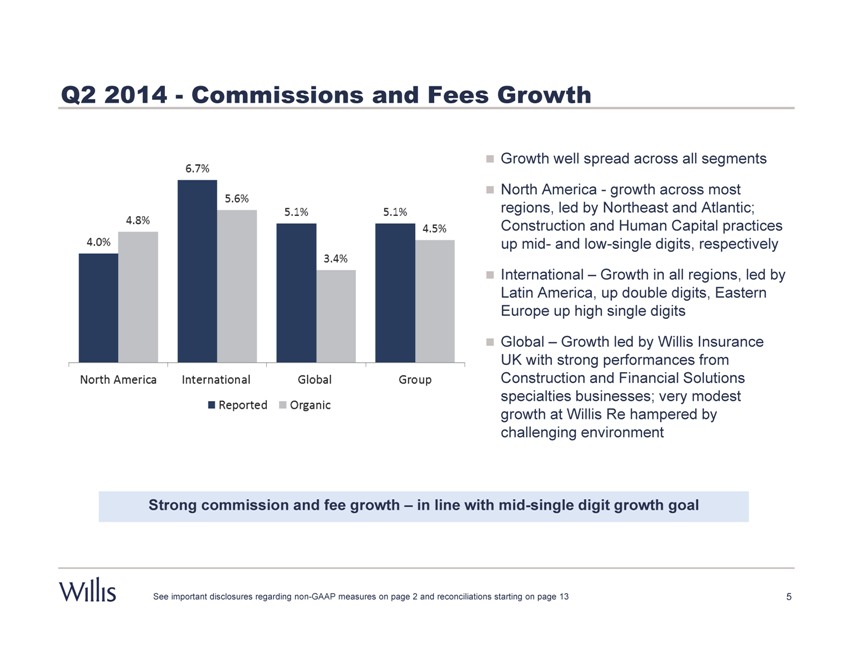
Q2 2014—Commissions and Fees Growth
4.0% 4.8% 6.7% 5.6% 5.1% 3.4% 5.1% 4.5%
North America International Global Group
Growth well spread across all segments
North America—growth across most regions, led by Northeast and Atlantic; Construction and Human Capital practices up mid- and low-single digits, respectively
International – Growth in all regions, led by Latin America, up double digits, Eastern Europe up high single digits
Global – Growth led by Willis Insurance UK with strong performances from Construction and Financial Solutions specialties businesses; very modest growth at Willis Re hampered by challenging environment
Strong commission and fee growth – in line with mid-single digit growth goal
See important disclosures regarding non-GAAP measures on page 2 and reconciliations starting on page 13
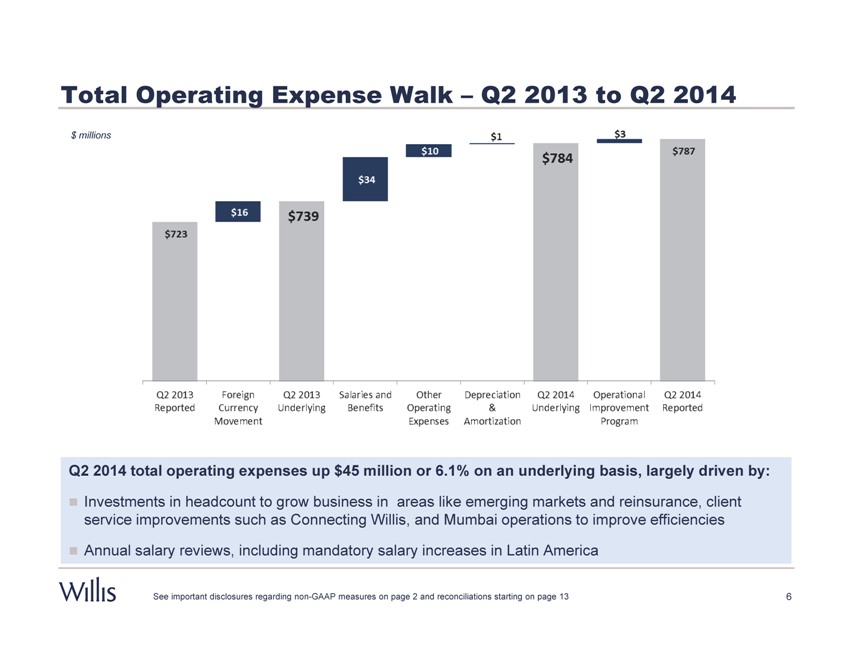
Total Operating Expense Walk – Q2 2013 to Q2 2014
$ millions
$723 $16 $739 $34 $10 $1 $784 $3 $787
Q2 2013 Reported Foreign currency Movement Q2 2013 Underlying Salaries and Benefits Other Operating Expenses
Depreciation & Amortization Q2 2014 underlying Operational Improvement Program Q2 2014 Reported
Q2 2014 total operating expenses up $45 million or 6.1% on an underlying basis, largely driven by:
Investments in headcount to grow business in areas like emerging markets and reinsurance, client service improvements such as Connecting Willis, and Mumbai operations to improve efficiencies
Annual salary reviews, including mandatory salary increases in Latin America
See important disclosures regarding non-GAAP measures on page 2 and reconciliations starting on page 13
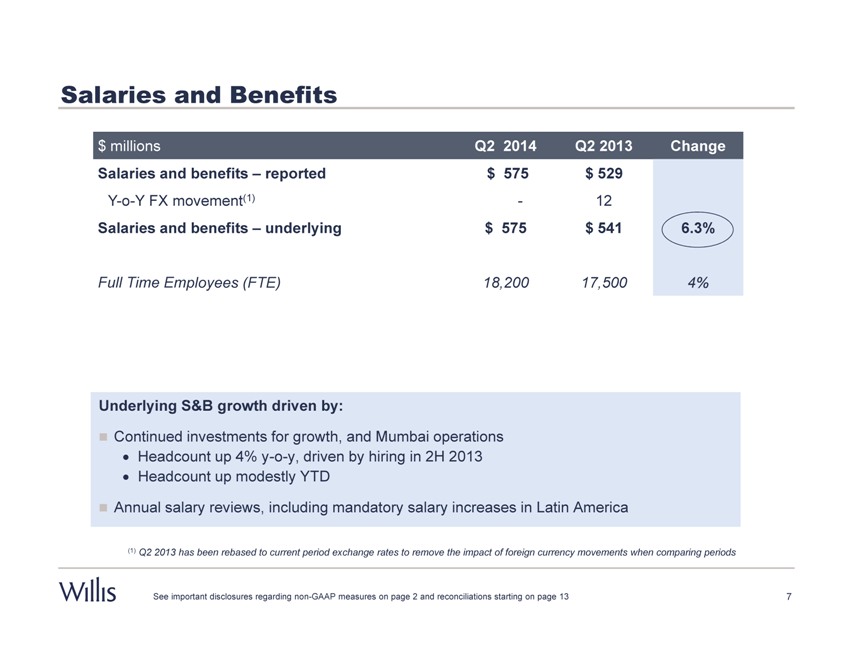
Salaries and Benefits
$ millions Q2 2014 Q2 2013 Change
Salaries and benefits – reported $ 575 $ 529
Y-o-Y FX movement(1) - 12
Salaries and benefits – underlying $ 575 $ 541 6.3%
Full Time Employees (FTE) 18,200 17,500 4%
Underlying S&B growth driven by:
Continued investments for growth, and Mumbai operations
Headcount up 4% y-o-y, driven by hiring in 2H 2013
Headcount up modestly YTD
Annual salary reviews, including mandatory salary increases in Latin America
(1) Q2 2013 has been rebased to current period exchange rates to remove the impact of foreign currency movements when comparing periods
See important disclosures regarding non-GAAP measures on page 2 and reconciliations starting on page 13
7
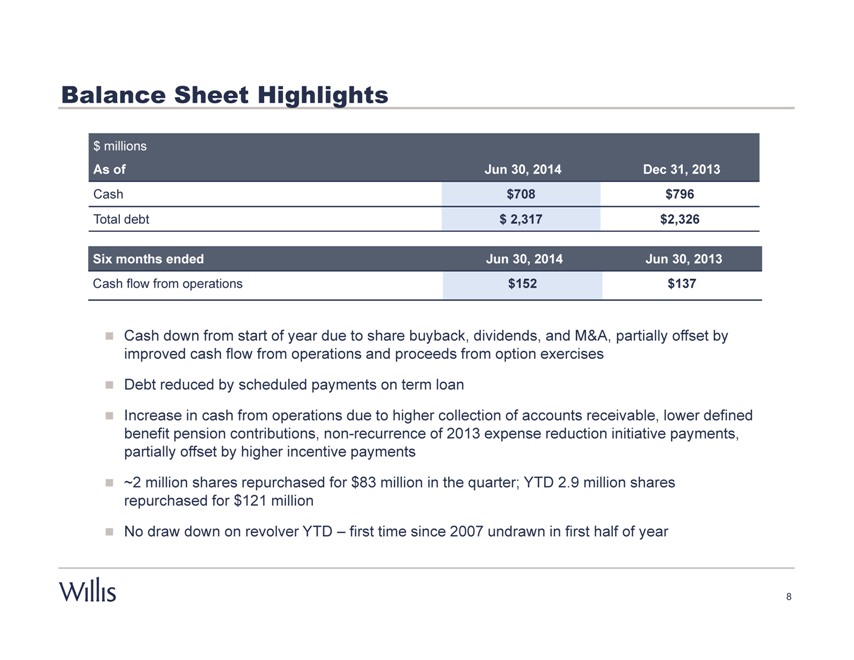
Balance Sheet Highlights
$ millions
As of Jun 30, 2014 Dec 31, 2013
Cash $708 $796
Total debt $ 2,317 $2,326
Six months ended Jun 30, 2014 Jun 30, 2013
Cash flow from operations $152 $137
Cash down from start of year due to share buyback, dividends, and M&A, partially offset by
improved cash flow from operations and proceeds from option exercises
Debt reduced by scheduled payments on term loan
Increase in cash from operations due to higher collection of accounts receivable, lower defined
benefit pension contributions, non-recurrence of 2013 expense reduction initiative payments,
partially offset by higher incentive payments
~2 million shares repurchased for $83 million in the quarter; YTD 2.9 million shares
repurchased for $121 million
No draw down on revolver YTD – first time since 2007 undrawn in first half of year
8
APPENDICES
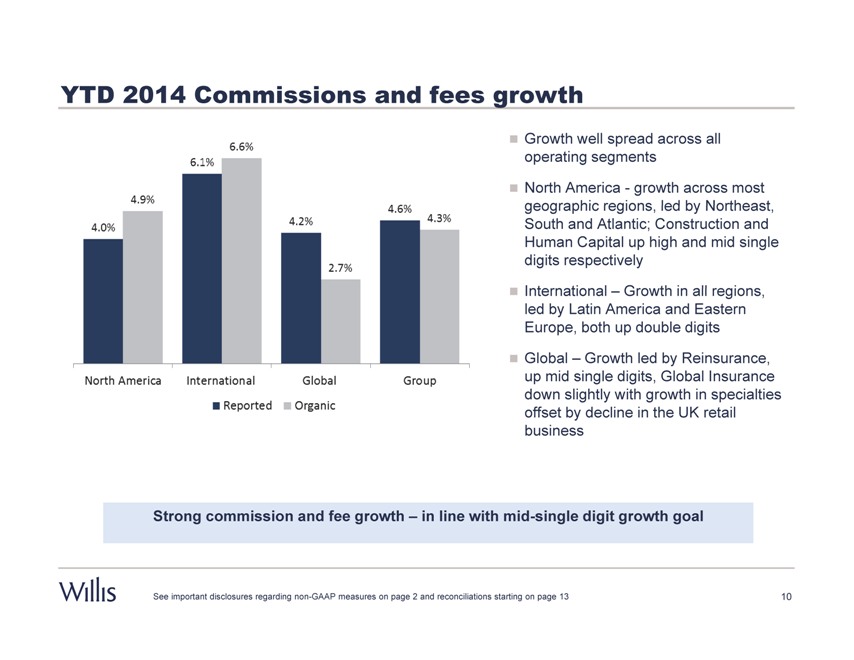
YTD 2014 Commissions and fees growth
4.0%
4.9%
6.1%
6.6%
4.2%
2.7%
4.6%
4.3%
North America
International
Global
Group
Reported
Organic
Growth well spread across all operating segments
North America-growth across most geographic regions, led by Northeast, South and Atlantic; Construction and Human Capital up high and mid single digits respectively
International – Growth in all regions, led by Latin America and Eastern Europe, both up double digits
Global – Growth led by Reinsurance, up mid single digits, Global Insurance down slightly with growth in specialties offset by decline in the UK retail business
Strong commission and fee growth – in line with mid-single digit growth goal
See important disclosures regarding non-GAAP measures on page 2 and reconciliations starting on page 13
10
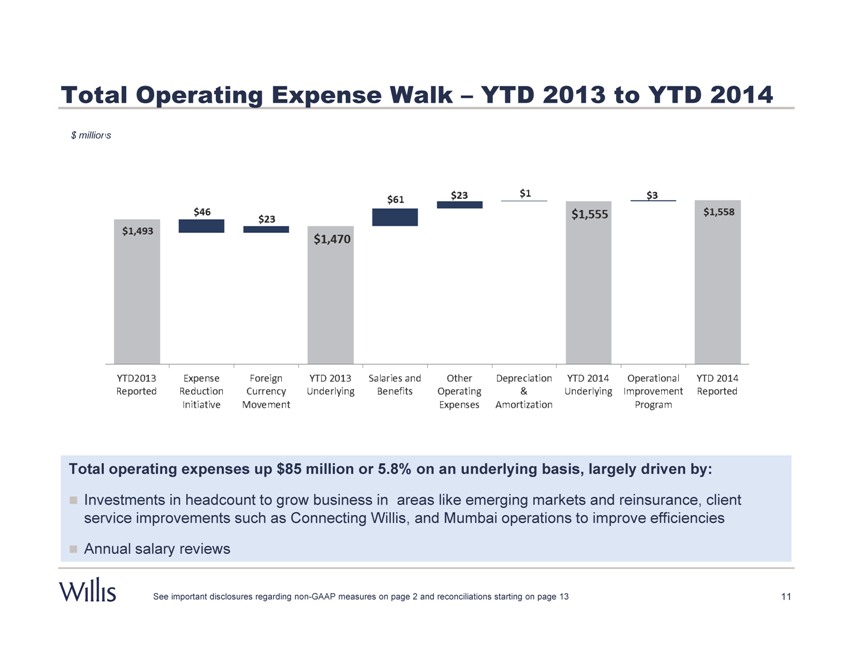
Total Operating Expense Walk – YTD 2013 to YTD 2014
$ millions
$1,493
$46
$23
$1,470 $61 $23 $1 $1,555 $3 $1,558
YTD 2013 Reported
Expense Reduction Initiative
Foreign Currency Movement
YTD 2013 Underlying
Salaries and Benefits
Other Operating Expenses
Depreciation & Amortization
YTD 2014 Underlying
Operational Improvement Program
YTD 2014 Reported
Total operating expenses up $85 million or 5.8% on an underlying basis, largely driven by:
Investments in headcount to grow business in areas like emerging markets and reinsurance, client service improvements such as Connecting Willis, and Mumbai operations to improve efficiencies
Annual salary reviews
See important disclosures regarding non-GAAP measures on page 2 and reconciliations starting on page 13
11
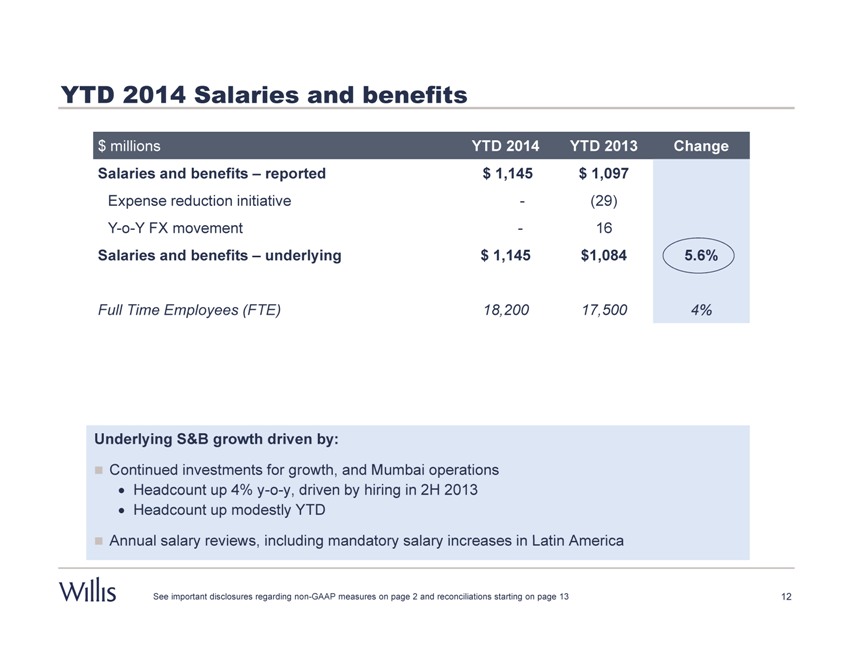
YTD 2014 Salaries and benefits
$ millions YTD 2014 YTD 2013 Change
Salaries and benefits – reported $ 1,145 $ 1,097
Expense reduction initiative - (29)
Y-o-Y FX movement - 16
Salaries and benefits – underlying $ 1,145 $1,084 5.6%
Full Time Employees (FTE) 18,200 17,500 4%
Underlying S&B growth driven by:
Continued investments for growth, and Mumbai operations
Headcount up 4% y-o-y, driven by hiring in 2H 2013
Headcount up modestly YTD
Annual salary reviews, including mandatory salary increases in Latin America
See important disclosures regarding non-GAAP measures on page 2 and reconciliations starting on page 13
12
Important disclosures regarding non-GAAP measures
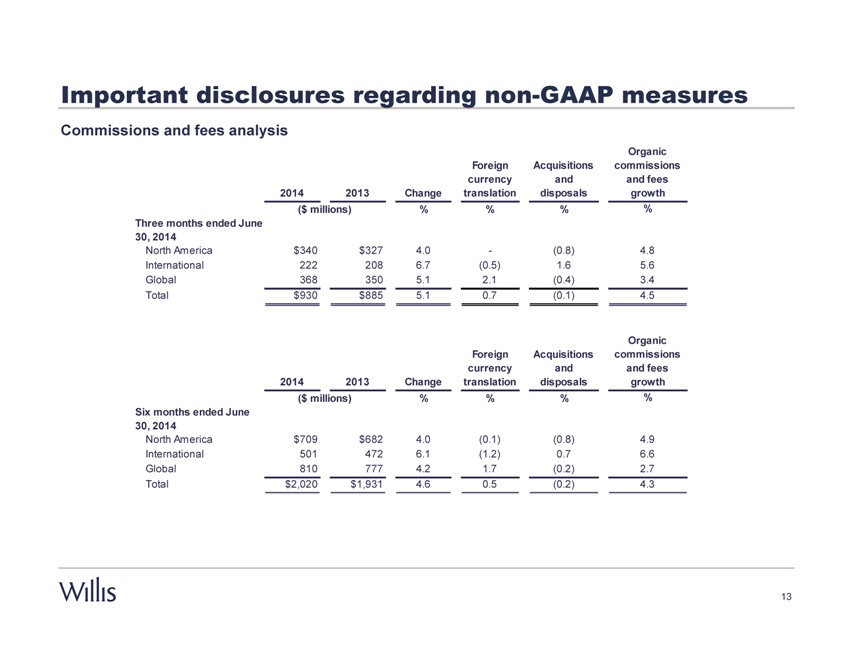
Commissions and fees analysis
Organic
Foreign Acquisitions commissions
currency and and fees
2014 2013 Change translation disposals growth
($ millions) % % % %
Three months ended June
30, 2014
North America $340 $327 4.0 - (0.8) 4.8
International 222 208 6.7 (0.5) 1.6 5.6
Global 368 350 5.1 2.1 (0.4) 3.4
Total $930 $885 5.1 0.7 (0.1) 4.5
Organic
Foreign Acquisitions commissions
currency and and fees
2014 2013 Change translation disposals growth
($ millions) % % % %
Six months ended June
30, 2014
North America $709 $682 4.0 (0.1) (0.8) 4.9
International 501 472 6.1 (1.2) 0.7 6.6
Global 810 777 4.2 1.7 (0.2) 2.7
Total $2,020 $1,931 4.6 0.5 (0.2) 4.3
13
Important disclosures regarding non-GAAP measures
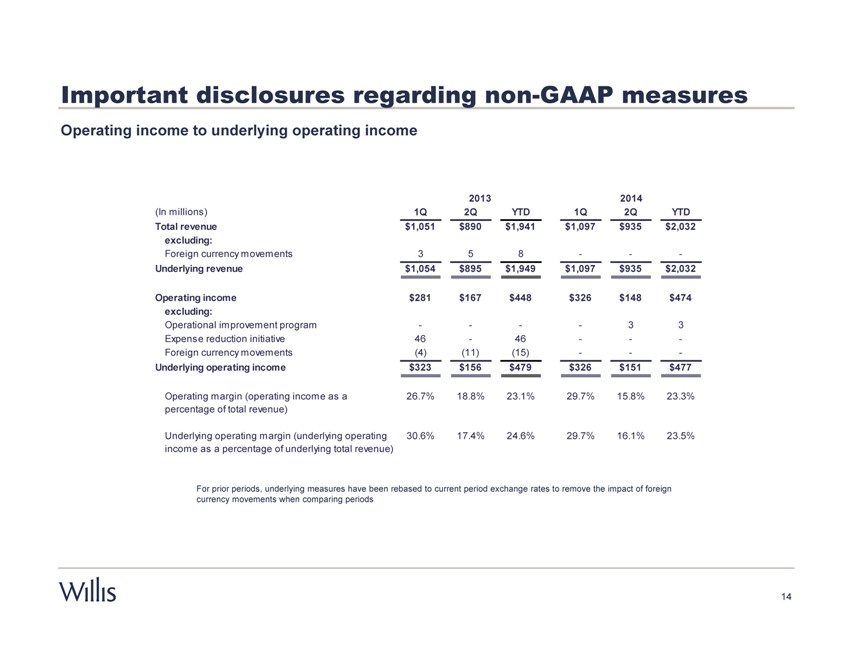
Operating income to underlying operating income
2013 2014
(In millions) 1Q 2Q YTD 1Q 2Q YTD
Total revenue $1,051 $890 $1,941 $1,097 $ 935 $2,032
excluding:
Foreign currency movements 3 5 8 - - -
Underlying revenue $1,054 $895 $1,949 $1,097 $ 935 $2,032
Operating income $281 $167 $448 $326 $148 $474
excluding:
Operational improvement program ---- 3 3
Expense reduction initiative 46 - 46 - - -
Foreign currency movements (4) (11) (15) - - -
Underlying operating income $323 $156 $479 $326 $151 $477
Operating margin (operating income as a 26.7% 18.8% 23.1% 29.7% 15.8% 23.3%
percentage of total revenue)
Underlying operating margin (underlying operating 30.6% 17.4% 24.6% 29.7% 16.1% 23.5%
income as a percentage of underlying total revenue)
For prior periods, underlying measures have been rebased to current period exchange rates to remove the impact of foreign
currency movements when comparing periods
14
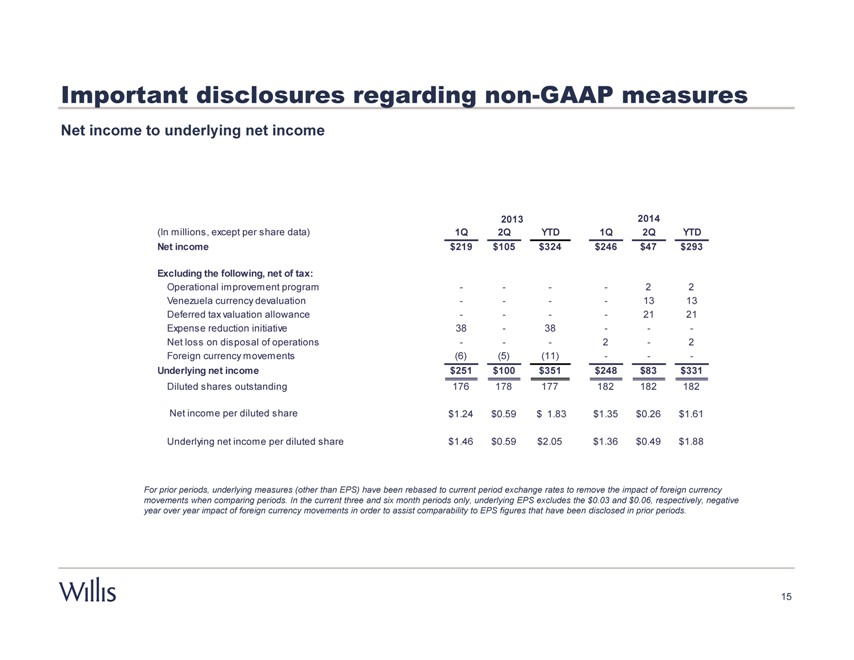
Important disclosures regarding non-GAAP measures
Net income to underlying net income
2013 2014
(In millions, except per share data) 1Q 2Q YTD 1Q 2Q YTD
Net income $219 $105 $324 $246 $47 $293
Excluding the following, net of tax:
Operational improvement program ---- 2 2
Venezuela currency devaluation ---- 13 13
Deferred tax valuation allowance ---- 21 21
Expense reduction initiative 38 - 38 -- -
Net loss on disposal of operations --- 2 - 2
Foreign currency movements (6) (5) (11) -- -
Underlying net income $251 $100 $351 $248 $83 $331
Diluted shares outstanding 176 178 177 182 182 182
Net income per diluted share $1.24 $0.59 $ 1.83 $1.35 $0.26 $1.61
Underlying net income per diluted share $1.46 $0.59 $2.05 $1.36 $0.49 $1.88
For prior periods, underlying measures (other than EPS) have been rebased to current period exchange rates to remove the impact of foreign currency movements when comparing periods. In the current three and six month periods only, underlying EPS excludes the $0.03 and $0.06, respectively, negative year over year impact of foreign currency movements in order to assist comparability to EPS figures that have been disclosed in prior periods.
15
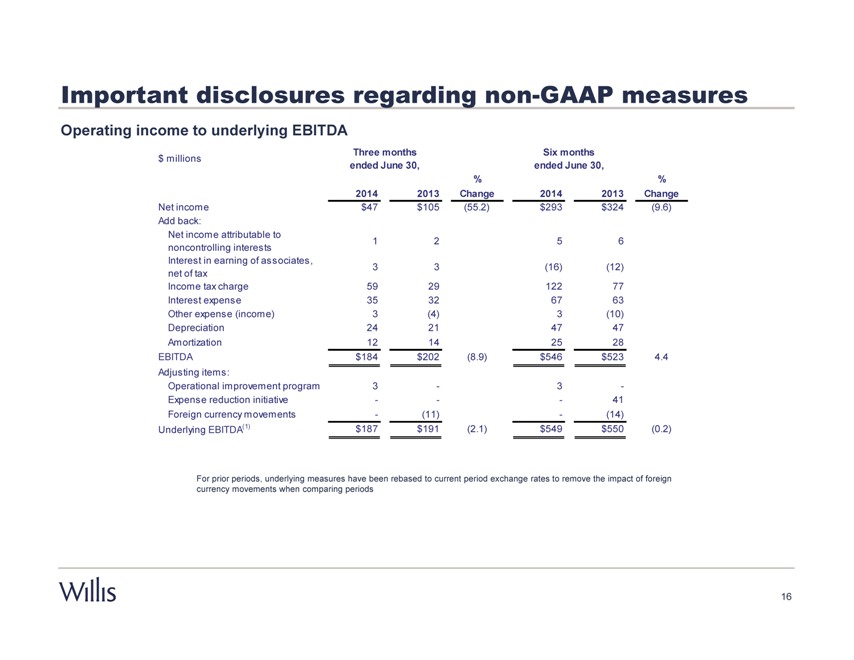
Important disclosures regarding non-GAAP measures
Operating income to underlying EBITDA
$ millions Three months Six months
ended June 30, ended June 30,
%%
2014 2013 Change 2014 2013 Change
Net income $47 $105 (55.2) $293 $324 (9.6)
Add back:
Net income attributable to
noncontrolling interests 1 2 5 6
Interest in earning of associates,
net of tax 3 3 (16) (12)
Income tax charge 59 29 122 77
Interest expense 35 32 67 63
Other expense (income) 3 (4) 3 (10)
Depreciation 24 21 47 47
Amortization 12 14 25 28
EBITDA $184 $202 (8.9) $ 546 $523 4.4
Adjusting items:
Operational improvement program 3 - 3 -
Expense reduction initiative - - - 41
Foreign currency movements - (11) - (14)
Underlying EBITDA(1) $187 $191 (2.1) $ 549 $550 (0.2)
For prior periods, underlying measures have been rebased to current period exchange rates to remove the impact of foreign
currency movements when comparing periods
16
IR Contacts
Peter Poillon
Tel: +1 212 915-8084
Email: peter.poillon@willis.com
Mark Jones
Tel: +1 212 915-8796
Email: mark.p.jones@willis.com
17