Exhibit 99.2
Willis Group Holdings
FIRST RESULTS QUARTER 2015
April, 2015
Important disclosures regarding forward-looking statements
This presentation contains certain “forward-looking statements” within the meaning of Section 27A of the Securities Act of 1933, and Section 21E of the Securities Exchange Act of 1934, w hich are intended to be covered by the safe harbors created by those law s. These forward-looking statements include information about possible or assumed future results of our operations.
All statements, other than statements of historical facts, included in this document that address activities, events or developments that w e expect or anticipate may occur in the future, including such things as our outlook, potential cost savings and accelerated adjusted operating margin and adjusted earnings per share grow th, future capital expenditures, growth in commissions and fees, business strategies, competitive strengths, goals, the benefits of new initiatives, growth of our business and operations, plans, and references to future successes are forw ard-looking statements. Also, w hen we use the w ords such as ‘anticipate’, ‘believe’, ‘estimate’, ‘expect’, ‘intend’, ‘plan’, ‘probably’, or similar expressions, we are making forward-looking statements.
There are important uncertainties, events and factors that could cause our actual results or performance to differ materially from those in the forward-looking statements contained in this document, including the follow ing: the impact of any regional, national or global political, economic, business, competitive, market, environmental or regulatory conditions on our global business operations; the impact of current global economic conditions on our results of operations and financial condition, including as a result of those associated w ith the Eurozone, any insolvencies of or other difficulties experienced by our clients, insurance companies or financial institutions; our ability to implement and fully realize anticipated benefits of our grow th strategy and revenue generating initiatives; our ability to implement and realize anticipated benefits of any cost-savings or operational improvement initiative, including our ability to achieve expected savings and other benefits from the multi-year Operational Improvement Program as a result of unexpected costs or delays and demand on managerial, operational and administrative resources and/or macroeconomic factors affecting the program as w ell as the impact of the program on business processes and competitive dynamics; the rejection of our Gras Savoye offer or failure to obtain regulatory approval; our ability to consummate acquisitions, including Miller Insurance Services and Gras Savoye, or achieve the expected benefits; our ability to effectively integrate any acquisition into our business; volatility or declines in insurance markets and premiums on w hich our commissions are based, but w hich we do not control; our ability to compete in our industry; material changes in commercial property and casualty markets generally or the availability of insurance products or changes in premiums resulting from a catastrophic event, such as a hurricane; our ability to retain key employees and clients and attract new business including at a time w hen the Company is pursuing various strategic initiatives; our ability to develop new products and services; the practical challenges and costs of complying w ith a w ide variety of foreign law s and regulations and any related changes, given the global scope of our operations and those of any acquired business and the associated risks of non-compliance and regulatory enforcement action; our ability to develop and implement technology solutions and invest in innovative product offerings in an efficient and effective manner; fluctuations in our earnings as a result of potential changes to our valuation allow ance(s) on our deferred tax assets; changes in the tax or accounting treatment of our operations and fluctuations in our tax rate; our ability to achieve anticipated benefits of any acquisition or other transactions in w hich we may engage, including any revenue grow th or operational efficiencies; our inability to exercise full management control over our associates; our ability to continue to manage our significant indebtedness; the timing or ability to carry out share repurchases and redemptions; the timing or ability to carry out refinancing or take other steps to manage our capital and the limitations in our long-term debt agreements that may restrict our ability to take these actions; any material fluctuations in exchange and interest rates that could adversely affect expenses and revenue; a significant decline in the value of investments that fund our pension plans or changes in our pension plan liabilities or funding obligations; rating agency actions, including a dow ngrade to our credit rating, that could inhibit our ability to borrow funds or the pricing thereof and in certain circumstances cause us to offer to buy back some of our debt; our ability to receive dividends or other distributions in needed amounts from our subsidiaries; our involvement in and the results of any regulatory investigations, legal proceedings and other contingencies; our exposure to potential liabilities arising from errors and omissions and other potential claims against us; underw riting, advisory or reputational risks associated with our business; the interruption or loss of our information processing systems, data security breaches or failure to maintain secure information systems; and impairment of the goodw ill in one of our reporting units, in w hich case we may be required to record significant charges to earnings.
The foregoing list of factors is not exhaustive and new factors may emerge from time to time that could also affect actual performance and results. For additional information see also Part I, Item 1A “Risk Factors” included in Willis’ Form 10-K for the year ended December 31, 2014, and our subsequent filings w ith the Securities and Exchange Commission. Copies are available online at http://www.sec.gov or on request from the Company.
Although w e believe that the assumptions underlying our forward-looking statements are reasonable, any of these assumptions, and therefore also the forward-looking statements based on these assumptions, could themselves prove to be inaccurate. In light of the significant uncertainties inherent in the forward-looking statements included in this presentation, our inclusion of this information is not a representation or guarantee by us that our objectives and plans w ill be achieved. Our forward-looking statements speak only as of the date made and w e will not update these forward-looking statements unless the securities law s require us to do so. In light of these risks, uncertainties and assumptions, the forward-looking events discussed in this presentation may not occur, and w e caution you against unduly relying on these forward-looking statements.
Important disclosures regarding non-GAAP measures
This presentation contains references to “non-GAAP financial measures” as defined in Regulation G of SEC rules. We present these measures because we believe they are of interest to the investment community and they provide additional meaningful methods of evaluating certain aspects of the Company’s operating performance from period to period on a basis that may not be otherwise apparent on a generally accepted accounting principles (GAAP) basis. These financial measures should be viewed in addition to, not in lieu of, the Company’s condensed consolidated income statements and balance sheet as of the relevant date. Consistent with Regulation G, a description of such information is provided below and a reconciliation of certain of such items to GAAP information can be found in our periodic filings with the SEC. Our method of calculating these non-GAAP financial measures may differ from other companies and therefore comparability may be limited.
Definitions of non-GAAP financial measures
We believe that investors’ understanding of the Company’s performance is enhanced by our disclosure of the following non-GAAP financial measures. Our method of calculating these measures may differ from those used by other companies and therefore comparability may be limited.
Organic commissions and fees growth
Organic commissions and fees growth excludes: (i) the impact of foreign currency movements; (ii) the first twelve months of net commission and fee revenues generated from acquisitions; and (iii) the net commission and fee revenues related to operations disposed of in each period presented, from reported commissions and fees growth. We believe organic growth in commissions and fees provides a measure that the investment community may find helpful in assessing the performance of business that were part of our business in both the current and prior periods, and provides a measure against which our businesses may be assessed in the future.
Underlying commissions and fees, underlying revenues, underlying total expenses, underlying salaries and benefits, underlying other operating expenses, underlying operating income, underlying operating margin, underlying EBITDA, underlying net income and underlying earnings per diluted share (“Underlying measures”).
Underlying measures are calculated by excluding the impact of certain items, including foreign currency movements, from the most directly comparable GAAP measures. We believe that excluding such items provides a more complete and consistent comparative analysis of our results of operations.
Organic revenues, organic total expenses, organic salaries and benefits, organic other operating expenses, organic operating income, organic operating margin and organic EBITDA (“Organic measures”).
Organic measures are calculated by excluding the twelve month impact from acquisitions and disposals (together with the impact of certain items, including foreign currency movements noted above), from the most directly comparable GAAP measures. We believe that excluding these items provides a more complete and consistent comparative analysis of our results of operations.
1Q 2015 EPS growth
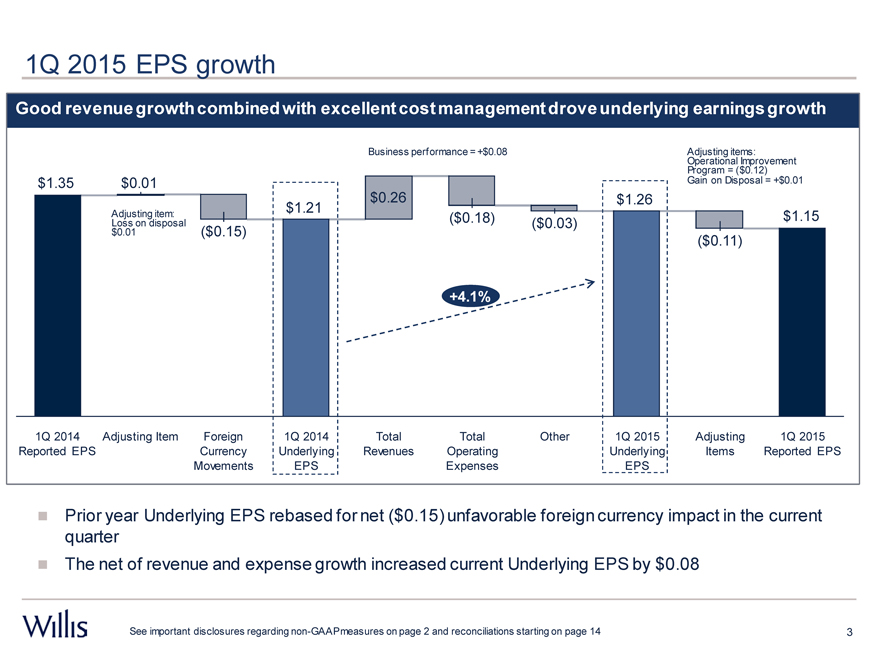
Good revenue growth combined with excellent cost management drove underlying earnings growth
Business performance = +$0.08 Adjusting items:
Operational Improvement
Program = ($0.12)
$1.35 | | $0.01 Gain on Disposal = +$0.01 |
Loss Adjusting on disposal item:($0.18)($0.03) $1.15
$0.01($0.15)($0.11)
+4.1%
1Q 2014 Adjusting Item Foreign 1Q 2014 Total Total Other 1Q 2015 Adjusting 1Q 2015
Reported EPS Currency Underlying Revenues Operating Underlying Items Reported EPS
Movements EPS Expenses EPS
Prior year Underlying EPS rebased for net ($0.15) unfavorable foreign currency impact in the current quarter The net of revenue and expense growth increased current Underlying EPS by $0.08
See important disclosures regarding non-GAAP measures on page 2 and reconciliations starting on page 14
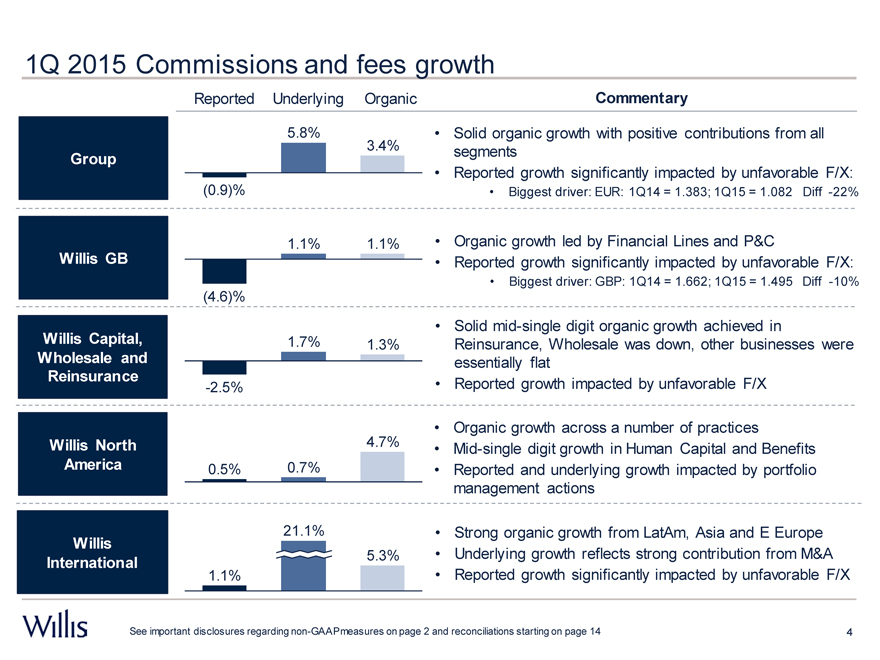
1Q 2015 Commissions and fees growth
Reported Underlying Organic Commentary
5.8% | | • Solid organic growth with positive contributions from all |
3.4%
Group segments
• Reported growth significantly impacted by unfavorable F/X:
(0.9)% | | • Biggest driver: EUR: 1Q14 = 1.383; 1Q15 = 1.082 Diff -22% |
1.1% | | 1.1% • Organic growth led by Financial Lines and P&C |
Willis GB • Reported growth significantly impacted by unfavorable F/X:
• Biggest driver: GBP: 1Q14 = 1.662; 1Q15 = 1.495 Diff -10%
(4.6)%
• Solid mid-single digit organic growth achieved in
Willis Capital, 1.7% 1.3% Reinsurance, Wholesale was down, other businesses were
Wholesale and essentially flat
Reinsurance -2.5% • Reported growth impacted by unfavorable F/X
• Organic growth across a number of practices
Willis North 4.7% • Mid-single digit growth in Human Capital and Benefits
America 0.5% 0.7% • Reported and underlying growth impacted by portfolio
management actions
Willis 21.1% • Strong organic growth from LatAm, Asia and E Europe
International 5.3% • Underlying growth reflects strong contribution from M&A
1.1% | | • Reported growth significantly impacted by unfavorable F/X |
See important disclosures regarding non-GAAP measures on page 2 and reconciliations starting on page 14
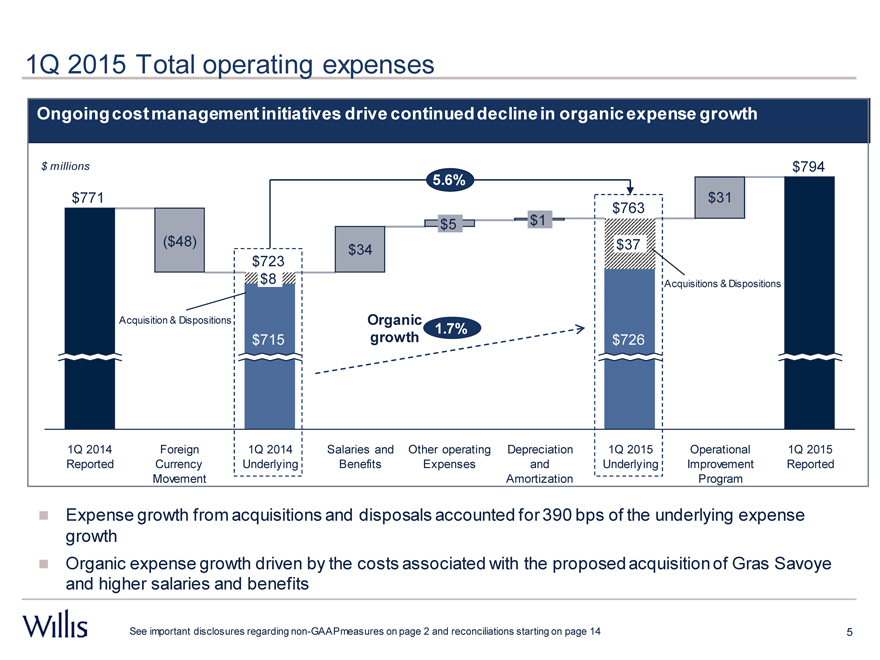
1Q 2015 Total operating expenses
Ongoing cost management initiatives drive continued decline in organic expense growth
$ millions $794
5.6%
$771 $31
$763
$5 $1
($48) $34 $37
$723
$8 Acquisitions & Dispositions
1.7%
Acquisition & Dispositions Organic 1.7%
$715 growth $726
1Q 2014 Foreign 1Q 2014 Salaries and Other operating Depreciation 1Q 2015 Operational 1Q 2015
Reported Currency Underlying Benefits Expenses and Underlying Improvement Reported
Movement Amortization Program
Expense growth from acquisitions and disposals accounted for 390 bps of the underlying expense growth Organic expense growth driven by the costs associated with the proposed acquisition of Gras Savoye and higher salaries and benefits
See important disclosures regarding non-GAAP measures on page 2 and reconciliations starting on page 14
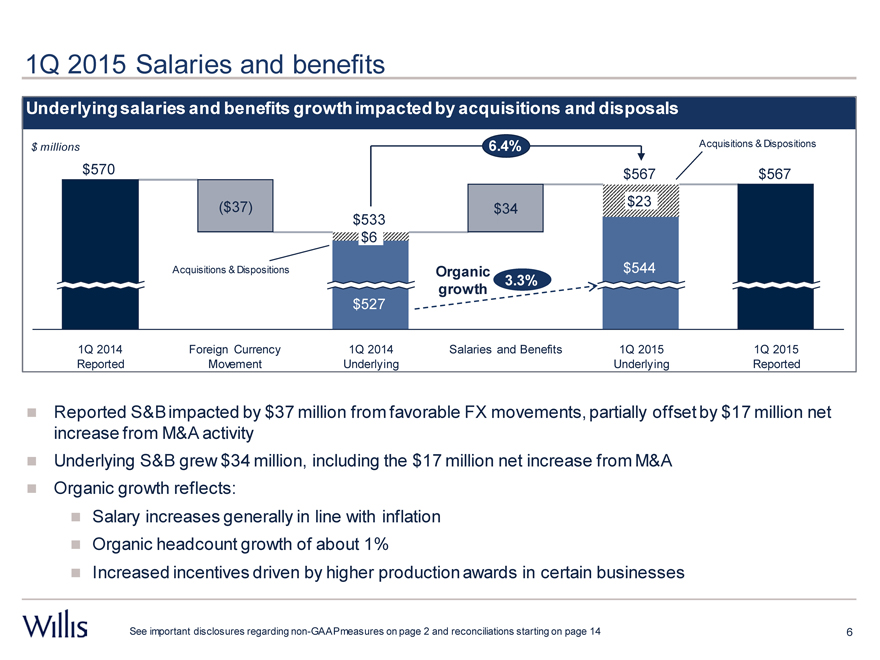
1Q 2015 Salaries and benefits
Underlying salaries and benefits growth impacted by acquisitions and disposals
$ millions 6.4% Acquisitions & Dispositions
$570 $567 $567
($37) $34 $23
$533
$6
Acquisitions & Dispositions Organic $544
growth 3.3%
$527
1Q 2014 Foreign Currency 1Q 2014 Salaries and Benefits 1Q 2015 1Q 2015
Reported Movement Underlying Underlying Reported
Reported S&B impacted by $37 million from favorable FX movements, partially offset by $17 million net increase from M&A activity Underlying S&B grew $34 million, including the $17 million net increase from M&A
Organic growth reflects:
Salary increases generally in line with inflation Organic headcount growth of about 1%
Increased incentives driven by higher production awards in certain businesses
See important disclosures regarding non-GAAP measures on page 2 and reconciliations starting on page 14 6
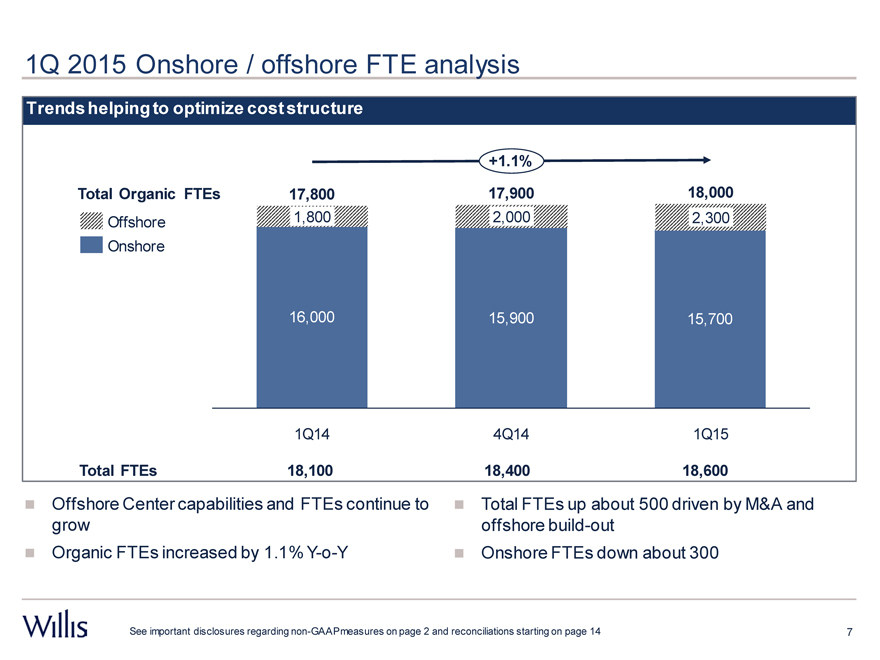
1Q 2015 Onshore / offshore FTE analysis
Trends helping to optimize cost structure
+1.1%
Total Organic FTEs 17,800 17,900 18,000
Offshore 1,800 2,000 2,300
Onshore
16,000 15,900 15,700
1Q14 4Q14 1Q15
Total FTEs 18,100 18,400 18,600
Offshore Center capabilities and FTEs continue to grow Organic FTEs increased by 1.1% Y-o-Y
Total FTEs up about 500 driven by M&A and offshore build-out Onshore FTEs down about 300
See important disclosures regarding non-GAAP measures on page 2 and reconciliations starting on page 14
1Q 2015 underlying EBITDA
Underlying EBITDA expands on C&F/Cost Spread
$ millions
$360
$335 $340
1Q 2013 1Q 2014 1Q 2015
Underlying
spread,(150)(160) + 20
bps
Organic
spread,(130)(120) + 170
bps
Underlying EBITDA driven by: ? Solid revenue growth
• | | Good organic C&F growth of 3.4% |
• | | Solid contributions from acquisitions (Max Matthiessen, Charles Monat, etc.) driving healthy underlying C&F growth of 5.8% ? Expense management |
• | | Organic expense growth of only 1.7% |
• | | Underlying expense growth of 5.6% |
• | | Operational improvement program beginning to impact |
Significant improvement in Y-o-Y growth rate reflects building success of strategic execution
See important disclosures regarding non-GAAP measures on page 2 and reconciliations starting on page 14
Gras Savoye Profile
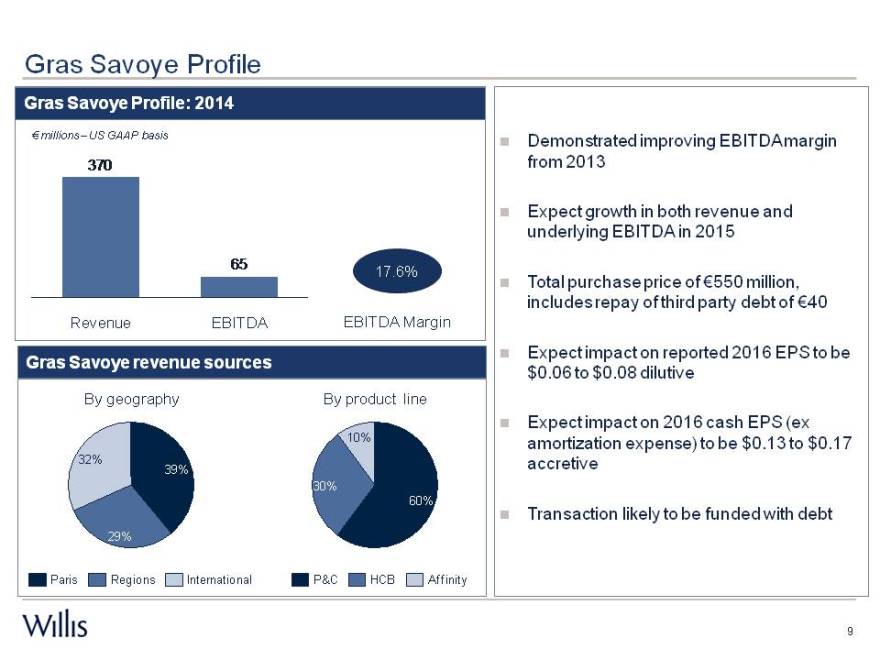
Gras Savoye Profile: 2014
€ millions – US GAAP basis
370
Revenue EBITDA EBITDA Margin
Gras Savoye revenue sources
By geography By product line
10%
32%
39%
30%
60%
29%
Paris Regions International P&C HCB Affinity
Demonstrated improving EBITDA margin from 2013
Expect growth in both revenue and underlying EBITDA in 2015
Total purchase price of ¬550 million, includes repay of third party debt of ¬40
Expect impact on reported 2016 EPS to be
$0.06 to $0.08 dilutive
Expect impact on 2016 cash EPS (ex amortization expense) to be $0.13 to $0.17 accretive
Transaction likely to be funded with debt
9
Gras Savoye: Excellent Strategic Fit
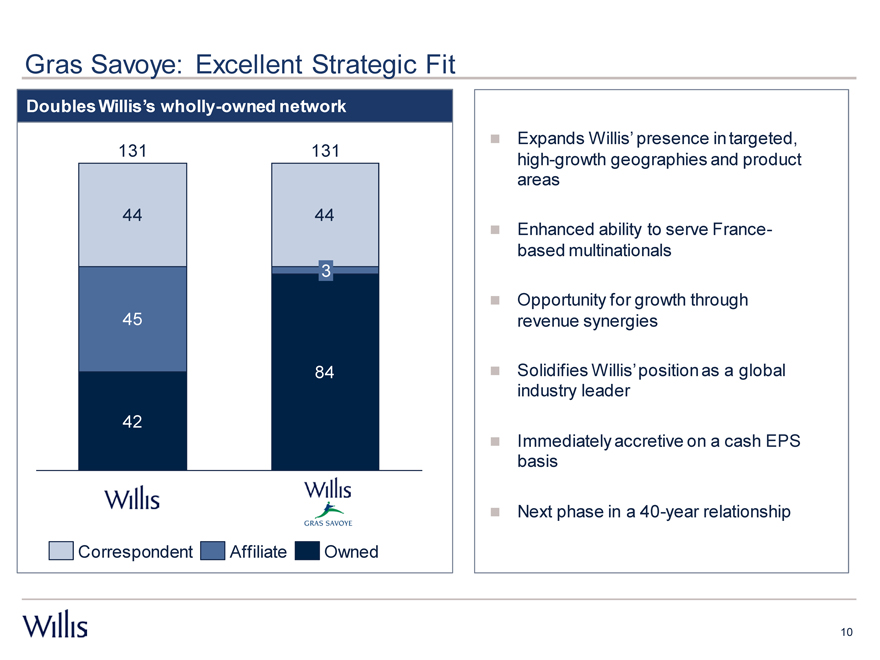
Doubles Willis’s wholly-owned network
131 131
Correspondent Affiliate Owned
Expands Willis’ presence in targeted, high-growth geographies and product areas
Enhanced ability to serve France-based multinationals
Opportunity for growth through revenue synergies
Solidifies Willis’ position as a global industry leader
Immediately accretive on a cash EPS basis
Next phase in a 40-year relationship
10
APPENDICES
Segment Structure
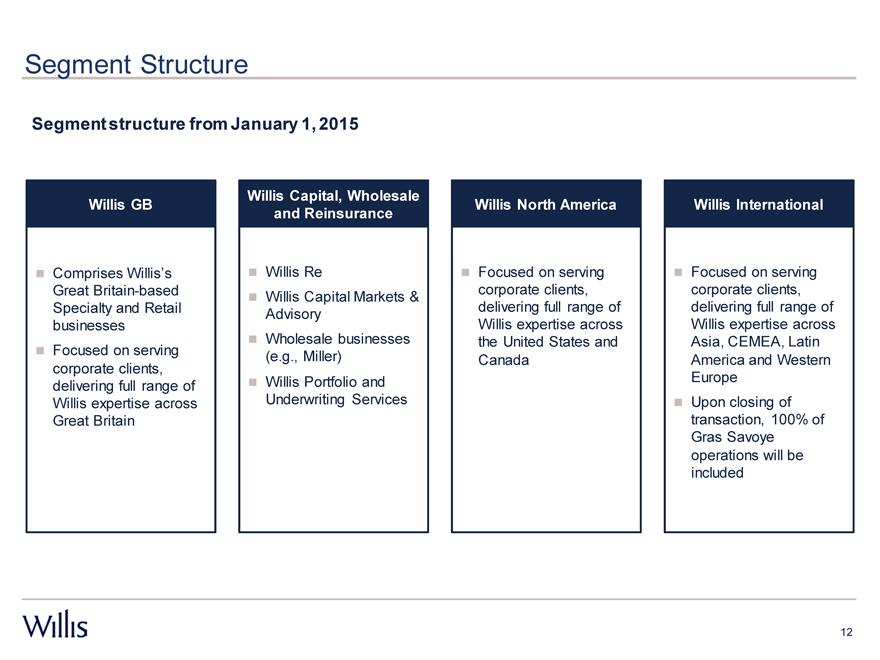
Segment structure from January 1, 2015
Willis GB
Comprises Willis’s Great Britain-based Specialty and Retail businesses Focused on serving corporate clients, delivering full range of Willis expertise across Great Britain
Willis Capital, Wholesale and Reinsurance
Willis Re
Willis Capital Markets & Advisory Wholesale businesses (e.g., Miller) Willis Portfolio and Underwriting Services
Willis North America
Focused on serving corporate clients, delivering full range of Willis expertise across the United States and Canada
Willis International
Focused on serving corporate clients, delivering full range of Willis expertise across Asia, CEMEA, Latin America and Western Europe Upon closing of transaction, 100% of Gras Savoye operations will be included
12
1Q 2015 Other operating expenses
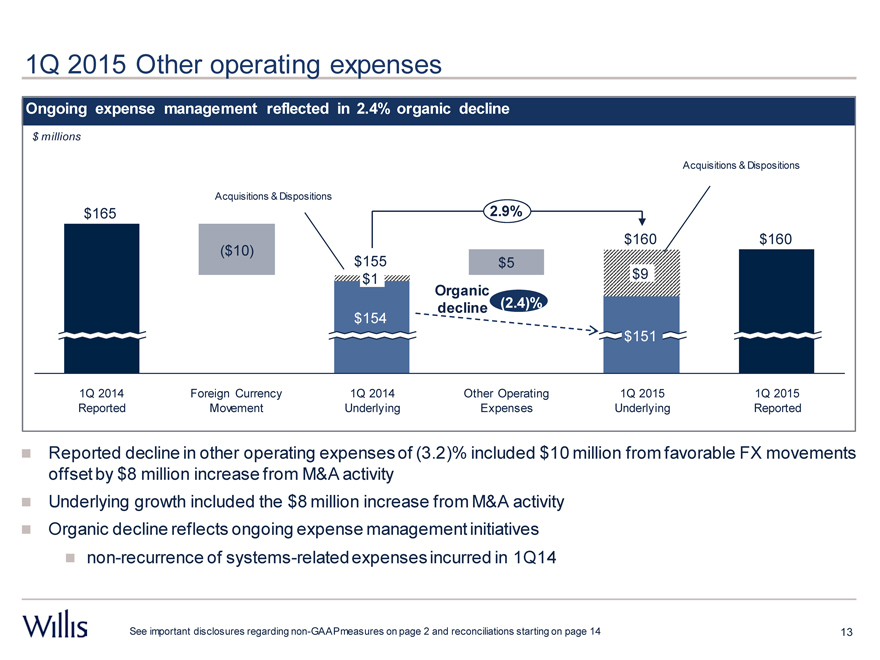
Ongoing expense management reflected in 2.4% organic decline
$ millions
Acquisitions & Dispositions
Acquisitions & Dispositions
$165 2.9%
$160 $160
($10)
$155 $5
$1 $9
Organicdecline (2.4)%
$154
$151
1Q 2014 Foreign Currency 1Q 2014 Other Operating 1Q 2015 1Q 2015
Reported Movement Underlying Expenses Underlying Reported
Reported decline in other operating expenses of (3.2)% included $10 million from favorable FX movements offset by $8 million increase from M&A activity Underlying growth included the $8 million increase from M&A activity Organic decline reflects ongoing expense management initiatives ? non-recurrence of systems-related expenses incurred in 1Q14
See important disclosures regarding non-GAAP measures on page 2 and reconciliations starting on page 14
13
Important disclosures regarding non-GAAP measures
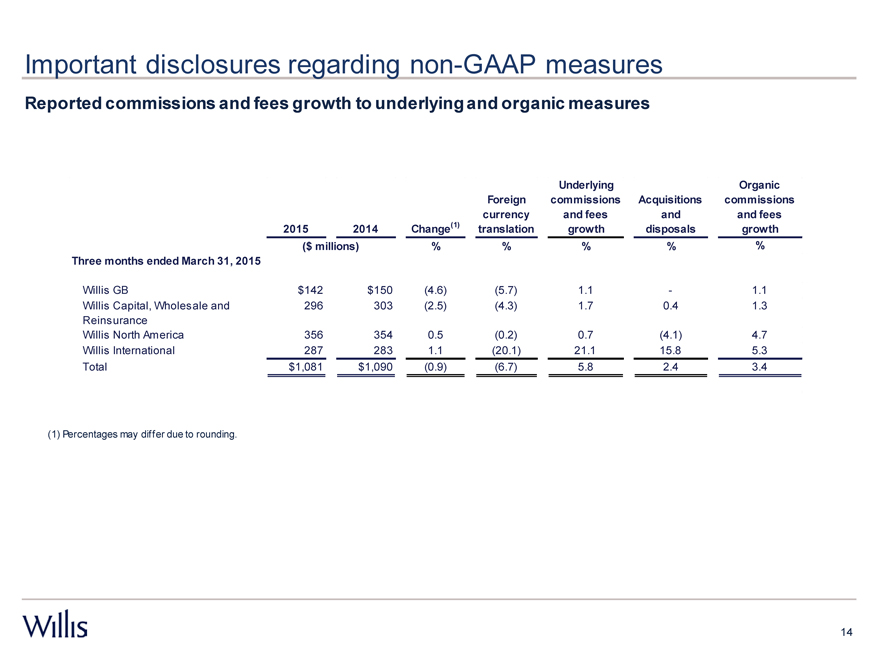
Reported commissions and fees growth to underlying and organic measures
Underlying Organic
Foreign commissions Acquisitions commissions
currency and fees and and fees
2015 2014 Change(1) translation growth disposals growth
($ millions) % % % % %
Three months ended March 31, 2015
Willis GB $142 $150 (4.6) (5.7) 1.1 - 1.1
Willis Capital, Wholesale and 296 303 (2.5) (4.3) 1.7 0.4 1.3
Reinsurance
Willis North America 356 354 0.5 (0.2) 0.7 (4.1) 4.7
Willis International 287 283 1.1 (20.1) 21.1 15.8 5.3
Total $1,081 $1,090 (0.9) (6.7) 5.8 2.4 3.4
(1) | | Percentages may differ due to rounding. |
14
Important disclosures regarding non-GAAP measures
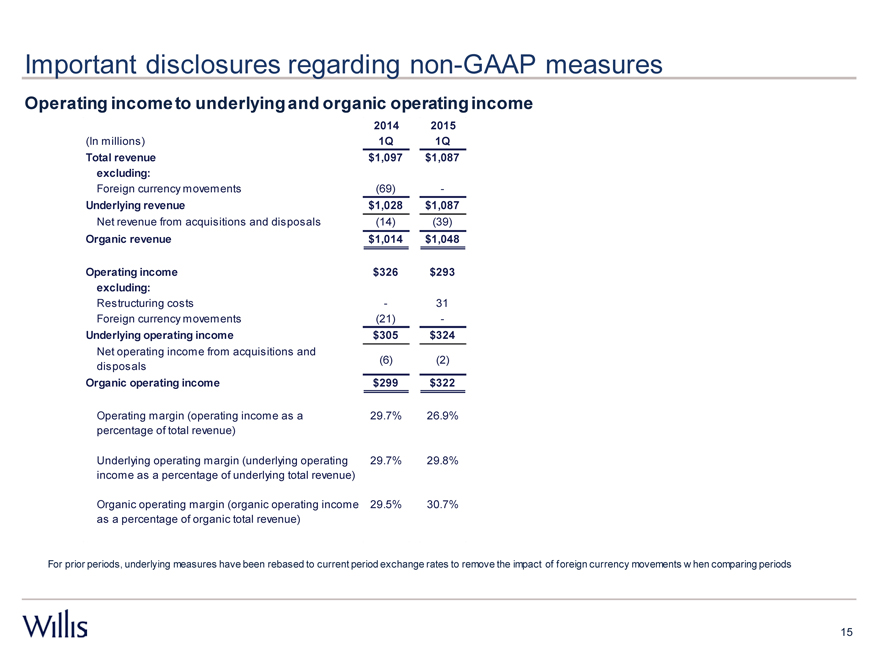
Operating income to underlying and organic operating income
2014 2015
(In millions) 1Q 1Q
Total revenue $1,097 $1,087
excluding:
Foreign currency movements (69) -
Underlying revenue $1,028 $1,087
Net revenue from acquisitions and disposals (14) (39)
Organic revenue $1,014 $1,048
Operating income $326 $293
excluding:
Restructuring costs - 31
Foreign currency movements (21) -
Underlying operating income $305 $324
Net operating income from acquisitions and
disposals (6) (2)
Organic operating income $299 $322
Operating margin (operating income as a 29.7% 26.9%
percentage of total revenue)
Underlying operating margin (underlying operating 29.7% 29.8%
income as a percentage of underlying total revenue)
Organic operating margin (organic operating income 29.5% 30.7%
as a percentage of organic total revenue)
For prior periods, underlying measures have been rebased to current period exchange rates to remove the impact of foreign currency movements w hen comparing periods
15
Important disclosures regarding non-GAAP measures
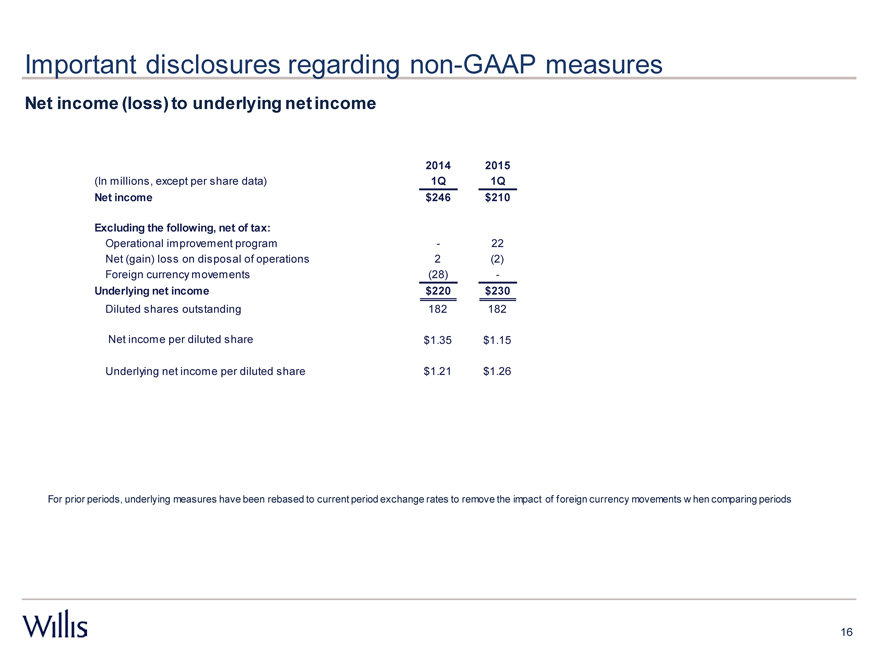
Net income (loss) to underlying net income
2014 2015
(In millions, except per share data) 1Q 1Q
Net income $246 $210
Excluding the following, net of tax:
Operational improvement program - 22
Net (gain) loss on disposal of operations 2 (2)
Foreign currency movements (28) -
Underlying net income $220 $230
Diluted shares outstanding 182 182
Net income per diluted share $1.35 $1.15
Underlying net income per diluted share $1.21 $1.26
For prior periods, underlying measures have been rebased to current period exchange rates to remove the impact of foreign currency movements w hen comparing periods
16
Important disclosures regarding non-GAAP measures
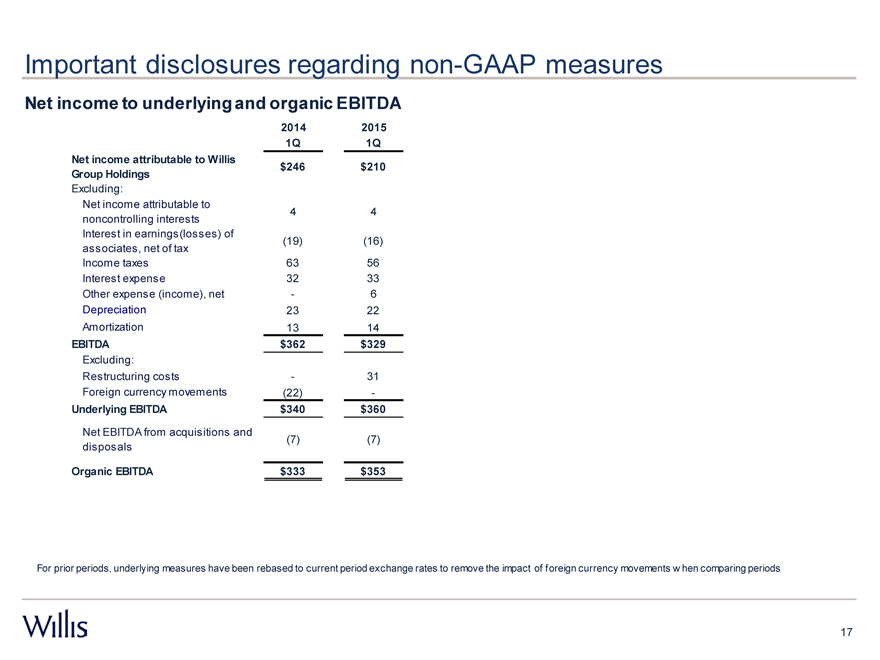
Net income to underlying and organic EBITDA
2014 2015
1Q 1Q
Net income attributable to Willis
Group Holdings $246 $210
Excluding:
Net income attributable to
noncontrolling interests 4 4
Interest in earnings(losses) of
associates, net of tax (19) (16)
Income taxes 63 56
Interest expense 32 33
Other expense (income), net - 6
Depreciation 23 22
Amortization 13 14
EBITDA $362 $329
Excluding:
Restructuring costs - 31
Foreign currency movements (22) -
Underlying EBITDA $340 $360
Net EBITDA from acquisitions and
disposals (7) (7)
Organic EBITDA $333 $353
For prior periods, underlying measures have been rebased to current period exchange rates to remove the impact of foreign currency movements w hen comparing periods
17
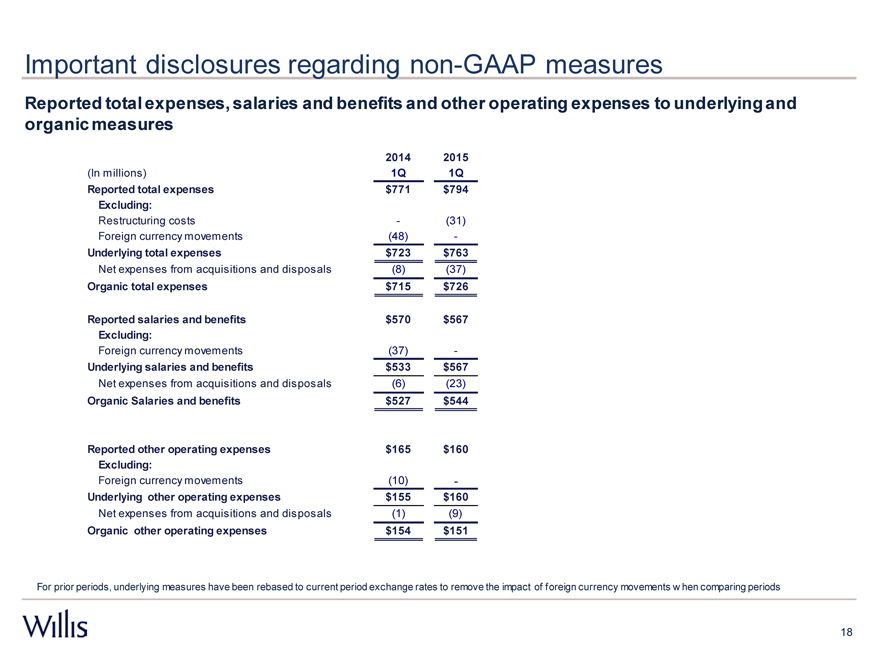
Important disclosures regarding non-GAAP measures
Reported total expenses, salaries and benefits and other operating expenses to underlying and organic measures
2014 2015
(In millions) 1Q 1Q
Reported total expenses $771 $794
Excluding:
Restructuring costs - (31)
Foreign currency movements (48) -
Underlying total expenses $723 $763
Net expenses from acquisitions and disposals (8) (37)
Organic total expenses $715 $726
Reported salaries and benefits $570 $567
Excluding:
Foreign currency movements (37) -
Underlying salaries and benefits $533 $567
Net expenses from acquisitions and disposals (6) (23)
Organic Salaries and benefits $527 $544
Reported other operating expenses $165 $160
Excluding:
Foreign currency movements (10) -
Underlying other operating expenses $155 $160
Net expenses from acquisitions and disposals (1) (9)
Organic other operating expenses $154 $151
For prior periods, underlying measures have been rebased to current period exchange rates to remove the impact of foreign currency movements w hen comparing periods
18
IR Contacts
Peter Poillon
Tel: +1 212 915-8084
Email: peter.poillon@willis.com
Media Contact
Juliet Massey
Tel: +44 7984 156 739
Email: juliet.massey@willis.com
19