Statoil ANNUAL REPORT ON FORM 20-F
UNITED STATES
SECURITIES AND EXCHANGE COMMISSION
Washington, D.C. 20549
Form 20-F
(Mark one)
_ | REGISTRATION STATEMENT PURSUANT TO SECTION 12(b) OR 12 (g) |
X | ANNUAL REPORT PURSUANT TO SECTION 13 OR 15(d) |
_ | TRANSITION REPORT PURSUANT TO SECTION 13 OR 15(d) |
_ | SHELL COMPANY REPORT PURSUANT TO SECTION 13 OR 15(d) OF THE |
Commission File No. 1-15200
Statoil ASA
(Exact Name of Registrant as Specified in Its Charter)
N/A
(Translation of Registrant's Name Into English)
Norway
(Jurisdiction of Incorporation or Organization)
Forusbeen 50, N-4035 Stavanger, Norway
(Address of Principal Executive Offices)
Eldar Sætre
Chief Financial Officer
Statoil ASA
Forusbeen 50, N-4035
Stavanger, Norway
Telephone No.: 011-47-5199-0000
Fax No.: 011-47-5199-0050
(Name, Telephone, E-mail and/or Facsimile number and Address of Company Contact Person)
Securities registered or to be registered pursuant to Section 12(b) of the Act:
Title of each class | Name of each exchange on which registered |
American Depositary Shares | New York Stock Exchange |
*Listed, not for trading, but only in connection with the registration of American Depositary Shares, pursuant to the requirements of the Securities and Exchange Commission
Securities registered or to be registered pursuant to Section 12(g) of the Act: None
Securities for which there is a reporting obligation pursuant to Section 15 (d) of the Act: None
Indicate the number of outstanding shares of each of the issuer's classes of capital or common stock as of the
close of the period covered by the Annual Report:
Ordinary shares of NOK 2.50 each 3,183,873,643
Indicate by check mark if the registrant is a well-known seasoned issuer, as defined in Rule 405 of the Securities
Act Yes_X_ No__
If this report in an annual or transition report, indicate by check mark if the registrant is not required to file reports
pursuant to Section 13 or 15(d) of the Securities Exchange Act of 1934. Yes__ No_X_
Indicate by check mark whether the registrant: (1) has filed all reports to be filed by Section 13 or 15(d) of the
Securities Exchange Act of 1934 during the preceding 12 months (or for such shorter period that the registrant
was required to file such reports), and (2) has been subject to such filing requirements for the past 90 days.
Yes_X_ No__
Indicate by check mark whether the registrant is a large accelerated filer, an accelerated filer, or a nonaccelerated
filer. See definition of “accelerated filer and large accelerated filer” in Rule 12b-2 of the Exchange Act.
(Check one):
Large accelerated filer_X_ Accelerated filer__ Non-accelerated filer__
Indicate by check mark which basis of accounting the registrant has used to prepare the financial statements
included in this filing:
U.S. GAAP __ International Financial Reporting Standards as issued by the International Accounting Standards
Board _X_ Other __
If “Other” has been checked in response to the previous question, indicate by check mark which financial
statement item the registrant has elected to follow.
Item 17 __ Item 18 __
If this is an annual report, indicate by check mark whether the registrant is a shell company (as defined in Rule
12b-2 of the Exchange Act). Yes__ No _X_
Annual report on Form 20-F 2009
Table of content
1 Introduction
1.1 Cover page
1.2 Key figures
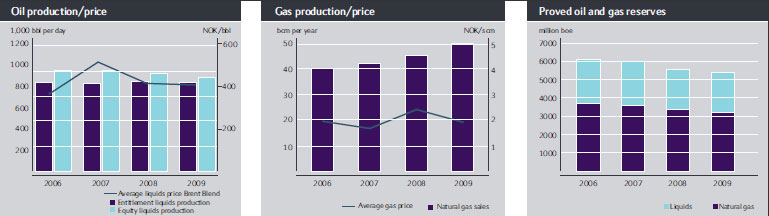
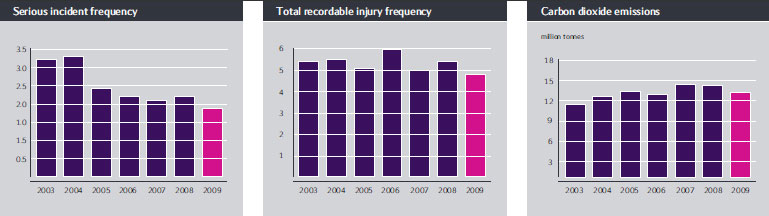
Key figures is a presentation of our performance in important areas: income, return, cash flow, oil production and price, gas production and price, proved reserves, total recordable injuries, serious incidents, and carbon dioxide emissions.

1.3 About the report
Statoil's Annual Report on Form 20-F for the year ended 31 December 2009 ("Annual Report on Form 20-F") is available online at www.statoil.com.
Statoil is subject to the information requirements of the US Securities Exchange Act of 1934 applicable to foreign private issuers. In accordance with these requirements, Statoil files its Annual Report on Form 20-F and other related documents with the Securities and Exchange Commission, the SEC. It is also possible to read and copy documents that have been filed with the SEC at the SEC's public reference room located at 100 F Street, N.E., Washington, D.C. 20549, USA. You may also call the SEC at 1-800-SEC-0330 for further information about the public reference rooms and their copy charges, or you may log on to www.sec.gov. The report can also be downloaded from the SEC website at www.sec.gov.
Statoil discloses on its website at www.statoil.com/en/aboutStatoil/corporategovernance/pages/default.aspx, and in its Annual Report on Form 20-F (Item 16B) significant ways (if any) in which its corporate governance practices differ from those mandated for US companies under the New York Stock Exchange (the "NYSE") listing standards.
1.4 Financial highlights
The financial downturn has been challenging for everyone, including the oil and gas industry. In such an uncertain business environment, the best protection comes from solid deliveries. In 2009 we delivered on our targets, both operationally and financially.
| For the year ended 31 December | |||
(in NOK billion, unless stated otherwise) | 2009 | 2008 | 2007 | 2006 |
|
|
|
|
|
Financial information |
|
|
|
|
Total revenues | 465.4 | 656.0 | 522.8 | 521.5 |
Net operating income | 121.6 | 198.8 | 137.2 | 166.2 |
Net income | 17.7 | 43.3 | 44.6 | 51.8 |
Cash flow provided by operating activities | 73.0 | 102.5 | 93.9 | 88.6 |
Cash flow used in investing activities | 75.4 | 85.8 | 75.1 | 57.2 |
Interest-bearning debt | 104.1 | 75.3 | 50.5 | 54.8 |
Net interest-bearing debt | 75.3 | 46.0 | 25.5 | 43.8 |
Total assets | 562.8 | 579.2 | 483.1 | 458.8 |
Share Capital | 8.0 | 8.0 | 8.0 | 8.0 |
Minority Interest | 1.8 | 2.0 | 1.8 | 1.6 |
Net assets / Total equity | 200.1 | 216.1 | 179.1 | 169.4 |
Net debt to capital employed | 27.3 % | 17.5 % | 12.4 % | 20.5 % |
Return on average capital employed after tax | 10.4 % | 21.0 % | 17.7 % | 22.6 % |
|
|
|
|
|
Operational information |
|
|
|
|
Equity oil and gas production (mboe/day) | 1,962 | 1,925 | 1,839 | 1,780 |
Proved oil and gas reserves (mmboe) | 5,408 | 5,584 | 6,010 | 6,101 |
Reserve replacement ratio (three-year average) | 64% | 60% | 81% | 76% |
Production cost (NOK / boe equity volumes) | 35.3 | 34.6 | 41.4 | 27.3 |
|
|
|
|
|
Share information |
|
|
|
|
Ordinary and diluted earnings per share | 5.75 | 13.58 | 13.80 | 15.82 |
Share price at Oslo Stock Exchange on 31 December | 144.80 | 113.90 | 169.00 | 165.25 |
Dividend paid per share NOK (1) | 6.00 | 7.25 | 8.50 | 9.12 |
Dividend paid per share USD (2) | 1.04 | 1.26 | 1.47 | 1.58 |
Weighted average number of ordinary shares outstanding | 3,183,873,643 | 3,185,953,538 | 3,195,866,843 | 3,230,849,707 |
|
|
|
|
|
(1) See Shareholder information section for a description of how dividends are determined and information on share repurchases. | ||||
(2) USD figure presented using the Central Bank of Norway 2009 year-end rate for Norwegian kroner, which was USD 1.00 = 5.7767 NOK. | ||||
Statoil publishes financial data in accordance with IFRS. Statoil did not publish financial data in accordance with IFRS in 2006 as we previously presented financial data in accordance with US GAAP. For this reason, we have not provided selected financial data for 2005 in this Annual Report. Selected financial data for that year presented in accordance with US GAAP is included in our 2006 Annual Report on Form 20-F.
1.5 A glance at 2009
2009 was a year of uncertainty, with the threat of the financial crisis, falling oil and gas prices and more unpredictable demand. Nevertheless, we delivered on our production targets and are well positioned for the future. This is a brief review of 2009.
The year at a glance
In January, we revealed our intent to merge land-based organisations and offshore installations in an over-arching production system designed to run the business more safely and predictably. The restructuring process proceeds as planned. The latest milestone is the opening of a new operations support centre at Sandsli.
Also in January, gas flowed from the Yttergryta subsea field on Åsgard in the Norwegian Sea. The field progressed from discovery to production in just 18 months. The average lead time for offshore oil and gas field developments in Norway is 15 years.
In March, we made a discovery at the Asterix gas prospect in the Norwegian Sea, which was deemed one of the larger finds offshore Norway in recent years.
In April, we joined forces with Norwegian power utility Statkraft to develop the 315 MW Sheringham Shoal Offshore Wind Farm off the coast of Norfolk, UK. The wind farm will have 88 turbines and is planned to start production in 2011. When fully operational, its annual electricity production will be about 1.1 TWh, enough to power some 220,000 UK homes.
Also in April, we announced the acquisition of a 40% stake in 50 blocks from BHP Billiton in the frontier DeSoto Canyon area of the US Gulf of Mexico. DeSoto Canyon is located east of Statoil's current production operation at Independence Hub. The area has water depths of about 1,000 metres, and is a mostly unexplored region in the eastern part of the Gulf of Mexico (GoM), offering advantageous early access to new plays.
In May, first oil was tapped on the Tahiti field in the Gulf of Mexico.
An offshore worker died on 7 May after an accidental fall on the North Sea Oseberg B platform operated by Statoil, in connection with the removal of scaffolding from the drilling area on the B platform. The victim was an employee of scaffolding contractor STS. In direct response to the accident, Statoil and contractors Aibel and STS took the initiative to introduce improvements throughout the entire scaffolding industry.
In June, production on the Lufeng 22-1 field in the South China Sea was shut down. We operated the field together with partner CNOOC from 1997. Under an agreement between CNOOC and Statoil, CNOOC has taken over full responsibility for the abandonment of phases two and three of the field. Our Shekou operations office was closed at the end of 2009, and our activities in China are currently centred around R&D cooperation and business development.
On June 1, we were devastated by the news that three colleagues from our Rio de Janeiro office were on Air France flight 447 that disappeared over the Atlantic. Geologist Marcela Pellizzon, 29, and lawyer Gustavo Peretti, 30, both Brazilian citizens, and Norwegian lawyer Kristian Berg Andersen, 37, perished in the accident. A memorial service was held in Rio in June.
In July, first oil was tapped on the Thunder Hawk field in the Gulf of Mexico.
Also in July, the Tyrihans field in the Norwegian Sea came on stream using the world's longest directly heated pipeline - some 43 kilometres long.
During the summer, some 30 vessels took part in marine operations on the Gjøa and Vega fields in the North Sea. Gjøa is our largest project under construction in the North Sea today and expected to start producing in 2010. The field's semi-sub platform is Statoil's first floating installation to source electricity from the mainland, reducing CO2 emissions by about 210,000 tonnes per year. The smaller Vega deposit will tie in to Gjøa and also start producing in 2010.
In August, we set a world record on the Ormen Lange field in the Norwegian Sea when the world's deepest remotely controlled "hot-tap" operation was completed at a sea depth of 860 metres.
In September, our Hywind pilot project - the world's first full-scale floating wind turbine - was officially inaugurated off the coast of western Norway for two years of testing. A still immature technology facing a long road to commercialisation and full-scale wind farm construction, Hywind can help floating wind turbines make a long-term contribution to meeting the world's soaring demand for energy.
Statoil CEO Helge Lund took part in a preliminary meeting at the UN headquarters in New York, in connection with preparations for the international climate summit in Copenhagen, after being appointed a member of the UN expert group for climate and energy. Statoil was the only oil company represented in the group, which consists of approximately 20 persons from different countries.
In October, we announced the nineteenth oil find on Angola's offshore Block 31. We hold a 13.3% stake in the acreage. Sonangol is concessionaire and BP operator. We are partner in nine producing Angolan fields, which contribute more than 200,000 barrels of equity production per day to our portfolio.
In November, we changed our name to Statoil and introduced our new brand identity. The Horton case - concerning Statoil's contract with Horton Investment Ltd, related to business development in Iran - was formally closed by the US authorities in November. Statoil fulfilled the conditions of agreements signed in 2006 with the US authorities to substantially strengthen our ethics and anti-corruption practices. Offshore installation of the first wellhead platform on the Statoil-operated Peregrino field in Brazil started.
In December, Statoil and Lukoil won the technical service contract from Iraq's Ministry of Oil to develop the sizeable West Qurna 2 field in the southern part of the country. West Qurna 2 is estimated to hold 12.9 billion barrels of recoverable reserves.
We signed memorandums of understanding (MoU's) with Gazprom to import LNG into the US and trade it there. The MoU's include Gazprom getting re-gasification capacity at the Cove Point, Maryland, LNG receiving terminal. Statoil will also sell natural gas to Gazprom at various US locations, while purchasing LNG from Gazprom at Cove Point.
Finally, it was announced on 18 December that Statoil and Chinese oil giant Sinopec will carry out joint geological studies on two deep-water blocks in the South China Sea. The agreement makes Statoil the first foreign company to work with Sinopec off the coast of China.
The year as a whole
Our total equity output both in and outside Norway increased to some 1,950,000 barrels of oil equivalents per day.
We carried out an extensive exploration drilling campaign on the NCS in 2009, completing 39 exploration wells, 30 wildcat wells to test new prospects and nine appraisal wells to establish the extent and size of previous discoveries. We proved 22 new discoveries, resulting in a discovery rate of more than 70%. Most of the finds are relatively small and close to producing fields in the North Sea and Norwegian Sea, making later tie-ins possible. The most important discoveries in 2009 were Asterix, Gro, Katla and Beta West; all except Gro being Statoil-operated.
Internationally, our average daily production surpassed 500,000 boe for the first time. Equity production increased by 10% from 2008, to 512 mboe/day, and production from three new fields started during the year. We had a high level of exploration activity: six of the 29 exploration wells drilled in 2009 have been announced as discoveries, with several interesting discoveries in the US Gulf of Mexico, Canada and Angola.
Looking ahead
The Leismer oil sands development project in Canada is well underway with production start up expected in autumn 2010. The Leismer Commercial Demonstration Plant is stage one of our total field development plan for several bitumen hubs upstream.
Our Peregrino project now towers over the surface of the sea in the Campos basin off Brazil. First oil is expected in early 2011 and production should reach its plateau of 100,000 barrels of oil equivalents per day within the first year.
The onshore Marcellus shale gas leases in the eastern US are in early stages of production and growing steadily.
��
2 Business overview
2.1 Our business
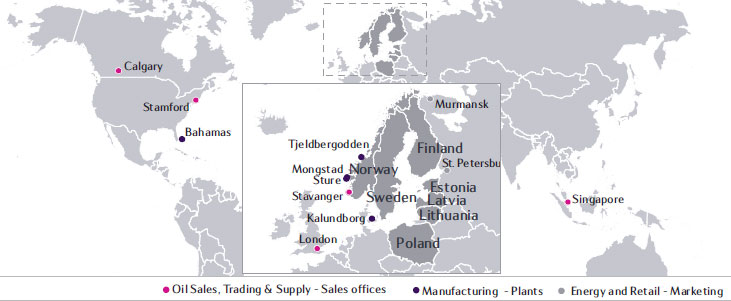
Statoil is an integrated energy company based in Norway. The company is present in approximately 40 other countries worldwide. We are the leading operator on the NCS and are also experiencing strong growth in our international production.
Statoil ASA is a public limited company organised under the laws of Norway and subject to the provisions of the Norwegian act relating to public limited liability companies (the Norwegian Public Limited Companies Act).
Entitlement oil and gas production outside Norway accounted for 20% of our total production, which averaged 1.806 mmboe per day in 2009.
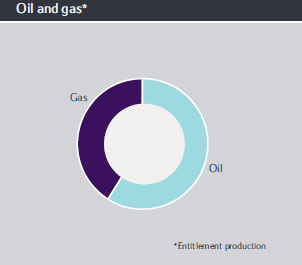
As of 31 December 2009, we had proved reserves of 2 174 mmbbl of oil and 514 bcm (equivalent to 18.1 tcf) of natural gas, corresponding to aggregate proved reserves of 5 408 mmboe.
We are represented in approximately 40 countries and are engaged in exploration and production activities in 22 of them. As of 31 December 2009, we had approximately 29,000 employees.
We are among the world's largest net sellers of crude oil and condensate and we are the second largest supplier of natural gas to the European market.
We have substantial processing and refining activities and approximately 2000 service stations in Scandinavia, Poland, the Baltic States and Russia.
We are contributing to the development of new energy resources, have ongoing activities in the fields of wind power and biofuels and are at the forefront of implementation of technologies for carbon capture and storage (CCS).
In further developing our international business, we intend to utilise our core expertise in areas such as deep water, heavy oil, harsh environments and gas value chains in order to exploit new opportunities and develop high quality projects.
Business address
Our business address is Forusbeen 50, N-4035 Stavanger, Norway. Our telephone number is +47 51 99 00 00. Our largest locations in terms of the number of employees are in Stavanger, Bergen and Oslo, Norway.
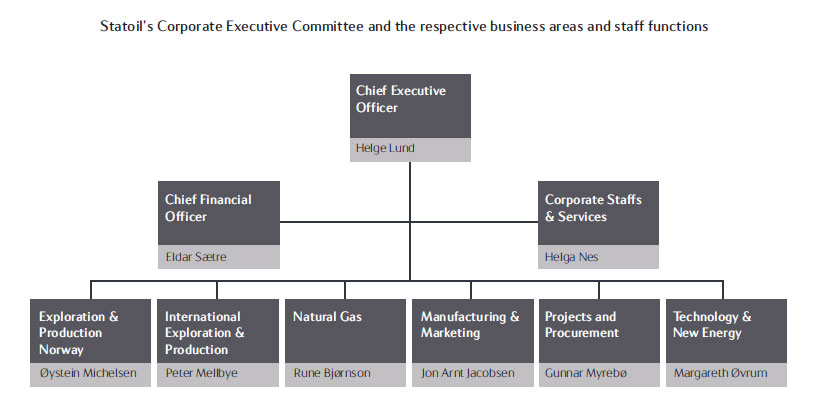
The Statoil group and the main business and function areas are presented in the following sections of this report.
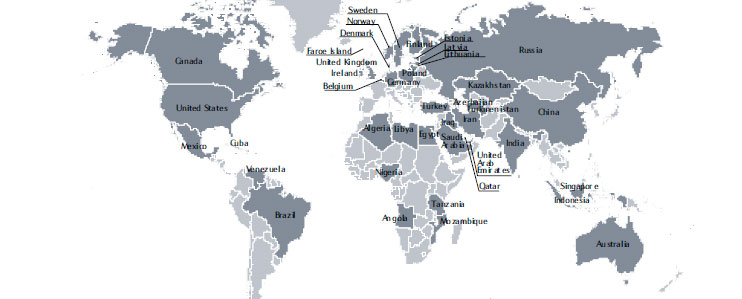
The figures below provide an overview of the geographical reach of Statoil's business and the organisational structure of our business areas and staff functions.
2.2 Our history
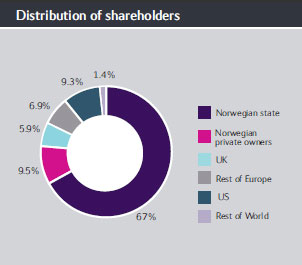
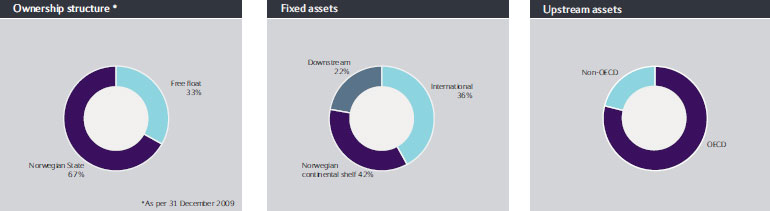
Statoil was formed in 1972 by a decision of the Norwegian Storting (parliament) and was listed on the Oslo and New York stock exchanges in 2001.
Statoil was incorporated as a limited liability company under the name Den norske stats oljeselskap a.s. Wholly-owned by the Norwegian State, the company's role was to be the government's commercial instrument in the development of the oil and gas industry in Norway. In 2001, the company became a public limited company listed on the Oslo and New York stock exchanges, and changed its name to Statoil ASA. On 1 October 2007, the oil and energy division of Hydro (formerly Norsk Hydro) was merged with Statoil, and the company was given the temporary name of StatoilHydro ASA. On 1 November 2009, the company changed its name back to Statoil ASA.
We have grown in parallel with the Norwegian oil and gas industry, which dates back to the late 1960s. The commencement of our operations focused primarily on the exploration, production and development of oil and gas on the Norwegian continental shelf (NCS) as partner.
In the 1970s, we commenced our own operations, made important discoveries and entered into oil refining operations, which have been of great importance to the further development of the NCS.
In the 1980s, we saw substantial growth through the development of major fields on the NCS (Statfjord, Gullfaks, Oseberg, Troll and others). We also became a major player in the European gas market by securing large sales contracts for the development and operation of gas transport systems and terminals. During the same decade, we were involved in manufacturing and marketing in Scandinavia, and we established a comprehensive network of service stations.
The 1990s were characterised by substantial improvements in the production performance of our large fields, resulting from intense technological development on the NCS. We laid the base for future improvements by becoming a leading company in the fields of floating production facilities and subsea development. The company grew strongly, expanded in new product markets and increased its commitment to international exploration and production.
Since 2000, our business has grown as a result of substantial investments on the NCS and internationally. Our ability to fully realise the potential of the NCS was strengthened through the merger with Hydro's oil and gas division, which also bolstered our global competitiveness. In recent years we have taken advantage of our competence to design and manage operations that function correctly in the environments they face, in order to grow our upstream activities by means of other than traditional offshore production, for example threough the development of heavy oil and shale gas projects.
Although petroleum related activities on the NCS and internationally have formed the main part of our business, we have increasingly participated in projects focusing on other forms of energy project, such as wind power and carbon capture and storage, in anticipation of the need to expand energy production, strengthen energy security and fight adverse climate change.
2.3 Statements on competitive position
Statements referring to Statoil's competitive position rely on a range of sources, including analysts' reports, independent market studies and our internal assessments of our market share.
Statements referring to Statoil's competitive position in the Business Overview and Operational Review sections are based on what we believe to be true and, in some cases, they rely on a range of sources, including investment analysts' reports, independent market studies and our internal assessments of our market share based on publicly available information about the financial results and performance of market players.
2.4 Strategy
Statoil's long-term strategy builds on the company's vision: 'Crossing Energy Frontiers'. It continues the current strategic direction of creating shareholder value as an upstream-oriented, and technology-based energy company.
Our strategy of long-term value creation, starts with our short-term deliveries on operations and HSE. As we work towards our ambition of realising the full value potential of the Norwegian Continental Shelf (NCS), we are simultaneously developing international platforms for long-term growth and gradually building a position in renewable energy production.
2.4.1.Business environment
In 2009 the world economy experienced the most severe recession since the Great Depression of the 1930s. There is still significant uncertainty as to the health of the world economy.
The recession has led to a significant reduction in energy demand in most regions. Energy prices fell significantly in the first part of the 2009, and caused a large reduction in revenues for the players in the industry. The corresponding falls in suppliers' costs have been much smaller. Thus, the industry's profitability has weakened significantly. Most energy commodity prices have showed a partial rebound during the second half of 2009 contributing to a more positive outlook for 2010.
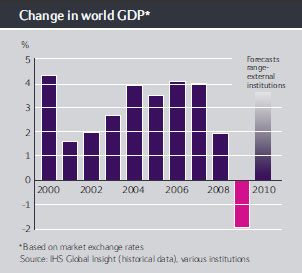
Macroeconomic outlook
After growing by more than 3% on an annual average basis during 2000-2008, the world economy in 2009 experienced the most severe recession since the Great Depression of the 1930s. Following the turbulence in the international financial system in the autumn of 2008, plunging business confidence and demand retrenchments led to a sharp contraction in global industrial production and international trade. In the first quarter of 2009 world economic activity fell by almost 4%. However, resolute and strong policy responses in all major economies stabilised the financial markets, restored general market confidence and from mid-2009 put the world economy on a moderate recovery path. China and other emerging economies in Asia provided an important stimulus to developed economies. For the year as a whole, there was a negative GDP growth of 3.4% and 1.9% for the OECD economies and the world economy, respectively.
At the beginning of 2010, the recovery of all major economies is still in progress. The rate of improvement does, however, vary across sectors and regions, as does the uncertainty of the outlook. Asia Pacific, less affected by the financial crisis and debt financed consumption, continues to grow relatively strongly, while the expansion in the United States and especially the European economies is more hesitant. This is mainly due to the household sectors' need for debt deleveraging, the high unemployment rate and the low rate of capacity utilisation in most industries. Furthermore, although the balance sheets of the financial institutions have improved during 2009, the planned banking reforms and the banks' own consolidation suggest that bank lending will continue to be restricted for some time. Overall, these forces indicate that the recovery of the world economy is expected to continue during 2010, but with a less vigorous upturn than was typical for previous business cycles.
The governments' economic rescue packages, which successfully contributed to the stabilisation and recovery in 2009, have led to severe deterioration of public finances in most OECD countries. The federal deficits of the main economies, excluding Germany, have increased from pre-crisis levels of about 1.0-2.0% of gross domestic products to an estimated 9-12% for 2010. Since these levels of public deficit are not sustainable, the outlook beyond 2010 implies a more contractive fiscal policy. This is likely to restrain the pace of economic growth beyond 2011-2012. The underlying structural global imbalances, which were among the underlying causes of the recession of 2008-2009, have been corrected only partly and temporarily. Overall, these imbalances suggest that the medium-term outlook for the world economy is still marked by uncertainty.
Energy markets and price developments
The sharp fall in world economic activity in 2008-2009 led to large reductions in energy demand in most regions of the world. Driven by a 2.1 mbd reduction in OECD oil demand, global oil demand fell by about 1.3 mbd (1.5%) from 2008 to 2009. The demand for natural gas also fell significantly in North America and Europe by 1.1 % and 6.3% (estimate), respectively. Helped by the relatively short-lived economic downturn, oil and gas demand held up reasonably well in China and non-OECD Asia. The weakness in energy demand has pushed energy prices down to levels not seen since the early 2000s.
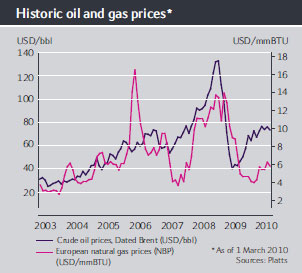
After the historical high of USD 144 per barrel (dated Brent) in mid-2008, crude oil prices plunged by about USD 100 per barrel during the second half of 2008, before levelling out in the USD 40-45 per barrel range in the first quarter of 2009. The stabilisation was helped by large cuts in Opec production, which stabilised the physical markets and prevented oil stocks from building further. Despite the high oil stocks and comfortable spare Opec production capacity, crude oil prices started to recover in the second quarter, triggered by expectations of an emerging world economic recovery and the prospect of a weaker US dollar. The upward trend in oil prices lasted throughout the year, supported by constructive macroeconomic data and relatively strong demand growth in Asian markets. By the end of 2009, prices were around USD 75 per bbl. Financial players' perceptions, portfolio optimisation and market positions were important drivers behind the 2009 oil price recovery. The average price of date d Brent in 2009 was USD 61.6 per bbl, down from USD 97.3 per bbl in 2008.
The Atlantic products' markets have also been severely hit by the economic recession. Total demand for products in the US and OECD European markets both fell by close to 0.8 million barrels per day, or more than 4%, from 2008 to 2009. Reduction in the demand for distillates, including diesel oil, gas oil and jet/kerosene accounted for about half of the total, while gasoline demand kept up relatively well in both regional markets. Lower demand for oil products led to high products stocks and downward pressure on the price differentials between oil products and crude oil. However, the relative stability of the gasoline markets led to less depressed gasoline differentials (margins), while distillate margins were at their lowest since 2003-04. Thus, refineries with a high gasoline yield were somewhat sheltered from the recession, led market developments of 2008-09.
Natural gas prices (spot) in North America and Europe, which also peaked in mid-2008, fell continuously until September 2009 on the prospect of significant oversupply. This was driven by the outlook for recession-induced demand reductions, sustained US domestic production and prospects for a steep growth in the imports of LNG into the Atlantic Basic markets. Especially in the United States, market gas prices came under downward pressure due to a concern that the need for storage capacity could exceed the actual storage capacity. Prices reached a low of about USD 2.5-3.0 per million BTU in September 2009 - the lowest level since 2002-2004. Gradually, however, it became clear that as US domestic production began to slide, natural gas captured market shares from coal in power generation, the storage surplus was not growing and significant volumes of Middle East LNG supplies were directed to Asian and European markets. The reduced supply pressure put gas prices in both markets on a moderate recov ery path, and by the end of the year US prices were back at about USD 5.70 per million BTU, close to the price levels at the beginning of the year. Although US conventional production slid further through 2009, the expansion of unconventional gas production, especially the production of shale gas, continued its sharply rising trend through the year. The European market has also been affected by lower gas demand and increased supply pressure, primarily from higher volumes of NGL and European spot prices (NBP) followed a similar pattern as US spot prices. The average NBP spot prices were reduced from USD 11.43 per million BTU in 2008 to USD 4.94 per million BTU in 2009.
European electricity prices fluctuated around a level of EUR 50-60 per MWh during 2005-08 and reached a peak of almost EUR 100 per MWh immediately after the break-out of the crisis in the financial markets in the autumn of 2008. Following the sharp decline in European economic activity during the winter of 2008-09, power demand contracted by more than 6 % (estimate) relative to the year before and pushed electricity prices to a low of EUR 30-40 per MWh. Power demand recovered during the second half of the year and pulled prices up into the EUR 40-50 per MWh range.
Prices in the European carbon dioxide market, the EU Emission Trading Scheme, tend to follow the same pattern as electricity prices as that market shares the same demand-side drivers. Carbon prices have, however, been relatively stable around EUR 13-15 per tonne during 2009. The lack of a clear direction following the Copenhagen meeting on future global and regional climate policies pushed carbon prices moderately downwards in December 2009.
The outlook for energy prices over the next few years is basically linked to the prospects for a moderate recovery of the world economy. The oil market is likely to resume the pre-crisis trends of moderate demand growth, modest to stagnant growth in non-Opec production and some expansion in Opec NGL/condensate production. This also suggests that Opec's spare production capacity will gradually be reduced. However, since oil price formation is strongly influenced by financial players, the uncertain outlook for financial markets, geopolitical developments and the US dollar will continue to be important additional drivers. The short-term outlook for the Atlantic Basin products markets is driven by a modest demand growth and the potential for products imports from several export refineries in the Middle East and Far East. The outlook for a sustained overcapacity in refining in the Atlantic Basin may at some point lead to capacity closures in Europe.
Prospects for a rebalancing of the European and North American gas markets are related to the strength of economic recovery. On the demand side, the price-driven competition with coal will continue to be important. The outlook for a further rise in US conventional gas production at relatively low costs has reduced the potential for imports to the North American markets. The prospects for increased LNG supplies into the Atlantic Basin are expected to cap significant natural gas price increases.
Industry context
Restricted upstream access, increasingly complex resources, the climate challenge and tougher financial terms have become more evident as strategic challenges for the oil and gas industry over the last 10 years. Access to resources restricts the growth potential of oil and gas companies, with a large share of the world's remaining conventional resources held by countries with limited access for international oil companies (IOCs). National oil companies have also entered the industry contest for international resources, resulting in an industry arena that is more competitive than ever. IOCs are therefore gradually being pushed to grow their asset base by accessing hydrocarbons in more remote areas, in deeper waters and in more technologically challenging environments. As a result, the contribution made by unconventional and deepwater hydrocarbons has increased by more than 10 percentage points during the last decade to make up nearly 30% of global production capacity in 2009. There are reasons to expect this trend to continue. Another key point is the global climate challenge. Climate regulation still remains uncertain post-Copenhagen, but a potential cost impact related to future policy adjustments remains a likely outcome. In addition to the access and climate challenge, industry profitability has tightened both through increasingly stringent government terms, but recently also through the margin squeeze following the financial turmoil.
The fall in oil and gas prices in the autumn of 2008 in the aftermath of the banking crisis took its toll on the industry in general. With average oil prices down by almost 40% in 2009 compared to 2008, revenues were severely hit. At the same time, suppliers' costs did not show a corresponding decrease. Data suggest that the cost level fell by 20-25% within capital intensive categories, while labour intensive supplies were reduced about 10%. Thus, overall industry profitability has significantly declined compared to 2008.

As a result of the margin squeeze, many companies have had to increase their borrowing, adjust their capital expenditure plans, re-evaluate their dividend policies, reduce their share buyback programmes and increase their focus on cost control and capital deployment efficiency through tighter prioritisation of exploration and development opportunities.
During the fourth quarter of 2008, most sources of funding dried up, and corporations with weak credit ratings had limited access to the bond market. However, the bond market recovered in 2009, especially for high-quality borrowers like the IOCs, which led to a large number of bond issues. Most of the money raised was used to finance existing operations and capital expenditure commitments rather than merger and aquisitions activities. Global E&P spending fell by some 15 - 20% in 2009. On the NCS on the other hand, the investment level grew by 14% mainly led by new field developments which are more challenging and require more resources due to their complexity and smaller size. With a more positive market sentiment and the jump in oil prices since the second quarter of last year, there is also an expectation of increased E&P spending for next year. Industry surveys indicate that global E&P expenditures will increase by approximately 10% this year. Statistics Norway suggests that th e 2010 investment level on the NCS will be slightly lower than that of 2009. Consistent with the overall themes in the industry of cost control and capital discipline, disposals of non-core assets are back on the agenda. Several assets are currently being marketed among major oil and gas companies.
Following the financial turmoil, the drop in demand has led to refinery overcapacity and pressure on margins. This is exacerbated by the start up of several export refineries in the Far East and Mid-East. In the longer term, refining overcapacity in the Atlantic basin is expected to lead to capacity closures in Europe.
The increased concerns for energy security and climate change have continued to fortify policy and long-term market drivers for commercial growth in renewables. While most renewable energy forms are more costly than fossil fuels are today, the competitive landscape is expected to shift as production costs for renewable energy decline, while the cost of carbon emissions is reflected in power and fuel prices. Significant amounts of public and private funding are currently going into research, development and expansion of new technologies in order to make renewables and Carbon Capture and Storage (CCS) more competitive.
Wind power is the largest single market for new energy, with prospects of increasingly higher production growth over time. Offshore wind is expected to take a significant share of the total wind market if several of the major countries are to achieve their renewable energy goals.
2.4.2 A strategy for value creation and growth
Statoil's strategy is to profitably grow its long term oil and gas production while gradually building a position in renewable energy production.
Overall strategic direction
Our overall long-term strategy builds on the following key components:
- Utilise our technology and management capabilities to capture the full potential of our positions on the Norwegian continental shelf (NCS).
- Deliver profitable international growth in the short and medium term from existing positions, whilst creating new opportunities for long-term value creation.
- Use exploration as a key growth tool to secure long-term production capacity.
- Develop profitable midstream and downstream positions in support of our upstream activities.
- Pursue selected business opportunities for renewable energy production and CCS.
- Apply technology and innovate in order to create value and accelerate asset developments.
- Minimise carbon emissions from, and the general environmental impact of, our upstream and midstream activities.
- Utilise organisational capabilities as a global energy company.
Short term priorities are to conduct safe and efficient operations and to deliver production growth in line with our guidance. We are transforming the way we work on the NCS in order to realise the full value potential of our positions there. We continue tight management of our cost base. Retaining financial flexibility remains important for us. In the longer term, our priorities are to optimise, mature and execute the current project portfolio, taking into account the dynamic economic environment, the globalisation of gas markets and the politically imposed framework and regulatory measures aimed at mitigating the risk of adjustment costs induced by climate change.
Utilising our capabilities
Gaining access to sufficient petroleum resources is increasingly challenging. We are seeking new opportunities in demanding areas requiring the full use of our legacy competence in technology and management. We also realise that mastering the most demanding areas qualifies us for succeeding in less demanding areas. There are four demanding areas in which Statoil has experience and competitive advantage:
- Deep water: we are active in six of the most interesting deepwater basins in the world - the Gulf of Mexico, Brazil, Angola, Nigeria, Norway and Indonesia.
- Harsh environments: we see the resource potential of the Arctic as particularly interesting, although it is a region that is not expected to deliver substantial results until the medium to longer term due to technical and environmental challenges .
- Heavy oil: we have positions in Norway, Canada, Venezuela, Brazil and the United Kingdom.
- Gas value chain: we are active in finding and delivering gas in many countries and have an extensive portfolio that includes Liquefied Natural Gas (LNG) and unconventional gas, e.g. US shale gas.
Responding to the climate challenge
Our ambition is to be an industry leader in carbon efficiency in terms of having a low climate impact in each of the activities in which we are engaged. We aim to create value by seeking low-carbon and energy-efficient competitive solutions in all areas of our business. Responding to the climate challenge in an effective manner will give our company a competitive advantage in the future.
Maximising value creation from upstream access opportunities
We will use exploration as a key growth tool to secure long term growth of reserves, production and value. This is consistent with maximising the long-term value of the NCS and with leveraging our core competencies to build, mature and deliver profitable growth outside Norway. We will continue to optimise our exploration portfolio, balancing frontier-, growth- and infrastructure led exploration.
We will continue selective business development activities to optimise the portfolio.
Maximising long-term value creation on the Norwegian continental shelf (NCS)
We maintain our position as the main industry player on the NCS.
We continuously work to improve our HSE performance and our cost and operational efficiency as well as implementing measures for improved hydrocarbon recovery (IHR). We see a structural shift in our non-sanctioned project portfolio from a few large, complex projects to a high number of mainly smaller projects or sub-sea tie-backs. This demands a high level of standardised technical concepts as well as simplified development processes.
Building and delivering profitable international growth
Our strategy is to deliver profitable international growth in the short and medium term from existing positions, while creating new opportunities for long-term value creation. We will utilise our core expertise in areas such as deep waters, harsh environments, heavy oil and the gas value chain to pursue attractive business opportunities around the world. Statoil's history as a state oil company gives us a competitive advantage in understanding host countries' needs and requirements and in working with them to develop the resource base to their benefit while creating value for our shareholders.
We anticipate that Statoil's future growth mainly will take place outside the NCS. Our short to medium-term focus is on delivering and maturing a high-quality project portfolio on time and within budget. In the longer term, our international asset base will allow us to grow and become more diversified, both in geographical terms and in types of production.
Developing profitable midstream and downstream positions
Statoil's strategy is to develop projects and to produce oil and gas where we see a potential for attractive returns and added value. We have a strong upstream focus in terms of our total value and asset base, complemented by a midstream and downstream portfolio related to marketing, trading, refining and storage of oil and gas products. We seek to capture synergies from our upstream positions and the market characteristics.
We anticipate further globalisation of the gas markets, and changes in the location of our oil and gas production. We also expect changes in consumption patterns in the aftermath of the financial crisis and as a result of the introduction of greenhouse gas mitigation measures by the authorities. We will monitor our midstream and downstream activities and adjust in a timely manner to meet the needs of markets and of our upstream positions to optimise our portfolio and maintain shareholder value.
Creating platform for renewable energy production and carbon capture and storage
Our strategy for renewable energy production and carbon management is to utilise existing core capabilities and current business positions to create profitable positions in renewable energy, prioritising offshore wind projects while keeping track of opportunities in other other areas through technology and selective investments.
We are building a portfolio of near-shore and off-shore wind farms and we are developing technology for large-scale deep water offshore wind power generation. In this context, our participation in Sheringham Shoal UK wind farm was an important milestone achieved in 2009 as was the preparation for the Forewind consortium on the Dogger Bank development to which we were awarded rights in 2010. Off the south-west coast of Norway we are piloting a prototype of the world's first full-scale floating wind turbine, Hywind, which is designed to be placed at water depths between 120 and 700 metres.
In addition, we reduce emissions of greenhouse gases from fossil energy production through carbon capture and storage (CCS).
Using technological innovation and implementation as a key business enabler
Technology is a key enabler in terms of Statoil realising its goals as an internationally competitive energy company. Our ambition is to attain distinctiveness and industrial leadership by aligning our technology and R&D efforts with our portfolio of activities and vice versa.
Based on our history of technological achievements, we actively seek to master demanding and critical developments within our priority activity areas. We prioritise technology efforts that add value to resources, and that allow us to develop smarter solutions for energy exploration and production, that are cost-effective and environmentally benign. We refine and standardise our technical requirements and work processes.
Technology innovation and implementation is critical to success in many of our activities, such as enabling field development in frontier deep waters and Arctic areas, the production of heavy oil, exploration for hydrocarbons trapped below salt, and managing environmental and climate-related issues. In addition, to enable sustainable energy provision in the long term, we aim to remain competitive in a broad range of core and emerging technologies, including offshore wind and sustainable biofuel.
2.5 E&P Norway
2.5.1 Introduction to E&P
Exploration & Production Norway consists of our exploration, field development and operations on the NCS.
Exploration & Production Norway (EPN) is the operator of 42 developed fields on the NCS. Statoil's equity and entitlement production on the NCS was 1,450 mmboe per day in 2009, which was about 75% of Statoil's total production. Acting as an operator, EPN is responsible for approximately 75% of all oil and gas production at the NCS. . In 2009, our average daily production of oil and natural gas liquids (NGL) was 784 mboe and our average daily gas production was 105.9 mmcm (3.7 bcf).
We have ownership interests in exploration acreage throughout the licensed parts of the NCS, both within and outside our core production areas. We participate in 219 licences on the NCS and are an operator for 162 of them.
As of 31 December 2009, EPN had proved reserves of 1,351 mmbbl of crude oil and 480 bcm (16,9 tcf) of natural gas, an aggregate of 4,369 mmboe.
2.5.2 E&P strategy
E&P Norway's strategy is to realise the full potential of the NCS through exploration, new developments, improved operational and drilling cost-efficiency, increased recovery from existing fields and the optimal use of existing infrastructure.
Safe and efficient operations are essential to our business
All activities in Statoil are conducted with a great focus on HSE in order to prevent harm to people and the environment. The implementation of Integrated Operations (IO) is expected to increase economic value through higher production, higher regularity and cost reductions. Upgrading and modification programmes for offshore installations are also planned with a view to maintaining safe and efficient operations.
Through our ongoing efforts to finalise the implementation of integrated operations and common work processes on all our installations on the NCS we aim to utilise best practices and optimise the use of our total resources to ensure safe and efficient operation.
Maintaining a high production level
Several fields on the NCS are maturing and production is declining. High priority will therefore be given to more efficient drilling operations, improved regularity and increased hydrocarbon recovery (IHR).
High regularity is expected to be achieved through efficient well work, better reservoir management, de-bottlenecking of export infrastructure and efficient turnarounds.
It is important to utilise unused capacity in existing infrastructure. Active near-field exploration is a key factor in extending fields' lifetime and initiating cost-effective tail-end production on fields that are in decline and/or have reached a critical point with respect to profitability.
Optimal development and exploitation of our existing portfolio is necessary in order to secure a solid foundation for future activities through continued active maturation of the project portfolio and high exploration level. New field developments are in general more challenging than before either in terms of complexity, smaller size or profitability. Hence these projects require more resources per barrel than before.
Access to new, prospective acreage is also necessary in order to maintain a high production level in the longer term. One of our ambitions is to become one of the leading players in the Arctic by 2020. Considering the long lead times for field developments, it is a pre-requisite in the near term to open new acreage. Succeeding in new field developments in the northern areas of the NCS is a priority for Statoil. Important efforts are currently under way to maintain stable operations in the Snøhvit LNG project, and to support timely and robust development of the Goliat oilfield. However, new high-quality exploration acreage remains a critical prerequisite for long-term success. To meet our ambitions in the far north, we have to address challenges in a range of areas - including geology and technology.
Gas position
The proportion of natural gas from our NCS portfolio is increasing. We have a flexible transportation system, with six different landing points on the European Continent/UK and flexibility in terms of gas deliveries from large gas-producing fields such as Troll and Oseberg.
Energy efficiency and carbon emissions
E&P Norway aims to maintain and strengthen the NCS's position as the most energy-efficient petroleum region in the world. We intend to push for energy efficiency in our day-to-day operations and evaluate new field developments in a long-term perspective with regard to energy and the environment. E&P Norway also plans to put more effort into developing a more energy-efficient supply chain with a life cycle perspective.
Industry leader on the NCS
We will maintain a stable relationship with suppliers, competitors, government and other stakeholders. The NCS is an arena for world-class innovation and technological development. Statoil is a leader in the deployment of new technology, including drilling and subsea technology, new solutions for reducing costs and the use of new technology for developing discoveries. As the largest operator on the NCS, we are leaders in the development of optimal area solutions and the overall development of the NCS.
2.5.3 E&P key events in 2009
In 2009, Exploration & Production Norway had a high level of exploration activity, and discoveries were made in 31 of 39 exploration wells.
- Total entitlement liquids and gas prodution in 2009 was 1,450 mboe per day.
- Started implementation of a new operating model for our offshore organisation in mid-2009.
- Several turnarounds completed in 2009.
- High exploration activity: 31 discoveries out of 39 exploration wells.
- New projects sanctioned:
- Goliat
- Ekofisk 2/4 V-A
- Vega South Oil
- Snorre Export
- Åsgard Gas Transfer
- Production from four new fields added total capacity of approximately 45 mboe per day:
- Yttergryta
- Alve
- Tyrihans
- Tune South
2.6 International E&P
2.6.1 Introduction to International E&P
Statoil is present in several of the most important oil and gas provinces in the world and International Exploration & Production will provide most of Statoil's future production growth.
International Exploration & Production (INT) is responsible for exploration, development and production of oil and gas outside the Norwegian continental shelf.
In 2009, the business area was engaged in production in 12 countries: Canada, the USA, Venezuela, Algeria, Angola, Libya, Nigeria, the UK, Azerbaijan, Russia, Iran and China. In 2009, INT produced 26% of Statoil's total equity production of oil and gas, and INT's share is expected to increase significantly in the future.
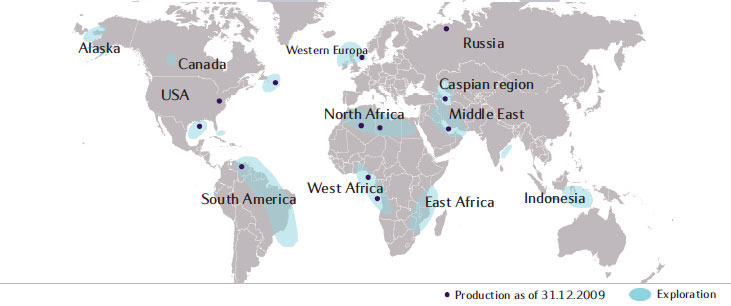
We have exploration licences in North America (Canada and the USA), Latin America (Brazil, Cuba and Venezuela), Africa (Algeria, Angola, Egypt, Libya, Mozambique, Nigeria and Tanzania), the European and Caspian area (the Faroes, Ireland, the UK and Azerbaijan), and the Middle East and Asia (Iran, India and Indonesia).
The main sanctioned development projects in which we are involved are in Canada, USA, Brazil and Angola, and we believe we are well positioned for further growth through a substantial pre-sanctioned project portfolio including the latest addition, the West Qurna 2 in Iraq. In January 2010 Statoil and Lukoil signed the development and production contract for West Qurna 2 with Iraqi authorities.
The map shows our exploration and production areas.
2.6.2.International E&P strategy
Our long-term upstream growth ambition will mainly be achieved by developing our international portfolio of assets into profitable growth.
Our four focus areas are:
- Deep waters - We will further develop our position as a leading deepwater operator. New technology made it possible to develop the Ormen Lange field with subsea installations only. We will also build on the experience gained on the Tordis field, where subsea separation and water injection is used. This experience transfer is expected to significantly increase the final recovery factors in some of the most challenging reservoirs in deep waters that we are working on, for example in the Gulf of Mexico.
- Gas value chains - Statoil has long and valuable experience in gas value chains and has demonstrated its capabilities in the monetisation of significant, often remote, gas resources. This experience will be a valuable contribution to future projects, such as Shah Deniz II and the large Marcellus shale gas accumulation.
- Harsh environments - Statoil has the ability to deliver cutting edge field developments in harsh conditions under the strictest environmental regulations. With our long experience of development and operations off the coast of Norway, we have a competitive advantage to build on. The Sn øhvit field in the Barents Sea is a project that brings natural gas to land for liquefaction and export. The onshore plant is the first of its kind in Europe and the world's northernmost liquefied natural gas facility.
- Heavy oil - We are well positioned through operatorships and ownership interests in several key heavy oil projects. In the Peregrino field off the coast of Brazil and the Bressay and Mariner fields off the coast of the UK, we will utilise our experience from fields such as Grane in the North Sea. For our large, long-term resource base in Canadian oil sands, we will draw on experiences from our involvement in the subsurface aspects of the Venezuelan Petrocede ño project. The development will benefit from technological advances deriving from research and development work at the Statoil heavy oil technology centre in Canada. The research centre is among other tasks working on improving energy efficiency, reducing emissions, and thus also reducing operating costs related to the production of heavy oil.
These focus areas all draw on the strong technical and project execution skills we have acquired through our experience on the Norwegian continental shelf. We access resources by establishing new growth platforms with the potential of becoming new focus areas; through advanced exploration activities and high-grading of exploration prospects, focused business development and long-term partnerships with national energy companies.
Iraq is our latest new platform and we have succeeded in establishing a foothold in competition with other companies. It is one of the countries in the world with the highest remaining hydrocarbon production potential, and it has been closed for foreign investment for more than 30 years. Statoil has entered into a partnership with Lukoil, one of the largest onshore operators in the world.
Our international access strategy has increased the scale of our operations in terms of produced volumes, reserves and technological and geographical breadth. We aim to build a robust, diverse and long-life portfolio which can increase our opportunities in the future.
2.6.3 International E&P key events in 2009
International E&P's average daily production exceeded 500,000 boe in 2009.
- Equity production increased by 10% from 2008, to 512 mboe/day.
- Production from three new fields started during the year.
- High exploration activity: six of the 29 exploration wells drilled in 2009 have been announced as discoveries, with several interesting discoveries in the US Gulf of Mexico (GoM), Canada and Angola. Nine wells were under evaluation at year end 2009.
- On 12 December, Statoil and Lukoil entered a winning bid for the West Qurna 2 field in the second licensing round in Iraq. Statoil's equity share will be 18.75%.
- The Ceasar Tonga project in GoM was sanctioned by the partnership.
- Production from three new fields added a total capacity of approximately 50 mboe per day (Statoil equity):
- Tahiti in GoM
- Thunder Hawk in GoM
- Gimboa test production in Angola
- Offshore installation of the first wellhead platform on the Statoil-operated Peregrino field in Brazil started in late 2009.
2.7 Natural Gas
2.7.1 Introduction to Natural Gas
The Natural Gas business area is responsible for Statoil's transportation, processing and marketing of pipeline gas and LNG worldwide, including the development of additional processing, transportation and storage capacity.
Natural Gas (NG) is also responsible for marketing gas supplies originating from the Norwegian state's direct financial interest (SDFI). In total, we account for approximately 80% of all Norwegian gas exports and are responsible for the technical operations of the majority of the export pipelines and onshore plants in the processing and transportation system for Norwegian gas (Gassled*).
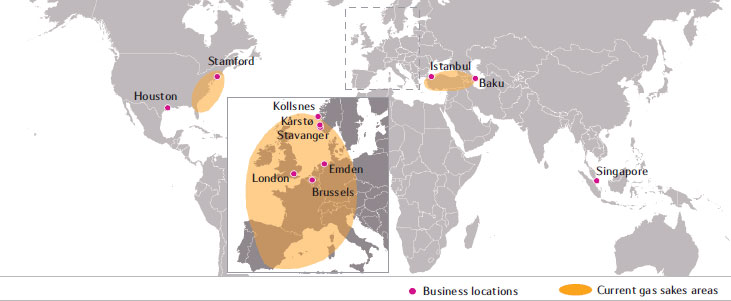
NG's business is conducted from three locations in Norway (Stavanger, Kårstø and Kollsnes) and from offices in Belgium, the UK, Germany, Turkey, Singapore, Azerbaijan and the USA (Houston and Stamford).
In 2009, we sold 38.7 bcm (1.37 tcf) of natural gas from the Norwegian Continental Shelf (NCS) on our own behalf, in addition to approximately 35.3 bcm (1.25 tcf) of NCS gas on behalf of the Norwegian state. Statoil's total European gas sales, including third party gas, amounted to 79.5 bcm (2.81 tcf) in 2009. That makes us the second largest gas supplier to Europe, with a market share of around 15% of the European gas market.
From our international positions, mainly Azerbaijan and the USA, we sold 5.3 bcm (0.19 tcf) of gas in 2009, 3.2 bcm (0.11 tcf) of which was entitlement gas.
We have a significant interest in the NCS pipeline system owned by Gassled, which is the world's largest offshore gas pipeline transportation system, totalling approximately 7800 kilometres. This network links gas fields on the NCS with processing plants on the Norwegian mainland, as well as terminals at six landing points located in France, Germany, Belgium and the United Kingdom, providing us with flexible access to customers throughout Europe.
*This system is owned by Gassled where Statoil has a 32.1% ownership.
2.7.2 Natural Gas strategy
NG's strategy is to maximise the value of our long-term sales business, increase value creation through portfolio optimisation and trading activities, and to establish new gas value chains.
NG's main task is to maximise value creation in markets that are constantly changing and deregulating, the European market in particular, by making active use of the new opportunities offered and managing risk within acceptable parameters.
We have a large European long-term gas sales contract portfolio and continuously evaluate midstream and downstream opportunities in order to take further advantage of our existing infrastructure, access to supplies, and natural gas marketing experience. Our downstream strategies may differ from region to region depending on our particular position in the area and the nature of the market in question.
In Europe, we are endeavouring to achieve greater efficiency in our existing supply portfolio, update and refine our commercial relations with key customers, and establish new positions that will improve delivery flexibility in our operations. Through balancing, optimisation from field to customer, trading activities, and sales directly to large industrial customers, we will continue to create additional value on top of our long-term sales business.
Natural gas is the focus of many exploration and business development activities carried out by both INT and EPN. A large proportion of the exploration activities on the NCS are focused on gas, and a number of INT projects focus on accessing international gas reserves.
We aim to further develop our position on the NCS and internationally through increased production and investment in existing and new fields and infrastructure aimed at serving the European and US gas markets. A necessary lever in support of this strategy is the continued development, maintenance and operation of the upstream and midstream (transport and processing) infrastructure required to safely and reliably deliver gas volumes where and when required. Efforts aimed at ensuring the safety, integrity and regularity of the infrastructure, while simultaneously upgrading and expanding the existing processing plants at Kårstø and Kollsnes, are of key importance in Norway.
The acquisition of a 32.5% interest in Chesapeake Energy's Marcellus shale gas acreage in the Appalachian basin in November 2008 will significantly strengthen our US natural gas business in terms of production, reserves and marketing (For more information, see Exploration & Production International). We will further develop our market position at the Cove Point LNG terminal on the East Coast of the USA. New midstream positions will be established in the USA in order to maximise value creation from this INT position in Marcellus. NG also plans to strengthen established market positions in Europe with gas from the NCS, the Caspian Sea and North Africa.
The main objective of NG's strategy is to utilise growth opportunities in all parts of the natural gas business and fully exploit the opportunities that changing market conditions provide. This means an increased focus on extracting value from the existing contracts and asset portfolio and on increasing the value added from trading and optimisation activities beyond the landing point. It also entails increased internationalisation of the gas business, including activities in North America, the Caspian region, LNG growth and the addition of new markets.
2.7.3 Natural Gas key events in 2009
Natural Gas delivered record operating income under challenging market conditions
- Strong Marketing & Trading results. NG delivered a record high trading result in 2009 due to our downstream positions and our ability to capitalise on price volatility. In addition we concluded approximately 8 bcm of new sales for the period 2009-2012.
- We maintained the value of our contract portfolio and were able to take advantage of volatile prices.
- Aldbrough gas storage in the UK. The facility began partial commercial operations in two caverns on 9 June 2009 .
- Naturkraft gas power plant at Kårstø. Naturkraft commenced commercial operation on 26 February 2009.
2.8 Manufacturing and Marketing
2.8.1 Introduction to Manufacturing & Marketing
Manufacturing & Marketing adds value through the processing and sale of the group's and the Norwegian state's production of crude oil and natural gas liquids.
Manufacturing & Marketing (M&M) is responsible for the group's combined operations in the transportation of oil, processing, sale of crude oil and refined products, retail activities and marketing of natural gas in Scandinavia. We operate in 13 countries, run two refineries, one methanol plant and three crude oil terminals. Our international trading activities make Statoil one of the world's largest crude oil traders. Over one million customers visit our 2000 service stations daily, and we operate an international lubricants and aviation fuel business.
Approximately 13,000 people from 30 nations work for M&M, around 10,000 outside Norway. In 2009, we traded 721 mmbbl of crude oil and condensate, approximately 25 million tonnes of refined oil products and 11.7 million tonnes of natural gas liquids (NGL). The refinery throughput was 15.0 million tonnes. Tjelbergodden produced approximately 10% of the European market's demand for methanol. In the energy and retail market, we sold approximately 12 billion litres in 2009, including 8 billion litres of petrol and diesel. Aviation fuelled over 70 airports worldwide and lubricant was distributed to 40 countries.
2.8.2 Manufacturing & Marketing strategy
M&M creates efficient, integrated oil value chains with competitive midstream and downstream positions.
M&M's main task is to maximise the value of Statoil's upstream production of crude oil and natural gas liquids (NGL) through professional refining and marketing. For this purpose, M&M has established efficient, integrated value chains with competitive midstream and downstream assets.
M&M's goal of safe, reliable and cost-efficient operations is the basis for further development of our market position. We will continue to pursue improvement opportunities and conduct necessary restructuring of our activities.
We will ensure high value creation based on Statoil's legacy assets on the Norwegian continental shelf, and a strong market position in North West Europe will continue to be a high priority.
Based on growing international upstream production, M&M will further develop regional trading hubs, with special emphasis on heavy oil activities. Statoil's heavy oil production in Canada and Brazil and our terminal asset on the Bahamas are important stepping stones.
M&M will continue to develop business-critical expertise and establish best practise in our work processes. We have developed a framework for deploying expertise throughout the organisation, with special emphasis on value chain expertise.
Oil sales, trading and supply (OTS)
OTS will continue to strengthen our global trading position, with an increased presence and activity in strategic regions such as the Americas and Asia, while maintaining our established market position in North West Europe. We will continue to develop business and infrastructure to secure market access and competitive pricing for our volumes worldwide. Trading infrastructure and sound logistical solutions give our business a competitive edge.
The acquisition of the South Riding Point Terminal in the Bahamas in 2009 will enable us to develop our trading around both equity and third party volumes sourced globally. OTS will continue to market Statoil's increasingly global upstream production both in conventional grades but even more importantly in extra heavy oils.
Manufacturing
Manufacturing's ambition is to contribute to maximising the value of Statoil's feedstocks from field to end user and to be an active downstream partner in the internationalisation of Statoil.
Manufacturing is preparing for the challenging market outlook that the European refining industry is facing. We are seeking to improve Mongstad and Kalundborg's competitive position by improving product yields, reliability and energy efficiency and by reducing costs while maintaining HSE performance.
Our ambition is to strengthen the value chain between our manufacturing and trading units and add value through more proactive integration of the operation of the Mongstad and Kalundborg refineries. This creates synergies through crude feedstock optimisation, greater flexibility and exchange of products between the refineries.
Energy and retail
Transportation fuel is the core of our energy and retail business (E&R), delivering 60% of gross income. Scandinavia and the Baltic region including Poland are the key geographical areas. In these markets, E&R is number one or two in terms of market share, with the exception of Poland where we are among the top five. In addition, we have a few stations in Murmansk and St Petersburg. Our engagement in the sale of heating oils and other stationary energy products is being reduced.
Our ambition is to improve profitability from our leading position in Scandinavia and to grow further on the eastern axis, building on our strong Baltic and Polish positions. We continually evaluate market opportunities based on the Scandinavian marketing concept. Acquisitions have recently been made in the automat sector and our ambition is to develop this market sector in parallel with our full-service offering. An important building block in realising this ambition is to be the environmental leader in our markets, with a first mover position in biofuels.
Statoil's Board of Directors has approved a proposal to create a stand-alone Energy & Retail business through an initial public offering (IPO) on the Oslo Stock Exchange. The IPO will take place at the earliest in the fourth quarter of 2010 or at a time when the capital market is deemed favourable for such an offering. Statoil intends to remain a majority shareholder of Energy & Retail at the time of the initial public offering and listing. The size and time horizon of Statoil's future ownership in Energy & Retail will be tailored to support and develop company value both for Energy & Retail and for the Statoil Group. The introduction of the new ownership structure is not expected to have a significant impact on the financial statements.
2.8.3 Manufacturing & Marketing key events 2009
Significantly lower margins in 2009 were challenging for the refining industry. The South Riding Point oil terminal lease boosted our international trading activities, while the JET business was successfully integrated into Scandinavian Energy and Retail.
- A challenging refining market, with a drop of from USD 8.3 to USD 4.3 per barrel in FCC refining margins.
- Impairment write-down of refineries reflecting the refining margin outlook.
- The combined heat and power (CHP) plant at Mongstad produced its first power for delivery to the grid in October 2009, with commissioning planned to continue into 2010.
- The sale or closure of all Hydro-branded stations in Sweden was completed in 2009. Closure of more than 400 stations.
- Restructuring and portfolio optimisation in stationary energy:
- Sold, or agreed to sell our downstream interests in gas companies located in Norway, Denmark and Sweden.
- The heating pellets, bottled gas and electricity businesses in Scandinavia sold.
- The international lubricants production will be centralised to Sweden, and the plant at Fagerstrand in Norway will be closed.
- Statoil's board of directors decided in March 2010 to change the ownership structure for the energy & retail business through a partial listing on the Oslo Stock Exchange.
- Acquisitions:
- The long-term lease of the South Riding Point oil terminal in the Bahamas acquired in October 2009.
- Our energy and retail business completed the integration of the JET stations in Scandinavia during 2009.
2.9 Technology and New Energy
2.9.1 Introduction to Technology & New Energy
Technology & New Energy is responsible for the development of technology and renewable energy, thereby contributing to solutions that cross energy frontiers.
Technology & New Energy (TNE) is responsible for ensuring capacity and expertise in the field of technology in addition to creating distinct technological solutions for global growth. This includes delivering innovative and competitive technological solutions for exploration, increased recovery, field development and safe, efficient and environmentally friendly operations. The research and development division, which has research centres in Trondheim, Bergen and Porsgrunn in Norway and in Calgary in Canada, is engaged in research and development as well as the piloting of new technology.
Climate change, supply security and a growing demand for clean energy are opening up new business opportunities for Statoil, particularly in Carbon Capture and Storage (CCS) and offshore wind. Statoil is in a position to seize these opportunities by utilising core capabilities from the oil and gas industry. Statoil's New Energy business entity is responsible for the company's business efforts in renewable energy. The activities are grouped under renewable energy production, new options and carbon dioxide management.

2.9.2 Technology & New Energy strategy
Statoil's technology strategy focuses on generating value by identifying, developing and applying technologies for securing maximum value from the Norwegian continental shelf (NCS), as well as establishing a position within renewables.
Technology strategy
Statoil's strategy is to maximise value as an international technology-based energy company. The objectives of the corporate technology strategy are to: (i) identify those technologies that will help the company to develop as a profitable, performance-driven, internationally competitive organisation; and (ii) guide the company's future growth in certain areas that can lead to substantial technology differentiation.
The strategy is focused on generating long-term business value through leading technology application. Its realisation will require the combined efforts of our technical staff to increase the value of existing business, secure and develop platforms for further growth and operate in new and more challenging environments. The strategy is upstream-motivated, although some weight is placed on energy diversification. Operational excellence and an HSE performance that is at the forefront in the industry underpin all our activities.
The corporate technology strategy is driven by the central business challenges and aims to build even stronger industry positions. Technology is a key enabler in relation to achieving this, and it will make significant contributions to field development in frontier deep waters (for example the Gulf of Mexico and Brazil), heavy oil production (for example Canadian oil sands, Venezuela and Peregrino in Brazil), and in arctic and sub-arctic regions with the focus on minimising risk to the environment and using our experience of operating in harsh weather conditions. Our ambition is to achieve distinctiveness and industry leadership in selected technologies and to stay competitive in a broad range of core and emerging technologies along the energy provision value chain, such as offshore wind and marine biofuel.
Efforts to standardise technology, secure fast track resource maturation and cost-efficient development solutions for mature resource areas contribute to the continued development of breakthrough and enabling technologies for frontier areas.
Furthermore, improved oil recovery (IOR) and improved drilling and well solutions are important in order to successfully grow our business. Statoil has achieved some of the petroleum industry's highest recovery factors on the NCS by combining scientific and engineering capabilities and introducing new technology. We intend to further advance the most important technologies to meet forthcoming IOR ambitions on the NCS and internationally. Drilling and well technology plays a key role in increasing production and ensuring regular delivery, and through its application we intend to achieve faster operations, reduced downtime and improved well flow, while improving safety during operations.
Technology development and deployment are carried out in close cooperation with national and international universities, research institutes, vendors and contractors. The split between external and internal research and development spending is around 50/50.
New Energy
Statoil's strategy for New Energy and carbon management is to utilise our core capabilities and current business positions to build a business with substantial value creation in the short and longer term. We will emphasise technologies where we can add value as a result of our offshore oil and gas expertise and experience. The main focus areas are offshore wind and carbon management. However, with the new energy industry still in an early phase of development, it is too early to "pick all the winners" of the future, so we are considering additional options in selected areas, such as second generation marine biofuels, geothermal, solar, hydrogen and other offshore renewables like wave and tidal energy. We also believe that our involvement has the potential to add value to certain oil and gas activities in the company, particularly in carbon management.
2.9.3 Technology & New Energy key events in 2009
This is an overview of key events related to TNE in 2009.
Technology
- The world's deepest hot tap operations on a pressurised pipeline were carried out on the Ormen Lange field in the Norwegian Sea during early August.
- New drilling and well technology developed by Statoil and FMC Technologies has been successfully tested on the Åsgard field in the Norwegian Sea. The new technology, called "Through tubing rotary drilling" (TTRD), enables old wells to be reused in a much simpler and more inexpensive way than previously.
- Statoil has introduced light well intervention (LWI) vessels on a large scale, with two such ships in operation all year round on the NCS. Compared with the use of traditional drilling rigs, these units cut the cost of well intervention work.
- Science education for the younger generation is part of Statoil's Academia programme. This June, a pilot - Newton energy room - financed by Statoil opened in Trondheim.
- Steerable line drilling pilot was a success. It will improve ability to drill in depleted reservoirs and unstable formations.
New Energy
- Statoil and Statkraft have decided to develop the 315MW Sheringham Shoal Offshore Wind Farm in the UK, providing energy to 220,000 British homes.
- Hywind, the world's first full-scale floating offshore wind turbine, started operation in autumn 2009 - enabling testing of the next generation of offshore wind technology.
- Construction of the European CO2 Technology Centre Mongstad (TCM) started in June 2009.
2.10 Projects & Procurement
2.10.1 Introduction to Projects & Procurement
Projects & Procurement is responsible for planning and executing all major development and modification projects, as well as for project and operational procurements within Statoil, including securing rig capacity based on the corporate rig strategy.
Our goal is to be world-class in terms of project execution and to deliver on time and within budget, in accordance with high HSE standards and agreed quality standards. To become a truly global energy player, it is essential that Statoil is able to execute projects at the very highest level, and thereby strengthen the company's international competitiveness.
Our current portfolio consists of more than 120 modification and development projects in the execution phase, with an expected total investment cost of more than NOK 200 billion. A large part of the portfolio consists of activities related to ongoing redevelopment efforts aimed at maximising production from the NCS.
2.10.2 Projects & Procurement strategy
Our strategy is to develop high-quality, efficient projects, as planned, and in a safe and reliable manner.
The ability to utilise the company's world-leading technology, execute projects in complex surroundings and demonstrate our core expertise in new markets is of vital importance in terms of opening up new business opportunities. The fight for global resources is fierce, but one Statoil is familiar with. The real challenge lies in local markets, local practices, new standards and new cultures. These unfamiliar settings affect price, availability, quality and lead times for deliveries.
We have great diversity in our project portfolio. On the NCS, many of our projects are related to redeveloping and upgrading existing fields and installations. These types of projects are often very complex, but the reward is a prolonged lifetime and increased recovery rates for our installations.
Moreover, a number of small satellite fields are being tied in to existing hubs. These projects are often part of the group's fast track programme, whose aim is to significantly shorten the time from discovery to production. Industrial standardisation is a key element in achieving this.
Internationally, our portfolio consists of fairly few, but large projects. Success relies on our ability to utilise our expertise and experience from the NCS. Our flagship is the Peregrino project off the coast of Brazil, Statoil's first operated mega project outside Norway. Furthermore, we are gaining valuable experience in Canada, where the Leismer demonstration project for heavy oil recovery is being developed.
Within renewable energy, the world first floating windmill was successfully completed in 2009 - the Hywind project. In addition to this, 88 windmills are being built off the east coast of England for the Sheringham Shoal project, thus gaining expertise in the execution of large projects in offshore wind.
A technology centre for carbon capture and storage is being built at Mongstad, the first step in developing a groundbreaking full-scale carbon capture plant.
We are dependent on the cooperation of a highly professional supply industry. We therefore seek to ensure a high degree of diversity among our suppliers, and are continuously on the lookout for innovative solutions and access to the best qualified expertise and external resources.
Securing sufficient flexibility in changing market conditions is a key focus area, and we expect our suppliers to adjust accordingly. Our activity level has remained high despite the world economic and financial situation having been very volatile in the past year. Although price reductions have been evident across most of our procurement segments, it is still a challenge to reduce market prices sufficiently to develop marginal fields. We therefore continue to seek cost optimisation, improvement in quality, productivity and efficiency in collaboration with our suppliers.
2.10.3 Projects key events in 2009
Key events in Projects & Procurement in 2009 include the successful start ups on Alve and Tyrihans, and completion of Hywind and the final platform at South Pars.
- The hull for the Gjøa semi platform has been transported from the Samsung yard in Korea to Stord. Mating of the hull and the platform topside was completed successfully on 27 December.
- Development of the Peregrino field off the coast of Brazil has proceeded according to plan. The substructure for the first drilling and wellhead platform was successfully installed on the seabed in November 2009, and the platform deck and modules were installed in January 2010.
- Production from the Yttergryta field on Haltenbanken started on 5 January 2009, only seven months after government approval of the PDO.
- Production from the Alve field started on 19 March.
- Production from the Tyrihans field started on 8 July.
- Production from the third and final platform on the South Pars phase 6-8 field started on 11 October.
- Major modifications of the Snøhvit LNG facilities were completed and production recommenced on 17 December.
- The world's first floating offshore windmill, Hywind, has been installed off the coast of Karmøy, Norway. Power production started on 21 September. Development of the Sheringham Shoal offshore wind park off the east coast of UK was sanctioned in March 2009. The wind farm, consisting of 88 windmills, is scheduled to start power production in 2011.
3 Operational review
Statoil's operational review is in accordance with the organisation of its operations, whereas certain disclosures about oil and gas reserves are based on geographical areas as required by the SEC.
Statoil prepares its operational review in accordance with its segment (business area) structure. Each business area is presented individually, and includes underlying business clusters according to how the business area organises its operations.
For further information on extractive activities, refer to sections 3.1 Operational review - E&P Norway and 3.2 Operational review - International E&P for descriptions of Exploration and Production Norway and International Exploration and Production, respectively.
Statoil prepares its disclosures for oil and gas reserves and certain other supplemental oil and gas disclosures based upon geographical areas as required by the SEC. The geographical areas are defined by continent, and consist of Eurasia, Africa and the Americas. Relevant information is further split into Norway and Eurasia excluding Norway.
For further information on disclosures for oil and gas reserves and certain other supplemental disclosures based upon geographical areas as required by the SEC, refer to section 3.8 Operational review - Production volumes and price information and section 3.9 Operational review - Proved oil and gas reserves.
3.1 E&P Norway
3.1.1 The NCS portfolio
3.1.1.1 Core production areas
Statoil's NCS portfolio consists of licences in the North Sea, the Norwegian Sea and the Barents Sea.
We have organised our production operations into four business clusters - Operations West, Operations North Sea, Operations North and Partner Operated Fields. The Operations West and Operations North Sea clusters cover our licences in the North Sea. Operations North covers our licences in the Norwegian Sea and in the Barents Sea. Partner Operated Fields cover the whole NCS.
The fields in each area use common infrastructure, such as production installations and oil and gas transport facilities where possible. This reduces the investment required to develop new fields. Our efforts in these core areas will also focus on finding and developing smaller fields through the use of existing infrastructure and on increasing production by improving the recovery factor.
We are making active efforts to extend production from our existing fields through improved reservoir management and the application of new technology.
3.1.1.2 Potential producing areas
In addition to the producing areas, we operate a significant number of exploration licences. The exploration acreage is located both in undeveloped frontier areas and close to infrastructure and producing fields.
NCS
At the end of 2009, the total licensed acreage on the Norwegian continental shelf (NCS) covers an area of 130,142 square kilometres split between 413 licences - an increase of 27 licences from 2008. Statoil had interests in 219 licences covering an area of 59,107 square kilometres and was operator for 162 of the 219 licences. Compared with 2008, the total number of licences in which we have interests has increased by one.
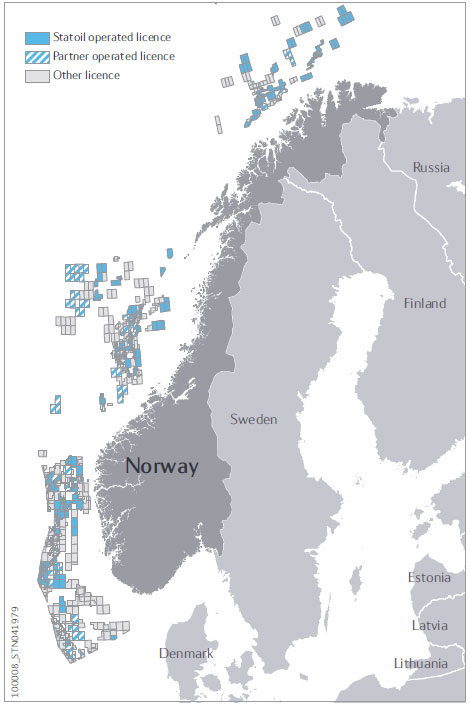
North Sea
The total licensed acreage in the North Sea covers 63,591 square kilometres split between 240 licenses. We have interests in 22,507 square kilometres split between 113 licences, and we operate 86 of the 113 licences. Seven licences have been relinquished as a result of completion of committed work programmes for licences, prospectivity evaluation and portfolio high-grading. Furthermore, we have partly relinquished acreage in eight licences in order to minimise area fee costs. Three new licences were farmed into in 2009, and we were awarded three licences in the Awards in Predefined Areas 2008 (APA 2008). We became operator of one of them. In addition, we were awarded one licences extension as operator. One new licence and five licence extensions were awarded to us in the APA 2009. We became operator of the new licence and three of the licence extensions.
Norwegian Sea
The total licensed acreage in the Norwegian Sea covers 46,790 square kilometres split between 131 licences. We have interests in 23,794 square kilometres split between 79 licences, and we operate 54 of the 79 licences. In the deepwater region, we have interests in licences covering approximately 12,300 square kilometres. Three licences were relinquished in 2009 as a result of completion of committed work programmes, prospectivity evaluation and portfolio high-grading. Furthermore, we have partly relinquished acreage in four licences in order to minimise area fee costs. We were awarded one new licence in the APA 2008 where we became operator. In addition, we were awarded three licences extension and we are operator of two of these. We were awarded three licences in the 20th Round, and we became operator of two of them. One new licence and one licence extension were awarded to us in the APA 2009, and we became operator for both of those.
Barents Sea
The total licensed acreage in the Barents Sea covers 19,761 square kilometres split between 42 licences. We have interests in 12,806 square kilometres split between 27 licences, and we operate 22 of the 27 licences. Four licences were relinquished and eight licences partly relinquished in 2009 as a result of completion of committed work programmes, prospectivity evaluation and portfolio high-grading. We were awarded three licenses in the 20th Round, and we became operator of two of them. Statoil did not apply for acreage in the Barents Sea in the APA 2008 or the APA 2009 as we are well positioned in acreage in the Hammerfest Basin that we believe is more prospective than the acreage that was announced.
3.1.1.3 Portfolio management
The licence portfolio is continuously optimised, and our core areas and strategies will be strengthened and supported through active portfolio management.
A sales and purchase agreement was signed with Lundin Norway AS in 2009 for Statoil to farm in to three of its licences. Statoil acquired 30% of PL359 and 30% of PL410 in the Utsira High Area, as well as 10% of PL409 south of the Utsira High Area. Several interesting discoveries have recently been made in this area.
Furthermore, several transactions have been carried out involving the farming-in and farming-out of exploration licences.
3.1.2 Exploration on the NCS
Statoil has carried out an extensive exploration drilling campaign on the NCS in 2009 by completing 39 exploration wells; 30 wildcat wells to test new prospects and nine appraisal wells to establish the extent and size of previous discoveries.
By drilling the untested prospects we proved 22 new discoveries, resulting in a discovery rate of more than 70% for the 30 wildcat wells.
The presence of hydrocarbons was affirmed by all the nine appraisal wells, so the total result for exploration drilling in 2009 shows that 31 of the 39 exploration wells successfully proved or confirmed the presence of hydrocarbons. We operated 34 of the 39 exploration wells. In addition, we operated two exploration extensions that resulted in two new discoveries.
The most important discoveries in 2009 were Asterix, Gro, Katla and Beta West, all except Gro are Statoil-operated. In the Norwegian Sea, the Asterix (PL327) gas discovery, located approximately 80 kilometres west of Luva, is strategically important in relation to building the basis for a potential deepwater gas development in the Vøring Basin. The Gro (PL326) gas discovery located approximately 50 kilometres south-west of Asterix is promising, but needs further evaluation and appraising before concluding on the resource potential. In the North Seas, the Katla (PL104) oil/gas discovery opens the prolific Oseberg Area to the south, and, in the Sleipner Area, the Beta West (PL046) gas/condensate discovery broadens this area's exploration potential already proven by the Dagny/Ermitrude finds.
The table below shows our exploration and development wells drilled on the NCS during the last three years.
| 2009 | 2008 | 2007 |
North Sea |
|
|
|
Statoil operated exploratory | 23 | 13 | 11 |
Successful | 18 | 8 | 9 |
Dry | 5 | 5 | 2 |
Statoil operated development | 72 | 75 | 87 |
|
|
|
|
Partner operated exploratory | 1 | 4 | 0 |
Successful | 1 | 2 | 0 |
Dry | 0 | 2 | 0 |
Partner operated development | 17 | 13 | 16 |
|
|
|
|
Norwegian Sea |
|
|
|
Statoil operated exploratory | 10 | 14 | 6 |
Successful | 8 | 11 | 3 |
Dry | 2 | 3 | 3 |
Statoil operated development | 19 | 13 | 12 |
|
|
|
|
Partner operated exploratory | 4 | 1 | 3 |
Successful | 3 | 1 | 1 |
Dry | 1 | 0 | 2 |
Partner operated development | 1 | 3 | 2 |
|
|
|
|
Barents Sea |
|
|
|
Statoil operated exploratory | 1 | 7 | 3 |
Successful | 1 | 5 | 2 |
Dry | 0 | 2 | 1 |
Statoil operated development | 0 | 0 | 0 |
|
|
|
|
Partner operated exploratory | 0 | 0 | 1 |
Successful | 0 | 0 | 1 |
Dry | 0 | 0 | 0 |
Partner operated development | 0 | 0 | 0 |
Totals |
|
|
|
Exploratory | 39 | 39 | 24 |
Successful | 31 | 27 | 16 |
Dry | 8 | 12 | 8 |
Development | 109 | 104 | 117 |
|
|
|
|
3.1.3 Oil and gas reserves on the NCS
At the end of 2009, we had a total of 1,351 mmbbl of proved oil reserves and 480 bcm (16.9 tcf) of proved natural gas reserves on the NCS.
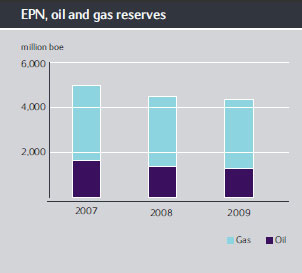
Measured in barrels of oil equivalents (boe), our NCS proved reserves consist of 31% oil and 69% natural gas, based on total NCS proved reserves of 4,369 mmboe.
One project on the NCS, the Goliat field in the Barents Sea, was sanctioned in 2009 and contributed positively to the reserves balance. In addition, approval of future development plans for several of our producing fields contributed positively. Future extension of the license period is now assumed reasonably certain on the NCS, increasing the proved reserves for certain fields.
The share of developed reserves at year end is 3,548 mmboe, which is 81% of the proved reserves. Of the 2009 proved developed reserves, 1,028 mmboe are oil and 401 bcm (14.1 tcf) are natural gas.
The following table shows our total NCS proved reserves as of 31 December for each of the last three years. Further information on reserves can be found in section 3.9 Operational review - Proved oil and gas reserves and in note 35 - Supplementary oil and gas information - to our Consolidated Financial Statements, which also explains revisions to the methodology for reserve etsimation for 2009 compared with earlier years.
| Oil/NGL | Natural gas | Total | ||
Year |
| mmbbls | bcm | bcf | mmboe |
2009 | Proved reserves end of year | 1,351 | 480 | 16,938 | 4,369 |
| of which, proved developed reserves | 1,028 | 401 | 14,138 | 3,548 |
2008 | Proved reserves end of year | 1,396 | 498 | 17,581 | 4,529 |
| of which, proved developed reserves | 1,113 | 410 | 14,482 | 3,693 |
2007 | Proved reserves end of year | 1,604 | 535 | 18,893 | 4,971 |
| of which, proved developed reserves | 1,187 | 427 | 15,084 | 3,875 |
3.1.4 Production on the NCS
In 2009, our total entitlement oil and NGL production in Norway was 286 mmbbl, and gas production was 38.7 bcm (1,366 bcf), which represents an aggregate of 1.450 mmboe per day.
The following table shows the NCS production fields and field areas in which we are currently participating. Field areas are groups of fields operated as a single entity.
|
|
|
|
|
|
|
|
| |
|
|
|
|
|
|
| Producing wells |
| |
Business cluster | Georgraphical area | Statoils equity interest in %(1) | Operator | On stream | License expiry date |
| Oil | Gas | Average daily production in 2009 mboe/day |
Operations North Sea |
|
|
|
|
|
|
|
|
|
Sleipner Øst | The North Sea | 59.60 | Statoil | 1993 | 2028 |
|
| 10 | 24.2 |
Sleipner Vest | The North Sea | 58.35 | Statoil | 1996 | 2028 |
|
| 18 | 95.2 |
Gungne | The North Sea | 62.00 | Statoil | 1996 | 2028 |
|
| 4 | 15.0 |
Troll Phase 1 (Gas) | The North Sea | 30.58 | Statoil | 1996 | 2030 |
|
| 39 | 131.2 |
Troll Phase 2 (Oil) | The North Sea | 30.58 | Statoil | 1995 | 2030 | (2) | 113 |
| 41.8 |
Fram | The North Sea | 45.00 | Statoil | 2003 | 2024 |
| 9 |
| 30.2 |
Kvitebjørn | The North Sea | 58.55 | Statoil | 2004 | 2031 |
|
| 10 | 83.3 |
Visund | The North Sea | 53.20 | Statoil | 1999 | 2023 |
| 6 | 1 | 26.8 |
Grane | The North Sea | 36.66 | Statoil | 2003 | 2030 | (3) | 25 | 0 | 62.2 |
Veslefrikk | The North Sea | 18.00 | Statoil | 1989 | 2015 |
| 18 | 0 | 2.2 |
Huldra | The North Sea | 19.88 | Statoil | 2001 | 2015 |
| 0 | 5 | 4.3 |
Glitne | The North Sea | 58.90 | Statoil | 2001 | 2013 |
| 6(4) | 0 | 3.8 |
Heimdal | The North Sea | 29.87 | Statoil | 1985 | 2021 | (5) | 0 | 6 | 1.2 |
Brage | The North Sea | 32.70 | Statoil | 1993 | 2015 | (6) | 22 | 0 | 10.9 |
Vale | The North Sea | 28.85 | Statoil | 2002 | 2021 |
|
| 1(7) | 1.8 |
Vilje | The North Sea | 28.85 | Statoil | 2008 | 2021 |
| 2 |
| 7.7 |
Volve | The North Sea | 59.60 | Statoil | 2008 | 2028 |
| 3 |
| 32.8 |
Total Operation North Sea |
|
|
|
|
|
| 204 | 94 | 574.4 |
|
|
|
|
|
|
|
|
|
|
Operations West |
|
|
|
|
|
|
|
|
|
Statfjord Unit | The North Sea | 44.34 | Statoil | 1979 | 2026 |
| 93(8) | 2 | 54.5 |
Statfjord Nord | The North Sea | 21.88 | Statoil | 1995 | 2026 |
| 7 |
| 1.1 |
Statfjord Øst | The North Sea | 31.69 | Statoil | 1994 | 2026 | (9) | 7 |
| 3.4 |
Sygna | The North Sea | 30.71 | Statoil | 2000 | 2026 | (10) | 3 |
| 0.7 |
Gullfaks | The North Sea | 70.00 | Statoil | 1986 | 2016 |
| 105 | 9 | 137.0 |
Snorre | The North Sea | 33.32 | Statoil | 1992 | 2015 | (11) | 34 | 0 | 38.9 |
Tordis area | The North Sea | 41.50 | Statoil | 1994 | 2024 |
| 6 | 0 | 7.9 |
Vigdis area | The North Sea | 41.50 | Statoil | 1997 | 2024 |
| 10 | 0 | 21.1 |
Gimle | The North Sea | 65.13 | Statoil | 2006 |
|
| 2 |
| 3.9 |
Oseberg | The North Sea | 49.30 | Statoil | 1988 | 2031 |
| 59 |
| 105.8 |
Tune | The North Sea | 50.00 | Statoil | 2002 | 2032 |
|
| 4 | 10.5 |
Total Operations West |
|
|
|
|
|
| 326 | 15 | 384.8 |
|
|
|
|
|
|
|
|
|
|
Operations North |
|
|
|
|
|
|
|
|
|
Alve | The Norwegian Sea | 85.00 | Statoil | 2009 | 2029 |
| 1 |
| 21 |
Kristin | The Norwegian Sea | 55.30 | Statoil | 2005 | 2033 | (12) | 12 | 0 | 64.9 |
Norne | The Norwegian Sea | 39.10 | Statoil | 1997 | 2026 |
| 12 | 0 | 16.6 |
Urd | The Norwegian Sea | 63.95 | Statoil | 2005 | 2026 |
| 5 | 0 | 4.1 |
Heidrun | The Norwegian Sea | 12.41 | Statoil | 1995 | 2024 |
| 34(13) | 0 | 11.8 |
Åsgard | The Norwegian Sea | 34.57 | Statoil | 1999 | 2027 |
| 0 | 39 | 128.9 |
Mikkel | The Norwegian Sea | 43.97 | Statoil | 2003 | 2022 | (14) | 0 | 3 | 24.2 |
Njord | The Norwegian Sea | 20.00 | Statoil | 1997 | 2021 & 2023 | (15) | 8(16) | 1 | 12.6 |
Tyrihans | The Norwegian Sea | 58.84 | Statoil | 2009 | 2029 |
| 3 | 0 | 20.4 |
Snøhvit | The Barents Sea | 33.53 | Statoil | 2007 | 2035 |
| 0 | 6 | 23.6 |
Yttergryta | The Norwegian Sea | 45.75 | Statoil | 2009 | 2027 |
| 0 | 1 | 4.5 |
Total Operations North |
|
|
|
|
|
| 75 | 50 | 332.5 |
|
|
|
|
|
|
|
|
|
|
Partner Operated Fields |
|
|
|
|
|
|
|
|
|
Ormen Lange | The Norwegian Sea | 28.92 | Shell | 2007 | 2041 |
|
| 10 | 112.0 |
Ekofisk area | The North Sea | 7.60 | ConocoPhillips | 1971 | 2028 |
| 150 | 0 | 24.2 |
Ringhorne Øst | The North Sea | 14.82 | ExxonMobil | 2006 | 2030 |
| 3 |
| 4.2 |
Sigyn | The North Sea | 60.00 | ExxonMobil | 2002 | 2018 |
| 1 | 2 | 14.2 |
Enoch | The North Sea | 11.78 | Talisman | 2007 | 2018 |
| 1 |
| 0.8 |
Skirne | The North Sea | 10.00 | Total | 2004 | 2025 |
|
| 2 | 2.6 |
Total Partner Operated Fields |
|
|
|
|
|
| 155 | 14 | 158.1 |
Total |
|
|
|
|
|
| 760.0 | 173.0 | 1,449.8 |
|
|
|
|
|
|
|
|
|
|
(1) Equity interest as of December 31, 2009. | (8) 89 single completed wells, 4 multiple completed wells | ||||||||
(2) Troll Phase 2 (Oil) has 64 multi branched wells | (9) PL037 expires in 2026 and PL089 expires in 2024 | ||||||||
(3) Grane has 9 multi branched wells | (10) PL037 expires in 2026 and PL089 expires in 2024 | ||||||||
(4) Glitne 1 multi branched well | (11) PL089 expires in 2024 and PL057 expires in 2015 | ||||||||
(5) PL036 expires in 2021 and PL102 expires in 2025. The owner | (12) PL134B expires in 2027 and PL199 expires in 2033 | ||||||||
share of the topside facilities is 39,44%, however the owner share | (13) 1 multi branched well | ||||||||
of the reservoir and production is 29,87%. | (14) PL092 expires in 2020 and PL121 expires in 2022 | ||||||||
(6) PL185 expires in 2015 and PL053B and PL055 both expire in 2017 | (15) PL107 expires in 2021 and PL132 expires in 2024 | ||||||||
(7) Vale 1 multi branched well | (16) 1 multi branched well | ||||||||
The following table shows our average daily entitlement production of oil, including NGL and condensates, and natural gas for each of the years ending 31 December 2009, 2008 and 2007.
| For the year ended December 31, | ||||||||
| 2009 | 2008 | 2007 | ||||||
| Oil and NGL | Natural gas |
| Oil and NGL | Natural gas |
| Oil and NGL | Natural gas |
|
Area production | mbbl | mmcm | mboe | mbbl | mmcm | mboe | mbbl | mmcm | mboe |
Operations North | 175 | 25 | 332 | 175 | 22 | 314 | 181 | 19 | 303 |
Operations North Sea | 269 | 49 | 574 | 250 | 49 | 558 | 236 | 56 | 590 |
Operations West | 297 | 14 | 385 | 355 | 19 | 477 | 362 | 16 | 464 |
Partner Operated Fields | 43 | 18 | 158 | 43 | 11 | 112 | 39 | 3 | 60 |
Total | 784 | 106 | 1450 | 824 | 101 | 1461 | 818 | 95 | 1417 |
3.1.5 Development on the NCS
3.1.5.1 Fields under development on the NCS
The following fields are currently under development on the Norwegian continental shelf:
Gjøa is located in the North Sea and will be developed by installing a subsea production system and a semi-submersible production platform. Gas will be exported via the FLAGS pipeline to St Fergus and oil exported via the Troll 2 pipeline to the Statoil-operated Mongstad refinery near Bergen. The Gjøa platform will process and export volumes from both the Gjøa field and the neighbouring Vega fields. The platform will be supplied with land-based electricity from Mongstad. The investments are estimated to total NOK 33.3 billion. We hold a 20% interest in Gjøa. Production is scheduled to start in late 2010. GDF Suez will be the operator from production start.
The Gudrun Field is located in the North Sea. The field will be developed with a separate steel jacket based process platform for separation of oil and gas. Gas and partly stabilised oil will be transported in separate pipelines from Gudrun to Sleipner. Gas will be further transported through the Gassled system, while oil will be transported together with Sleipner condensate through pipeline to the Gassco operated Kårstø plant near Hugesund. The Plan for Development and operation was submitted to the Norwegian authorities in February 2010. Production is estimated to start in 1st quarter of 2014. The total investments are estimated to be NOK 20,3 billion. Statoil holds a 46,8% interest in Gudrun.
Morvin, in which we hold an interest of 64%, is an oil and gas field located in the Norwegian Sea, 15 kilometres north-west of Åsgard. The field was discovered in 2001, and the Plan for Development and Operation was submitted in February 2008 and approved by the Norwegian authorities in April 2008. The field will be a subsea development with two templates tied in to Åsgard B for processing through a 20-kilometre-long wellstream pipeline. The development of Morvin is currently estimated to require capital expenditure of NOK 8.4 billion, and production from the field is estimated to commence in late 2010.
Skarv is an oil and gas field located in the Norwegian Sea, in which we have an interest of 36.165% and for which BP is the operator. The field is being developed with an FPSO vessel and five subsea installations. Oil will be exported by offshore loading, and gas will be exported via the Åsgard export system. Production is expected to start in August 2011, and the total development cost is estimated by the operator, BP, to be NOK 37.9 billion.
The PDO for Goliat was submitted in February 2009 and approved by the Norwegian parliament in June 2009. Goliat is the first oilfield to be developed in the Barents sea. The field is being developed with subsea wells tied back to a circular FPSO. The oil will be offloaded to shuttle tankers. Associated gas will initially be reinjected and later exported together with the gas cap. Statoil is the only partner in Goliat, with an interest of 35%. Eni is the operator. Production start-up is expected in the fourth quarter 2013. The operator's estimate of development costs for the field is NOK 28 billion.
The Vega/Vega South project comprises the development of three separate gas-condensate accumulations: Vega North and Vega Central in PL248 and Vega South in PL090C. Our ownership interests in the licences are 60% and 45%, respectively. The fields are located in the North Sea. Three four-slot templates will be installed, and production will be transported to the Gjøa installation in a common pipeline. The total investments for the project are estimated to be NOK 7.5 billion. Production is scheduled to start in late 2010.
The table below shows some key figures for our major development projects.
|
| Estimates of | |||
Project | Statoil's share | Statoil's investment (1) | Production start | Plateau production, Statoil's share (3) | Lifetime in years |
Gjøa | 20.000 % | 6.7 | 2010 | 19,000 | 15 |
Goliat (2) | 35.000 % | 9.8 | 2013 | 30,000 | 18 |
Gudrun | 46.800 % | 9.5 | 2014 | 40,000 | 12 |
Morvin | 64.000 % | 5.4 | 2010 | 20,000 | 14 |
Skarv (2) | 36.165 % | 13.7 | 2011 | 53,000 | 12 |
Vega/Vega Sør | 60% / 45% | 4.1 | 2010 | 30,000 | 13 |
|
|
|
|
|
|
(1) Estimated in NOK billion |
|
|
|
| |
(2) Partner operated project |
|
|
|
| |
(3) Boe/day |
|
|
|
|
|
3.1.5.2 Redevelopments on the NCS
The following projects are being developed on the NCS to give existing installations an extended life or to exploit new opportunities.
Oseberg Low Pressure involves the installation of two new production manifolds for low-pressure wells with tie-in to second stage separators. Production started in February 2010.
The Snorre Redevelopment project, which is defined as an IOR project, will contribute to achieving the Snorre Unit and Vigdis overall oil recovery ambition. The project includes a water injection pipeline from Statfjord C to the Vigdis field.
The Statfjord Late Life project will convert Statfjord into a mainly gas-producing field by changing the drainage strategy. The export of gas to the UK through a new pipeline connected to the existing pipelines to Flags and St Fergus commenced in late 2007. Total investments in the project are estimated to amount to NOK 21.4 billion.
Troll Field projects include the Troll B Gas Injection Project and the Troll A P12 Pipeline Project. The main goals for these projects are IOR from Troll B and to enable the Troll field to maintain an average gas export capacity of 120 million standard cubic metres per day and a long-term gas export capacity of 30 billion standard cubic metres per year.
The Troll B Gas Injection project includes two gas injectors in the Troll West Gas Province south. Start-up is planned in 2011.
The Troll A P12 project includes a new 62.5-kilometre 36-inch pipeline between Troll A and Kollsnes, modifications on Troll A and an interface with the Kollsnes plant. The pipeline is planned to start in late 2011.
The Troll C - O2 Template, which will be located north-west of the Troll C platform, is defined as an IOR project. The O2 Template will be tied back to the existing O1 Template, which is tied back to Troll C. Drilling started in December 2009 and production is planned to start in 2010.
A new low-pressure compressor module will be installed on Troll C to increase capacity, and thereby production and recovery from Troll West. Production is planned to start in 2010.
The Norne M Template will be located in the southern area of the Norne field. The template will have four production well slots and will be connected to the existing infrastructure at the K template. Drilling and production is planned to start in 2010.
3.1.6 Fields in production on the NCS
3.1.6.1 Operations North Sea
Operations North Sea includes a large part of Statoil's production activity on the NCS. There is focus on increasing and prolonging production in the area, with priority given to Improved Oil Recovery and the exploration and the development of new fields.
Our producing fields in Operations North Sea are Troll, Fram, Sleipner, Kvitebjørn, Visund, Grane, Brage, Veslefrikk, Huldra, Glitne, Volve, Heimdal, Vilje and Vale. The area is dominated by the production of natural gas, as 53% of the equity production in 2009 was gas. The petroleum reserves are located below water depths of between 80 and 330 metres.
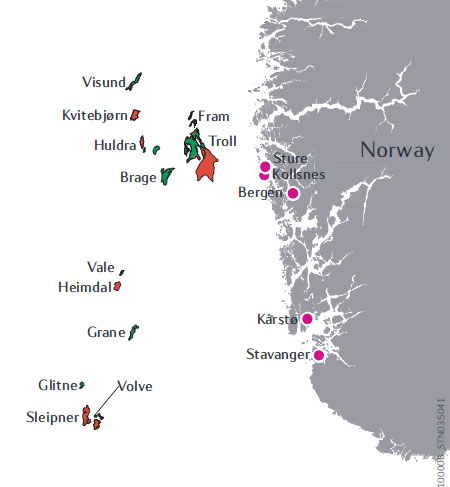
In 2009, Statoil's share of the area's production was 269 mbbl of oil, condensate and NGL per day and 18 mmcm (627 mmcf) of gas per day, or 575 mboe in total per day.
Brage is an oilfield east of Oseberg in the northern part of the North Sea. The oil is piped to Oseberg and then through the pipeline in the Oseberg Transport System to the Sture terminal. A gas pipeline is tied back to Statpipe.
Fram is connected to the Troll C platform for processing. Oil production started in 2003, and gas exports started in October 2007.
Glitne is an oilfield located about 40 kilometres north-west of Sleipner East. Glitne is the smallest field development on the NCS to use a stand-alone production system.
Grane is the first field on the NCS to produce heavy crude oil, and is Statoil's largest heavy oil field. The field is located to the east of the Balder field in the northern part of the North Sea. Oil from Grane is piped to the Sture terminal, where it is stored and shipped. Injection gas is imported to Grane by pipeline from the Heimdal facility. As a result, after around 25 years of oil production, Grane will produce the injected gas. Due to a new drilling strategy, the field managed to increase daily production by approx. 15% in 2009.
Heimdal is a gas field located in the northern part of the North Sea. Heimdal mainly operates as a processing centre for other fields. Huldra, Skirne and Vale deliver gas to Heimdal, and gas from Oseberg is also transported via Heimdal.
Sleipner consists of the Sleipner East, Gungne and Sleipner West gas and condensate fields. Condensate from the Sleipner field is transported to the gas processing plant at Kårstø. The gas from Sleipner has a high level of carbon dioxide, which is extracted on the field and re-injected into a sand layer beneath the seabed to reduce carbon dioxide emissions to the air. We are currently exploring several prospects and discoveries in the Sleipner area that can potentially be tied in to Sleipner.
The Troll Area comprises Troll and Fram, and the Vega and Gjøa development projects. Troll is the largest gas field on the NCS and a major oilfield. The Troll Field Project submitted a new Plan for development, operation and installation in June 2008 for IOR in the area. The project is well under way.
Veslefrikk is an oilfield located north of Oseberg in the northern part of the North Sea. Huldra is located in the Viking Graben and developed by a (normally unmanned) platform, remotely controlled from the Veslefrikk field. Oil from Veslefrikk is exported through the Oseberg Transportation System, while gas is exported to Kårstø. Veslefrikk also processes condensate from Huldra.
The first oil flowed from the Vilje field to the Alvheim floating production, storage and offloading vessel (FPSO) on 1 August 2008. The Vilje field, which is linked to the Alvheim field, is located in the northern part of the North Sea, north of the Heimdal field.
The Visund oilfield is located to the east of the Snorre field in the northern part of the North Sea. The field contains oil and gas in several tilted fault blocks with separate pressure and liquid systems. The oil is piped to Gullfaks A for storage and export. Gas is exported to the Kvitebjørn gas pipeline and on to Kollsnes.
Volve is an oilfield located in the southern part of the North Sea approximately eight kilometres north of Sleipner East. The development is based on production from the Mærsk Inspirer jack-up rig, with Navion Saga used as a storage ship to hold crude oil before export. Gas is piped to the Sleipner A platform for final processing and export.
The Kvitebjørn field resumed production on 27 January 2009 after being shut down since August 2008 due to a gas leak resulting from damage caused to the Kvitebjørn gas pipeline.
3.1.6.2 Operations West
The Operations West area contains light oil petroleum resources in a compact geographic area in which Statoil is the sole operator. The main producing fields in the Operations West area are Statfjord, Gullfaks, Snorre, Oseberg, Tordis and Vigdis.
Statoil's share of the area's production in 2009 was 256 mbbl per day of oil, 41 mbbl per day of NGL and 87 mboe per day of gas, or 385 mboe per day in total. Operations West is the leading oil producing area on the NCS and, even after 20 years of production, we believe there are still substantial opportunities for increased value creation.
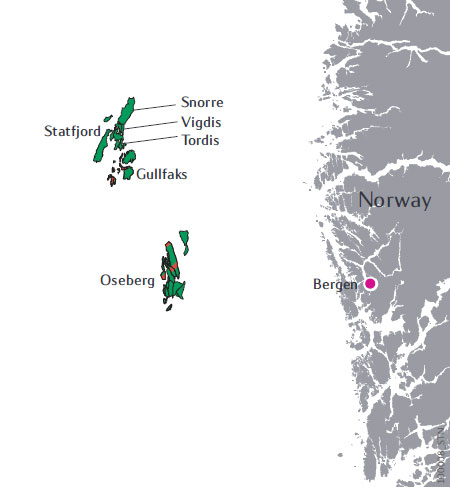
Statoil has taken several initiatives to identify and implement measures to increase and prolong production from the Operations West area. These initiatives involve a combination of cost reductions and IOR, and they have resulted in the prolongation of planned production beyond the current licence period for several of the fields.
In 2009, Operations West performed six turnarounds within the scheduled time frame and without serious HSE incidents.
Gullfaks has been developed with three large concrete production platforms. Oil is loaded directly into custom-built shuttle tankers on the field. Associated gas is piped to the Kårstø gas processing plant and then on to continental Europe. Five satellite fields -Gullfaks South, Rimfaks, Gullveig, Gulltopp and Skinfaks - have been developed with subsea wells remotely controlled from the Gullfaks A and C platforms.
The Gimle field is a Gullfaks satellite field that is operated as a separate unit. At the end of 2009, Gimle consisted of two producers and one injector, all drilled as long-reach wells from the Gullfaks C platform.
The Oseberg area includes the main Oseberg field, which has been developed with field centre installations, and the Oseberg C production platform, and two satellite fields, Oseberg East and Oseberg South, developed with production platforms. In addition, the Tune field and Oseberg West Flank have been developed with subsea installations and tied back to the Oseberg Field Centre. Oil and gas from the satellites is piped to the Oseberg Field Centre for processing and transportation. Oil is exported to shore through the Oseberg transportation system to the Sture terminal, and gas is exported through the Oseberg gas transportation system to Heimdal and on to market.
There was a fatal accident on the Oseberg B installation on 7 May 2009. A person died after falling about 14 metres from scaffolding onto the deck. A major safety programme for scaffodling activities has been launched after the accident.
The PL 089 licence includes the Vigdis, Borg and Tordis fields. The Tordis field and the southern part of the Borg field have been developed with seven subsea satellites and two templates tied back to Gullfaks C, where the oil and gas is processed and stored for offshore loading and export.
The Vigdis field was developed in 1997, with three subsea templates with a well stream through pipelines connected to Snorre A, where the oil is stabilised and exported to Gullfaks for storage and loading. The northern part of Borg is also produced via the Vigdis templates. The IOR project involving Increased Water Injection from Statfjord C is delayed due to the need for riser replacement, which is estimated to take place in 2010.
The Snorre field has been developed with two platforms and one subsea production system. Oil and gas is exported to Statfjord for final processing, storage and loading. One satellite field, Vigdis, has been developed with a subsea tie-back to Snorre A.
An inspection revealed internal damage to three risers on Snorre B in autumn 2008, resulting in the shutdown of risers and reduced production. Two of three risers were replaced during autumn 2009. The third riser will be replaced in 2010.
Statfjord has been developed with three fully-integrated platforms supported by gravity base structures featuring concrete storage cells. Each platform is tied to offshore loading systems for loading oil into tankers. Associated gas is piped through the Tampen link to the UK or, alternatively, to the Kårstø gas processing plant and then on to continental Europe. Three satellite fields (Statfjord North, Statfjord East and Sygna) have been developed, each of them tied back to the Statfjord C platform. In 2005, an amended PDO was approved by the Ministry of Petroleum and Energy for the late-life production period for Statfjord. The ministry granted a licence extension for the Statfjord area from 2009 to 2026.
3.1.6.3 Operations North
Our producing fields in the Operations North area are Åsgard, Mikkel, Heidrun, Kristin, Norne, Urd, Njord and Snøhvit. The Yttergryta field started production in January 2009, the Alve field in March 2009 and the Tyrihans field in July 2009.
Our share of the area's production in 2009 was 175 mbbl per day of oil, condensate and NGL, and 25 mmcm per day of gas, or 333 mboe in total per day.
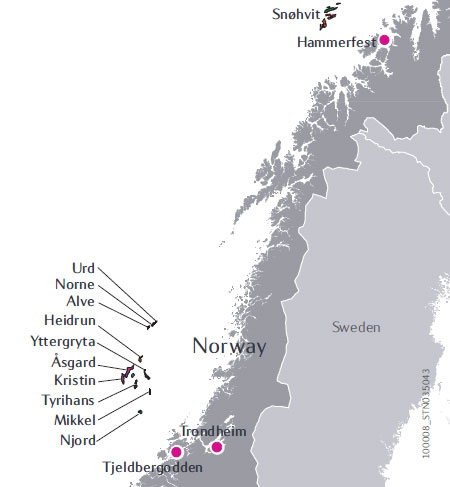
This region is characterised by petroleum reserves located at water depths between 250 and 500 metres. The reserves are partly under high pressure and at high temperatures. These conditions have made development and production more difficult and have challenged the participants to develop new types of platforms and new technology, such as floating processing systems with subsea production templates. We plan to increase efficiency by further coordinating our operations in the area and by stemming the decline in production from the mature fields through increased seismic activity and well maintenance. In addition, we intend to expand our activities by utilising our installed production and transportation capacity before building new infrastructure.
The Heidrun platform is the largest concrete tension leg platform ever built. Most of the oil from Heidrun is shipped by shuttle tankers to our Mongstad crude oil terminal for onward transportation to customers. Gas from Heidrun provides the feedstock for the methanol plant at Tjeldbergodden in Norway. Additional gas volumes are exported through the Åsgard Transport System (ÅTS) to gas markets in continental Europe.
Kristin is a gas and condensate field in the south-western section of the Operations North area. The Kristin development is the first high-temperature/high-pressure (HTHP) field developed with subsea installations. The pressure and temperature in the reservoir - 900 bar and 170 degrees Celsius, respectively - are higher than any other developed field on the NCS. The stabilised condensate is exported to a joint Åsgard and Kristin storage vessel, and the rich gas is transported to shore via the ÅTS to the gas processing facility at Kårstø.
Tyrihans started producing oil and gas in July 2009 and by the end of the year was producing from 3 wells. In addition gas is injected into a fourth injection well via Åsgard B. Tyrihans will be completed in 2010/2011 with another 7 wells. All production is processed on the Kristin platform.
Njord consists of two installations. Njord A is a platform with drilling facilities and a production plant for oil and gas. Njord B is a storage vessel for oil. The Njord field has produced oil since 1997, and gas exports started late 2007 via ÅTS and Kårstø.
The Norne field has been developed with a production and storage ship tied to subsea templates. This ship carries processing facilities on its deck and storage tanks for oil. Processed crude oil can be transferred over the stern to shuttle tankers. Norne is connected to gas markets in continental Europe through a link with ÅTS.
The Urd fields, Svale and Stær, are located ten kilometres and five kilometres north of the Norne field, respectively. The fields are produced through subsea facilities with the well stream tied back to the Norne FPSO.
The Alve field, which consists of one producing well, was started up in March 2009. The field is produced through subsea facilities with the well stream tied back to the Norne FPSO.
Snøhvit is the first gas field developed in the Barents Sea. Twenty wells will produce natural gas from three gas reservoirs: Snøhvit, Askeladd and Albatross. By the end of 2009 Snøhvit was producing from 6 wells. All the offshore installations are subsea, which makes Snøhvit one of the first major developments without production facilities offshore.
The natural gas, which is transported to shore through a 143-kilometre-long pipeline, is landed on Melkøya where it is processed at our LNG plant. This plant is Europe's largest export factory for LNG, which is shipped to customers in Europe and the USA in tankers. The first shipment took place in late 2007.
The LNG plant has suffered from operational challenges and there are still some uncertainties related to the timing of regular and stable operations. Performance and regularity improved significantly in 2008 and 2009. One major maintenance shutdown in 2009 has been carried out to achieve a further improvement in regularity.
The Åsgard field contains three fields: Smørbukk, Smørbukk South and Midgard. The field was developed with the Åsgard A production ship for oil, the Åsgard B semi-submersible floating production platform for gas and the Åsgard C storage vessel. The subsea production installations are among the most extensive in the world, with a total of 53 wells grouped in 18 seabed templates. Furthermore, the Åsgard B platform is the largest floating gas processing centre in the world and Åsgard A is one of the largest floating production ships ever built.
The Åsgard development links the Haltenbanken area to Norway's gas transport system in the North Sea. Gas from the field is piped through the Åsgard Transport System (ÅTS) to the processing plant at Kårstø and on to receiving terminals in Emden and Dornum in Germany. Oil produced at the Åsgard A vessel and condensate from the Åsgard C storage vessel are shipped from the field in shuttle tankers.
Mikkel is a gas and condensate field. Production from two seabed templates is tied to the subsea installation at Midgard for onward transport to the Åsgard B gas processing platform.
Yttergryta started production from a single well in January 2009. The well stream is tied back to Åsgard B for processing.
3.1.6.4 Partner-operated fields on the NCS
Partner-operated fields represent a significant proportion of Statoil's oil and gas portfolio. The portfolio ranges from development projects to mature fields, and their complexity requires detailed knowledge of the areas involved.
Ormen Lange, a deepwater gas field in the Norwegian Sea, is the second largest gas field on the NCS in which Statoil has a 28.92% interest. Statoil was operator for the development phase and Norske Shell became the operator for the production phase that began at the end of 2007. Statoil continues to execute approved, but not yet completed, parts of the subsea development. The selected development is an extensive subsea development at depths ranging from 850 to 1100 metres. The well stream is transported to an onshore processing and export plant at Nyhamna. Gas is then transported through a dry gas pipeline, Langeled, via Sleipner to Easington in the UK.
Ekofisk is the first developed field complex that came into operation on the Norwegian continental shelf. The operator is ConocoPhillips. It consists of the fields Ekofisk, Eldfisk and Embla (Statoil's interest 7.604%), plus Tor (Statoil's interest 6.639%). Ekofisk has been upgraded with several new platforms over the years. The latest was 2/4-M, which was installed in 2005. Several new projects are being studied: a new Ekofisk living accomodation and field centre, a new Ekofisk South drilling platform and redevelopments of Eldfisk and Tor. Final decisions are expected to be made during the next few years. These new platforms are expected to extend the field life beyond the current licence period, which ends in 2028.
Sigyn, operated by ExxonMobil, is a gas and condensate field located 12 kilometres south-east of the Sleipner A installation in which we have a 60% interest. The gas is exported from Sleipner A and the condensate is delivered to Kårstø. The development consists of three production wells on one subsea template, with two pipelines and one umbilical connecting it to the Sleipner A platform.
Statoil has a 14.82% interest in the ExxonMobil-operated field Ringhorne East. The unitised field started production in March 2006. Three production wells have been drilled from the Ringhorne facility. Oil is transported via Ringhorne to Balder for offshore loading. Gas is exported via Jotun into Statpipe. A fourth production well is planned.
Statoil has a 10% interest in the Skirne gas and condensate field, which is operated by Total. The field has two subsea templates with one well each. The well stream is transported to Heimdal for processing. From there, gas is transported in Vesterled or Statpipe. The condensate is transported from Brae to St Fergus in the UK.
Statoil has an 11.78% interest in the Enoch field operated by Talisman. The field is a subsea development tied back to Brae A in the British sector. Production started in May 2007.
3.1.7 Decommissioning on the NCS
There has been no decommissioning of Statoil-operated fields during the last three years.
The Norwegian government has laid down strict procedures for the removal and disposal of offshore oil and gas installations under the Convention for the Protection of the Marine Environment of the Northeast Atlantic, known as the OSPAR Convention. During the last three years, however, there has been no decommissioning of Statoil-operated fields. On partner-operated fields, there has been removal activity on Frigg and Ekofisk.
3.2 International E&P
3.2.1 Our international E&P portfolio
Statoil has built up a large international resource base in recent years. We are continuously optimising our portfolio, and our focus areas and strategies will be strengthened and supported through active portfolio management. .
Major additions to our international portfolio include entry into the Marcellus shale gas acreage in north-eastern USA in 2008 and the purchase of the Kai Kos Dehseh oil sands in Canada in 2007. In 2008, we also took on the operatorship and acquired the remaining 50% equity share of Peregrino, a heavy oil project in Brazil. Statoil's main M&A activities in 2009 and early 2010 are presented below.
Acquisitions:
On 14 April 2009, Statoil acquired a 40% stake in 50 blocks from BHP Billiton in the DeSoto Canyon area of the US Gulf of Mexico. This positions us in a frontier play in the central GoM.
On 18 May 2009, we reached agreement with BPC Limited to become the operator of three offshore exploration licences in the Bahamas, identified as a frontier play. Approval and awarding of the licences by the Government of the Commonwealth of the Bahamas is still pending.
On 12 August 2009, we entered a deal where we farmed into a 30% share of the Repsol-operated BM-ES-29 licence in the Espirito Santo basin in Brazil, further positioning us in the pre-salt play. Repsol received equity shares in four of our GoM leases in exchange. The deal is currently pending government approval.
Iraq is the latest new growth platform where we have succeeded in establishing a foothold in competition with other companies. In Iraq's second licensing round on 12 December 2009, Statoil and Lukoil submitted the winning bid for developing the West Qurna 2 field. On 31 January 2010 Statoil and Lukoil signed the development and production contract for West Qurna 2 with Iraqi authorities. The consortium of contractors consists of the state Iraq's North Oil Company (25%), Lukoil (56.25%) and Statoil (18.75%). Lukoil will be the operator.
On 25 January 2010, we entered a deal with ConocoPhillips through which we gained 25% interest in 50 leases in the Chukchi Sea in Alaska. By adding on these leases to the 16 previously acquired in Chukchi, we now have a sizable acreage portfolio to explore in the coming years.
In January 2010, we increased our share in St.Malo in the US GoM from 6.25% to 21.5% by exercising our pre-emption rights. The transaction was completed on 9 March 2010.
On 17 March 2010, Statoil was the highest bidder on 21 leases in the Central lease sale 213 in the US GoM. Statoil's winning bids are subject to review and final approval by the Mineral Management Service (MMS).
Divestments and other reduction of Statoil's portfolio:
We completed the sale of our interests in licences off the coast of Denmark to Bayerngas Norge AS on 24 June 2009.
On 30 June 2009, we completed the sale of our interest in the UK Caledonia field (21.32%) to Premier Oil ONS Limited.
On 29 October 2009, we signed a well participation agreement with CNOOC under which we successfully farmed down Statoil's interest in several exploration prospects in the Gulf of Mexico.
With effect from 1 January 2010, the Russian state oil company Zarubezhneft became a partner in the Kharyaga PSA with a 20% interest, thus reducing Statoil's share from 40% to 30%.
Libyan State oil Company (NOC) in Libya has renegotiated the PSA for Mabruk, and in January 2010, our equity share of production in Mabruk was reduced from 25.0% to 5.0% effective as of 1 January 2008.
3.2.2 International exploration activity
Statoil's strategy is to continuously access new exploration acreage with high resource potential and to maximise the number of high impact wells.
We have exploration licences in North America (Canada and the USA), Latin America (Brazil, Cuba and Venezuela), Africa (Algeria, Angola, Egypt, Libya, Mozambique, Nigeria and Tanzania), Europe and the Caspian region (the Faroes, Ireland, the UK and Azerbaijan), and the Middle East and Asia (Iran, India and Indonesia). Our exploration strategy remains focused on accessing more new quality acreage, including unconventional hydrocarbons and exploration resources that are demanding in terms of technology.
In 2009, we reduced our exploration spending and activity level to reflect the new market situation with lower oil and gas prices. We have completed 29 wells in 2009, and seven were ongoing at year end. Of the 29 wells, six were announced as discoveries and nine are currently under evaluation. We plan to drill about 30 wells in 2010.
In 2009, we reached an agreement with BPC Limited to become the operator of three offshore exploration licences: Zapata, Islamorada and Falcones in the Cay Sal area of the south-western Bahamas. Approval and the awarding of the licences by the Government of the Commonwealth of the Bahamas is still pending.
In the Faroes, we have decided to enter into the third exploration period in Licence 008, and have committed to drilling one well during the period 2010-2014. We also received an extension for licences 006, 009 and 011 with one commitment well to drill.
We have entered the next exploration period in our 3/94 licence in Ireland with a commitment to drill one well.
In 2009, we relinquished our sole licence in Morocco.
The areas where we entered or had significant activity in 2009 are presented below.
3.2.2.1 North America
3.2.2.1.1 Canada
Statoil is operator and partner in licences off the coast of Newfoundland, and we hold 1129 square kilometres (279,053 acres) of oil sands leases in Alberta. The Statoil-operated Mizzen well resulted in a discovery in 2009.
Offshore
We completed drilling and testing operations for the exploration Mizzen well in licence 1049 in the frontier Flemish Pass basin in March 2009. The well proved a hydrocarbon accumulation, and a Significant Discovery Licence was awarded in February 2010.. Statoil is the operator and holds a 65% interest in the licence.
Ballicatters, an exploration well operated by Suncor with a Statoil interest of 50%, was drilled in the Jeanne d'Arc basin on licence 1113 and 1092 from July to October 2009. For technical reasons, the well has been suspended. A plan for re-entry is currently being developed.
Evaluation work based on 3D seismic data on the two operated licences in the southern part of the Jeanne d'Arc basin has continued during the year in order to define drillable prospects. This work will continue in 2010, and plans for the drilling of identified prospects will be developed.
Oil sands
We currently have an interest in 1129 square kilometres (279,053 net acres) of oil sands' leases located in the Athabasca region of Alberta.
In order to determine the extent of the exploitable oil sands deposits in Alberta, a total of more then five hundred wells were drilled in the region from 2003 to 2009. In addition, extensive seismic surveys were acquired during that period.
In the 2008-2009 winter drilling programme, only wells required for delineation, observation and water source or disposal for near-term development phases were drilled.
Our oil sand activities are described in more detail in section 3.2.5.1.1 Operational review - International E&P - International fields in development and production - North America - Canada.
3.2.2.1.2 The USA
We have significant activities in the USA, with more than 400 leases in the Gulf of Mexico and 66 in Alaska. With two new rigs in the Gulf of Mexico, we embarked on an extensive drilling programme and were drilling two operated wells at the end of 2009.
US Gulf of Mexico
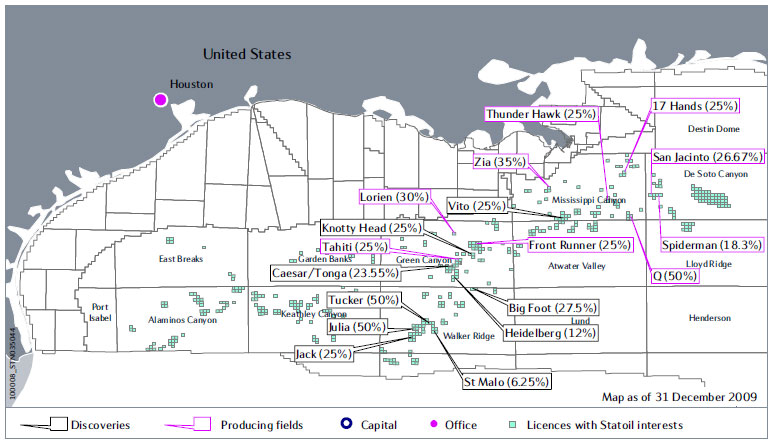
During 2009, we participated in ten exploration and appraisal wells, five of which were completed by year end. Heidelberg 1 and Vito 1 wells were announced as Miocene oil discoveries in 2009. A Vito appraisal well (sidetrack to Vito 1) was announced as a Miocene oil discovery in March 2010, and a second sidetrack appraisal well is planned for 2010 to further delineate the discovery.
In 2009, Statoil became the operator for an extensive drilling programme with two new rigs arriving in the Gulf of Mexico during the second half of the year. At year end, the Maersk Developer was drilling an appraisal well on the Tucker discovery in Walker Ridge and the Discoverer Americas was drilling an exploration well on the Krakatoa prospect in Mississippi Canyon. These two operations will continue in 2010, and we plan to drill additional deepwater wells during 2010.
In 2009, we acquired a 40% stake in 50 leases from BHP Billiton in the frontier DeSoto Canyon area of the US Gulf of Mexico. DeSoto Canyon is located east of Statoil's current production operation at Independence Hub. The area has water depths of about 1000 metres. We were awarded 23 leases in the Central Lease Sale 208, including 14 in the eastern GoM with partner BHP Billiton. Following a thorough technical evaluation, it was decided not to submit any bids for the Western Lease Sale 209.
Statoil was the highest bidder on 21 leases in the Central lease sale 213 in March 2010. Statoil's winning bids are subject to review and final approval by the Mineral Management Service (MMS).
To date, three multi-well participation agreements have been entered into with Ecopetrol (agreement concluded in 2008), Repsol and CNOOC, reducing our interests in a total of eight deepwater prospects .
Alaska
We entered an agreement with ConocoPhillips under which we acquired a 25% equity in 50 leases covering the Devil's Paw prospect in the Chukchi Sea.
With the selection of the seismic contractor in 2009, we have taken the first step towards 3D Seismic acquisition for Statoil's Chukchi Sea acreage, which is planned for 2010. Preparation of environmental and other permit applications is progressing and stakeholder engagement with North Slope communities has also commenced. In addition, Statoil has participated in the collection of environmental baseline data in the Chukchi Sea.
Gas shales
Exploration activity related to gas shale in onshore USA is presented in article 3.2.5 Operational review-International E&P-Fields in development and production.
3.2.2.2 Latin America
3.2.2.2.1 Brazil
We have interests in nine exploration licences in four different basins in waters off the coast of Brazil. We are the operator of four of the licences. During 2009, we acquired a 30% interest in the pre-salt licence BM-ES-29.
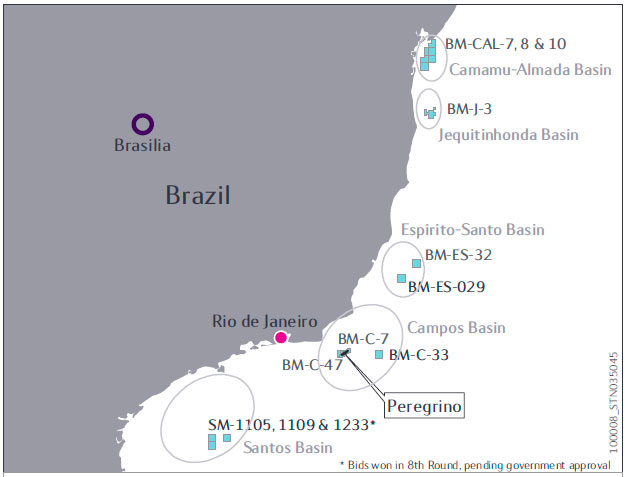
In 2009, we farmed into a 30% share of the Repsol-operated BM-ES-29 licence in the Espirito Santo basin with one commitment well to drill. The interests in three blocks that we won in the 8th round in the Santos basin are pending award.
We have completed two wells in BM-J-3 and one well in BM-C-33, which fulfilled our commitments for these licences. We have one commitment well in BM-CAL-10, one in BM-CAL-7 and one in BM-C-47.
3.2.2.3 Africa
3.2.2.3.1 Angola
Statoil holds interests in blocks 4/05, 15, 15/06, 17, 31 and 34 in Angola. Fourteen wells were completed in 2009, with three announced as discoveries.
We have extensive exploration activity in Angola, with a number of wells drilled in 2009 and expected to be drilled in 2010 and the coming years. We have interests varying from 5% to 50% in six blocks .
The Block 15 exploration licence, with ExxonMobil as operator, has expired. Areas with proven oil have been converted to Development Area (DA) and Provisional Development Areas (PDA). A total of 38 exploration and appraisal wells have been drilled on the original Block 15 and offspring DAs and PDAs.
In Block 17, which is operated by Total, a total of 34 exploration and appraisal wells have been drilled, with the last two completed in 2009.
In Block 31 operated by BP, six exploration wells were completed in 2009 with two discoveries announced. To date, a total of 31 exploration wells have been drilled in the block. Three wells have been completed in Block 15/06, with one discovery announced and one well ongoing at year end.
We have fulfilled our commitments in blocks 15 and 17 and have remaining commitments to fulfil in other blocks: one well in Block 4/05, two wells in Block 15/06, one well in Block 31 and one well in Block 34.
3.2.2.3.2 East Africa
Statoil is the operator of two large frontier offshore blocks in the East Africa region - Block 2 in Tanzania and Area 2&5 in Mozambique, both with water depths in the 1000 to 3000 metres range.
Block 2 (11,099 square kilometres), Tanzania: We have fulfilled the seismic commitment in the current exploration phase in this block. In order to mature the block further, a 1600-square-kilometre 3D survey has been acquired between December 2009 and March 2010. In March 2010, we farmed down 35% of our equity to ExxonMobil. We are the operator of the block and have a 65% interest.
Area 2&5 (13,402 square kilometres), Mozambique: We are the operator, with a 90% interest in the licence, which consists of two blocks under one licence agreement, with the state oil company Empresa Nacional de Hidrocarbonetos (ENH) as partner. We are currently in the second exploration period during which there is a commitment to shoot 3D seismic. A 1300-square-kilometre 3D survey is currently being acquired.
3.2.2.3.3 Egypt
We are the operator, with an 80% interest, in two offshore exploration licences located in the Mediterranean, west of the Nile Delta, in water depths ranging from sea level to 3000 metres.
El Dabaa Offshore (Block 9) covers an area of 8368 square kilometres. We have fulfilled the 2D and 3D seismic commitments. We have a commitment to drill one well in this licence and planning related to the drilling of this well will be in focus during 2010.
Ras El Hekma Offshore (Block 10) covers an area of 9802 square kilometres. We have fulfilled our work commitment in this licence, which includes the acquisition of 2D and 3D seismic surveys. Initial processing was completed early in 2009, and further processing is ongoing.
3.2.2.4 Middle East and Asia
3.2.2.4.1 Indonesia
Statoil is operator of the Karama production sharing contract (PSC) with a 51% interest, and it has a 40% interest in the Kuma PSC. Both licences are located off Indonesia, in water depths ranging from 1000 to 2000 metres.

In 2009, all the acquired seismic data have been processed, and seismic interpretation and mapping of potential drilling locations have been initiated for both the Karama PSC and the Kuma PSC. We have entered into several shared drilling-related contracts together with the other five consortium companies that will use the contracted drillship, Global Santa Fe Explorer. We have three commitment wells in the Karama PSC, and one commitment well in the Kuma PSC. Drilling is planned to start in 2010/2011. Several studies have been initiated to support the definition of optimal drilling locations and in preparation for safe and efficient drilling operations.
3.2.3 International oil and gas reserves
At the end of 2009, the international business area had a total of 824 mmbbl of proved oil reserves and 34.3 bcm (1 210 bcf) of proved natural gas reserves.
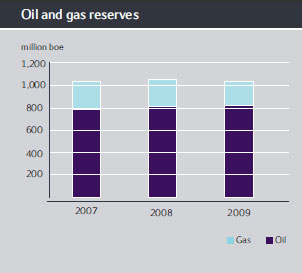
Measured in barrels of oil equivalents (boe), our international proved reserves consist of 79 % oil and 21 % natural gas, based on total international proved reserves of 1 039 mmboe.
Several of our international fields contribute positively to the reserves balance in 2009:
- Kizomba satellites phase 1 in Angola and the Caesar Tonga Unit in Gulf of Mexico, USA, were sanctioned in 2009.
- The Gimboa field in Angola commenced test production in April 2009.
- The PSVM development in Angola was approved by the concessionaire in 2008 and as a result recorded proved reserves for the first time in 2009.
- The Marcellus Shale Gas play in USA, part of our gas value chain strategy, recorded proved reserves in 2009 for the first time.
- The Leismer Demonstration Project in the Kai Kos Dehseh leases in Canada, with initial production scheduled for late 2010, contributes to the reserves balance in 2009 with reference to several analogous SAGD projects in operation in the Athabascan area.
Effective from 1 January 2010, the Russian state oil company Zarubezhneft became a partner in the Kharyaga PSA with a 20 % interest, thus reducing Statoil's share from 40 % to 30 % and having a negative effect on our reserves' balance.
The increase in the oil price during 2009 has had a negative effect on our proved reserves' estimates for international projects with a Production Sharing Agreement or a Buy Back Agreement.
The share of developed reserves at year end is 565 mmboe, up 5 % from 2008. Of the 2009 proved developed reserves, 413 mmboe are oil and 24.1 bcm (852 bcf) are natural gas.
The following table shows our total international proved reserves as of 31 December for each of the last three years. Further information on reserves can be found in section 3.9 Operational review - Proved oil and gas reserves and in note 35 - Supplementary oil and gas information to our consolidated financial statements, which also explains revisions to the methodology for reserve estimation for 2009 compared with earlier years.
|
| Oil/NGL | Natural gas | Total | |
Year |
| mmbbls | bcm | bcf | mmboe |
2009 | Proved reserves end of year | 824 | 34.3 | 1,210 | 1,039 |
| of which, proved developed reserves | 413 | 24.1 | 852 | 565 |
2008 | Proved reserves end of year | 805 | 39.7 | 1,403 | 1,055 |
| of which, proved developed reserves | 406 | 20.6 | 727 | 536 |
2007 | Proved reserves end of year | 785 | 40.4 | 1,426 | 1,039 |
| of which, proved developed reserves | 323 | 21.2 | 748 | 456 |
3.2.4 International production
Statoil's petroleum production outside Norway in 2009 amounted to an average of 357 mboe per day of entitlement production and 512 mboe per day of equity production.
Our total annual entitlement production in 2009 was approximately 130 mmboe, compared with 106 mmboe in 2008. The first table shows our average daily entitlement production of liquids and natural gas for the years ending 31 December 2009, 2008 and 2007. In 2009 the fields Tahiti and Thunder Hawk in the USA came on stream and the Gimboa field in Angola started test production.
| For the year ended 31 December | ||
Entitlement production | 2009 | 2008 | 2007 |
|
|
|
|
Oil and NGL (mboe per day) | 283 | 232 | 252 |
Natural gas (mmcm per day) | 12 | 9 | 9 |
Total (mboe per day) | 357 | 290 | 307 |
The next table provides information about the fields which contributed to 2009 production.
Field | Statoil's equity interest in percent | Operator | On stream | License expiry | Productive wells as of year end |
North America |
|
|
|
|
|
Canada: Hibernia | 5.00% | HMDC | 1997 | 2027 | 33 |
Canada: Terra Nova | 15.00% | Suncor | 2002 | 2022 | 15 |
USA: Lorien | 30.00% | Noble | 2006 | HBP (1) | 2 |
USA: Front Runner | 25.00% | Murphy Oil | 2004 | HBP | 8 |
USA: Spiderman Gas | 18.33% | Anadarko | 2007 | HBP | 3 |
USA: Q Gas | 50.00% | Statoil | 2007 | HBP | 1 |
USA: San Jacinto Gas | 26.67% | ENI | 2007 | HBP | 2 |
USA: Zia | 35.00% | Devon | 2003 | HBP | 1 |
USA: Seventeen Hands | 25.00% | ENI | 2006 | HBP | 1 |
USA: Marcellus shale gas | Varies | Varies | 2008 | HBP | 51 |
USA: Tahiti | 25.00% | Chevron | 2009 | HBP | 6 |
USA: Thunder Hawk | 25.00% | Murphy Oil | 2009 | HBP | 3 |
|
|
|
|
|
|
Latin America |
|
|
|
|
|
Venezuela: PetroCedeño (2) | 9.68% | PetroCedeño | 2008 | 2032 | 404 |
|
|
|
|
|
|
Sub Saharan Africa |
|
|
|
|
|
Angola: Kizomba A | 13.33% | ExxonMobil | 2004 | 2026 | 27 |
Angola: Kizomba B | 13.33% | ExxonMobil | 2005 | 2027 | 24 |
Angola: Xikomba | 13.33% | ExxonMobil | 2003 | 2027 | 5 |
Angola: Marimba North | 13.33% | ExxonMobil | 2007 | 2027 | 3 |
Angola: Mondo | 13.33% | ExxonMobil | 2008 | 2029 | 9 |
Angola: Saxi-Batuque | 13.33% | ExxonMobil | 2008 | 2029 | 7 |
Angola: Girassol/Jasmim | 23.33% | Total | 2001 | 2022 | 25 |
Angola: Dalia | 23.33% | Total | 2006 | 2024 | 26 |
Angola: Rosa | 23.33% | Total | 2007 | 2022 | 12 |
Angola: Block 4/05 (3) | 20.00% | Sonangol | 2009 | 2026 | 3 |
Nigeria: Agbami | 18.85% | Chevron | 2008 | 2024 | 12 |
|
|
|
|
|
|
North Africa, Europe, Caspian and Russia |
|
|
|
| |
Algeria: In Salah | 31.85% | Sonatrach/BP/Statoil | 2004 | 2027 | 32 |
Algeria: In Amenas | 50.00% | Sonatrach/BP/Statoil | 2006 | 2022 | 17 |
Libya: Mabruk (4) | 5.00% | Total | 1995 | 2028 | 59 |
Libya: Murzuq | 2.40% | Repsol | 2003 | 2032 | 93 |
Azerbaijan: ACG | 8.56% | BP | 1997 | 2024 | 59 |
Azerbaijan: Shah Deniz | 25.50% | BP | 2006 | 2031 | 4 |
UK: Alba | 17.00% | Chevron | 1994 | 2018 | 38 |
UK: Caledonia (5) | 21.32% | Chevron | 2003 | 2018 | 1 |
UK: Jupiter | 30.00% | ConocoPhillips | 1995 | 2010 | 16 |
UK: Schiehallion | 5.88% | BP | 1998 | 2017 | 21 |
Russia: Kharyaga (6) | 30.00% | Total | 1999 | 2032 | 20 |
|
|
|
|
|
|
Middle East and Asia |
|
|
|
|
|
China: Lufeng (7) | 75.00% | Statoil | 1997 | 2011 | 0 |
Iran: South Pars | 37.00% | POGC | 2008 | 2012 | 30 |
|
|
|
|
|
|
Total International E&P |
|
|
|
| 1073 |
|
|
|
|
|
|
(1) Held by production; A company’s right to own and operate an oil and gas lease is perpetuated beyond its original primary term, as long thereafter as oil and gas is produced in paying quantities | |||||
(2) Petrocedeño is a non-consolidated company | |||||
(3) Producing wells are related to test production | |||||
(4) Renegotiation of the PSA by the Libyan State oil Company (NOC) for the Mabruk field was completed in January 2010. Statoil's equity share in Mabruk was reduced from 25.0% to 5.0% effective as of 1 January 2008 | |||||
(5) Caledonia field was sold to Premier Oil in June 2009 |
|
|
|
| |
(6) With effect from 1 January 2010, the Russian state oil company Zarubezhneft became a partner in the Kharyaga PSA with a 20% interest, thus reducing Statoil's share from 40% to 30% | |||||
(7) Lufeng field was shut down in June 2009 | |||||
The table below presents equity and entitlement production per country in 2009.
Country | Average daily equity production (1) mboe/day | Average daily entitlement production (2) mboe/day |
North America |
|
|
Canada | 18.2 | 18.2 |
USA | 46.3 | 46.3 |
|
|
|
Sub Saharan Africa |
|
|
Angola | 191.3 | 118.6 |
Nigeria | 38.5 | 35.7 |
|
|
|
North Africa, Europe, Caspian and Russia |
|
|
Algeria | 66.7 | 42.0 |
Libya (3) | 7.0 | 4.5 |
Azerbaijan | 106.3 | 54.6 |
Russia | 8.9 | 8.0 |
UK | 7.7 | 7.7 |
|
|
|
The Middle East and Asia |
|
|
China | 1.5 | 1.4 |
Iran | 6.2 | 6.2 |
|
|
|
Subtotal International E&P production | 499 | 343 |
|
|
|
Equity accounted production |
|
|
Venezuela: PetroCedeño (4) | 13.6 | 13.6 |
|
|
|
Total International E&P including share of equity accounted production | 512 | 357 |
|
|
|
(1) In PSA countries our share of capital expenditures and operational expenses are computed on the basis of equity production | ||
(2) Production figures are after deductions for royalties, production sharing and profit sharing | ||
(3) Renegotiation of PSA by the Libyan State oil Company (NOC) for the Mabruk field was completed in January 2010. 2009 volumes are based on old PSA terms. | ||
(4) Petrocedeño is accounted for pursuant to the equity accounting method. | ||
3.2.5 International fields in development and production
Major efforts are being made to make the transition from a mainly North Sea player to a world-class international operator.
We are working continuously to develop our inventory of projects into producing assets by looking at innovative technical and commercial solutions.
This section covers projects under development and fields in production. Pre-sanctioned projects, including some discoveries in the early evaluation phase, are also presented. This section often refers to a field's plateau production, which means yearly average equity production at plateau for a field where we have a 100% ownership share. Capacities also refer to the total field or facility.
Exploration activities are described in report section 3.2.2 Operational review - International E&P - International exploration activity.
Sanctioned projects coming on stream 2010-2012 * | Statoil's share | Operator | Time of sanctioning | Production start |
|
|
|
|
|
Canada: Leismer Demonstration Plant (Oil Sands phase 1) | 100.0 % | Statoil | 2007 | 2010 |
Brazil: Peregrino | 100.0 % | Statoil | 2007 | 2011 |
Angola: Pazflor | 23.33% | Total | 2007 | 2011 |
Angola: PSVM | 13.33% | BP | 2008 | 2011 |
The USA: Ceasar Tonga phase 1 | 23.55% | Anadarko | 2009 | 2011 |
Angola: Kizomba satellites phase 1 | 13.33% | Exxon | 2009 | 2012 |
* Not exhaustive |
|
|
|
|
3.2.5.1 North America
Statoil's E&P activities in North America comprise interests in the US Gulf of Mexico, shale gas in the Appalachian region of north-eastern USA, off the eastern coast of Canada and oil sands in the Alberta province in onshore Canada.
We also have a representative office in Mexico City.
3.2.5.1.1 Canada
Oil sands represent a long-term investment for the company and our Leismer Demonstration Project is on schedule. Offshore, we have production from Hibernia and Terra Nova, and two development projects.
Oil sands
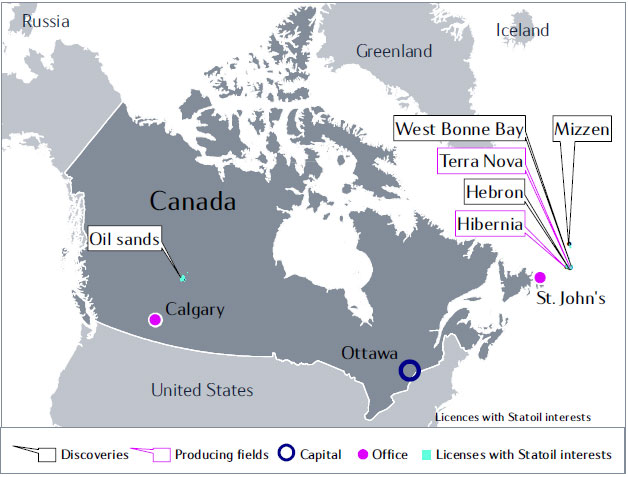
In 2007, we acquired 100% of the shares in North American Oil Sands Corporation (NAOSC) and operatorship of the Kai Kos Dehseh (KKD) leases. We currently own interests in 1129 square kilometres (279,053 net acres) of oil sands' leases located in the Athabasca region of Alberta. In its raw state, bitumen is a heavy viscous oil that we will produce using the steam-assisted gravity drainage method (SAGD) from a depth of approximately 430 metres, with an average producing zone thickness ranging from 15 to 30 metres.
Oil sands represent a long-term investment, and Statoil has the flexibility required to develop it in stages. The first phase is the Leismer Demonstration Project, which will have a capacity of approximately 20,000 barrels of oil per day with initial production scheduled for late 2010.
Construction and commissioning of the Leismer Demonstration Project is on schedule, with approximately 75% completion progress at the end of December 2009. All the production wells have been drilled and completion of the wells is ongoing. The installation of the bitumen and diluent pipelines from the Leismer Demonstration Project to Cheecham is on schedule. Work on the Cheecham terminal is also proceeding according to plan. On completion, the Leismer Demonstration Project will be connected to the existing pipeline infrastructure at Cheecham that runs to the Edmonton area.
Statoil will use the Leismer Demonstration Project as a learning platform, where we will test a number of technologies or processes aimed at improving efficiency and extraction and improving our environmental footprint. The Statoil Heavy Oil Research Centre in Calgary is an integral part of this effort.
Offshore
Statoil has interests in two crude oil producing fields: Hibernia (Statoil share 5%) and Terra Nova (15%), and in the two development projects; Hebron (9.7%) and Hibernia Southern Extension Unit (10.5%)
Fields in production
Hibernia, which was developed with a gravity base structure (GBS), is operated by Hibernia Management and Development Company Ltd (HMDC). The Hibernia field is in the initial stages of decline, with 2009 production rates averaging 125,000 barrels of oil per day.
Terra Nova produces from a floating production, storage and offloading vessel (FPSO) and is operated by Suncor. The Terra Nova field is also in decline, with 2009 production rates averaging 80,000 barrels of oil per day.
Development projects
The Hebron field, operated by ExxonMobil, will be developed with a gravity based structure (GBS). To date, the pre-engineering project studies have been completed.
The Hibernia Southern Extension Unit, operated by ExxonMobil, comprises the development of resources in several fault blocks to the south of the existing Hibernia field. The field is planned for development as a satellite to the Hibernia field. The Hibernia South Extension Unit is located across three license areas, where Statoil holds working interests of 22.5% in PL1005, 4.5% in EL1093 and 4.5% of the unit portion of PL1001. Statoil's unitised interest is currently 10.5%.
3.2.5.1.2 USA
With the projects Tahiti and Thunder Hawk on stream, and CaesarTonga sanctioned, we have taken our assets in the Gulf of Mexico to a new level. Onshore we continue to ramp up production from our Marcellus shale gas asset.
Onshore
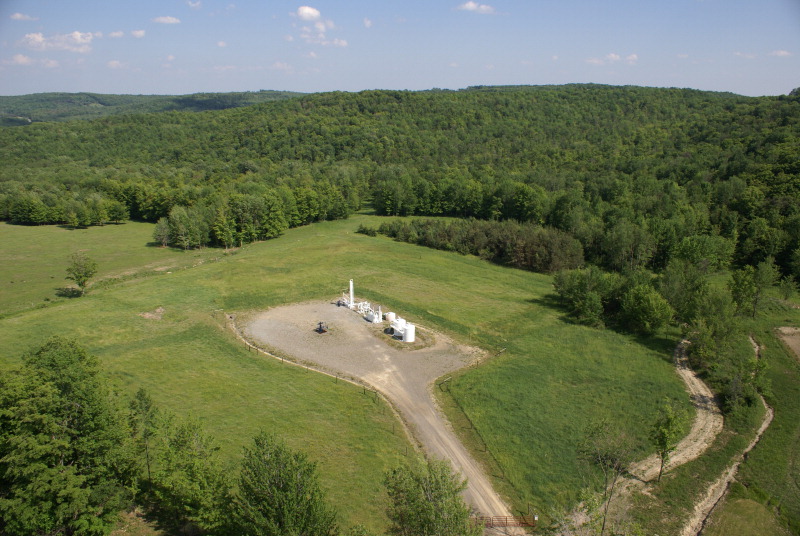
The Marcellus Shale Gas play is located in the Appalachian region of north-eastern USA. In November 2008, we entered into a Strategic Alliance with Chesapeake Energy, acquiring 32.5% of Chesapeake's 1.8 million acres in the Marcellus. The Marcellus provides Statoil with a long-life gas asset with considerable optionality. The asset is part of our gas value chain strategy, whereby we are building a North American gas marketing hub integrated with our Cove Point LNG import terminal and our offshore gas production in the Gulf of Mexico. Marcellus production started in 2008 and Statoil's daily equity production reached around 3,000 boe per day at year end 2009. Statoil and Chesapeake will continue to acquire and high-grade acreage around the most prospective areas of the play and will gradually build up production.
Offshore, Gulf of Mexico
Fields in production
Production started in May 2009 from the Chevron-operated Tahiti oilfield in which we have a 25% interest. The field is located in Green Canyon Block 640 and consists of six wells in two subsea drill centres connected to a Spar floating facility with a production capacity of 125,000 bbl per day. The second phase of the Tahiti development is in the appraisal and project initiation phase. Tahiti 2 will add as many as six producing and four water injection wells to the existing architecture, and the Spar facility is being upgraded to handle 155,000 bbl per day.
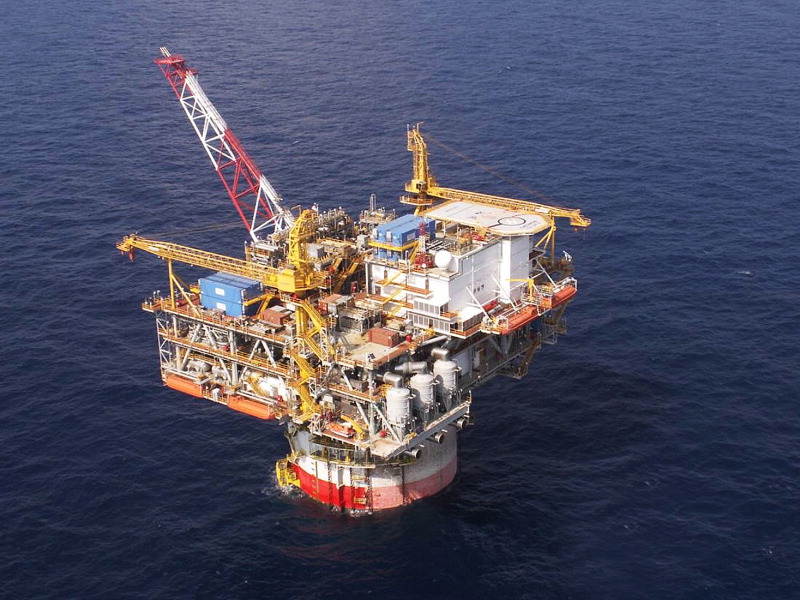
In July 2009, production started from the Thunder Hawk oilfield located in Mississippi Canyon Block 734. We have a 25% interest in the Murphy Oil-operated development consisting of a semi-submersible floating production facility located in Mississippi Canyon Block 736. The processing capacity is approximately 45,000 bbl oil per day.
Our three deepwater natural gas fields - Q, San Jacinto and Spiderman - are part of the Anadarko-operated Independence Hub. The Q field is Statoil-operated while San Jacinto and Spiderman are partner-operated. The fields produce via subsea tie-backs to the Independence Hub platform, a floating production facility located in Mississippi Canyon Block 920. The Independence Hub is owned by third parties and has processing capacity of one billion cubic feet of natural gas per day (178 000 boe per day) . We have contractual rights to 12.7% of that capacity.
We have a 30% interest in the Noble Energy-operated Lorien oilfield, located in Green Canyon 199. Lorien produces through a subsea tie-back to Shell's Bullwinkle platform.
The Murphy-operated Front Runner oilfield is located in Green Canyon 338/339/382. We have a 25% interest in Front Runner, which started production in 2004.
We also had production from Zia in 2009. It is a small oil field located in Mississippi Canyon Block 496 and Seventeen Hands, a small gas field located in Mississippi Canyon Block 299. Both fields tie back to platforms owned by others.
Fields under development
Statoil has a 23.55% working interest in the Anadarko Petroleum-operated Caesar Tonga Unit in Green Canyon Block 683. Development of the four block unit was sanctioned in 2009 as a four-well subsea tie-back to the Anadarko's Constitution platform. The field is expected to start oil production in 2011.
Discoveries under appraisal
The Jack oilfield, which is located in Walker Ridge Block 758/759 and in which we have a 25% interest, was discovered in 2004.
St. Malo is an oilfield located in Walker Ridge Block 678. In January 2010, we increased our interest in St. Malo from 6.25% to 21.5% by exercising our pre-emption rights. St. Malo and Jack are in approximately 2000 metres of water, approximately 40 kilometres apart. Both fields are operated by Chevron and are currently planned to be developed jointly. In 2009, the concept for the development was selected and front-end engineering and design started. The development concept consists of separate subsea wells tied to a shared centrally located surface facility. The Jack and St Malo development is expected to be sanctioned in late 2010.
We have a 27.5% interest in Big Foot, a Chevron-operated oil discovery located in Walker Ridge Block 29. In 2009, a dry tree tension leg platform with a drilling rig was selected as the development concept. Project sanctioning is expected in 2010.
3.2.5.2 Latin America
Our current asset portfolio in Latin America comprises our interest in the Peregrino offshore heavy oil development project in Brazil and the onshore extra heavy oil producing asset, Petrocedeño, in Venezuela.
3.2.5.2.1 Brazil
Statoil is operator for, and owns 100% of the Peregrino oil field off the coast of Brazil. By 2012, we are expected to become the largest international offshore operator in Brazil in terms of production.
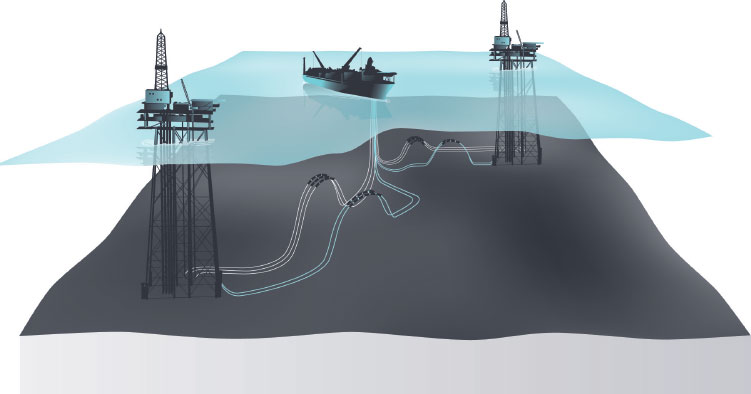
The Peregrino field is a heavy oil field located in approximately 120 metres of water in the prolific Campos Basin off the coast of Brazil, about 85 kilometres off the coast of Rio de Janeiro.
The field is being developed with a Floating Production Storage and Offloading Vessel (FPSO) and two wellhead platforms with drilling capability. The first oil production is planned to come on stream in early 2011 and we expect to reach plateau production within the first year of production. Design capacity is 100,000 boe per day. All development contracts have been signed, and the execution phase of the project and installation of field facilities are now in progress.
3.2.5.2.2 Venezuela
Statoil has a 9.677% interest in Petrocedeño, one of the largest extra heavy crude projects in Venezuela.
The Petrocedeño project involves the exploitation of extra heavy crude oil from the reservoirs in the Orinoco Belt. A diluting component is added in order to enable the extra heavy oil to be transported by pipeline to the coast, where it is upgraded to a light, low-sulphur syncrude destined for the international market. Petrocedeño, S.A., owned by the project partners, operates the field and markets the products.
Petrocedeño experienced operational problems throughout 2009,and was not able to produce up to design capacity. A preventive maintenance shutdown took place at the end of the year and activities were initiated to restore the plant to normal operation.
We have been present in Venezuela since 1994, and we have a long-term perspective on our activities in the country.
3.2.5.3 Sub Saharan Africa
Our development and production portfolio in sub-Saharan Africa comprises blocks 4/05, 15, 17 and 31 off the coast of Angola, and the OML 127 and OML 128 production licences off the coast of Nigeria.
3.2.5.3.1 Angola
The Angolan continental shelf is the largest contributor to Statoil's production outside Norway. It yielded 191 mboe per day in equity production at the end of 2009, 37% of our total international oil and gas output.
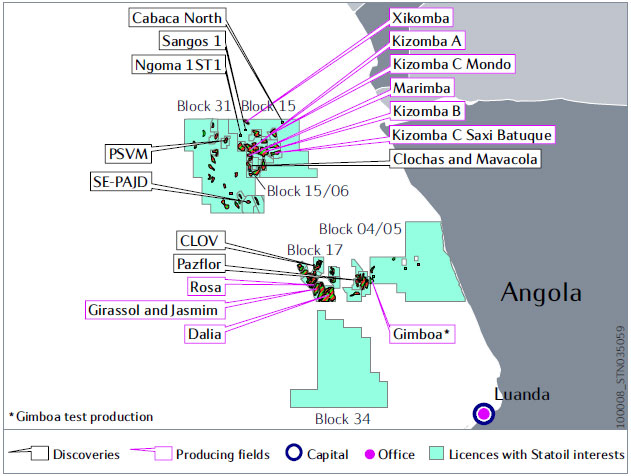
Angola is a key building block in our international strategy and our ambition is to become an operator in the country.
Block 17 is operated by Total, and our interest is 23.33%. Production from the block currently comprises four development areas produced over two FPSOs. The Girassol, Jasmim and Rosa development areas are produced over the Girassol FPSO and the Dalia development area over the Dalia FPSO.
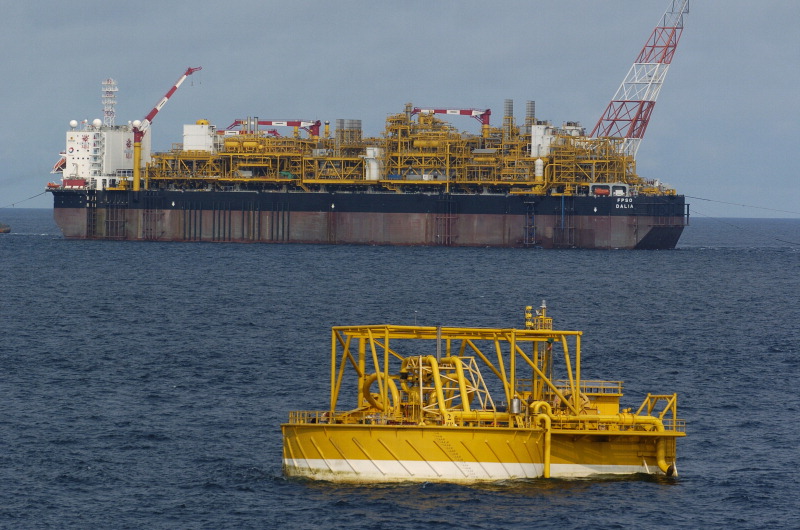
Girassol and Jasmim went off plateau production in October 2008. The combined production from Girassol, Jasmim and Rosa was in the order of 215 mboe per day in 2009. Dalia FPSO produced at a peak level of 240 mboe per day in 2009.
The Pazflor project, which comprises the discoveries Perpetua, Acacia, Zinia and Hortensia, will be produced over a new FPSO with expected production capacity of 200 mboe per day and start-up scheduled for the end of 2011. Once Pazflor starts production, Block 17 is expected to reach a production level of around 650 mboe per day.
The CLOV project, the fourth FPSO development in Block 17, consists of the discoveries Cravo, Lirio, Orchidea and Violeta. Basic engineering started in 2008. Engineering, procurement and construction contracts are under evaluation, and sanction of the project is anticipated in 2010.
Increased Oil Recovery (IOR) projects to fill ullage capacity on the Girassol FPSO and to increase oil recovery from Block 17 are under evaluation. The IOR projects include subsea tie-backs, development of infill wells and the use of new technology.
Pursuant to the Production Sharing Agreement (PSA), all surplus gas from from Block 17 is to be delivered to Sonangol, which owns the gas. Block 17 is progressing on a Gas Export Project that is split into two phases. Phase I, sanctioned in 2007, is an export line from Block 17 to Block 2, where the gas can be injected through a wellhead platform if Angola LNG Terminal (AnLNG) is unavailable. Phase II, sanctioned in 2008, includes a 24-inch diameter pipeline from Block 2 to AnLNG. Costs related to the Gas Export Project will be recovered through the PSA.
Block 15 is operated by Esso Angola, a subsidiary of ExxonMobil. Our interest is 13.33%. Total production from Block 15 exceeded 600 mboe per day in 2009. Production from the block currently comes from five FPSOs; Kizomba A, Kizomba B, Xikomba, Kizomba C-Mondo and Kizomba C-Saxi Batuque. In addition, one satellite, Marimba, is producing through a tie-back to the Kizomba A FPSO. Xikomba, which is a small, isolated field, is expected to be shut down in October 2010.
Kizomba satellites phase 1, consisting of two medium-sized discoveries - Clochas and Mavacola - was sanctioned by the partnership in 2009. Sonangol has approved all major contracts, and detailed engineering is ongoing. It is scheduled to come on stream in 2012.
The Mondo 4 appraisal well drilled in 2009 proved a separate structure of limited size in the Mondo development area. Feasibility studies are ongoing, both for the Mondo 4 discovery and for the other remaining, undeveloped discoveries in the block.
Pursuant to the PSA, all surplus gas from the offshore blocks is to be delivered to Sonangol, which owns the gas. The Gas Gathering Project for Block 15 is under development. It will collect gas from Kizomba A, B and C and the satellites. A dedicated trunk line will deliver the gas to AnLNG.
Block 31, an ultra-deepwater licence, is operated by BP, and our interest is 13.33%. The common development of the first four discoveries in the northern part of the block - Plutao, Saturno, Venus and Marte (PSVM) - was approved by the concessionaire in July 2008. PSVM will be developed via a new FPSO with a production capacity of 150,000 boe per day. Production start-up is expected in late 2011.
Work is also ongoing to pursue the development of SE-PAJD (Hub 2), comprising the Palas, Astraea, Juno and Dione discoveries.
One to two additional production hubs are expected to be launched in this block.
Block 4/05 is operated by Sonangol P&P, and our interest is 20%. This block includes the Gimboa field, which was sanctioned in 2006. The average production has been 21 mboe per day since the FPSO commenced test production in April 2009. Work is also ongoing to pursue the development of Gimboa Phase 2, with two small-sized discoveries, UMC-6 and UMC-7.
Block 15/06 is operated by Eni. Our interest is 5%. Several discoveries have been made. Work is ongoing to assess a development solution for the discoveries located in the northwestern part of the block.
3.2.5.3.2 Nigeria
In Nigeria, we have an interest in the largest deepwater producing field, Agbami.
The Agbami field in deep waters off Nigeria has been developed with subsea wells connected to an FPSO. Production started in 2008. Agbami, which is operated by Chevron, is located in licences OML 127 and OML 128, approximately 110 kilometres off the Nigerian coast. Our interest in the unitised field is 18.85%. The Agbami field reached a plateau production rate of 250 mboe per day in August 2009, four months ahead of schedule.
There is renewed vigour on the part of the Nigerian government to restructure the oil and gas sector by introducing an omnibus bill called the Petroleum Industry Bill (PIB) to replace 16 petroleum related laws that will be repealed. So far, it is not possible to determine the impact of potential restructuring and changes in the regulatory and fiscal framework.
The security and political situation is largely unchanged, with various groups causing continued uncertainty. The overall situation is monitored continuously and appropriate security measures are being assessed for our personnel and assets.
3.2.5.4 North Africa, Europe, Russia and Caspian
Statoil has built a unique position as supplier to the European gas market. In addition to our heritage position on the Norwegian continental shelf, we have upstream assets supplying the market from both the south (Algeria), and south-east (Azerbaijan).
The Shtokman field is a long-term resource that can enhance our upstream gas position while making us a supplier from the north-east.
We have interests in production and development assets in Algeria, Libya, Ireland, the United Kingdom, Azerbaijan and Russia, in addition to early-phase evaluation assets in the United Kingdom and Algeria.
We also have representative offices in Kazakhstan and Turkmenistan.
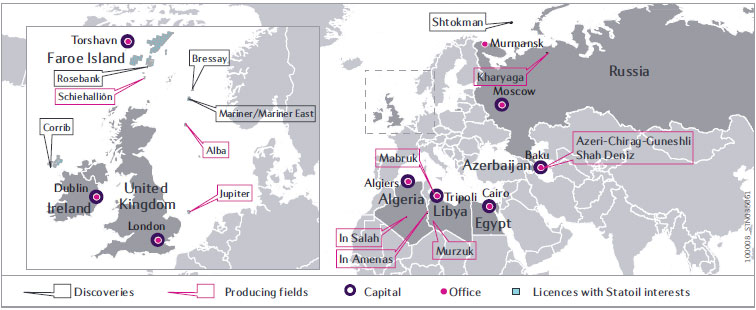
3.2.5.4.1 Algeria
Our main assets, In Salah and In Amenas, are the third and fourth largest gas developments in Algeria.
Fields in production
The In Salah onshore gas development, in which we have a 31.85% interest, is Algeria's third largest gas development. The field is currently producing at plateau level of around 130 mboe per day.Carbon capture is an important environmental commitment. The carbon capture and reinjection at In Salah is verified through a separate Joint Industry Project (between Statoil, BP and Sonatrach). The project aims to reaffirm the sustainability and reliability of carbon dioxide reinjection as a preferred solution for the reduction of carbon emissions. So far, more than three million tonnes of carbon dioxide have been captured and stored.
A Contract of Association, including mechanisms for revenue sharing, governs the rights and obligations of the joint operatorship between Sonatrach, BP and Statoil. A joint marketing company sells the gas produced in the development, and all gas that will be produced up until 2017 has been sold under long-term contracts.
The In Amenas onshore development is the fourth largest gas development in Algeria, containing significant liquid volumes. Production efficiency is high, but export capacity through the Sonatrach pipelines is limited.
The facilities are built and are operated through a joint operatorship between Sonatrach, BP and Statoil, and we have a 50% share of the development costs. Production from this project has currently reached its plateau level. The rights and obligations are governed by a production sharing contract that gives BP and Statoil access to a share of the liquid volumes only. A continuous production drilling campaign is ongoing.
The security situation in the northern part of Algeria is still regarded as unstable and being monitored continuously. Appropriate measures are assessed on the basis of the perceived risk level.
Fields in development
The In Salah Gas Compression Project: start-up of two of the three gas compression plants is expected during 2010. The third plant is expected to start up in early 2011. Work is ongoing on the In Salah Southern Field Development Project to mature the remaining four discoveries into production.
The In Amenas Gas Compression Project is led by BP and expected to be sanctioned in late 2010. The compressors are expected to come on stream in 2013. This will make it possible to reduce wellhead pressure and thus increase production.
In March 2009, the last of the 10 Hassi Mouina exploration/appraisal wells was completed and the drilling rig demobilised. A total of 2500 km of 2D seismic has been collected. At present, Statoil is working on assessing the technical solutions for and commercial attractiveness of a potential development.
3.2.5.4.2 Libya
We are well positioned for growth in Libya, with two producing assets and a focus on technology-based IOR projects.
Fields in production
The Mabruk oilfield is located in licence C-17, north-west in the Sirte basin. The Dahra south-east project was sanctioned in early 2009, and drilling and construction are progressing according to plan.
The NC 186 licence in the Murzuk area consists of seven fields. We are currently producing from six fields (A, B, D, H, I and J) through one common processing facility. The oil from the Murzuk fields is transported by pipeline to the Az Zawia terminal west of Tripoli for lifting by ship. The remaining field with an approved field development plan is K field, which is expected to start production in 2010. The gas utilisation project aimed at stopping continuous flaring is expected to start up in 2010.
3.2.5.4.3 United Kingdom
We have several oilfields under appraisal in the United Kingdom (UK) and hold interests in three producing fields.
Fields in production
The Alba oilfield, located in the central part of the UK North Sea, is operated by Chevron. We have a 17% interest in this field.
Schiehallion oilfield is located west of the Shetland Islands. The operator is BP and we have a 5.88% interest.
Jupiter is a gas field located in the southern part of the UK North Sea. We have a 30% interest and the operator is ConocoPhillips.
All these fields are in the mature to late-life stage of production.
Discoveries under appraisal
We are operator for Bressay (in which we have a 81.63% interest), Mariner (in which we have a 44.44% interest) and Mariner East (in which we have a 62% interest). They are all heavy oil discoveries for which studies and appraisal will continue.
Rosebank, a discovery made by Chevron in 2004, is located west of the Shetland Islands. We have a 30% interest in this field. The operator has recently completed appraisal drilling and is moving towards concept selection.
3.2.5.4.4 Ireland
We have a 36.5% interest in the Corrib gas field, which lies on the Atlantic Margin north-west of Ireland. The Shell-operated Corrib field development was sanctioned in 2001, and work towards first gas is progressing.
The development will comprise seven subsea wells, and the gas will be transported through a pipeline to an onshore gas processing terminal. The gas will be exported from the terminal via the Bord Gais Eireann link line to the existing Irish gas grid.
The Irish planning authorities granted planning permission for the gas terminal in 2004. Project execution was suspended in 2005 due to protests by local landowners. Work on the project recommenced in 2006 following a comprehensive safety review on the onshore pipeline by the Irish authorities. Alternative pipeline routes were identified as part of a community consultation process and a revised route was submitted to the Irish planning authority (ABP) during first quarter 2009. ABP responded to the application in November 2009 with a number of questions and a proposed alternative route which is predominantly located within the Sruwaddacon estuary rather than on land. The project is in the process of reviewing the proposal and will respond to ABP within May 2010. Six of the seven offshore wells have been drilled. Construction of the onshore gas terminal is expected to be completed during 2010. First gas for the project will be dependent upon construction methodology adopted for the revised ons hore pipeline route and receipt of the necessary approvals from the Irish Authorities..
3.2.5.4.5 Azerbaijan
We have been present in Azerbaijan since 1992, and we are now the second largest foreign oil company in the country in terms of proved reserves and production.
At present, we hold interests in three PSAs offshore in the Azeri sector of the Caspian Sea: the Azeri-Chirag-Gunashli (ACG) oilfield, the Shah Deniz gas and condensate field and the Alov, Araz and Sharg prospects.

We have an 8.5633% interest in the BP-operated ACG PSA. Crude oil production from the field commenced in 1997. The field has subsequently been developed through the ACG Phase I-III developments finalised in 2008. Chirag Oil Project was sanctioned in March 2010 and is expected to start production in 2013. The project will comprise one new platform with capacity to produce 185 000 barrels of oil per day. Today, crude production from ACG exceeds 800,000 barrels of oil per day.
The crude oil from ACG is transported to the Mediterranean Sea through the 1760-kilometre Baku-Tbilisi-Ceyhan (BTC) Pipeline, in which we participate with an 8.71% interest.
Statoil has a 25.5% interest in the Shah Deniz PSA, where BP is the field operator. The production of gas from Stage one started at the beginning of 2007 and exceeded six billion cubic metres in 2009. We are the operator of the AGSC company that manages gas sales, contract administration and business development for Shah Deniz stage one gas. We are also the commercial operator of the South Caucasus Pipeline system (SCP) for gas transport from Shah Deniz to markets in Azerbaijan, Georgia and Turkey.
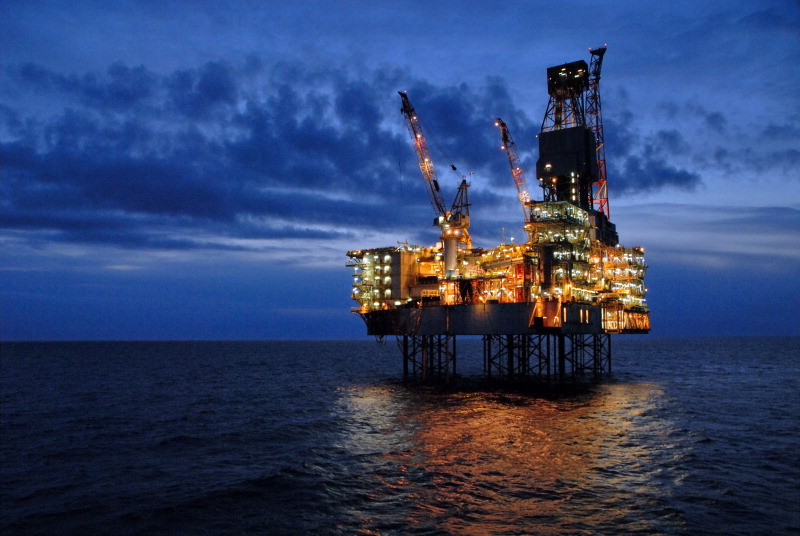
The partnership is working with the ambition to start production of Shah Deniz Stage two in 2016, with a capacity of around 16 billion cubic metres of natural gas per year. The project is in the concept selection phase, and commercial negotiations are ongoing to secure sales contracts and transportation rights to the markets.
The Caspian region has long been viewed as an area with a risk of increased economic, social and political instability. Although the general situation has improved, there are still political disputes that remain unsolved in both Azerbaijan and Georgia.
3.2.5.4.6 Russia
Statoil has been present in Russia since the late 1980s. We have a 24% ownership interest in Shtokman Development AG, which is responsible for the Shtokman development phase one, and a 30% ownership interest in one producing field, the Kharyaga oilfield.
Field under planning
The Shtokman gas and condensate field is located in the Russian Barents Sea, and the agreement with Gazprom gives Statoil a 24% equity interest in Shtokman Development AG in which Gazprom (51%) and Total (25%) are the other two partners. The owners have seconded personnel to Shtokman Development AG (SDAG), which is responsible for planning, financing, constructing and operating the infrastructure that is necessary for the first phase of the development. SDAG will own and operate the infrastructure for 25 years from the start of commercial production. SDAG is currently maturing the technical concept for the first phase of the Shtokman development in accordance with the framework agreements signed in 2007. Implementation of the project is subject to a final investment decision pursuant to SDAG's plans.
Field in production
The Kharyaga field is located onshore in the Timan Pechora basin in north-west Russia. The field is being developed under a production sharing agreement (PSA). Total is the operator. With effect from 1 January 2010, the Russian state oil company Zarubezhneft became a partner in the Kharyaga PSA with a 20% interest, thus reducing Statoil's share from 40% to 30%.
Pursuant to the terms of the PSA, the Kharyaga field is being developed in stages. Production from phase three started in 2009, and the production has been increased to design capacity of 30,000 bbl per day. At year end 2009, 13 wells had been drilled out of a total of 23 planned wells. Phase three also involves the installation of gas treatment facilities that will stop gas flaring in the future.
3.2.5.5 The Middle East and Asia
In January 2010, Statoil and Lukoil signed a development and production contract with Iraqi authorities for the development of the West Qurna 2 field.
We have representative offices in Indonesia, Singapore, Dubai and the United Arab Emirates.
3.2.5.5.1 Iran
Statoil was the offshore operator for the development of phases 6, 7 and 8 of the South Pars gas and condensate field in the Iranian sector of the Persian Gulf. The development is now complete and the last platform began production in 2009.
The Iranian oil company NIOC has taken over as operator for the field. Statoil will be assisting NIOC for a limited transitional period in accordance with the contractual framework.
Statoil has previously taken part in exploration and drilling activities in the country on the Anaran field. Work on this project has been stopped.
Statoil also holds a licence for exploration of the Khorramabad field. No activity is planned for this licence.
See section Risk review - Risk factors- Risks related to our business, for additional information about the risk of US sanctions relating to activities in Iran.
The company will not make any future investments in Iran under the present circumstances, but it is committed to fulfilling its contract obligations in respect of South Pars.
3.2.5.5.2 China
Statoil operated the Lufeng 22-1 oilfield in the South China Sea together with partner CNOOC from 1997 until mid-2009.
Production on Lufeng 22-1 was shut down on 15 June 2009. Abandonment of phase one and demobilisation of the Floating Production, Storage and Offloading (FPSO) vessel was finalised on 14 July 2009. Under an agreement between CNOOC and Statoil, CNOOC has taken over full responsibility for the abandonment of phases two and three of the field. The Shekou operations office was closed at the end of 2009.
Statoil's activities in China are currently centred around R&D cooperation and business development.
3.2.5.5.3 Iraq
On 31 January 2010, Statoil and Lukoil signed a development and production contract with the Iraqi authorities for the development of the West Qurna 2 field.
The consortium of contractors consists of the state of Iraq's North Oil Company (25%), Lukoil (56.25%) and Statoil (18.75%). Lukoil will be the operator. The development and production contract for the West Qurna 2 field was offered as a standard service contract under which the contractors receive cost recovery plus a remuneration fee. Lukoil and Statoil's bid for West Qurna 2 included a production plateau level of 1,800,000 barrels per day.
Lukoil and Statoil are working to set up the organisation required to develop the field. A substantial proportion of the work will be done by an Iraqi workforce or by Lukoil, but Statoil will also contribute to the joint organisation. Statoil will also set up a small representative office in Baghdad.
The security of personnel and implementation of necessary security measures are the main priorities. The security situation in Iraq is still demanding, but it has improved over the last two years. There are variations in different parts of the country, and West Qurna 2 is not considered to be in the most challenging area.
Statoil has been working with the Iraqi authorities for more than five years, conducting joint field studies and training Iraqi personnel. The entry into Iraq gives Statoil an important position in the Middle East, developing one of the world's largest oil fields for the benefit of both the Iraqi people and the participating companies.
3.3 Natural Gas
3.3.1European gas market
In natural gas, we see short term challenges and long term upsides. We expect demand for gas to pick up along with an industrial recovery, and despite weak markets, Statoil's gas business has delivered good results.
In the longer term, we believe natural gas will be an increasingly attractive commodity. According to the IEA World Energy Outlook 2009, estimated annual growth in global gas consumption in the period 2007 to 2030 will be 1.5%, slightly less than last year's estimate.
Growth in gas demand in OECD Europe in the same period is expected to be 0.8% per annum. This translates into a demand for gas in OECD Europe in 2030 of approximately 650 bcm - up from the current level of around 550 bcm. Gas's share of total primary energy consumption is approaching 25% in the OECD countries in Europe, and it is expected to reach 28% in 2030. A large part of the growth in gas consumption in the period - more than 60 per cent - is expected to come from the electricity sector.
We market and sell our own gas and the Norwegian State's natural gas volumes. We are the second largest gas supplier to Europe and the sixth largest supplier in the world. Furthermore, we market gas sourced from producing areas other than the NCS. Other major gas suppliers in Europe are Gazprom in Russia, Sonatrach in Algeria and GasTerra in the Netherlands. We believe that Norwegian natural gas exports will remain highly competitive due to reliability, access to a flexible and integrated transportation infrastructure and proximity to key European markets such as the UK, Germany and France. In addition, natural gas is an attractive source of energy from an environmental perspective since it emits far less CO2 than coal and oil.
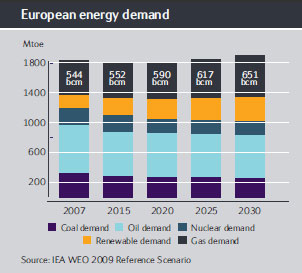
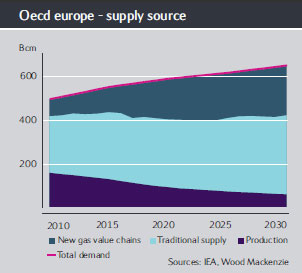
The UK was for a long time the second largest producer of natural gas in Europe after Russia. However, it is expected that the UK could be dependent on imports for approximately 80% of its gas requirements already in 2016. Based on our growing infrastructure, we believe we are well positioned to supply part of the UK's additional demand for imported natural gas and continue to be a key player in the UK market - Europe's largest and most liberalised natural gas market.
The Langeled gas export pipeline was put into operation in 2007, connecting the NCS to Easington in the UK. Another infrastructure project called the Tampen Link, a pipeline from the Statfjord field on the NCS to the existing Flags pipeline on the UK continental shelf, was also completed in 2007. By 2010, the ongoing Gjøa/Vega field developments will be completed and tied into the Flags system - further increasing NCS export capacity to the UK market.
Disputes between Russia and Ukraine about gas transit highlight the importance of Russian gas supplies to European markets. In the years ahead, Russian supplies are expected to grow further, and, in the longer term, the EU is set to import some 80% of its natural gas due to declining domestic gas production. In order to diversify supplies, European countries and companies are actively seeking to establish alternative supply solutions, mainly through LNG, but also by establishing new pipeline infrastructure from the Caspian region and from North Africa.
Europe will need additional sources of natural gas, both because of growth in demand and because of declining domestic production. Statoil participates in increasing gas production in Azerbaijan, with the Shah Deniz field in the Caspian Sea as a key asset. Gas is already exported from Azerbaijan to Georgia and Turkey via the South Caucasus Pipeline (SCP). In order to bring gas even further west, we participate in the Trans Adriatic Pipeline (TAP) that aims to connect the Italian market with gas flowing westwards from Turkey, through Greece and Albania.
As the European energy market undergoes deregulation and structural changes, we believe that natural gas will play an increasingly important role. This trend will be reinforced by further steps in Europe to curb climate gas emissions, in particular by the use of carbon pricing mechanisms such as the EU Emissions Trading Scheme. We expect the use of natural gas as a source of electricity generation to continue to grow, as it is necessary to replace even more coal-based generation capacity with natural gas. Deregulation creates new opportunities and business models in the gas sector, both with regard to added values through efficiency gains and to building a more substantial portfolio of sales directly aimed at large industrial customers and local distribution companies. The integration of the gas and power markets also presents us with new business opportunities in trading and as a means of increasing the value of gas by upgrading through generation and improving our flexibility in market opera tions. We therefore aim to manage and further develop marketed volumes, and to increase the scale and scope of our trading and optimisation, including both midstream and downstream activities.
For information about the EU Gas Directive, please see report section 3.10.3 Operational review - Regulation - The EU gas directive.
3.3.2 Gas sales and marketing
Statoil is a long-term, reliable natural gas supplier that has a strong position in some of the world's most attractive markets. We are the second biggest gas supplier to Europe and the sixth largest in the world.
Europe
The major export markets for NCS gas are Germany, France, the United Kingdom, Belgium, Italy, the Netherlands and Spain. Our main customers are large national or regional gas companies such as E.ON Ruhrgas, GdF Suez, ENI Gas & Power, British Gas Trading (a subsidiary of Centrica), Distrigaz and GasTerra. In addition, we sell to large end users, mostly through long-term take-or-pay contracts.
In the United Kingdom, we market our gas to large industrial customers, power generators and wholesalers, in addition to participating in the UK spot market. NG also has an end user sales business based in Belgium, serving major customers in Belgium, the Netherlands and France. Our group-wide gas trading activity is mainly focused on the UK gas market, which is a significant market in terms of size and the most liberalised market in Europe. We are also increasingly taking part in other liquid trading points such as the TTF (Title Transfer Facility) in the Netherlands, the Zeebrugge Hub in Belgium and Gaspool in Germany.
In 2004, Statoil (UK) Limited and SSE Hornsea Limited (subsidiaries of Statoil and Scottish and Southern Energy Plc, respectively) entered into a joint venture for the development, operation and maintenance of a salt cavern gas storage facility near Aldbrough on the east coast of Yorkshire, close to the Easington terminal. On completion, the storage facility will comprise nine underground caverns. Statoil (UK) Limited owns one third of the storage capacity being developed, of which the SDFI will have access to 48.3%. The facility has been developed and is operated by SSE Hornsea Limited. The storage facility started limited commercial operation during the second quarter 2009, with full commercial operation of the nine-cavern facility scheduled for 2011. The design capacity of the storage facility is expected to be 420 mmcm. Statoil's share of the total development cost is estimated to be NOK 0.7 billion.
In Germany, we hold a 30.8% stake in the Norddeutsche Erdgas-Transversale, or Netra, overland gas transmission pipeline, and a 23.7% stake in Etzel Gas Storage through our subsidiary Statoil Deutschland. Etzel Gas Storage is currently increasing its working gas capacity by 10 additional caverns, one of which was completed in 2009. The rest will be completed in 2010 and early 2011. All partners in Etzel Gas Storage are participating in this project.
USA
The USA is the world's largest and most liquid gas market. Statoil Natural Gas LLC (SNG) has a gas marketing and trading organisation in Stamford, Connecticut that markets natural gas to local distribution companies, industrial customers and power generators. SNG has two long-term capacity contracts with Dominion Resources Inc., which owns the Cove Point LNG re-gasification terminal in Maryland. The first is for a one-third share of Cove Point capacity (LTD1), which equates to approximately 3.2bcm per year, and the second is for 100% of the Cove Point Expansion (CPX) capacity of approximately 7.7 bcm per year. This equates to a total re-gasification capacity of 10.9 bcm per year. This expansion reflects Statoil's focus on the growing natural gas market in the USA and provides more flexibility in sourcing third party LNG to the terminal. The CPX capacity also includes downstream pipeline capacities from the Cove Point terminal to Leidy in Pennsylvania, and gas storage capacity at Leidy. The Cove Point Expansion capacity commenced services on 26 March 2009. A pier expansion project at Cove Point was approved by the Federal Energy Regulatory Commission (FERC) in July 2009 and construction has now started, with completion of the project expected in the latter part of 2011. This will enable the Cove Point terminal to accommodate larger LNG vessels than is currently the case and provide Statoil with increased supply opportunities for third party LNG cargoes into Cove Point.
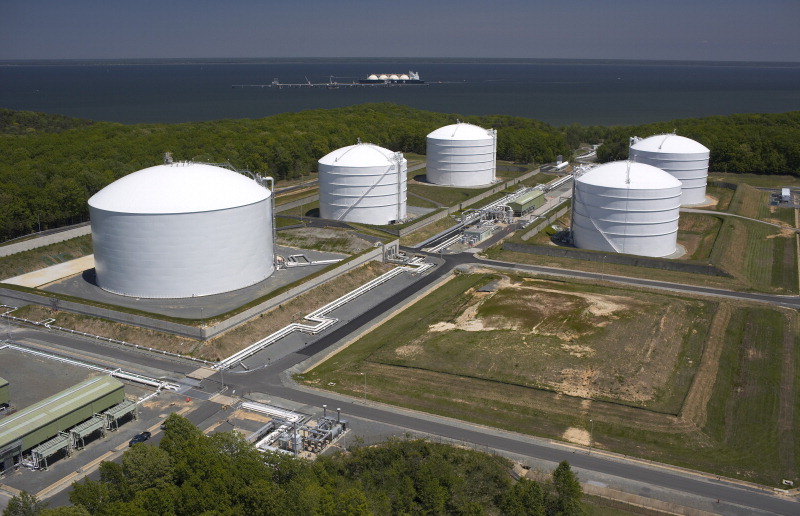
Through Statoil, SDFI pays for a share of the capacity at the Cove Point re-gasification terminal, downstream pipeline capacity and storage capacity. LNG is sourced from the Snøhvit LNG facility in Norway and from third party suppliers.
SNG also markets the equity production from Statoil's assets in the US Gulf of Mexico, in addition to sourcing some pipeline gas domestically for profit optimisation purposes.
In 2008, Statoil entered into a strategic agreement with Chesapeake Energy Corporation (as described in 3.2.5.1.2 The USA). The agreement adds a major building block to Statoil's gas value chain in the USA. It also provides access to large gas reserves located geographically near the North East which, historically, is the highest paying gas market. This will thereby strengthen Statoil's USA gas position. Over time, this will result in a significant increase in the volume of gas marketed and traded by Statoil in the USA.
SNG has also concluded transportation agreements with Tennessee Gas Pipeline (a subsidiary of El Paso Corp), and Texas Eastern Transmission (a subsidiary of Spectra Energy Corp), ensuring Statoil the right to transport up to 2 billion cubic metres (bcm) per year/200 000 mcf/day directly from the Northern Marcellus production area to New York City and the surrounding areas. These agreements secure access to some of the main pipeline systems for gas in the New York City area and thereby help maximize the value of our gas produced in the Marcellus shale. We expect that this will create attractive sales opportunities in New York City, New Jersey and surrounding areas in what is regarded the most attractive gas market in the US
Azerbaijan
Statoil has a 25.5% share in the Shah Deniz gas/condensate field in Azerbaijan and is the commercial operator for gas transportation and sales activities for Shah Deniz stage 1 gas volumes. In addition, Statoil chairs the partners' gas sales committee for the planned Shah Deniz stage 2 full field development. Azerbaijan, Georgia and Turkey are part of the gas sales portfolio for stage 1 in which Turkey is the main market. Gas is purchased and sold through the Statoil-operated Azerbaijan Gas Supply Company (AGSC), and the gas is shipped to customers through the South Caucasus Pipeline (SCP), which runs from the Sangachal terminal in Azerbaijan via Georgia to the Georgian/Turkish border. Shah Deniz stage 1 gas transportation and sales reached 6.2 bcm in 2009.
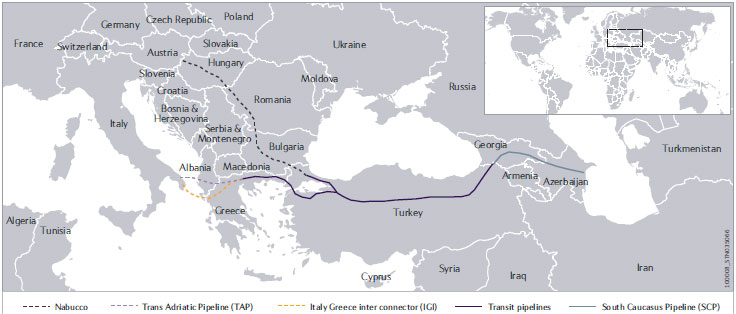
The stage 2 development of Shah Deniz is currently in the Concept Selection phase of operator BP's Capital Value Process. Field reserves support a significant stage 2 production and will be larger than in stage 1. Key activities for NG in this context are related to the commercialisation of stage 2 through the organisation, planning and conducting of gas market/transport evaluations and negotiations with counterparties in the Caspian region, Turkey, the European Union and Russia. Progress of the marketing activities has been hampered by the lack of an intergovernmental agreement between Turkey and Azerbaijan on volumes for transit and sales to the Turkish market.
In February 2008, Statoil signed an agreement with the Swiss EGL Group to establish a joint venture to develop, build and operate the Trans Adriatic Pipeline (TAP) from Greece via Albania to Italy. We joined the TAP project as part of our efforts to provide attractive export options and ensure competition for the Shah Deniz gas in the European market. TAP will thus be competing with other pipelines to attract potential customers for gas from Shah Deniz. A final investment decision is linked to the Shah Deniz stage 2 development.
Algeria
Statoil has a 31.9% share in Algeria's third largest gas development, the In Salah field and In Amenas. The gas is sold through a joint marketing company that sells the gas produced from development on behalf of the operators Sonatrach, BP and Statoil. All gas that will be produced up until 2017 has been sold under long-term contracts.
LNG
Statoil's LNG trading and commercial operations are based in the company's offices in Stavanger, Norway. From here, daily contact is maintained between the production plant at Melkøya, vessels at sea and the contractual receivers of the LNG. Production from the plant at Melkøya, the first LNG production facility in Europe, proved to be unstable throughout 2009. In addition to scheduled maintenance during the months of August to October, several unexpected interruptions to production were experienced during the year. Despite the operational issues at Melkøya, we met our contractual obligations through mitigation activities, such as purchasing replacement LNG and piped gas to supplement available Snøhvit LNG. Global LNG prices have been under pressure from lower demand and increased global production. The largest drop in LNG imports was seen into the US market. Of the Snøhvit production, a total of six cargoes were diverted away from the US market into higher pr iced markets in Europe. Statoil will continue to pursue its ambition to grow a global LNG portfolio.
3.3.3 Norway's gas transport system
The Norwegian gas pipeline system has been developed over the last 30 years to become an integrated system connecting gas producing fields to receiving terminals in Europe via processing plants on the Norwegian mainland.
Norway's gas pipelines currently total 7800 kilometres. Since 2003, all gas pipelines with third party customers have been unitised into a single joint venture, Gassled, with regulated third party access. The Gassled system is operated by the independent system operator, Gassco AS, a company wholly owned by the Norwegian State. In 2009, the Gassled system transported 96.6 bcm (3.4 tcf) of gas to Europe.
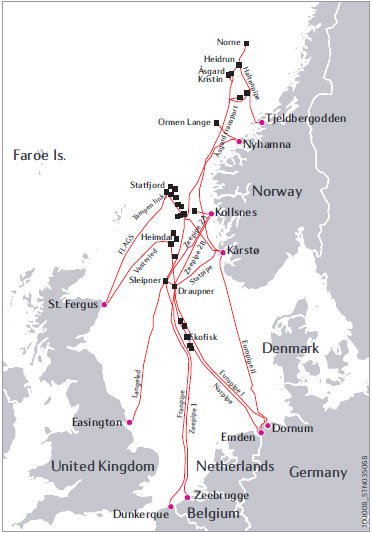
In 2009, the Gassled system was again expanded through the merger of the Kvitebjørn gas pipeline, Norne Gas Transportation System and Etanor ethane fractionation system at Kårstø. When new gas infrastructure facilities are merged into Gassled, the ownership shares are adjusted in relation to the relative value of the assets and each owner's relative interest.
From 1 January 2011, the Gassled ownership interests will be adjusted. Petoro's interests will increase by approximately 8% and all other parties will reduce their interests proportionally. Similar adjustments will be made to the ownership interest in Zeepipe Terminal JV and Dunkerque Terminal DA. In addition, Statoil's future ownership interest in Gassled may change as a result of the inclusion of new infrastructure.
Statoil is technical service provider (TSP) for Gassco with respect to the Kårstø and Kollsnes processing terminals as well as for most of the pipeline infrastructure system.
As an integrated pipeline network with high flexibility and regularity, we believe that the Norwegian gas pipeline system is an essential facility that ensures reliable supplies of natural gas to Europe.
The tables below present facts about the NCS gas pipelines, including transportation routes and daily capacities, and our ownership in Gassled and other terminals.
Gas pipelines included in Gassled | Start up date | Product | Start point | End point | Transport capacity(1) mmcm/day | Statoil share in % | |
|
|
|
|
|
|
|
|
Zeepipe |
|
|
|
|
|
| |
| Zeepipe 1 | 1993 | Dry gas | Sleipner riser platform | Zeebrugge | 40.9 | See Ownership structure Gassled |
| Zeepipe 2A | 1996 | Dry gas | Kollsnes | Sleipner riser platform | 72.0 |
|
| Zeepipe 2B | 1997 | Dry gas | Kollsnes | Draupner E | 71.0 |
|
Europipe 1 | 1995 | Dry gas | Draupner E | Dornum/Emden | 44.5 |
| |
Franpipe | 1998 | Dry gas | Draupner E | Dunkerque | 52.4 |
| |
Europipe II | 1999 | Dry gas | Kårstø | Dornum | 64.6 |
| |
Norpipe AS | 1977 | Dry gas | Norpipe Y (Ekofisk Area) | Emden | 43.1 |
| |
Åsgard Transport | 2000 | Rich gas | Åsgard | Kårstø | 70.4 |
| |
Statpipe |
|
|
|
|
|
| |
| Zone 1 | 1985 | Rich gas | Statfjord | Kårstø | 26.8 |
|
| Zone 4A | 1985 | Dry gas | Heimdal | Draupner S | 33.3 |
|
|
|
|
| Kårstø | Draupner S | 20.1 |
|
| Zone 4B | 1985 | Dry gas | Draupner S | Norpipe Y (Ekofisk Area) | 30.0 |
|
Oseberg Gas Transport | 2000 | Dry gas | Oseberg | Heimdal | 39.9 |
| |
Vesterled (Frigg transport) | 2001 | Dry gas | Heimdal | St. Fergus | 36.0 |
| |
Langeled North | 2007 | Dry gas | Nyhamna | Sleipner Riser | Approx. 70.0 |
| |
Langeled South | 2006 | Dry gas | Sleipner | Easington | 68.0 |
| |
Tampen Link | 2007 | Rich gas | Statfjord | FLAGS | 26.5 (2) |
| |
Norne Gas Transportation System | 2001 | Rich gas | Norne field | Åsgard Transport | 11.0 |
| |
Kvitebjørn gas pipeline | 2004 | Rich gas | Kvitebjørn | Kollsnes | 25.4 |
| |
Gjøa Gas Pipe (3) | 2010 | Rich gas | Gjøa Field | FLAGS | 17.0 |
| |
|
|
|
|
|
|
|
|
(1) We use committable capacity as a measurement for transport capacity. Committable capacity is defined as the capacity available for stable deliveries. | |||||||
(2) 26.5 mmcm/d is the maximal committable capacity |
|
|
|
| |||
(3) To be included in Gassled from 1st June 2010 |
|
|
|
|
| ||
Gas pipelines not included in Gassled | Start-up date | Product | Start point | End point | Transport capacity mmcm/day | Statoil share in % |
|
|
|
|
|
|
|
Haltenpipe | 1996 | Rich gas | Heidrun | Tjeldbergodden/ Åsgard Transport | 7.1 | 19.06 |
Heidrun gas export | 2001 | Rich gas | Heidrun | Åsgard Transport | 10.9 | 12.41 |
|
|
|
|
|
|
|
|
|
|
|
|
|
|
|
|
|
|
|
|
|
Terminal facilities included in Gassled | Startup date | Product | Location |
|
|
|
|
|
|
|
|
|
|
Zeepipe JV |
|
|
|
|
|
|
Europipe receiving facilities | 1995 | Dry gas | Dornum, Germany |
|
|
|
Europipe metering station | 1995 | Dry gas | Emden, Germany |
|
|
|
Norsea Gas AS | 1977 | Dry gas | Gas Terminal, Emden, Germany |
|
|
|
Statpipe JV (Kårstø gas treatment plant) | 1985 | Dry gas/NGL | Kårstø, Norway |
|
|
|
Easington Receiving Facilities | 2006 | Dry gas | Easington, UK |
|
|
|
Vesterled JV (Frigg terminal) | 1978 | Dry gas | St. Fergus, Scotland |
|
|
|
Kollsnes Gas Plant | 1996 | Dry gas/NGL | Kollsnes, Øygarden Norway |
|
|
|
Etanor DA | 2000 | Ethane | Kårstø, Norway |
|
|
|
|
|
|
|
|
|
|
|
|
|
|
|
|
|
|
|
|
|
|
|
|
Terminals not included in Gassled | Startup date | Product | Location |
|
|
|
|
|
|
|
|
|
|
Zeepipe terminal JV (1) | 1993 | Dry gas | Zeebrugge, Belgium |
|
|
|
Dunkerque terminal DA (2) | 1998 | Dry gas | Dunkerque, France |
|
|
|
|
|
|
|
|
|
|
(1) Gassled owners hold 49 per cent interest in the terminal. |
|
|
|
| ||
(2) Gassled owners hold 65 per cent interest in the terminal. |
|
|
|
| ||
Ownership structure Gassled | Period 2009-2010 | Period 2011-2028 |
Petoro AS(1) | 38.46% | 46.51% |
Statoil ASA | 32.10% | 28.32% |
ExxonMobil | 9.43% | 8.03% |
Total | 7.78% | 6.04% |
Shell | 5.32% | 4.92% |
Norsea Gas AS | 2.73% | 2.25% |
ConocoPhillips | 2.00% | 1.67% |
Eni | 1.53% | 1.27% |
Dong | 0.66% | 1.00% |
Statoil interest including 28.58% of Norsea Gas AS | 32.88% | 28.96% |
|
|
|
(1) Petoro holds the participating interest on behalf of the SDFI. |
| |
Gas pipelines included in Gassled | Start up date |
|
|
|
|
Zeepipe | 1993/1996/1997 |
|
Europipe 1 | 1995 |
|
Franpipe | 1998 |
|
Europipe II | 1999 |
|
Norpipe AS | 1977 |
|
Åsgard Transport | 2000 |
|
Statpipe | 1985 |
|
Oseberg Gas Transport | 2000 |
|
Vesterled (Frigg transport) | 2001 |
|
Langeled North | 2007 |
|
Langeled South | 2006 |
|
Tampen Link | 2007 |
|
Norne Gas Transportation System | 2001 |
|
Kvitebjørn Gas Pipeline | 2004 |
|
Gjøa Gas Pipe 3) | 2010 |
|
|
|
|
Terminal facilities included in Gassled | Startup date | Location |
|
|
|
Zeepipe JV |
|
|
Europipe receiving facilities | 1995 | Dornum, Germany |
Europipe metering station | 1995 | Emden, Germany |
Norsea Gas AS | 1977 | Emden, Germany |
Statpipe JV (Kårstø gas treatment plant) | 1985 | Kårstø, Norway |
Easington Receiving Facilities | 2006 | Easington, UK |
Vesterled JV (Frigg terminal) | 1978 | St. Fergus, Scotland |
Kollsnes Gas Plant | 1996 | Kollsnes, Norway |
|
|
|
(1) We use committable capacity as a measurement for transport capacity. Committable capacity is defined as the capacity available for stable deliveries. | ||
(2) 26.5 mmcm/d is the maximal committable capacity |
| |
(3) To be included in Gassled from 1 July 2010. |
|
|
3.3.4 Kårstø gas processing plant
As technical service provider (TSP), Statoil is responsible for the operation, maintenance and further development of the Kårstø gas processing plant on behalf of the operator Gassco.
Kårstø processes rich gas and condensate, or light oil, from the NCS received via the Statfjord pipeline, the Åsgard pipeline and the Sleipner condensate pipeline. The processing plant currently has a rich gas capacity of 88 mmcm per day. Products produced at Kårstø include ethane, propane, iso-butane, normal butane, naphtha and stabilised condensate. When all these elements have been separated from the gas, the remaining gas (dry gas) is sent to customers via the Statpipe, Europipe II and Rogass pipelines. The processing plant currently has a dry gas export capacity of 77 mmcm per day.
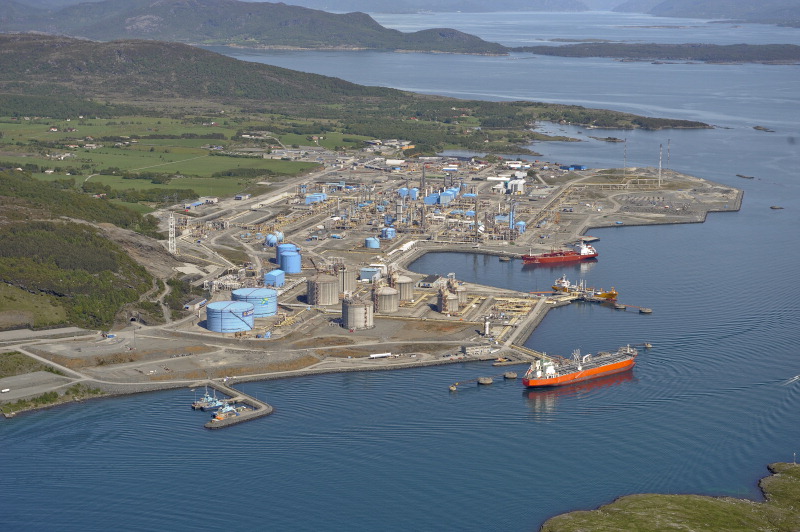
The Kårstø processing plant is undergoing comprehensive upgrading over the next few years in order to meet safety and technical requirements and future needs. KEP is the project name for several projects intended to make the Kårstø facilities more robust and ensure safe and efficient operation. This investment is estimated at around NOK 7 billion. The first sub-project was completed successfully in 2008. Plans entail the completion of the remaining sub-projects between 2010 and 2012. The peak manning for KEP on site will be around 700. In 2009, Kårstø produced 24.1 bcm of dry gas, 0.9 million tonnes of ethane, 4.2 million tonnes of LPG and 2.2 million tonnes of condensate/naphtha for export to customers worldwide.
3.3.5 Kollsnes gas processing plant
As technical service provider (TSP), Statoil is responsible for the operation, maintenance and further development of the Kollsnes gas processing plant on behalf of the operator Gassco.
The plant was initially built to receive gas landed from the Troll field in two 36-inch pipelines. The plant currently has a design capacity of 144 mmcm per day. In 2008, an upgrade was completed of the flash gas compressor and the condensate system, increasing the robustness of the plant. In 2009, Kollsnes produced 31.0 bcm of dry gas and 2.0 mmcm of condensate.
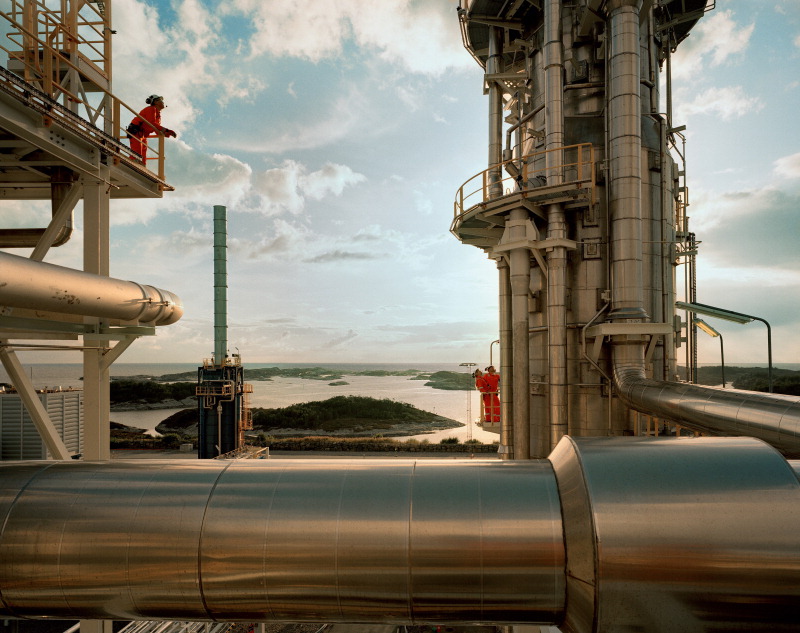
3.3.6 Gas sales agreements
Statoil manages, transports and markets approximately 80% of all NCS gas.
Due to the relatively large size of the NCS gas fields and the extensive cost of developing new fields and gas transportation pipelines, most of Statoil's gas sales contracts are long-term contracts that typically run for 10 to 20 years or more. Under these contracts, the purchasers agree to take daily and annual quantities of gas and, if the gas is not taken, they are obliged to pay for the contracted quantity. The majority of Statoil's long-term sales contracts have reached plateau level.
Prices under traditional long-term contracts are generally tied to a formula based on the prevailing prices for substitute fuels for natural gas, typically heavy fuel oil and gasoil. By contrast, the most recent long-term gas sales contracts in the UK are priced with reference to a daily UK market gas price index. There can be significant price fluctuations during the life of the contract. Under the traditional long-term contracts, prices are typically adjusted quarterly and are calculated on the basis of the prevailing prices in the three to nine months before the date of adjustment as published in reference indices. However, the price formula, which allows for monthly or quarterly adjustment, does not pick up on all trends in the marketplace, e.g. changes in the taxation of gas and competing fuels imposed by national governments. Therefore, most of our long-term gas contracts contain contractual price adjustment mechanisms that can be triggered at regular intervals, either by the buyer or t he seller. Under our long-term sales contracts either party is entitled to initiate a price review process under certain circumstances.
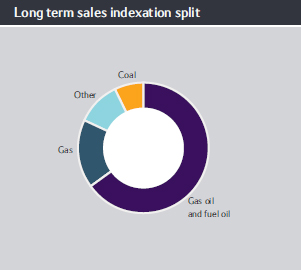
In 2009, Statoil was involved in commercial discussions (in lieu of a price review) or in formal price review processes for approximately 75% of the volumes covered by our long-term sales contracts.
3.4 Manufacturing & Marketing
3.4.1 Oil Sales, Trading and Supply
Statoil is one of the major net sellers of crude oil in the world, operating from sales offices in Stavanger, Oslo, London, Singapore and Stamford, and selling and trading crude oil, condensate, NGL and refined products.
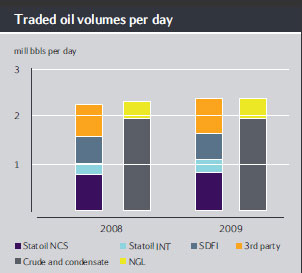
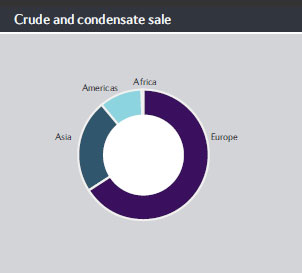
We market Statoil's own volumes and SDFI's equity production of crude oil and NGL, in addition to third party volumes. In 2009, our total sales of crude and condensate were equivalent to 721 million barrels, including supplies to our own refineries. The main crude oil market for Statoil is in north-western Europe. In addition, we sell volumes to North America and Asia. Most of the crude oil volumes are sold in the spot market based on publicly quoted market prices. Of the total 721 mill bbls sold in 2009, approximately 47% were Statoil's own equity volumes.
We also operate the South Riding Point crude oil terminal in the Bahamas in addition to being responsible for optimising the commercial utilisation of the crude terminals located at Mongstad and Sture in Norway.
3.4.1.1 South Riding Point
On 22 October 2009 Statoil completed the acquisition of SRP Holding Limited, which holds the lease for the South Riding Point crude oil terminal in the Bahamas until 2049. The lease includes oil storage as well as loading and unloading facilities.
The terminal, which is located on Grand Bahama Island, consists of two shipping berths and ten storage tanks with storage capacity for 6.75 million barrels of crude.
We plan to upgrade the terminal to allow for the blending of crude oils, including heavy oils. Future blending operations will normally be carried out onshore, but facilities will also be installed that allow for blending from ship to ship at the jetty.
The acquisition is a strategic measure that will both support our global trading ambitions and improve our handling capacity for heavy oils. We have rented capacity at the terminal since 1993. New blending facilities and full terminal capacity will strengthen both our marketing and trading positions in the North American market. The terminal will also be an important part of our plans to market our own volumes of heavy oil.
In addition to the existing lease period, we have an option to extend the agreement for an additional 30 years until 2079.
3.4.2 Manufacturing
Statoil is majority owner and operator of the Mongstad refinery and Tjeldbergodden methanol plant in Norway and sole owner and operator of the Kalundborg refinery in Denmark. We also operate the Oseberg Transportation System.
We are majority owner (79%) and operator of the Mongstad refinery in Norway, which has a crude oil distillation capacity of 180 mbbl per day, and sole owner and operator of the Kalundborg refinery in Denmark, which has a crude oil and condensate distillation capacity of 118 mbbl per day. In addition, we have rights to 10% of production capacity at the Shell-operated refinery in Pernis, the Netherlands, which has a crude oil distillation capacity of 400 mbbl per day. Our methanol operations consist of a 81.7% stake in the gas-based methanol plant at Tjeldbergodden, Norway, which has a design capacity of 0.95 million tonnes per year.
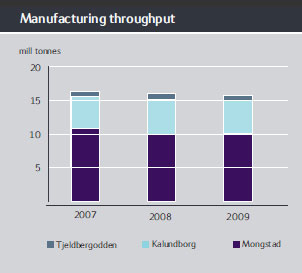
We also operate the Oseberg Transportation System (36.2% stake) including the Sture crude oil terminal. The plant was built to receive crude from the Oseberg field through a pipeline, and since 2003 it has also received crude from the Grane field pipeline. Oseberg blend (after stabilisation), Grane blend and some LPG are exported, while some LPG and naphtha is piped to Mongstad combined with condensate from the Kollsnes gas processing plant.
The following table shows operating characteristics for the plants at Mongstad, Kalundborg and Tjeldbergodden.
All data for year ended December 31 |
|
|
|
|
|
|
|
|
|
|
|
|
| ||
| Throughput (1) |
| Distillation capacity (2) |
| On stream factor % (3) |
| Utilization rate % (4) | ||||||||
Refinery | 2009 | 2008 | 2007 |
| 2009 | 2008 | 2007 |
| 2009 | 2008 | 2007 |
| 2009 | 2008 | 2007 |
|
|
|
|
|
|
|
|
|
|
|
|
|
|
|
|
Mongstad | 10.0 | 10.0 | 10.9 |
| 8.7 | 8.7 | 8.7 |
| 92.3 | 92.2 | 97.8 |
| 86.8 | 88.2 | 93.2 |
Kalundborg | 5.0 | 5.2 | 4.7 |
| 5.5 | 5.5 | 5.5 |
| 95.3 | 88.3 | 96.4 |
| 88.2 | 90.3 | 91.7 |
Tjeldbergodden | 0.71 | 0.91 | 0.70 |
| 0.95 | 0.95 | 0.95 |
| 82.6 | 98.9 | 81.7 |
| 90.2 | 96.5 | 97.7 |
(1) Actual throughput of crude oils, condensates, NGL, feed and blendstock, measured in million tonnes. | |||||||||||||||
(2) Nominal crude oil and condensate distillation capacity, and methanol production capacity, measured in million tonnes. |
|
|
|
|
|
| |||||||||
(3) Composite reliability factor for all processing units, excluding turnarounds. |
|
|
|
|
|
|
|
|
|
| |||||
(4) Composite utilization rate for all processing units, stream day utilization. |
|
|
|
|
|
|
|
|
|
| |||||
3.4.2.1 Mongstad
The Mongstad refinery is a medium-sized, modern refinery. It is linked to offshore fields, the Sture crude oil terminal and the Kollsnes gas processing plant, making it an attractive site for landing and processing hydrocarbons.
The Mongstad refinery was built in 1975. It was significantly expanded and upgraded in the late 1980s, and it has been subject to considerable investment over the last 15 years in order to meet new product specifications. It is a medium-sized, modern refinery. It is directly linked to offshore fields through two crude oil pipelines and linked through an NGL/condensate pipeline to the crude oil terminal at Sture and the gas processing plant at Kollsnes. This makes Mongstad an attractive site for landing and processing hydrocarbons and for the further development of our oil and gas reserves.
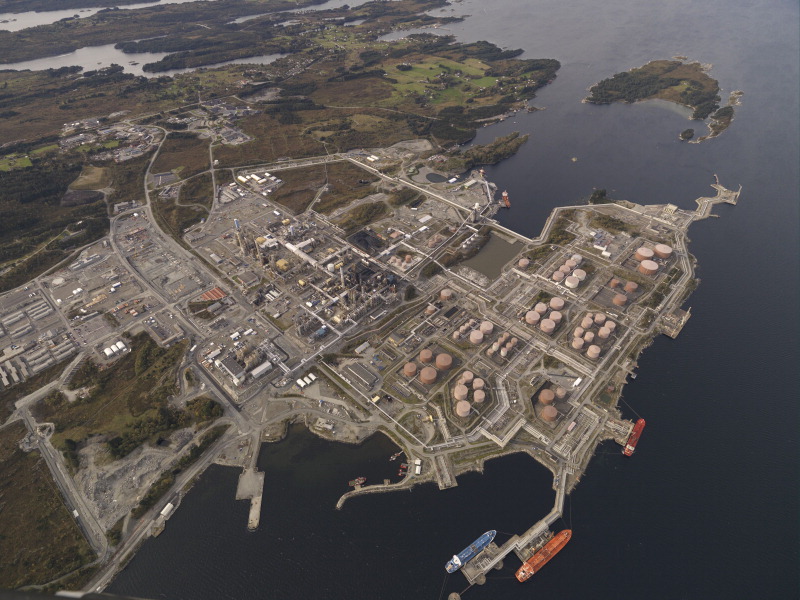
In addition to the refinery, the main facilities at Mongstad consist of a crude oil terminal and a Natural Gas Liquids (NGL) process unit and terminal. The crude terminal is owned 65% by Statoil. A large proportion of its crude oil comes through two direct pipelines from the Troll field. The storage capacity is 9.4 million barrels of crude.
Vestprosess, which is owned 34% by Statoil, transports and processes NGL and condensate. The Vestprosess pipeline connects the Kollsnes and Sture plants to Mongstad. The NGL is fractionated in the Vestprosess NGL unit to produce naphtha, propane and butane.
The refinery is owned 79% by Statoil and 21% by Shell.
Approximately 45% of Mongstad's total production is delivered to Scandinavian markets and 55% is exported to north-west Europe and the United States. The following table shows the approximate quantities of refined products (in thousand tonnes) produced at Mongstad for the periods indicated. In addition to crude, the Mongstad refinery upgrades large volumes of heavy fuel oil, NGL from Oseberg and Tune, and condensate from Troll, Kvitebjørn, Visund and Fram.
The Mongstad refinery can manufacture products to meet different specifications through its in-line blending during ship loading.
| For the year ended 31 December | |||||
Mongstad product yields and feedstock | 2009 | 2008 | 2007 | |||
|
|
|
|
|
|
|
LPG | 372 | 4% | 311 | 3% | 373 | 4% |
Gasoline / naphtha | 4,401 | 44% | 3,902 | 39% | 4,721 | 43% |
Jet / kerosene | 717 | 7% | 820 | 8% | 755 | 7% |
Gasoil | 3,473 | 34% | 3,680 | 37% | 3,865 | 35% |
Fuel oil | 374 | 4% | 485 | 5% | 311 | 3% |
Coke / sulphur | 164 | 2% | 190 | 2% | 222 | 2% |
Fuel, flare & loss | 532 | 5% | 575 | 6% | 692 | 6% |
Total throughput | 10,033 | 100% | 9,963 | 100% | 10,939 | 100% |
|
|
|
|
|
|
|
Troll, Heidrun (FOB crude oils) | 4,062 | 40% | 4,676 | 47% | 4,751 | 43% |
Other North Sea crude oils (CIF crude oil) | 3,679 | 37% | 3,072 | 31% | 3,780 | 35% |
Residue | 1,316 | 13% | 1,132 | 11% | 1,265 | 12% |
Other fuel and blendstock | 976 | 10% | 1,083 | 11% | 1,143 | 10% |
Total feedstock | 10,033 | 100% | 9,963 | 100% | 10,939 | 100% |
|
|
|
|
|
|
|
Note: Changes in throughput and yields are partly due to maintenance shutdowns (e.g. major turnaround in 2008). | ||||||
The refinery reliability (i.e. on-stream factor) was high in 2007, but the site experienced some operational problems during 2008 and 2009. In addition, there were also shutdowns due to the market situation in 2009. In 2008 the largest turnaround in Mongstad's history was executed on schedule. There were no turnarounds in 2007 or 2009. Capacity utilisation (the share of available plant capacity actually used) was reduced in 2009, also due to the market situation.
We are building a combined heat and power plant (CHP plant) at Mongstad. The CHP plant is part of a strategically important project for Manufacturing & Marketing. The CHP plant will improve the Mongstad refinery's energy efficiency. The CHP plant has a capacity of approximately 280 megawatts of electric power and 350 megawatts of process heat. The plant will have a gradual start-up phase as the refinery needs less steam due to a changed feedstock pattern, lower throughput and the postponement of projects. The plant is under commissioning and testing, and will be operated by Dong Energy, with Statoil paying an annual tariff for its use. There is an agreement with the Troll licensees that this facility will supply power to the Troll A gas platform and the associated Kollsnes onshore processing plant. In addition to the CHP plant, the CHP investment project includes a new gas pipeline from Kollsnes and necessary modifications at the refinery.
Together with the Norwegian Government, Statoil is involved in several projects that aim to develop solutions for carbon capture and storage (CCS) at Mongstad. These projects are further described in section 3.5.2 Operational review - Technology & New Energy - New energy.
3.4.2.2 Kalundborg
The Kalundborg refinery is a small and flexible oil refinery. This enables it to produce a variety of products, although its main products are low-sulphur petrol and diesel for markets in Denmark and Sweden.
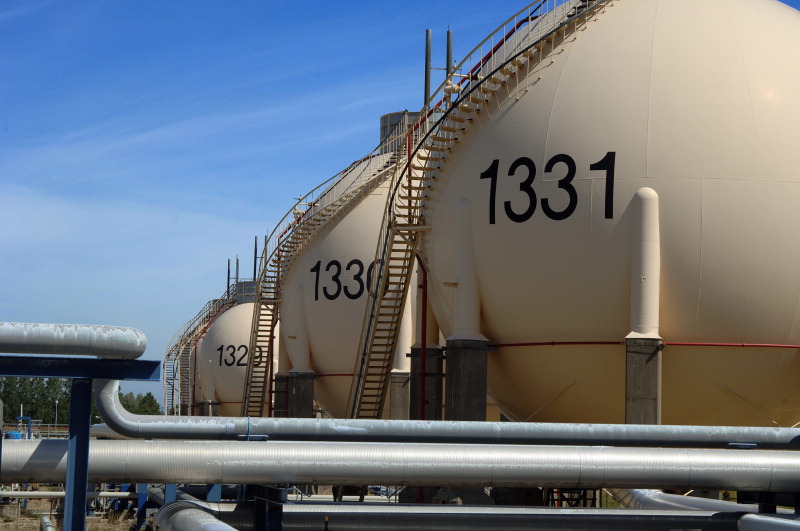
The refinery is connected via two pipelines (one gasoline and one gasoil) to our terminal at Hedehusene, near Copenhagen.
Kalundborg's refined products are also supplied to other markets in north-western Europe, mainly Germany and France. Fuel oil is exported to Italy and the USA.
The following table shows the approximate quantities of refined products (in thousand tonnes) produced by Kalundborg in the periods indicated.
| For the year ended 31 December | |||||
Kalundborg product yields and feedstock | 2009 | 2008 | 2007 | |||
LPG | 71 | 1% | 54 | 1% | 78 | 2% |
Gasoline / naphtha | 1,620 | 32% | 1,598 | 31% | 1497 | 32% |
Jet / kerosene | 130 | 2% | 251 | 5% | 209 | 4% |
Gasoil | 2,140 | 43% | 2,105 | 40% | 1997 | 42% |
Fuel oil (2) | 886 | 18% | 1,023 | 20% | 746 | 16% |
Coke / sulphur | 0 | 0% | 6 | 0% | 5 | 0% |
Fuel, flare & loss | 189 | 4% | 183 | 3% | 186 | 4% |
Total throughput(1) | 5,036 | 100% | 5,220 | 100% | 4,718 | 100% |
|
|
|
|
|
|
|
Condensates: Ormen Lange, Snöhvit, Sleipner | 998 | 20% | 659 | 12% | 170 | 4% |
Other North Sea crude oils | 3,713 | 74% | 4,314 | 83% | 4395 | 93% |
Other fuel and blendstocks | 202 | 4% | 247 | 5% | 153 | 3% |
Other crudes | 123 | 2% |
|
|
|
|
Total feedstocks | 5,036 | 100% | 5,220 | 100% | 4,718 | 100% |
|
|
|
|
|
|
|
1) Total throughput has decreased from 2008, due to the economic downturn. The refinery operates in a market, |
|
|
|
|
|
|
that is oversupplied with products, so the production during 2009 was not maximized. |
|
|
|
|
|
|
2)The Fuel Reduction plant has been in operation throughout 2009, except for a planned shutdown in September, |
|
|
|
|
|
|
and an incident in October, hence the reduction in 2009. |
|
|
|
|
| |
The refinery reliability (i.e. on-stream factor) was relatively high in 2007 and 2009, but 2008 was more challenging; partly related to startup after a major modification project. There was a turnaround in 2007. Capacity utilisation (the share of available plant capacity actually used) was reduced in 2009 due to the market situation.
Kalundborg has improved its performance significantly in recent years through several small investment projects aimed at increasing flexibility and improving yield/product quality. It produces high-quality products, including low-sulphur gasoline and diesel, in accordance with EU specifications.
The Fuel Reduction Project was completed in 2008, and it is now producing according to the design specifications.
3.4.2.3 Tjeldbergodden
The methanol plant at Tjeldbergodden is the largest in Europe and one of the most energy efficient in the world. It is supplied with natural gas from the Heidrun field in the Norwegian Sea through Haltenpipe.
Statoil owns 81.7% of the plant, which has a maximum proven capacity of 0.92 million metric tonnes per year (mmtpa). Actual throughput in 2009 was reduced due to depressed methanol market prices and necessary maintenance. Methanol production in 2009 was 0.71 mmtpa
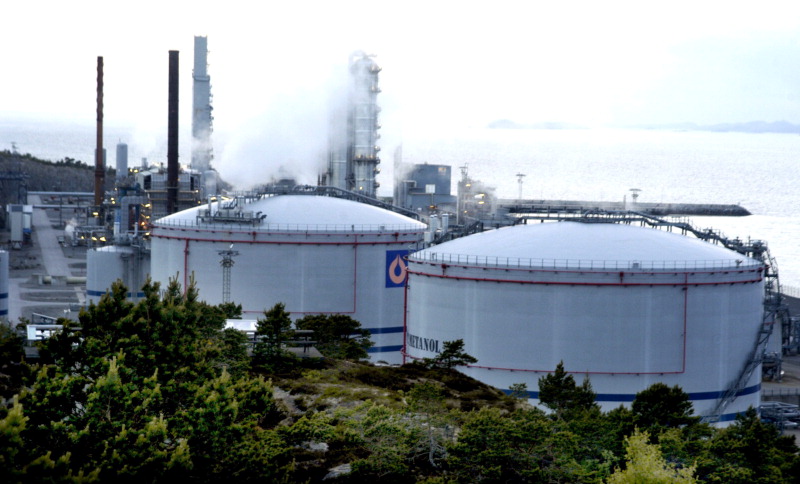
We also own 50.9% of Tjeldbergodden Luftgassfabrikk DA, one of the largest air separation units (ASU) in Scandinavia.
3.4.2.4 Sture
The Sture terminal receives crude oil in two pipelines, from the Oseberg area and the Grane field in the North Sea. The terminal is part of the Oseberg Transportation System in which Statoil has a 36.2% stake.
The terminal has storage capacity for 6.3 million barrels of crude.
The processing facilities at Sture stabilise Oseberg crude oil and recover LPG mix (propane and butane) and naphtha. Oseberg Blend and Grane crude qualities and LPG mix are exported. LPG and naphtha are also transported through the Vestprosess pipeline to Mongstad.
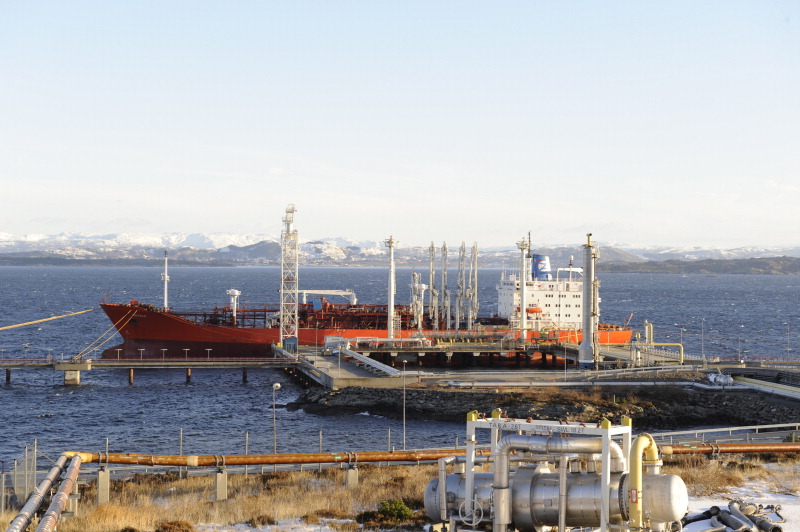
3.4.3 Energy and Retail
Energy and retail employs close to 10,500 employees who run 2000 service stations and 300 automated truck stops in eight countries. We also market refined products directly to consumer and industrial markets.
The majority of Energy and Retail's sales are generated in Scandinavia. In Norway we have a transport fuel market share of approximately 35%. In Sweden, our transport fuel market share is approximately 32%, and in Denmark it is approximately 27%, based on sales from Statoil and JET-branded stations together with truck-stop sales. Other service stations are located in Poland, Russia and the Baltic states: Estonia, Lithuania and Latvia. We are the market leader in Estonia and Latvia measured in terms of fuel volumes sold, with approximately 23% and 36% respectively of the local transport fuel market in 2009.
The full-service stations in the retail segment sell transportation fuels, car accessories and basic vehicle service products. Most stations also offer consumer goods (including fast food), convenience products and basic groceries. In 2009, together with automated stations, these stations sold approximately 6.9 billion litres of petrol and diesel. Sales from truck stops accounted for additional sales of 1.0 billion litres.
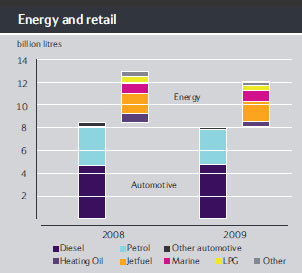
The following table lists retail outlets by region or country as of 31 December 2009 and our volume of automotive fuel sales for the year ended 31 December 2009.
Retail outlets/country |
|
|
|
|
|
|
|
|
|
|
|
Service Stations | Scandinavia | Poland | Baltics | Russia | Total |
Statoil owned and operated | 276 | 186 | 167 | 19 | 648 |
Statoil owned and dealer operated | 464 |
|
|
| 464 |
Dealer owned and operated | 178 | 57 | 6 |
| 241 |
Automated stations | 588 | 47 | 17 |
| 652 |
Total | 1506 | 290 | 190 | 19 | 2005 |
|
|
|
|
|
|
Truck Stops | 292 | 0 | 0 | 0 | 292 |
|
|
|
|
|
|
Automotive fuel volumes (millions of litres) |
|
|
|
| |
|
|
|
|
|
|
Petrol | 2,449 | 375 | 439 | 61 | 3324 |
Diesel | 3,391 | 568 | 469 | 19 | 4447 |
LPG/Ethanol | 67 | 137 | 24 | 0 | 228 |
Total | 5,907 | 1,080 | 932 | 80 | 7,999 |
In addition to retail operations, Energy and Retail also supplies aviation and marine fuels, as well as a large number of Statoil-brand refined products. Such products include heating oil and lubricants that are supplied to both retail and industrial customers.
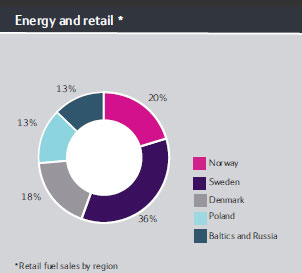
JET integration
A total of 123 JET stations in Sweden and 70 JET stations in Denmark have been successfully integrated into Statoil. A major IT integration has taken place in order to move the stations from the old ConocoPhillips systems over to the Statoil IT platform. The integration of these 193 sites boosts Energy and Retail's position as the leading fuel company in Scandinavia, with a balance between full-service and automated outlets.
Developing our business
Statoil's Board of Directors has approved a proposal to create a stand-alone Energy & Retail business through an initial public offering (IPO) on the Oslo Stock Exchange. The IPO will take place at the earliest in the fourth quarter of 2010 or at a time when the capital market is deemed favourable for such an offering. Statoil intends to remain a majority shareholder of Energy & Retail at the time of the initial public offering and listing. The size and time horizon of Statoil's future ownership in Energy & Retail will be tailored to support and develop company value both for Energy & Retail and for the Statoil Group. The introduction of the new ownership structure is not expected to have a significant impact on the financial statements.
3.5 Technology & New Energy
3.5.1 Research and development initiatives
Our research and development (R&D) efforts focus on the technology areas identified as addressing our key business challenges.
The R&D portfolio is organised in five programmes: Exploration; Increased Oil Recovery and Reservoir Drilling & Well; New Development Solutions; Oil and Gas Value Chain; New Energy and New Ideas. In addition, there is an Academia programme that addresses cooperation with universities and research institutes.
Research and development expenditure has been stable for the last three years at approximately NOK 2.1 billion per year.
Cooperation with external partners such as academic institutions, R&D institutes and suppliers is crucial in relation to technology provision. The aim is a 50/50 split between internal and external R&D spending.
In the exploration technology context, we are developing new basin and prospect concepts that enable better global screening, exploration drilling and quantitative prediction of basin prospectivity. In addition, we are working on the identification, characterisation and prediction of deepwater plays for exploration in complex geological settings. The incorporation of integrated geophysical and geological methodologies into next generation workflows results in continued improvement of subsurface imaging and interpretation. The goal is to considerably reduce the risk of drilling dry holes and to enable us to determine the presence of commercially viable reservoirs prior to drilling.
For proven reservoirs, the aim is to optimise hydrocarbon recovery by improving ways of identifying remaining resources and draining our reservoirs as efficiently and effectively as possible. Important success factors here are data integration and faster model updates for integrated operations across disciplines, organisational entities and geographical areas. We are developing fit-for-purpose modelling techniques for better and more efficient modelling of reservoir drainage, more efficient drilling and intervention solutions and more cost effective well construction methods.
Innovative offshore field development solutions are resulting in a transition from topside facilities to intelligent, remotely-operated, autonomous seabed facilities, coupled with ultra-long, subsea tie-backs and wellstream compression devices. However, we also see that compact processing technology developed for subsea application has a substantial potential to improve production efficiency on existing platforms. The aim is to improve the regularity and performance of both new and producing fields. Furthermore, it is necessary to increase our knowledge about design and operations in ice-bound areas and in ultra-deepwater conditions. Environmental activities relating to our licence-to-operate in the far north and time-critical research relating to exploration drilling in the far north are being addressed. We are also developing technology for the processing and transportation of offshore heavy oil.
The opportunities in gas value chain technology may lie in gaining greater access to, and cost-effectively developing, difficult unconventional gas resources. We are developing technology for the processing and transportation of challenging gas as well as pipeline solutions for deep and ultra-deep assets, and refining technology for handling challenging and unconventional crude oil, such as for the Peregrino field in Brazil.
The Calgary Heavy Oil Technology Centre was established in 2008 to strengthen our efforts in heavy oil technologies. The focus is on developing onshore extra-heavy oil value chains.
Our commitment to environmental stewardship is twofold: meeting our objective of zero harm to the environment by expanding our toolkit of environmental monitoring and integrated risk-modelling systems, and, secondly, creating business in new energy sources. In addition to our present activities in offshore wind and marine biofuels we are assessing opportunities in renewable energy sources and carriers. Cost and energy-efficient carbon capture and storage (CCS) that does not harm the environment is an important element being addressed by Statoil. We believe technological innovation is the key to a profitable, sustainable, low-carbon energy future. Integrating trend-breaking technologies such as biotechnology and other new ideas into the value chains is also part of our research and development efforts.
As part of the research effort, we are pursuing an extensive collaboration programme with academic institutions in which we gain access to world-class research within strategic areas for Statoil. By stimulating the development of leading expertise in the energy segment, we also secure long-term recruitment to science and technology.
By supporting collaboration between universities, research institutions and industry, we also contribute to building a strong Norwegian petroleum cluster.
3.5.2 New energy
New Energy focuses particularly on developing profitable business in areas where we may have a competitive edge as a result of our offshore expertise. Key areas are offshore wind and carbon capture and storage.
Renewable power production
Our main focus in renewable power production is on making offshore wind power a profitable business, but we are also engaged in activities in onshore wind, wave, tidal, solar and geothermal energy. In October 2002, Havøygavlen Wind Park came on line with a capacity of 40 MW. It generates enough power for approximately 5000 Norwegian homes. Havøygavlen is the world's northernmost wind farm, located close to North Cape. Havøygavlen is a wholly owned subsidiary of Statoil. We also have two windmills that power a pioneering project on the island of Utsira. In addition, Statoil has several other onshore wind projects under evaluation in Norway.
Sheringham Shoal
In 2009, Statoil joined forces with the Norwegian utilities company Statkraft to develop the Sheringham Shoal offshore wind farm in the UK. Located off the coast of northern Norfolk, the 315 MW Sheringham Shoal wind farm is expected to provide enough energy to power almost 220,000 British homes. Sheringham Shoal, which received consent in August 2008, will be a major contributor of clean power to the UK market. The generated electricity and renewable energy certificates will be sold in the UK market. Construction work started in 2009. The 88 wind turbine generators will be set into production one by one as they are commissioned and tested in the period up until the end of 2011.
To fulfil its EU 2020 renewable energy target, the UK Government has estimated that more than 30% of its electricity production will have to come from renewable electricity by 2020. Offshore wind will play a major part in achieving this target. In January 2010 The Crown Estate announced the third round of offshore leasing, awarding areas which could develop in total 32 GW of offshore wind capacity. This comes in addition to the potential capacity of 8 GW from previous rounds. Statoil was as part of the Forewind consortium awarded the Dogger Bank zone. This is the largest area in the licensing round with an expected capacity of 9-13 GW. Forewind is a consortium of four equal partners. In addition to Statoil, it consists of RWE npower renewables, Scottish and Southern Energy and Statkraft. This is currently an investment opportunity, and Statoil has as of yet not committed to any investments in the project.
Hywind - the world's first full-scale floating wind turbine
In 2009, Statoil crossed a new energy frontier when the company developed the world's first full-scale floating wind turbine - Hywind. The 2.3 MW turbine, a pilot of a concept developed by Statoil, is located 10 km off the island of Karmøy north of Stavanger in Norway. The test period started in autumn 2009 and will last for two years. The Hywind pilot is based on known technology from both the wind power industry and oil and gas industry, which has been combined in a completely new way. Work on this project rests on the fundamental philosophy that existing turbine solutions can function using floating structures and mooring systems developed for the offshore sector.
Having demonstrated technological feasibility through the Hywind pilot, the next phase will focus on demonstrating commercial feasibility. Statoil is therefore considering locations for further demonstration.
Sustainable fuels
Biofuel is considered to be the most effective measure for reducing carbon dioxide emissions from the transport sector. We wish to position ourselves for longer-term growth in low-cost second-generation marine biofuel technology by building technological expertise and securing access to winning technologies through demo projects, and by engaging in technology development and active technology monitoring.
Carbon capture and storage
Carbon capture and storage (CCS) is seen as one of the main methods of combating climate change. Statoil has long been a pioneer of CCS in oil and gas production, and we currently operate some of the world's largest projects in this area. Statoil is engaged in the development of potential medium and long-term breakthrough technologies for carbon dioxide capture. They include both improvements of existing concepts and radically novel concepts. The aim is to significantly improve energy efficiency and reduce costs.
Together with Gassnova (which represents the Norwegian government in matters relating to CCS), the South African integrated energy and chemical company Sasol, and Shell, we are building a centre for carbon dioxide capture technologies at Mongstad, known as the European carbon dioxide Technology Centre Mongstad (TCM). Sasol has signed a Memorandum of Understanding (MoU) to explore the possibility of becoming a participant in the TCM.
The technology centre demonstration plant aims to help suppliers develop more cost-efficient, environmentally friendly and safe technologies for carbon dioxide capture to handle emissions from different flue gases, such as gas power, coal power and refineries. The plants will have the capacity to capture up to 100,000 tonnes of carbon dioxide annually, and this therefore represent an important step towards full, industrial scale carbon dioxide capture. Construction activities are progressing according to plan after starting in summer 2009, and start up is scheduled for the end of 2011/early 2012.
CCS business development
Based on our experience from Sleipner, In Salah and Snøhvit and our experience of handling geological risk and developing large projects, Statoil is seeking CCS-related business opportunities. Provided that satisfactory commercial and legal conditions are in place, Statoil's ambition is to develop, own and operate profitable CCS projects, focusing on storage. However, to become an important tool in the fight against emissions of greenhouse gases and combating climate change, CCS must become commercially viable.
Potential storage sites are restricted to sedimentary basins that are distributed around the world. These basins are found both onshore and offshore, mostly in the vicinity of land areas. Statoil has established a subsurface team dedicated to mapping and maturing future carbon dioxide storage. The ambition is to store our own carbon dioxide (for example from our own production of carbon dioxide-rich natural gas streams like Sleipner), and third party carbon dioxide (for example from captured carbon dioxide from coal-fired power plants).
Our business activities in carbon dioxide also include the development of projects under the United Nations' Clean Development Mechanism (CDM). This activity builds on our experience of carbon dioxide reduction from the oil and gas sector. Country selection is based on CDM market conditions, Statoil's presence in the country and other criteria, such as emission data and sector attractiveness. Our main activities so far have been in Mexico and China.
3.5.3 Technology development
We are among the front runners in applying technology within the oil and gas industry.
We achieve this by providing best practice support, devising world-class concepts for our development projects, and by leading established corporate initiatives to improve performance.
Our technological expertise enhances our performance in areas such as exploration, improved oil recovery (IOR) and integrated operations (IO). Technology development is used to promote and achieve corporate targets for production growth, increased regularity, reduced costs and improved drilling efficiency.
We also support innovators and entrepreneurs with technology developments and commercialisation activities, thus helping to create robust suppliers and new technology products that are vital to our oil, gas and new energy activities. Statoil has ownership interests and is involved in all major Science Parks and Incubators in Norway, and benefits from venture activities aimed at accessing new technologies. In 2009, we established a special purpose company, Energy Capital Management AS, to manage corporate venture activities. This move focuses on venture capital as a tool for accessing new technologies, and it will underpin Statoil's technology strategy and help to capitalise on today's ownership positions in the venture business. In addition, through the LOOP programme, Statoil helps suppliers to develop new, innovative products and services for our business.
Selected advances made in 2009 are summarised below:
Advanced seismic imaging for exploration
Major technological advances have been made for seismic imaging in complex geology. New state-of-the-art migration algorithms required to image sub-salt structures in the Gulf of Mexico and other salt provinces have been developed and qualified for use by the internal imaging teams in Norway and Houston. This new internal imaging capability will improve our capability in terms of defining sub-salt plays and prospects and maturing drillable prospects. This advance is a key short-term element in the exploration seismic imaging and interpretation initiative.
Through-tubing rotary drilling
New drilling and well technology developed by Statoil and FMC Technologies will improve oil recovery from subsea fields. The technology has now been successfully tested on the Åsgard field in the Norwegian Sea. This technology enables the reuse of old subsea wells in a simpler and more inexpensive way than before, by drilling a new well directly through the production tubing in an existing well. The technology is estimated to have a great potential to increase oil production from subsea fields.
Steerable liner drilling 9-5/8"
The steerable drilling liner concept had its first successful pilot on the Brage field in 2009. This technology improves the ability to drill in depleted reservoirs and unstable formations, and it is an important tool for drilling infill wells in mature fields.
Compact inline technology
A compact cyclonic oil/water and gas/liquid separation unit has been developed. Full-scale pilot testing was carried out on Gullfaks this year. This type of inline technology has multiple areas of application. It is an important tool in relation to succeeding with subsea processing in deep waters such as the Gulf of Mexico. It is excellent for de-bottlenecking and tie-ins to existing platforms, and it presents future opportunities for unmanned platforms. It is Statoil-owned technology, licensed to FMC.
Experience from mono ethylene glycol (MEG) regeneration systems
Results from the start-up and operation of the MEG system on Snøhvit and Ormen Lange have been summarised. The experience from these two MEG systems gives Statoil unique knowledge and understanding of the complex MEG chemistry and process, and it generates new ideas for how such systems can be improved to increase operational regularity.
Laboratory experiments for thermal extra-heavy oil recovery
An experimental rig has been constructed in Alberta, Canada to provide data for optimising the solvent co-injection process in order to reduce energy consumption (steam-oil ratio) and improve bitumen recovery efficiency compared with steam-assisted gravity drainage (SAGD). Two SAGD experiments have been successfully performed as part of providing the basis for studying solvent co-injection and developing expertise in this experimental technique. The solvent co-injection experiment has been completed, and the preliminary results are promising when compared with the two previous SAGD experiments. It is expected that solvent co-injection will reduce both CO2 emissions and water consumption. This has implications for both investments and operating costs.
Hot tapping
The world's deepest hot tap operation on a pressurised pipeline was performed on the Ormen Lange field in the Norwegian Sea in early August. Hot tapping operations involve carrying out repairs, replacements or tie-ins on pipelines that remain pressurised. That makes it possible to avoid expensive shutdowns and simplifies the tie-in of new pipeline systems to existing infrastructure.
Lander technology
Lander technology is an important contributor to the paradigm shift that is taking place in environmental monitoring. Depending on the communication systems (physical downloading of data, cable, communication buoys) and how the lander systems are powered (batteries or from our installations/from land), the multi-sensor platform can measure and send data in real-time. Since the landers serve as a platform, different sensors will be deployed depending on the nature of the actual activity of interest. So far, a lander has been deployed in Nordland VII for measurement of background information on physical and chemical condition in addition to measurement of biological fluxes.
3.6 Projects
3.6.1 Project development
Our projects portfolio is very diverse, ranging from new projects and improvements to existing assets to generating production growth on the NCS and supporting the company's ambitions to become a global energy player.
Completion of our two mega projects, Gjøa and Peregrino, will be our biggest milestones in 2010 and 2011. Moreover, several modification projects such as Statfjord Late Life involve optimising production from exisisting fields.
Project completions 2010 - 2011 | Type |
NCS | Gjøa |
Heidrun PPL upgrade | |
Morvin | |
Ormen Lange Southern Fields | |
Oseberg C mud module | |
Oseberg D Gas Treatment | |
Oseberg D HRSG | |
Oseberg F Low Pressure Production | |
Sleipner A 10 bar inlet pressure | |
Snorre A produced water upgrade | |
Snorre A Re-development, | |
Snorre B produced water upgrade | |
Statfjord Late Life | |
Tordis/Vigdis Control systems | |
Troll A Living Quarter Extension | |
Troll B gas injection | |
Troll C Low Pressure Production | |
Troll O2 Template, | |
Troll P12 Pipeline | |
Vega | |
Visund Nord | |
Åsgard Gas Transfer | |
Onshore | Energiverk Mongstad |
Statoil Mongstad Miljøinvestering (SMIL) | |
Kårstø Double Inlet X-over (DIXO) | |
Kårstø NGL Metering station | |
Kollsnes projects | |
International | In Salah Gas Compression |
Leismer Demo | |
Peregrino |
Executing projects internationally - an essential part of fulfilling the group's ambitions to become a truly global energy player - adds a further element of complexity to our business. Examples of PRO's contributions in this respect are the Leismer Demonstration project and the In Salah Gas Compression.
If we are to build an international reputation as a world-class implementer of projects, the way in which we deliver results is as important as the results themselves. That means delivering on time and cost, and without compromising high HSE and ethical standards.
3.7 People and the group
Statoil's overall strategic objective is to build a globally competitive company and an exceptional place to perform and develop.
The financial and economic turmoil that characterised the global economy in 2009 has affected the entire industry, leading to a stronger focus on efficiency improvements and on the optimal use of existing resources. At the same time, the increase in business activities internationally requires Statoil to develop new capabilities to succeed globally and to attract talents in new countries.
We have recently reviewed our global people policies to ensure consistent common standards across groups. Together with our values and ethical code of conduct, our people policies are the most important guidelines for furthering the people processes.
3.7.1 Employees in Statoil
The Statoil group employs approximately 29,000 permanent employees in 40 countries, and more than 18,000 of them are employed in Norway, and approximately 11,000 were employed outside Norway. Of these, 9,399 were employed in the retail business.
In 2009, the Statoil group recruited almost 3,700 new employees, 50% were recruited to the retail organisation.
By the end of 2009, 35% were under the age of 35, 57% were between 35 and 55 years old, and 8% were 55 years or older. The table below provides an overview of the number of permanent employees and percentage of women in the Statoil group from 2007 to 2009.
| Number of employees | Women | ||||
Geographical Region | 2009 | 2008 | 2007 | 2009 | 2008 | 2007 |
|
|
|
|
|
|
|
Norway | 18,100 | 17,891 | 17,959 | 31% | 30% | 29% |
Rest of Europe | 9,593 | 10,475 | 10,151 | 50% | 47% | 46% |
Africa | 165 | 144 | 117 | 28% | 32% | 34% |
Asia | 150 | 169 | 144 | 55% | 54% | 52% |
North America | 584 | 448 | 315 | 34% | 39% | 33% |
South America | 147 | 102 | 72 | 48% | 53% | 53% |
|
|
|
|
|
|
|
TOTAL | 28,739 | 29,229 | 28,758 | 37% | 35% | 37% |
|
|
|
|
|
|
|
Non - OECD | 2,703 | 3,009 | 2,904 | 64% | 65% | 66% |
* Service station personnel are included
Geographical Region | Permanent employees 2009 | Consultants | Total Workforce* | Consultants** | % of part time | New hires |
|
|
|
|
|
|
|
Norway | 18100 | 5309 | 23409 | 23% | 4.5 | 1310 |
Rest of Europe | 9593 | 4556 | 14149 | 32% | 7.2 | 2113 |
Africa | 165 | 41 | 206 | 20% | N/A | 29 |
Asia | 150 | 36 | 186 | 19% | N/A | 13 |
North America | 584 | 281 | 865 | 32% | N/A | 172 |
South America | 147 | 104 | 251 | 41% | N/A | 62 |
|
|
|
|
|
|
|
TOTAL | 28739 | 10327 | 39066 | 26% | N/A | 3699*** |
|
|
|
|
|
|
|
Non - OECD | 2703 | 314 | 3017 | 10% | N/A | 288 |
|
|
|
|
|
|
|
*Total workforce consists of number of permanent employees and consultants |
|
|
| |||
** Consultants do not include enterprise personnel |
|
|
|
|
| |
*** 1843 of these were recruited to the retail business |
|
|
|
| ||
Statoil's low turnover rates reflect a high level of satisfaction and engagement among its employees, which is also supported by the results of the annual organisational and working environment survey. In Statoil ASA, the total turnover rate for 2009 was 0.73%. The figure below provides an overview of the total turnover rate by gender and age in Statoil ASA
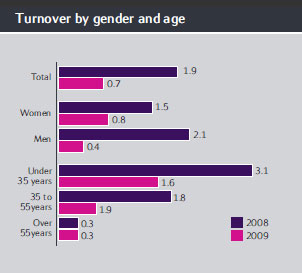
3.7.2 Equal opportunities
We are committed to building a workplace that promotes diversity and inclusion through its people processes and practices.
In December 2009, the overall percentage of women in the company was 37%, and 40% of the board of directors were women, as were 22% of the corporate executive team. The focus on diversity issues is also reflected in the company's people strategy. One of the key priorities in 2009 has been to strengthen diversity in the leadership pipeline. The total proportion of female managers in Statoil ASA is 25%, and, among managers under the age of 45, the proportion is 34%.
Through our development programmes, we aim to increase the number of female managers, and we endeavour to give equal representation to men and women in leadership development programmes. In 2009, we worked systematically on the development, deployment and succession planning of business-critical leadership positions. Of leaders promoted to the top 170 roles in 2009, 47% were female. Of the 84 senior vice presidents in Statoil, 24% are female, while 35% of our successor pool for these roles are female.
We also devote close attention to male-dominated positions and discipline areas. In 2009, 26% of staff engineers were women, and among staff engineers with up to 20 years' experience, the proportion of women is 31%. The proportion of female skilled workers in 2009 was 16%.
The reward system in Statoil is non-discriminatory and supports equal opportunities, which means that, given the same position, experience and performance, men and women will be at the same salary level. However, due to differences between women and men in types of positions and number of years' experience, there are some differences in compensation when comparing the general pay levels of men and women.
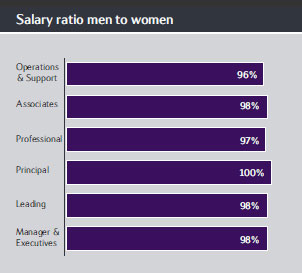
Cultural diversity
We believe that being a global and sustainable company requires people with a global mindset. One way to build a global company is to ensure that recruitment processes both within and outside Norway contribute to a culturally diverse workforce. In December 2009, 4% of the managers and 7% of the rest of our employees based in our Statoil offices in Norway are of non-Norwegian origin. Outside Norway, we need to continue to focus on increasing the number of people and managers that are locally recruited, and to reduce long-term, extensive use of expats in our business operations.
3.7.3 Unions and representatives
Statoil's cooperation with employee representatives and trade unions is based on confidence, trust and continuous dialogue between management and the people in various cooperative bodies.
In Statoil, 69% of the employees in the parent company are members of a trade union. Work councils and working environment committees are established where required by law or agreement.
In 2009, one of Statoil's cooperation priorities has been to improve relations with European employee representatives. The European Work Council (EWC) consists of employee representatives from nine European countries, mostly from the retail side of the business. The EWC is an arena where Statoil's employees in Europe receive relevant information on a regular basis, and engage in direct dialogue with management on matters concerning the group as a whole. Two conferences were held for this purpose in 2009.
Statoil is also currently party to an international agreement with the International Federation of Chemical, Energy, Mine and General Workers Union (ICEM). This agreement supports and facilitates Statoil's ambition to further promote and develop good employee and industrial relations on a broad global basis and its content reflects our policies and values on areas such as industrial relations, human rights and labour standards and HSE.
Since 2007, Statoil has undergone major organisational changes as a result of the merger between Statoil and Hydro's oil and gas division. In 2009, Statoil finalised the merger by implementing its new operating model on the Norwegian continental shelf, which affected 5000 offshore employees. The unions and the company agreed on the principles for the new collaboration model, which involve simplifying and decentralising the model.
3.7.4 Organisational structure
The following table shows significant subsidiaries owned directly by the parent company, as well as the parent company's equity interest and the subsidiaries' country of incorporation.
Our voting interest is in each case equivalent to our equity interest.
Ownership in certain subsidiaries (in %) |
|
|
|
|
|
Name | % | Country of | Name | % | Country of |
SIA Statoil Latvija | 100 | Latvia | Statoil Norge AS | 100 | Norway |
Statholding AS | 100 | Norway | Statoil Norsk LNG AS | 100 | Norway |
Statoil AB | 100 | Sweden | Statoil North Africa Gas AS | 100 | Norway |
Statoil Angola Block 15 AS | 100 | Norway | Statoil North Africa Oil AS | 100 | Norway |
Statoil Angola Block 15/06 Award AS | 100 | Norway | Statoil North America Inc. | 100 | United States |
Statoil Angola Block 17 AS | 100 | Norway | Statoil Orient AG | 100 | Switzerland |
Statoil Angola Block 31 AS | 100 | Norway | Statoil Petroleum AS | 100 | Norway |
Statoil Apsheron AS | 100 | Norway | Statoil Polen Invest AS | 100 | Norway |
Statoil Azerbaijan AS | 100 | Norway | Statoil Sincor AS | 100 | Norway |
Statoil BTC Finance AS | 100 | Norway | Statoil SP Gas AS | 100 | Norway |
Statoil Coordination Centre NV | 100 | Belgium | Statoil UK Ltd | 100 | United Kingdom |
Statoil Danmark AS | 100 | Denmark | Statoil Venezuela AS | 100 | Norway |
Statoil Deutschland GmbH | 100 | Germany | Statoil Venture AS | 100 | Norway |
Statoil Exploration Ireland Ltd. | 100 | Ireland | Statpet Invest AS | 100 | Norway |
Statoil Forsikring AS | 100 | Norway | UAB Lietuva Statoil | 100 | Lithuania |
Statoil Hassi Mouina AS | 100 | Norway |
|
|
|
Statoil New Energy AS | 100 | Norway | Statoil Methanol ANS | 82 | Norway |
Statoil Nigeria AS | 100 | Norway | Mongstad Refining DA | 79 | Norway |
Statoil Nigeria Deep Water AS | 100 | Norway | Mongstad Terminal DA | 65 | Norway |
Statoil Nigeria Outer Shelf AS | 100 | Norway | Tjeldbergodden Luftgassfabrikk DA | 51 | Norway |
|
|
|
|
|
|
3.8 Production volumes and price information
Statoil's operational review is in accordance with the organisation of its operations, whereas certain disclosures about oil and gas reserves are based on geographical areas as required by the SEC.
Statoil prepares its operational review in accordance with its segment (business area) structure. Each business area is presented individually, and includes underlying business clusters according to how the business area organises its operations.
For further information on extractive activities, refer to sections 3.1 Operational review - E&P Norway and 3.2 Operational review - International E&P for descriptions of Exploration and Production Norway and International Exploration and Production, respectively.
Statoil prepares its disclosures for oil and gas reserves and certain other supplemental oil and gas disclosures based upon geographical areas as required by the SEC. The geographical areas are defined by continent, and consist of Eurasia, Africa and the Americas. Relevant information is further split into Norway and Eurasia excluding Norway.
For further information on disclosures for oil and gas reserves and certain other supplemental disclosures based upon geographical areas as required by the SEC, refer to this section 3.8 Operational review - Production volumes and price information and 3.9 Operational review - Proved oil and gas reserves.
3.8.1 Entitlement production
This section describes our oil and gas production and sales volumes.
The following table shows our Norwegian and international entitlement production of crude oil and natural gas for the periods indicated. The stated production volumes are the volumes that Statoil is entitled to pursuant to conditions laid down in licence agreements and production sharing agreements, or PSAs. The production volumes are net of royalty oil paid in kind and of gas used for fuel and flaring. Our production is based on our proportionate participation in fields with multiple owners and does not include production of the Norwegian state's oil and natural gas. Production of extra heavy oil from the field Petrocedeño in Venezuela is included as crude oil.
| For the year ended 31 December | ||
Entitlement production | 2009 | 2008 | 2007 |
|
|
|
|
Norway |
|
|
|
Crude oil (mmbbls)1 | 279 | 302 | 299 |
Natural gas (bcf) | 1367 | 1348 | 1238 |
Natural gas (bcm) | 38.7 | 38.2 | 35.1 |
Combined oil and gas (mmboe) | 523 | 542 | 519 |
|
|
|
|
Eurasia excluding Norway |
|
|
|
Crude oil (mmbbls)1 | 19 | n/a | n/a |
Natural gas (bcf) | 49 | n/a | n/a |
Natural gas (bcm) | 1.4 | n/a | n/a |
Combined oil and gas (mmboe) | 28 | n/a | n/a |
|
|
|
|
Africa |
|
|
|
Crude oil (mmbbls)1 | 63 | n/a | n/a |
Natural gas (bcf) | 54 | n/a | n/a |
Natural gas (bcm) | 1.5 | n/a | n/a |
Combined oil and gas (mmboe) | 73 | n/a | n/a |
|
|
|
|
America |
|
|
|
Crude oil (mmbbls)1 | 20 | n/a | n/a |
Natural gas (bcf) | 48 | n/a | n/a |
Natural gas (bcm) | 1.4 | n/a | n/a |
Combined oil and gas (mmboe) | 29 | n/a | n/a |
|
|
|
|
Outside Norway |
|
|
|
Crude oil (mmbbls)1 | n/a | 85 | 92 |
Natural gas (bcf) | n/a | 121 | 114 |
Natural gas (bcm) | n/a | 3.4 | 3.2 |
Combined oil and gas (mmboe) | n/a | 106 | 112 |
|
|
|
|
Total |
|
|
|
Crude oil (mmbbls)1 | 381 | 386 | 391 |
Natural gas (bcf) | 1519 | 1469 | 1352 |
Natural gas (bcm) | 43.0 | 41.6 | 38.3 |
Combined oil and gas (mmboe) | 652 | 648 | 632 |
|
|
|
|
|
|
|
|
1) Crude oil includes natural gas liquids (NGL) and condensate. NGL includes both LPG and naphta. |
| ||
3.8.2 Average production cost and sales prices
The following tables present the average unit of production cost based on entitlement volumes and realised sales prices. The information has been split by continent for 2009, while this split is not available for prior periods.
| Norway | Outside Norway |
|
|
|
Year ended 31 December 2008 |
|
|
Average sales price liquids in USD per bbl | 91.5 | 88.7 |
Average sales price natural gas in NOK per Sm3 | 2.4 | 1.3 |
Average production cost in NOK per boe | 37.3 | 42.2 |
|
|
|
Year ended 31 December 2007 |
|
|
Average sales price liquids in USD per bbl | 70.9 | 69.1 |
Average sales price natural gas in NOK per Sm3 | 1.69 | 1.17 |
Average production cost in NOK per boe | 46.3 | 34.4 |
| Norway | Eurasia excluding Norway | Africa | America |
|
|
|
|
|
Year ended 31 December 2009 |
|
|
|
|
Average sales price liquids in USD per bbl | 57.8 | 58.2 | 57.8 | 61.7 |
Average sales price natural gas in NOK per Sm3 | 1.9 | 0.6 | 1.4 | 0.9 |
Average production cost in NOK per boe | 36.9 | 55.2 | 40.9 | 45.3 |
3.9 Proved oil and gas reserves
Proved oil and gas reserves were estimated to be 5408 mmboe at the end of 2009, compared with 5584 mmboe at the end of 2008.
Proved reserves and changes in proved reserves are estimated in accordance with SEC definitions. As of 31 December 2009 Statoil's estimates reflect the revisions to Rule 4-10 of SEC Regulation S-X on the definitions of reserves. For additional information see "Critical accounting judgements and key sources of estimation uncertainty; Proved oil and gas reserves" in note 2 Significant accounting policies to the consolidated financial statements. For prior period figures, see note 35 Supplementary oil and gas information to the consolidated financial statements. The reserves replacement ratio is defined as the sum of additions and revisions of proved reserves, divided by produced volumes in any given period.
Summary of oil and gas reserves as of 31 December 2009 based on average fiscal-year prices.
| Proved reserves | ||
| Oil and NGL | Natural Gas | Total oil and gas |
Reserves category | (mmbbls) | (bcf) | (mmboe) |
|
|
|
|
Developed |
|
|
|
Norway | 1,028 | 14,138 | 3,548 |
Eurasia excluding Norway | 94 | 523 | 187 |
Eurasia | 1,122 | 14,661 | 3,735 |
Africa | 208 | 256 | 254 |
America | 111 | 73 | 124 |
|
|
|
|
Undeveloped |
|
|
|
Norway | 322 | 2,800 | 821 |
Eurasia excluding Norway | 44 | 224 | 84 |
Eurasia | 366 | 3,024 | 905 |
Africa | 102 | 83 | 116 |
America | 265 | 51 | 274 |
|
|
|
|
Total proved reserves | 2,174 | 18,148 | 5,408 |
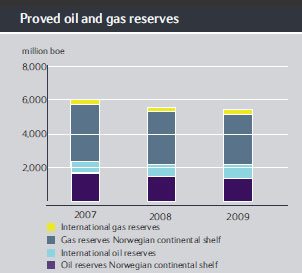
Changes in proved reserves estimates most commonly originate from revisions of estimates due to observed production performance, extensions of proved areas through drilling activities, or the inclusion of proved reserves in new discoveries through the sanctioning of development projects. These are sources of additions to proved reserves that result from continuous business processes and could be expected to continue to add reserves at some level in the future. Proved reserves can also be added or subtracted through acquisitions or disposals of assets.
Changes in proved reserves can also be due to factors outside management control, such as changes in oil and gas prices. Proved reserves as of 31 December 2009 have been determined based on a 12 month average price, whereas proved reserves for previous years are based on year end prices. While higher oil and gas prices normally allow more oil and gas to be recovered from the accumulations, Statoil's proved oil and gas reserves under PSAs and similar contracts will generally decrease as a result. Statoil will receive smaller quantities of oil and gas under the cost recovery and profit sharing arrangements of these contracts as a result of increased oil and gas prices. These changes are included in the revisions category in the table below.
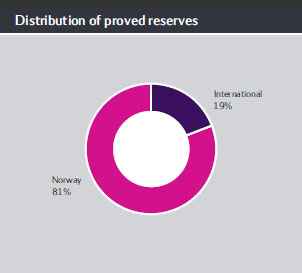
In Norway, reserves are booked as proved when a development plan is submitted, since there is reasonable certainty that such a plan will be approved by the regulating authorities. Outside of Norway, reserves are booked as proved when regulatory approval is received, or when such approval is imminent. New discoveries with reserves booked in 2009 all start production in the period from 2009 to 2013. Reserves from new discoveries, upward revisions of reserves and purchases of proved reserves are expected to contribute to maintaining proved reserves in future years.
Additions that have contributed to our proved reserves in 2009 are:
Extension and discoveries that have increased our proved reserves in 2009 are:
- The Goliat field in the Bartents Sea in Norway, Kizomba satellites phase 1 in Angola and the Caesar Tonga Unit in Gulf of Mexico, USA, were sanctioned in 2009.
- The Beta Vest structure, an extension to the Sleipner Vest field, proved hydrocarbons by drilling in 2009.
- The Gimboa field in Angola commenced test production in April 2009.
- The PSVM development in Angola was approved by the concessionaire in 2008 and is carrying proved reserves in 2009.
- The Marcellus Shale Gas play in the USA, part of our gas value chain strategy, carries proved reserves in 2009.
Approval of future development plans for several of our producing fields on the NCS has contributed positively to revision of proved reserves:
- On the Oseberg field, a decision to upgrade existing drilling facilities allows for more wells to be drilled, resulting in increased reserves.
- On the Rimfaks field, a decision of pressure depleting the Brent reservoir has increased the reserves.
- On the Kvitebjørn field, a project has been approved that will allow for production at lower reservoir pressure through installation of a compressor module, thereby increasing the reserves.
In December 2008, the SEC issued new rules for reporting of oil and gas reserves by revising the definition of proved reserves. The technical aspects of the new rules have affected our proved reserves from certain fields:
- At the Kai Kos Dehseh leases in the Athabascan area in Canada, the Leismer Demonstration Project is able to book proved reserves for the first time, referring to several analogous reservoirs in the Athabascan area where reserves are currently produced using the SAGD technology. The project was sanctioned in 2008 and is scheduled to start production in 2010.
- Future extension of the licence period is now assumed reasonably certain on the NCS, increasing the proved reserves for certain fields.
- Some fields, previously limited by lowest known hydrocarbons, have been included in the proved reserves based on a lower contact established with reasonable certainty based on reliable technology.
The effect of the new rules on our total proved reserves is however immaterial and is estimated to be less than 2%. This estimate includes the effect of the change in product price to be used, from year end price to a 12 month average price.
Below is a table showing the reserves additions in each change category relating to the reserve replacement ratio for the years 2009, 2008 and 2007.
| For the year ended 31 December | ||
(million boe) | 2009 | 2008 | 2007 |
Revisions and improved recovery | 326 | 213 | 325 |
Extensions and discoveries | 155 | 17 | 215 |
Purchase of petroleum-in-place | 0 | 69 | 0 |
Sales of petroleum-in-place | (4) | (10) | 0 |
Change in interest * | 0 | (68) | 0 |
Total reserve additions | 476 | 222 | 541 |
Production | (652) | (648) | (632) |
Net change in proved reserves | (176) | (426) | (91) |
|
|
|
|
* Reduction of interest in Petrocedeño |
|
|
|
The reserves replacement ratio was 73% in 2009, compared with 34% in 2008. The increase in the reserves replacement ratio in 2009 compared with 2008 is mainly due to 2009 being a year with more reserves additions from new fields and sanctioned future development plans for producing fields. The average replacement rate for the last three years was 64%, including purchases, sales and reduction of the shareholding in Petrocedeño in 2008.
| For the year ended 31 December | ||
Reserves replacement ratio (three-year average) | 2009 | 2008 | 2007 |
Corporate | 0.64 | 0.60 | 0.81 |
The usefulness of the reserves replacement ratio is limited by the volatility of oil prices, the influence of oil and gas prices on PSA reserve booking, the sensitivity related to the timing of project sanctions, and the time lag between exploration expenditure and booking of reserves.
Preparation of reserves estimates
Statoil's annual proved reserves reporting process is coordinated by a central group of experts. This group is called Corporate Exploration and Production Forecasting (CEPF) and consists of experts within geosciences, reservoir and production technology and financial evaluation with on average more than 20 years of experience from the oil and gas industry. The CEPF group reports to the Vice President of Finance and Control in the Technology and New Energy business area and is thus independent of both E&P Norway and the International E&P business areas.
Although this group reviews the information centrally, each asset team is responsible for ensuring that it is in compliance with the requirements of the SEC and our corporate standards. Information about proved oil and gas reserves, standardised measures of discounted net cash flows related to proved oil and gas reserves and other information related to proved oil and gas reserves, is collected from the assets and checked for consistency and conformity with applicable standards by CEPF. The final numbers for each asset are quality controlled and signed off by the responsible asset manager before aggregation to required reporting level by CEPF.
The aggregated results are brought forward for approval to relevant Business Area management teams and the corporate executive committee and finally presented to the board of directors.
The technical person primarily responsible for overseeing the preparation of the reserves estimates is the manager of the CEPF group. The person who presently holds this position has a Bachelor's Degree in Earth sciences from the University of Gothenburg, and a Master's degree in Petroleum Exploration and Exploitation from Chalmers University of Technology in Gothenburg, Sweden. She has 24 years of experience in the oil and gas industry of which 23 are within Statoil. She is a member of the Norwegian Petroleum Society and a vice chairperson of the UNECE Expert Group on Resource Classification (EGRC).
Development of reserves
Total quantity of proved undeveloped oil and gas reserves as of 31 December 2009 was 1 295 mmboe of which 63% is related to fields in Norway. Significant undeveloped reserves are related to large gas fields on the NCS with continuous development activity, such as Troll, Snøhvit, Tyrihans, Visund and Ormen Lange.
Due to the nature of large fields with continuous development activity such as Troll and Snøhvit in Norway, Azeri-Chirag-Gunashli in Azerbaijan and Petrocedeño in Venezuela, these fields contain reserves that remain undeveloped for five years or more. The Troll phase 3 development activity includes start-up of production from additional wells in 2024 while the Snøhvit development activity includes start-up of production from additional wells in the Askeladden structure in 2017, both to maintain the plateau production. The development activity for Azeri-Chirag-Gunashli and Petrocedeño include continuous drilling beyond 2015.
Fields under development but not yet in production, such as Skarv, Gjøa and Goliat in Norway, CaesarTonga in GoM USA, Corrib in Ireland, Leismer Demonstration Project in Canada, Peregrino in Brazil and Kizomba satellites in Angola represent approximately 30% of the total proved undeveloped reserves at year end 2009.
The sanctioning of new projects such as CaesarTonga in the GoM and Marcellus in the USA, Goliat in Norway, the Leismer Demonstration Project in Canada and the Kizomba satellites and PSVM in Angola added a total of 128 mmboe of proved undeveloped reserves in 2009. Start of production and further development of producing fields contributed to converting reserves from undeveloped to developed. The net change in proved undeveloped reserves during 2009 represents a reduction of 60 mmboe.
Start of production from the fields Alve, Yttergryta and Tyrihans in Norway, Tahiti and Thunder Hawk in GoM USA, Marcellus in USA and Gimboa in Angola increased our developed reserves by 224 mmboe in 2009. Most of this increase came from converting undeveloped reserved into developed reserves.
In 2009 Statoil incurred NOK 56.9 billion in development costs related to assets carrying proved reserves, of which NOK 29.9 billion were related to moving proved undeveloped reserves to developed.
Additional information about proved oil and gas reserves is provided in note 35 - Supplementary oil and gas information - to our Consolidated Financial Statements.
Delivery commitments
From the Norwegian Continental Shelf (NCS) Statoil is required, on behalf of the Norwegian State's direct financial interest (SDFI), to manage, transport and sell the Norwegian State's oil and gas. These reserves are sold in conjunction with our own reserves. As part of this arrangement, Statoil will deliver gas to customers in accordance with various types of sales contracts. In order to fulfil the commitments, Statoil will utilise a field supply schedule which provides the highest possible total value for the joint portfolio of oil and gas between Statoil and SDFI.
As at 31 December 2009, the Statoil/SDFI arrangement amounted to a total of 29.5 tcf (835 bcm) in total expected gas commitments on the NCS. The principles for booking of proved reserves are limited to contracted gas sales or gas with access to a robust gas market.
The majority of Statoil's gas volumes are sold under long term contracts with Take or Pay clauses. For each individual year, Statoil and SDFI express their delivery commitments as the sum of the Annual Contract Quantity (ACQ). In the contract years 2009 to 2012, the joint ACQ for the respective years are; 2.50, 2.43, 2.39, and 2.40 tcf. The majority of delivery commitments will be fulfilled by production from our existing proved reserves from fields where Statoil and/or SDFI participates, while any shortfalls would be covered by sourcing existing gas markets.
3.9.1 Operational statistics
Operational statistics include information about acreage and the number of wells drilled.
Productive oil and gas wells and developed and undeveloped acreage
The following tables show the number of gross and net productive oil and gas wells and total gross and net developed and undeveloped oil and gas acreage in which Statoil had interests at 31 December 2009.
A "gross" value reflects wells or acreage in which Statoil has interests (presented as 100%). The net value corresponds to the sum of whole or fractional working interest for Statoil in gross wells or acreage.
At 31 December 2009 |
| Norway | Eurasia excluding Norway | Africa | America | Total |
Number of productive oil and gas wells |
|
|
|
|
|
|
Oil wells | — gross | 813 | 140 | 305 | 472 | 1,730 |
| — net | 294.0 | 19.3 | 32.7 | 48.2 | 394.2 |
Gas wells | — gross | 159 | 49 | 49 | 58 | 315 |
| — net | 68.5 | 16.6 | 18.0 | 17.5 | 120.6 |
The total gross number of productive wells as of end 2009 includes 340 oil wells and 16 gas wells with multiple completions or wells with more than one branch.
At 31 December 2009 (in thousands of acres) | Norway | Eurasia excluding Norway | Africa | America | Total | |
Developed and undeveloped oil and gas acreage |
|
|
|
|
| |
Acreage developed | — gross | 763 | 198 | 815 | 146 | 1,922 |
| — net | 277 | 52 | 258 | 17 | 604 |
Acreage undeveloped | — gross | 13,843 | 12,012 | 30,921 | 10,439 | 67,215 |
| — net | 6,181 | 6,266 | 20,398 | 4,723 | 37,568 |
Net productive and dry oil and gas wells drilled
The following tables show the net productive and dry exploratory and development oil and gas wells completed or abandoned by Statoil in the past three years. The 2009 information is split by continent, whereas this split is not available for prior years. Productive wells include wells in which hydrocarbons were found, and the drilling or completion of which, in the case of exploratory wells, has been suspended pending further drilling or evaluation. A dry well is one found to be incapable of producing sufficient quantities to justify completion as an oil or gas well.
Year 2009 | Norway | Eurasia excluding Norway | Africa | America | Total |
Net productive and dry exploratory wells drilled | 21.3 | 0.9 | 4.4 | 2.8 | 29.3 |
— Net dry exploratory wells drilled | 9.6 | 0.3 | 2.1 | 1.0 | 13.0 |
— Net productive exploratory wells drilled | 11.7 | 0.6 | 2.2 | 1.8 | 16.3 |
|
|
|
|
|
|
Net productive and dry development wells drilled | 25.7 | 4.6 | 8.1 | 13.9 | 52.3 |
— Net dry development wells drilled | 1.2 | 0.4 | 0.7 | 0.0 | 2.3 |
— Net productive development wells drilled | 24.5 | 4.2 | 7.3 | 13.9 | 50.0 |
|
| Norway | Outside Norway | Total |
|
|
|
|
|
Year 2008 |
|
|
|
|
Net productive and dry exploratory wells drilled |
| 26.1 | 12.1 | 38.2 |
— Net dry exploratory wells drilled |
| 7.2 | 5.8 | 13.0 |
— Net productive exploratory wells drilled |
| 18.9 | 6.3 | 25.2 |
|
|
|
|
|
Net productive and dry development wells drilled |
| 27.9 | 23.7 | 51.6 |
— Net dry development wells drilled |
| 0.5 | 0.0 | 0.5 |
— Net productive development wells drilled |
| 27.4 | 23.7 | 51.1 |
|
|
|
|
|
Year 2007 |
|
|
|
|
Net productive and dry exploratory wells drilled |
| 13.2 | 14.0 | 27.1 |
— Net dry exploratory wells drilled |
| 4.5 | 5.9 | 10.4 |
— Net productive exploratory wells drilled |
| 8.7 | 8.0 | 16.7 |
|
|
|
|
|
Net productive and dry development wells drilled |
| 34.7 | 19.7 | 54.4 |
— Net dry development wells drilled |
| 0.7 | 1.0 | 1.7 |
— Net productive development wells drilled |
| 34.0 | 18.7 | 52.7 |
Related to our oil sand development in the Athabasca region of Alberta we also drilled 48 wells in 2009 to delineate the bitumen pay. All of these wells were drilled, logged, cored and abandoned. We also drilled 15 water wells in which we were searching for suitable source or disposal water zones. Some of these were abandoned and some completed for water needs.
Exploratory and development drilling in process
The following table shows the number of exploratory and development oil and gas wells in the process of being drilled by Statoil at 31 December 2009.
At 31 December 2009 |
| Norway | Eurasia excluding Norway | Africa | America | Total |
Number of wells in progress |
|
|
|
|
|
|
Developement Wells | — gross | 35 | 7 | 11 | 111 | 164 |
| — net | 15.3 | 1.0 | 2.6 | 58.6 | 77.5 |
Exploratory Wells | — gross | 4 | - | 1 | 6 | 11 |
| — net | 1.8 | - | 0.1 | 2.1 | 4.0 |
3.9.2 Report of DeGolyer and MacNaughton
Statiol's estimates of proved reserves are not materially different from those prepared by independent petroleum engineering consultants.
DeGolyer and MacNaughton, petroleum engineering consultants, have performed an independent evaluation of Statoil's proved reserves as of 31 December 2009. The evaluation accounts for 100 % of Statoil's proved reserves. The aggregated net proved reserves estimates prepared by DeGolyer and MacNaugthon do not differ materially from those prepared by Statoil when compared on the basis of net equivalent barrels.
Net proved reserves at 31 December 2009 | Oil, Condensate and LPG | Sales Gas | Oil Equivalent |
Estimated by Statoil | 2,174 | 18,148 | 5,408 |
Estimated by DeGolyer and MacNaughton | 2,284 | 18,274 | 5,540 |
A reserves report summarising this evaluation is included as Exhibit 15(a)(iii).
3.10 Regulation
The principal Norwegian legislation governing our petroleum activities in Norway consists of the Norwegian Petroleum Act and the Norwegian Petroleum Taxation Act.
The principal Norwegian legislation governing our petroleum activities in Norway and on the NCS is currently the Norwegian Petroleum Act of 29 November 1996 (the "Petroleum Act"), and the regulations issued thereunder, as well as the Norwegian Petroleum Taxation Act of 13 June 1975 (the "Petroleum Taxation Act"). The Petroleum Act states the principle that the Norwegian state is the owner of all subsea petroleum on the NCS, that exclusive right to resource management is vested in the Norwegian state and that the Norwegian state alone is authorised to award licences for petroleum activities. We are dependent on the Norwegian state for approval of our NCS exploration and development projects and our applications for production rates for individual fields.
Under the Petroleum Act, the Norwegian Ministry of Petroleum and Energy is responsible for resource management and for administering petroleum activities on the NCS. The main task of the Ministry of Petroleum and Energy is to ensure that petroleum activities are conducted in accordance with the applicable legislation, the policies adopted by the Norwegian parliament, the Storting, and relevant decisions of the Norwegian State. The Ministry of Petroleum and Energy primarily implements petroleum policy through its power to administer the award of licences and approve operators' field and pipeline development plans, as well as petroleum transport and gas sales contracts. Only those plans that conform to the policies and regulations adopted by the Storting are approved. As set out in the Petroleum Act, if a plan involves an important principle or will have a significant economic or social impact, it must also be submitted to the Storting for acceptance before being approved by the Ministry of Pet roleum and Energy.
We are not required to submit any decisions relating to our operations to the Storting. However, the Storting's role with respect to major policy issues in the petroleum sector may affect us in two ways: firstly, when the Norwegian State acts in its capacity as majority owner of our shares and, secondly, when the Norwegian State acts in its capacity as regulator:
- The Norwegian State held 67% of our ordinary shares as of 12 March 2010. The Norwegian State's shareholding in Statoil is managed by the Ministry of Petroleum and Energy. The Ministry of Petroleum and Energy will normally decide how the Norwegian State will vote on proposals submitted to general meetings of the shareholders. However, in certain exceptional cases, it may be necessary for the Norwegian State to seek approval from the Storting before voting on a certain proposal. This will normally be the case if we issue additional shares and such issuance would significantly dilute the Norwegian State's holding, or if such issuance would require a capital contribution from the Norwegian State in excess of government mandates. It is not possible to predict what stance the Norwegian Storting will take on a proposal for issuance of additional shares that would either significantly dilute its holding of Statoil shares or require a capital contribution from it in excess of governmental mandates. A decision by the Norwegian State against our proposal to issue additional shares would prevent us from raising additional capital in this manner and could adversely affect our ability to pursue business opportunities and to further develop the company.
- The Norwegian State exercises important regulatory powers over us, as well as over other companies and corporations. As part of our business, we, or the partnerships to which we are a party, frequently need to apply for licences and other approval of various kinds from the Norwegian State. In respect of certain important applications, such as the approval of major plans for operation and development of fields, the Ministry of Petroleum and Energy must obtain the consent of the Storting before it can approve our or the relevant partnership's application. This may take additional time and affect the content of the decision. Although Statoil is majority-owned by the Norwegian State, it does not receive preferential treatment with respect to licences granted by or under any other regulatory rules enforced by the Norwegian State.
Although Norway is not a member of the European Union, or EU, it is a member of the European Free Trade Association (EFTA). The EU and its member states have entered into the Agreement on the European Economic Area, referred to as the EEA Agreement, with the members of EFTA (except Switzerland).
The EEA Agreement makes certain provisions of EU law binding between the states of the EU and the EFTA states, and also between the EFTA states themselves. An increasing volume of regulation affecting us is adopted within the EU and then applied to Norway under the EEA Agreement. As a Norwegian company operating both within EFTA and the EU, our business activities are regulated by both EEA law and EU law to the extent that EU law has been incorporated into EEA law under the EEA Agreement.
3.10.1 The Norwegian licensing system
Production licences are the most important type of licence awarded under the Petroleum Act, and the Ministry of Petroleum and Energy holds executive discretionary power to award a production licence and to decide the terms of that licence.
In 2009, we participated in 222 production licences on the NCS. As a participant in licences, we are subject to the regulations of the Norwegian licensing system.
Production licences are the most important type of licence awarded under the Petroleum Act, and the Ministry of Petroleum and Energy holds executive discretionary power to award a production licence and to decide the terms of that licence. The Government is not entitled to award us a licence in an area until the Storting has decided to open the area in question for exploration. The terms of our production licences are decided by the Ministry of Petroleum and Energy.
A production licence grants the holder an exclusive right to explore for and produce petroleum within a specified geographical area. The licensees become the owners of the petroleum produced from the field covered by the licence. Notwithstanding the exclusive rights granted under a production licence, the Ministry of Petroleum and Energy has the power, in exceptional cases, to permit third parties to carry out exploration in the area covered by a production licence. For a list of our shares in production licences, see report section 3.1.4 Operational review - E&P Norway - Production on the NCS.
Production licences are normally awarded through licensing rounds. The first licensing round for NCS production licences was announced in 1965. The award of the first licences covered areas in the North Sea. Over the years, the awarding of licences has moved northward and covers areas in both the Norwegian Sea and the Barents Sea. In recent years, the principal licensing rounds have mainly included licences in the Norwegian Sea. Beginning in 2003, the Norwegian government changed its policy on mature areas and introduced a scheme for awarding production licences called "Award in Predefined Areas" (APA) in mature parts of the Norwegian continental shelf. The awarding of licences in the predefined areas has taken place every year since 2003. In a report to the Storting, the Ministry of Petroleum and Energy has announced that this policy will continue.
The Norwegian State accepts licence applications from individual companies and group applications. This allows us to choose our exploration and development partners.
Production licences are awarded to joint ventures. As is the case for most fields on the NCS, our production activities are conducted through joint venture arrangements with other companies and in some cases with the Norwegian State through its wholly-owned company Petoro. The members of the joint venture are jointly and severally responsible to the Norwegian State for obligations arising from petroleum operations carried out under the licence. Once a production licence is awarded, the licensees are required to enter into a joint operating agreement and an accounting agreement that regulate the relationship between the partners. The Ministry of Petroleum and Energy decides the form of the joint operating agreements and accounting agreements.
The governing body of the joint venture is the management committee. Each member is entitled to one seat on the management committee. The management committee's tasks are set out in the joint operating agreement and include setting guidelines for the operator of the field, exercising control over the activities of the operator, and making decisions on the activities of the joint venture. Votes in the management committee are counted by a combination of the number of members in the joint venture and their ownership interests. The number of votes required to make a decision varies from licence to licence, but a decision is normally reached when a certain number of the members and a percentage of the ownership interests, specified individually in each licence, have voted in favour of a proposal. The voting rules are structured so that a licensee holding more than 50% of a licence normally cannot vote through a proposal on its own, but will need the support of one or more of the other licensees. In licences awarded since 1996 where the SDFI holds an interest, the Norwegian State, acting through the SDFI management company, may veto decisions made by the joint venture management committee, which, in the opinion of the Norwegian State, would not be in compliance with the obligations of the licence with respect to the Norwegian State's exploitation policies or financial interests. This veto power has never been used.
Under the joint operating agreements covering licences awarded prior to 1996, the management company that supervises the Norwegian State's SDFI interest, Petoro AS, has the power, with certain exceptions, to make decisions unilaterally in matters that are assumed to be of a political nature or matters of principle, or which may have significant social or socio-economic consequences, if Petoro AS is acting under the direction of its shareholder. Prior to the establishment of the SDFI management company, Statoil held this right, which was exercised three times, most recently in 1988. In autumn 2002, the Storting began to allow individual licence groups to substitute this special voting rule for the SDFI with a veto rule similar to the veto rules that have applied to licences awarded since 1996. Such substitution is subject to the approval of the Ministry of Petroleum and Energy.
The day-to-day management of a field is the responsibility of an operator appointed by the Ministry of Petroleum and Energy. In 2009, we were the operator for 42 of our 48 production licences. The operator is in practice always a member of the joint venture holding the production licence, although this is not legally required. The terms of engagement of the operator are set out in the joint operating agreement. Under the joint operating agreement, an operator can normally terminate its engagement at six months' notice. However, with the consent of the Ministry of Petroleum and Energy, the management committee may instruct the operator to continue to perform its duties until a new operator has been appointed. The management committee can terminate the operator's engagement at six months' notice on an affirmative vote by all members of the management committee other than the operator. A change of operator requires the consent of the Ministry of Petroleum and Energy. In special cases, the Minist ry of Petroleum and Energy can order a change of operator.
Licensees are required to submit a plan for development and operation, or PDO, to the Ministry of Petroleum and Energy for approval. In respect of fields of a certain size, the Storting has to accept the PDO before it is formally approved by the Ministry of Petroleum and Energy. Until the PDO has been approved by the Ministry of Petroleum and Energy, the licensees cannot, without the prior consent of the Ministry of Petroleum and Energy, undertake material contractual obligations or commence construction work.
Production licences are normally awarded for an initial exploration period, which is typically six years, but can either be for a shorter period or for a maximum period of ten years. During this exploration period, the licensees must meet a specified work obligation set out in the licence. The work obligation will typically include seismic surveying and/or exploration drilling. If the licensees fulfil the obligations set out in the production licence, they are entitled to require that the licence be prolonged for a period specified at the time when the licence is awarded, typically 30 years. As a rule, the right to prolong the licence does not apply to the whole of the geographical area covered by the initial licence, but only to a percentage, typically 50%. The size of the area that must be relinquished is determined at the time the licence is awarded. In special cases, the Ministry of Petroleum and Energy may extend the duration of a production licence.
If natural resources other than petroleum are discovered in the area covered by a production licence, the Norwegian State may decide to delay petroleum production in the area. If such a delay is imposed, the licensees are, with certain exceptions, entitled to a corresponding extension of the licence period. To date, such a delay has never been imposed.
If important public interests are at stake, the Norwegian State may direct us and other licensees on the NCS to reduce the production of petroleum. From 15 July 1987 until the end of 1989, licensees were directed to curtail oil production by 7.5%. Between 1 January 1990 and 30 June 1990, licensees were directed to curtail oil production by 5%. In 1998, the Norwegian State resolved to reduce Norwegian oil production by about 3%, or 100 mbbl per day. In March 1999, the Norwegian State decided to further increase the reduction to 200 mbbl per day. In the second quarter of 2000, the reduction was again set to 100 mbbl per day. On 1 July 2000, this restriction was removed. By a Royal Decree of 19 December 2001, the Norwegian government decided that Norwegian oil production would be reduced by 150 mbbl per day from 1 January 2002 until 30 June 2002. This amounted to a reduction in output of approximately 5%.
Licensees may buy or sell interests in production licences subject to the consent of the Ministry of Petroleum and Energy and the approval of the Ministry of Finance of a corresponding tax treatment position. The Ministry of Petroleum and Energy must also approve indirect transfers of interests in a licence, including changes in the ownership of a licensee, if they result in a third party obtaining a decisive influence over the licensee. In most licences there are no pre-emption rights in favour of the other licensees. However, the SDFI, or the Norwegian State, as appropriate, still holds pre-emption rights in all licences. Except from one minor transaction which is still pending approval, all of our licencing transactions entered into in 2009 were approved by the Ministry of Petroleum and Energy and Ministry of Finance.
A licence from the Ministry of Petroleum and Energy is also required in order to establish facilities for the transport and utilisation of petroleum. When applying for such licences, the owners, which are in practice licensees under a production licence, must prepare a plan for installation and operation. Licences for the establishment of facilities for transport and utilisation of petroleum will normally be awarded subject to certain conditions. Typically, these conditions require the facility owners to enter into a participants' agreement. The ownership of most facilities for transport and utilisation of petroleum in Norway and on the NCS are organised as joint ventures of a group of licence holders, and the participants' agreements are similar to the joint operating agreements entered into by the members of joint ventures holding production licences. All of our applications for facility licences submitted in 2009 have been granted by the Ministry of Petroleum and Energy.
Licensees are required to prepare a decommissioning plan before a production licence or a licence to establish and use facilities for the transportation and utilisation of petroleum expires or is relinquished, or the use of a facility ceases. The decommissioning plan must be submitted to the Ministry of Petroleum and Energy no sooner than five and no later than two years prior to the expiry of the licence or the cessation of the use of the facility, and it must include a proposal for the disposal of facilities on the field. On the basis of the decommissioning plan, the Ministry of Petroleum and Energy makes a decision as to the disposal of the facilities.
The Norwegian State is entitled to take over the fixed facilities of the licensees when a production licence expires, is relinquished or revoked. In respect of facilities on the NCS, the Norwegian State decides whether any compensation will be payable for facilities thus taken over. If the Norwegian State should choose to take over onshore facilities, the ordinary rules of compensation in connection with the expropriation of private property apply. None of our production licences expired in 2009 and none are due to expire in 2010.
Licences for the establishment of facilities for transport and utilisation of petroleum typically include a clause whereby the Norwegian State can require that the facilities be transferred to it free of charge on expiry of the licence period.
3.10.2 Gas sales and transportation
We market gas from the Norwegian continental shelf on our own and the Norwegian state's behalf. Gas is transported through the Gassled pipeline network to customers in Europe.
Gas sales contracts with buyers for the supply of Norwegian gas are concluded individually with each company.
The upstream gas transportation system consists of several pipelines owned by a joint venture called Gassled. We have a 32.102% direct ownership interest in Gassled (32.881% including our indirect interest through our 28.58% holding in Norsea Gas AS) and are responsible for technical operation of the majority of the gas export pipelines and onshore plants in the Gassled processing and transportation system. See section 3.3.3 Operational review-Natural Gas-Norway's gas transport system.
By Royal Decree of 20 December 2002, the Norwegian authorities issued regulations relating to access to and tariffs for capacity in the upstream gas transportation system. There are three main considerations behind the regulations. Firstly, together with the Act adopted by the Storting in June 2002, the regulations implement the Gas Directive of the European Union. Secondly, they established a system for access to the upstream gas transportation system that is compatible with company-based gas sales from the NCS. Thirdly, they provided for the new ownership structure of the upstream gas transportation system (Gassled).
Parts of the regulations have general application and parts - including the tariffs - are only applicable to the upstream gas transportation system owned by the Gassled joint venture. The regulations establish the main principles for access to the upstream gas transportation system. The access regime consists of a regulated primary market where, pursuant to the regulations, the right to book spare capacity is allocated to users with needs for the transport of natural gas. Furthermore, the access regime consists of a secondary market where capacity can be transferred between users after the allocation in the primary market if transportation needs change.
Capacity in the primary market is released and booked through Gassco AS on the internet. Spare capacity is released for pre-defined time periods at announced points in time and with specific time limits for reservations. If reservations exceed the spare capacity, the spare capacity will be allocated on the basis of an allocation formula. However, in the event of scarce capacity, consideration must first be given to the owners' duly substantiated needs for capacity, limited to twice the owner's equity interest in the upstream pipeline network.
Based on authorisation granted under the regulations, tariffs for the use of capacity in Gassled are decided by the Ministry of Petroleum and Energy. The ministry's policy for determining the tariffs is to avoid excessive returns on the capital invested in the transportation system, allowing the return on the Norwegian petroleum activity to be taken out on the fields instead of in the transportation systems. The tariffs are paid for booked capacity and not on the basis of the actually transported volume.
3.10.3 The EU Gas Directive
The EU Gas Directive, which has been included in the EEA Agreement and incorporated into Norwegian legislation, regulates the European gas market in conjunction with the Gas Transmission Access Regulation of 2005.
Most of our gas is sold under long-term gas contracts to customers in the EU, a gas market that continues to be affected by changes in EU regulations and the implementation of such regulations in EU member states. Such regulation affects our ability to expand or even maintain our current market position, as quantities sold under our gas sales contracts may be subject to a material change in gas prices as a result of the regulations under the EU Gas Directive.
The Directive requires that, with effect from July 2007, all consumers in Europe should be able to choose their energy supplier. Fundamental changes to this directive were adopted by the European Union in July 2009 and will enter into force in EU in March 2011 (set out in EC Directive 2009/73), with specific focus on the separation of ownership of transmission assets from supply activities. The objective of these changes is to increase competition in national markets and integrate them into regional and, eventually, a single EU-wide market for natural gas. It is difficult to predict the effect liberalisation measures will have on the development of gas prices, but the main objective of the single gas market is to create greater choice and reduce prices for customers through increased competition.
3.10.4 HSE regulation
Our petroleum operations in Norway are subject to extensive regulation with regard to health, safety and the environment, or HSE.
Under the Petroleum Act, which is administered by the Ministry of Petroleum and Energy, our petroleum operations must be conducted in compliance with a reasonable standard of care, taking into consideration the safety of employees, the environment and the economic values represented by installations and vessels. The Petroleum Act specifically requires that petroleum operations be carried out in such a manner that a high level of safety is maintained and developed in accordance with technological developments. Statoil established a system for monitoring the technical safety of its facilities and plants in 2001, and, as part of this system, it collects and interprets information from its operating activities and incorporates risk management into its operating activities.
We are required at all times to maintain a plan to deal with emergency situations in our petroleum operations. During an emergency, the Ministry of Labour, the Ministry of Fisheries and Coastal Affairs/the Norwegian Coastal Administration may decide that other parties should provide the necessary resources, or otherwise adopt measures to obtain the necessary resources, to deal with the emergency for the account of the licensees.
The Petroleum Safety Authority Norway (PSA) has regulatory responsibility for safety, emergency preparedness and the working environment for all petroleum-related activities. The PSA's area of responsibility includes supervision of safety, emergency preparedness and the working environment for both offshore and onshore facilities.
In our capacity as holder of licences under the Petroleum Act, we are subject to strict statutory liability in respect of losses or damage suffered as a result of pollution caused by spills or discharges of petroleum from petroleum facilities covered by any of our licences. This means that anyone who suffers damage or loss as a result of pollution caused by any of our NCS licence areas can claim compensation from us without needing to demonstrate that the damage is due to any fault on our part. If the pollution is caused by a force majeure event, a Norwegian court may reduce the level of damages to a level it considers reasonable.
3.10.5 Taxation of Statoil
We are subject to ordinary Norwegian corporate income tax as well as to a special petroleum tax relating to our offshore activities. We are also subject to a special carbon dioxide emissions tax and a nitrogen oxide fee.
Under our production licences we are obliged to pay an area fee to the Norwegian State. Below is a summary of certain key aspects of the Norwegian tax rules that apply to our operations.
Corporate income tax
Our profits, both from offshore oil and natural gas activities and from onshore activities, are subject to Norwegian corporate income tax. The corporate income tax rate is currently 28%. Our profits are computed in accordance with ordinary Norwegian corporate income tax rules, subject to certain modifications that apply to companies engaged in petroleum operations. Gross revenue from oil production and the value of lifted stocks of oil are determined on the basis of norm prices. Norm prices are decided on a monthly basis by the Petroleum Price Board, a body whose members are appointed by the Ministry of Petroleum and Energy, and published quarterly. The Petroleum Taxation Act states that the norm prices shall correspond to the prices that could have been obtained in a sale of petroleum between independent parties in a free market. When adopting norm prices, the Petroleum Price Board takes a number of factors into consideration, including spot market prices and contract prices in the industry.
The maximum rate of depreciation of development costs related to offshore production installations and pipelines is 16.67% per year. Depreciation starts when the cost is incurred. Exploration costs may be deducted in the year in which they are incurred. Financial costs related to the offshore activity are calculated directly based on a formula set out in the Petroleum Tax Act. The financial costs deductible against the offshore tax regime are the total financial costs multiplied by 50% of tax values divided by average interest-bearing debt. All other financial costs and income are allocated to the onshore tax regime.
Any tax losses may be carried forward indefinitely against subsequent income earned. Fifty percent of losses relating to activity conducted onshore in Norway may be deducted from NCS income subject to the 28% tax rate. Losses on foreign activities may not be deducted against NCS income. Losses on offshore activities are fully deductible from onshore income.
By using group contributions between Norwegian companies in which we hold more than 90% of the shares and the votes, tax losses and taxable income can be offset to a great extent. Group distributions are not deductible from our offshore income.
Dividends received are subject to tax in Norway. The basis for taxation is 3% of the dividend amounts received, which is subject to the standard 28% income tax rate. Dividends from low-tax countries or portfolio investments outside the EEA will under certain circumstances be subject to the standard 28% income tax rate based on the full amounts received.
Capital gains from the realisation of shares are taxable. The basis for taxation is 3% of the gain, which is subject to the standard 28% income tax. Capital losses from the realisation of shares are not deductible. Exemptions apply to shares held in companies domiciled in low-tax countries or portfolio investments outside the EEA, where, under certain circumstances, capital gains will be subject to the standard 28% income tax rate and capital losses will be deductible.
Special petroleum tax
A special petroleum tax is levied on profits from petroleum production and pipeline transportation on the NCS. The special petroleum tax is currently levied at a rate of 50%. The special tax is applied to relevant income in addition to standard 28% income tax, resulting in a 78% marginal tax rate on income subject to petroleum tax. The basis for computing the special petroleum tax is the same as for income subject to ordinary corporate income tax, except that onshore losses are not deductible from the special petroleum tax, and a tax-free allowance, or uplift, is granted at a rate of 7.5% per year. The uplift is computed on the basis of the original capitalised cost of offshore production installations. The uplift may be deducted from taxable income for a period of four years, starting in the year in which the capital expenditure is incurred. Unused uplift may be carried forward indefinitely.
Abandonment costs
Abandonment costs incurred can be deducted as operating expenses. Provisions for future abandonment costs are not tax deductible.
Carbon dioxide emissions tax
A special carbon dioxide emissions tax applies to petroleum activities on the NCS. The tax is NOK 0.46 for 2009 and NOK 0.47 for 2010 per standard cubic metre of gas burned or directly released and per litre of oil burned. In addition, companies operating on the NCS have to buy allowances to cover the carbon dioxide emissions from the petroleum activities.
Nitrogen oxide emissions tax
With effect from 1 January 2007, the Norwegian government introduced a nitrogen oxide tax applicable to emissions of nitrogen oxide on the NCS. The fee is NOK 15.85 per kilogram of nitrogen oxide for 2009 and NOK 16.14 for 2010.
As an alternative to paying the nitrogen oxygen fee, companies can voluntarily agree to contribute to an industry nitrogen oxygen fund for the years 2008-2010. The contribution to the fund is NOK 11 per kilogram of nitrogen oxide emissions. We have entered into an agreement to contribute to the fund.
Area fee
After the expiry of the initial exploration period, the holders of production licences are required to pay an area fee. The amount of the area fee is set out in regulations issued under the Petroleum Act. In respect of most of the production licences, the initial annual area fee is currently NOK 30,000 per square kilometre. For the subsequent year the fee is increased to NOK 60,000 per square kilometre and thereafter the yearly fee is increased to NOK 120,000 per square kilometre. Production licences for which a plan for development and operation (PDO) has been submitted are, from the time of submission of the PDO and for as long as extraction from the deposit takes place, exempt from the obligation to pay the area fee for the area defining the deposits included in the PDO.
Taxation outside Norway
Statoil's international petroleum activities are subject to tax pursuant to local tax legislation. Fiscal regulation of our upstream operations is generally based on corporate income tax regimes and/or production sharing agreement (PSA) regimes. Royalties may be applicable in each regime.
Generally, income from Statoil's upstream production outside Norway is subject to tax at the higher of the Norwegian onshore rate (28%) or the prevailing tax rate in the countries in which it operates. Statoil is subject to excess (or "windfall") profit tax in some of the countries where it produces crude oil.
Production sharing agreements
Under a PSA, the host government typically retains the right to the hydrocarbons in place. Under a PSA, the contractor normally receives a share of the oil produced to recover its costs, and is also entitled to an agreed share of the oil as profit. The allocation of profit oil between the state and the contractors is typically increasingly based on a success factor, such as surpassing certain specified internal rates of return, production rates or accumulated production. Normally, the contractors carry the exploration costs and risk prior to a commercial discovery and are then entitled to recover those costs during the producing phase. Fiscal provisions in a PSA contract are to a large extent negotiable and are unique to each PSA. Parties to a PSA are generally insulated from legislative changes in a country's general tax laws.
Income tax regimes
Under an income tax/royalty regime, companies are granted licences by the government to extract petroleum, and the state may be entitled to royalties in addition to tax based on the company's net taxable income from production. In general, the fiscal terms surrounding these licences are not negotiable and the company is subject to legislative changes to the tax laws.
3.10.6 The Norwegian state's participation
The Norwegian State's policy as a shareholder in Statoil has been and continues to be to ensure that petroleum activities create the highest possible value for the Norwegian State.
Initially, the Norwegian State's participation in petroleum operations was largely organised through us. In 1985, the Norwegian State established the State's Direct Financial Interest, or SDFI, through which the Norwegian State has direct participating interests in licences and petroleum facilities on the NCS. As a result, the Norwegian State holds interests in a number of licences and petroleum facilities in which we also hold interests.
As a result of changes in global markets and competitive conditions in the petroleum industry, the Norwegian State carried out a strategic review of its oil and gas policy in 2000. Based on the results of this strategic review, the Norwegian State prepared a plan to restructure its petroleum holdings on the NCS that was approved by the Storting on 26 April 2001. The key elements of the restructuring plan led to:
- the partial privatisation of Statoil
- restructuring of the Norwegian State's SDFI assets, including the sale of SDFI assets to us and to other oil and gas companies, and an exchange of interests in certain oil and gas infrastructure between the SDFI and us
- the establishment of procedures to ensure that, as long as the Norwegian State instructs us to do so, we will continue to market and sell the State's oil and gas, together with our oil and gas
- the transfer of responsibility for and management of the SDFI's assets from us to a new company called Petoro AS, which is wholly owned by the Norwegian State; and
- the transfer of operational responsibility for certain pipelines on the NCS from us to Gassco AS, which is wholly owned by the Norwegian State.
3.10.7 Marketing and sale of SDFI oil and gas
Historically, we have marketed and sold the Norwegian State's oil and gas as part of our own production, and the Norwegian State has elected to continue this arrangement.
Accordingly, at an extraordinary general meeting held on 27 February 2001, the Norwegian State, as sole shareholder, revised our articles of association by adding a new article that requires us to continue to market and sell the Norwegian State's oil and gas together with our own oil and gas in accordance with an instruction established in shareholder resolutions in effect from time to time. At an extraordinary general meeting held on 25 May 2001, the Norwegian State, as sole shareholder, approved a resolution containing the instructions referred to in the new article. This resolution is referred to as the owner's instruction.
The Norwegian State has a coordinated ownership strategy aimed at maximising the aggregate value of its ownership interests in Statoil and the Norwegian State's oil and gas. This is reflected in the owner's instruction, which contains a general requirement that, in our activities on the NCS, we are required to take account of these ownership interests in decisions that may affect the execution of this marketing arrangement.
The owner's instruction sets forth specific terms for the marketing and sale of the Norwegian State's oil and gas. The principal provisions of the owner's instruction are set out below.
Objectives
The overall objective of the marketing arrangement is to obtain the highest possible total value for our oil and gas and the Norwegian State's oil and gas and to ensure an equitable distribution of the total value creation between the Norwegian State and us. In addition, the following considerations are important:
- to create the basis for long-term and predictable decisions concerning the marketing and sale of the Norwegian State's oil and gas;
- to ensure that results, including costs and revenues related to our oil and gas and the Norwegian State's oil and gas, are transparent and possible to measure; and
- to ensure efficient and simple administration and execution.
Our tasks
Our tasks under the owner's instruction are to market and sell the Norwegian State's oil and gas and to carry out all necessary tasks, other than those carried out jointly with other licensees under the production licence, relating to the marketing and sale of the Norwegian State's oil and gas, including, but not limited to, responsibility for processing, transport and marketing. In the event that the owner's instruction is terminated, in whole or in part, by the Norwegian State, the owner's instruction provides for a mechanism under which contracts for the marketing and sale of the Norwegian State's oil and gas to which we are a party may be assigned to the Norwegian State or its nominee. Alternatively, the Norwegian State may require that the contracts be continued in our name, but that, in the underlying relationship between the Norwegian State and us, the Norwegian State has all rights and obligations related to the Norwegian State's oil and gas.
Costs
The Norwegian State does not pay us a specific consideration for executing these tasks, but the Norwegian State reimburses us for its proportionate share of certain costs, which, under the owner's instruction, may be our actual costs or an amount specifically agreed.
Price mechanisms
For sales of the Norwegian State's natural gas, both to us and to third parties, the payment to the Norwegian State is based on either achieved prices, a net back formula or market value. We now purchase all of the Norwegian State's oil and NGL. Pricing of the crude oil is based on market reflective prices. NGL prices are based on either achieved prices, market value or market reflective prices.
Lifting mechanism
As part of the coordinated ownership strategy, a lifting mechanism for the Norwegian State's and our oil and gas is established in accordance with rules set out in the owner's instruction.
To ensure neutral weighting between the Norwegian State's and our own natural gas volumes, a list has been established for deciding the priority between each individual field. To decide the ranking, a mathematical optimisation model is used that describes existing and planned production facilities, infrastructure and processing terminals in which the Norwegian State and we have ownership interests. The list yields a result giving the highest total net present value for the Norwegian State's and our oil and gas. In the evaluation, the following objective criteria shall apply:
- the effect of the draw on the depletion rate
- identification of time-critical fields
- influence on oil/liquid fields with associated gas requiring gas disposal; and
- spare capacity and flexibility in transportation systems and onshore facilities.
The various fields are ranked in accordance with the assumed total value creation for the Norwegian State and us, assuming all of the fields meet our profitability requirements if we participate as a licensee, and the Norwegian State's profitability requirements if the State is a licensee. The list is updated annually or more frequently if events occur that may significantly influence the ranking. Within each individual field in which both the Norwegian State and we are licensees, the Norwegian State and we will deliver volumes and share income in accordance with our respective participating interests.
The Norwegian State's oil and NGL are lifted together with our oil and NGL in accordance with applicable lifting procedures for each individual field and terminal.
Withdrawal or amendment
The Norwegian State may at any time utilise its position as majority shareholder of Statoil to withdraw or amend the instruction requiring us to market and sell the SDFI oil and natural gas together with our own.
3.10.8 Petoro AS
In 1985, the Norwegian State began taking a direct financial interest in production licences through the establishment of the SDFI, and, in 2001, a new state-owned company, Petoro, was formed to manage SDFI assets.
From the establishment of Statoil in 1972 and until 1 January 1985, the participation of the Norwegian State in production licences and facilities for the transport and utilisation of petroleum took place entirely through Statoil. With effect from January 1985, the Norwegian State's participation was reorganised through the establishment of the SDFI. Through this reorganisation, the Norwegian State began taking a direct financial interest in production licences. The establishment of the SDFI entailed the transfer of a substantial part of our participation in most of our then licences to the SDFI, although, formally, such licences continued to be held wholly in our name. Since its establishment in 1985, the SDFI has taken shares in most licences awarded. The SDFI also holds shares in a number of oil and gas pipelines and land-based terminal facilities.
In connection with the restructuring, the Norwegian State formed a new state-owned company, Petoro AS, in May 2001, which took over responsibility for, and the management of, the SDFI assets as licensee, in accordance with a new chapter of the Petroleum Act. The Norwegian State continues to be the beneficial owner of these assets. We continue to market and sell the Norwegian State's oil and gas together with our own oil and gas in accordance with the owner's instruction described in report section 3.10.7 Operational review-Regulation-Marketing and sale of the SDFI oil and gas. One of the tasks of Petoro AS is to supervise our compliance with the owner's instruction.
Petoro AS does not own any of the oil and gas produced under the licence interests it holds, it does not receive any revenues from sales of the Norwegian State's oil and gas, and it is not permitted to have an operator role. However, Petoro AS may become a participant in new licences awarded by the Norwegian State.
3.10.9 Gassco AS
In connection with the restructuring of the Norwegian State's oil and gas interests in May 2001, the Norwegian State formed a separate company, Gassco AS.
Gassco took over as operator of the natural gas transportation system previously operated by us on 1 January 2002. Gassco AS is wholly owned by the Norwegian State. The owners of the infrastructure systems appointed Gassco AS as the new operator.
The transfer of the operatorship to Gassco AS was made without consideration of, and does not affect existing arrangements, with respect to ownership or access to the natural gas transportation system or transport tariffs. However, in accordance with the joint venture agreements for each of the gas transportation assets, the operator is entitled to be reimbursed for its costs as operator. Accordingly, since Gassco AS was appointed as operator, we no longer receive such reimbursement, and we will, as will other users of the infrastructure, be required to pay our share of Gassco AS's expenses relating to the operation of the natural gas pipelines in which we hold interests.
Gassco AS has entered into contracts with us for each infrastructure joint venture, pursuant to which we will carry out technical operating activities on behalf of Gassco AS, such as system maintenance, for which we will receive reimbursement of costs. Either Gassco AS or we may terminate each of these contracts without cause, except for the contract for the Statpipe joint venture, after five years. Either Gassco AS or we may also terminate the part of the Statpipe contract that concerns the offshore pipelines, after five years. Currently, Gassco AS may terminate the part of the Statpipe contract that concerns the Kårstø plant at any time, provided that two-thirds of the owners, representing more than two-thirds of the ownership interests, have supported such termination.
The natural gas transportation system was transferred to a new joint venture called Gassled as of 1 January 2003. Gassco AS is the operator of the Gassled joint venture. Our direct ownership interest in Gassled is currently 32.102% (32.881% including our indirect interest through our 28.58% holding in Norsea Gas AS), 15.73% in Zeepipe Terminal JV and 20.87% in Dunkerque Terminal DA. From 1 January 2011, our direct ownership interest in Gassled will be reduced to 28.217% due to an increased ownership interest for Petoro. In addition, our ownership interest in Gassled may also change as a result of the inclusion of existing or new infrastructure or if Gassled undertakes further investments without participation from its owners in the same ratio as their ownership interests in Gassled. For more information on the Gassled joint venture, see report section 3.3.3 Operational review - Natural Gas - Norway's gas transportation system.
3.11 Competition
There is intense competition in the oil and gas industry for customers, production licences, operatorships, capital and experienced human resources.
In recent years, the oil and gas industry has experienced consolidation, as well as increased deregulation and integration in strategic markets.
Statoil competes with major integrated oil and gas companies, as well as with independent and government-owned companies for the acquisition of assets and licences for the exploration, development and production of oil and gas, and for the refining, marketing and trading of crude oil, natural gas and related products. Key factors affecting competition in the oil and gas industry are oil and gas prices and demand, the cost of exploration and production, global production levels, alternative fuels and governmental and environmental regulations.
Statoil's ability to remain competitive will depend, among other things, on management's continued focus on reducing unit costs and improving efficiency, maintaining long-term growth in our reserves and production through continued technological innovation and our ability to seize international opportunities in areas where our competitors may also be actively pursuing exploration and development opportunities. The company believes that it is in a position to compete effectively in each of its business segments.
3.12 Property, plant and equipment
We have interests in real estate in numerous countries throughout the world, but no one individual property is significant to us as a whole.
Our principal offices located at Forusbeen 50, N-4035, Stavanger, Norway, comprise approximately 135,000 square metres of office space, and are owned by Statoil.
A contract has been signed with IT Fornebu Holding AS in Oslo for the long-term lease of a new 60,000 square metre office building to be built at Fornebu in Bærum municipality. The building, which will enable all of Statoil's activities in the Oslo region to be consolidated, will be ready for occupation in autumn 2012. IT Fornebu Holding AS will be the owner and Statoil will be the tenant.
For a description of our significant reserves and sources of oil and natural gas, see note 35 - Supplementary oil and gas information in the Consolidated Financial Statements in this report.
3.13 Related party transactions
We have the following transactions with related parties, including state-owned entities and the DnBNOR bank:
Transactions with the Norwegian state
For a description of shares held by the Norwegian state, see report section 6.4 Shareholder information-Major shareholders. See also report section 4.2.7 Financial analysis and review -Liquidity and capital resources - Material contracts.
Transactions with other entities in which the Norwegian State is a major shareholder
Because the Norwegian State controls a substantial proportion of industry in Norway, there are many state-controlled entities with whom we do business. The financial value of most such transactions is relatively small, and the ownership interest of the Norwegian State in such counterparties has not had any effect on the arm's-length nature of the transactions. In respect of the goods and services that we purchase in particular, we purchase telephone services from Telenor ASA, a telecommunications company in which the Norwegian State holds a 53.97% interest. Such purchases are made pursuant to standard tariff rates applicable to public and private companies in Norway.
Other transactions with the Norwegian State
Total purchases of liquids and natural gas from the Norwegian State amounted to NOK 74,338 million (204 mmboe) in 2009. In 2008 and 2007, the total purchases amounted to NOK 112,682 million (223 mmboe) and NOK 98,498 million (237 mmboe) respectively. Purchases of natural gas from the Norwegian State (excluding purchases from licences and sales on behalf of the Norwegian State) amounted to NOK 265 million in 2009. In 2008 and 2007, the purchases of natural gas amounted to NOK 375 million and NOK 287 million, respectively. The significant amounts included in the line item Payables to associated companies and other related parties in note 25 Trade and other payables to the Consolidated financial statement, are amount payables to the Norwegian State for these purchases. The prices paid by Statoil for the oil purchased from the Norwegian State are estimated at market prices. In addition, Statoil sells the Norwegian State's natural gas in its own name, but for the account and risk of the Norwegian S tate.
The Norwegian State compensates Statoil for its relative share of the costs related to certain Statoil natural gas storage and terminal investments and related activities. See report section 3.10.7 Operational review-Regulation-Marketing and sale of the SDFI oil and gas for more details.
Although the Norwegian State is Statoil's majority owner, Statoil does not receive any preferential treatment with respect to licences granted by the Norwegian State or under any other regulatory rules enforced by the Norwegian State.
Employee loans
We have a general arrangement with DnBNOR whereby DnBNOR makes available to each of our employees personal consumer loans of up to NOK 300,000. The employees pay the "norm interest rate", which is variable and set by the Norwegian State, and we pay the difference between the norm interest rate and the then-current market interest rate. We also guarantee these loans up to an aggregate maximum amount of NOK 10 million. The repayment period is up to eight years. Our obligations resulting from paying the interest rate difference will be dependent on the loan volume, but, based on current interest rates, it would not exceed NOK 5 million per year.
Members of the corporate executive committee and the board of directors may not take up loans under the current programme. None of the three employee-elected members of the board of directors and none of members of the corporate executive committee had any balances outstanding under this facility as of 15 March 2010.
Employees at certain employment levels are entitled to an interest-free car loan from the company. Members of the corporate executive committee and employee-elected members of the board are generally excluded from this arrangement, and none of them had any balances outstanding as of 15 March 2010.
4 Financial analysis and review
Statoil delivered a strong operational performance in 2009 and the company is in good financial shape and well positioned to continue to deliver growth and shareholder value towards 2012 and beyond.
The company met its guided production level by increasing equity production by 2%, to 1.962 mboe per day. It also delivered a successful exploration programme while maintaining cost control and capital discipline. However, net operating income was down by 39%, mainly because of lower prices for both oil and gas. Net operating income amounted to NOK 121.6 billion.
Around 80% of the Hydro merger synergies have been achieved, and the remainder are expected to be realised during 2010. Significant cost reductions have secured Statoil's highly competitive operating unit cost position.
The company has had a strong cash flow throughout the financial turmoil and has a sound financial position. Statoil is thus positioned to continue its production growth towards 2012 despite the current weakness in the gas markets, and it has projects and resource potential to underpin profitable growth beyond 2012. The board of directors is proposing an attractive dividend of NOK 6.00 per share for 2009.
4.1 Continued deliveries in turbulent markets
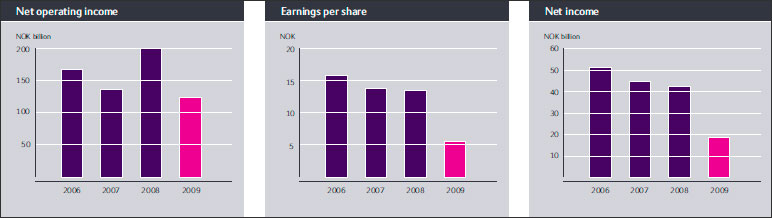
Statoil delivers sound financial and operational results in a demanding market. The activity level is high, and our production is growing according to plan.
In 2009, Statoil delivered total liquids and gas entitlement production of 1.806 mboe per day, up 3% from 1.751 mboe per day in 2008. The contribution from international operations reached the highest level yet, accounting for approximately 20% of the entitlement production. Total equity production increased by 2% from 2008, to 1.962 mboe per day in 2009.
Despite strong production and increased contribution from higher volumes, net operating income was down 39% at NOK 121.6 billion in 2009, compared with NOK 198.8 billion in 2008. The decrease was mainly attributable to lower prices for oil and gas and increased depreciation, amortisation and impairment losses. Having realised approximately 80% of the expected synergies from the merger, Statoil has reduced overall expenses, reduced expenditures related to logistics and procurement, improved operational efficiencies, and increased value creation through commodities trading.
Statoil delivered an extensive exploration programme in 2009. Of a total of 70 exploration wells completed before 31 December 2009, 29 were drilled outside the NCS. Forty wells were announced as discoveries, seven of which are located outside the NCS. In 2009, 481 mmboe were added through revisions, extensions and discoveries, compared with additions of 230 mmboe in 2008, also through revisions, extensions and discoveries.
In all, Statoil achieved a reserve replacement ratio of 73% in 2009.
Statoil maintained a high level of activity in progressing projects into production in 2009. Four projects on the NCS and two international projects came on stream in 2009. Eight new projects have been sanctioned for development in 2009, three of which are outside Norway.
In 2009, the group gained access to 13 new exploration licences in India, Canada, GoM, Libya, Brasil and the Faroe Islands. On the NCS, we were awarded access to 13 new licences, as operator for six and as partner in seven. We were also awarded five licence extensions, as operator for four and partner in one. In addition, the group signed a contract with Lukoil and the Iraqi government concerning an 18.75% interest in the West Ourna 2 field in Iraq.
4.1.1 Sales volumes
Sales volumes include our lifted entitlement volumes, the sale of SDFI volumes as well as our marketing of third party volumes
We take part in the production of oil and natural gas volumes, and incur capital expenditures and operating expenses on the basis of such equity volumes. Under certain profit sharing agreements (PSAs), a portion of the equity production is distributed to the relevant government before arriving at the volumes that we are ultimetely entitled to sell (entitlement volumes). The timing of when we lift our share of entitlement volumes may cause us to at any point in time have a difference between our share of entitlement volumes and the volumes lifted. This difference is called overlift if we have lifted more than our share of the entitlement production, and underlift if our cumulative lifting is less than our share of the entitlement volumes. The lifted volumes and volumes in inventory are the basis for what we can sell to third parties.
In addition to our own volumes of lifted entitlement production and in storage, we market and sell oil and gas owned by the Norwegian state through the Norwegian state's share in production licences, known as the State's Direct Financial Interest, or SDFI. For additional information, see section 3.13 Operational review-Related party transactions. The following table shows SDFI and Statoil sales volume information for crude oil and natural gas, as applicable, for the periods indicated. The Statoil natural gas sales volumes include equity volumes sold by Natural Gas, natural gas volumes sold by International E&P and ethane volumes.
For more information on the differences between equity and entitlement production, sales volumes and lifted volumes, see section 4.1.10 Financial analysis and review - Continued deliveries in turbulent markets - Definitions of reported volumes.
Sales Volumes |
| Year ended December 31, |
|
2009 | 2008 | 2007 | |
Statoil: (1) |
|
|
|
Crude oil (mmbbls) (2) | 381 | 372 | 395 |
Natural gas (bcf) | 1462 | 1387 | 1257 |
Natural gas (bcm) (3) | 41.4 | 39.3 | 35.6 |
Combined oil and gas (mmboe) | 642 | 619 | 619 |
|
|
|
|
Third party volumes: (4) |
|
|
|
Crude oil (mmbbls)(2) | 257 | 242 | 240 |
Natural gas (bcf) | 192 | 127 | 177 |
Natural gas (bcm) (3) | 5.4 | 3.6 | 5.0 |
Combined oil and gas (mmboe) | 291 | 265 | 271 |
|
|
|
|
SDFI assets owned by the Norwegian State: |
|
| |
Crude oil (mmbbls) (2) | 200 | 213 | 235 |
Natural gas (bcf) | 1,431 | 1,440 | 1,327 |
Natural gas (bcm) (3) | 40.5 | 40.8 | 37.6 |
Combined oil and gas (mmboe) | 455 | 470 | 472 |
|
|
|
|
Total |
|
|
|
Crude oil (mmbbls) (2) | 838 | 827 | 869 |
Natural gas (bcf) | 3,085 | 2,955 | 2,760 |
Natural gas (bcm) (3) | 87.4 | 83.7 | 78.2 |
Combined oil and gas (mmboe) | 1388 | 1353 | 1361 |
|
|
|
|
(1) The Statoil volumes included in the table above are based on the premise that volumes sold were equal to lifted volumes in the relevant year. Changes in inventory may cause these volumes to differ from the sales volumes reported elsewhere in this report by the Oil Trading and Supplies (OTS) organisation in the Manufacturing and Marketing segment in that such volumes include volumes still in inventory or transit held by other reporting entities within the group. Excluded from such volumes are volumes lifted by the International E&P but not sold by OTS, and volumes lifted by E&P Norway or International and still in inventory or in transit. | |||
(2) Sales volumes of crude oil include NGL and condensate. All sales volumes reported in the table above include internal deliveries to our manufacturing facilities. | |||
(3) At a gross calorific value (GCV) of 40 MJ/scm. | |||
(4) Third party volumes of crude oil include both volumes purchased from partners in our upstream operations and other cargos purchased in the market. The third party volumes are purchased either for sale to third parties or for our own use. Third party volumes of natural gas include third party LNG volumes related to our activities at the Cove Point regasification terminal in the U.S. | |||
4.1.2 Group profit and loss analysis
Revenues and other income were NOK 465.4 billion in 2009, which is NOK 190.6 billion lower than in 2008 and NOK 57.4 billion lower than in 2007. Most of the revenues stem from the sale of lifted crude oil, natural gas and refined products produced and marketed by Statoil.
Consolidated statement of income | Year ended 31 December | ||||
(in NOK billion) | 2009 | 2008 | 2007 | 09-08 change | 08 -07 change |
|
|
|
|
|
|
Revenues and other income |
|
|
|
|
|
Revenues | 462.3 | 652.0 | 521.7 | (29%) | 25% |
Net income from associated companies | 1.8 | 1.3 | 0.6 | 39% | 111% |
Other income | 1.4 | 2.8 | 0.5 | (51%) | 428% |
|
|
|
|
|
|
Total revenues and other income | 465.4 | 656.0 | 522.8 | (29%) | 25% |
|
|
|
|
|
|
Operating expenses |
|
|
|
|
|
Purchase, net of inventory variation | 205.9 | 329.2 | 260.4 | (37%) | 26% |
Operating expenses | 56.9 | 59.3 | 60.3 | (4%) | (2%) |
Selling, general and administrative expenses | 10.3 | 11.0 | 14.2 | (6%) | (23%) |
Depreciation, amortisation and net impairment losses | 54.1 | 43.0 | 39.4 | 26% | 9% |
Exploration expenses | 16.7 | 14.7 | 11.3 | 14% | 30% |
|
|
|
|
|
|
Total operating expenses | 343.8 | 457.2 | 385.6 | (25%) | 19% |
|
|
|
|
|
|
Net operating income | 121.6 | 198.8 | 137.2 | (39%) | 45% |
|
|
|
|
|
|
Net financial items | (6.7) | (18.4) | 9.6 | (64%) | (291%) |
|
|
|
|
|
|
Income tax | (97.2) | (137.2) | (102.2) | (29%) | (34%) |
|
|
|
|
|
|
Net income | 17.7 | 43.3 | 44.6 | (59%) | (3%) |
Earnings per share for income attributable to equity holders of company basic and diluted |
|
|
|
|
|
5.7 | 13.6 | 13.8 | (58 %) | (100 %) | |
Operational data | Year ended 31 December | ||||
| 2009 | 2008 | 2007 | 09-08 change | 08-07 change |
|
|
|
|
|
|
Average liquids price (USD/bbl) | 58.0 | 91.0 | 70.5 | (36 %) | 29 % |
USDNOK average daily exchange rate | 6.30 | 5.63 | 5.86 | 12 % | (4 %) |
Average liquids price (NOK/bbl) | 364 | 513 | 413 | (29 %) | 24 % |
Gas prices (NOK/scm) | 1.90 | 2.40 | 1.66 | (21 %) | 45 % |
Refining margin, FCC (USD/boe) | 4.3 | 8.2 | 7.5 | (48 %) | 9 % |
Total entitlement liquids production (mboe per day) | 1066 | 1055 | 1070 | 1 % | (1 %) |
Total entitlement gas production (mboe per day) | 740 | 696 | 654 | 6 % | 6 % |
Total entitlement liquids and gas production (mboe per day) | 1806 | 1751 | 1724 | 3 % | 2 % |
Total equity liquids production (mboe per day) | 1202 | 1200 | 1165 | 0 % | 3 % |
Total equity gas prodcution (mboe per day) | 760 | 725 | 674 | 5 % | 8 % |
Total equity liquids and gas production (mboe per day) | 1962 | 1925 | 1839 | 2 % | 5 % |
Total liquids liftings (mboe per day) | 1045 | 1019 | 1081 | 3 % | (6 %) |
Total gas liftings (mboe per day) | 740 | 696 | 654 | 6 % | 6 % |
Total liquids and gas liftings (mboe per day) | 1785 | 1714 | 1735 | 4 % | (1 %) |
Production cost entitlement volumes | 38.4 | 38.1 | 44.1 | 1 % | (14 %) |
Equity production cost excluding restructuring and gas injection cost (NOK/boe, last 12 months) | 35.3 | 33.3 | 31.2 | 6 % | 7 % |
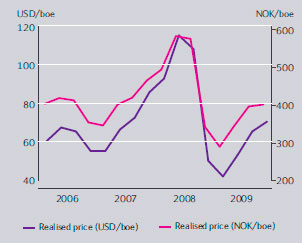
Revenues and other income was NOK 465.5 billion in 2009, compared to NOK 656,0 billion in 2008 and NOK 521.7 billion in 2007. Most of the revenues stem from the sale of lifted crude oil, natural gas and refined products produced and marketed by Statoil. In addition, we also market and sell the Norwegian state's share of liquids from the NCS. All purchases and sales of the Norwegian State's production of liquids are recorded as purchases net of inventory variations and sales, respectively.
The NOK 190.6 billion decrease in revenues from 2008 to 2009 was mainly attributable to lower prices of both liquids and gas. Realised prices of liquids measured in NOK decreased by 29% from 2008 to 2009, contributing NOK 56.5 billion to the reduction in revenues. Gas prices were down 21% in 2009 compared to last year, and contributed NOK 25.0 billion to the reduction in revenues. The reduction in revenues was partly compensated by a 4% increase in liftings of both liquids and gas, with a total off-setting effect of NOK 15.2 billion. The decrease in revenues related to volumes purchased from The Norwegian State contributed NOK 124.3 billion.
Realised prices of liquids measured in NOK increased by 29% from 2007 to 2008, contributing NOK 37.0 billion to the revenues, whereas the overall gas sales volumes contributed NOK 6.1 billion and the increase in prices of natural gas contributed NOK 29.2 billion to the change. This was partly off-set by a decrease in liftings of liquids of NOK 9.0 billion. The increase in revenues related to volumes purchased from The Norwegian State contributed NOK 71.0 billion.
The volumes lifted and sold will over time equal our production of entitlement volumes, but may be higher or lower in any period due to differences between the capacity of the vessels lifting our volumes and the actual entitlement production in the period. Total liquids liftings was 1.045 mmboe per day in 2009, an increase of 3% compared to last year. In 2008, total liquids liftings decreased from 1.081 mmboe per day in 2007 to 1.019 mmboe per day in 2008. The average daily underlift was 21 mboe per day in 2009 and 37 mboe per day in 2008, while there was an average overlift of 11 mboe per day and 2007.
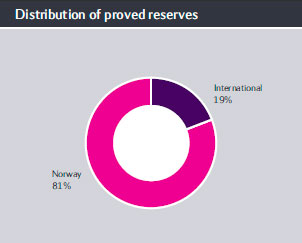
Entitlement volumes lifted is the basis for the revenue recognition, while equity production volumes affect operating costs more directly. See report section Financial analysis and review - Continued deliveries in turbulent markets - Sales volumes for more details on the PSA effects that causes differences between equity and entitlement volumes. See below for more details on the difference between lifted and produced volumes.
Net income from associated companies was NOK 1.8 billion in 2009, NOK 1.3 billion in 2008 and NOK 0.6 billion in 2007.
Other income was NOK 1.4 billion in 2009, compared with NOK 2.8 billion in 2008 and NOK 0.5 billion in 2007. The income in 2009 stem mainly from insurance proceeds relating to business interruptions. The income in 2008 and 2007 was mainly related to gain from sale of assets.
Purchase, net of inventory variation includes the cost of the oil and NGL production purchased from the Norwegian state pursuant to the Owners Instruction. The purchase, net of inventory variation amounted to NOK 205.9 billion in 2009, compared to NOK 329.2 billion in 2008 and NOK 260.4 billion in 2007. The increase from 2007 through 2008 was mainly caused by higher prices of liquids measured in NOK, while the 37% decrease from 2008 to 2009 mainly stem from lower prices of liquids measured in NOK.
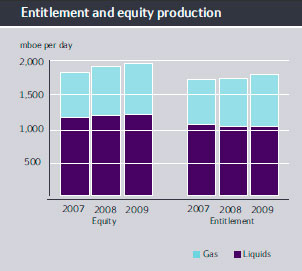
Operating expenses include field production costs and transport systems related to the company's share of oil and natural gas production. Operating expenses were NOK 56.9 billion in 2009, reduced by 4% since 2008 when operating expenses were NOK 59.3 billion. The reduction was mainly attributable to reduced transportation costs and the reversal of a provision related to a take or pay contract in previous periods. In 2007, operating expenses were NOK 60.3 billion, and the 2% decrease from 2007 to 2008 was primarily due to restructuring costs related to the merger in 2007 and was only partly offset by increased costs related to start-up of new fields, higher activity and industry cost inflation in 2008.
Total liquids and gas entitlement production increased from 1.751 mmboe per day in 2008 to 1.806 mmboe per day in 2009. In 2007, total liquids and gas production was 1.724 mmboe per day. activities. Equity production of oil and gas increased from 1.925 mmboe per day in 2008 to 1.962 mmboe per day in 2009. In 2007, equity production of liquids and gas was 1.839 mmboe per day.
The 2% increase in equity production from 2008 to 2009 was primarily due to increased production from start-up of new fields, ramp-up on existing fields, partly offset by declining production from mature fields, various operational issues and maintenance activities. Entitlement production increased by 3% due to the same reasons and also due to a less adverse effect of product sharing agreements (PSA-effects).
The 5% increase in equity production from 2007 to 2008 was primarily due to new fields coming on stream and a higher gas off-take, partly offset by declining production from maturing fields. The 2% increase in entitlement production was due to the same reasons, but was partly offset by higher adverse PSA-effects.
The production cost per boe based on entitlement volumes was NOK 38.4 for the 12 months ended 31 December 2009, compared with NOK 38.1 for the 12 months ending 31 December 2008. In 2007, the production cost per boe was NOK 44.1. Production costs are incurred based on our equity production. Management therefore thinks that unit of production cost based on equity production is a better measure of cost control than unit of production cost based on entitlement volumes. Based on equity volumes, the production cost per boe for the two periods was NOK 35.3 and NOK 34.6, respectively.
Adjusted for restructuring costs and other costs arising from the merger recorded in the fourth quarter of 2007 and gas injection costs, the production cost per boe of equity production for the 12 months ending 31 December 2009 and 2008, was NOK 35.3 and NOK 33.3 respectively.
Adjustments are made for certain costs related to the purchase of gas used for injection into oil-producing reservoirs. The adjustment facilitates comparison of field production costs with other fields which do not pay for their own gas used for injection into oil producing reservoirs.
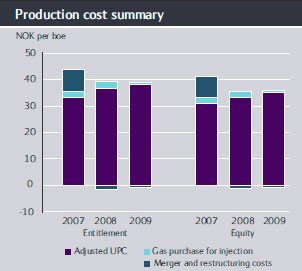
Selling, general and administrative expenses include expenses related to the sale and marketing of our products, such as business development costs, payroll and employee benefits. These amount to NOK 10.3 billion in 2009, compared to NOK 11.0 billion in 2008 and NOK 14.2 billion in 2007. The 6% decrease from 2008 to 2009 consists of numerous different factors, cost savings being one of them. The 23% decrease from 2007 to 2008 was mainly due to restructuring costs related to the merger in 2007 and was only partly offset by increased costs related to higher activity and industry cost inflation in 2008.
Depreciation, amortisation and impairment includes depreciation of production installations and transport systems, depletion of fields in production, amortisation of intangible assets and depreciation of capitalised exploration expenditure. It also includes write-downs of impaired long-lived assets and reversals of impairments. These expenses amounted to NOK 54.1 billion in 2009, compared to NOK 43.0 billion in 2008 and NOK 39.4 billion in 2007.
The 26% increase in depreciation, amortisation and impairment expenses in 2009 compared to 2008 was due to increased production on the NCS and impairment charges net of reversals of NOK 7.1 billion, mostly related to assets in the Gulf of Mexico and refinery assets in Norway.
Depreciation, amortisation and impairment expenses in 2008 showed a increase of 9% compared to 2007. The increase was due to impairment charges net of reversals of NOK 2.3 billion, mostly related to the Gulf of Mexico, and an increase in production.
| Year ended 31 December | ||||
Depreciation, amortisation and net impairment losses (in NOK billion) | 2009 | 2008 | 2007 | 09-08 change | 08-07 change |
Ordinary depreciation | (46.5) | (40.4) | (37.0) | 15 % | 9 % |
Amortisation of intangible assets | (0.1) | (0.1) | (0.2) | 5 % | (31 %) |
Impairments, net of reversals | (6.4) | (2.4) | (2.2) | 166 % | 11 % |
Impairment of intangible assets | (1.0) | 0.0 | 0.0 | n/a | n/a |
Depreciation, amortisation and net impairment losses | (54.1) | (43.0) | (39.4) | 26 % | 9 % |
Exploration expenditures are capitalised to the extent that exploration efforts are considered successful, or pending such assessment. Otherwise, such expenditures are expensed. The exploration expense consists of the expensed portion of our exploration expenditure in 2009 and write-offs of exploration expenditure capitalised in previous years. In 2009, the exploration expenses were NOK 16.7 billion, a 14% increase since 2008 when exploration expenses were NOK 14.7 billion. In 2007, exploration expenses were NOK 11.3 billion.
| For the year ended 31 December | ||||
Exploration (in NOK billion) | 2009 | 2008 | 2007 | 09-08 change | 08-07 change |
|
|
|
|
|
|
Exploration expenditure (activity) | 16.9 | 17.8 | 14.2 | -5% | 25% |
Expensed, previously capitalised exploration expenditure | 7.0 | 3.7 | 1.7 | 89% | 118% |
Capitalised share of current periods exploration activity | (7.2) | (6.8) | (4.6) | 6% | 48% |
|
|
|
|
|
|
Exploration expense | 16.7 | 14.7 | 11.3 | 14% | 30% |
The 14% increase in exploration expenses from 2008 to 2009 was mainly due to a higher number of wells drilled and a higher portion of exploration expenditure capitalised in previous years being impaired. The 30% increase in exploration expenses from 2007 to 2008 was mainly due to a higher number of wells drilled, generally more expensive wells, higher field evaluation costs and delineation of the oil sands project in Canada.
In 2009, a total of 68 exploration and appraisal wells and two exploration extension wells were completed, 41 on the NCS and 29 internationally. Thirty-eight exploration and appraisal wells and two exploration extension wells have been declared as discoveries.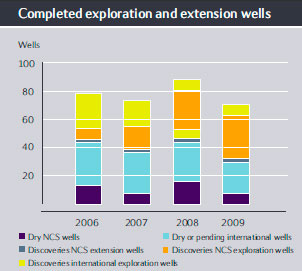
In 2008, a total of 79 exploration and appraisal wells and nine exploration extension wells were completed, 48 on the NCS and 40 internationally. Thirty-five exploration and appraisal wells and six exploration extension wells have been declared as discoveries.
In 2007, a total of 71 exploration and appraisal wells were completed, 24 on the NCS and 47 internationally. In addition, two exploration extension wells were completed in the same period. Thirty-four of the exploration and appraisal wells were confirmed discoveries, 16 on the NCS and 18 internationally. Both exploration extension wells were discoveries.
Net operating income was NOK 121.6 billion in 2009, compared to NOK 198.8 billion in 2008 and NOK 137.2 billion in 2007. The 39% decrease from 2008 to 2009 was primarily attributable to lower prices of liquids and gas, and increased depreciation, amortisation and impairment losses, partly offset by income from higher volumes sold. The 45% increase from 2007 to 2008 was mainly due to higher realised prices for both liquids and natural gas, measured in NOK, and it was only partly offset by increased operating expenses caused by a higher activity level and new, more expensive fields coming on stream.
Net operating income in 2007 was also influenced by increased operating, selling and administrative expenses stemming in part from restructuring and other costs arising from the merger, a negative change in derivatives, new fields coming on stream and increased activity levels. The restructuring costs and other costs arising from the merger were recorded primarily under operating and general and administrative expenses, and they were allocated to the business areas where possible. Restructuring costs and other costs arising from the merger were primarily related to pensions and early retirement costs and impairment of assets in Sweden.
In 2009, net operating income was affected by the following items: impairment losses net of reversals (NOK 12.2 billion) and underlift (NOK 1.2 billion) negatively affected net operating income, while higher fair value of derivatives (NOK 2.2 billion), higher values of products in operational storage (NOK 2.1 billion), other accruals (NOK 1.3 billion), gain on sale of assets (NOK 0.5 billion) and reversals of restructuring costs (NOK 0.3 billion) all positively affected net operating income in 2009.
In 2008, net operating income was affected by the following items: impairment charges net of reversals (NOK 4.8 billion), lower values of products in operational storage (NOK 2.8 billion), underlift (NOK 2.4 billion) and other accruals (NOK 2.3 billion) all affected net operating income in 2008 negatively, while increased fair value of derivatives (NOK 1.8 billion), gains on derivatives to hedge the value of inventories (NOK 0.8 billion), gains on sales of assets (NOK 1.4 billion) and reversal of restructuring cost accrual (NOK 1.6 billion) positively affected net operating income in 2008.
In 2007, net operating income was impacted of the following items: impairment charges net of reversals (NOK 2.8 billion), loss on derivatives to hedge the value of inventories (NOK 1.1 billion), other accruals (NOK 1.2 billion), restructuring cost accrual (NOK 6.7 billion) and other costs related to the merger (NOK 3.2 billion) all impacted net operating income in 2007 negatively, while increased fair value of derivatives (NOK 0.5 billion), overlift (NOK 1.6 billion), higher values of products in operational storage (NOK 1.5 billion) positively impacted net operating income in 2008.
Net financial items amounted to a loss of 6.7 billion in 2009, compared to a loss of NOK 18.4 billion in 2008.
The NOK 11.7 billion positive change from 2008 to 2009 was mostly attributable to NOK 2.0 billion net currency gains caused by a 17% weakening of US dollar versus the NOK for the year ended 31 December 2009, compared to NOK 32.6 net currency losses caused by a 29% strengthening of the US dollar versus the NOK for the year ended 31 December 2008.
Net foreign exchange losses in 2009 and net foreign exchange losses in 2008 are mainly related to currency derivatives used for currency and liquidity risk management. Effective 1 January 2009 the functional currency changed to US dollar for the parent company. As a result US dollar denominated non-current financial liabilities that impacted Net foreign exchange gains (losses) in 2008, do not impact the income statement in 2009. The positive impact of net currency exchange gains was partly offset by a NOK 8.5 billion decrease in interest income and other financial items and a NOK 14.5 billion increase in interest and other finance expenses.
Interest income and other financial items amounted to NOK 3.7 billion for the year ended 31 December in 2009, compared to NOK 12.2 billion for the year ended 31 December 2008. The NOK 8.5 billion decrease was mainly related to NOK 3.9 billion in lower income from securities and NOK 5.5 billion in decreased interest income on current financial assets.
Interest expense and other finance expenses amounted to a net expenses of NOK 12.5 billion for the year ended 31 December 2009, compared to a net gain of NOK 2.0 billion for the year ended 31 December 2008. The decrease of NOK 14.5 billion mostly relate to fair value losses on interest rate derivatives used to manage the interest rate risk of the loan portfolio, due to increasing US dollar rates for 2009. Correspondingly, decreasing US dollar rates in 2008 resulted in fair value gains on these swap positions.
In 2008, Net financial items amounted to a loss of NOK 18.4 billion, compared with a gain of NOK 9.6 billion in 2007.
The NOK 28.0 billion negative change from 2007 to 2008 was mostly attributable to NOK 32.6 billion net currency losses caused by a 29% strengthening of US dollar versus the NOK for the year ended 31 December 2008, compared to NOK 10.0 billion net currency gains from a 14% weakening of the US dollar versus the NOK for the year ended 31 December 2007.
Net foreign exchange losses in 2008 and net foreign exchange gains in 2007 are mainly related to currency derivatives used for currency and liquidity risk management, in combination with net impact on the US dollar denominated loan portfolio.The negative impact of currency exchange losses was partly offset by a NOK 9.9 billion increase in interest income and other financial items and a NOK 4.7 billion decrease in interest and other finance expenses.
Interest income and other financial items amounted to NOK 12.2 billion for the year ended 31 December 2008, compared to NOK 2.3 billion for the year ended 31 December 2007. The increase of NOK 9.9 billion mainly related to an increase in interest income of NOK 4.4 billion and an increase in income from securities of NOK 5.5 billion, mainly related to currency gains on USD denominated investments.
Interest expense and other finance expenses amounted to a net gain of NOK 2.0 billion for the year ended 31 December 2008, compared to a net loss of NOK 2.7 billion for the year ended 31 December 2007.
Management of the portfolio of security investments, mainly related to equity securities, is held by our insurance captive, Statoil Forsikring AS, commercial papers is held by Statholding AS and liquidity funds is held by Statoil ASA.
The Norwegian central bank's closing rate for USDNOK was 5.78 on 31 December 2009, 7.00 on 31 December 2008 and 5.41 on 31 December 2007. These exchange rates have been applied in Statoil's financial statements.
Income taxes were NOK 97.2 billion in 2009, equivalent to a tax rate of 84.6%, compared to NOK 137.2 billion in 2008, equivalent to a tax rate of 76.0% and NOK 102.2 billion in 2007, equivalent to a tax rate of 69.6%.
The increase in the tax rate from 2008 to 2009 was mainly due to significant taxable exchange gains, which do not have an impact on the statement of income for companies whose functional currency is USD. In 2009 the taxable income related to these exchange gains is estimated to be NOK 25.0 billion higher than income before tax, which increases the tax rate. In addition, the tax rate was increased by relatively higher income from the NCS with higher than average tax rates, and impairment losses with lower than average tax rates.
The increase in the tax rate from 2007 to 2008 was mainly related to the net loss on financial items which is tax deductible at a lower tax rate than the average rate. In addition, the tax rate was increased by the deferred tax expense caused by currency effects in certain group companies which are taxable in a different currency than the functional currency. This was partly offset by the tax effect of a proportionally higher operating income being subject to a lower than average tax rate.
The effective tax rate is calculated as income taxes divided by income before taxes. Fluctuations in the effective tax rates from year to year are principally the result of non-taxable items (permanent differences), changes in the components of income between Norwegian oil and gas production, taxed at a marginal rate of 78%. Other Norwegian income, including the onshore portion of net financial items are taxed at 28%, and income in other countries taxed at the applicable income tax rates.
In 2009, the non-controlling interest (minority interest) in net profit was negative NOK 0.6 billion, compared to an income of NOK 0.005 billion in 2008 and NOK 0.5 billion in 2007. The non-controlling interest is primarily related to the Mongstad crude oil refinery.
Net income was NOK 17.7 billion in 2009, compared to NOK 43.3 billion in 2008 and NOK 44.6 billion in 2007. The 59% decrease from 2008 to 2009 is mainly due to reduced operating income caused by lower revenues from liquids and gas sales and a higher effective tax rate, only partly offset by reduced loss on net financial items.
The 3% decrease from 2007 to 2008 was mainly caused by a loss on financial items, high income taxes and increased operating expenses, and was only partly offset by higher prices on both liquids and natural gas, measured in NOK.
The Board of Directors proposes to the Annual General Meeting a dividend of NOK 6.00 per share for 2009, making an aggregate total of NOK 19.1 billion. In 2008, ordinary dividend was NOK 4.40 per share, as well as NOK 2.85 per share in special dividend, making an aggregate total of NOK 23.1 billion. Ordinary dividend for 2007 was NOK 4.20 per share, as well as NOK 4.30 per share in special dividend, making an aggregate total of NOK 27.1 billion for 2007.
4.1.3 Group outlook
Statoil's guidance for equity production is in the range of 1,925 to 1,975 mboe per day in 2010.
The expected volumes are exclusive of any Opec cuts. Commercial considerations related to gas sales activities, operational regularity, the timing of new capacity coming on stream and gas offtake represent the most significant risks related to the production guidance.
Planned turnarounds in 2010 are estimated to have a negative impact on the equity production of around 50 mboe per day in 2010.
Capital expenditure in 2010, excluding acquisitions and capital leases, is estimated to be around USD 13 billion.
The unit production cost for equity volumes is estimated to be NOK 35-36 per boe, which is on a par with 2009.
The company will continue to mature its large portfolio of exploration assets and expects an exploration activity level in 2010 of around USD 2.3 billion.
We expect prices for crude oil, products and natural gas to continue to be volatile in the short to medium term. Refining margins have been declining for more than a year, and we anticipate that they will remain low, at least in the near term.
In the long term, we continue to take a positive view of gas as an energy source. Domestic production of gas in the EU continues to decline, while demand for gas is expected to increase in the long term, particularly due to the lower carbon footprint of natural gas compared with oil and coal. In the USA, we believe that our position in the Marcellus shale gas acreage, in combination with Gulf of Mexico production and our LNG regasification capacity position at Cove Point, will provide a foundation for growth in our US market position in the years ahead.
Statoil's income could vary significantly with changes in commodity prices, while volumes are fairly stable through the year. There is a small seasonal effect on volumes in the winter and summer seasons due to normally higher off-takes of natural gas during cold periods. There is normally an additional small seasonal effect on volumes as a result of the higher maintenance activity level on offshore production facilities during the second and third quarters each year, since generally better weather conditions allow for more maintenance work.
These forward-looking statements reflect current views about future events and are, by their nature, subject to significant risks and uncertainties because they relate to events and depend on circumstances that will occur in the future. See "Forward looking statements" section 10.
4.1.4 Segment performance and analysis
Oil and natural gas are subject to internal transactions between our business segments before being sold in the market. We have established a pricing policy for transfers based on the market price.
The table details certain financial information for our four business segments: Exploration & Production Norway (EPN), International Exploration & Production (INT), Natural Gas (NG) and Manufacturing & Marketing (M&M). We eliminate intercompany sales when combining business segment results. These include transactions recorded in connection with our oil and natural gas production in the EPN or INT segments, and also in connection with the sale, transportation or refining of our oil and natural gas production in the M&M or NG segments.
EPN produces oil, which it sells internally to Oil Sales, Trading and Supply (OTS) in the M&M segment, which then sells the oil in the market. EPN also produces natural gas, which it sells internally to the NG segment, also for sale in the market. A large share of the oil and a small share of the natural gas produced by INT is also sold in the same way as the oil and natural gas produced by EPN. The remaining oil and gas from INT is sold directly in the market. Statoil has established a market price-based transfer pricing policy whereby an internal price is set at which the EPN business area sells oil and natural gas to the M&M and NG segments.
The transfer price formula for natural gas produced by EPN and marketed and sold by NG was changed with effect from 1 January 2008 in order to better reflect fundamental changes in the markets for competing energies, for instance crude oil, for developments in natural gas markets and for changes in the natural gas sales contracts portfolio. The internal price is linked to the gas market prices, and it better reflects the distribution of value creation between NG and EPN. The change was effective as of 1 January 2008 and it is reflected in our financial reporting, without prior periods being restated.
In 2009, the average transfer price for natural gas per standard cubic metre was NOK 1.38 per scm. The average transfer price was NOK 1.87 in 2008 and NOK 1.39 in 2007. For oil sold from EPN to M&M, the transfer price is the applicable market reflective price minus a margin of NOK 0.70 per barrel.
For additional information please refer to note 5 Segments in the Consolidated Financial Statements.
The following table shows certain financial information for the four segments, including intercompany eliminations for each of the years in the three-year period ending 31 December 2009.
| For the year ended 31 December | ||
(in NOK billion) | 2009 | 2008 | 2007 |
|
|
|
|
Exploration & Production Norway |
|
|
|
Total revenues | 158.7 | 219.8 | 179.2 |
Net operating income | 104.3 | 166.9 | 123.2 |
Non-current assets | 176.0 | 165.5 | 153.1 |
|
|
|
|
International Exploration & Production |
|
|
|
Total revenues | 41.8 | 46.1 | 41.6 |
Net operating income | 2.6 | 12.8 | 12.2 |
Non-current assets | 152.7 | 160.6 | 107.3 |
|
|
|
|
Natural Gas |
|
|
|
Total revenues | 98.6 | 110.8 | 73.4 |
Net operating income | 18.5 | 12.5 | 1.6 |
Non-current assets | 34.8 | 35.7 | 35.6 |
|
|
|
|
Manufacturing & Marketing |
|
|
|
Total revenues | 351.2 | 531.3 | 428.0 |
Net operating income | (0.5) | 4.5 | 3.8 |
Non-current assets | 28.6 | 34.4 | 27.6 |
|
|
|
|
Other and elimination |
|
|
|
Total revenues | (184.9) | (252.1) | (199.5) |
Net operating income | (3.3) | 2.1 | (3.4) |
Non-current assets | 3.0 | 3.9 | 2.9 |
|
|
|
|
Statoil group |
|
|
|
Total revenues | 465.4 | 656.0 | 522.8 |
Net operating income | 121.6 | 198.8 | 137.2 |
Non-current assets | 395.1 | 400.1 | 326.5 |
Non-current assets, not allocated to segments | 51.4 | 33.5 | 26.9 |
(in NOK million) | Crude oil | Gas | NGL | Refined products | Other | Total sale |
|
|
|
|
|
|
|
Year ended 31 December 2009 |
|
|
|
|
|
|
Norway | 182,353 | 80,018 | 34,655 | 45,927 | 18,137 | 361,090 |
USA | 19,836 | 5,555 | 117 | 14,017 | 672 | 40,197 |
Sweden | 0 | 0 | 0 | 16,556 | 3,795 | 20,351 |
Denmark | 0 | 0 | 0 | 15,105 | 1,957 | 17,062 |
Other | 9,978 | 2,959 | 154 | 10,762 | 1,102 | 24,955 |
|
|
|
|
|
|
|
Total revenues (excluding net income from associated companies) | 212,167 | 88,532 | 34,926 | 102,367 | 25,663 | 463,655 |
(in NOK million) | Crude oil | Gas | NGL | Refined products | Other | Total sale |
|
|
|
|
|
|
|
Year ended 31 december 2008 |
|
|
|
|
|
|
Norway | 260,171 | 79,813 | 44,536 | 79,659 | 31,105 | 495,284 |
United States | 24,712 | 8,795 | 1,660 | 20,182 | 2,545 | 57,894 |
Sweden | 0 | 0 | 0 | 23,428 | 2,618 | 26,046 |
Denmark | 0 | 0 | 0 | 16,858 | 2,558 | 19,416 |
Singapore | 11,203 | 1,906 | 0 | 0 | 0 | 13,109 |
UK | 1,982 | 10,878 | 2 | 0 | 2,800 | 15,662 |
Other | 7,305 | 930 | 198 | 16,885 | 2,008 | 27,326 |
|
|
|
|
|
|
|
Total revenues (excluding net income from associated companies) | 305,373 | 102,322 | 46,396 | 157,012 | 43,634 | 654,737 |
(in NOK million) | Crude oil | Gas | NGL | Refined products | Other | Total sale |
|
|
|
|
|
|
|
Year ended 31 December 2007 |
|
|
|
|
|
|
Norway | 209,764 | 62,911 | 47,119 | 52,537 | 14,342 | 386,673 |
United States | 24,142 | 5,269 | 1,766 | 22,823 | (864) | 53,136 |
Sweden | 0 | 0 | 0 | 15,217 | 7,892 | 23,109 |
Denmark | 0 | 0 | 0 | 13,161 | 1,759 | 14,920 |
Singapore | 13,861 | 0 | 0 | 367 | 0 | 14,228 |
Other | 13,290 | 2,485 | 139 | 11,517 | 2,691 | 30,122 |
|
|
|
|
|
|
|
Total revenues (excluding net income from associated companies) | 261,057 | 70,665 | 49,024 | 115,622 | 25,820 | 522,188 |
4.1.5 Exploration & Production Norway
Our overall strategy on the NCS is to conduct safe, efficient and reliable operations and capture the full potential of the NCS by developing profitable oil and gas resources.
Statoil delivered an extensive exploration programme on the NCS in 2009. We participated in 39 exploration and appraisal wells, 31 of which resulted in discoveries. In addition, we completed two exploration extensions, both announced as discoveries. Total exploration expenditure was NOK 8.2 billion in 2009, compared with NOK 8.7 billion in 2008 and NOK 5.7 billion in 2007.
Gross investments amounted to NOK 34.9 billion in 2009, which is unchanged from 2008 and slightly higher than NOK 31.1 billion in 2007. Around half of our investments are related to new fields, while the other half are investments in existing fields.
In total, four new fields came on stream on the NCS in 2009: Yttergryta, Alve, Tyrihans and Tune South.
Our production of oil and gas on the NCS averaged 1.450 mmboe per day in 2009, compared with 1.461 mmboe per day in 2008 and 1.417 in 2007.
4.1.5.1 Profit and loss analysis
Exploration & Production Norway generated total revenues of NOK 158.7 billion in 2009 and its net operating income was NOK 104.3 billion. The average daily entitlement production in 2009 was 784 mboe per day for liquids and 666 mboe per day for gas.
| For the year ended 31 December | ||||
Income statement (in NOK billion) | 2009 | 2008 | 2007 | 09-08 change | 08-07 change |
|
|
|
|
|
|
Total revenues and other income | 158.7 | 219.8 | 179.2 | (28 %) | 23 % |
|
|
|
|
|
|
Operating expenses | 23.4 | 23.5 | 29.1 | (0 %) | (19 %) |
Selling, general and administrative expenses | 0.1 | (0.1) | 0.3 | (153 %) | (135 %) |
Depreciation, amortisation and impairment | 25.7 | 24.0 | 23.0 | 7 % | 4% |
Exploration expenses | 5.2 | 5.5 | 3.6 | (6 %) | 52% |
Total expenses | 54.4 | 52.9 | 56.1 | 3 % | (6 %) |
Net operating income | 104.3 | 166.9 | 123.1 | (38 %) | 36% |
|
|
|
|
|
|
Operational data: |
|
|
|
|
|
Liquids price (USD/bbl) | 57.8 | 91.5 | 70.9 | (37 %) | 29% |
Liquids price (NOK/bbl) | 363 | 515 | 415 | (30 %) | 24% |
Transfer price natural gas (NOK/scm) | 1.38 | 1.87 | 1.39 | (26 %) | 34% |
|
|
|
|
|
|
Liftings: |
|
|
|
|
|
Liquids (mboe per day) | 778 | 808 | 831 | (4 %) | (3 %) |
Natural gas (mboe per day) | 666 | 637 | 599 | 5 % | 6% |
Total liquids and gas liftings (mboe per day) | 1444 | 1445 | 1430 | (0 %) | 1% |
|
|
|
|
|
|
Production: |
|
|
|
|
|
Entitlement liquids (mboe per day) | 784 | 824 | 818 | (5 %) | 1% |
Entitlement natural gas (mboe per day) | 666 | 637 | 599 | 5 % | 6% |
Total entitlement liquids and gas production (mboe per day) | 1450 | 1461 | 1417 | (1 %) | 3% |
We generated total revenues of NOK 158.7 billion in 2009, NOK 219.8 billion in 2008 and NOK 179.2 billion in 2007. A decrease of 37% in the average price in USD of oil sold by E&P Norway to Manufacturing and Marketing accounted for NOK 52.1 billion of the decrease in revenues, and a 26% decrease in the average transfer price in NOK of natural gas sold by E&P Norway to Natural Gas accounted for NOK 18.9 billion of the decrease in revenues. This was partly offset by a positive currency exchange rate deviation of NOK 12.6 billion due to a 14.0% increase in the USD/NOK exchange rate. Furthermore, lifted volumes of liquids decreased by 4.0%, making a negative contribution of NOK 5.7 billion, which was partly offset by a 4.3% increase in lifted volumes of natural gas, making a positive contribution of NOK 2.9 billion.
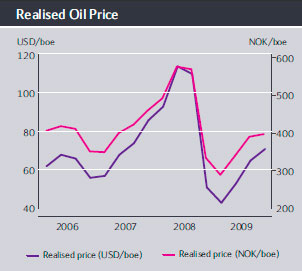
The average daily lifting of liquids in 2009 was 778 mboe per day, compared with 808 mboe per day in 2008 and 831 mboe per day in 2007. Over time, the volumes lifted and sold will equal the volumes produced, but they may be higher or lower in any period due to differences between the capacity of the vessels lifting our volumes and the actual entitlement production in the period. The average daily underlift was 6 mboe per day in 2009 and 16 mboe per day in 2008, compared with an average overlift of 13 mboe per day in 2007.
There was an increase in total revenues from NOK 179.2 billion in 2007 to NOK 219.8 billion in 2008. An increase of 31% in the average price in USD of oil sold by E&P Norway to Manufacturing and Marketing contributed NOK 54.6 billion, and a 35% increase in the average transfer price in NOK of natural gas sold by E&P Norway to Natural Gas, contributed NOK 17.9 billion. Lifted volumes of natural gas increased by 6.7%, resulting in a positive contribution of NOK 3.2 billion. This was offset by a negative currency exchange rate deviation of NOK 11.1 billion due to a 7.2% decrease in the USD/NOK exchange rate. In addition, other income increased by NOK 3.1 billion, mainly as a result of a change in the fair value of derivatives. Lifted volumes of crude oil decreased by 2.5%, making a negative contribution of NOK 3.1 billion.
Operating, general and administrative expenses were NOK 23.5 billion in 2009, compared with NOK 23.4 billion in 2008 and NOK 29.4 billion in 2007. Increased processing/transportation cost were partly offset by lower operating plant cost.
The decrease of NOK 6.0 billion in operating, general and administrative expenses from 2007 to 2008 was mainly due to a decrease in other expenses of NOK 6.8 billion, which was largely due to restructuring costs as a result of the merger in 2007 and a decrease of NOK 1.3 billion in transportation costs in 2008, due in part to reduced booking of transportation capacity. In addition, selling, general and administrative expenses decreased by NOK 0.4 billion while processing costs decreased by NOK 0.3 billion, from 2007 to 2008. This was partially countered by an increase of NOK 2.7 billion in operating plant costs, which was largely due to the start up of new fields of NOK 1.1 billion, increased costs of NOK 0.5 billion of gas purchased for injection at Grane and increased operating activity.
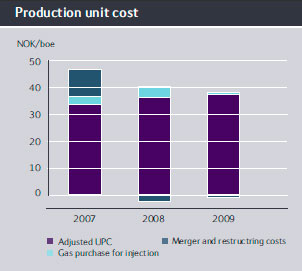
The average daily production of entitlement liquids in 2009 was 784 mboe per day, compared with 824 mboe per day in 2008 and 818 mboe per day in 2007. The decrease in production from 2008 to 2009 was mainly related to expected declines on several fields, various operational issues on the Kristin, Gullfaks South and Norne fields, turnaround and less NGL due to less gas offtake on Oseberg and close-down of the Tordis subsea separator from the end of May 2008 due to leakage from a well. The decrease was partly offset by build up of production at Ormen Lange and Snøhvit and new production from Alve, Tyrihans, Volve, Vilje and Yttergryta, and Kvitebjørn returning to full production from July 2009 after it was shut down due to a damaged gas pipeline.
The increased production from 2007 to 2008 was mainly related to the start-up of the Volve field in February 2008, higher production on Kvitebjørn than in 2007until the shutdown from August 2008, when Kvitebjørn was shut down to allow safe drilling operations most of the year, new wells on Fram and a building up of production on Ormen Lange. The increase was partly offset by declining production from wells in the Grane, Norne, Troll Olje, Tordis, Visund and Sleipner fields.
The average daily production of entitlement gas was 666 mboe per day in 2009 (equal to 105.9 mmcm or 3.74 mmcf), compared with 637 mboe in 2008 (equal to 101.3 mmcm or 3.58 mmcf) and 599 mboe in 2007 (equal to 95.2 mmcm or 3.36 mmcf).
The unit production cost was NOK 36.93 per boe in 2009, compared with NOK 37.31 per boe in 2008 and NOK 46.26 per boe in 2007. The total production cost was NOK 19.5 in 2009, compared with NOK 19.9 billion in 2008, and NOK 23.9 billion in 2007.
The 19% decrease from 2007 to 2008 is due to a 17% decrease in costs and a 3% increase in production. Indirect operating costs decreased by NOK 7.2 billion, mainly due to restructuring costs as a result of the merger in 2007 and the refund in 2008 of the licence partners' proportional share of the restructuring costs. Operating plant costs increased by NOK 2.7 billion, due to both higher activity and increased pressure on costs in the industry. NOK 1.1 billion is attributed to the start-up of new fields. Other variable costs increased by NOK 0.8 billion due to losses on sales of assets.
Depreciation, depletion and impairment expenses were NOK 25.7 billion in 2009, compared with NOK 24.0 billion in 2008 and NOK 23.0 billion in 2007. The increase is mainly due to new fields in production in 2009.
The NOK 1.0 billion increase from 2007 to 2008 was mainly due to higher depreciation costs as a result of higher depreciation offshore resulting from increased production and changes in the portfolio of producing fields.
Exploration expenditure (including capitalised exploration expenditure) in 2009 amounted to NOK 8.2 billion, compared with NOK 8.7 billion in 2008 and NOK 5.7 billion in 2007. The decrease from 2008 to 2009 was mainly due to fewer wells being drilled in 2009.
The increase from 2007 to 2008 primarily stemmed from a higher number of wells being drilled.
Exploration expenses in 2009 were NOK 5.2 billion, compared with NOK 5.5 billion in 2008 and NOK 3.6 billion in 2007.
In 2009, 39 exploration and appraisal wells and two exploration extension wells were completed on the NCS, of which 31 exploration and appraisal wells and both exploration extension wells were announced as discoveries. In 2008, 39 exploration and appraisal wells and nine exploration extension wells were completed on the NCS, of which 27 exploration and appraisal wells and six exploration extension wells were discoveries.
In 2007, 24 exploration and appraisal wells and two exploration extension wells were completed. Of these, 16 exploration and appraisal wells and both exploration extension wells resulted in discoveries.
The drilling of two exploration and appraisal wells was ongoing at the end of the fourth quarter 2009. Three exploration and appraisal wells have been completed since 31 December 2009. All of the wells, Omega North, Lower Lunde and Hild appraisal, were discoveries.
The reconciliation of exploration expenditure with exploration expenses is shown in the table below.
| For the year ended 31 December | ||||
Exploration (in NOK billion) | 2009 | 2008 | 2007 | 09-08 change | 08-07 change |
Exploration expenditure (activity) | 8.2 | 8.7 | 5.8 | (6 %) | 51% |
Expensed, previously capitalized exploration expenditure | 1.2 | 0.7 | 0.1 | 57% | 1398% |
Capitalized share of current period's exploration activity | (4.2) | (3.9) | (2.2) | (7 %) | (80 %) |
Exploration expenses | 5.2 | 5.5 | 3.6 | (6 %) | 52 % |
Net operating income in 2009 was NOK 104.3 billion compared with NOK 166.9 billion in 2008 and NOK 123.2 billion in 2007. The NOK 62.6 billion decrease in 2009 was mainly due to decreased prices for oil and gas.
The NOK 43.7 billion increase in 2008 was mainly due to price and volume effects and NOK 5.5 billion in restructuring and other costs arising from the merger in 2007.
4.1.5.2 Outlook
Our 2010 drilling portfolio is well balanced between frontier impact wells, growth wells and infrastructure near wells.
Exploration is our preferred growth vehicle and we currently have a robust portfolio consisting of frontier impact wells, wells that could provide a basis for establishing new infrastructure (growth wells), and infrastructure near existing wells.
We have secured rig capacity for our drilling activity in 2010 and are well positioned to take advantage of the expected future softening in the rig market. We expect to drill 16 to 20 exploration wells on the NCS in 2010.
A plan for development and operation (PDO) of the Gudrun field in the North Sea was submitted to the Government in February 2010. Statoil is the operator and has a 46.8% share in the field.
In the period leading up to 2012, several new fields are expected to commence production. Gjøa, Vega/Vega South and Morvin are expected to start production in 2010, while the BP-operated Skarv field is expected to start production in 2011.
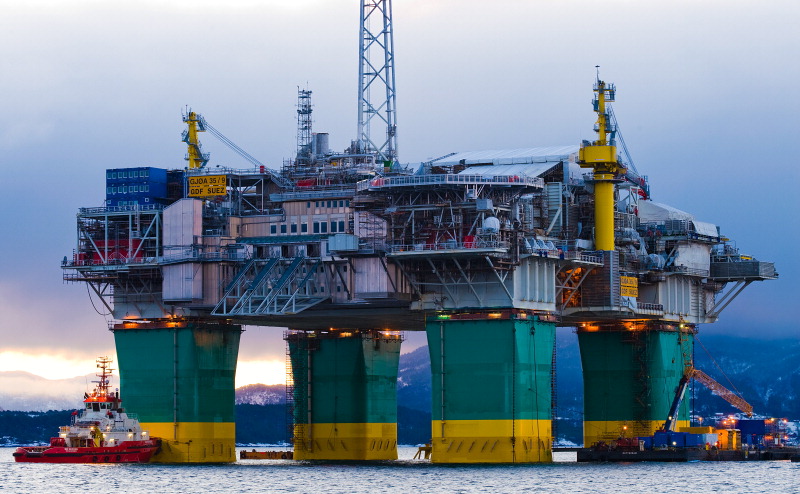
4.1.6 International Exploration & Production
Our strategy is to deliver international growth in the short and medium term from existing positions, while creating new opportunities for long-term value creation.
In our international exploration activities in 2009, we focused on high-grading our portfolio with strict prioritisation and sequencing of the drilling targets. In total, 29 exploration and appraisal wells were completed in 2009 and, at year end, seven wells were announced as discoveries, six of which were completed this year and one was completed last year. At year end, nine wells were pending final evaluation. The total exploration expenses were NOK 11.5 billion in 2009, compared with NOK 9.2 billion in 2008.
Our international entitlement production was 357 mboe per day in 2009, compared with 290 mboe per day in 2008. The average daily equity production of oil and gas was 512 mboe per day in 2009, compared with 465 mboe in 2008.
Equity volumes represent produced volumes under a Production Sharing Agreement (PSA) contract that corresponds to Statoil's percentage ownership in a particular field. Entitlement volumes, on the other hand, represent Statoil's share of the volumes distributed to the partners in the field. They are subject to deductions for, among other things, royalties and the host government's share of profit oil. Entitlement volumes lifted are the basis for revenue recognition, while equity production volumes affect operating costs more directly. Under the terms of a PSA, the amount of profit oil deducted from equity volumes will normally increase with the cumulative return on investment to the partners and/or production from the licence. The distinction between equity and entitlement is relevant to most PSA regimes. The main countries in which we operate under PSAs are Algeria, Angola, Azerbaijan, Libya, Nigeria and Russia.
Our international portfolio has been further strengthened in 2009 through a successful bid for a service contract on the West Qurna 2 field in the second licence round in Iraq. Statoil will hold an 18.75% equity share in the consortium. In early 2010, we increased our equity share in the St. Malo discovery in the US Gulf of Mexico from 6.25% to 21.5% by exercising our pre-emption rights. We also divested our assets on the Danish continental shelf, and our equity share in the Kharyaga field in Russia has been reduced from 40% to 30%. An overview of portfolio transactions in 2009 is presented in article 3.2.1 - Portfolio management.
The total capital expenditure of NOK 39.4 billion in 2009 was lower than last year, mainly due to the acquisition of equity in Peregrino in Brazil and Marcellus Shale acreage in the USA in 2008.
4.1.6.1 Profit and loss analysis
INT generated total revenues of NOK 41.8 billion in 2009 and net operating income of NOK 2.6 billion. The average daily entitlement production of liquids was 283 mboe and the average daily entitlement production of gas was 74 mboe.
| For the year ended 31 December | ||||
IFRS income statement (in NOK billion) | 2009 | 2008 | 2007 | 09-08 change | 08-07 change |
|
|
|
|
|
|
Total revenues and other income | 41.8 | 46.1 | 41.6 | (9 %) | 11% |
|
|
|
|
|
|
Purchase, net of inventory variation | 1.1 | 1.7 | 1.9 | (32 %) | (12 %) |
Operating expenses | 6.7 | 5.6 | 5.4 | 18% | 4% |
Selling, general and administrative expenses | 2.8 | 3.2 | 3.3 | (11 %) | (4 %) |
Depreciation, amortisation and impairment | 17.1 | 13.7 | 11.1 | 25 % |
|
Exploration expenses | 11.5 | 9.2 | 7.7 | 26% | 19% |
Total expenses | 39.2 | 33.3 | 29.4 | 18% | 13% |
Net operating income | 2.6 | 12.8 | 12.2 | (80 %) | 5% |
|
|
|
|
|
|
Operational data: |
|
|
|
|
|
Liquids price (USD/bbl) | 58.4 | 88.7 | 69.1 | (34 %) | 28% |
Liquids price (NOK/bbl) | 366.5 | 499.3 | 404.8 | (27 %) | 23% |
|
|
|
|
|
|
Liftings: |
|
|
|
|
|
Liquids (mboe per day) | 267 | 211 | 250 | 26 % | (16 %) |
Natural gas (mboe per day) | 74 | 59 | 55 | 25 % | 7% |
Total liquids and gas liftings (mboe per day) | 341 | 270 | 305 | 26 % | (12 %) |
|
|
|
|
|
|
Production: |
|
|
|
|
|
Entitlement liquids (mboe per day) | 283 | 232 | 252 | 22 % | (8 %) |
Entitlement natural gas (mboe per day) | 74 | 59 | 55 | 25 % | 7% |
Total entitlement liquids and gas production (mboe per day) | 357 | 290 | 307 | 23 % | (5 %) |
Total equity liquids and gas production (mboe per day) | 512 | 465 | 422 | 10 % | 10% |
We generated total revenues of NOK 41.8 billion in 2009, compared with NOK 46.1 billion in 2008 and NOK 41.6 billion in 2007. The decrease from 2008 to 2009 was mainly related to a 34% decrease in realised liquid and gas prices that made a negative contribution of NOK 14.3 billion. This reduction was partly offset by a 26% increase in the lifted volumes, which contributed positively in the amount of NOK 11.2 billion.
The increase from 2007 to 2008 was mainly related to a 19% increase in realised liquid and gas prices, which contributed NOK 7.7 billion, gains from the sale of assets, and income from affiliated companies which contributed NOK 2.2 billion. This was partly offset by an 11% decrease in the lifted volumes, which made a negatvie contribution of NOK 5.4 billion.
The average daily lifting of liquids was 267 mboe in 2009, compared with 211 mboe in 2008 and 250 mboe in 2007. Over time, the volumes lifted and sold will equal our production of entitlement volumes, but they may be higher or lower in any period due to differences between the capacity and timing of the vessels lifting our volumes and the actual entitlement production in the period. The average daily over/underlift in 2009, 2008 and 2007 was 2 mboe underlift, 4 mboe underlift and 19 mboe overlift, respectively.
The average daily entitlement production of liquids was 283 mboe in 2009, compared with 232 mboe in 2008 and 252 mboe in 2007. The 22% increase in average daily liquids production from 2008 to 2009 was mainly related to the ramp-up of the Agbami field in Nigeria and Saxi-Batuque in Angola, start-up on Tahiti in the Gulf of Mexico and a higher entitlement factor on PSA fields due to lower prices.
The decrease in average daily liquid production from 2007 to 2008 was mainly related to decreased production from ACG in Azerbaijan due to the Central Azeri gas leakage and Kizomba A in Angola coming off plateau, in addition to overall reduced entitlement volumes from PSA fields due to high realised prices. These decreases were partly offset by the start-up of Agbami in Nigeria and the Saxi-Batuque and Mondo fields in Angola.
The average daily entitlement production of gas was 74 mboe in 2009 (equivalent to 12 mmcm or 413 mmcf), compared with 59 mboe in 2008 (equivalent to 9 mmcm or 331 mmcf) and 55 mboe in 2007 (equivalent to 9 mmcm or 309 mmcf). The 25% increase in daily gas production from 2008 to 2009 was mainly related to higher off-take from the In Salah field and increased production from Independence Hub due to extensive hurricane activity in 2008.
The increase in daily gas production from 2007 to 2008 was mainly related to the ramp-up of production from Shah Deniz in Azerbaijan, and the start-up of new gas fields in the GoM in the third and fourth quarters of 2007 (Q, Spiderman, San Jacinto). The increase was partly offset by divestment of the GoM shelf fields with effect from year end 2007 and reduced off-take and a maintenance turnaround on the In Salah field in Algeria.
The average daily equity liquids and gas production was 512 mboe per day in 2009, compared with 465 mboe in 2008 and 422 mboe in 2007.
The unit of production cost based on entitlement volumes was USD 7.2 per boe in 2009, compared with USD 7.6 per boe in 2008 and USD 5.9 per boe in 2007.
Measured in NOK, it was 45.2 per boe in 2009, 42.2 per boe in 2008 and 34.4 in 2007. The 6.3% increase in unit of production cost measured in NOK from 2008 to 2009 is mainly due to the strengthening of USD in relation to NOK and increased preparations for operating activity. These increases were partly offset by a higher entitlement factor due to lower realised oil and gas prices in 2009. The increase in unit of production cost measured in NOK from 2007 to 2008 was mainly due to reduced entitlement production and increased costs related to new fields on stream, increased activity, inflation and industry cost pressure.
Production costs are incurred based on our equity production. Management therefore thinks that unit of production cost based on equity production is a better measure of cost control than unit of production cost based on entitlement volumes. Based on equity volumes, the production cost per boe for the three periods was USD 4.9, USD 4.6 and USD 4.3 respectively. The increase between the years was mainly due to an underlying cost pressure and more expensive fields coming on stream.
The unit of production cost based on equity volumes was USD 4.9 per boe in 2009, compared with USD 4.6 per boe in 2008 and USD 4.3 per boe in 2007. Measured in NOK, it was 30.8 per boe in 2009, 25.9 per boe in 2008 and 25.0 per boe in 2007.
Operating, general and administrative expenses increased by NOK 0.7 billion to NOK 9.5 billion in 2009, compared with NOK 8.8 billion in 2008 and NOK 8.7 billion in 2007.
Depreciation, depletion and amortisation expenses were NOK 17.1 billion in 2009, compared with NOK 13.7 billion in 2008 and NOK 11.1 billion in 2007. The 25% increase from 2008 to 2009 was due to an increase of NOK 4.6 billion in ordinary depreciation, which was mainly due to new assets coming on stream. This increase was partly offset by a NOK 1.2 billion decrease in net impairments, which was mainly due to adverse effects of market conditions in 2008.
The increase in 2008 compared to 2007 was mainly due to an increased net impairment write-down effect of NOK 0.9 billion that was largely related to market conditions, and a NOK 1.7 billion increase in ordinary depreciation that was mainly due to new assets coming on stream and a reduction in the proven reserves estimates in 2008, which form the basis for the unit of production depreciation.
Depreciation, depletion and amortisation | For the year ended 31 December | ||||
(in NOK billion) | 2009 | 2008 | 2007 | 09-08 change | 08-07 change |
Ordinary depreciations | 16.2 | 11.6 | 9.9 | 40 % | 17 % |
Impairments | 2.6 | 3.2 | 1.2 | (19 %) | 167 % |
Reversal of impairments | (1.7) | (1.1) | 0.0 | 55 % | n/a |
Depreciation, depletion and amortisation cost | 17.1 | 13.7 | 11.1 | 25 % | 23 % |
Exploration expenditure was NOK 8.7 billion in 2009, compared with NOK 9.1 billion in 2008 and NOK 8.5 billion in 2007. The decrease from 2008 to 2009 was mainly due to a reduction in seismic spending, reduced drilling activity and lower field evaluation costs. The reduction was partly offset by the strengthening of the USD/NOK exchange rate from 2008 to 2009.
The increase from 2007 to 2008 was mainly due to more expensive wells, higher field evaluation costs and delineation drilling on the oil sands project in Canada.
Exploration | For the year ended 31 December | ||||
(in NOK billion) | 2009 | 2008 | 2007 | 09-08 change | 08-07 change |
Exploration expenditure (activity) | 8.7 | 9.1 | 8.5 | (4 %) | 8% |
Expensed, previously capitalised exploration expenditure | 5.8 | 3.0 | 1.6 | 94% | 88% |
Capitalised share of current period's exploration activity | (3.0) | (2.9) | (2.4) | 4 % | (23 %) |
Exploration expenses | 11.5 | 9.2 | 7.7 | 26 % | 19 % |
Exploration expenses were NOK 11.5 billion in 2009, compared with NOK 9.2 billion in 2008 and NOK 7.7 billion in 2007. The increase from 2008 to 2009 is mainly due to the net impairment effect of capitalised exploration assets of NOK 2.9 billion, partly offset by decreases in drilling activity and seismic spending.
The increase from 2007 to 2008 was mainly due to more expensive wells, higher field evaluation cost and delineation drilling on the oil sands project in Canada as well as net impairment effects that were mainly related to changes in market conditions. The increase was partly offset by an increased capitalisation rate.
In total, 29 exploration and appraisal wells were completed in 2009 and, at year end, seven wells were announced as discoveries, six of which were completed this year while one well was completed last year. At year end, nine wells were pending final evaluation. In 2008, 40 exploration and appraisal wells were completed, eight of which were announced as discoveries. In 2007, 47 exploration and appraisal wells were completed, 18 of which were announced as discoveries.
Net operating income in 2009 was NOK 2.6 billion, compared with NOK 12.8 billion in 2008 and NOK 12.2 billion in 2007. The decrease is mainly related to reduced prices, which contributed negatively in the amount of NOK 14.3 billion, increased depreciation, depletion and amortisation, which contributed NOK 3.4 billion, exploration expenses increasing by NOK 2.3 billion, other income decreasing by NOK 1.2 billion, which was mainly related to the sale of assets and miscellaneous increases of NOK 0.2 billion. This was partly offset by increased lifted volumes, which positively affected the result by NOK 11.2 billion.
The increase from 2007 to 2008 was mainly related to the price effect, which contributed NOK 7.7 billion, and gains from the sale of assets and income from affiliated companies of NOK 2.2 billion and other miscellaneous increases of NOK 0.2 billion, partly offset by decreased entitlement production, which contributed NOK 5.4 billion, increased depreciation, depletion and amortisation of NOK 2.6 billion, and exploration, which contributed NOK 1.5 billion.
4.1.6.2 Outlook
Going forward, we will build on our strong production performance from 2009 and lay the foundation for further medium and long-term growth both by focusing on exploration and by maturing and developing our existing portfolio of projects.
We will have a continued strong focus on exploration and are planning for spending in 2010 on a par with 2009. We expect to drill around 30 international exploration and appraisal wells this year.
All of our projected 2012 production is related to already-sanctioned fields. We expect the Leismer Demonstration project to start production in the fourth quarter 2010.
We will continue to develop and execute new projects in the portfolio with the focus on cost consciousness and capital flexibility.
4.1.7 Natural Gas
The market in 2009 was characterised by falling gas prices and lower demand. Despite the challenging market situation, Natural Gas managed to deliver strong results in 2009.
We experienced a drop in natural gas prices in 2009. Our volume-weighted average price was NOK 1.90 per scm in 2009, a decrease of 21% from 2008. Most gas supply contracts in Europe are indexed to oil products, which means that a change in oil prices will affect the gas markets after a certain time delay (6-9 months). During the second half of 2008, oil prices fell sharply from more than USD 140 per barrel to some USD 40 per barrel. This affected natural gas prices in the second half of 2009.
All of the gas from the NCS sold by the Natural Gas business area is purchased from Exploration & Production Norway (EPN) at a market-based internal price. The drop in natural gas sales prices was thus largely offset by a lower internal purchase price. Our average internal purchase price was NOK 1.38 per scm in 2009, a decrease of 26% from 2008.
Statoil sold 41.4 bcm of entitlement gas in 2009, a slight increase compared with 2008. In addition, we sold 35.3 bcm of NCS gas on behalf of the SDFI. Most of the gas was sold to European energy providers under long-term contracts. Our market share is approximately 20-25% in Germany and France and approximately 15% in the UK and the Netherlands.
During 2009, we have scaled up our trading activities and delivered a record high trading result, which was made possible by our downstream positions and our ability to capitalise on price volatility.
4.1.7.1 Profit and loss analysis
Revenues in Natural Gas mainly come from gas sales under long-term gas sales contracts and tariff revenues from transportation and processing facilities. Natural Gas generated revenues of NOK 98.6 billion in 2009.
| For the year ended 31 December | ||||
IFRS income statement (in NOK billion) | 2009 | 2008 | 2007 | 09-08 change | 08-07 change |
| |||||
Total revenues and other income | 98.6 | 110.8 | 73.5 | (11 %) | 51% |
| |||||
Purchase, net of inventory variation | 62.1 | 80.9 | 56.7 | (23 %) | 43 % |
Operating expenses | 14.4 | 13.8 | 12.3 | 4 % | 13 % |
Selling, general and administrative expenses | 0.8 | 1.3 | 1.1 | (38 %) | 9 % |
Depreciation, amortisation and impairment | 2.8 | 2.3 | 1.8 | 22 % | 25% |
Total expenses | 80.1 | 98.3 | 72.0 | (19 %) | 37% |
Net operating income | 18.5 | 12.5 | 1.5 | 48 % | 739% |
| |||||
Operational data: | |||||
Natural gas sales Statoil entitlement (bcm) | 41.4 | 39.3 | 35.6 | 5 % | 10 % |
Natural gas sales (third-party volumes) (bcm) | 8.4 | 5.9 | 6.4 | 42 % | (8 %) |
Natural gas sales (bcm) | 49.8 | 45.2 | 42.0 | 10 % | 8 % |
Natural gas sales on commission | 1.3 | 1.4 | 0.8 | (7 %) | 79 % |
Natural gas price (NOK/scm) | 1.90 | 2.40 | 1.66 | (21 %) | 45 % |
Transfer price natural gas (NOK/scm) | 1.38 | 1.87 | 1.39 | (26 %) | 34 % |
Regularity at delivery point | 100.0 % | 100.0 % | 100.0 % | 0 % | 0% |
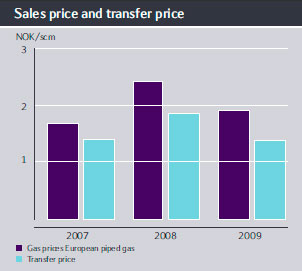

Revenues in Natural Gas mainly come from gas sales under long-term gas sales contracts and tariff revenues from transportation and processing facilities. Natural Gas generated revenues of NOK 98.6 billion in 2009, compared with NOK 110.8 billion in 2008 and NOK 73.5 billion in 2007. The 11% decrease from 2008 to 2009 was mainly due to lower prices for natural gas throughout 2009 compared with 2008, partly offset by a 10% increase in sales volumes.
The 51% decrease in total revenues from 2007 to 2008 was mainly due to the high prices for natural gas throughout 2008, as well as an 8% increase in sales volumes.
Purchase, net of inventory variation decreased by 23% from 2008 to 2009 and increased by 43% from 2007 to 2008. The decrease from 2008 to 2009 is mainly related to a 26% decrease in the transfer price to E&PN. The increase from 2007 to 2008 was mainly related to a 34% increase in the transfer price and higher NCS volumes purchased from E&PN.
Selling, general and administrative expenses in 2009 remained at the same level as in 2008. The 12% increase from 2007 to 2008 was mainly related to increased LNG transportation and increased booking of throughput capacity in Gassled in 2008.
Net operating income was NOK 18.5 billion in 2009, compared with NOK 12.5 billion in 2008. The increase of NOK 6 billion was mainly due to an increased margin between gas sale revenues and gas purchase costs in 2009 compared with 2008, in addition to higher processing and transport income in 2009. The increased margin was a result of the positive contribution from realised trading and optimisation positions in addition to a NOK 2.7 billion gain on derivatives in 2009 compared with a NOK 1.2 billion gain in 2008.
Net operating income for 2008 was NOK 12.5 billion, compared with NOK 1.5 billion in 2007. The increase of NOK 11.0 billion was mainly due to a 45% increase in the volume-weighted average sales price.
Natural Gas has two main business activities: Processing and Transport and Marketing and Trading. Processing and Transport activities consists of our share in Gassled and our role as Technical Service Provider at Kårstø and Kollsnes. Marketing and Trading activities consist of our gas sales and trading activities. The transportation costs associated with the Natural Gas segment, are included in the Marketing and Trading activity.
Net operating income in Processing and Transport was NOK 7.6 billion in 2009, compared with NOK 6.3 billion in 2008. Processing and Transport revenues increased by NOK 1.3 billion due to higher booking in 2009, while fixed operating expenses remained at the same level.
Net operating income in 2008 amounted to NOK 6.3 billion, compared with NOK 5.6 billion in 2007. Processing and Transport revenues increased by NOK 1.1 billion, partly offset by operating expenses, depreciation and impairment, which increased by NOK 0.4 billion.
Net operating income in Marketing and Trading amounted to NOK 10.9 billion in 2009, compared with NOK 6.2 billion in 2008. The increase of NOK 4.7 billion was mainly due to the positive contribution from realised trading and optimisation positions in 2009 in addition to a NOK 2.7 billion gain on derivatives in 2009 compared with a NOK 1.2 billion gain in 2008.
Net operating income in 2008 amounted to NOK 6.2 billion, compared with a loss of NOK 4.1 billion in 2007. The increase of NOK 10.3 billion was mainly due to a 78% increase in the margin between gas sale revenues and gas purchase costs compared with 2007. The increased margin was the result of a 45% increase in the volume-weighted average sales prices in addition to a NOK 1.2 billion gain on derivatives in 2008 compared with a NOK 3.4 billion loss in 2007.
Total natural gas sales were 49.8 bcm (1.76 tcf) in 2009, 45.2 bcm (1.60 tcf) in 2008 and 42.0 bcm (1.48 tcf) in 2007. The 10% increase from 2008 to 2009 in gas volumes sold was due to an increase in both our own and third party volumes.
The 8% increase from 2007 to 2008 in gas volumes sold was mainly due to increased own gas sales, but this was partly offset by a net decrease in Statoil third party volumes.
The weighted average gas price for our sales was NOK 1.90 per scm in 2009, compared with NOK 2.40 per scm in 2008, a decrease of 21%. The decrease in price from 2008 to 2009 was mainly due to a decrease in prices for oil products during the second half of 2008, affecting our long-term gas sales contracts after a delay of six to nine months, as well as to lower gas prices at the National Balancing Point (NBP) in the UK in 2009 than in 2008.
4.1.7.2 Outlook
The reduced demand for gas, from the industrial sector in particular, means that there is currently sufficient supply to meet demand in all the major gas markets. In the longer term, however, the market will probably require new supplies and thus new projects.
The impact of the economic downturn on long-term demand and the development of new gas projects is difficult to assess. The balance between these two factors will determine the development of long-term gas prices.
The short-term gas market is affected by new LNG capacity coming on stream, the success of US gas shale production and by reduced demand for energy. LNG in the Atlantic basin is responding to changes in prices between major markets, taking advantage of arbitrage opportunities. We believe that we have value creation potential through increased gas exports due to the proximity and flexibility of our infrastructure to profitable markets.
In the long term, we continue to have a positive view of gas as an energy source for Europe. Domestic production of gas in the EU continues to decline, while demand for gas is expected to increase in the long term, particularly due to the lower carbon footprint of natural gas compared with oil and coal. The trend for LNG as a link between regional markets is expected to continue as more LNG will come on stream, making gas a commodity that is driven by global development.
Our gas strategy remains firm. In 2010, we plan to focus on extracting maximum value from our long-term gas sales portfolio by maintaining daily supply regularity and continuing to restructure our contracts as part of regular contract revisions. In addition, we will focus on participating in the short-term gas markets in order to add value through balancing, trading and optimisation activities. Business development efforts will be concentrated on commercialising our position in the Shah Deniz field and our newly-acquired gas position in the USA. In combination with Gulf of Mexico production and our LNG regasification capacity position at Cove Point, the position in the Marcellus shale gas acreage will provide a sound basis for continued development of a value-creating US business.
4.1.8 Manufacturing & Marketing
In 2009, we experienced challenging market conditions and a significant decline in refining margins, further emphasising the importance of cost-efficient operations and prudent project selection and execution.
In 2009, we continued the standardisation and simplification process throughout the business area in order to both increase efficiency and reduce our operating costs.
Our total capital expenditure was NOK 6.8 billion in 2009. In addition to the execution of ongoing projects at our refineries, we acquired the long-term lease of the South Riding Point terminal. Capital expenditure was NOK 8.5 billion in 2008 and NOK 4.8 billion in 2007.
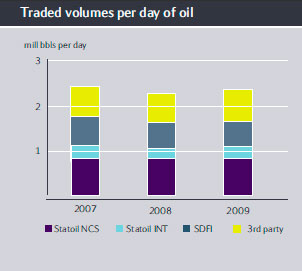
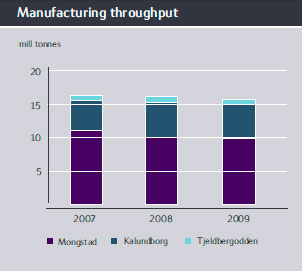
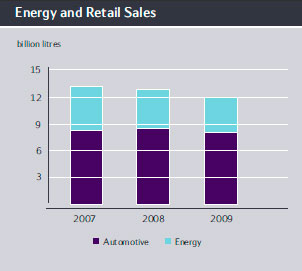
Oil sales, trading and supply
With average crude, condensate and NGL sales of 2.4 mmbbl per day in 2009, we are one of the world's largest net sellers. Of these daily sales, approximately 1.1 mmbbl were our own volumes, 0.7 mmbbl were third party volumes and 0.6 mmbbl were SDFI volumes. Our average sales volume was 2.3 mmbbl per day in 2008, and 2.4 mmbbl per day in 2007.
On 22 October 2009, we completed the acquisition of the long-term lease of the South Riding Point crude oil terminal in the Bahamas. This acquisition was in line with our strategy of strengthening our global trading position by securing physical infrastructure and third party contracts, based on our production in selected regions. Physical activity relates to an actual commodity and does not involve trading in financial instruments. The average daily third party volumes we sold in 2009 totalled 0.70 mmbbl, compared with 0.66 mmbbl in 2008 and 0.66 mmbbl in 2007.
Manufacturing
We reduced refining throughput in 2009 due to low margins, but since maintenance activity was lower than in 2008, the total throughput was slightly higher in 2009. Both Mongstad and Kalundborg also had some unplanned shutdowns during 2009. A gasoil leakage incident occurred at Kalundborg, while Mongstad experienced technical problems in its cracker unit. Tjeldbergodden had low production in 2009 due to depressed methanol market prices and necessary maintenance shutdowns.
Energy and retail
We have maintained our leading energy and retail positions and have the largest or second largest market share in most of the countries in which we operate.
On 1 April 2009, Statoil sold 118 unmanned Swedish Hydro/Uno-X-branded filling stations, 40 unmanned Swedish JET-branded stations and all of the 40 unmanned Norwegian JET-branded station to St1 OY. These sales were in accordance with the terms set by the European Commission when it approved Statoil's acquisition of JET in Norway, Sweden and Denmark.
Statoil's board of directors has decided to consider a new ownership structure for the group's energy and retail business. Listing on the Oslo stock exchange is expected to be the most likely solution, but this would not take place before the fourth quarter of 2010 at the earliest. Should listing be the result of the evaluation process, Statoil will probably consolidate the business on the introduction. The size and time horizon of Statoil's further ownership will be tailored to the new company's development needs. No significant impact on the financial statements is expected on initiation of this new ownership structure.
4.1.8.1 Profit and loss analysis
In Manufacturing & Marketing, total revenues and other income decreased to NOK 351 billion, mainly due to lower oil prices.
| Twelve months ended 31 December | ||||
|
|
|
|
|
|
Income statement (in NOK billion) | 2009 | 2008 | 2007 | 09-08 change | 08-07 change |
|
|
|
|
|
|
Total revenues and other income | 351.2 | 531.3 | 428.1 | (34 %) | 24 % |
|
|
|
|
|
|
Purchase, net of inventory variation | 325.0 | 501.4 | 401.8 | (35 %) | 25 % |
Operating expenses | 10.8 | 14.7 | 12.6 | (27 %) | 16 % |
Selling, general and administrative expenses | 8.3 | 8.6 | 7.0 | (3 %) | 23 % |
Depreciation, amortisation and impairment | 7.8 | 2.1 | 2.8 | 267 % | (25 %) |
Total expenses | 351.8 | 526.8 | 424.2 | (33 %) | 24 % |
Net operating income | (0.5) | 4.5 | 3.9 | (112 %) | 17 % |
|
|
|
|
|
|
Operational data: |
|
|
|
|
|
FCC margin (USD/bbl) | 4.3 | 8.2 | 7.5 | (48 %) | 9 % |
Contract price methanol (EUR/tonne) | 173.0 | 344.0 | 317.0 | (50 %) | 9 % |
Total revenues and other income decreased from NOK 531 billion in 2008 to NOK 351 billion in 2009. The decrease from 2008 to 2009 was mainly due to lower prices for crude and other oil products. The average crude price in USD decreased by approximately 37% in 2009 compared to 2008, but was partly offset by the strengthening of the average USD exchange rate by almost 12%.
The increase from 2007 to 2008 was mainly due to higher prices for crude and other oil products. The average crude price in USD increased by approximately 40% in 2008 compared to 2007 but was partly offset by the weakening of the average USD exchange rate by almost 4%.
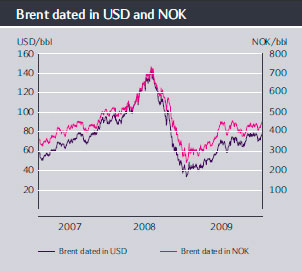
Purchase, net of inventory variation decreased from NOK 501 billion in 2008 to NOK 325 billion in 2009, mainly due to lower prices on volumes purchased. The increase of 25% from 2007 to 2008 was primarily due to increased prices on volumes purchased.
Operating, selling, general and administrative expenses decreased by 18% in 2009 compared with 2008. This was due to lower freight rates, and reversal of the 2008 provision of NOK 1.3 billion related to a take-or-pay contract at Mongstad. Manufacturing incurred increased operating costs in 2009 due to high maintenance activity.
Costs increased by 19% in 2008 compared with 2007. This was due to increased transportation costs of NOK 0.7 billion for shipments of crude made to Asia in 2008, and a provision of NOK 1.3 billion related to a take-or-pay contract at Mongstad. Manufacturing incurred increased operating costs in 2008 due to high maintenance activity. During 2007 there were additional costs associated with provisions for pension liabilities of NOK 0.7 billion included in restructuring costs relating to the merger.
Depreciation, amortisation and impairment totalled NOK 7.8 billion in 2009, compared with NOK 2.1 billion in 2008. The increase was mainly due to an impairment loss of NOK 5.4 billion in 2009 in Manufacturing.
The decrease of 25% in 2008 compared with 2007 was mainly due to an impairment loss of NOK 0.95 billion in 2007 in Energy & Retail Sweden, of which NOK 0.5 billion was included in restructuring costs relating to the merger.
In 2009, the net operating loss was NOK 0.5 billion, compared with a net operating income of NOK 4.5 billion in 2008
and NOK 3.9 billion in 2007. The net operating loss in 2009 was impacted by impairment loss on refinery assets (NOK 5.4 billion), loss on inventory hedge positions which do not qualify for hedge accounting (NOK 2.0 billion), restructuring costs in Energy and Retail (NOK 0.2 billion), currency effect on the value of inventories in commercial storage (NOK 0.2 billion), and lower refining margins and methanol prices. Positive effects in 2009 were a gain from price change on our operational storage (NOK 2.1 billion), reversal of a take-or-pay contract provision (NOK 1.3 billion), strong trading results and improved retail margins.
The net operating income in 2008 was impacted by a positive currency effect on the value of inventories in commercial storage (NOK 3.3 billion), and a gain on inventory hedge positions which do not qualify for hedge accounting (NOK 0.8 billion). Negative effects in 2008 were loss from price change on our operational storage (NOK 2.8 billion), a take-or-pay contract provision (NOK 1.3 billion), restructuring costs in Energy and Retail (NOK 0.5 billion) and lower results in Manufacturing and Energy and Retail.
The net operating income in 2007 was impacted by a gain from price change on our operational storage (NOK 1.5 billion). Negative effects in 2007 were currency effect on the value of inventories in commercial storage (NOK 1.4 billion), loss on inventory hedge positions which do not qualify for hedge accounting (NOK 1.1 billion), restructuring and impairment costs in Energy and Retail (NOK 1.1 billion) and pension cost provisions (NOK 0.7 billion).
Oil sales, trading and supply
In 2009, net operating income was NOK 3.7 billion, compared with NOK 4.2 billion in 2008 and NOK 1.4 billion in 2007. The net operating income in 2009 was impacted by a gain from price change on our operational storage (NOK 2.1 billion) and strong trading results, especially within product and gas liquids trading. Negative effects in 2009 were loss on inventory hedge positions which do not qualify for hedge accounting (NOK 2.0 billion), and currency effect on the value of inventories in commercial storage (NOK 0.2 billion).
The net operating income in 2008 was impacted by a positive currency effect on the value of inventories in commercial storage (NOK 3.3 billion), and a gain on inventory hedge positions which do not qualify for hedge accounting (NOK 0.8 billion) and improved overall trading results. Negative effects in 2008 were loss from price change on our operational storage (NOK 2.8 billion), and negative results within product trading, leading to a scaling down of product trading by the end of the year.
The net operating income in 2007 was impacted by a gain from price change on our operational storage (NOK 1.5 billion). Negative effects in 2007 were a currency effect on the value of inventories in commercial storage (NOK 1.4 billion), and loss on inventory hedge positions which do not qualify for hedge accounting (NOK 1.1 billion).
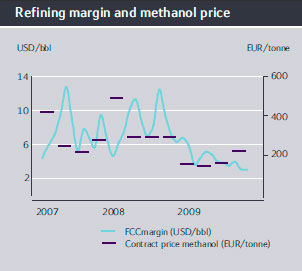
Manufacturing
In 2009, net operating loss was NOK 5.3 billion, compared with positive net operating income of NOK 0.7 billion in 2008 and NOK 3.3 billion in 2007. The net operating loss in 2009 was impacted by impairment loss on the Mongstad and Kalundborg refinery assets (NOK 5.4 billion), low refining margins and high operating costs due to the increased activity levels in maintenance and modification. Both the average refining margin and the contract price for methanol decreased by approximately 50% in 2009. A positive effect in 2009 was reversal of a take-or-pay contract provision (NOK 1.3 billion).
The net operating income in 2008 was impacted by a take-or-pay contract provision (NOK 1.3 billion), a large turnaround at Mongstad, and high operating costs due to the increased activity levels in maintenance, modifications and business development. Margins were low at Mongstad due to the turnaround, but improving at Kalundborg due to the fuel reduction project and good feedstock optimisation. Both the average refining margin and the contract price for methanol increased by 9% in 2008.
The net operating income in 2007 was impacted by strong refining margins, combined with high refinery reliability and utilisation.
Energy and retail
In 2009, net operating income was NOK 1.3 billion, compared with a net operating loss of NOK 0.2 billion in 2008 and NOK 0.0 billion in 2007. The net operating income in 2009 was impacted by improved retail margins. Negative effects in 2009 were restructuring costs (NOK 0.2 billion), and lower fuel and convenience sales volumes.
The net operating income in 2008 was impacted by loss from price change for our operational storage (NOK 0.4 billion), restructuring costs (NOK 0.5 billion), lower non fuel margins and volumes, and increased operating costs.
The net operating income in 2007 was impacted by restructuring and impairment costs in Sweden (NOK 1.1 billion).
4.1.8.2 Outlook
Worldwide demand for oil products should increase during 2010, whilst global refinery overcapacity is expected to continue for several years to come, maintaining pressure on refining margins.
We believe that retail volumes will increase, but that there will be a reduction in marginsOil sales, trading and supply
We expect the global demand for oil products to recover during 2010. As the global economy remains in a fragile state, a return to pre-recession demand levels is not imminent. In the mid to long term, we expect that efficiency gains in the transportation sector will continue to lead to falling demand for oil products in both Europe and the US, with any future growth coming mainly from developing economies, especially in Asia and the Middle East. The fall in demand is also driven by long-term demographic trends. Diesel demand, relative to gasoline is expected to continue to increase in Europe. This will lead to an increasing surplus of gasoline in Europe for exportation, but with the "traditional" export market of the US also expected to move into surplus, this European surplus will have to be exported greater distances. The increasing demand for diesel and jet fuel will also impact upon optimal refinery configuration and product margins.
In the longer term, we expect the oil market to be supply constrained, and as the availability of conventional, light crudes continues to decline, there should be increasingly strong incentives for refineries to process heavy and extra heavy crude oils such as Canadian bitumen.
We anticipate that a strong increase in global Gas Liquids supply (due to higher gas production in North Africa, the Middle East), will lead to a 'buyers market'. The increased LPG volumes are expected to be used mainly as feedstock for petrochemical production while some volumes could also be used within the transportation fuel sector.
Manufacturing
The outlook for the refinery industry continues to be challenging, with the low-margin environment we experienced in 2009 expected to continue for some time. In the short term, we see that the drop in demand has led to refinery overcapacity and subsequent pressure on margins. This situation is exacerbated due to the start up of several export refineries in the Far East and Middle East. In the longer term, the overcapacity in the Atlantic Basin refining capacity could lead to capacity closures in Europe. The most likely candidates for closure would probably be smaller refineries with less ability to convert heavy crudes into transportation fuels.
New fuel standards which will require traceability and the reporting of GHG emissions from all fuel types (and possibly introducing minimum standards) are currently being developed in the EU and are also proposed in the US. In future, we expect profitability to depend on location and the flexibility to process different crudes.
Energy and retail
As regards our local transportation fuel markets where Statoil is an active retailer, margins are currently relatively healthy, although the market is experiencing a reduction in volumes and sales of non-fuel goods as a result of the economic downturn. In 2010 and going forward, we expect the markets to slowly recover to a more normal state, with decreased margins but slightly increased volumes, both for transportation fuel and convenience goods. Medium to long-term growth in the transportation fuel sector will be driven by the anticipated growth in the diesel sector. The longer-term perspective is more uncertain. There is consolidation in the market, which could lead to margins being maintained, but the threshold is lower for new entrants to the automated stop sector in particular. In the long-term, we should expect increased competition from alternative fuels (biofuel, electricity, gas etc). Biofuels' market share of transportation fuel has increased sharply in recent years and it is expecte d to continue to be an important blending component. Threats and opportunities and the pace of development in the different markets could vary significantly depending on the strength of government regulation and tax incentives.
4.1.9 Eliminations and other operations
Eliminiations and other operations for the years ending 31 December 2009, 2008 and 2007.
Other operations consist of the activities of Corporate Services, Corporate Centre, Group Finance and the two corporate technical service providers, Technology and New Energy, and Projects.
In connection with our other operations, we recorded a net operating loss of NOK 1.1 billion in 2009, compared with a loss of NOK 0.7 billion in 2008 and a loss of NOK 2.3 billion in 2007. The increase in net operating loss is mainly related to a gain from the sale of IS Partner AS recorded in 2008.
The decrease from 2007 to 2008 was primarily due to the gain on the sale of IS Partner AS in 2008 and the fact that no provisions were made for early retirement costs and other restructuring costs in 2008, compared with 2007, when provisions were made for early retirement and pension benefits due to the merger. The increase was partly offset by increased costs because of higher activity.
4.1.10 Definitions of reported volumes
Here we explain some of the terms used when reporting our volumes, such as lifted entitlement volumes, equity volumes, entitlement volumes and proved reserves.
Volumes that explain revenues
In explaining revenues and changes in revenues, we report lifted entitlement volumes. This is because we can only recognise income from volumes to which we have legal title, and such title typically arises upon lifting (i.e. loading onto a vessel) of the volumes. Under a Production Sharing Agreement (PSA), we are only entitled to receive and sell certain parts of the volumes produced, and we therefore refer to entitlement volumes for revenue recognition purposes. The difference between equity and entitlement volumes is described in more detail below.
Volumes of lifted liquids (crude oil, condensate and natural gas liquids) and natural gas correlate with production over time, but they may be higher or lower than entitlement production for the period due to operational factors that affect the timing of when Statoil-chartered vessels lift the liquids from the fields. Volumes of natural gas produced on the NCS are deemed to be equal to lifted volumes of natural gas from the NCS.
Volumes of lifted liquids and natural gas may be sold or put into storage. The volumes that give rise to revenues from the sale of liquids and natural gas in the period are therefore equal to lifted volumes plus changes in inventories of liquids and natural gas.
Volumes that explain operating expenses
In explaining operating expenses, in total and production cost per barrel of oil equivalents, we believe that produced (equity) volumes are a better indicator of activity levels than lifted volumes. Moreover, we believe that equity volumes are a better indicator of the activity level under PSAs than entitlement volumes, since our capital expenditure and operating expenses under such contracts are linked to equity volumes produced rather than to entitlement volumes received.
Equity volumes represent produced volumes that correspond to Statoil's percentage ownership interest in a particular field. Entitlement volumes, on the other hand, represent Statoil's share of the volumes distributed under a PSA to the partners in the field, which are subject to deductions for, among other things, royalties and the host government's share of profit oil. Under the terms of a PSA, the amount of profit oil deducted from equity volumes will normally increase with the cumulative return on investment to the partners and/or production from the licence. The distinction between equity and entitlement is relevant to most PSA regimes. The main countries in which we operate under PSAs are Algeria, Angola, Azerbaijan, Libya, Nigeria and Russia.
Volumes of proved reserves
Proved reserves are entitlement volumes recognised as reserves in accordance with SEC Rule 4-10 (a) and relevant guidance. They represent volumes that with reasonable certainty will be produced and to which we will have entitlement in the future. See section 3.9 Operational review - Proved oil and gas reserves and note 35 - Supplementary oil and gas information in the Consolidated Financial Statements in this report, for details about how we measure and report on proved reserves.
4.2 Liquidity and capital resources
4.2.1 Review of cash flows
The cash flow from operating activities was NOK 73.0 billion in 2009. As of 31 December 2009, the debt ratio was 27.3% and we had liquid assets of NOK 31.7 billion.
| For the year ended 31 December | ||||
Condensed cash flow statement (in NOK billion) | 2009 | 2008 | 2007 | Change 08-09 | Change 07-08 |
|
|
|
|
|
|
Cash flows from underlying operations | 181.9 | 239.9 | 195.7 | (57.9) | 44.1 |
Cash flows from (to) changes in working capital | (5.7) | 1.3 | 0.5 | (7.0) | 0.8 |
Taxes paid | (100.5) | (139.6) | (102.4) | 39.1 | (37.2) |
Other changes | (2.8) | 0.9 | 0.1 | (3.7) | 0.8 |
Cash flows provided by operations | 73.0 | 102.5 | 93.9 | (29.5) | 8.6 |
|
|
|
|
|
|
Acquisitions | 0.0 | (13.1) | 0.0 | 13.1 | (13.1) |
Additions to PP&E and intangible assets | (75.2) | (76.2) | (75.5) | 1.0 | (0.6) |
Proceeds from sales | 1.4 | 5.4 | 1.1 | (3.9) | 4.3 |
Other changes | (1.6) | (1.9) | (0.7) | 0.3 | (1.3) |
Cash flows used in investing activities | (75.4) | (85.8) | (75.1) | 10.5 | (10.7) |
|
|
|
|
|
|
Net change in long-term borrowing | 41.4 | (0.3) | (1.2) | 41.7 | 0.9 |
Net change in short-term borrowing | (7.1) | 10.5 | 0.8 | (17.6) | 9.7 |
Dividends paid | (23.1) | (27.1) | (25.7) | 4.0 | (1.4) |
Other changes | 0.1 | (0.1) | 18.1 | 0.2 | (18.3) |
Cash flows from (used in) financing activities | 11.3 | (17.0) | (7.9) | 28.3 | (9.1) |
|
|
|
|
|
|
Net increase (decrease) in cash flows | 8.9 | (0.3) | 10.9 | 9.3 | (11.2) |
Cash flows from operating activities
Statoil's primary source of cash flow consists of funds generated from operations. The cash flow from operating activities amounted to NOK 73 billion in 2009, compared with NOK 102.5 billion in 2008. The decrease of NOK 29.5 billion was primarily due to a NOK 57.9 billion decrease in cash flows from underlying operations, an increase of NOK 7.0 billion in cash flows used as working capital and a decrease of NOK 3.7 billion in cash flows used for non-current items related to operating activities. These effects were partly offset by a decrease of NOK 39.1 billion in taxes paid.
The cash flow from operating activities was NOK 102.5 billion in 2008, compared with NOK 93.9 billion in 2007. The increase of NOK 8.6 billion was due to an increase in cash flows from underlying operations of NOK 44.1 billion and cash flows of NOK 0.8 billion from other non-current items related to operating activities and NOK 0.8 from changes in working capital. . These effects were partly offset by an increase of NOK 37.2 billion in taxes paid.
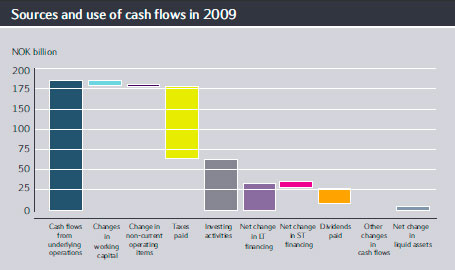
Cash flows used in investing activities amounted to NOK 75.4 billion in 2009, a decrease of NOK 10.5 billion from 2008. The decrease mostly stems from acquisitions paid for in 2008, partly offset by a reduction of NOK 3.9 billion in proceeds from sales.
Approximately 55% of the investments in 2009 were investments in assets expected to contribute to growth in oil and gas production, while approximately 35% relate to investments in currently producing fields. The remaining 10% represent investments in Statoil's other activities.
The cash flow used in investing activities was NOK 85.8 billion in 2008, compared with NOK 75.1 billion in 2007. The increase of NOK 10.7 billion was largely related to NOK 13.1 billion in acquisitions, for the most part related to the purchase of the remaining 50% share of the Peregrino development, NOK 3.6 billion in increased investments in other intangible assets and NOK 2.3 billion in increased capitalisation of exploration expenditures, partly offset by a reduction of NOK 5.3 billion in investments in property, plant and equipment and NOK 4.3 billion in higher proceeds from sales of assets.
Approximately 50% of the investments in 2008 were investments in assets expected to contribute to growth in oil and gas production, while approximately 35% relate to investments in currently producing fields. The remaining 15% represent investments in Statoil's other activities.
Gross investments are defined as additions to property, plant and equipment (including intangible assets and long-term share investments) and capitalised exploration expenditure. Gross investments amounted to NOK 85.0 billion in 2009, compared with NOK 95.4 billion in 2008 and NOK 75.0 billion in 2007.
| For the year ended 31 December | ||||
Gross investments (in NOK billion) | 2009 | 2008 | 2007 | 09-08 change | 08-07 change |
|
|
|
|
|
|
- E&P Norway | 34.9 | 34.9 | 31.1 | (0 %) | 12 % |
- International E&P | 39.4 | 48.7 | 36.2 | (19 %) | 35 % |
- Natural Gas | 2.6 | 2.0 | 2.1 | 29 % | (6 %) |
- Manufacturing & Marketing | 6.8 | 8.5 | 4.8 | (20 %) | 76 % |
- Other | 1.3 | 1.3 | 0.8 | 3 % | 73 % |
|
|
|
|
|
|
Gross investments | 85.0 | 95.4 | 75.0 | (11 %) | 27 % |
Gross investments in 2008 were higher than in 2007 and 2009 due to significant investments that year, most notably in the remaining 50% share of the Peregrino development off the coast of Brazil and the investment in a 32.5% share of the Marcellus shale gas development in the USA. Moreover, gross investments increased in 2009 compared with previous years due to the capitalisation of a financial lease contract.
Cash flows used in investing activities are reconciled with gross investments in the table below. In 2009, the difference between cash flows used in investing activities and gross investments is largely related to financial lease whereas, in 2008, the difference was mostly related to proceeds from sales of assets and other changes in non-current loans granted and joint venture activities.
| For the year ended 31 December | ||
Reconciliation of cash flow to gross investments (in NOK billion) | 2009 | 2008 | 2007 |
|
|
|
|
Cash flows to investments | 75.4 | 85.8 | 75.1 |
Proceeds from sales of assets | 1.4 | 5.4 | 1.1 |
Financial lease | 6.9 | 0.3 | 0.0 |
Other changes in non-current loans granted and JV balances | 1.3 | 3.9 | (1.2) |
|
|
|
|
Gross investments | 85.0 | 95.4 | 75.0 |
Cash flows related to financing activities
Net cash flows from financing activities for 2009 amounted to NOK 11.3 billion, compared with cash flows used in financing activities of NOK 17.0 billion for 2008. The change of NOK 28.3 billion was mainly related to NOK 41.7 billion in net changes in long-term borrowing, NOK 4.0 billion less dividend paid in 2009, partly offset by the repayment of short-term borrowings in the amount of NOK 7.1 billion in 2009, compared with an increase of NOK 10.5 billioni n short-term borrowings in 2008.
New long-term borrowings in 2009 amounted to NOK 46.3 billion due to the need to ensure a level of financial flexibility in a lower oil-price environment, compared with NOK 2.6 billion in 2008. NOK 4.9 billion in long-term debt was repaid in 2009, compared with NOK 2.9 billion in 2008.
Cash flows used in financing activities in 2009 included a dividend of NOK 23.1 billion paid by Statoil ASA to shareholders related to the annual accounts for 2008, while the dividend paid by Statoil ASA to its shareholders in 2008 relating to the annual accounts for 2007 amounted to NOK 27.1 billion.
Net cash flows used in financing activities in 2008 amounted to NOK 17.0 billion, compared with NOK 7.9 billion in 2007. The increase of NOK 9.1 billion was mainly related to a settlement of the demerger balance with Norsk Hydro of NOK 18.7 billion, combined with an increase in dividend paid of NOK 1.4 billion. These effects were partly offset by increased current financial liabiliites of NOK 10.5 billion in 2008, mainly related to collateral on financial counterparties and commercial papers.
New long-term borrowings at 31 December 2008 amounted to NOK 2.6 billion, compared with NOK 1.7 billion at 31 December 2007. The repayment of long-term debt at 31 December 2008 was NOK 2.9 billion compared with NOK 2.9 billion at 31 December 2007. Cash flows used in financing activities in 2008 included a dividend of NOK 27.1 billion paid by Statoil ASA to shareholders related to the annual accounts for 2007, while the dividend paid by Statoil ASA to its shareholders in 2007 relating to the annual accounts for 2006 was NOK 25.7 billion.
4.2.2 Selected balance sheet information
The following tables contain selected financial information related to our balance sheet and financial ratios that form part of the basis for the subsequent analysis of financial assets and liabilities.
| For the year ended 31 December | ||
Selected financial data - Balance sheet (in NOK billion) | 2009 | 2008 | 2007 |
|
|
|
|
ASSETS |
|
|
|
Non-current assets |
|
|
|
Property, plant and equipment | 340.8 | 329.8 | 278.4 |
Intangible assets | 54.3 | 66.0 | 44.9 |
Investments in associated companies | 10.1 | 12.6 | 8.4 |
Deferred tax assets | 2.0 | 1.3 | 0.8 |
Pension assets | 2.7 | 0.0 | 1.6 |
Financial investments | 13.3 | 16.5 | 15.3 |
Derivative financial instruments | 17.6 | 21.3 | 12.8 |
Financial receivables | 5.7 | 4.9 | 3.5 |
Total non-current assets | 446.5 | 452.5 | 365.6 |
|
|
|
|
Current assets |
|
|
|
Inventories | 20.2 | 15.2 | 17.7 |
Trade and other receivables | 58.9 | 69.9 | 69.2 |
Current tax receivables | 0.2 | 3.8 | 0.2 |
Derivative financial instruments | 5.4 | 9.4 | 8.8 |
Financial investments | 7.0 | 9.7 | 3.4 |
Cash and cash equivalents | 24.7 | 18.6 | 18.3 |
Total current assets | 116.4 | 126.7 | 117.5 |
TOTAL ASSETS | 562.8 | 579.2 | 483.1 |
| For the year ended 31 December | ||
Selected financial data - Balance sheet (in NOK billion) | 2009 | 2008 | 2007 |
|
|
|
|
EQUITY AND LIABILITIES |
|
|
|
Equity |
|
|
|
Share capital | 8.0 | 8.0 | 8.0 |
Treasury shares | (0.0) | (0.0) | (0.0) |
Additional paid-in capital | 41.7 | 41.4 | 41.4 |
Add. paid-in cap. rel.to treasury shares | (0.8) | (0.6) | (0.4) |
Retained earnings | 145.9 | 148.0 | 140.9 |
Other reserves | 3.6 | 17.3 | (12.6) |
Statoil shareholder's equity | 198.3 | 214.1 | 177.3 |
Non-controlling interests | 1.8 | 2.0 | 1.8 |
Total equity | 200.1 | 216.1 | 179.1 |
|
|
|
|
Non-current liabilities |
|
|
|
Financial liabilities | 96.0 | 54.6 | 44.4 |
Derivative financial instruments | 1.7 | 1.6 | 0.0 |
Deferred tax liabilities | 76.3 | 68.1 | 67.5 |
Pension liabilities | 21.1 | 25.5 | 19.1 |
Asset retirement obligations, other provisions ans other liabilities | 55.8 | 54.4 | 43.8 |
Total non-current liabilities | 250.9 | 204.3 | 174.8 |
|
|
|
|
Current liabilities |
|
|
|
Trade and other payables | 59.8 | 61.2 | 64.6 |
Current tax payable | 41.0 | 57.1 | 50.9 |
Financial liabilities | 8.1 | 20.7 | 6.2 |
Derivative financial instruments | 2.9 | 19.9 | 7.5 |
Total current liabilities | 111.8 | 158.9 | 129.2 |
Total liabilities | 362.7 | 363.1 | 304.0 |
TOTAL EQUITY AND LIABILITIES | 562.8 | 579.2 | 483.1 |
| Year ended 31 December | ||
Other financial information | 2009 | 2008 | 2007 |
Net debt to capital employed (GAAP basis) (1) | 26.6 % | 17.8 % | 13.9 % |
Net debt to capital employed (2) | 27.3 % | 17.5 % | 12.4 % |
After-tax return on average capital employed (GAAP basis) (3) | 10.4 % | 21.0 % | 17.7 % |
Ratio of earnings to fixed charges (4) | 7.1 | 52.1 | 19.6 |
|
|
|
|
(1) As calculated according to GAAP. Net debt to capital employed is the net debt divided by capital employed. Net debt is interest-bearing debt less cash and cash equivalents and short-term investments. Capital employed is net debt, shareholders’ equity and minority interest. | |||
|
|
|
|
(2) As adjusted. In order to calculate the net debt to capital employed ratio that our management makes use of internally and which we report to the market, we make adjustments to capital employed as it would be reported under GAAP to adjust for project financing exposure that does not correlate to the underlying exposure and to add into the capital employed measure interest-bearing elements which are classified together with non-interest-bearing elements under GAAP. See report section 4.3 Financial analysis and review - Non-GAAP measures for a reconciliation of capital employed and a description of why we make use of this measure. | |||
|
|
|
|
(3) As calculated in accordance with GAAP. After-tax return on average capital employed (ROACE) is equal to net income before minority interest and before after-tax net financial items, divided by average capital employed over the last 12 months. | |||
|
|
|
|
(4)Based on IFRS. For the purpose of these ratios, earnings consist of the income before (i) tax, (ii) minority interest, (iii) amortization of capitalized interest and (iv) fixed charges (which have been adjusted for capitalized interest) and after adjustment for unremitted earnings from equity accounted entities. Fixed charges consist of interest (including capitalized interest) and estimated interest within operating leases. | |||
4.2.3 Financial assets and liabilities
Gross financial liabilities amounted to NOK 104.1 billion, while net financial liabilities were NOK 75.3 billion at 31 December 2009. The net debt to capital employed ratio was 27.3% at 31 December 2009.
Current items
Current items (total current assets minus total current liabilities) were positive in the amount of NOK 4.6 billion at 31 December 2009, while they were negative by NOK 32.2 billion at 31 December 2008.
The increase of NOK 36.8 billion was due to a decrease in current liabilities such as NOK 16.1 billion in taxes payable, NOK 12.5 billion in financial liabilities and NOK 17.0 billion in derivative financial instruments, and an increase in cash and cash equivalents of NOK 6.1 billion, partly offset by a decrease in accounts receivable of NOK 13.6 billion.
Current items (total current assets minus total current liabilities) were negative by NOK 14.9 billion at 31 December 2008, while they were positive by NOK 0.4 billion at 31 December 2007.
The decrease of NOK 15.3 was mainly due to an increase in current liabilities, such as NOK 3.8 billion in accounts payable, NOK 6.1 billion in taxes payable, NOK 13.1 billion in derivatives, NOK 7.7 billion in collateral, NOK 3.0 billion in commercial papers and a current portion of non-financial liabilities of NOK 4.0 billion, in combination with a decrease in inventories of NOK 2.5 billion. These factors were partly offset by a decrease in accounts payable with related parties of NOK 7.2 billion in combination with an increase in current assets such as NOK 2.9 billion in accounts receivable, NOK 1.0 billion in joint venture receivables, NOK 6.4 billion in derivatives and current financial investments of NOK 6.4 billion.
We believe that given Statoil's established liquidity reserves (including committed credit facilities) and Statoil's credit rating and access to capital markets, Statoil has sufficient working capital for its foreseeable requirements. Our main sources of liquidity are described below.
Liquidity
Our annual cash flow from operations is highly dependent on oil and gas prices and our levels of production. It is only influenced to a small degree by seasonality and maintenance turnarounds. Fluctuations in oil and gas prices, which are outside our control, will cause changes in our cash flows. We will use available liquidity to finance Norwegian petroleum tax payments (due on 1 February, 1 April, 1 June, 1 August, 1 October and 1 December each year), any dividend payment and investments. Our investment programme is spread over the year. There may be a gap between funds from operations and funds required to fund investments, which will be financed by short and long-term borrowings. We aim to keep ratios relating to net debt at levels consistent with our objective of maintaining our long-term credit rating at least within the single A category. In this context, Statoil carries out various risk assessments, some of them in line with financial matrices used by S&P and Moody's, such as free cash flow from operations over net debt and net debt to capital employed.
Our long-term and short-term ratings from Moody's are Aa2 and P-1, respectively. Our long-term rating from Standard & Poor's was raised to AA- in August 2007, reflecting the majority ownership by the Norwegian State. Standard & Poor's short-term rating of Statoil is A-1+. The current rating outlook is "Stable" from both agencies.
As of 31 December 2009, we had liquid assets of NOK 31.7 billion, including NOK 24.7 billion in cash and cash equivalents and NOK 7.0 billion of current financial investments (domestic and international capital market investments). Approximately 46% of our liquid assets were held in NOK-denominated assets, 26% in USD, 14% in EUR and 15% in other currencies (GBP, CAD, BRL), before the effect of currency swaps and forward contracts.
As of 31 December 2008, we had liquid assets of NOK 28.4 billion, including NOK 18.6 billion in cash and cash equivalents and NOK 9.7 billion of current financial investments (domestic and international capital market investments). Approximately 29% of our liquid assets were held in EUR-denominated assets, 6% in NOK and 58% in USD, 3% in GBP and 4% in other currencies, before the effect of currency swaps and forward contracts.
Compared with year end 2008, current financial investments decreased by NOK 2.7 billion during 2009, and cash and cash equivalents increased by NOK 6.1 billion. The increase in liquid assets during 2009 was mainly due to new long-term debt.
Our general policy is to maintain a liquidity reserve in the form of cash and cash equivalents on our balance sheet, and committed, unused credit facilities and credit lines in order to ensure that we have sufficient financial resources to meet our short-term requirements. Long-term funding is raised when we identify a need for such financing based on our business activities and cash flows, as well as when market conditions are considered favourable.
As of 31 December 2009, the group had USD 2.0 billion available in a committed revolving credit facility from international banks, including a USD 500 million swing-line facility. The facility was entered into by us in 2004, and, after exercising an extension option in 2006, it is available for drawdowns until December 2011. At year end 2008, no amounts had been drawn under the revolving credit facility. In 2008 we drew down a line of credit established in our favour on a bilateral basis by an international financial institution. The loan is denominated in USD and has a final maturity of five years.
To secure necessary financial flexibility, Statoil ASA issued new bonds in 2009 of GBP 800 million due in March 2031, EUR 1.2 billion due in March 2021, EUR 1.3 billion due in March 2015, USD 0.5 billion due in April 2014, USD 1.5 billion due in April 2019 and USD 0.9 billion due in October 2014, aggregating to a total of NOK 46.3 billion.
In 2010, Statoil will continue to secure necessary financial flexibility and, depending, among other things, on oil and gas price developments, it may issue bonds should market conditions be viewed as attractive. See section 5.2.1 Risk review - Risk management - Managing financial risk - for more information about liquidity.
Gross interest-bearing financial liabilities
Gross interest bearing financial liabilities were NOK 104.1 billion at 31 December 2009, compared with NOK 75.3 billion at 31 December 2008. The NOK 28.8 billion increase was due to a combination of increased non-current financial liabilities of NOK 41.4 billion and decreased current financial liabilities of NOK 12.5 billion.
The increase in non-current financial liabilities was mostly attributable to the issuing of new bonds of GBP 800 million due in March 2031, EUR 1.2 billion due in March 2021, EUR 1.3 billion due in March 2015, USD 0.5 billion due in April 2014, USD 1.5 billion due in April 2019 and USD 0.9 billion due in October 2014, aggregating to a total of NOK 46.3 billion, in combination with a new financial lease of NOK 8.9 billion relating to a leased FPSO and energy plant currently in the construction phase, partly offset by the repayment of loans of NOK 4.9 billion.
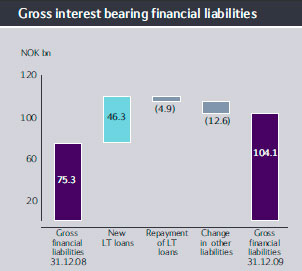
Gross interest-bearing financial liabilities were NOK 75.3 billion at year end 2008, compared with NOK 50.5 billion at the end of 2007. The increase of NOK 24.8 billion was mainly related to an increase of NOK 10.2 billion in non-current financial liabilities due to the weakening of the NOK versus the USD (NOK 1.59). In addition, cash collateral on financial counterparties and commercial papers increased by NOK 7.3 billion and NOK 3.0 billion, respectively, in 2008.
For risk management purposes, currency swaps are used to ensure that Statoil keeps long-term interest-bearing debt in USD. As a result, most of the group's non-current financial liabilities are exposed to changes in the USD/NOK exchange rate.
Net interest-bearing financial liabilities
Net interest-bearing financial liabilities amounted to NOK 75.3 billion at 31 December 2009, compared with NOK 46.0 billion at 31 December 2008. The change of NOK 29.3 billion was mainly related to an increase in gross financial liabilities of NOK 28.8 billion, in combination with an increase in cash, cash equivalents and current financial investments of NOK 3.4 billion, partly offset by changed adjustments of NOK 2.9 billion.
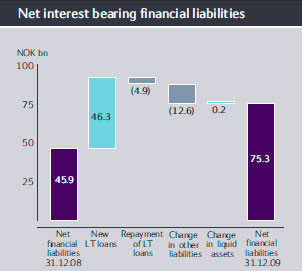
The net debt to capital employed ratio
The net debt to capital employed ratio before adjustments, defined as net interest-bearing debt in relation to capital employed, was 26.6% in 2009, compared with 17.8% in 2008 and 13.9% in 2007.
The adjusted net debt to capital employed ratio was 27.3% as of 31 December 2009, compared with 17.5% as of 31 December 2008. The 9.8% increase was mainly related to an increase in net financial liabilities of NOK 29.3 billion, in combination with an increase in capital employed of NOK 13.1 billion. (See report section 4.3.3 Financial analysis and review -Non-GAAP measures-Net debt to capital employed ratio for more information.)
Our method of calculating the net debt to capital employed ratio includes certain adjustments to net debt and capital employed, and it may therefore be considered to be a non-GAAP financial measure.
The net debt to capital employed ratio was 17.5% as of 31 December 2008, compared with 12.4% as of 31 December 2007. The 5.1% increase was mainly related to an increase of NOK 20.5 billion in net financial liabilities, partly offset by an increase of NOK 6.8 billion in cash equivalents and current financial investments.
The group's borrowing needs are mainly covered through the issuing of short-term and long-term securities, including utilisation of a US Commercial Paper Programme and a Euro Medium Term Note (EMTN) Programme (the limits of the programme being USD 4 billion and USD 6 billion, respectively), and through draw-downs under committed credit facilities and credit lines. After the effect of currency swaps, 100% of our borrowings are in USD.
Our financial policies take into consideration funding sources, the maturity profile of long-term debt, interest rate risk management, currency risk and the management of liquid assets. Our borrowings are denominated in various currencies and swapped into USD, since the largest proportion of our net cash flow is denominated in USD. In addition, we use interest rate derivatives, primarily consisting of interest rate swaps, to manage the interest rate risk of our long-term debt portfolio.
New long-term borrowings totalled NOK 46.3 billion in 2009 and NOK 2.6 billion in 2008. The repayment of long-term debt at 31 December 2009 was NOK 4.9 billion, compared with NOK 2.9 billion at 31 December 2008.
The company's central finance function manages the funding, liability and liquidity activities at group level based on adopted financial policies.
Cash, cash equivalents and current financial investments were NOK 31.7 billion at 31 December 2009, compared with NOK 28.4 billion at 31 December 2008. The increase of NOK 3.3 billion was mainly due to new long-term debt in 2009.
Cash and cash equivalents amounted to NOK 24.7 billion at 31 December 2009, compared with NOK 18.6 billion at 31 December 2008. Current financial investments, which are part of our cash management, amounted to NOK 7.0 billion at 31 December 2009, compared with NOK 9.7 billion at 31 December 2008.
4.2.4 Principal contractual obligations
The table summarises our principal contractual obligations and other commercial commitments as of 31 December 2009.
The table includes contractual obligations, but excludes derivatives and other hedging instruments as well as asset retirement obligations, which for the most part are expected to lead to cash disbursements more than five years in the future. Obligations payable by Statoil to unconsolidated equity affiliates are included gross in the table. Where Statoil includes both an ownership interest and the transport capacity cost for a pipeline in the consolidated accounts, the amounts in the table include the transport commitments that exceed Statoil's ownership share. See also report section 5.2.2 Risk review - Risk management - Disclosures about market risk, for more information.
| As at 31 December, 2009 | ||||
| Payment due by period * | ||||
Contractual obligations (in NOK billion) | Less than 1 year | 1-3 years | 3-5 years | More than 5 years | Total |
|
|
|
|
|
|
Undiscounted non-current financial liabilities | 6.9 | 15.7 | 21.9 | 87.0 | 131.6 |
Minimum operating lease payments | 14.0 | 18.9 | 7.2 | 3.1 | 43.2 |
Nominal minimum payments related to transport capacity, terminal capacity and similar commitments | 8.7 | 15.4 | 12.8 | 37.6 | 74.4 |
|
|
|
|
|
|
Total contractual obligations | 29.6 | 50.0 | 41.9 | 127.7 | 249.2 |
|
|
|
|
|
|
* "Less than 1 year" represents 2010; "1-3 years" represents 2011 and 2012, "3-5 years" represents 2013 and 2014, while "More than 5 years" includes amounts for 2015 and later periods. | |||||
Non-current debt in the table represents principal payment obligations. For information on interest commitments relating to long-term debt, reference is made to note 22 - Non-current financial liabilities and note 27 - Leases, to our Consolidated Financial Statements included in this report.
Contractual obligations relating to capital expenditures, acquisitions of intangible assets and construction in progress amounted to NOK 30.1 billion as of 31 December 2009, of which payments of NOK 15.1 billion are due within one year.
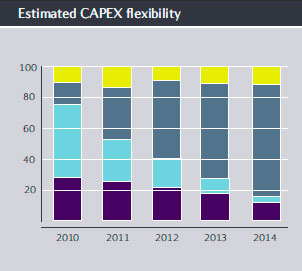
Over time, we have increasing flexibility in terms of capital expenditure commitments. This flexibility is partly dependent on decisions made by partners.
The group's projected pension benefit obligation was NOK 61.4 billion and the fair value of plan assets amounted to NOK 43.0 billion as of 31 December 2009. Actuarial gains amounted to NOK 3.2 billion as of 31 December 2009 and are reported as part of the Statement of comprehensive income (equity). Company contributions are mainly related to employees in Norway. Contributions to pension plans can either be paid in cash or be deducted from the pension premium fund. The pension premium fund amounted to NOK 7.2 billion and NOK 4.5 billion at 31 December 2009 and 2008, respectively. The decision whether to pay in cash or deduct from the pension premium fund is made on an annual basis. In 2009, a pension premium amounting to NOK 4.1 billion was paid. In 2008, NOK 2.9 billion was deducted from the pension premium fund. The company contribution in 2008, paid in cash, was NOK 0.2 billion (exclusive of payroll tax). In addition, NOK 1.2 billion was paid to Statoil's pension fund as a capital increase in 2008.
The expected company contribution related to 2010 amounts to NOK 2.1 billion.
4.2.5 Investments
Our investments have decreased compared with 2008 due to substantial acquisitions during the previous year, mainly in our international project portfolio.
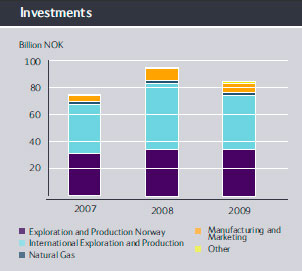
Capital expenditure
Our capital expenditure in our four principal business segments from 2007 through 2009 is described below, including the allocation per segment as a percentage of gross investments. Capital expenditure is expected to amount to approximately USD 13.0 billion in 2010, compared with USD 12.4 billion in 2009 (exclusive of capitalisation of financial leases).
| For the year ended 31 December | ||||
Gross investments (in NOK billion) | 2009 | 2008 | 2007 | 09-08 Change | 08-07 Change |
|
|
|
|
|
|
- E&P Norway | 34.9 | 34.9 | 31.1 | (0 %) | 12% |
- International E&P | 39.4 | 48.7 | 36.2 | (19 %) | 35% |
- Natural Gas | 2.6 | 2.0 | 2.1 | 29 % | (6 %) |
- Manufacturing & Marketing | 6.8 | 8.5 | 4.8 | (20 %) | 76 % |
- Other | 1.3 | 1.3 | 0.8 | 3 % | 73 % |
|
|
|
|
|
|
Total gross investments | 85.0 | 95.4 | 75.0 | (11 %) | 27 % |
|
| For the year ended 31 December | ||||
Gross investments (in NOK billion) | 2009 | % of total | 2008 | % of total | 2007 | % of total |
|
|
|
|
|
|
|
- E&P Norway | 34.9 | 41 % | 34.9 | 37 % | 31.1 | 41 % |
- International E&P | 39.4 | 46 % | 48.7 | 51 % | 36.2 | 48 % |
- Natural Gas | 2.6 | 3 % | 2.0 | 2 % | 2.1 | 3 % |
- Manufacturing & Marketing | 6.8 | 8 % | 8.5 | 9 % | 4.8 | 6 % |
- Other | 1.3 | 2 % | 1.3 | 1 % | 0.8 | 1 % |
|
|
|
|
|
|
|
Total gross investments | 85.0 | 100 % | 95.4 | 100% | 75.0 | 100 % |
This section describes our estimated capital expenditure for 2010 with respect to potential capital expenditure requirements for the principal investment opportunities available to us and other capital projects currently under consideration. The figure is based on Statoil developing organically, and it excludes possible expenditures related to acquisitions. Therefore, the expenditure estimates and descriptions of investments in the segment descriptions below could differ materially from the actual expenditure. For more information about the various projects in each of the segments, see the respective report sub-sections described under section 4 Financial analysis and review.
E&P Norway. A substantial proportion of our 2010 capital expenditure will be spent on ongoing development projects on Skarv, Morvin, Gjøa, Goliat, the Gullfaks fields and IOR projects.
International E&P. We currently estimate that a substantial proportion of our 2010 capital expenditure will be spent on the following ongoing and planned development projects: Peregrino in Brazil, Pazflor and PSVM in Angola, Marcellus Shale Gas in the USA and Leismer Demo Project in Canada.
Natural Gas. We currently estimate that most of the 2010 capital expenditures will be spent on projects related to upgrading the Kårstø processing plant and the Gassled transportation system, and on transport solutions for Marcellus Shale Gas. In addition, projects are under execution to increase our flexibility to move gas in time, to improve robustness in relation to delivery obligations and to exploit opportunities relating to daily and seasonal gas price fluctuations. These projects involve both Gassled on the NCS and our assets in the UK.
Manufacturing & Marketing. We are focusing our capital expenditure on upgrading our refineries to increase robustness and flexibility, as well as developing extra heavy oil value chains based on E&P assets. In 2006, we received the final permit to build a combined heat and power plant (CHP plant) at Mongstad. It is being constructed and will be operated by the Danish company Dong under a long-term lease agreement, under which Statoil has an option to take over ownership after 20 years free of charge. We and our partners at Mongstad and on Troll are investing NOK 3.9 billion in refinery modifications and a gas pipeline from Kollsnes to Mongstad in connection with the CHP plant, which is expected to start operation in 2010. At Kalundborg, the main focus is on infrastructure improvements. In 2009, we bought the lease for the Bahamian South Riding Point crude terminal. We are currently assessing the need for upgrading of the terminal to enable it to take new, potentially h eavier crudes.
As illustrated in section 4.2.4 Financial analysis and review - Liquidity and capital resources - Principal contractual obligations, we have committed to certain investments in the future. The proportion of estimated investments that we have committed to at year end 2009 will decline with time. The further into the future, the more flexibility we will have to revise expenditure. This flexibility is partly dependent on the expenditure our partners in joint ventures agree to commit to.
Exploration expenditure
We experienced some reduction in exploration activities in 2009 compared with the level in 2008. Exploration expenditure in 2009 amounted to NOK 16.9 billion, compared with NOK 17.8 billion in 2008 and NOK 14.2 billion in 2007. Exploration expenditure is expected to decline to approximately USD 2.3 billion in 2010. The group expects to participate in the drilling of approximately 50 wells in 2010. However, no guarantees can be given with regard to the number of wells drilled, the cost per well and the results of drilling. Evaluation of the results of drilling will influence the amount of exploration expenditure capitalised and expensed. See report section 4.2.9 Financial analysis and review - Critical accounting judgements.
We use the "Successful efforts" method of accounting for oil and natural gas-producing activities. Expenditure on drilling and equipping exploratory wells is capitalised until it is clarified whether there are proven reserves. Expenditure on drilling exploratory wells that do not find proven reserves and geological, geophysical and other exploration expenditure is expensed. Unproven oil and gas properties are assessed quarterly; unsuccessful wells are expensed. Exploratory wells that have found reserves, but where classification of those reserves as proven depends on whether major capital expenditure can be justified, may remain capitalised for more than one year. The main conditions are either that firm plans exist for future drilling in the licence or that a development decision is planned in the near future.
Finally, we may alter the amount, timing or segmental or project allocation of our capital expenditure in anticipation of or as a result of a number of factors outside our control, including, but not limited to:
- exploration and appraisal results, such as favourable or disappointing seismic data or appraisal wells;
- cost escalation, such as higher exploration, production, plant, pipeline or vessel construction costs;
- government approval of projects;
- government awards of new production licences;
- partner approvals;
- the development and availability of satisfactory transport infrastructure;
- the development of markets for our petroleum products and other products, including price trends;
- political, regulatory or tax regime risks;
- accidents such as rig blowouts or fires, and natural hazards;
- adverse weather conditions;
- environmental problems which could lead, for instance, to development restrictions, costs relating to regulatory compliance or the effects of petroleum discharges or spills; and
- acts of war, terrorism and sabotage.
4.2.6 Off balance sheet arrangements
This section describes various agreements, such as operational leases and transportation and processing capacity contracts, that are not recognised in the balance sheet.
We have entered into various agreements, such as operational leases and transportation and processing capacity contracts, that are not recognised in the balance sheet. See report section 4.2.4 Financial analysis and review - Liquidity and capital resources - Principal contractual obligations, for more information.
We are not party to any off-balance sheet arrangements such as the use of Variable Interest Entities.
The group is party to certain guarantees, commitments and contingencies that, pursuant to IFRS, are not necessarily recognised in the balance sheet as liabilities. See note 28 Other commitments and contingencies in section 8 Consolidated financial statements for more information.
4.2.7 Material contracts
Statoil has not entered into any material contracts since the merger with Hydro's oil and energy activities on 1 October 2007.
See report section 3.13 Operational review-Related party transactions and report section 6.4 Shareholder information - Major shareholders, for a description of certain agreements we have entered into with the Norwegian State.
4.2.8 Impact of inflation
Price increases for raw materials and services that are necessary for the development and operation of oil and gas-producing assets have affected our results in recent years.
Although the price pressure has abated since it peaked in 2008, our results have been significantly affected in the last few years by inflation in the cost of certain raw materials and services that are necessary for the development and operation of oil and gas-producing assets. Other parts of our business are not exposed to similar cost pressures.
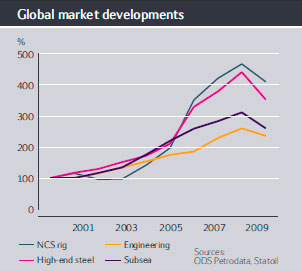
While some of the cost pressure relate to capitalised expenditures and thus only affect our annual profit through increased depreciation, certain elements of operating expenditures have also been affected by this inflation. See our analysis of profit and loss as well as relevant outlook sections in report section 4.1 Financial analysis and review - "Continued deliveries in turbulent markets".
As measured by the general consumer price index, inflation in Norway for the years ended 31 December 2009, 2008 and 2007 was 2.0%, 2.1% and 0.9%, respectively.
4.2.9 Critical accounting judgements
This section describes key sources of estimation uncertainty and the critical judgements that the group has made when applying accounting policies.
The consolidated financial statements have been prepared in accordance with International Financial Reporting Standards (IFRS) as adopted by the European Union (EU). The accounting policies applied by the group also comply with IFRS as issued by the International Accounting Standards Board (IASB). This means that we are required to make estimates and assumptions. We believe that, of the company's significant accounting policies (see note 2 - Significant accounting policies, to our consolidated financial statements included in this report), the following may involve a greater degree of judgement and complexity, which, in turn, could materially affect the net income if various assumptions were significantly changed.
Critical judgements when applying accounting policies
The following are the critical judgements, apart from those involving estimations (see below), that the group has made in the process of applying the accounting policies and that have the most significant effect on the amounts recognised in the financial statements:
Revenue recognition - gross versus net presentation of traded SDFI volumes of oil and gas production
As described under Transactions with the Norwegian State above, the group markets and sells the Norwegian State's share of oil and gas production from the NCS. The group includes the costs of purchase and proceeds from the sale of the SDFI oil production in Purchases [net of inventory variation] and Revenues, respectively. In making the judgement, the group considered the detailed criteria for the recognition of revenue from the sale of goods, and in particular it assessed whether the risk and reward of the ownership of the goods had been transferred from the SDFI to the group.
As also described above, the group sells, in its own name, but for the Norwegian State's account and risk, the State's production of natural gas. This sale, and related expenditures refunded by the State, are recorded net in the group's financial statements. In making the judgment, the group considered the same criteria as for oil production and concluded that the risk and reward of the ownership of the gas had not been transferred from the SDFI to the group.
Method of accounting applied for the Hydro petroleum merger
The merger between Statoil ASA and Hydro petroleum in 2007 was accounted for using the carrying amounts of the assets and liabilities. When making this judgement, the group considered, firstly, whether Statoil ASA and Hydro petroleum were under the common control of the Norwegian State and, secondly, given the conclusion that both entities were under the control of the Norwegian State, assessed what method of accounting would provide the most meaningful portrayal of the merger for accounting purposes. Statoil concluded that such a reorganisation would be best presented using the carrying amounts of assets and liabilities, and it is presented in the financial statements for all periods presented as if the companies had always been combined.
Key sources of estimation uncertainty
The preparation of consolidated financial statements requires that management make estimates and assumptions that affect reported amounts of assets and liabilities, income and expenses. The estimates and associated assumptions are based on historical experience and various other factors that are believed to be reasonable under the circumstances, the result of which forms the basis for making the judgements about carrying values of assets and liabilities that are not readily apparent from other sources. Actual results may differ from these estimates. The estimates and underlying assumptions are reviewed on an ongoing basis taking the current and expected future market conditions into consideration.
The group is exposed to a number of underlying economic factors, such as liquids prices, natural gas prices, refining margins, foreign exchange rates, interest rates and financial instruments with fair values derived from changes in these factors, which affect the overall results. In addition, the group's results are influenced by the level of production, which, in the short term, may be influenced by, for instance, maintenance programmes. In the long term, the results are impacted by the success of exploration and field development activities.
The matters described below are considered to be the most important in relation to understanding the key sources of estimation uncertainty that are involved in preparing these financial statements and the uncertainties that could most significantly affect the amounts reported on the results of operations, financial position and cash flows.
Proven oil and gas reserves
Proven oil and gas reserves have been estimated by internal experts on the basis of industry standards and criteria established by regulations of the SEC. The SEC revised Rule 4-10 of Regulation S-X and changed a number of oil and gas reserve estimation requirements effective for the year ending 31 December 2009 . This required , on a prospective basis , the use of a price based on a 12-month average for reserve estimation instead of a single end-of-year price and allows for nontraditional sources such as bitumen extracted from oil sands to be included as reserves . The Financial Accounting Standards Board (FASB) also aligned the requirements for supplemental oil and gas disclosures with the changes made by the SEC . Statoil estimates that implementation of the revisions had an immaterial impact on proved reserves as of 31 December 2009 and will have an immaterial impact on unit of production depreciation starting in 2010 . However , the comparability of disclosures between years is impacted by the new requirements.
Reserves estimates are based on subjective judgments involving geological and engineering assessments of in-place hydrocarbons volumes, the production, historical extraction recovery and processing yield factors and installed plant operating capacity. For future development projects, proven reserves estimates are only included where there is a significant commitment to project funding and execution and when relevant governmental and regulatory approvals have been secured or are reasonably certain to be secured. The reliability of these estimates at any point in time depends on both the quality and quantity of the technical and economic data and the efficiency of the extracting and processing of the hydrocarbons. An independent third party has evaluated Statoil's proven reserves estimates, and the results of this evaluation do not differ materially from management estimates. Proven oil and gas reserves are those quantities of oil and gas, which, by analysing geoscience and engineering data, ca n be estimated with reasonable certainty to be economically producible from a given date forward, from known reservoirs, and under existing economic conditions, operating methods and government regulations. Unless evidence indicates that renewal is reasonably certain, estimates of economically producible reserves only reflect the period before the contracts providing the right to operate expire. The project to extract the hydrocarbons must have commenced or the operator must be reasonably certain that it will commence within a reasonable time. Future changes in proven oil and gas reserves, for instance as a result of changes in prices, could have a material impact on the unit of production rates used for depreciation and amortisation.
Expected oil and gas reserves
Expected oil and gas reserves have been estimated by internal experts on the basis of industry standards and are used for impairment testing purposes and for calculating asset retirement obligations. Reserves estimates are based on subjective judgments involving geological and engineering assessments of in-place hydrocarbons volumes, the production, historical extraction recovery and processing yield factors, installed plant operating capacity and operating approval limits. The reliability of these estimates at any point in time depends on both the quality and quantity of the technical and economic data and the efficiency of the extracting and processing of the hydrocarbons. Future changes in expected oil and gas reserves, for instance as a result of changes in prices, could have a material impact on asset retirement obligations, as well as on the impairment testing of upstream assets, which could have a material effect on operating income as a result of changed impairment charges.
Exploration and leasehold acquisition costs
The group capitalises the costs of drilling exploratory wells pending determination of whether the wells have found proven oil and gas reserves. The group also capitalises leasehold acquisition costs and signature bonuses paid to obtain access to undeveloped oil and gas acreage. Judgments as to whether these expenditures should remain capitalised or written down due to impairment losses in the period may materially affect the operating income for the period.
Impairment/reversal of impairment
The group has significant investments in property, plant and equipment and intangible assets. Changes in the circumstances or expectations of future performance of an individual asset may be an indicator that the asset is impaired, thus requiring the book value to be written down to its recoverable amount. Impairments are reversed if conditions for impairment are no longer present. Evaluating whether an asset is impaired or if an impairment should be reversed requires a high degree of judgement and may depend to a large extent on the selection of key assumptions about the future used.
Unproven oil and gas properties are assessed for impairment when facts and circumstances suggest that the carrying amount of the asset may exceed its recoverable amount, and at least annually. If, following evaluation, an exploratory well has not found proven reserves, the previously capitalised costs are tested for impairment. Subsequent to the initial evaluation phase for a well, it will be considered a trigger for impairment testing of a well if no development decision is planned for the near future, and, moreover, if there is no concrete plan for future drilling in the licence. Impairment of unsuccessful wells is reversed if the conditions for impairment are no longer present.
Estimating recoverable amounts involves complex estimates of relevant future cash flows based on assumptions about the future, and discounted to their present value. Impairment testing requires long-term assumptions to be made concerning a number of often volatile economic factors, such as future market prices, refinery margins, currency exchange rates and future output, discount rates and political and country risk, in order to establish relevant future cash flows. Impairment testing frequently also requires judgement to be applied as regards applicable probabilities and probability distributions. This also applies to the levels of sensitivity inherent in the establishment of recoverable amount estimates, and, consequently, in ensuring that the robustness of the estimates of recoverable amounts, where relevant, is factored sufficiently into the impairment evaluations and reflected in the impairment or reversal of impairment recorded in the financial statements. Long-term assumptions are made at group level about major economic factors, and there is a high degree of reasoned judgement involved in establishing these assumptions, in determining other relevant factors such as forward price curves, in estimating production outputs, and in determining the ultimate termination value of an asset.
Employee retirement plans
When estimating the present value of defined pension benefit obligations that represent a gross long-term liability in the balance sheet, and, indirectly, the period's net pension expense in the statement of income, management make a number of critical assumptions affecting these estimates. Most notably, assumptions made about the discount rate to be applied to future benefit payments, the expected return on plan assets and the annual rate of compensation increase have a direct and potentially material impact on the amounts presented. Significant changes in these assumptions between periods can have a material effect on the financial statements.
Asset retirement obligations.
The group has significant obligations to decommission and remove offshore installations at the end of the production period. Legal obligations associated with the retirement of non-current assets are recognised at their fair value at the time the obligations are incurred. Upon initial recognition of a liability, that cost is capitalised as part of the related non-current asset and allocated to expense over the useful life of the asset.
It is difficult to estimate the costs of these decommissioning and removal activities, which are based on current regulations and technology, considering relevant risks and uncertainties. Most of the removal activities are many years in the future and the removal technology and costs are constantly changing. The estimates include assumptions about both the the time required and the day rates for rigs, marine operations and heavy lift vessels, which can vary considerably depending on the assumed complexity of the removal. As a result, the initial recognition of the liability, the capitalised cost associated with decommissioning and removal obligations, and the subsequent adjustment of these balance sheet items involve the application of significant judgement.
Derivative financial instruments
When not directly observable in active markets, the fair value of derivative contracts must be computed internally based on internal assumptions as well as directly observable market information, including forward and yield curves for commodities, currencies and interest. Changes in internal assumptions and forward curves could have a material impact on the internally computed fair value of derivative contracts, particularly long-term contracts, resulting in a corresponding impact on income or loss in the income statement.
Income tax
The group annually incurs significant amounts of income taxes payable to various jurisdictions around the world, and it also recognises significant changes in deferred tax assets and deferred tax liabilities, all of which are based on management's interpretations of applicable laws, regulations and relevant court decisions. The quality of these estimates is highly dependent upon management's ability to properly apply what are in part very complex sets of rules, to recognise changes in applicable rules and, in the case of deferred tax assets, management's ability to project future earnings from activities that can utilise loss carryforward positions against future income taxes.
4.3 Non-GAAP measures
This section describes the non-GAAP financial measures SEC regulations require us to disclose .
We are subject to SEC regulations regarding the use of "non-GAAP financial measures" in public disclosures. Non-GAAP financial measures are defined as numerical measures that either exclude or include amounts that are not excluded or included in the comparable measures calculated and presented in accordance with generally accepted accounting principles, which in our case refers to IFRS.
The following financial measures may be considered non-GAAP financial measures:
- Return on Average Capital Employed (ROACE).
- Production cost per barrel of entitlement and equity volumes.
- Net debt to capital employed ratio.
4.3.1 Return on capital employed (ROACE)
We use ROACE to measure the return on capital employed, regardless of whether the financing is through equity or debt.
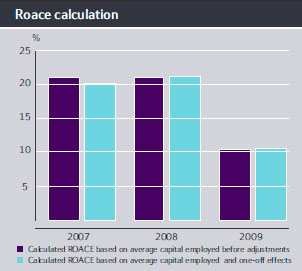
We use ROACE to measure the return on capital employed, regardless of whether the financing is through equity or debt. In the company's view, this measure provides useful information for both the company and investors about performance during the period under evaluation. We make regular use of this measure to evaluate our operations. Our use of ROACE should not be viewed as an alternative to income before financial items, income taxes and minority interest, or to net income, which are measures calculated in accordance with generally accepted accounting principles or ratios based on these figures.
ROACE was 10.4% in 2009, compared with 21.0% in 2008 and 17.7% in 2007. The decrease from last year was due to a 43% drop in net income adjusted for financial items after tax and a 15% increase in capital employed.
Adjusted for the effects of restructuring costs and other costs arising from the merger, ROACE was 10.5% in 2009, compared with 21.1% in 2008 and 20% in 2007. The decrease from 2008 to 2009 was caused by a drop in income and increased capital employed. ROACE is defined as a non-GAAP financial measure.
Calculation of numerator and denominator used in ROACE calculation | For the year ended 31 December | ||
(in NOK billion, except percentages) | 2009 | 2008 | 2007 |
|
|
|
|
Net income for the year | 17.7 | 43.3 | 44.6 |
After-tax net financial items for the year | 10.5 | 6.4 | (7.2) |
|
|
|
|
Net income adjusted for financial items after tax (A1) | 28.2 | 49.7 | 37.5 |
|
|
|
|
Adjustment for restructuring costs and other costs arising from the merger | (0.1) | (0.4) | 4.2 |
|
|
|
|
Net income adjusted for restructuring costs and other costs arising from the merger (A2) | 28.2 | 49.3 | 41.7 |
|
|
|
|
Calculated average capital employed: |
|
|
|
Average capital employed before adjustments (B1) | 271.2 | 236.4 | 211.8 |
Average capital employed (B2) | 268.7 | 233.3 | 208.9 |
|
|
|
|
Calculated ROACE: |
|
|
|
ROACE based on average capital employed before adjustments (A1/B1) | 10.4 % | 21.0 % | 17.7 % |
ROACE based on average capital employed and adjusted for restructuring costs (A2/B2) | 10.5 % | 21.1 % | 19.9 % |
4.3.2 Unit of production cost
The production cost is computed on the basis of entitlement volumes and equity volumes in order to evaluate the underlying development in production costs.
Production cost per boe of equity volumes is used to evaluate the underlying development in production costs. Significant portions of Statoil's international production are subject to production-sharing agreements with countries' authorities. Under these agreements, we cover our share of the operating expenditures related to the equity volumes produced. Our international production costs are thus affected by the amount of equity barrels produced, more than by the entitlement volumes received. In order to exclude the effects that production-sharing agreements have on entitlement volumes (PSA effects), we also compute the unit of production cost based on equity volumes.
| Entitlement production | Equity production | ||||
| For the year ended 31 December | For the year ended 31 December | ||||
Production cost summary (in NOK per boe) | 2009 | 2008 | 2007 | 2009 | 2008 | 2007 |
|
|
|
|
|
|
|
Calculated production cost | 38.4 | 38.1 | 44.1 | 35.3 | 34.6 | 41.4 |
Calculated production cost, excluding restructuring cost from the merger | 38.8 | 40.6 | 35.7 | 35.7 | 36.9 | 33.5 |
Calculated production cost, excluding restructuring and gas injection cost | 38.4 | 36.7 | 33.2 | 35.3 | 33.3 | 31.2 |
Entitlement volumes used in the calculation of the normalised production cost per boe have therefore been adjusted for PSA effects. Higher oil price levels negatively affect the production entitlement volumes, and hence the production unit cost.
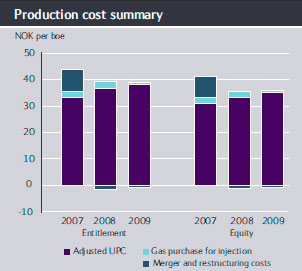
Entitlement volumes are highly affected by production-sharing agreements (PSA effects). On average, the equity volumes exceeded entitlement volumes by 205 mboe per day in 2009, 166 mboe per day in 2008 and 115 mboe per day in 2007. With the same cost basis but higher volumes, the cost per barrel of equity volumes will always be lower than the cost per barrel of entitlement volumes. Based on equity volumes, the average production cost was NOK 35.3 per boe in 2009, compared with NOK 34.6 per boe in 2008 and NOK 41.4 per boe in 2007.
The following is a reconciation of our overall operating expenses per year with production cost per year as used when computing the unit of production cost per oil equivalent of entitlement and equity volumes.
| For the year ended 31 December | ||
Reconcilliation of overall operating expenses to production cost (in NOK billion) | 2009 | 2008 | 2007 |
|
|
|
|
Operating expenses, Statoil Group | 15.7 | 16.2 | 22.7 |
|
|
|
|
Deductions of costs not relevant to production cost calculation |
|
|
|
1) Business Areas non-upstream | 7.6 | 8.5 | 8.5 |
|
|
|
|
Total operating expenses upstream | 8.0 | 7.6 | 14.2 |
|
|
|
|
2) Operation over/underlift | 0.3 | (0.4) | (0.1) |
3) Transportation pipeline/vessel upstream | 1.0 | 1.3 | 2.1 |
4) Miscellaneous items | (0.1) | 0.5 | 0.1 |
|
|
|
|
Total operating expenses upstream excl. over/underlift & transportation | 6.7 | 6.3 | 12.1 |
Total production costs last 12 months | 25.0 | 24.2 | 27.8 |
|
|
|
|
5) Grane gas purchase | 0.2 | 0.6 | 0.4 |
6) Restructuring costs from the merger | (0.3) | (1.6) | 5.3 |
7) Change in ownership interest | 0.0 | 0.8 | 0.0 |
|
|
|
|
Total operating expenses upstream for adjusted cost per barrel calculation | 6.7 | 6.6 | 6.3 |
4.3.3 Net debt to capital employed ratio
In the company's view, the calculated net debt to capital employed ratio provides a more complete picture of the group's current debt situation than gross interest-bearing debt.
In the company's view, the calculated net debt to capital employed ratio provides a more complete picture of the group's current debt situation than gross interest-bearing debt. The calculation uses balance sheet items relating to total debt and adjusts for cash, cash equivalents and short-term investments. Certain adjustments are made, since different legal entities in the group lend to projects and others borrow from banks. Project financing through an external bank or similar institution will not be netted in the balance sheet and will over-report the debt stated in the balance sheet in relation to the underlying exposure in the group. Similarly, certain net interest-bearing debts incurred from activities pursuant to the Marketing Instruction from the Norwegian State are set off against receivables on the SDFI.
The net interest-bearing debt adjusted for these two items is included in the average capital employed, which is also used in the calculation of ROACE.
The table below reconciles the net interest-bearing debt, capital employed and net debt to capital employed ratio with the most directly comparable financial measure or measures calculated in accordance with GAAP.
Calculation of capital employed and net debt to capital employed ratio | For the year ended 31 December | ||
(in NOK billion, except percentages) | 2009 | 2008 | 2007 |
|
|
|
|
Total shareholders' equity | 198.3 | 214.1 | 177.3 |
Non-controlling interests | 1.8 | 2.0 | 1.8 |
|
|
|
|
Total equity and minority interest (A) | 200.1 | 216.1 | 179.1 |
|
|
|
|
Short-term debt | 8.1 | 20.7 | 6.2 |
Long-term debt | 96.0 | 54.6 | 44.4 |
|
|
|
|
Gross interest-bearing debt | 104.1 | 75.3 | 50.5 |
|
|
|
|
Cash and cash equivalents | 24.7 | 18.6 | 18.3 |
Current financial investments | 7.0 | 9.7 | 3.4 |
|
|
|
|
Cash and cash equivalents and current financial investments | 31.7 | 28.4 | 21.6 |
|
|
|
|
Net debt before adjustments (B1) | 72.4 | 46.9 | 28.9 |
|
|
|
|
Other interest-bearing elements | 5.0 | 1.9 | 0.0 |
Marketing instruction adjustment | (1.4) | (1.7) | (1.4) |
Adjustment for project loan | (0.7) | (1.1) | (2.0) |
|
|
|
|
Net interest-bearing debt (B2) | 75.3 | 46.0 | 25.5 |
|
|
|
|
Calculation of capital employed: |
|
|
|
Capital employed before adjustments to net interest-bearing debt (A+B1) | 272.5 | 263.0 | 208.0 |
Capital employed, adjusted (A+B2) | 275.4 | 262.0 | 204.5 |
|
|
|
|
Calculated net debt to capital employed: |
|
|
|
Net debt to capital employed before adjustments (B1/(A+B1)) | 26.6 % | 17.8 % | 13.9 % |
Net debt to capital employed (B2/(A+B2)) | 27.3 % | 17.5 % | 12.4 % |
4.4 Accounting Standards (IFRS)
We prepare our consolidated financial statements in accordance with International Financial Reporting Standards (IFRS) as adopted by the EU and as issued by the International Accounting Standards Board.
We prepared our first set of consolidated financial statements pursuant to IFRS for 2007. The IFRS standards have been applied consistently to all periods presented in the consolidated financial statements and when preparing an opening IFRS balance sheet as of 1 January 2006 (subject to certain exemptions allowed by IFRS 1) for the purpose of the transition to IFRS.
Change in parent company functional currency
With effect from 2009, we have reported using USD as the functional currency in the parent company, while we use NOK as the reporting currency. Prior period financial statements have not been restated, since this is not required by the standard.
5 Risk review
5.1 Risk factors
5.1.1 Risks related to our business
This section discusses some of the potential risks relating to our business, such as oil prices, the financial crisis, competition and international relations.
A substantial or prolonged decline in oil or natural gas prices would have a material adverse effect on us.
Historically, the prices of oil and natural gas have fluctuated greatly in response to changes in many factors. We do not and will not have control over the factors affecting the prices of oil and natural gas. These factors include:
- global and regional economic and political developments in resource-producing regions, particularly in the Middle East and South America
- global and regional supply and demand
- the ability of the Organization of the Petroleum Exporting Countries (Opec) and other producing nations to influence global production levels and prices
- prices of alternative fuels which affect our realised prices under our long-term gas sales contracts
- Norwegian and foreign governmental regulations and actions
- global economic conditions
- war or other international conflicts
- changes in population growth and consumer preferences
- the price and availability of new technology, and
- weather conditions.
It is impossible to predict future price movements for oil and natural gas with certainty. A prolonged decline in oil and natural gas prices will adversely affect our business, the results of our operations and our financial condition, our liquidity and our ability to finance planned capital expenditure. In addition to the adverse effect on revenues, margins and profitability from any fall in oil and natural gas prices, a prolonged period of low prices or other indicators could lead to further reviews for impairment of the group's oil and natural gas properties. Such reviews would reflect management's view of long-term oil and natural gas prices and could result in a charge for impairment that could have a significant effect on the results of our operations in the period in which it occurs. Rapid material and/or sustained reductions in oil, gas and product prices can impact on the validity of the assumptions on which strategic decisions are based and can impact on the economic viability of pr ojects planned or in development. For an analysis of the impact on net operating income of changes in oil and gas prices, see section 5.2 Risk Review-Risk Management.
Exploratory drilling involves numerous risks, including the risk that we will encounter no commercially productive oil or natural gas reservoirs, which could materially adversely affect our results.
We are exploring or considering exploring in various geographical areas, including resource provinces such as the Norwegian Sea, the Barents Sea, the deepwater US Gulf of Mexico, the Arctic, onshore Algeria and Libya, as well as offshore Alaska, Angola, Brazil and Venezuela, where environmental conditions are challenging and costs can be high. In addition, our use of advanced technologies requires greater pre-drilling expenditure than traditional drilling strategies. The cost of drilling, completing and operating wells is often uncertain. As a result, we may incur cost overruns or may be required to curtail, delay or cancel drilling operations because of a variety of factors, including unexpected drilling conditions, pressure or irregularities in geological formations, equipment failures or accidents, adverse weather conditions, compliance with governmental requirements and shortages of or delays in the availability of drilling rigs and the delivery of equipment. For example, we have entered int o long-term leases for drilling rigs which may turn out not to be required for the originally intended operations, and we cannot be certain that these rigs will be re-employed or at what rates they will be re-employed. Fluctuations in the market for leases of drilling rigs will also have an impact on the rates we can charge in re-employing these rigs. Our overall drilling activity or drilling activity within a particular project area may be unsuccessful. Such failure will have a material adverse effect on the results of our operations and financial condition.
If we fail to acquire or find and develop additional reserves, our reserves and production will decline materially from their current levels.
The majority of our proven reserves are on the Norwegian continental shelf (NCS), a maturing resource province. Unless we conduct successful exploration and development activities and/or acquire properties containing proven reserves, our proven reserves will decline as reserves are produced. Successful execution of our group strategy depends critically on sustaining long-term reserves replacement. If upstream resources are not progressed to proven reserves in a timely and efficient manner, we will be unable to sustain the long-term replacement of reserves. In addition, the volume of production from oil and natural gas properties generally declines as reserves are depleted. For example, some of our major fields, such as Gullfaks, are dependent on satellite fields to maintain production and, unless efforts to improve the development of satellite fields are successful, production will gradually decline.
In a number of resource-rich countries, national oil companies control a significant proportion of oil and gas reserves that remain to be developed. To the extent that national oil companies choose to develop their oil and gas resources without the participation of international oil companies or that we are unable to develop partnerships with national oil companies, our ability to find and acquire or develop additional reserves will be limited.
Our future production is highly dependent on our success in finding or acquiring and developing additional reserves. If we are unsuccessful, we may not meet our long-term ambitions for growth in production, and our future total proven reserves and production will decline and adversely affect the results of our operations and financial condition.
We encounter competition from other oil and natural gas companies in all areas of our operations, including the acquisition of licences, exploratory prospects and producing properties.
The oil and gas industry is extremely competitive, especially with regard to exploration for, and exploitation and development of new sources of oil and natural gas.
Some of our competitors are much larger, well-established companies with substantially greater resources, and in many instances they have been engaged in the oil and gas business for much longer than we have. These larger companies are developing strong market power through a combination of different factors, including:
- diversification and reduction of risk
- the financial strength necessary for capital-intensive developments
- exploitation of benefits of integration
- exploitation of economies of scale in technology and organisation
- exploitation of advantages of expertise, industrial infrastructure and reserves, and
- strengthening of positions as global players.
These companies may be able to pay more for exploratory prospects and productive oil and natural gas properties and may be able to define, evaluate, bid for and purchase a greater number of properties and prospects, including operatorships and licences, and they may be able to invest more in developing technology than our financial or human resources permit. Our performance could be impeded if competitors developed or acquired intellectual property rights to technology that we required or if our innovation lagged behind the industry. For more information on the competitive environment, see section 3.11 Operational Review-Competition.
We face challenges in achieving our strategic objective of successfully exploiting growth opportunities.
An important element of our strategy is to continue to pursue attractive growth opportunities available to us, both in enhancing and repositioning our asset portfolio and expanding into new markets. The opportunities that we are actively pursuing may involve acquisitions of businesses or properties that complement or expand our existing portfolio, and the challenges to renewal of our upstream portfolio are growing due to increasing global competition for access to opportunities.
Our ability to successfully implement this strategy will depend on a variety of factors, including our ability to:
- identify acceptable opportunities
- negotiate favourable terms
- develop the performance of new market opportunities or acquired properties or businesses promptly and profitably
- integrate acquired properties or businesses into our operations
- arrange financing, if necessary, and
- comply with legal regulations.
As we pursue business opportunities in new and existing markets, we anticipate significant investments and costs in connection with the development of such opportunities. We may incur or assume unanticipated liabilities, losses or costs associated with assets or businesses acquired. Any failure by us to successfully pursue and exploit new business opportunities could result in financial losses and inhibit growth.
If we are successful in the pursuit of our strategy, and no assurances can be given that we will be, our ability to achieve our financial, capital expenditure and production forecasts may be materially affected. Any such new projects we acquire will require additional capital expenditure and will increase the cost of our discoveries and development. These projects may also have different risk profiles than our existing portfolio. These and other effects of such acquisitions could result in us having to revise either or both of our forecasts with respect to unit production costs and production.
In addition, the pursuit of acquisitions or new business opportunities could divert financial and management resources away from our day-to-day operations to the integration of acquired operations or properties, including those operations and properties subject to the final phases of integration after the merger with Hydro Petroleum. We may require additional debt or equity financing to undertake or consummate future acquisitions or projects, and such financing may not be available on terms satisfactory to us, if at all, and it may, in the case of equity, be dilutive to our earnings per share.
Our development projects involve many uncertainties and operating risks that can prevent us from realising profits and cause substantial losses.
Our development projects may be delayed or unsuccessful for many reasons, including cost overruns, lower oil and gas prices, equipment shortages, mechanical and technical difficulties and industrial action. These projects will also often require the use of new and advanced technologies, which may be expensive to develop, purchase and implement, and may not function as expected. In addition, some of our development projects will be located in deepwater or other hostile environments, such as the Gulf of Mexico and the Barents Sea, or produced from challenging reservoirs, which can exacerbate such problems. There is a risk that development projects that we undertake may suffer from such problems.
Our development projects on the NCS also face the challenge of remaining profitable. We are increasingly developing smaller satellite fields in mature areas and our projects are subject to the Norwegian State's relatively high taxes on offshore activities. Our other development projects in mature fields in Western Europe also potentially face higher operating costs. In addition, our development projects, particularly those in remote areas, could become less profitable, or unprofitable, if we experience a prolonged period of low oil or gas prices.
We face challenges in the renewable energy sector.
Although energy production from renewables is currently modest in most countries, wind power, solar energy and biofuels are developing into significant industries. We cannot predict the demand for renewables. We believe that technological innovation and the integration of trend-breaking technologies such as biotechnology and other new ideas is key to advancing in the renewable energy sector and meeting a profitable, sustainable, low-carbon energy future. Some of our competitors may be able to invest more in developing technology in the renewable energy sector than we do. Our performance in the renewable energy sector could be impeded if competitors developed or acquired intellectual property rights to technology that we required or if our innovation lagged behind the industry. In addition, projects in renewable energy involve emerging technologies, evolving manufacturing techniques and/or cutting edge implementation. Little precedence exists for incorporating certain renewable aspects into new o r existing projects.
We may not be able to produce some of our oil and gas economically due to the lack of necessary transportation infrastructure when a field is in a remote location.
Our ability to exploit economically any discovered petroleum resources beyond our proven reserves will be dependent, among other factors, on the availability of the necessary infrastructure to transport oil and gas to potential buyers at a commercially acceptable price. Oil is usually transported by tankers to refineries, and natural gas is usually transported by pipeline to processing plants and end-users. We may not be successful in our efforts to secure transportation and markets for all of our potential production.
Some of our international interests are located in politically, economically and socially unstable areas, which could disrupt our operations.
We have assets located in unstable regions around the world. For example, the states bordering the Caspian Sea dispute ownership and the distribution of proceeds from the Caspian's seabed and subsoil resources. Our activities in the Persian Gulf may be subject to disruption due, for example, to war and terrorism. Other countries, such as Venezuela, Nigeria and Angola, where we also have operations, have experienced expropriation or nationalisation of property, civil strife, strikes, acts of war, guerrilla activities and insurrections. The occurrence of incidents related to political, economic or social instability could disrupt our operations in any of these regions, causing a decline in production that could have a material adverse effect on the results of our operations or financial condition.
Our operations are subject to political and legal factors in the countries in which we operate.
We have assets in a number of countries with emerging or transitioning economies, which lack well-established and reliable legal systems, where the enforcement of contractual rights is uncertain or where the governmental and regulatory framework is subject to unexpected change. Our exploration and production activities in these countries are often undertaken together with national oil companies and are subject to a significant degree of state control. In recent years, governments and national oil companies in some regions have begun to exercise greater authority and impose more stringent conditions on companies pursuing exploration and production activities, which is a trend we expect to continue. Intervention by governments in such countries can take a wide variety of forms, including:
- restrictions on exploration, production, imports and exports,
- the awarding or denial of exploration and production interests,
- the imposition of specific seismic and/or drilling obligations,
- price controls,
- tax or royalty increases, including retroactive claims,
- nationalisation or expropriation of our assets,
- unilateral cancellation or modification of our licence or contract rights,
- the renegotiation of contracts,
- payment delays, and
- currency exchange restrictions or currency devaluation.
The likelihood of these occurrences and their overall effect on us vary greatly from country to country and are not predictable. If such risks materialise, they could cause us to incur material costs or cause our production to decrease, potentially having a material adverse effect on our operations or financial condition.
Our activities in certain countries could lead to US sanctions.
In October 2002, we signed a participation agreement with Petropars of Iran, pursuant to which we assumed the operatorship for the offshore part of phases 6-7-8 of the South Pars gas development project in the Persian Gulf. Adjusted for an impairment in 2005, a partial reversal of impairment in 2009 and cumulative depreciation charges, the net book value was USD 306.2 million at year end 2009. In addition, as a result of the merger with Norsk Hydro's oil and gas business, Statoil owns a 75% interest in the Anaran Block in Iran, which was acquired by Norsk Hydro in 2000. Following the commerciality declaration of the Azar discovery in the Anaran Block in August 2006, Norsk Hydro agreed to conduct negotiations with the National Iranian Oil Company for a Master Development Plan and a Development Service Contract. The Anaran Block is currently in the exploration phase. Statoil had invested USD 104 million in the project but this amount has been fully written off following an impairment review in 2008. Work on th is project has stopped. Also as a result of the merger, Statoil now owns a 100% interest in the Khorramabad Exploration Block, for which Statoil is the operator. In September 2006, Norsk Hydro signed the Khorramabad Exploration and Development Contract with the National Iranian Oil Company, with a total commitment of USD 49.5 million over four years related to seismic surveys and other exploration activities. We completed the gathering of seismic data in the Khorramabad Exploration Block in the fourth quarter of 2008. No further activity is planned for this license. See section 3.2.5.5.1 Operational Review - International E&P - The Middle East and Asia - Iran.
In congressional testimony to the House Foreign Affairs Sub-committee on the Middle East and South Asia in October 2009, Assistant Secretary of State for Near Eastern Affairs, Jeffrey D. Feltman, testified that the Obama Administration intends to review oil and gas investments in Iran by foreign companies for potential violations of the Iran Sanctions Act of 1996 (ISA). Following this testimony, Statoil has, on a voluntary basis, provided officials from the U.S. State Department with information about its activities and investments in Iran. The ISA requires the President of the United States to sanction companies that invest more than USD 20 million during any 12-month period in Iran's energy sector. Such sanctions could include denial of US bank loans and restrictions on the importation of goods produced by the sanctioned company. We cannot predict the interpretation or implementation of US governmental policies under the ISA with respect to our activities in Iran. It is possible that the US authorities may determine that our investments in Iran or other related projects constitute activity covered by the ISA and, as a result, may subject us to sanctions.
Certain countries, including Iran and Cuba, have been identified by the US State Department as state sponsors of terrorism. Our activities in Cuba consist of a 30% interest in six deepwater exploration blocks acquired from Repsol-YPF in 2006. As at 31 December 2009, we had invested USD 12.5 million in these projects. These activities are not material to our business, financial condition or results of operations, as the total amount invested in these operations represented less than 0.03% of our total assets as of 31 December 2009.
We are aware that the U.S. Congress is considering legislation that would tighten U.S. sanctions against Iran, primarily targeting the sale of refined petroleum to Iran. We are also aware of initiatives by certain US states and US institutional investors, such as pension funds, to adopt or consider adopting laws, regulations or policies requiring divestment from, or reporting of interests in, companies that do business with countries designated as state sponsors of terrorism. These policies could have an adverse impact on investment by certain investors in our securities.
We are exposed to potentially adverse changes in the tax regimes of each jurisdiction in which we operate.
We operate in 40 countries around the world, and any of these countries could modify its tax laws in ways that would adversely affect us. Most of our operations are subject to changes in tax regimes in a similar manner to other companies in our industry. In addition, in the long-term, the marginal tax rate in the oil and gas industry tends to change with the price of crude oil. Significant changes in the tax regimes of countries in which we operate could have a material adverse affect on our liquidity and the results of our operations.
We are exposed to potential losses and could be seriously harmed by natural disasters, operational catastrophes or security breaches.
Exploration for, the production of, and the transportation of oil and natural gas is hazardous, and natural disasters, operator error or other occurrences can result in oil spills, gas leaks, loss of containment of hazardous materials exposed to blowouts, cratering, fires, equipment failure and loss of well control. Failure to manage these risks could result in injury or loss of life, damage or destruction of wells and production facilities pipelines and other property and damage to the environment. All modes of transportation of hydrocarbons contain inherent risks. A loss of contaminant of hydrocarbons and other hazardous materials could occur during transportation by road, rail, sea or pipeline. Given the high volumes involved, this is a significant risk due to the potential impact of a release on the environment and people.
Offshore operations are subject to marine perils, including severe storms and other adverse weather conditions, vessel collisions and governmental regulations, as well as interruptions or termination by governmental authorities based on environmental and other considerations. Losses and liabilities arising from such events would significantly reduce our revenues or increase our costs and have a material adverse effect on our operations or financial condition.
We are exposed to risks regarding the safety and security of our operations. Inability to provide safe environments for our workforce and the public could lead to injuries or loss of life and could result in regulatory action, legal liability and damage to our reputation. Security threats require continuous oversight and control. Acts of terrorism against our plants and offices, pipelines, transportation or computer systems could severely disrupt businesses and operations and could cause harm to people.
Our crisis management systems may be ineffective.
We have developed contingency plans to continue or recover operations following a disruption or incident. Inability to restore or replace critical capacity to an agreed level within an agreed time frame could prolong the impact of any disruption and could severely affect business and operations. Likewise, we have crisis management plans and capability to deal with emergencies at every level of our operations. If we do not respond or are not perceived to respond in an appropriate manner to either an external or internal crisis, our business and operations could be severely disrupted.
The crude oil and natural gas reserve data in this annual report are only estimates, and our future production, revenues and expenditures with respect to our reserves may differ materially from these estimates.
The reliability of proven reserve estimates depends on:
- the quality and quantity of our geological, technical and economic data;
- whether the prevailing tax rules and other government regulations, contracts and oil, gas and other prices will remain the same as on the date estimates are made;
- the production performance of our reservoirs; and
- extensive engineering judgments.
Many of the factors, assumptions and variables involved in estimating reserves are beyond our control and may prove to be incorrect over time. Results of drilling, testing and production after the date of the estimates may require substantial upward or downward revisions in our reserve data. In addition, fluctuations in oil and gas prices will have an impact on our proven reserves relating to fields governed by Production Sharing Agreements, or PSAs, since part of our entitlement under PSAs relates to the recovery of development costs. Any downward adjustment could lead to lower future production and thus adversely affect our financial condition, future prospects and market value.
We face foreign exchange risks that could adversely affect the results of our operations.
Our business faces foreign exchange risks because a large percentage of our revenues and cash receipts are denominated in US dollars, while sales of refined products may be in a variety of currencies. Fluctuations between the US dollar and other currencies may adversely affect our business and can give rise to foreign exchange exposures with a consequent impact on underlying costs and revenues. See section 5.2.1 Risk review - Risk management - Managing financial risk.
We are exposed to risks relating to trading and supply activities.
Statoil is engaged in substantial trading and commercial activities in the physical markets and it also uses financial instruments such as futures, options, over-the-counter (OTC) forward contracts, market swaps and contracts for differences related to crude oil, petroleum products, natural gas and electricity in order to manage price volatility. We also use financial instruments to manage foreign exchange and interest rate risk.
Although Statoil believes it has established appropriate risk management procedures, trading activities involve elements of forecasting and Statoil bears the risk of market movements - the risk of significant losses if prices develop contrary to expectations - and the risk of default by counterparties. See section 5.2.1 Risk review - Risk management - Managing financial risk for more information regarding risk management. Any of these risks could have an adverse effect on the results of our operations and financial condition.
The global financial turmoil may have impacts on our liquidity and financial condition that we cannot currently predict.
The current economic situation could lead to reduced demand for oil and natural gas or reductions in the prices of oil and natural gas, or both, which would have a negative impact on our financial position, results of operations and cash flows. Governments will be facing greater pressure on public finances, leading to a risk of increased taxation. These factors may also lead to intensified competition for market share and available margin, with consequential potential adverse effects on volumes. The financial and economic situation may have a negative impact on third parties with whom we do, or may do, business. While the ultimate outcome and impact of the current financial turmoil cannot be predicted, it may have a material adverse effect on our future liquidity, results of operations and financial condition.
We may fail to attract and retain senior management and skilled personnel.
The attraction and retention of senior management and skilled personnel is a critical factor in the successful execution of our strategy as an international oil and gas group. We may not always be successful in hiring or retaining suitable senior management and skilled personnel. Failure to recruit or retain senior management and skilled personnel or more generally maintain good employee relations could compromise achievement of our strategy and cause disruption to the management structure and relationships, an increase in costs associated with staff replacement, lost business relationships or reputational damage. An inability to attract or retain suitable employees could have a significant adverse impact on our ability to operate.
Failure to meet our ethical and social standards could harm our reputation and our business.
Our code of conduct, which applies to all employees of the group, including hired personnel, consultants, intermediaries, lobbyists and others who act on our behalf, defines our commitment to high ethical standards and compliance with applicable legal requirements wherever we operate. Incidents of ethical misconduct or non-compliance with applicable laws and regulations could be damaging to our reputation, competitiveness and shareholder value. Multiple events of non-compliance could call into question the integrity of our operations.
We set ourselves high standards of corporate citizenship and aspire to contribute to a better qualify of life through the products and services we provide. If it is perceived that we are not respecting or advancing the economic and social progress of the communities in which we operate, our reputation and shareholder value could be damaged.
5.1.2 Risks related to the regulatory regime
This section discusses potential risks to our business relating to the regulatory regime, such as having to comply with new laws and regulations.
Competition is expected to increase in the European gas market, currently our main market for gas sales, as a result of European Union (EU) directives.
The general liberalisation of European gas markets which could adversely affect our ability to expand or even maintain our current market position or result in a reduction in prices in our gas sales contracts.
Fundamental changes continue to take place in the organisation and operation of the European gas market with the objective of opening national markets to competition and integrating them into a single market for natural gas. This process started with the EU Gas Directive, which became effective in August 2000.
In July 2009, the EU adopted an expansive legislative package setting out new regulations for the internal markets in energy, electricity and gas which will enter into force in March 2011. The new regulations contain numerous requirements for energy companies relating to supply, transmission, and distribution. The requirements include greater separation of production and supply activities from transmission and distribution activities; the establishment of independent national electricity regulators charged with supporting a competitive, secure and environmentally-sustainable internal markets in electricity and gas; and the harmonization of technical standards in order to promote cross-border collaboration and investment. The new regulations also provide for a European Agency for the Cooperation of Energy Regulators with competence to oversee many parts of the legislative package.
Another EU initiative likely to impact on the market for gas involves the environmental package implemented in December 2008, which strengthens and extends the Emissions Trading Scheme and creates national targets for renewable energy. This will have positive and negative impacts on the competitive position of natural gas as a fuel.
The third focus area of EU energy policy is supply security and this has led to increased focus on projects diversifying gas supplies to the EU. As a result, the Caspian region, where Statoil participates in the Shah Deniz field, is now receiving increasing attention from the EU. Solutions to bring Caspian gas to Europe are receiving political support from the EU in an attempt to resolve the complex transportation issue in the region.
Most of our gas is sold under long-term gas contracts to customers in the EU, a gas market that will continue to be affected by changes in EU regulations and the implementation of such regulations in EU member states. As a result of the directives, our ability to expand or even maintain our current market position could be materially adversely affected and quantities sold under our gas sales contracts may be subject to a material reduction in gas prices.
We may incur material costs in connection with complying with, or as a result of, health, safety and environmental laws and regulations.
Compliance with environmental laws and regulations in Norway and abroad could materially increase our costs. We incur, and expect to continue to incur, substantial capital and operating costs relating to compliance with increasingly complex laws and regulations covering the protection of the environment and human health and safety, including:
- costs of reducing certain types of emissions to air and discharges to the sea
- remediation of environmental contamination at various owned and previously-owned facilities and at third party sites where our products or waste have been handled or disposed of
- compensation of persons claiming damages caused by our activities or accidents, and
- costs in connection with the decommissioning of drilling platforms and other facilities.
The Norwegian Petroleum Safety Authority (PSA) was established on 1 January 2004, with regulatory responsibility for safety, emergency preparedness and the working environment for all petroleum-related activities. See section 3.10 Operational Review-Regulation.
In our capacity as holder of licences on the NCS under the Norwegian Petroleum Act of 29 November 1996, we are subject to statutory strict liability in respect of losses or damage suffered as a result of pollution caused by spills or discharges of petroleum from petroleum facilities covered by any of our licences. This means that anyone who suffers losses or damage as a result of pollution caused by operations in any of our NCS licence areas can claim compensation from us without needing to demonstrate that the damage is due to any fault on our part.
Whether in Norway or abroad, new laws and regulations, the imposition of tougher requirements on licences, increasingly strict enforcement of or new interpretations of existing laws and regulations, or the discovery of previously unknown contamination may require future expenditure in order to:
- modify operations
- install pollution control equipment
- implement additional safety measures
- perform site clean-ups, or
- curtail or cease certain operations.
In particular, we may be required to incur significant costs to comply with the 1997 Kyoto Protocol to the United Nations Framework Convention on Climate Change, known as the Kyoto Protocol, and other pending EU laws and directives. In addition, increasingly strict environmental requirements, including those relating to petrol sulphur levels and diesel quality, affect product specifications and operational practices. Future expenditure to meet such specifications could have a material adverse effect on our operations or financial condition.
Compliance with laws, regulations and obligations relating to climate change and other environmental regulations could result in substantial capital expenditure, reduced profitability from changes in operating costs, and revenue generation and strategic growth opportunities being affected. Many of our mature fields are producing increasing quantities of water with oil and gas. Our ability to dispose of this water in environmentally acceptable ways may have an impact on our oil and gas production.
If we do not apply our resources to overcome the perceived trade-off between global access to energy and the protection or improvement of the natural environment, we could fail to live up to our aspirations of no or minimal damage to the environment and contributing to human progress.
Political and economic policies of the Norwegian State could affect our business.
The Norwegian State plays an active role in the management of NCS hydrocarbon resources. In addition to its direct participation in petroleum activities through the State's Direct Financial Interest (SDFI) and its indirect impact through tax and environmental laws and regulations, the Norwegian State awards licences for reconnaissance, production and transportation, and it approves, among other things, exploration and development projects, gas sales contracts and applications for (gas) production rates for individual fields. The Norwegian State may, if important public interests are at stake, also instruct us and other oil companies to reduce the production of petroleum. Furthermore, in the production licences in which the SDFI holds an interest, the Norwegian State retains the ability to direct petroleum licencees' actions in certain circumstances.
If the Norwegian State were to take additional action pursuant to its extensive powers over activities on the NCS or to change laws, regulations, policies or practices relating to the oil and gas industry, our NCS exploration, development and production activities and results of our operations could be materially and adversely affected. For more information about the Norwegian State's regulatory powers, see section 3.10 Operational Review-Regulation.
5.1.3 Risks related to Norwegian state ownership
This section discusses some of the potential risks relating to our business that could derive from the majority ownership by the Norwegian State as well as our involvement in the SDFI.
The interests of our majority shareholder, the Norwegian State, may not always be aligned with the interests of our other shareholders, and this may affect our decisions relating to the NCS.
The Norwegian Parliament, known as the Storting, and the Norwegian State have resolved that the Norwegian State's shares in Statoil and the SDFI's interest in NCS licences must be managed in accordance with a coordinated ownership strategy for the Norwegian State's oil and gas interests. Under this strategy, the Norwegian State has required us to continue to market the Norwegian State's oil and gas together with our own as a single economic unit.
Pursuant to the coordinated ownership strategy for the Norwegian State's shares in Statoil and the SDFI, the Norwegian State requires us, in our activities on the NCS, to take account of the Norwegian State's interests in all decisions that may affect the development and marketing of our own and the Norwegian State's oil and gas.
The Norwegian State held 67% of our ordinary shares as of 12 March 2010. A two-thirds majority is required to decide matters submitted to a vote of shareholders, and the Norwegian state effectively has the power to influence the outcome of any shareholder vote due to the size of its percentage ownership of our shares, including amending our articles of association and electing all non-employee members of the corporate assembly. The employees are entitled to be represented by up to one-third of the members of the board of directors and one-third of the corporate assembly.
The corporate assembly is responsible for electing our board of directors. It also makes recommendations to the general meeting concerning the board of directors' proposals relating to the company's annual accounts, balance sheet, allocation of profits and coverage of loss. The interests of the Norwegian State in deciding these and other matters and the factors it considers in exercising its votes, especially under the coordinated ownership strategy for the SDFI and our shares held by the Norwegian State, could be different from the interests of our other shareholders. Accordingly, when making commercial decisions relating to the NCS, we have to take the Norwegian State's coordinated ownership strategy into account, and we may not be able to fully pursue our own commercial interests, including those relating to our strategy for the development, production and marketing of oil and gas.
If the Norwegian State's coordinated ownership strategy is not implemented and pursued in the future, then our mandate to continue to sell the Norwegian State's oil and gas together with our own as a single economic unit is likely to be prejudiced. Loss of the mandate to sell the SDFI's oil and gas could have an adverse effect on our position in our markets. For further information about the Norwegian State's coordinated ownership strategy, see section 3.13 Operational review-Related party transactions.
5.2 Risk management
Our overall risk management approach includes identifying, evaluating, and managing risk in all our activities. We manage risk in order to ensure safe operations and to reach our corporate goals in compliance with our requirements.
We have an enterprise-wide risk management approach, which means we:
- have a risk and reward focus at all levels of the organisation,
- evaluate significant risk exposure related to major commitments,
- manage and coordinate risk at corporate level.
We divide risk management into three categories:
- Strategic risks, which are long-term fundamental risks monitored by our Corporate Risk Committee. Our Corporate Risk Committee, which is headed by our chief financial officer and which includes, among others, representatives of our principal business segments, is responsible for reviewing, defining and developing our strategic market risk policies. The committee meets monthly to decide our risk management strategies, including hedging and trading strategies and valuation methodologies.
- Tactical risks, which are short-term trading risks based on underlying exposures managed by our principle business segment line managers, and
- Operational risks such as those described under risk factors and which cover all major operational goals and underlying risk drivers are managed by our principle business segment line managers. In addition, insurable risks are managed by our captive insurance company operating in the Norwegian and international insurance markets.
To address our strategic and tactical risks, we have developed policies aimed at managing the volatility inherent in some of these natural business exposures, and, in accordance with these policies, we enter into various financial and commodity-based transactions (derivatives). While the policies and mandates are set at the group level, the business areas responsible for marketing and trading commodiites are also responsible for managing the commodity-based price risks. The interest, liqudity, liability and credit risks are managed centrally by the finance department.
The following section describes in some detail the market risks that we are exposed to and how we manage these risks.
5.2.1 Managing financial risk
The results of our operations depend on a number of factors, most significantly those that affect the price we receive in NOK for our products.
Specifically, such factors include the level of crude oil and natural gas prices, trends in the exchange rate between the USD, in which the trading price of crude oil is generally stated and to which natural gas prices are frequently related, and NOK, in which our accounts are reported and a substantial proportion of our costs are incurred; our oil and natural gas production volumes, which in turn depend on entitlement volumes under PSAs and available petroleum reserves, and our own, as well as our partners' expertise and cooperation in recovering oil and natural gas from those reserves; and changes in our portfolio of assets due to acquisitions and disposals.
Our results will also be affected by trends in the international oil industry, including possible actions by governments and other regulatory authorities in the jurisdictions in which we operate, or possible or continued actions by members of the Organisation of Petroleum Exporting Countries (OPEC) that affect price levels and volumes; refining margins; increasing cost of oilfield services, supplies and equipment; increasing competition for exploration opportunities and operatorships, and deregulation of the natural gas markets, which may cause substantial changes to the existing market structures and to the overall level and volatility of prices.
The following table shows the yearly averages for quoted Brent Blend crude oil prices, natural gas contract prices, fluid catalytic cracking (FCC) margins and the USD/NOK exchange rates for 2009, 2008 and 2007.
Yearly average | 2009 | 2008 | 2007 | 2006 |
Crude oil (USD/bbl brent blend) | 58.0 | 91.0 | 70.5 | 63.2 |
Natural gas (NOK per scm)(1) | 1.9 | 2.4 | 1.7 | 1.9 |
FCC margins (USD/bbl)(2) | 4.3 | 8.3 | 7.5 | 7.1 |
USDNOK average daily exchange rate | 6.3 | 5.6 | 5.9 | 6.4 |
|
|
|
|
|
(1) From the Norwegian Continental Shelf. |
|
|
| |
(2) Refining margin. |
|
|
|
|
The illustration shows how certain changes in the crude oil price, natural gas contract prices and the USD/NOK exchange rate, if sustained for a full year, could affect our financial results in 2010.
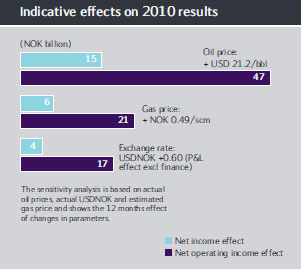
The estimated sensitivity of our financial results to each of the factors has been estimated based on the assumption that all other factors would remain unchanged. The estimated effects on the financial results would differ from those that would actually appear in our consolidated financial statements because our consolidated financial statements would also reflect the effect on depreciation, trading margins, exploration expenses, inflation, potential tax system changes and the effect of any hedging programmes in place.
Our oil and gas price hedging policy is designed to assist our long-term strategic development and our attainment of targets by protecting financial flexibility and cash flows.
Fluctuating foreign exchange rates can have a significant impact on our operating results. Our revenues and cash flows are mainly denominated in or driven by US dollars, while our operating expenses and income taxes payable largely accrue in NOK. We seek to manage this currency mismatch by issuing or swapping long-term debt in USD. This debt policy is an integrated part of our total risk management programme. We also engage in foreign currency hedging in order to cover our non-USD needs, which are primarily in NOK. We manage the risk arising from our interest rate exposure through the use of interest rate derivatives, primarily interest rate swaps, based on a benchmark for the interest reset profile of our long-term debt portfolio. In general, an increase in the value of USD in relation to NOK can be expected to increase our reported earnings. Please see notes 6 Financial risk management, 30 Financial instruments by category and 31 Financial instruments: measurement and market risk sensitivities to the co nsolidated financial statements for quantitative and qualitative disclosures about market risk.
We sell the Norwegian State's share of oil and natural gas production from the NCS. Amounts payable to the Norwegian State for these purchases are included as Accounts payable - related parties in the consolidated balance sheets. The pricing of the crude oil is based on market reflective prices. NGL prices are based on either attained prices, market value or market reflective prices.
Statoil sells, in its own name, but for the Norwegian State's account and risk, the State's natural gas production. This sale, as well as related expenses refunded by the State, is shown net in our financial statements. Expenses refunded by the State include expenses incurred in connection with activities and investments that are necessary in order to secure market access and optimise the profit from the sale of the Norwegian State's natural gas. For sales of the Norwegian State's natural gas, both for our own use and to third parties, the payment to the Norwegian State is based on prices attained, a net back formula or market value. We purchase a small proportion of the Norwegian State's gas. For further details, see section 3.13 Operational review-Related party transactions.
High oil prices have contributed to higher earnings and profitability from international projects with PSAs than previously anticipated. Under a PSA, the partners are generally entitled to production volumes that cover the development costs and an agreed share of the remaining volumes. When oil prices are high, this means that these projects will move from a phase where earnings cover development costs to a phase where profits are generated at an earlier point in time. In PSA contracts, the higher the oil price, the sooner the field is profitable and the smaller the share of production that goes to the partners. The actual effect varies between different agreements and countries. Often these tax regimes are asymmetric, i.e. the company's upside is somewhat limited while the company is fully exposed to the downside. See Financial analysis and review - continued deliveries in turbulent markets - sales volumes for a description of the impact of the PSA effects.
Historically, our revenues have largely been generated from the production of oil and natural gas on the NCS. Norway imposes a 78% marginal tax rate on income from offshore oil and natural gas activities (a symmetrical tax system). See section 3.10.5 Operational review-Regulation-Taxation of Statoil. Our earnings volatility is moderated as a result of the significant proportion of our Norwegian offshore income that is subject to a 78% tax rate in profitable periods, and the significant tax assets generated by our Norwegian offshore operations in any loss-making periods. Most of the taxes we pay are paid to the Norwegian State. Since 1 January 2004, dividends received have not been subject to tax in Norway. Exemptions are granted for dividends from low-tax countries or portfolio investments outside the EEA.
Government fiscal policy is an issue in several of the countries in which we operate, such as, but not limited to, Venezuela, the United States, Nigeria, Algeria and Angola. For instance, government fiscal policy could require royalties in cash or in kind, increased tax rates, increased government participation, and changes in terms and conditions as defined in various production or income-sharing contracts. Our financial statements are based on currently enacted regulations and on any current claims from tax authorities regarding past events. Developments in government fiscal policy may have a negative effect on future net income.
Financial risk management
Statoil's business activities naturally expose the group to financial risk. The group's approach to risk management includes identifying, evaluating, and managing risk in all activities using a top-down approach for the purpose of avoiding sub-optimisation and utilising correlations observed from a group perspective. Only summing up the different market risks without including the correlations will overestimate our total market risk. For this reason the group utilises correlations between all the most important market risks, such as oil and natural gas prices, product prices, currencies, and interest rates, to calculate the overall market risk and thereby utilise the natural hedges embedded in our portfolio. This approach also reduces the number of unnecessary transactions, which reduces transaction costs and avoids sub-optimisation.
In order to achieve the above effects, the group has centralised trading mandates (financial positions taken to achieve financial gains, in addition to established policies) such that all major/strategic transactions are co-ordinated through our Corporate Risk Committee. Local trading mandates are therefore relatively small.
The group's Corporate Risk Committee, which is chaired by the chief financial officer and includes representatives of the principal business segments, is responsible for defining, developing, and reviewing the group's risk policies. The chief financial officer, assisted by the Corporate Risk Committee, is also responsible for overseeing and developing Statoil's enterprise-wide risk management and proposing appropriate measures to adjust risk at the corporate level. The committee meets at least six times per annum and regularly receives risk information relevant to the group from our corporate risk department.
The financial risk management covers market risks, including commodity price risk, interest rate risk, currency risk and equity price risk; liquidity risk; and credit risk.
Market risk
Statoil operates in the worldwide crude oil, refined products, natural gas and electricity markets and is exposed to market risks, including fluctuations in hydrocarbon prices, foreign currency rates, interest rates and electricity prices that can affect the revenues and costs of operating, investing and financing. These risks are primarily managed on a short-term basis with the focus on achieving the highest risk-adjusted returns for the group within the given mandate. Long-term positions, defined as having a time horizon of six months or more, are managed at the corporate level while short-term positions are managed at segment and lower levels in accordance with trading strategies and mandates approved by the Corporate Risk Committee.
The group has established guidelines for entering into contractual arrangements (derivatives) in order to manage its commodity price, foreign currency rate, and interest rate risk. The group uses both financial and commodity-based derivatives to manage the risks in revenues and the present value of future cash flows.
Commodity price risk
Commodity price risk is our most important tactical market risk. To manage commodity price risk, we enter into commodity-based derivative contracts, which consist of futures, options, over-the-counter (OTC) forward contracts, market swaps and contracts for differences related to crude oil, petroleum products, natural gas and electricity.
Derivatives associated with crude oil and petroleum products are mainly traded on the InterContinental Exchange (ICE) in London, the New York Mercantile Exchange (NYMEX), the OTC Brent market, and in crude and refined products swaps markets. Derivatives associated with natural gas and electricity are mainly OTC physical forwards and options, Nordpool forwards, and futures traded on the NYMEX and ICE.
The term of oil and refined oil products derivatives is usually less than one year and the term for natural gas and electricity derivatives is three years or less. The commodity price risk is managed by the marketing and trading organisations in the Natural Gas and Manufacturing & Marketing business areas, respectively. The risks are managed in the trading currencies of the commodities in question, and not necessarily in the functional or reporting currency of the company.
Currency risk
We consider Statoil to be a USD company for currency management purposes. Fluctuations in exchange rates can have significant effects on our results. Foreign exchange risk is assessed on a portfolio basis in accordance with approved strategies and mandates. We only use well-understood, conventional derivative instruments, including futures and options traded on regulated exchanges, OTC swaps, options and forward contracts.
Our cash inflows are largely denominated in or driven by USD, while our cash outflows mainly derive from tax and dividend payments in NOK, as well as certain investments, payment of salaries and various other costs payable in NOK. Accordingly, our exposure to foreign currency rates is primarily related to USD versus NOK. We seek to manage this currency mismatch by issuing or swapping non-current financial debt into USD.
We further seek to manage short-term currency mismatches by using derivative instruments for both currency and liquidity management purposes. Typically, we purchase NOK during the course of a calendar year in order to cover projected NOK payments of Norwegian income taxes and dividends in the first half of the subsequent year. This means, from time to time, that we purchase substantial amounts in NOK on a forward basis using derivative instruments.
Interest rate risk
The group has assets and liabilities with variable interest rates that expose the group to cash flow risk caused by market interest rate fluctuations. The group enters into interest rate derivatives, particularly interest rate swaps, to alter interest rate exposure, to lower expected funding costs over time and to diversify sources of funding. By using the fixed interest rate debt market when issuing new debt while at the same time altering the interest rate exposure by entering into interest rate swaps, funding sources becomes more diversified than if we were only able to use the floating rate debt market.
We principally manage the group's interest rates by converting cash flows from the long-term debt portfolio issues with fixed coupon rates ends into floating rate interest payments. Bond issues are normally issued at fixed rates in local currency (JPY, EUR, CHF, GBP and USD). These bonds are converted to floating USD bonds by using interest rate and currency swaps. Under interest rate swaps, the group agrees with other parties to exchange, at specified intervals, the difference between interest amounts calculated by reference to an agreed notional principal amount and agreed fixed or floating interest rates. The group's interest rate policy also includes a mandate to deviate from base policy and keep part of the long-term debt in fixed interest rates.
Equity price risk
The group's captive insurance company held listed equity securities as a part of its portfolio. In addition, the group has some other non-listed equity securities acquired for long-term strategic purposes. By holding these assets, the group is exposed to equity price risk defined as the risk of declining equity prices leading to a decline in the fair value of the group's assets recognised in the balance sheet. The equity price risk in the portfolio held by the group's captive insurance company with the aim of maintaining a moderate risk profile is managed through geographical diversification, the use of broad benchmark indexes and the use of several different fund managers.
Liquidity risk
Liquidity risk is the risk that we will not be able to meet our obligations when they fall due. The purpose of liquidity and short-term liability management is to make certain that the group has sufficient funds available at all times to cover financial obligations.
On a monthly basis, Statoil's business activities normally generate a positive cash flow from operations. However, in months when taxes are paid (February, April, June, August, October and December) or annual dividend is paid (typically in May/June) cash flows are typically limited. Our operating cash flows are negatively affected by declines in oil and gas prices. However, during 2009, our overall liquidity position remained strong and our policies for managing liquidity remained unchanged.
As a rule, the amount of liquid assets will follow a cyclical pattern and increase from month to month, with the exception of months with tax or dividend payments, when the amount is sharply reduced. In the period following tax and dividend payments, the amount of liquid assets will often be significantly reduced. A need for short-term funding will then be triggered for a period until the debt is repaid. This is subsequently followed by a new accumulation of liquid assets.
Short-term funding can be carried out bilaterally through direct borrowing from banks, insurance companies, etc. An alternative is to issue short-term debt securities under one of the existing funding programmes or under documentation established ad hoc. These funding programmes are as follows:
- A USD 4 billion US commercial paper programme. This is the most flexible programme used for working capital, including timing issues on corporate tax and dividend payments, as well as for periodic acquisition financing.
- A USD 2 billion committed multi-currency revolving credit facility from international banks, including a USD 500 million swing-line facility. The facility was entered into in 2004, and is available for draw-downs until December 2011. This facility is primarily intended as a "back-up" facility for the US commercial paper programme, and should be regarded as support for the credit rating of this programme.
- Uncommitted credit lines. A short-term funding source occasionally required over and above the other short-term programmes and accumulated cash.
In order to have access to sufficient liquidity at all times, Statoil defines and continuously maintains a minimum liquidity reserve, which comprises unused committed external credit facilities, cash and cash equivalents, and current financial investments, excluding the current portion of the investment portfolio held by the group's captive insurance subsidiary.
| As at 31 December | ||
Liquid assets (in NOK billion) | 2009 | 2008 | 2007 |
|
|
|
|
Cash & cash equivalents | 24.7 | 18.6 | 18.3 |
Financial investments | 7.0 | 9.7 | 3.3 |
Total liquid assets | 31.7 | 28.4 | 21.6 |
Funding and liability
As a basic principle, we separate investment decisions from financing decisions. Funding needs arise as a result of the group's general business activity. The main rule is to establish financing at corporate level. Project financing may be applied in cases involving joint ventures with other companies.
We aim at all times to maintain access to a variety of funding sources, in respect of both instruments and geography, and to maintain relationships with a core group of international banks that provide various kinds of banking and funding services.
We have credit ratings from Moody's and Standard & Poor's and the stated objective is to have a rating at least within the single A category. This rating ensures necessary predictability when it comes to funding access to favourable terms and conditions. Our current long-term ratings are Aa2 stable outlook and AA- stable outlook from Moody's and Standard & Poor's, respectively. The short-term rating from Moody's is P-1 and A-1+ from Standard & Poor's. We intend to keep financial ratios relating to our debt at levels consistent with our objective of maintaining our long-term credit rating at least within the single A category. To sustain financial flexibility going forward we seek to maintain a credit rating at least within the single A category. In this context we carry out different risk assessments, some of them in line with financial matrices used by S&P and Moody's, such as free funds from operations over net debt and net debt to capital employed.
In order to control our refinancing risk, the maturity and redemption profile of non-current debt we issue, is managed within certain limits. The limits are expressed as maximum annual mandatory redemptions as a share of Statoil's capital employed.
Liquidity forecasts serve as tools for financial planning. In order to maintain necessary financial flexibility, we have requirements for maximum (forecasted) current debt and minimum (forecasted) liquidity reserve. The issuance of long-term debt is used as a tool for reducing current debt and/or increasing the liquidity reserve. New non-current funding will be initiated if liquidity forecasts uncover non-compliance with given limits, unless further detailed considerations indicate that the non-compliance is likely to be very temporary. In such case, the situation will be further monitored before additional non-current debt is drawn.
For further information about our debenture bonds, bank loans and other debt portfolio profile, see note 22 Non-current financial liabilities in the consolidated financial statements.
Statoil's dividend policy includes providing a return to our shareholders through cash dividends and share repurchases. The level of cash dividends and share repurchases can fluctuate in any one year, depending on our assessment of future cash flows, capital expenditure plans, financing requirements and appropriate financial flexibility. See section 6 Shareholder information section for additional information about our dividend policy.
Credit risk
Credit risk is the risk that our customers or counterparties to financial instruments will cause us financial loss by failing to honour their obligations. Credit risk arises from credit exposure in connection with customer accounts receivable as well as from derivative financial instruments and deposits with financial institutions. Theoretically, the group's maximum credit exposure for financial assets is the aggregated balance sheet carrying amounts of financial investments (excluding equity investments of NOK 6.5 billion in 2009 and NOK 6.5 billion in 2008), derivative financial instruments, financial receivables, trade and other receivables, and cash and cash equivalents. The group manages this exposure through its credit risk management policies and procedures.
The recent financial turmoil has resulted in additional focus on the need for all entities to have robust credit policies and close monitoring of associated risks. Over the years, we have established a clear credit policy, which has proven especially valuable during this period of widespread financial pressure. The tools we use to manage and monitor credit risk have been tested by the crisis and no significant credit losses were experienced by the group during 2008 and 2009.
Key elements of our credit risk management approach include:
- A conservative global credit risk policy
- Credit mandates
- Internal credit rating process
- Credit risk mitigation tools
- Continuously monitoring and managing credit exposures.
Prior to entering into transactions with new counterparties, our credit policy requires all counterparties to be formally identified, approved and assigned internal credit ratings as well as exposure limits. Once established, all counterparties are re-assessed at least annually, with high-risk counterparties being reviewed more frequently. The internal credit ratings reflect our assessment of the counterparties' credit risk and are similar to rating categories used by well known credit rating agencies, Standard & Poor's and Moody's. Exposure limits are determined on the basis of assigned internal credit ratings combined with other factors, such as expected transaction and industry characteristics, as outlined in our credit policy. The mandate for setting credit limits is regularly reviewed with regard to changes in market conditions.
Several instruments are available to us to reduce or control credit risk, at both individual counterparty and portfolio level. The main tools used by Statoil are variations of bank and parental guarantees, prepayments and cash collateral. For bank guarantees, only highly rated international banks are accepted.
We manage credit risk at both portfolio and counterparty level. We have pre-defined limits regarding the minimum average credit rating allowed at any given time at the group portfolio level as well as maximum credit exposures for individual counterparties. We monitor the portfolio on a regular basis and individual exposures versus limits on a daily basis. The total credit exposure portfolio of Statoil is well diversified with respect to the number and quality of counterparties and industries, and geographically. Most of our credit exposure is with investment grade counterparties.
The following table contains the average credit exposure by counterparty by internal credit rating and includes the rating categories' share of the group's total exposure:
The following table contains the fair market value of open non-exchange traded derivative assets broken down by our assessment of the counterparty's credit risk:
| At 31 December | ||
Receivables split by counterparty credit rating (in NOK billion) | 2009 | 2008 | 2007 |
|
|
|
|
Counter-party rated: |
|
|
|
Investment grade, rated A or above | 27.7 | 21.7 | 19.6 |
Other investment grade | 16.4 | 7.1 | 0.9 |
Non-investment grade or not rated | 15.0 | 0.8 | 0.7 |
As of 31 December 2009, counterparties have paid NOK 4.7 billion in cash, which is held by us as collateral to offset a portion of this credit exposure.
Consistent with our policies, commodity derivative counterparties have been assigned internal credit ratings corresponding to those of their respective parent companies. In cases where the parent company is highly rated, it may not be necessary to seek a parent company guarantee from such a counterparty.
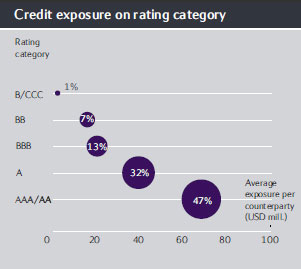
The graph illustrates the magnitude as of 31 December 2009 of our credit risk exposure broken down by our assessment of the counterparties' credit risk. As can be seen from the illustration, most of our credit risk exposure is with counterparties assessed by us as having investment grade credit rating. Our assessment of each counterparty's credit risk is often consistent with the credit ratings published by credit rating agencies but may vary on a case-by-case basis due to differences in the timing and/or the judgments inherent in the specific credit risk assessment. Our assessment of each counterparty's credit risk may also change over time due to changes in company-specific or general conditions.
The illustration above reflects the credit risk exposure that Statoil has to its counterparties as of 31 December 2009. Credit ratings of such counterparties may be subject to revision or withdrawal at any time in accordance with our internal credit rating policy, and any such change to a counterparty's credit rating may affect Statoil's credit risk exposure.
As stated above, in accordance with our internal credit rating policy, we reassess counterparty credit risk at least annually and assess counterparties that we identify as high risk more frequently. The internal credit ratings reflect our assessment of the counterparties' credit risk and are similar to rating categories used by well known credit rating agencies, Standard & Poor's and Moody's. The mandate for setting credit limit is regularly reviewed with regard to changes in market conditions.
5.2.2 Disclosures about market risk
Statoil uses financial instruments to manage commodity price risks, interest rate risks, currency risks and liquidty and funding risks, and significant amounts of assets and liabilities are accounted for as financial instruments.
See note 30 Financial instruments by category to the Consolidated financial statements for details of the nature and extent of such positions, and note 31 Financial instruments measurement and market risk sensitivities for qualitative and quantitative disclosures of the risks associated with these instruments.
5.3 Legal proceedings
We are involved in a number of judicial, regulatory and arbitration proceedings concerning matters arising in connection with the conduct of our business.
Except as set forth below, we are currently not aware of any legal proceedings or claims that we believe could, individually or in the aggregate, have significant effects on our financial position or profitability or on the results of our operations or liquidity.
The AFT case
Statoil ASA issued a declaration to the Norwegian Ministry of Petroleum and Energy (MPE) in 1999 in connection with a dispute between four Åsgard partners and Statoil related to the construction of new facilities for the Åsgard development at the Kårstø Terminal. The declaration confirmed that the MPE will receive similar treatment as the four Åsgard partners with respect to the disputed issues. On the basis of the declaration, the MPE alleged the right to compensation and initiated legal proceedings against Statoil on 29 April 2008 in a writ involving a multi-component claim. The aggregate principal exposure for the claim was estimated to be between NOK 4 and 7 billion after tax. Following a verdict in Stavanger district court on 15 January 2010, Statoil and the MPE on 5 March 2010 reached an amicable settlement of the case pursuant to which both parties waived their rights to appeal the court verdict. Under the terms of the settlement, Statoil has agreed to pay t he MPE a cash compensation of NOK 500 million after tax, and NOK 375 million in pre-tax interest, corresponding to NOK 270 million after tax.
During the fourth quarter of 2008, ExxonMobil, the final Åsgard partner at the time of the original dispute, issued a writ with a compensation claim approximating an estimated exposure of up to NOK 1 billion after tax. The dispute with ExxonMobil was settled in October 2009, and the impact of this settlement on the consolidated financial statements was not material.
The Libya case
Statoil was informed on 26 September 2007 about possible consultancy agreements and transactions associated with Hydro's petroleum activities in Libya, which were transferred to Statoil as of 1 October 2007 as part of the merger with Hydro's petroleum business, and which could be in conflict with applicable Norwegian and US anti-corruption legislation. Following a preliminary assessment by Statoil, an external review was initiated of the relevant aspects. The external US and Norwegian legal counsels that have conducted the review submitted their report to Statoil ASA's CEO on 6 October 2008. The report has also been submitted to the National Authority for Investigation and Prosecution of Economic and Environmental Crime in Norway (Økokrim), the US Department of Justice, the US Securites and Exchange Commission and the Libyan authorities. The report does not draw any legal conclusions. In accordance with the mandate for the review, the report sets out the facts relevant to applicable Norw egian and US anti-corruption legislation to which Statoil ASA may be subject as a result of the merger. On 15 May 2009, Økokrim announced it would not open an investigation related to the international activites of the former Hydro Oil & Energy. Neither the US authorities nor the Libyan authorities have initiated any actions or proceedings in relation to the matters described in the investigation reports.
6 Shareholder information
Statoil is the largest company listed on the Oslo Stock Exchange, where it trades under the ticker code STL. Statoil is also listed on New York Stock Exchange under the ticker code STO.
Statoil share | 2009 | 2008 | 2007 | 2006 | 2005 |
Share price STL high (NOK) | 146.80 | 214.10 | 191.50 | 210.50 | 166.50 |
Share price STL low (NOK) | 108.90 | 96.40 | 151.50 | 147.25 | 91.25 |
Share price STL average (NOK) | 129.50 | 153.60 | 169.70 | 174.25 | 130.60 |
Share price STL year-end (NOK) | 144.80 | 113.90 | 169.00 | 165.25 | 155.00 |
|
|
|
|
|
|
Market value year-end (NOK billion) | 462 | 363 | 539 | 358 | 336 |
Daily turnover (million shares) | 9.6 | 13.5 | 16.5 | 12.6 | 10.1 |
|
|
|
|
|
|
Ordinary and diluted earnings per share (EPS) (NOK) 1) | 5.75 | 13.58 | 13.80 | 15.82 | 14.19 |
P/E 1) 2) | 25.18 | 8.39 | 12.25 | 10.45 | 10.92 |
|
|
|
|
|
|
Total dividend per share (NOK) 3) | 6.00 | 7.25 | 8.50 | 9.12 | 8.20 |
Ordinary dividend per share (NOK) 3) | 6.00 | 4.40 | 4.20 | 4.00 | 3.60 |
Special dividend per share (NOK) | 0.00 | 2.85 | 4.30 | 5.12 | 4.60 |
Growth in ordinary dividend per share 4) | 36.4 % | 4.8 % | 5.0 % | 11.1 % | 12.5 % |
Growth in total dividend per share | -17.2 % | -14.7 % | -6.8 % | 11.2 % | 54.7 % |
Total dividend per share (USD) 5) | 1.04 | 1.26 | 1.47 | 1.58 | 1.42 |
Pay-out ratio 6) | 104% | 53% | 61% | 57% | 58% |
Dividend yield 7) | 4.1 % | 6.4 % | 5.0 % | 5.5 % | 5.3 % |
|
|
|
|
|
|
Net interest bearing debt to capital employed 1) | 27.3% | 17.5% | 12.4% | 20.5 % | 15.1 % |
Ordinary shares outstanding, weighted average | 3,183,873,643 | 3,185,953,538 | 3,195,866,843 | 3,230,849,707 | 2,165,740,054 |
Ordinary shares outstanding, year-end | 3,188,647,103 | 3,188,647,103 | 3,188,647,103 | 3,208,800,400 | 2,189,585,600 |
|
|
|
|
|
|
|
|
|
|
|
|
1) Figures for 2005 are USGAAP, only former Statoil figures. |
|
|
|
|
|
2) Share price at year-end divided by EPS. |
|
|
|
|
|
3) Proposed cash dividend for 2009. |
|
|
|
|
|
4) Excluding special dividend and share buy-back. |
|
|
|
|
|
5) The USD amounts are based on the Norwegian Central Bank's exchange rate at 31 December 2009. |
|
|
| ||
6) Total dividend paid per share divided by EPS. Total capital distribution in 2006 is 67%, including share buy-back of NOK 1.55 per share in 2006. | |||||
7) Total dividend paid per share divided by year-end share price. |
|
|
|
|
|
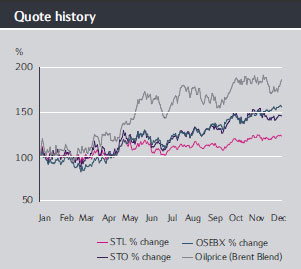
As of 31 December 2009, Statoil represented 31% of the total value of all companies registered on the Oslo Stock Exchange, with a market value of NOK 462 billion.
Statoil's share price closed at NOK 144.80 at the end of 2009. Taking into consideration the dividend of NOK 7.25 per share paid in 2009, the total return was NOK 38.15 or 33%. Quote history shows the development of the Statoil share price compared with the oil price and the Oslo Stock Exchange Benchmark Index (OSEBX).The board of directors proposes a dividend of NOK 6.00 per share for 2009, for approval by the annual general meeting on 19 May 2010. The NOK 6.00 dividend per share it is proposed to distribute to our shareholders is equivalent to a direct yield of approximately 4.1%, and we will distribute 104% of net income from 2009. Net income per share amounted to NOK 5.75 in 2009, a decrease of 57.7% compared with 2008.
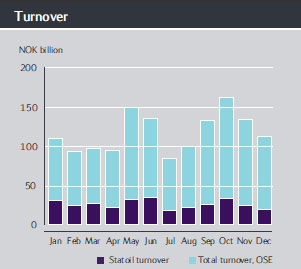
Turnover of shares is a measure of traded volumes. On average, 9.6 million Statoil shares were traded on the Oslo Stock Exchange every day in 2009, a decrease of 29% on the previous year. Statoil shares accounted for 22% of the total market value traded throughout the year (see illustration).
Statoil ASA had 3,188,647,103 ordinary shares outstanding at year end. Statoil ASA has one class of shares, and each share confers one vote at the general meeting.
As of 31 December 2009, Statoil had approximately 103,900 shareholders registered in the Norwegian Central Securities Depository (VPS), which is virtually unchanged from 103,400 shareholders the year before. There is no duty to register as an ADR-holder in the USA, and the actual number of registered ADR holders as of 31 December 2009 was 719, while the number of beneficial holders is not known. Dividend for 2008 was paid to approximately 113,000 beneficiaries in the USA according to the records of The Bank of New York Mellon. The number of American Depositary Receipts traded on the New York Stock Exchange decreased by 28% during the course of the year to 61.3 million shares at the end of 2009.
6.1 Dividend policy
The board of directors has decided to adjust the company's dividend policy in order to create a more predictable dividend level going forward.
It is Statoil's ambition to grow the annual cash dividend, measured in NOK per share, in line with long-term underlying earnings. When deciding the annual dividend level, the Board will take into consideration expected cash flow, capital expenditure plans, financing requirements and appropriate financial flexibility.
In addition to cash dividend, Statoil might buy back shares as part of its total distribution of capital to the shareholders.
The direct link to the IFRS net income has been removed, and the focus will be on growing the annual cash dividend per share in line with long-term underlying earnings. The new policy does not entail a change in the long-term dividend level, including potential share buy-backs, compared with the previous policy. The Board emphasises the importance of also maintaining an attractive dividend level in the future.
6.1.1 Dividends
Dividends for a fiscal year are declared at our annual general meeting in the following year. The Norwegian Public Limited Companies Act forms the legal framework for dividend payments.
Under this Act, dividends may only be paid in respect of a financial period for which audited financial statements have been approved by the annual general meeting of shareholders, and any proposal to pay a dividend must be recommended by the board of directors, accepted by the corporate assembly and approved by the shareholders at a general meeting. The shareholders at the annual general meeting may vote to reduce, but may not increase, the dividend proposed by the board of directors.
We can only distribute dividends (1) if our equity, based on Statoil ASA's unconsolidated balance sheet, amounts to 10% or more of the total assets reflected in our unconsolidated balance sheet without following a creditor notice procedure as required for reducing the share capital, (2) to the extent compatible with good and careful business practice with due regard to any losses that we may have incurred after the last balance sheet date or that we may expect to incur, and (3) provided that the dividend to be distributed is calculated on the basis of our unconsolidated financial statements.
Although we currently intend to pay annual dividends on our ordinary shares, we cannot assure that dividends will be paid or the amount of any dividends. Future dividends will depend on a number of factors prevailing at the time our board of directors considers any dividend payment.
The following table shows the cash dividend amounts paid to all shareholders since 2006 on a per share basis and in the aggregate, as well as cash dividend proposed by our board of directors to be paid in 2010 on our ordinary shares for the fiscal year 2009.
In 2006, 2007, 2008, the total dividend per share consisted of an ordinary dividend and a special dividend. The special dividends paid in these years are the result of increased annual net income due to higher realised oil and gas prices.
|
| Per ordinary share 1) |
|
| |
|
| Ordinary | Special | Total |
|
|
| dividend | dividend | dividend | Total |
Year |
| NOK | NOK | NOK | NOK billion |
2005 |
| 3.60 | 4.60 | 8.20 | 17.8 |
2006 |
| 4.00 | 5.12 | 9.12 | 19.7 |
2007 |
| 4.20 | 4.30 | 8.50 | 27.1 |
2008 |
| 4.40 | 2.85 | 7.25 | 23.1 |
2009 |
| 6.00 | 0.00 | 6.00 | 19.1 |
|
|
|
|
|
|
1) For fiscal years 2008, 2007, 2006 and 2005 the total dividend per share consisted of an ordinary dividend and a special dividend. |
| ||||
The 2009 dividend will be paid on 2 June 2010. |
|
|
|
| |
The proposed dividend for 2009 will be considered by the annual general meeting on 19 May 2010. The Statoil share will be traded ex-dividend from 20 May 2010, and the approved dividend will be disbursed on 2 June 2010.
Since we will only pay dividends in Norwegian kroner (NOK), exchange rate fluctuations will affect the amounts in USD received by holders of ADRs after the ADR depositary converts cash dividends into USD. The dividend will be made availabe to the depository on 2 June 2010. The depository will convert the dividend into USD at the prevailing exchange rate for NOK and pay the US ADR holders the USD equivalent of the dividend in NOK, minus prevailing bank charges. The payment date for dividend in USD to US ADR holders is expected to be 14 June 2010.
Share repurchases
In addition to a cash dividend, Statoil might buy back shares as part of its total distribution of capital to its shareholders. For the period 2009-2010, the board of directors did not ask the annual general meeting of Statoil for an authorisation to repurchase Statoil shares in the market for subsequent annulment. We did not undertake any share repurchases in 2009 and 2008, and no shares were acquired in the market for subsequent cancellation. In 2006, a number of 20,158,848 shares were repurchased for the total amount of NOK 3.3 billion.
There is no guarantee that share repurchases will continue in the future. Future share repurchases will depend on the authorisation of our shareholders, as well as a number of factors prevailing at the time our board of directors considers any share repurchase.
6.2 Equity securities purchased by issuer
Shares are acquired in the market for transfer to employees under the share savings scheme in accordance with the limits set by the board. However, no shares were repurchased in the market for the purpose of subsequent cancellation in 2009.
6.2.1 Statoil share savings plan
Since 2004, Statoil has had a share savings plan for all employees of the group. The purpose of this plan is to strengthen the business culture and encourage loyalty through employees becoming part-owners of the company.
Through regular salary deductions, employees can invest up to 5% of their base salary in Statoil shares. In addition, the company contributes 20% of the amount, up to a maximum of NOK 1,500 per year (approximately USD 250). This company contribution is a tax-free employee benefit under the current Norwegian tax legislation. After a lock-in period of two calendar years, one extra share will be awarded for each share purchased. Under current Norwegian tax legislation, the share award is a taxable employee benefit, with a value equal to the value of the shares and taxed at the time of the award. Shares transferred to employees are acquired by the company in the market.
The board of directors is authorised to acquire Statoil shares in the market on behalf of the company. The authorisation can be used to acquire own shares for a total nominal value of up to NOK 15 million. Shares acquired pursuant to this authorisation may only be used for sale and transfer to employees of the Statoil group as part of the group's share saving scheme, as approved by the board of directors. The minimum and maximum amounts that may be paid per share are NOK 50 and 500, respectively. Within these limits, the board of directors can freely decide when to acquire shares, although the purchases follow a fixed plan for one year at a time.
The authorisation was renewed by the annual general meeting on 19 May 2009 and is valid until the next annual general meeting, but not beyond 30 June 2010. This authorisation replaces the previous authorisation to acquire own shares for implementation of the share saving scheme for employees granted by the annual general meeting on 20 May 2008.
The nominal value of each share is NOK 2.50. With a maximum overall nominal value of NOK 15 million, the authorisation for the repurchase of shares in connection with the group's share savings plan covers the repurchase of no more than six million shares.
Period in which shares where repurchased | Number of shares repurchased |
| Average price per share in NOK |
| Total number of shares purchased as part of program (1) | Maximum number of shares that may yet be purchased under the program authorisation (1) |
|
|
|
|
|
|
|
January 2009 | 521,800 |
| 116.64 |
| 3,344,324 | 2,655,676 |
February 2009 | 494,500 |
| 123.08 |
| 3,838,824 | 2,161,176 |
March 2009 | 520,400 |
| 117.45 |
| 4,359,224 | 1,640,776 |
April 2009 | 521,600 |
| 116.88 |
| 4,880,824 | 1,119,176 |
May 2009 | 460,100 |
| 132.96 |
| 5,340,924 | 659,076 |
June 2009 | 450,400 |
| 136.58 |
| 450,400 | 5,549,600 |
July 2009 | 492,000 |
| 125.10 |
| 942,400 | 5,057,600 |
August 2009 | 461,000 |
| 133.83 |
| 1,403,400 | 4,596,600 |
September 2009 | 469,800 |
| 131.88 |
| 1,873,200 | 4,126,800 |
October 2009 | 453,700 |
| 137.31 |
| 2,326,900 | 3,673,100 |
November 2009 | 444,900 |
| 141.88 |
| 2,771,800 | 3,228,200 |
December 2009 | 454,000 |
| 139.89 |
| 3,225,800 | 2,774,200 |
January 2010 | 452,500 |
| 147.11 |
| 3,678,300 | 2,321,700 |
February 2010 | 519,000 |
| 128.88 |
| 4,197,300 | 1,802,700 |
Total | 6,715,700 | (2) | 130.16 | (3) | 4,197,300 | 1,802,700 |
|
|
|
|
|
|
|
(1) The authorisation to repurchase a maximum of six million shares with a maximum overall nominal value of NOK 15 million for repurchase of shares in | ||||||
connection with the share savings plan was given by the annual general meeting on 20 May 2008. The authorisation was renewed by the | ||||||
annual general meeting on 19 May 2009 maintaining a maximum of six million shares with a maximum overall nominal value of 15 million for repurcase | ||||||
of shares, and valid until 30 June 2010. |
|
|
|
|
| |
(2) All shares repurchased have been purchased in the open market and pursuant to the authorisation mentioned above. | ||||||
(3) Weighted average price per share. |
|
|
|
|
|
|
6.3 Information and communications
Keeping the market updated about Statoil's financial performance and future prospects is the basis for assessing the value of the company.
Information provided to the stock market must be transparent and ensure equal treatment, and it must aim to provide shareholders with correct, clear, relevant and timely information that forms the basis for assessing the value of the company.
The Statoil share is listed on the stock exchanges in Oslo and New York, and the company distributes its share price-sensitive information through the international wire services, Oslo Stock Exchange in Norway, the Securities and Exchange Commission in the USA, and the company's website.
Our registrar manages our shares listed on the Oslo Stock Exchange on our behalf and provides the connection to the Norwegian Central Securities Depository (VPS). Major services provided by the registrar are investor services for private shareholders, the disbursement of dividend and assistance at our general meetings. DnB NOR bank is currently account registrar for Statoil.
6.3.1 Investor contact
Our investor relations staff function (IR) coordinates the dialogue with our shareholders.
We place great emphasis on ensuring that relevant and timely information is distributed to the capital markets. Given the size and diversity of our shareholder base, the opportunities for direct shareholder interaction are limited to a certain extent. Our "Investor Centre" web pages are therefore specially designed for investors and analysts who wish to follow the company's progress - http://www.statoil.com/ir
Our quarterly presentations and other relevant presentations by management are broadcast directly on the internet, and the pertaining reports are made available together with other relevant information on the company's website.
Statoil meets the requirements for the information symbol and English symbol issued by Oslo Stock Exchange (Oslo Børs).
Ticker Codes
Oslo Stock Exchange STL
New York Stock Exchange STO
Reuters STL.OL
Bloomberg STL NO
Financial calendar for 2010 | |
11 February | Fourth quarter results 2009 and strategy update |
26 March | Annual report 2009 |
05 May | First quarter 2010 |
19 May | Annual general meeting 2010 |
20 May | Share trading ex-dividend |
02 June | Dividend payment |
29 July | Second quarter 2010 |
03 November | Third quarter 2010 |
6.4 Major shareholders
The Norwegian State is the largest shareholder in Statoil, with an ownership interest of 67%. Its ownership interest is managed by the Ministry of Petroleum and Energy.
Statoil was partially privatised and listed on the stock exchange on 18 June 2001, when it became a public limited company. After the initial offering, the government retained 81.7% of the Statoil shares. From 2005 and prior to the merger with Hydro's oil and energy activities in 2007, the Norwegian State owned 70.9% of the shares in Statoil.
Pursuant to the exchange ratio agreed in connection with the merger with Hydro's oil and gas activities, the State's ownership interest in the merged company was 62.5%, or 1,992,959,739 shares on 1 October 2007. In accordance with the Storting's decision of 2001 concerning a minimum state shareholding of two-thirds in Statoil, the Government built up the State's ownership interest in Statoil by buying shares in the market during the period from June 2008 to March 2009. In March 2009, the Government announced that the State's ownership interest had reached 67%, and the Government's purchase of Statoil shares was completed. As of 12 March 2010, the Norwegian State had a 67% ownership interest in Statoil and 3.13% interest through Folketrygdfondet, totalling 70.13%.
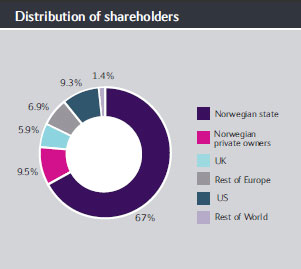
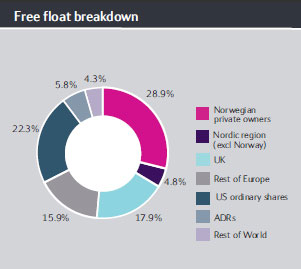
As of 12 March 2010, the National Insurance Fund, (Folketrygdfondet) owned 99,922,060 shares, or 3.13% of the total number of ordinary shares. The Norwegian State is the only person or entity known to us to own beneficially, directly or indirectly more than 5% of our outstanding shares. We have not been notified of any other beneficial owner of 5% or more of our ordinary shares as of 12 March 2010.
In June 2001, in connection with the initial public offering of our ordinary shares, we established a sponsored American Depositary Receipt facility with The Bank of New York Mellon as depositary, pursuant to which American Depositary Receipts (ADRs) representing American Depositary Shares (ADSs) are issued. We have been informed by The Bank of New York Mellon that in the United States, as of 12 March 2010, there were 60,900,828 ADRs outstanding in the United States (representing approximately 1.9% of the ordinary shares outstanding). As of 12 March 2010, there were 719 registered holders of ADRs resident in the United States and 279,447,057ordinary shares were held by 514 registered holders resident in the United States representing approximately 8.8% in total.
Statoil has one class of shares, and each share confers one vote at the general meeting. The Norwegian State does not have any voting rights that differ from the rights of other ordinary shareholders. Pursuant to the Norwegian Public Limited Liability Companies Act, a majority of more than two-thirds of the votes cast as well as of the votes represented at a general meeting is required to amend our articles of association. As long as the Norwegian state owns more than one-third of our shares, it will be able to prevent any amendments to our articles of association.
Since the Norwegian State, acting through the Minister of Petroleum and Energy, has in excess of two-thirds of the shares in the company, it has sole power to amend our articles of association. In addition, as a majority shareholder, the Norwegian State has the power to control any decision at general meetings of our shareholders that requires a majority vote, including the election of the majority of the corporate assembly, which has the power to elect our board of directors and approve the dividend proposal by the board of directors.
The Norwegian State endorses the principles set out in "The Norwegian Code of Practice for Corporate Governance", and it has stated that it expects companies in which the State has ownership interests to adhere to the code. The principle of ensuring equal treatment of different groups of shareholders is a key element in the State's own guidelines. In companies in which the State is a shareholder together with others, the State wishes to exercise the same rights and obligations as any other shareholder and not act in a manner that has a detrimental effect on the rights or financial interests of other shareholders. In addition to the principle of equal treatment of shareholders, emphasis is also placed on transparency in relation to the State's ownership and on the general meeting being the correct arena for owner decisions and formal resolutions.
Shareholders at 12 March 2010 | Type | Number of shares | Ownership in % |
The Norwegian State (Ministry of Petroleum and Energy) |
| 2,136,393,559 | 67.00 |
Folketrygdfondet (Norwegian national insurance fund) |
| 99,922,060 | 3.13 |
Bank of New York ADR Department | Nominee | 59,422,950 | 1.86 |
Clearstream Banking | Nominee | 43,650,052 | 1.37 |
State Street Bank | Nominee | 42,408,969 | 1.33 |
JPMorgan Chase Bank | Nominee | 40,485,140 | 1.27 |
State Street Bank | Nominee | 29,164,652 | 0.91 |
State Street Bank | Nominee | 24,777,757 | 0.78 |
The Northern Trust | Nominee | 23,865,000 | 0.75 |
Bank of New York Mellon | Nominee | 20,242,707 | 0.63 |
State Street Bank | Nominee | 15,094,135 | 0.47 |
DnB NOR Bank ASA |
| 14,300,885 | 0.45 |
The Northern Trust | Nominee | 12,198,941 | 0.38 |
Skandinaviska Enskilda Bank | Nominee | 11,922,115 | 0.37 |
Vital Forsikring ASA |
| 11,841,626 | 0.37 |
The Northern Trust | Nominee | 11,077,896 | 0.35 |
Bank of New York Mellon | Nominee | 10,739,642 | 0.34 |
State Street Bank | Nominee | 10,682,635 | 0.34 |
Euroclear Bank | Nominee | 9,661,453 | 0.30 |
DnB NOR, Norge VPF |
| 9,410,930 | 0.30 |
|
|
|
|
Source: Norwegian Central Securities Depository (VPS) |
|
|
|
6.5 Market and market prices
The principal trading market for our ordinary shares is the Oslo Stock Exchange, and the ordinary shares are also listed on the New York Stock Exchange, trading in the form of American Depositary Shares (ADSs).
Statoil's shares have been listed on the Oslo Stock Exchange since our initial public offering on 18 June 2001. The ADSs trading on the New York Stock Exchange are evidenced by American Depositary Receipts (ADRs), and each ADS represents one ordinary share. Statoil has a sponsored ADR facility with the Bank of New York Mellon as depositary.
6.5.1 Share prices
These are the reported high and low quotations at market closing for the ordinary shares on the Oslo and New York stock exchanges for the periods indicated.
They are derived from the Oslo Stock Exchange Daily Official List, and the highest and lowest sales prices of the ADSs as reported on the New York Stock Exchange composite tape.
| NOK per ordinary share | USD per ADS | ||
Share price | High | Low | High | Low |
|
|
|
|
|
Year ended 31 December |
|
|
|
|
2005 | 166.50 | 91.25 | 25.80 | 14.69 |
2006 | 210.50 | 147.25 | 34.52 | 22.39 |
2007 | 191.50 | 151.50 | 35.19 | 23.90 |
2008 | 214.10 | 96.40 | 42.47 | 13.37 |
2009 | 146.80 | 108.90 | 26.41 | 15.11 |
|
|
|
|
|
Quarter ended |
|
|
|
|
31 March 2008 | 169.90 | 135.30 | 31.76 | 25.30 |
30 June 2008 | 214.10 | 155.00 | 42.47 | 30.35 |
30 September 2008 | 187.10 | 130.60 | 36.95 | 21.85 |
31 December 2008 | 144.80 | 96.40 | 23.06 | 13.37 |
31 March 2009 | 131.00 | 108.90 | 20.09 | 15.11 |
30 June 2009 | 140.70 | 113.80 | 22.19 | 17.01 |
30 September 2009 | 137.90 | 119.40 | 23.20 | 18.26 |
31 December 2009 | 146.80 | 126.00 | 26.41 | 21.69 |
March up until 12 March 2010 | 149.20 | 126.90 | 26.47 | 21.57 |
|
|
|
|
|
Month of |
|
|
|
|
September 2009 | 135.40 | 128.30 | 23.20 | 21.19 |
October 2009 | 141.50 | 126.00 | 25.45 | 21.69 |
November 2009 | 146.80 | 135.70 | 26.41 | 23.69 |
December 2009 | 146.50 | 140.00 | 25.44 | 24.18 |
January 2010 | 149.20 | 134.00 | 26.47 | 22.36 |
February 2010 | 137.00 | 126.90 | 23.55 | 21.57 |
March up until 12 March 2010 | 139.50 | 134.50 | 23.70 | 22.75 |
6.5.2 Fees related to Statoil's ADR program
Fees and charges payable by a Holder of ADSs
The Bank of New York Mellon, as Depositary, collects its fees for delivery and surrender of ADSs directly from investors depositing shares or surrendering ADSs for the purpose of withdrawal or from intermediaries acting for them. The Depositary collects fees for making distributions to investors by deducting those fees from the amounts distributed or by selling a portion of distributable property to pay the fees. The Depositary may generally refuse to provide fee-attracting services until its fees for those services are paid.
The charges of the Depositary payable by investors are as follows:
Persons depositing or withdrawing shares must pay: | For: |
USD 5.00 (or less) per 100 ADSs (or portion of 100 ADSs) | Issuance of ADSs, including issuances resulting from a distribution of shares or rights or other property |
| Cancellation of ADSs for the purpose of withdrawal, including if the deposit agreement terminates |
USD 0.02 (or less) per ADS | Any cash distribution to ADS registered holders |
A fee equivalent to the fee that would be payable if securities distributed to you had been shares and the shares had been deposited for issuance of ADSs | Distribution of securities distributed to holders of deposited securities which are distributed by the Depositary to ADS registered holders |
Registration or transfer fees | Transfer and registration of shares on our share register to or from the name of the Depositary or its agent when you deposit or withdraw shares |
Expenses of the Depositary | Cable, telex and facsimile transmissions (as provided in the deposit agreement) |
| Converting foreign currency to U.S. dollars |
Taxes and other governmental charges the Depositary or the custodian have to pay on any ADS or share underlying an ADS, for example, stock transfer taxes, stamp duty or withholding taxes | As necessary |
Any charges incurred by the Depositary or its agents for servicing the deposited securities | As necessary |
Reimbursements and payments made and fee waivers granted by the Depositary
The Depositary has agreed to reimburse certain Company expenses related to the Company's ADR program and incurred by the Company in connection with the program. In the year ended 31 December 2009, the Depositary reimbursed USD 1,595,055 to the Company.
The table below sets forth the types of expenses that the Depositary has agreed to reimburse and the amounts reimbursed in the year ended 31 December 2009:
Category of Expenses | USD Amount Reimbursed for the year ended 31 December 2009 |
NYSE listing fees | 106,382 |
US investor relations expenses and other miscellaneous expenses | 1,488,673 |
Total Amount Reimbursed | 1,595,055 |
| |
* Net of withholding tax paid by the Depository. | |
The Depositary has also agreed to waive fees for standard costs associated with the administration of the ADR program and has paid certain expenses directly to third parties on behalf of the Company. The expenses paid to third parties include expenses relating to the mailing of notices and meeting material as well as the tabulate of votes in connection with the Company's annual general meeting.
The table below sets forth the expenses that the Depositary waived or paid directly to third parties in the year ended 31 December 2009:
Category of Expenses | USD Amount Waived or Paid for the year ended 31 December 2009 |
Third-party expenses paid directly by the Depositary | 147,030 |
Service fees and out of pocket expenses waived by the Depositary | 130,000 |
Total Amount Waived or Paid Directly to Third Parties | 277,030 |
Under certain circumstances, including removal of the Depositary or termination of the ADR program by the Company, the Company is required to repay to the Depositary amounts reimbursed and/or expenses paid to or on behalf of the Company during the twelve month period prior to notice of removal or termination.
6.6 Taxation
This section describes the material Norwegian tax consequences that apply to shareholders resident in Norway and to non-resident shareholders in connection with the acquisition, ownership and disposal of shares and ADSs.
Norwegian tax matters
This section does not provide a complete description of all tax regulations that might be relevant (i.e. for investors to whom special regulations may be applicable). This section is based on current law and practice. Shareholders should consult their professional tax adviser for advice concerning individual tax consequences.
Taxation of dividends
Under the participation exemption model, corporate shareholders resident in Norway for tax purposes are exempt from tax on dividends distributed by Norwegian companies. However, effective from 7 October 2008, 3% of net income that is tax free under the participation exemption will be included in the Norwegian corporate shareholder's general taxable income. For individual shareholders, double taxation applies: dividend income exceeding a "deductible allowance", which is an amount equal to the risk-free interest after tax on the base cost of the shareholding, will be taxable at a flat rate, currently 28%. The average interest on Treasury bills of three months' maturity will be applied.
Non-resident shareholders are as a rule subject to withholding tax at a rate of 25% on dividends distributed by Norwegian companies. This withholding tax does not apply to corporate shareholders that document that they are genuinely resident for tax purposes in a country in the European Economic Agreement area (EEA area) and that they are involved in genuine economic business activity in that country, provided that Norway is entitled to receive information from the state of residency pursuant to a tax treaty or other international treaty. If no such treaty exists with the state of residency, the shareholder may instead present certification issued by the tax authorities of the state of residency verifying the documentation.
The withholding rate of 25% is often reduced in tax treaties between Norway and other countries. Generally, the treaty rate does not exceed 15% and, in cases where a corporate shareholder holds a qualifying percentage of the shares of the distributing company, the withholding tax rate on dividends may be further reduced. The withholding tax rate in the tax treaty between the United States and Norway is currently 15% in all cases. The treaty is currently being renegotiated, but it is uncertain at what point in time a new treaty will be in place. Shareholders that carry on business activities in Norway and whose shares are effectively connected with such activities are not liable to the withholding tax. In such case, the rules described in the above paragraph regarding corporate shareholders resident in Norway apply. We are obliged by law to deduct any applicable withholding tax when paying dividends to non-resident shareholders.
Under the tax treaty between Norway and the United States, the 15% withholding rate will apply to dividends paid on shares held directly by holders who are able to properly demonstrate to the company that they are entitled to the benefits of the tax treaty.
Dividends paid to the depositary for redistribution to shareholders who hold ADSs will in principle be subject to withholding tax of 25%. The beneficial owners will in this case have to apply to the Central Office - Foreign Tax Affairs (COFTA) for a refund of the excess amount of tax withheld.
An application for a refund of withholding tax must contain the following:
- Specification of the distributing company(ies) involved, the exact amount of shares, the date the dividend payments were made, the total dividend payment, the withholding tax deducted in Norway and the amount that is being reclaimed. The withholding tax must be calculated in Norwegian currency and all sums specified accordingly (in NOK).
- Documentation that shows that the refund claimant received the dividends and the withholding tax rate that was applied in Norway.
- A certificate of residence issued by the tax authorities stating that the refund claimant is resident for tax purposes in that state in the income year in question or at the time the dividends were decided. This documentation must be the original document.
- If the refund application is based on an assertion that the shareholder is covered by the participation exemption method, the application must also contain the information necessary to decide whether the refund claimant is an entity covered by the tax exemption model.
- The information required to decide whether the refund claimant is the beneficial owner of the dividend payment(s).
- If the securities are registered with a foreign custodian/bank/clearing house, the claimant must provide information about which foreign custodian/bank/clearing house the securities are registered with in Norway.
The application must be signed by the applicant. If the application is signed by a proxy, a copy of the letter of authorisation must be enclosed.
However, pursuant to agreements with the Financial Supervisory Authority of Norway and the Norwegian Directorate of Taxes, the Bank of New York, acting as depositary, is entitled to receive dividends from us for redistribution to a beneficial owner of shares or ADSs at the applicable treaty withholding rate, if the beneficial holder has provided the Bank of New York with appropriate certification to establish such holder's eligibility for the benefits under the tax treaty with Norway.
Wealth tax.
The shares are included in the basis for the computation of wealth tax imposed on individuals who, for tax purposes, are considered to be resident in Norway. Norwegian limited companies and certain similar entities are not subject to wealth tax. Currently, the marginal wealth tax rate is 1.1% of the value assessed. As of 2008, the assessment value of listed shares is 100% of the listed value of such shares on 1 January in the assessment year.
Non-resident shareholders are not subject to wealth tax in Norway for shares in Norwegian limited companies unless the shareholder is an individual and the shareholding is effectively connected with his business activities in Norway.
Inheritance tax and gift tax.
When shares or ADSs are transferred, either through inheritance or as a gift, such transfer may give rise to inheritance tax in Norway if the deceased at the time of death, or the donor at the time of the gift, is a resident or citizen of Norway. However, if a Norwegian citizen is not a resident of Norway at the time of his or her death, Norwegian inheritance tax will not be levied if an inheritance tax or a similar tax is levied by the country of residence. Irrespective of citizenship, Norwegian inheritance tax may be levied if the shares or ADSs are effectively connected with the conducting of a trade or business through a permanent establishment in Norway.
Taxation on the realisation of shares
Under the participation exemption model, corporate shareholders resident in Norway for tax purposes are exempt from tax on gains on the sale, redemption or other disposal of shares in Norwegian companies. Corporate shareholders will not be allowed a deduction for losses incurred on the sale, redemption or other disposal of shares in Norwegian companies if a gain would be exempted from taxation. However, effective from 7 October 2008, 3% of net income that is tax free under the participation exemption will be included in the Norwegian corporate shareholder's general taxable income.
For individual shareholders resident in Norway for tax purposes, the sale, redemption or other disposal of shares will be considered a taxable realisation of shares. Gains or losses in connection with such realisation are included in or deducted from the individual's general taxable income in the year of disposal. Ordinary income is taxed at a flat rate of 28%. The gain is subject to tax and the loss is deductible irrespective of the length of the ownership and the number of shares disposed of.
The taxable gain or loss is calculated as the sales price adjusted for transaction expenses minus the taxable basis. A shareholder's tax basis is normally equal to the acquisition cost of the shares. Any unused "deductible allowance" from previous years attributable to the individual shares realised may be deducted, but the deduction can not exceed the gain on the shares.
Shareholders not resident in Norway are generally not subject to tax in Norway on capital gains, and losses are not deductible on the sale, redemption or other disposal of shares or ADSs in Norwegian companies, unless the shareholder carries on business activities in Norway and such shares or ADSs are or have been effectively connected with such activities. In addition, individual shareholders previously resident in Norway may, on certain conditions, be liable to tax in Norway on such gains if the realisation takes place within five years of the end of the calendar year in which the shareholder ceased to be a resident of Norway for tax purposes, or, alternatively, within five years of the Norwegian tax residency expiring pursuant to Norwegian domestic law or tax treaty.
Transfer tax.
No transfer tax is imposed in Norway in connection with the sale or purchase of shares.
United States tax matters
This section describes the material United States federal income tax consequences for US holders (as defined below) of owning shares or ADSs. It only applies to you if you hold your shares or ADSs as capital assets for tax purposes. This section does not apply to you if you are a member of a special class of holders subject to special rules, including:
- dealers in securities;
- traders in securities that elect to use a mark-to-market method of accounting for their securities holdings;
- tax-exempt organisations;
- life insurance companies;
- persons liable to alternative minimum tax;
- persons that actually or constructively own 10% or more of the voting stock of Statoil;
- persons that hold shares or ADSs as part of a straddle or a hedging or conversion transaction; or
- persons whose functional currency is not USD.
This section is based on the Internal Revenue Code of 1986, as amended, its legislative history, existing and proposed regulations, published rulings and court decisions, and the Convention between the United States of America and the Kingdom of Norway for the Avoidance of Double Taxation and the Prevention of Fiscal Evasion with Respect to Taxes on Income and Property (the ''Treaty''). These laws are subject to change, possibly on a retroactive basis. In addition, this section is based in part upon the representations of the depositary and the assumption that each obligation in the deposit agreement and any related agreement will be performed in accordance with its terms. For United States federal income tax purposes, if you hold ADRs evidencing ADSs, you will generally be treated as the owner of the ordinary shares represented by those ADRs. Exchanges of shares for ADRs, and ADRs for shares will not generally be subject to United States federal income tax.
You are a ''US holder'' if you are a beneficial owner of shares or ADSs and you are for United States federal income tax purposes:
- an individual who is a citizen or resident of the United States;
- a United States domestic corporation;
- an estate whose income is subject to United States federal income tax regardless of its source; or
- a trust if a United States court can exercise primary supervision over the trust's administration and one or more United States persons are authorised to control all substantial decisions of the trust.
You should consult your own tax adviser regarding the United States federal, state and local and the Norwegian and other tax consequences of owning and disposing of shares and ADSs in your particular circumstances.
Taxation of dividends.
Subject to the passive foreign investment, or PFIC, rules discussed below, if you are a US holder, the gross amount of any dividend paid by Statoil of its current or accumulated earnings and profits (as determined for United States federal income tax purposes) is subject to United States federal income taxation. If you are a non-corporate US holder, dividends paid to you in taxable years beginning before 1 January 2011 that constitute qualified dividend income will be taxable at a maximum tax rate of 15% if you hold the shares or ADSs for more than 60 days during the 121-day period beginning 60 days before the ex-dividend date and meet other holding-period requirements. Dividends we pay with respect to shares or ADSs will generally be qualified dividend income.
You must include any Norwegian tax withheld from the dividend payment in this gross amount even though you do not in fact receive the amount withheld as tax. The dividend is taxable for you when you, in the case of shares, or the depositary, in the case of ADSs, receive the dividend, actually or constructively. The dividend will not be eligible for the dividends-received deduction generally allowed to United States corporations in respect of dividends received from other United States corporations.
The amount of the dividend distribution that you must include in your income as a US holder will be the value in US dollars (USD) of the payments made in Norwegian kroner (NOK) determined at the spot NOK/USD rate on the date the dividend distribution is includible in your income, regardless of whether or not the payment is in fact converted into US dollars. Distributions in excess of current and accumulated earnings and profits, as determined for United States federal income tax purposes, will be treated as a non-taxable return of capital to the extent of your tax basis in the shares or ADSs and, to the extent in excess of your tax basis, will be treated as capital gain.
Subject to certain limitations, the 15% Norwegian tax withheld in accordance with the treaty and paid to Norway will be creditable or deductible against your United States federal income tax liability. Special rules apply when determining the foreign tax credit limitation with respect to dividends that are subject to the maximum 15% rate. Dividends will be income from sources outside the United States. Dividends paid in taxable years beginning before 1 January 2007 will generally be ''passive income'' or ''financial services income'', and dividends paid in taxable years beginning after 31 December 2006 will, depending on your circumstances, be either ''passive'' or ''general'' income for purposes of computing the foreign tax credit allowable to you.
Any gain or loss resulting from currency exchange rate fluctuations during the period from the date you include the dividend payment in income until the date you convert the payment into US dollars will generally be treated as ordinary income or loss and will not be eligible for the special tax rate applicable to qualified dividend income. Such gain or loss will generally be income or loss from sources within the United States for foreign tax credit limitation purposes.
Taxation of capital gains.
Subject to the PFIC rules discussed below, if you are a US holder and you sell or otherwise dispose of your shares or ADSs, you will generally recognise a capital gain or loss for United States federal income tax purposes equal to the difference between the value in US dollars of the amount that you realise and your tax basis, determined in US dollars, in your shares or ADSs. A capital gain by a non-corporate US holder that is recognised before 1 January 2011 is generally taxed at a maximum rate of 15% if the holding period of the holder is longer than one year. The gain or loss will generally be income or loss from sources within the United States for foreign tax credit limitation purposes.
If you receive any foreign currency on the sale of shares or ADSs, you may recognise ordinary income or loss from sources within the United States as a result of currency fluctuations between the date of the sale of the shares or ADSs and the date the sales proceeds are converted into US dollars.
PFIC Rules.
We believe that the shares and ADSs should not be treated as stock of a PFIC for United States federal income tax purposes, but this conclusion is a factual determination that is made annually and thus may be subject to change. If we were to be treated as a PFIC, unless a US holder elects to be taxed annually on a mark-to-market basis with respect to the shares or ADSs, a gain realised on the sale or other disposition of the shares or ADSs would in general not be treated as a capital gain. Instead, if you are a US holder, you would be treated as if you had realised such gain and certain "excess distributions" ratably over your holding period for the shares or ADSs and would be taxed at the highest tax rate in effect for each such year to which the gain was allocated, together with an interest charge in respect of the tax attributable to each such year. With certain exceptions, the shares or ADSs will be treated as stock in a PFIC if we were a PFIC at any time during the period you hel d the shares or ADSs. Dividends that you receive from us will not be eligible for the special tax rates applicable to qualified dividend income if we are treated as a PFIC with respect to you, either in the taxable year of the distribution or the preceding taxable year, but will instead be taxable at rates applicable to ordinary income.
6.7 Exchange controls and other limitations
Under Norwegian foreign exchange controls currently in effect, transfers of capital to and from Norway are not subject to prior government approval except for the physical transfer of payments in currency, which is restricted to licensed banks.
This means that non-Norwegian resident shareholders may receive dividend payments without Norwegian exchange control consent as long as the payment is made through a licensed bank.
There are no restrictions affecting the rights of non-residents or foreign owners to hold or vote for our shares.
6.8 Exchange rates
The table below shows the high, low, average and end-of-period exchange rates for the Norwegian krone per USD 1.00 as announced by Central Bank of Norway.
The average is computed using the monthly average exchange rates announced by the Central Bank of Norway during the period indicated.
Year ended December 31 | Low | High | Average | End of Period |
|
|
|
|
|
2005 | 6.0809 | 6.7945 | 6.4426 | 6.7687 |
2006 | 6.0125 | 6.8381 | 6.4135 | 6.2551 |
2007 | 5.2751 | 6.4727 | 5.8610 | 5.4110 |
2008 | 4.9589 | 7.2183 | 5.6390 | 6.9989 |
2009 | 5.5433 | 7.2048 | 6.2898 | 5.7767 |
| Low | High |
|
|
|
2009 |
|
|
September | 5.7625 | 6.1041 |
October | 5.5433 | 5.8107 |
November | 5.5596 | 5.8081 |
December | 5.5805 | 5.8600 |
2010 |
|
|
January | 5.6026 | 5.8800 |
February | 5.8327 | 6.0036 |
March (up to and including 12 March 2010) | 5.8358 | 5.9571 |
On March 12, 2010, the exchange rate announced by Central Bank of Norway for the Norwegian krone was USD 1.00 = NOK 5.8358.
Fluctuations in the exchange rate between the Norwegian krone and the US dollar will affect the amounts in US dollars received by holders of American Depositary Shares (ADSs) on the conversion of dividends, if any, paid in Norwegian kroner on the ordinary shares, and they may affect the US dollar price of the ADSs on the New York Stock Exchange.
7 Corporate governance
Statoil's objective is to create long-term value for its shareholders through exploration for, and production, transportation, refining and marketing of petroleum and petroleum-derived products,and other forms of energy.
In pursuing our corporate objective, we are committed to the highest level of governance and to cultivating a value-based performance culture that rewards exemplary ethical standards, respect for the environment and personal and corporate integrity. We believe that there is a link between high-quality governance and the creation of shareholder value.
The work of the board of directors is based on the existence of a clearly-defined division of roles and responsibilities between the shareholders, the board of directors and the company's management.
Our governing structures and controls help to ensure that we run our business in a profitable manner for the benefit of our shareholders, employees and other stakeholders in societies in which we operate.
The following principles underline our approach to corporate governance:
|
Corporate governance in Statoil is subject to annual reviews and discussions by the board of directors.
Statoil's board of directors endorses the 'Norwegian Code of Practice for Corporate Governance', last revised on 21 October 2009. The company's compliance with and, if applicable, deviation from the Code of Practice is commented on, and these comments are available at www.statoil.com/codeofpractice.
In the board's view, Statoil has complied with the code of practice throughout the year ended 31 December 2009. In the statutory report, the board presents its statement on corporate governance, sequenced as the Norwegian code of practice stipulates.
7.1 Ethics Code of Conduct
Together with Statoil's values statement, the Ethics Code of Conduct constitutes the basis and framework for our performance culture.
Our ability to create value is dependent on applying high ethical standards, and we are determined that Statoil shall be known for these standards. Ethics is treated as an integral part of our business activities. The group demands high ethical standards of everyone who acts on our behalf and will conduct an open dialogue on ethical issues, internally and externally.
The Statoil Ethics Code of Conduct describes Statoil's commitment and requirements in connection with issues of an ethical nature that relate to business practice and personal conduct.
In our business activities, we will comply with applicable laws and regulations and act in an ethical, sustainable and socially responsible manner. Respect for human rights is an integral part of Statoil's values base.
The Ethics Code of Conduct's target group consists of everyone who works for the Statoil group, including all employees, the chief executive officer, the chief financial officer, the controller and members of the board of directors of Statoil and its subsidiaries. The Ethics Code of Conduct is available at www.statoil.com/Ethics. Statoil's anti-corruption compliance programme can also be found on the same webpage.
Business partners are also expected to have ethical standards that are consistent with Statoil's ethical requirements.
Statoil has a dedicated ethics helpline that can be used by employees who want to express concerns or seek advice regarding the legal and ethical conduct of Statoil's business.
7.2 Articles of association
The articles of association and the Norwegian Public Limited Companies Act form the legal framework for Statoil's operations.
Statoil's current articles of association were adopted at the annual general meeting of shareholders on 19 May 2009 and entered into force on 2 November 2009:
Summary of our articles of association
Name of the Company
Our registered name is Statoil ASA. We are a Norwegian public limited company.
Registered office
Our registered office is in Stavanger, Norway, registered with the Norwegian Register of Business Enterprises under number 913 609 016.
Object of the company
The object of our company, as set forth in Article 1, is, either by us or through participation in or together with other companies, to carry out exploration, production, transportation, refining and marketing of petroleum and petroleum derived products, and other forms of energy, as well as other businesses.
Share capital
Our share capital is NOK 7,971,617,757.50 divided into 3,188,647,103 ordinary shares.
Nominal value of shares
The nominal value of each ordinary share is NOK 2.50.
Board of directors
Our articles of association provide that our board of directors shall consist of ten directors. The board, including the chair and the deputy chair, shall be elected by the corporate assembly.
Corporate assembly
We have a corporate assembly of 18 members who are elected for two-year terms. The general meeting elects 12 members with four deputy members, and six members with deputy members are elected by and from among the employees.
Annual general meeting
Our annual general meeting is held no later than June 30 each year.
The meeting will deal with the annual report and accounts, including distribution of dividends, and any other matters required by law or our articles of association.
Marketing of petroleum on behalf of the Norwegian State
Our articles of association provide that we are responsible for marketing and selling petroleum produced under the SDFI's shares in production licences on the NCS as well as petroleum received by the Norwegian State as royalty together with our own production. Our general meeting adopted an instruction in respect of such marketing on 25 May 2001.
Nomination committee
The tasks of the nomination committee (in the articles of association referred to as the "election committee") are to make recommendations to the general meeting regarding the election of and fees for shareholder-elected members and deputy members of the corporate assembly, and to make recommendations to the corporate assembly regarding the election of and fees for shareholder-elected members and deputy members of the board of directors.
The full articles of association can be found at www.statoil.com/ArticlesOfAssociation.
7.3 General meeting of Shareholders
The annual general meeting of shareholders (AGM) is the company's supreme body. The objective of the general meeting is to ensure shareholder democracy. Statoil encourages all shareholders to participate in person or by proxy.
The annual general meeting of shareholders (AGM) is the company's supreme corporate body. The 2010 AGM is scheduled for 19 May, 2010 in Stavanger, Norway, with simultaneous transmission by webcast. The AGM is conducted in Norwegian with simultaneous English translation during the webcast.
The main framework as regards convening and holding the AGM in Statoil is as follows:
Pursuant to the company's articles of association, the AGM must be held by the end of June each year. Notice of the meeting and documentation for the AGM are published on Statoil's website at least 21 days prior to the meeting and sent consecutively by mail to all shareholders whose address is known no later than 21 days before the AGM. All shareholders who are registered in the Norwegian Central Securities Depository (VPS) will receive an invitation to the AGM.
Shareholders are entitled to have their proposal dealt with at the general meeting if the proposal has been submitted in writing to the board of directors in sufficient time to allow inclusion in the distributed notice of meeting. Shareholders who are prevented from attending may vote by proxy.
The deadline for registration for the AGM is the day before the AGM is due to take place.
The AGM is normally opened and chaired by the chair of the corporate assembly. If there is a dispute concerning individual matters and the chair of the corporate assembly belongs to one of the disputing parties, or is for some other reason not perceived as being impartial, another person will be appointed to chair the AGM in order to ensure impartiality in relation to the matters to be considered. As Statoil has a large number of shareholders with a wide geographical distribution, Statoil offers shareholders the opportunity to follow the AGM by webcast.
The following matters are decided at the AGM:
- Election of the shareholders' representatives to the corporate assembly
- Election of the nomination committee (referred to as the election committee in the articles of association)
- Election of the external auditor and stipulation of the auditor's fee
- Approval of the board of directors' report, the financial statements and any dividend, proposed by the board of directors and recommended by the corporate assembly
- Any other matters listed in the notice convening the AGM
All shares carry an equal right to vote at general meetings. Resolutions at AGMs are normally passed by simple majority. However, Norwegian company law requires a qualified majority for certain resolutions, including resolutions to waive preferential rights in connection with any share issue, approval of a merger or demerger, amendment of the articles of association or authorisation to increase or reduce the share capital. Such matters require the approval of at least two-thirds of the aggregate number of votes cast as well as two-thirds of the share capital represented at the AGM.
The minutes of the AGM are made available on Statoil's website immediately after the AGM.
As regards extraordinary general meetings (EGM), an EGM shall be held if demanded by the corporate assembly, the chair of the corporate assembly, the auditor or shareholders representing at least 5% of the share capital in order to consider and decide a specific matter. The board must ensure that the extraordinary general meeting is held within a month of such demand being submitted.
In the following, we will provide an outline of certain resolutions by the AGM:
Issuing of new shares
If we issue any new shares, including bonus share issues, our articles of association must be amended, which requires the same majority as other amendments to our articles of association. In addition, under Norwegian law, our shareholders have a preferential right to subscribe to issues of new shares by us. The preferential right to subscribe to an issue may be waived by a resolution of a general meeting passed by the same percentage as required to approve amendments to our articles of association. The general meeting may, with a majority as described above, authorise the board of directors to issue new shares, and to waive the preferential rights of shareholders in connection with such share issues. Such authorisation may be effective for maximum two years, and the par value of the shares to be issued may not exceed 50% of the nominal share capital when the authorisation was granted.
The issuing of shares through the exercise of preferential rights to holders who are citizens or residents of the USA may require us to file a registration statement in the USA under US securities laws. If we decide not to file a registration statement, these holders may not be able to exercise their preferential rights.
Right of redemption and repurchase of shares
Our articles of association do not authorise the redemption of shares. In the absence of authorisation, the redemption of shares may nonetheless be decided by a general meeting of shareholders by a two-thirds majority on certain conditions. However, the share redemption would, for all practical purposes, depend on the consent of all shareholders whose shares are redeemed.
A Norwegian company may purchase its own shares if authorisation to do so has been granted by a general meeting with the approval of at least two-thirds of the aggregate number of votes cast as well as two-thirds of the share capital represented at the general meeting. The aggregate par value of such treasury shares held by the company must not exceed 10% of the company's share capital and treasury shares may only be acquired if, according to the most recently adopted balance sheet, the company's distributable equity exceeds the consideration to be paid for the shares. Authorisation by the general meeting cannot be granted for a period exceeding 18 months.
Distribution of assets on liquidation
Under Norwegian law, a company may be wound up by a resolution of the company's shareholders at a general meeting passed by both a two-thirds majority of the aggregate votes cast and two-thirds of the aggregate share capital represented at the general meeting. The shares are ranked equally in the event of a return on capital by the company upon winding-up or otherwise.
Electronic distribution
In 2010, a proposal to revise the articles of association will be forwarded by the board for approval by the AGM. The revision, if approved, will allow distribution of documents to future AGMs at Statoil's web site. A shareholder may nevertheless request that documents, which relate to matters to be dealt with by the AGM, be sent to him/her.
7.4 Nomination committee
In accordance with Statoil's articles of association, the nomination committee (referred to as the election committee in the articles of association) consists of four members who are shareholders, or representatives of shareholders.
The committee is independent of both the board and the company's management.
The duties of the nomination committee are:
- to present recommendations to the AGM for the election of shareholder-elected members and deputy members of the corporate assembly
- to present recommendations to the corporate assembly for the election of shareholder-elected members to the board of directors
- to present recommendations to the AGM for the election of members of the nomination committee
- to present a proposal for the remuneration of members of the board of directors, the corporate assembly and the nomination committee
Shareholders can, using a form on the company's website, propose candidates for the board of directors, the corporate assembly and the nomination committee.
The members of the nomination committee are elected by the AGM. Two of the members are elected from among the shareholder-elected members of the corporate assembly. Members of the nomination committee are normally elected for a term of two years.
The members of the nomination committee are:
- Olaug Svarva (chair), managing director, Folketrygdfondet
- Gro Bækken, managing director of OLF, Oljeindustriens Landsforening (the Norwegian Oil Industry Association) as of 1 January (Gro Brækken has, due to conflict of interest, not participated in the nomination committee since 17 August 2009)
- Tom Rathke, managing director, Vital Forsikring and executive vice president, DnB NOR
- Bjørn Ståle Haavik, director general, Ministry of Petroleum and Energy
The nomination committee held 16 meetings in 2009.
The rules of procedure for the nomination committee are available at www.statoil.com/NominationCommittee.
7.5 Corporate assembly
Pursuant to the Norwegian Public Limited Liability Companies Act, companies with more than 200 employees must elect a corporate assembly unless otherwise agreed between the company and a majority of its employees.
Name | Occupation | Place of Residence | Year of birth | Position | Family relations to Corporate Executive committee, Board or Corporate Assembly members | Share ownership for members pr 31.12.2009 | Share ownership for members pr 12.03.2010 | First time elected | Expiration date of current term |
|
|
|
|
|
|
|
|
|
|
Olaug Svarva | Managing Director, Folketrygdfondet | Oslo | 1957 | Chair, Shareholder elected | No | 0 | 0 | 2007 | 2010 |
Idar Kreutzer | CEO, Storebrand | Oslo | 1962 | Deputy chair, Shareholder elected | No | 0 | 0 | 2007 | 2010 |
Karin Aslaksen | Senior Vice President, Elkem AS | Hosle | 1959 | Shareholder elected | No | 0 | 0 | 2008 | 2010 |
Greger Mannsverk | Managing Director, Bergen Group Kimek | Kirkenes | 1961 | Shareholder elected | No | 0 | 0 | 2002 | 2010 |
Steinar Olsen | Self-employed | Stavanger | 1949 | Shareholder elected | No | 0 | 0 | 2007 | 2010 |
Benedicte Berg Schilbred | Working Chair of the Board, Odd Berg Group | Tromsø | 1946 | Shareholder elected | No | 0 | 0 | 2007 | 2010 |
Ingvald Strømmen | Dean, NTNU | Ranheim | 1950 | Shareholder elected | No | 0 | 0 | 2006 | 2010 |
Inger Østensjø | Chief administrative officer, Stavanger Municipality | Stavanger | 1954 | Shareholder elected | No | 0 | 0 | 2006 | 2010 |
Rune Bjerke | CEO, DnBNOR | Oslo | 1960 | Shareholder elected | No | 0 | 0 | 2007 | 2010 |
Kåre Rommetveit | Director, Bergen Medical research foundation | Hjellestad | 1945 | Shareholder elected | No | 0 | 0 | 2007 | 2010 |
Tore Ulstein | Managing Director, Ulstein International | Ulsteinvik | 1967 | Shareholder elected | No | 0 | 0 | 2008 | 2010 |
Eldfrid Irene Hognestad | Principal Engineer, Technology & New Energy | Stavanger | 1966 | Employee representative | No | 694 | 791 | 2009 | 2011 |
Stig Lægreid | Union Official, Projects | Oslo | 1963 | Employee representative | No | 426 | 466 | 2009 | 2011 |
Per Martin Labråthen | Process technician, Exploration & Production Norway | Brevik | 1961 | Employee representative | No | 406 | 431 | 2007 | 2011 |
Anne K.S. Horneland | Union Official, Exploration & Production Norway | Hafrsfjord | 1956 | Employee representative | No | 1629 | 1847 | 2006 | 2011 |
Jan-Eirik Feste | Union Official, Marketing & Manufacturing | Lindås | 1952 | Employee representative | No | 282 | 305 | 2008 | 2011 |
Per Helge Ødegård | Union Official, Exploration & Production Norway | Porsgrunn | 1963 | Employee representative | No | 824 | 963 | 1994 | 2011 |
Anne Synnøve Hebnes | Manager, Technology & New Energy | Stavanger | 1972 | Employee representative, observer | No | 0 | 0 | 2006 | 2011 |
Oddbjørn Viken | Manager, Exploration & Production Norway | Røyken | 1961 | Employee representative, observer | No | 1580 | 1824 | 2009 | 2011 |
Frode Solberg | Union Official, Natural Gas | Bergen | 1969 | Employee representative, observer | No | 0 | 0 | 2009 | 2011 |
The corporate assembly must consist of at least 12 members or a larger number divisible by three. Shareholders elect two-thirds of the members of the corporate assembly, while employees elect the remaining third.
Pursuant to Statoil's articles of association, the corporate assembly consists of 18 members. Twelve members and four deputy members are elected at the general meeting by the shareholders, and six members, two observers and deputy members are elected by and from among the employees, such employees being non-executive personnel.
Members of the corporate assembly are normally elected for a term of two years. Members of the board of directors and the general manager cannot be members of the corporate assembly, but they are entitled to attend and to speak at meetings of the corporate assembly unless the corporate assembly decides otherwise in individual cases.
The corporate assembly's main duty is to elect the board of directors.
Its responsibilities also include overseeing the board and the CEO's management of the company, making decisions on investments of considerable magnitude in relation to the company's resources and making decisions involving the rationalisation or reorganisation of operations that will entail major changes in or reallocation of the workforce.
The duties of the corporate assembly are defined in section 6-37 of the Norwegian Public Limited Liability Companies Act.
The corporate assembly held five meetings in 2009.
All members of the corporate assembly reside in Norway. Members of the corporate assembly do not have service contracts with the company or its subsidiaries providing for benefits upon termination of employment.
7.6 Board of directors
Pursuant to Statoil's articles of association, the board of directors consists of 10 members. The management is not represented on the board, and all shareholder-elected directors are independent.
As required by Norwegian company law, the company's employees are entitled to be represented by three board members. There are no board member service contracts that provide for benefits upon termination of office. Statoil's board of directors has determined that, in its judgement, all of the shareholder-elected directors are independent, as defined by the Norwegian Code of Practice.
The board of directors of Statoil ASA is responsible for the overall management of the Statoil group, and for supervising the group's activities in general. The board of directors handles matters of major importance or of an extraordinary nature. However, it may require the management to refer any matter to it. The board of directors appoints the president and chief executive officer (CEO), and stipulates the job instructions, powers of attorney and terms and conditions of employment for the president and CEO.
The board of directors has two sub-committees, the audit committee and the compensation committee.
The board held 11 meetings in 2009. Attendance at board meetings was 94%.
Members of the board of directors
Svein Rennemo
Position: Chair of the board and member of the board's compensation committee.
Born: 1947
Term of office: Chair of the board of Statoil ASA since 1 April 2008.
Independent: Yes
Other directorships: Chair of the board of Integrated Optoelectronics AS, Tomra Systems ASA and Pharmaq AS. Member of the board of Norske Skogsindustrier ASA.
Number of shares in Statoil ASA as of 31 December 2009: 10,000
Loans from Statoil: None
Experience: CEO of Petroleum Geo-Services ASA from 2002 until 1 April 2008 (when he took up office as chair of the board of Statoil ASA).From 1994 to 2001, Rennemo worked for Borealis, first as deputy CEO and CFO and, from 1997, as CEO.
He held various management positions in Statoil from 1982 to 1994, latterly as head of the petrochemical division.During the period 1972 to 1982, he was an analyst and monetary policy and economics adviser at Norges Bank (the Norwegian Central Bank), the OECD Secretariat in Paris and the Ministry of Finance.
Education: Economist, University of Oslo.
Family relations: No family relations to other members of the board, members of the corporate executive committee or the corporate assembly.
Other matters: Svein Rennemo is a Norwegian citizen, and he lives in Norway.
Marit Arnstad

Position: Deputy chair and member of the board's audit committee.
Born: 1962
Term of office: Member of the board of Statoil ASA since June 2006, deputy chair since 1 October 2007.
Independent: Yes
Other directorships: Chair of the board of the Norwegian University of Science and Technology (NTNU) and of Statskog SF. Board member of Polaris Media ASA, Aker Seafoods ASA and NTE Nett AS.
Number of shares in Statoil ASA as of 31 December 2009: None
Loans from Statoil: None
Experience: Arnstad is an advocate with the law firm Arntzen de Besche Trondheim AS. Arnstad was Minister of Petroleum and Energy during the period 1997 - 2000. She was a member of the Norwegian parliament, the Storting, representing the Centre Party from 1993 to 1997 and 2001 to 2005, and was leader of the party's parliamentary group from 2003 to 2005. Before that, she was a higher executive officer with the Ministry of the Environment.
Education: Law graduate (cand. jur.) from the University of Oslo.
Family relations: No family relations to other members of the board, members of the corporate executive committee or the corporate assembly.
Other matters: Marit Arnstad is a Norwegian citizen, and she lives in Norway.
Kjell Bjørndalen
Position: Board member and member of the board's compensation committee.
Born: 1946
Term of office: Member of the board of Statoil ASA since 1 October 2007. Member of Statoil ASA's corporate assembly from 1992 to 2007.
Independent: Yes
Other directorships: Bjørndalen is a member of the boards of Alfred Berg Kapitalforvaltning AS and Xynergo AS.
Number of shares in Statoil ASA as of 31 December 2009: None
Loans from Statoil: None
Experience: Until October 2007, he was president of the Norwegian United Federation of Trade Unions (Fellesforbundet) and a member of the secretariat of the Norwegian Confederation of Trade Unions (LO).
Family relations: No family relations to other members of the board, members of the corporate executive committee or the corporate assembly.
Other matters: Kjell Bjørndalen is a Norwegian citizen, and he lives in Norway.
Roy Franklin

Position: Member of the board, and chair of the board's audit committee.
Born: 1953
Term of office: Member of the board of Statoil ASA since 1 October 2007.
Independent: Yes
Other directorships: Franklin is a non-executive chair of the board of Keller Group plc, a London-based international ground engineering company, and a board member of the Australian oil and gas company Santos Ltd.
Number of shares in Statoil ASA as of 31 December 2009: None
Loans from Statoil: None
Experience: Has broad experience from management positions in several countries, including positions with BP, Paladin Resources plc. and Clyde Petroleum plc.
Education: Bachelor of Science in geology from the University of Southampton, UK.
Family relations: No family relations to other members of the board, members of the corporate executive committee or the corporate assembly.
Other matters: Roy Franklin is a UK citizen and he lives in the UK. In 2004, he was awarded an OBE for his work for the British oil and gas industry.
Elisabeth Grieg

Position: Board member and member of the board's compensation committee.
Born: 1959
Term of office: Member of the board of Norsk Hydro ASA from 2001 to 2007. Member of the board of Statoil ASA since 1 October 2007.
Independent: Yes
Other directorships: Grieg is chair of the board of Grieg Shipping Group and Grieg Star Shipping AS. Board member in Grieg Maturitas AS, Grieg Foundation and SOS Children's Villages, Norway. Member of the council of Det Norske Veritas.
Number of shares in Statoil ASA as of 31 December 2009: 8,190
Loans from Statoil: None
Experience: Grieg is managing director of Grieg International AS, co-owner of the Grieg Group and president of the Norwegian Shipowners' Association.
Family relations: No family relations to other members of the board, members of the corporate executive committee or the corporate assembly.
Other matters: Elisabeth Grieg is a Norwegian citizen, and she lives in Norway. She is a part-owner of the family company Grieg Maturitas AS, which indirectly owns 20% of AON Grieg AS. In 2009 AON Grieg AS acted as a broker for Statoil, for which Statoil paid fees totalling NOK 6,178,373.81. In addition, Grieg Maturitas AS and other family companies own a direct and indirect interest of 75% in Grieg Logistics AS. Grieg's husband, Stig Grimsgaard Andersen, is a member of the board of Grieg Logistics AS. Grieg Logistics AS delivered logistics and transport services to Statoil in 2009, for which it received fees totalling NOK 112,412,045.
Jakob Stausholm

Position: Board member and member of the board's audit committee.
Born: 1968
Term of office: Member of the board of Statoil ASA since July 2009.
Independent: Yes
Other directorships: No
Number of shares in Statoil ASA as of 31 December 2009: None
Loans from Statoil: None
Experience: Stausholm is the chief financial officer of the global facility services provider ISS A/S.
Before joining ISS's corporate executive committee in 2008, he was employed by the Shell Group for 19 years and held a number of management positions, inter alia as vice president finance for the group's exploration and production in Asia and the Pacific, as chief internal auditor, and various senior finance positions in Europe and Latin America.
Education: M.Sc. in economics from the University of Copenhagen.
Family relations: No family relations to other members of the board, members of the corporate executive committee or the corporate assembly.
Other matters: Jakob Stausholm is a Danish citizen and he lives in Denmark.
Grace Reksten Skaugen

Position: Board member and member of the board's compensation committee.
Born: 1953
Term of office: Member of the board of Statoil ASA since 2002.
Independent: Yes
Other directorships: Chair of the boards of Entra Eiendom AS, Ferd Holding and Norsk Institutt for Styremedlemmer, and member of the boards of REC ASA and the Swedish listed company Investor AB.
Number of shares in Statoil ASA as of 31 December 2009: 400
Loans from Statoil: None
Experience: Self-employed business consultant, director in corporate finance in Enskilda Securities in Oslo from 1994 to 2002. Has also worked with venture capital and shipping in Oslo and London and carried out research in microelectronics at Columbia University in New York.
Education: She has a doctorate in laser physics from the Imperial College of Science and Technology at the University of London and an MBA from the Norwegian School of Management (BI).
Family relations: No family relations to other members of the board, members of the corporate executive committee or the corporate assembly.
Other matters: Grace Reksten Skaugen is a Norwegian citizen and she lives in Norway.
Lill-Heidi Bakkerud

Position: Employee-elected member of the board.
Born: 1963.
Term of office: Member of the board of Statoil ASA from 1998 to 2002, and again since 2004.
Independent: No
Other directorships: Bakkerud is a member of the executive committee of the Industry Energy (IE) trade union and holds several offices as a result of this.
Number of shares in Statoil ASA as of 31 December 2009: 300
Loans from Statoil: None
Experience: She has worked as a process technician at the petrochemical plant in Bamble and on the Gullfaks field in the North Sea. She is now a full-time employee representative as the leader of IE Statoil branch.
Education: Has a craft certificate as a process/chemistry worker.
Family relations: No family relations to other members of the board, members of the corporate executive committee or the corporate assembly.
Other matters: Lill-Heidi Bakkerud is a Norwegian citizen, and she lives in Norway.
Morten Svaan

Position: Employee-elected member of the board and member of the board's audit committee.
Born: 1956
Term of office: Member of the board of Statoil ASA since 2002.
Independent: No
Other directorships: None
Number of shares in Statoil ASA as of 31 December 2009: 1,245
Loans from Statoil: None
Experience: Svaan has worked for Statoil since 1985. He now works on health, safety and the environment (HSE) for the Technology & New Energy business area, largely focusing on security and emergency response. Svaan was chief employee representative for the Statoil branch of the NIF/Tekna trade union from 2000 until 2004.
Education: He holds a PhD in chemistry from the Norwegian University of Science and Technology and a degree in business economics from the Norwegian School of Management (BI).
Family relations: No family relations to other members of the board, members of the corporate executive committee or the corporate assembly.
Other matters: Morten Svaan is a Norwegian citizen, and he lives in Norway.
Einar Arne Iversen

Position: Employee-elected member of the board.
Born: 1962
Term of office: Member of the corporate assembly of Statoil ASA from 2000 to 2009. Member of the board of Statoil ASA since June 2009.
Independent: No
Other directorships: None
Number of shares in Statoil ASA as of 31 December 2009: 2,561
Loans from Statoil: As of 31 December 2009: an employee loan amounting to NOK 153,880.02 and a car loan totalling NOK 178,886. Both loans were taken up prior to Iversen's election to the board of Statoil ASA. As of 15 March 2010, both loans have been settled.
Experience: Iversen joined Statoil in 1986, worked on technical training in Bergen and was training manager at Tjeldbergodden. He has held the offices of deputy secretary-general and secretary-general of the NITO trade union since 1998.
Education: Engineer, NKI Technical College.
Family relations: No family relations to other members of the board, members of the corporate executive committee or the corporate assembly.
Other matters: Einar Arne Iversen is a Norwegian citizen, and he lives in Norway.
7.6.1 Audit committee
The board elects at least three of its members to serve on the audit committee and appoints one of them to act as chair. The employee representatives on the board may nominate one committee member.
The current members of the audit committee are Roy Franklin (chair), Marit Arnstad, Jakob Stausholm and Morten Svaan (employee representative).
The board of directors' audit committee (audit committee) is a sub-committee of the board of directors (board) and its objective is to act as a preparatory body in connection with the board's supervisory roles with respect to financial reporting and the effectiveness of the company's internal control system, and other tasks assigned to the audit committee in accordance with the provisions herein. The audit committee is instructed to assist the board in its supervising of issues such as:
- monitoring the financial reporting process, including reviewing implementation of accounting principles and policies
- monitoring the effectiveness of the company's internal control, internal audit and risk management systems
- maintaining continuous contact with the statutory auditor regarding the annual and consolidated accounts
- reviewing and monitoring the independence of the company's internal auditor and the independence of the statutory auditor, ref. the Statutory Auditor law, chapter 4 and, in particular, whether other services than audits delivered by the statutory auditor or the audit firm are a threat to the statutory auditor's independence.
The audit committee supervises implementation of and compliance with the group's Ethics Code of Conduct and supervises the group's compliance activities relating to corruption.
The internal audit function reports directly to the board of directors and to the chief executive officer.
Under Norwegian law, the external auditor is elected by the shareholders at the annual general meeting. The audit committee makes a recommendation to the board concerning the appointment of the external auditor based on its evaluation of the qualifications and independence of the auditor proposed for election or re-election. The audit committee meets at least five times a year, and it meets separately with the internal auditor and the external auditor on a regular basis.
The audit committee is also charged with reviewing the scope of the audit and the nature of any non-audit services provided by external auditors. The external auditors report directly to the audit committee on a regular basis. The audit committee shall ensure that the company has procedures in place for receiving and dealing with complaints received by the company regarding accounting, internal control or auditing matters, and for the confidential and anonymous submission, via the group's ethics helpline, by company employees of concerns regarding accounting or auditing matters as well as other matters regarded as being in breach of the group's Ethics Code of Conduct or statutory provisions. The audit committee is designated as the company's qualified legal compliance committee for the purposes of section 307 of the Sarbanes-Oxley Act of 2002.
The audit committee may examine all activities and circumstances relating to the operations of the company in the execution of its tasks. In this connection, the audit committee may request the chief executive officer or any other employee to give it access to information, facilities and personnel and such assistance as it requests. The audit committee is authorised to carry out or instigate such investigations as it deems necessary in order to carry out its tasks and it may use the company's internal audit or investigation unit, the external auditor or other external advice and assistance. The costs of such work will be covered by the group.
The audit committee is responsible to the board only for the execution of its tasks. The work of the audit committee in no way alters the responsibility of the board and its individual members, and the board retains full responsibility for the audit committee's tasks.
The audit committee held six meetings in 2009. There was 95% attendance at the committee's meetings.
The committee's mandate is available at www.statoil.com/auditcommittee.
7.6.1.1 Audit committee financial expert
The board of directors has decided that a member of the audit committee, Jakob Stausholm, qualifies as an "audit committee financial expert", as defined in Item 16A of Form 20F.
The board of directors has also concluded that Jakob Stausholm is independent within the meaning of Rule 10A-3 under the Securities Exchange Act.
7.6.2 Compensation committee
The compensation committee is a sub-committee of the board of directors that assists the board of directors on matters relating to management compensation and leadership development.
The compensation committee is a sub-committee of the board of directors and its main responsibilities are:
(1) as a preparatory body for the board, to make recommendations to the board in all matters relating to principles for executive rewards, remuneration strategies and concepts, the CEO's contract and terms of employments and leadership development, assessments and succession planning
(2) to be informed about and advise the company's management in its work on Statoil's remuneration strategy and in drawing up appropriate remuneration policies for senior executives, and
(3) to review Statoil's remuneration policies in order to safeguard the owners' long-term interests.
The committee consists of four board members. At year end 2009, the committee members were Grace Reksten Skaugen (chair), Svein Rennemo, Elisabeth Grieg and Kjell Bjørndalen. All of the committee members are independent, non-executive directors.
The committee held eight meetings in 2009. There was 81% attendance at the committee's meetings.
The committee's mandate is available at www.statoil.com/CompensationCommittee
7.7 Compliance with NYSE listing rules
Statoil's primary listing is on the Oslo Stock Exchange (Oslo Børs). Consequently Statoil's corporate governance practices follow the requirements of Norwegian law [and the Oslo Stock Exchange]. Statoil is also registered as a foreign private issuer with the US Securities and Exchange Commission with American Depositary Shares representing its Ordinary Shares listed on the New York Stock Exchange (NYSE). Therefore, Statoil is also subject to the NYSE's listing rules ("NYSE rules"). As a foreign private issuer, Statoil is exempt from most of the NYSE corporate governance standards that domestic US companies must follow. However, Statoil is required to disclose any significant ways in which its corporate governance practices differ from those applicable to domestic US companies under the NYSE rules. A statement of differences is set forth below:
Corporate governance guidelines
The NYSE rules require domestic US companies to adopt and disclose corporate governance guidelines. Statoil's corporate governance principles are developed by management and the board of directors. Oversight of the board of directors and management is exercised by the corporate assembly.
Director independence
The NYSE rules require domestic US companies to have a majority of "independent directors", as defined by the NYSE rules. The NYSE definition of an "independent director" sets out five specific independence tests and also requires an affirmative determination by the board of directors that the director has no material relationship with the company.
Pursuant to Norwegian company law, Statoil's board of directors consists of members elected by shareholders and employees. Statoil's board of directors has determined that, in its judgement, all of the shareholder-elected directors are independent. In making its independence determinations, the board focuses on there not being any conflicts of interest between shareholders, the board of directors and the company's management but does not explicitly take into consideration the NYSE's five specific tests. The directors elected from among Statoil's employees would not be considered independent under the NYSE rules because they are employees of Statoil. None of the employee-elected directors is an executive officer of the company.
Board committees
Pursuant to Norwegian company law, managing the company is the responsibility of the board of directors. Statoil has an audit committee and a compensation committee that are responsible for preparing certain issues for the board of directors. The committees operate pursuant to charters that are broadly comparable to the form required by the NYSE rules. They report on a regular basis to, and are subject to, continuous oversight by the board of directors.
Statoil complies with the NYSE rule regarding the obligation to have an audit committee that meets the requirements of Rule 10A-3 of the US Securities Exchange Act of 1934.
As required by Norwegian company legislation, the members of Statoil's audit committee include an employee-elected director. Statoil relies on the exemption provided for in Rule 10A-3(b)(1)(iv)(C) from the independence requirements of the US Securities Exchange Act of 1934 with respect to the employee-elected director. Statoil does not believe that its reliance on this exemption will materially adversely affect the ability of the audit committee to act independently or to satisfy the other requirements of Rule 10A-3 relating to audit committees. The other members of the audit committee meet the independence requirements under Rule 10A-3.
Among other things, the audit committee evaluates the qualifications and independence of the company's external auditor. However, in accordance with Norwegian law, the auditor is elected by the annual general meeting of the company's shareholders.
The Statoil Board of Directors does not have a nominating/corporate governance board sub-committee. Instead, the roles prescribed for a nominating/corporate governance committee under the NYSE rules are principally carried out by the corporate assembly and the election committee.
Shareholder approval of equity compensation plans
The NYSE rules require that, with limited exemptions, all equity compensation plans be subjected to a shareholder vote. Although the issuance of shares and authority to buy back company shares must be approved by Statoil's annual general meeting of shareholders under Norwegian company law, approval of equity compensation plans is normally reserved for the board of directors.
7.8 Management
The president and CEO has overall responsibility for day-to-day operations in Statoil and also appoints the corporate executive committee (CEC). Each of the CEC members heads separate business areas or staff functions.
The president and CEO has overall responsibility for day-to-day operations in Statoil. The president and CEO is responsible for developing Statoil's business strategy and presenting it to the board of directors for decision, for the development and execution of the business strategy, and for nurturing a performance-driven, value-based culture.
The president and CEO appoints the corporate executive committee (CEC). Members of the CEC have a collective duty to safeguard and promote Statoil's corporate interests and to provide the president and CEO with the best possible basis for deciding the company's direction, making decisions and ensuring execution and follow-up of business activities. In addition, each of the CEC members heads separate business areas or staff functions.
Members of Statoil's corporate executive committee
Helge Lund
Born: 1962
Position: CEO of Statoil ASA since August 2004.
External offices: None
Number of shares in Statoil ASA as of 31 December 2009: 23,515
Loans from Statoil: None
Experience: Came to Statoil from the position of CEO in Aker Kværner ASA. Held central managerial positions in the Aker RGI system from1999. Has been political adviser to the Conservative Party of Norway's parliamentary group, a consultant with McKinsey & Co and deputy managing director of Nycomed Pharma AS.
Education: MA in business economics (siviløkonom) from the Norwegian School of Economics and Business Administration (NHH) in Bergen and Master of Business Administration (MBA) from INSEAD in France.
Family relations: No family relations to other members of the CEC, members of the board or the corporate assembly.
Other matters: Helge Lund is a Norwegian citizen, and he lives in Norway.
Eldar Sætre

Born: 1956
Position: CFO of Statoil ASA since October 2003.
External offices: Member of the board of Strømberg Gruppen AS.
Number of shares in Statoil ASA as of 31 December 2009: 9,644
Loans from Statoil: None
Experience: He joined Statoil in 1980 and has since held several management positions in the group, mainly in the fields of accounting and finance.
Education: MA in business economics (siviløkonom) from the Norwegian School of Economics and Business Administration in Bergen.
Family relations: No family relations to other members of the CEC, members of the board or the corporate assembly.
Other matters: Eldar Sætre is a Norwegian citizen, and he lives in Norway.
Øystein Michelsen
Born: 1956
Position: Executive vice president in Statoil ASA since 10 November 2008.
External offices: Member of the board in Oljeindustriens Landsforening (OLF, the Norwegian Oil Industry Association)
Number of shares in Statoil ASA as of 31 December 2009: 5,866
Loans from Statoil ASA: None
Experience: Recruited to Hydro's research centre in Porsgrunn in 1981, he was attached to Hydro oil and energy division from 1985, and was head of the operations unit for Hydro's oil activities from 2004. He has been senior vice president for Statoil's Operations North cluster since 1 October 2007.
Education: MA in engineering (sivilingeniør) from the Norwegian Institute of Technology (NTH) in Trondheim.
Family relations: No family relations to other members of the CEC, members of the board or the corporate assembly.
Other matters: Øystein Michelsen is a Norwegian citizen, and he lives in Norway.
Peter Mellbye

Born: 1949
Position: Executive vice president in Statoil ASA since 1992.
External offices: Member of the board of the Energy Policy Foundation of Norway (EPF).
Number of shares in Statoil ASA as of 31 December 2009: 12,170
Loans from Statoil: None
Experience: Worked for the Ministry of Trade and the Norwegian Export Council before joining Statoil in 1982. Held several central management positions in Statoil. Executive vice president of Natural Gas from 1992 to 2004.
Education: Cand. polit. degree from the University of Oslo.
Family relations: No family relations to other members of the CEC, members of the board or the corporate assembly.
Other matters: Peter Mellbye is a Norwegian citizen, and he lives in Norway.
Rune Bjørnson

Born: 1959
Position: Executive vice president in Statoil ASA since 2004.
External offices: None
Number of shares in Statoil ASA as of 31 December 2009: 7,853
Loans from Statoil: None
Experience: He has worked for Statoil since1985, holding various management positions in the Natural Gas business area. He was vice president in Statoil U.K. Ltd. from 2001 to 2003.
Education: Cand. polit. degree from the University of Bergen.
Family relations: No family relations to other members of the CEC, members of the board or the corporate assembly.
Other matters: Rune Bjørnson is a Norwegian citizen, and he lives in Norway.
Jon Arnt Jacobsen

Born: 1957
Position: Executive vice president in Statoil ASA since 2004.
External offices: Member of the board of Storebrand ASA.
Number of shares in Statoil ASA as of 31 December 2009: 10,982
Loans from Statoil: None
Experience: Worked for Den norske Bank (DnB) for 13 years, where he held positions including general manager and head of DnB's Singapore branch. Group finance director of Statoil from 1998 to 2004.
Education: MA in business economics (siviløkonom) from the Norwegian School of Management (BI) in Oslo and Master of Business Administration (MBA) from the University of Wisconsin.
Family relations: No family relations to other members of the CEC, members of the board or the corporate assembly.
Other matters: Jon Arnt Jacobsen is a Norwegian citizen, and he lives in Norway.
Gunnar Myrebøe

Born: 1949
Position: Executive vice president in Statoil ASA since 10 November 2008.
External offices: None
Number of shares in Statoil ASA as of 31 December 2009: 5,595
Loans from Statoil: None
Experience: Worked for Phillips Petroleum before joining Statoil in 1981. Among other things, he was in charge of project development for the Sleipner condensate project, was responsible for gas technology in the Natural Gas business area, has been project director for Norfra (Franpipe) and head of Statoil research and technology.
From 2003 to 2007, Mr Myrebøe led the development of the offshore part of Snøhvit and, since the merger between Statoil and Hydro, he has been responsible for offshore modifications in the Projects business area.
Education: Graduated with a Master of Science degree (sivilingeniør) from the Norwegian University of Science and Technology (NTNU) in 1973.
Family relations: No family relations to other members of the CEC, members of the board or the corporate assembly.
Other matters: Gunnar Myrebøe is a Norwegian citizen, and he lives in Norway.
Margareth Øvrum

Born: 1958
Position: Executive vice president in Statoil ASA since September 2004.
External offices: Member of the board of Atlas Copco AB, Ratos AB and the Research Council of Norway.
Number of shares in Statoil ASA as of 31 December 2009: 12,031
Loans from Statoil: None
Experience: Øvrum has worked for Statoil since1982 and has held central management positions in the company, including the position of executive vice president for health, safety and the environment and executive vice president for technology & projects. She was the company's first female platform manager, on the Gullfaks field. She was senior vice president for operations for Veslefrikk and vice president of operations support for the Norwegian continental shelf.
Education: MA in engineering (sivilingeniør) from the Norwegian Institute of Technology (NTH) in Trondheim, specialising in technical physics.
Family relations: No family relations to other members of the CEC, members of the board or the corporate assembly.
Other matters: Margareth Øvrum is a Norwegian citizen, and she lives in Norway.
Helga Nes

Born: 1956
Position: Executive vice president in Statoil ASA since 10 November 2008.
External offices: None
Number of shares in Statoil ASA as of 31 December 2009: 3,616
Loans from Statoil: None
Experience: Nes worked for Hydro from 1984, as a process engineer, quality manager and head of staff, among other positions. Nes was responsible for HSE and HR in exploration and development in Hydro's oil and energy division from 2002 to 2004, and IT director from 2004 to 2007. From 2007, Nes was in charge of HSE and HR in the Projects business area in Statoil.
Education: Cand. real degree in organic chemistry from the Norwegian University of Science and Technology (NTNU) and a Master of Business Administration from the Norwegian BI Norwegian School of Management.
Family relations: No family relations to other members of the CEC, members of the board or the corporate assembly.
Other matters: Helga Nes is a Norwegian citizen, and she lives in Norway.
7.9 Compensation to the governing bodies
This section details compensation paid to the board of directors, the corporate executive committee and the corporate assembly.
In 2009, aggregate compensation totalling NOK 880,174 was paid to the members of the corporate assembly, NOK 4,437,000 to the members of the board of directors and NOK 45,479,000 to the members of the corporate executive committee.
Detailed information about the individual compensation of the members of the board of directors and the members of the corporate executive committee in 2009 is provided in the tables below.
Members of the board (In NOK thousand) | Board remuneration | Audit committee | Compensation committee | Total remuneration |
Rennemo Svein | 590 | 0 | 63 | 653 |
Arnstad Marit | 375 | 105 | 0 | 480 |
Skaugen Grace R | 300 | 0 | 90 | 390 |
Grieg Elisabeth | 300 | 0 | 63 | 363 |
Svaan Morten | 300 | 105 | 0 | 405 |
Bjørndalen Kjell | 300 | 0 | 56 | 356 |
Franklin Roy | 462 | 145 | 0 | 607 |
Bakkerud Lill-Heidi | 300 | 0 | 0 | 300 |
Stausholm Jakob * | 150 | 55 | 0 | 205 |
Iversen Einar Arne ** | 162 | 0 | 0 | 162 |
Nilsen Geir *** | 138 | 0 | 0 | 138 |
Clausen Claus **** | 138 | 0 | 0 | 138 |
Nielsen Kurt Anker ***** | 68 | 34 | 0 | 102 |
Fritsvold Ragnar Per *** | 138 | 0 | 0 | 138 |
Total | 3721 | 444 | 272 | 4437 |
* Member since 2 July 2009 | ||||
** Member since 17 June 2009 | ||||
*** Observer until 17 June 2009 | ||||
**** Member until 17 June 2009 | ||||
***** Member until 24 March 2009 | ||||
Management remuneration in 2009 (in NOK thousand) |
|
|
|
|
|
|
|
|
|
| ||
|
|
|
|
|
|
|
|
|
|
|
|
|
| Fixed remuneration |
|
|
|
|
|
|
|
|
|
| |
Members of Corporate Executive Committee 1) | Base pay 2) | LTI 3) | Bonus 4) | Taxable benefits in kind | Taxable reimbursements | Taxable salary | Non-taxable benefits in kind | Non-taxable reimbursements | Non-taxable salary | Total remuneration | Estimated pension cost 5) | Estimated present value of pension obligation |
Lund Helge (CEO) | 6495 | 1890 | 1500 | 338 | 19 | 10242 | 485 | 19 | 504 | 10746 | 3950 | 21254 |
Bjørnson Rune (Executive vice president (E.V.P.), Natural Gas) | 2507 | 600 | 540 | 221 | 20 | 3888 | 0 | 25 | 25 | 3913 | 767 | 18668 |
Jacobsen Jon Arnt (E.V.P, Manufacturing & Marketing) | 2874 | 669 | 361 | 68 | 8 | 3980 | 0 | 37 | 37 | 4017 | 1398 | 16147 |
Mellbye Peter (E.V.P, International Exploration & Production) | 3787 | 813 | 731 | 205 | 20 | 5556 | 9 | 31 | 40 | 5596 | 1339 | 37287 |
Sætre Eldar (CFO) | 2927 | 713 | 712 | 162 | 31 | 4545 | 178 | 25 | 203 | 4748 | 870 | 25595 |
Øvrum Margareth (E.V.P, Technology & New Energy) | 2771 | 694 | 624 | 55 | 13 | 4157 | 0 | 48 | 48 | 4205 | 902 | 25243 |
Nes Helga (E.V.P, Staff functions & corporate services) | 2271 | 550 | 365 | 176 | 39 | 3401 | 181 | 17 | 198 | 3599 | 684 | 17150 |
Michelsen Øystein (E.V.P, Exploration & Production Norway) | 3220 | 750 | 481 | 217 | 6 | 4674 | 280 | 23 | 303 | 4977 | 749 | 21378 |
Myrebø Gunnar (E.V.P, Projects & Procurement) | 2419 | 575 | 324 | 45 | 5 | 3368 | 299 | 11 | 310 | 3678 | 732 | 21463 |
Total | 29271 | 7254 | 5638 | 1487 | 161 | 43811 | 1432 | 236 | 1668 | 45479 | 11391 | 204185 |
|
|
|
|
|
|
|
|
|
|
|
|
|
|
|
|
|
|
|
|
|
|
|
|
|
|
1) In addition to remuneration to the members of the Corporate Executive Committee, a final payment to former E.V.P, Staff functions & corporate services, Hilde Merete Aasheim, was made during 2009. The payment covered vacation | ||||||||||||
pay and value of unused vacation days. Total remuneration for Mrs. Aasheim during 2009 was NOK 416 thousand. |
|
|
|
|
|
|
| |||||
2) Base pay consists of base salary, holiday allowance and any other administrative benefits. |
|
|
|
|
|
|
|
| ||||
3) Fixed long-term incentive (LTI) element. The LTI implies an obligation to invest the net amount in Statoil shares. A lock-in period of 3 years applies for the investment. |
|
|
|
| ||||||||
4) Bonus paid in 2009 is related to the period 1 October 2007 to 31 December 2008 due to the merger between Statoil and Hydro Oil and gas effective from 1 October 2007. |
|
|
| |||||||||
5) Pension cost is calculated based on actuarial assumptions and pensionable salary at 31 December 2009 and will be recognised as pension cost in the Statement of Income in 2010. Payroll tax is not included. |
| |||||||||||
Statoil's remuneration policy
Statoil's remuneration policy is strongly linked to the company's people policy and core values. Certain key principles have been adopted for the design of the company's remuneration concept. These principles pertain in general but they are applied differently for the different remuneration systems and job categories.
The remuneration concept is an integrated part of our values-based performance framework. It shall:
- reflect our competitive market strategy and local market conditions
- strengthen the common interests of people in the Statoil group and shareholders
- be in accordance with statutory regulations and good corporate governance
- be fair, transparent and non-discriminatory
- reward and recognise delivery and behaviour equally
- differentiate on the basis of responsibilities and performance
- reward both short and long-term contributions and results.
Our rewards and recognition policy is designed to attract and retain the right people - people who perform, change and learn. The overall remuneration level and composition of rewards reflect the national and international framework and business environment within which Statoil operates.
The decision-making process
The decision-making process for implementing or changing remuneration policies and concepts and determining salaries and other remuneration for the corporate executive committee is in accordance with the provisions of the Norwegian Public Limited Liability Companies Act sections 5-6, 6-14, 6-16 a) and the board's Rules of Procedures as last amended on 31 July 2008.
The remuneration concept for the corporate executive committee
Statoil's remuneration concept for the corporate executive committee consists of the following main elements:
- Fixed remuneration
- Variable pay
- Pensions and insurance schemes
- Severance pay arrangements
- Other benefits.
Fixed remuneration
Fixed remuneration consists of the base salary and a long-term incentive.
Base salary
The base salary shall be competitive in the markets in which the company operates and shall reflect the individual's responsibility and performance. The evaluation of performance is based on fulfilment of certain pre-defined goals; see "Variable pay" below. The base salary is normally reviewed once a year.
Long-term incentive (LTI)
Statoil will continue its established long-term incentive system for a limited number of senior managers, including the members of the corporate executive committee.
The long-term incentive system is a fixed, monetary compensation calculated as a percentage of the participant's base salary, ranging from 20 to 30 per cent depending on the participant's position. The participant is obliged to use the fixed LTI amount (after tax) to buy Statoil shares on the market every year and to hold the shares for a lock-in period of three years.
The long-term incentive and the annual variable pay system constitute a remuneration concept that focuses on both short and long-term goals and results. The long-term incentive contributes to strengthening the commonality of interest between the top management and the shareholders of Statoil.
Variable pay
The intention is to continue the company's variable pay concept in 2010.Based on performance, the chief executive officer is entitled to annual variable pay with a maximum potential of 50 per cent of the fixed remuneration. The executive vice presidents have an equivalent variable pay scheme with a maximum potential of 40 per cent.
In order to obtain an improved distribution of the annual variable pay budget, and to underpin a drive towards an even stronger performance, it has been decided to adjust the pay out level for performance at target from 67 per cent to 50 per cent of the maximum potential.
Remuneration policies' effect on risk
The remuneration concept is an integrated part of our performance management system. It is an overarching principle that there should be a close link between performance and remuneration.
Individual salary and annual variable pay reviews are based on the performance evaluation in our performance management system. However, participation in the long-term incentive (LTI) scheme and the size of the annual LTI element are not based directly on performance but are linked to the level of the position in question.
The goals that form the basis for performance assessment are established between the manager and the employee as part of our performance management process. The performance goals have two dimensions: delivery and behaviour, where delivery and behaviour are equally important and given equal weight. Delivery goals are established for each of the five perspectives: finance, operations, market, HSE, people and organisation. In each perspective, both longer-term strategic objectives and shorter-term key performance indicators (KPI) are set, as well as actions to be executed. Some of these actions will be risk-mitigating actions derived from strategic or operational risk assessments. Behaviour goals are based on Statoil's core values and leadership principles. They address the behaviour required and expected in order to achieve our delivery goals.
Performance evaluation is a holistic evaluation that combines measurement and assessment of performance against both delivery and behaviour goals. The KPIs are used as indicators only. Hence, sound judgement and hindsight are applied before final conclusions are drawn. For instance KPI results are reviewed in relation to their strategic contribution, sustainability and any significant changes in assumptions.
This balanced score card approach, with goals defined in both the delivery and behaviour dimension, and holistic performance evaluation should significantly reduce the risk that our remuneration policies are likely to have a material adverse effect.
One of several targets in the performance contracts of the chief executive officer and chief financial officer is related to the company's relative total shareholder return (TSR). The amount of annual variable pay is decided on the basis of an overall assessment of the achievement of various targets including, but not limited to, the company's relative TSR.
7.10 Share ownership
This section describes the number of Statoil shares owned by the members of the board of directors and the corporate executive committee.
The number of Statoil shares owned by the members of the board of directors and the executive committee and/or owned by their close associates is shown below. Individually, each member of the board of directors and the corporate executive committee owned less than 1% of the outstanding Statoil shares.
Ownership of Statoil shares (including share ownership of "close associates") | As of 31 December 2009 | As of 12 March 2010 |
|
|
|
Members of the Corporate Executive Committee |
|
|
Helge Lund | 23515 | 24912 |
Eldar Sætre | 9644 | 10365 |
Margareth Øvrum | 12031 | 12689 |
Rune Bjørnson | 7853 | 8476 |
Jon Arnt Jacobsen | 10982 | 11699 |
Peter Mellbye | 12170 | 13033 |
Øystein Michelsen | 5866 | 5866 |
Gunnar Myrebøe | 5595 | 5918 |
Helga Nes | 3616 | 3647 |
Members of the Board of Directors |
|
|
Svein Rennemo | 10000 | 10000 |
Marit Arnstad | 0 | 0 |
Elisabeth Grieg | 33108 | 33108 |
Kjell Bjørndalen | 0 | 0 |
Grace Reksten Skaugen | 400 | 400 |
Jakob Stausholm | 0 | 0 |
Roy Franklin | 0 | 0 |
Lill-Heidi Bakkerud | 330 | 330 |
Morten Svaan | 1245 | 1326 |
Einar Arne Iversen | 2561 | 2740 |
Individually, each member of the corporate assembly owned less than 1% of outstanding Statoil shares as of 31 December 2009 and as of 12 March 2010. In aggregate, members of the corporate assembly owned a total of 5,841 shares as of 31 December 2009 and a total of 6,627 shares as of 12 March 2010. Information about the individual share ownership of the members of the corporate assembly is presented in the section 7.5 Corporate governance - Corporate assembly.
The voting rights of members of the board of directors, the corporate executive committee and the corporate assembly do not differ from those of ordinary shareholders.
7.11 Independent auditor
This section provides details about the independent auditor, and about policies, procedures and remuneration relating to the auditor.
Our independent registered public accounting firm (independent auditor) is independent in relation to Statoil and is appointed by the general meeting of shareholders. The independent auditor's fee must be approved by the general meeting of shareholders.
Pursuant to the instructions for the board's audit committee (audit committee) approved by the board of directors, the audit committee is responsible for ensuring that the company is subject to an independent and effective external and internal audit.
Every year, the independent auditor presents a plan for the audit committee for the execution of the independent auditor's work.
The independent auditor is present at the board meeting that deals with the preparation of the annual accounts.
The independent auditor participates in meetings with the audit committee at which the internal control system is discussed.
When evaluating the independent auditor, emphasis is placed on the firm's qualifications, capacity, local and international availability and the size of the fee.
The audit committee evaluates and makes a recommendation regarding the choice of independent auditor and is responsible for ensuring that the independent auditor meets the requirements in Norway and in the countries where Statoil is listed. The independent auditor is subject to the provisions of US securities legislation, which stipulate that a responsible partner may not lead the engagement for more than five consecutive years.
The audit committee considers all reports from the independent auditor before they are considered by the board of directors. The audit committee holds regular meetings with the independent auditor without the company's management being present.
The audit committee's policies and procedures for pre-approval
In its instructions for the audit committee, the board of directors has delegated to the audit committee the authority to pre-approve assignments to be performed by the independent auditor. The audit committee has issued guidelines for the management's pre-approval of assignments to be performed by the independent auditor.
All services provided by the independent auditor must be pre-approved by the audit committee. Provided that the suggested types of services are permissible under SEC guidelines, pre-approval is usually granted at a regular audit committee meeting. The chair of the audit committee has been authorised to pre-approve services that are in accordance with policies established by the audit committee that specify in detail the types of services that qualify. It is a condition that any services pre-approved in this manner are presented to the full audit committee at its next meeting. Some pre-approvals can therefore be granted by the chair of the audit committee if an urgent reply is deemed necessary.
Remuneration of the independent auditor in 2009
In the annual consolidated financial statements and in the parent company's financial statements, the independent auditor's remuneration is split between the audit fee and the fee for audit-related and other services. The chair presents the split between the audit fee and the fee for audit-related and other sevices to the annual general meeting of shareholders.
Ernst & Young AS is the company's independent registered public accounting firm. The table below itemises the expensed remuneration paid to the external auditor in 2009, 2008 and 2007, respectively:
|
| Audit related fee | Other service fee |
|
(in NOK million, excluding VAT) | Audit fee | Total | ||
|
|
|
|
|
2009 |
|
|
|
|
Ernst & Young - Norway | 34.2 | 5.3 | 3.7 | 43.2 |
Ernst & Young - outside Norway | 27.1 | 1.5 | 0.9 | 29.5 |
|
|
|
|
|
Total | 61.3 | 6.8 | 4.6 | 72.7 |
|
|
|
|
|
2008 |
|
|
|
|
Ernst & Young - Norway | 35.0 | 4.9 | 0.1 | 40.0 |
Ernst & Young - outside Norway | 25.3 | 3.8 | 0.1 | 29.2 |
|
|
|
|
|
Total | 60.3 | 8.7 | 0.2 | 69.2 |
|
|
|
|
|
2007 |
|
|
|
|
Ernst & Young - Norway | 20.7 | 7.3 | 0.1 | 28.1 |
Ernst & Young - outside Norway | 24.1 | 0.8 | 0.3 | 25.2 |
|
|
|
|
|
Total | 44.8 | 8.1 | 0.4 | 53.3 |
All fees included in the table were approved by the audit committee.
Audit services are defined as the standard audit work that must be performed every year in order to issue an opinion on Statoil's consolidated financial statements and to issue reports on the IFRS's statutory financial statements. It also includes other audit services, which are those services that only the independent auditor can reasonably provide, such as auditing of non-recurring transactions and the application of new accounting policies, audits of significant and newly implemented system controls and limited reviews of quarterly financial results.
Audit-related services include other assurance and related services provided by auditors, but not restricted to those that can only reasonably be provided by the external auditor who signs the audit report, that are reasonably related to the performance of the audit or review of the company's financial statements, such as acquisition due diligence, audits of pension and benefit plans, consultations concerning financial accounting and reporting standards.
Other services include services provided by the auditors within the framework of Sarbanes Oxley Act, i.e. certain agreed upon procedures.
Audit fees amounting to NOK 8.9 million, NOK 8.5 million and NOK 6.1 million relating to Statoil-operated licences were paid to Ernst & Young for the years 2009, 2008 and 2007, respectively.
The increase in audit fees from 2007 to 2008 were mainly due to the increase in activity in connection with the merger with Hydro Petroleum.
7.12 Controls and procedures
This section describes controls and procedures relating to our financial reporting.
Evaluation of disclosure controls and procedures
Our management, with the participation of our chief executive officer and chief financial officer, has evaluated the effectiveness of the design and operation of our disclosure controls and procedures pursuant to Exchange Act Rule 13a-15(b) as of the end of the period covered by Form 20-F. Based on that evaluation, the chief executive officer and chief financial officer have concluded that these disclosure controls and procedures are effective at a reasonable level of assurance.
In order to facilitate the evaluation, Statoil established a disclosure committee in January 2008 to review material disclosures made by Statoil for any errors, misstatements and omissions. The disclosure committee is chaired by the chief financial officer. It consists of the heads of Investor Relations, Accounting and Financial Control, Tax and General Counsel and may be supplemented by other internal and external personnel. The head of the Internal Audit is an observer at the committee's meetings.
In designing and evaluating our disclosure controls and procedures, our management, with the participation of the chief executive officer and chief financial officer, recognised that any controls and procedures, no matter how well designed and operated, can only provide reasonable assurance that the desired control objectives will be achieved, and that our management must necessarily exercise judgment in evaluating the cost-benefit aspects of possible controls and procedures. Because of the limitations inherent in all control systems, no evaluation of controls can provide absolute assurance that all control issues and any instances of fraud in the company have been detected.
The management's report on internal control of financial reporting
The management of Statoil ASA is responsible for establishing and maintaining adequate internal control of financial reporting. Our internal control of financial reporting is a process designed, under the supervision of the chief executive officer and chief financial officer, to provide reasonable assurance regarding the reliability of financial reporting and the preparation of Statoil's financial statements for external reporting purposes in accordance with International Financial Reporting Standards as adopted by the European Union (EU). The accounting policies applied by the group also comply with IFRS as issued by the International Accounting Standards Board (IASB).
The management has assessed the effectiveness of internal control of financial reporting based on the Internal Control - Integrated Framework issued by the Committee of Sponsoring Organizations of the Treadway Commission (COSO). Based on this assessment, the management has concluded that Statoil's internal control over financial reporting as of 31 December 2009 was effective.
Statoil's internal control of financial reporting includes policies and procedures that pertain to the maintenance of records that, in reasonable detail, accurately and fairly, reflect transactions and dispositions of assets; provide reasonable assurance that transactions are recorded in the manner necessary to permit the preparation of financial statements in accordance with IFRS, and that receipts and expenditures are only carried out in accordance with the authorisation of the management and directors of Statoil; and provide reasonable assurance regarding the prevention or timely detection of any unauthorised acquisition, use or disposition of Statoil's assets that could have a material effect on our financial statements.
Because of its inherent limitations, internal control of financial reporting may not prevent or detect all misstatements. Moreover, projections of any evaluation of the effectiveness of internal control to future periods are subject to a risk that controls may become inadequate because of changes in conditions and that the degree of compliance with the policies or procedures may deteriorate.
The effectiveness of internal control of financial reporting as of 31 December 2009 has been audited by Ernst & Young AS, an independent registered public accounting firm that also audits our consolidated financial statements included in this annual report. Their audit report on the internal control of financial reporting is included in section 8 in the Consolidated Financial Statements of this report.
Changes in internal controls of financial reporting
No changes occurred in our internal control of financial reporting during the period covered by Form 20-F that have materially affected, or are reasonably likely to materially affect, our internal control of financial reporting.
8 Consolidated Financial Statements
CONSOLIDATED STATEMENT OF INCOME | ||||
|
| For the year ended 31 December | ||
(in NOK million) | Note | 2009 | 2008 | 2007 |
|
|
|
|
|
REVENUES AND OTHER INCOME |
|
|
|
|
Revenues |
| 462,292 | 651,977 | 521,665 |
Net income from associated companies | 15 | 1,778 | 1,283 | 609 |
Other income |
| 1,363 | 2,760 | 523 |
|
|
|
|
|
Total revenues and other income | 5 | 465,433 | 656,020 | 522,797 |
|
|
|
|
|
OPERATING EXPENSES |
|
|
|
|
Purchases [net of inventory variation] |
| ( 205,870) | ( 329,182) | ( 260,396) |
Operating expenses |
| ( 56,860) | ( 59,349) | ( 60,318) |
Selling, general and administrative expenses |
| ( 10,321) | ( 10,964) | ( 14,174) |
Depreciation, amortisation and net impairment losses | 13 | ( 54,056) | ( 42,996) | ( 39,372) |
Exploration expenses |
| ( 16,686) | ( 14,697) | ( 11,333) |
|
|
|
|
|
Total operating expenses |
| ( 343,793) | ( 457,188) | ( 385,593) |
|
|
|
|
|
Net operating income | 5 | 121,640 | 198,832 | 137,204 |
|
|
|
|
|
FINANCIAL ITEMS |
|
|
|
|
Net foreign exchange gains (losses) |
| 1,993 | ( 32,563) | 10,043 |
Interest income and other financial items |
| 3,708 | 12,207 | 2,305 |
Interest and other finance expenses |
| ( 12,451) | 1,991 | ( 2,741) |
|
|
|
|
|
Net financial items | 10 | ( 6,750) | ( 18,365) | 9,607 |
|
|
|
|
|
Income before tax |
| 114,890 | 180,467 | 146,811 |
|
|
|
|
|
Income tax | 11 | ( 97,175) | ( 137,197) | ( 102,170) |
|
|
|
|
|
Net income |
| 17,715 | 43,270 | 44,641 |
|
|
|
|
|
|
|
|
|
|
Attributable to: |
|
|
|
|
Equity holders of the company |
| 18,313 | 43,265 | 44,096 |
Non-controlling interest (Minority interest) |
| ( 598) | 5 | 545 |
|
| 17,715 | 43,270 | 44,641 |
|
|
|
|
|
Earnings per share for income attributable to equity holders of the company - basic and diluted | 12 | 5.75 | 13.58 | 13.80 |
CONSOLIDATED STATEMENT OF COMPREHENSIVE INCOME | |||
| For the year ended 31 December | ||
(in NOK million) | 2009 | 2008 | 2007 |
|
|
|
|
Net income | 17,715 | 43,270 | 44,641 |
|
|
|
|
Foreign currency translation differences | (13,637) | 30,880 | (9,858) |
Actuarial gains (losses) on employee retirement benefit plans | 3,191 | (7,945) | 74 |
Change in fair value of available for sale financial assets | (66) | (1,362) | 926 |
Income tax on income and expense recognised directly in OCI | (742) | (802) | (175) |
|
|
|
|
Other comprehensive income (OCI) | (11,254) | 20,771 | (9,033) |
|
|
|
|
Total comprehensive income | 6,461 | 64,041 | 35,608 |
|
|
|
|
Attributable to: |
|
|
|
Equity holders of the parent company | 7,059 | 64,036 | 35,063 |
Non-controlling interest | (598) | 5 | 545 |
| 6,461 | 64,041 | 35,608 |
CONSOLIDATED BALANCE SHEET |
|
|
|
|
|
| At 31 December | At 31 December | At 1 January |
|
| 2009 | 2008 | 2008 |
(in NOK million) | Note |
| (restated) | (restated) |
|
|
|
|
|
ASSETS |
|
|
|
|
Non-current assets |
|
|
|
|
Property, plant and equipment | 13 | 340,835 | 329,841 | 278,352 |
Intangible assets | 14 | 54,253 | 66,036 | 44,850 |
Investments in associated companies | 15 | 10,056 | 12,640 | 8,421 |
Deferred tax assets | 11 | 1,960 | 1,302 | 793 |
Pension assets | 23 | 2,694 | 30 | 1,622 |
Financial investments | 16 | 13,267 | 16,465 | 15,266 |
Derivative financial instruments | 30 | 17,644 | 21,282 | 12,768 |
Financial receivables | 16 | 5,747 | 4,914 | 3,515 |
|
|
|
|
|
Total non-current assets |
| 446,456 | 452,510 | 365,587 |
|
|
|
|
|
Current assets |
|
|
|
|
Inventories | 17 | 20,196 | 15,151 | 17,696 |
Trade and other receivables | 18 | 58,895 | 69,931 | 69,378 |
Current tax receivable |
| 179 | 3,840 | 0 |
Derivative financial instruments | 30 | 5,369 | 9,366 | 8,802 |
Financial investments | 19 | 7,022 | 9,747 | 3,359 |
Cash and cash equivalents | 20 | 24,723 | 18,638 | 18,264 |
|
|
|
|
|
Total current assets |
| 116,384 | 126,673 | 117,499 |
|
|
|
|
|
TOTAL ASSETS |
| 562,840 | 579,183 | 483,086 |
CONSOLIDATED BALANCE SHEET |
|
|
|
|
|
| At 31 December | At 31 December | At 1 January |
|
| 2009 | 2008 | 2008 |
(in NOK million) | Note |
| (restated) | (restated) |
|
|
|
|
|
EQUITY AND LIABILITIES |
|
|
|
|
Equity |
|
|
|
|
Share capital |
| 7,972 | 7,972 | 7,972 |
Treasury shares |
| (15) | (9) | (6) |
Additional paid-in capital |
| 41,732 | 41,450 | 41,370 |
Additional paid-in capital related to treasury shares |
| (847) | (586) | (359) |
Retained earnings |
| 145,909 | 147,998 | 140,909 |
Other reserves |
| 3,568 | 17,254 | (12,611) |
|
|
|
|
|
Statoil shareholders' equity |
| 198,319 | 214,079 | 177,275 |
|
|
|
|
|
Non-controlling interest (Minority interest) |
| 1,799 | 1,976 | 1,792 |
|
|
|
|
|
Total equity |
| 200,118 | 216,055 | 179,067 |
|
|
|
|
|
Non-current liabilities |
|
|
|
|
Financial liabilities | 22 | 95,962 | 54,606 | 44,374 |
Derivative financial instruments |
| 1,657 | 1,617 | 27 |
Deferred tax liabilities | 11 | 76,322 | 68,144 | 67,477 |
Pension liabilities | 23 | 21,142 | 25,538 | 19,092 |
Assets retirement obligations, other provisions and other liabilities | 24 | 55,834 | 54,359 | 43,845 |
|
|
|
|
|
Total non-current liabilities |
| 250,917 | 204,264 | 174,815 |
|
|
|
|
|
Current liabilities |
|
|
|
|
Trade and other payables | 25 | 59,801 | 61,200 | 64,624 |
Current tax payable |
| 40,994 | 57,074 | 50,941 |
Financial liabilities | 26 | 8,150 | 20,695 | 6,166 |
Derivative financial instruments | 30 | 2,860 | 19,895 | 7,473 |
|
|
|
|
|
Total current liabilities |
| 111,805 | 158,864 | 129,204 |
|
|
|
|
|
Total liabilities |
| 362,722 | 363,128 | 304,019 |
|
|
|
|
|
TOTAL EQUITY AND LIABILITIES |
| 562,840 | 579,183 | 483,086 |
CONSOLIDATED STATEMENT OF CHANGES IN EQUITY |
|
|
|
|
|
|
|
| |||
|
|
|
|
|
|
| Other reserves |
|
|
| |
(in NOK million, except share data) | Number of shares issued | Share capital | Treasury shares | Additional paid-in capital | Additional paid-in capital related to treasury shares | Retained earnings | Available for sale financial assets | Currency translation adjustments | Statoil shareholders' equity | Non-controlling interest | Total |
|
|
|
|
|
|
|
|
|
|
|
|
At 1 January 2007 | 3,208,805,951 | 8,022 | (54) | 44,684 | (3,605) | 122,153 | 450 | (3,817) | 167,833 | 1,574 | 169,407 |
|
|
|
|
|
|
|
|
|
|
|
|
Net income for the period |
|
|
|
|
| 44,096 |
|
| 44,096 | 545 | 44,641 |
Income and expense recognised directly in OCI |
|
|
|
|
| 211 | 614 | (9,858) | (9,033) |
| (9,033) |
Total recognised income and expense for the period* |
|
|
|
|
|
|
|
|
|
| 35,608 |
Dividend paid |
|
|
|
|
| (25,694) |
|
| (25,694) |
| (25,694) |
Cash distributions (to) from non-controlling interest |
|
|
|
|
|
|
|
|
| (327) | (327) |
Merger related adjustments |
|
|
|
|
| 143 |
|
| 143 |
| 143 |
Effectuation of annulment | (20,158,848) | (50) | 50 | (3,426) | 3,426 |
|
|
| 0 |
| 0 |
Equity settled share based payments |
|
|
|
|
|
|
|
|
|
|
|
(net of allocated shares) |
|
|
| 112 |
|
|
|
| 112 |
| 112 |
Treasury shares purchased (net of allocated shares) |
|
| (2) |
| (180) |
|
|
| (182) |
| (182) |
|
|
|
|
|
|
|
|
|
|
|
|
At 31 December 2007 | 3,188,647,103 | 7,972 | (6) | 41,370 | (359) | 140,909 | 1,064 | (13,675) | 177,275 | 1,792 | 179,067 |
|
|
|
|
|
|
|
|
|
|
|
|
Net income for the period |
|
|
|
|
| 43,265 |
|
| 43,265 | 5 | 43,270 |
Income and expense recognised directly in OCI |
|
|
|
|
| (9,094) | (1,015) | 30,880 | 20,771 |
| 20,771 |
Total recognised income and expense for the period* |
|
|
|
|
|
|
|
|
|
| 64,041 |
Dividend paid |
|
|
|
|
| (27,082) |
|
| (27,082) |
| (27,082) |
Cash distributions (to) from non-controlling interest |
|
|
|
|
|
|
|
|
| 179 | 179 |
Equity settled share based payments |
|
|
|
|
|
|
|
|
|
|
|
(net of allocated shares) |
|
|
| 80 |
|
|
|
| 80 |
| 80 |
Treasury shares purchased (net of allocated shares) |
|
| (3) |
| (227) |
|
|
| (230) |
| (230) |
|
|
|
|
|
|
|
|
|
|
|
|
At 31 December 2008 | 3,188,647,103 | 7,972 | (9) | 41,450 | (586) | 147,998 | 49 | 17,205 | 214,079 | 1,976 | 216,055 |
CONSOLIDATED STATEMENT OF CHANGES IN EQUITY |
|
|
|
|
|
|
|
| |||
|
|
|
|
|
|
| Other reserves |
|
|
| |
(in NOK million, except share data) | Number of shares issued | Share capital | Treasury shares | Additional paid-in capital | Additional paid-in capital related to treasury shares | Retained earnings | Available for sale financial assets | Currency translation adjustments | Statoil shareholders' equity | Non-controlling interest | Total |
At 31 December 2008 | 3,188,647,103 | 7,972 | (9) | 41,450 | (586) | 147,998 | 49 | 17,205 | 214,079 | 1,976 | 216,055 |
|
|
|
|
|
|
|
|
|
|
|
|
Net income for the period |
|
|
|
|
| 18,313 |
|
| 18,313 | (598) | 17,715 |
Income and expense recognised directly in OCI |
|
|
|
|
| 2,432 | (49) | (13,637) | (11,254) |
| (11,254) |
Total recognised income and expense for the period* |
|
|
|
|
|
|
|
|
|
| 6,461 |
Dividend paid |
|
|
|
|
| (23,085) |
|
| (23,085) |
| (23,085) |
Cash distributions (to) from non-controlling interest |
|
|
|
|
|
|
|
|
| 421 | 421 |
Merger related adjustments |
|
|
|
|
| 251 |
|
| 251 |
| 251 |
Equity settled share based payments |
|
|
|
|
|
|
|
|
|
|
|
(net of allocated shares) |
|
|
| 282 |
|
|
|
| 282 |
| 282 |
Treasury shares purchased (net of allocated shares) |
|
| (6) |
| (261) |
|
|
| (267) |
| (267) |
|
|
|
|
|
|
|
|
|
|
|
|
At 31 December 2009 | 3,188,647,103 | 7,972 | (15) | 41,732 | (847) | 145,909 | 0 | 3,568 | 198,319 | 1,799 | 200,118 |
|
|
|
|
|
|
|
|
|
|
|
|
* For detailed information, see Consolidated statement of comprehensive income |
|
|
|
| |||||||
CONSOLIDATED STATEMENT OF CASH FLOWS |
|
|
|
| For the year ended 31 December | ||
| 2009 | 2008 | 2007 |
(in NOK million) |
| (restated) | (restated) |
|
|
|
|
OPERATING ACTIVITIES |
|
|
|
Income before tax | 114,890 | 180,467 | 146,811 |
|
|
|
|
Adjustments to reconcile net income to net cash flows |
|
|
|
provided by operating activities: |
|
|
|
Depreciation, amortisation and impairment losses | 54,056 | 42,996 | 39,372 |
Exploration expenditures written off | 6,998 | 3,872 | 1,660 |
(Gains) losses on foreign currency transactions and balances | 6,512 | 15,243 | (559) |
(Gains) losses on sales of assets and other items | (526) | (2,704) | (188) |
Termination benefits | 0 | 0 | 8,633 |
|
|
|
|
Changes in working capital (other than cash and cash equivalents): |
|
|
|
• (Increase) decrease in inventories | (5,045) | 2,470 | (2,434) |
• (Increase) decrease in trade and other receivables | 11,036 | (1,129) | (6,493) |
• (Increase) decrease in net current financial derivative instruments | (13,038) | 11,858 | 4,277 |
• (Increase) decrease in current financial investments | 2,725 | (6,388) | (2,327) |
• Increase (decrease) in trade and other payables | (1,365) | (5,466) | 10,447 |
|
|
|
|
Taxes paid | (100,473) | (139,604) | (102,422) |
(Increase) decrease in non-current items related to operating activities | (2,769) | 918 | (2,851) |
|
|
|
|
Cash flows provided by operating activities | 73,001 | 102,533 | 93,926 |
|
|
|
|
INVESTING ACTIVITIES |
|
|
|
Additions through business combinations | 0 | (13,120) | 0 |
Additions to property, plant and equipment | (67,152) | (58,529) | (63,785) |
Exploration expenditures capitalised | (7,203) | (6,821) | (4,569) |
Changes/Additions to other intangibles | (795) | (10,828) | (7,186) |
Change in long-term loans granted and other long-term items | (1,636) | (1,910) | (652) |
Proceeds from sale of assets | 1,430 | 5,371 | 1,080 |
|
|
|
|
Cash flows used in investing activities | (75,356) | (85,837) | (75,112) |
CONSOLIDATED STATEMENT OF CASH FLOWS |
|
|
|
| For the year ended 31 December | ||
| 2009 | 2008 | 2007 |
(in NOK million) |
| (restated) | (restated) |
|
|
|
|
FINANCING ACTIVITIES |
|
|
|
New long-term borrowings | 46,318 | 2,596 | 1,723 |
Repayment of long-term borrowings | (4,905) | (2,864) | (2,876) |
Distribution (to)/from non-controlling interests | 421 | 179 | (327) |
Dividend paid * | (23,085) | (27,082) | (25,695) |
Treasury shares purchased | (343) | (308) | (217) |
Norsk Hydro ASA merger balance | 0 | 0 | 18,687 |
Net short-term borrowings, bank overdrafts and other ** | (7,115) | 10,450 | 797 |
|
|
|
|
Cash flows provided by (used in) financing activities | 11,291 | (17,029) | (7,908) |
|
|
|
|
Net increase (decrease) in cash and cash equivalents | 8,936 | (333) | 10,906 |
|
|
|
|
Effect of exchange rate changes on cash and cash equivalents | (2,851) | 707 | (160) |
Cash and cash equivalents at the beginning of the period | 18,638 | 18,264 | 7,518 |
|
|
|
|
Cash and cash equivalents at the end of the period | 24,723 | 18,638 | 18,264 |
|
|
|
|
Interest paid | 2,912 | 2,771 | 3,709 |
Interest received | 3,962 | 4,544 | 2,256 |
|
|
|
|
* Dividend paid in 2007 includes NOK 6.1 billion charged to Hydro Petroleum from Norsk Hydro ASA under the terms of the merger plan. | |||
** Regarding redemption of shares held by the state, Statoil has paid the state NOK 2.4 billion in 2007. |
|
| |
8.1 Notes to the Consolidated Financial Statements
8.1.1 Organisation
Statoil ASA, originally Den Norske Stats Oljeselskap AS, was founded in 1972 and is incorporated and domiciled in Norway.
Effective 1 October 2007, Statoil ASA merged with the oil and gas activities of Norsk Hydro ASA (Hydro Petroleum), and the company's name changed to StatoilHydro ASA. As of 1 November 2009 the name was changed back to Statoil ASA. The address of its registered office is Forusbeen 50, N-4035 Stavanger, Norway.
Statoil's business consists principally of the exploration, production, transportation, refining and marketing of petroleum and petroleum-derived products.
Statoil ASA is listed on the Oslo Stock Exchange (Norway) and the New York Stock Exchange (USA).
Statoil's oil and gas activities and net assets on the Norwegian Continental Shelf (NCS) were until 31 December 2008 owned by Statoil ASA and by Statoil Petroleum AS. With effect from 1 January 2009, Statoil ASA transferred the ownership of its NCS net assets to Statoil Petroleum AS, a 100% owned operating subsidiary. Following the transfer, all NCS net assets are owned by Statoil Petroleum AS. As a result of this group internal reorganisation, the nature of the parent company Statoil ASA's operations and transactions were changed so that its functional currency also changed from NOK to USD effective as of the same date and with prospective effect. The functional currency of Statoil Petroleum AS has not changed and remains NOK. The presentation currency for the Statoil group remains NOK.
8.1.2 Significant accounting policies
Statement of compliance
The Consolidated financial statements of Statoil ASA and its subsidiaries ("Statoil") have been prepared in accordance with International Financial Reporting Standards (IFRSs) as adopted by the European Union (EU). The accounting policies applied by the group also comply with IFRSs as issued by the International Accounting Standards Board (IASB).
Basis of preparation
The financial statements are prepared on the historical cost basis with some exceptions, as detailed in the accounting policies set out below. These policies have been applied consistently to all periods presented in these consolidated financial statements.
Operating expenses in the statements of income are presented as a combination of function and nature in conformity with industry practice. Purchases [net of inventory variation] and Depreciation, amortisation and impairment losses are presented in separate lines by their nature, while Operating expenses and Selling, general and administrative expenses as well as Exploration expenses are presented on a functional basis. Significant expenses such as salaries, pensions, etc. are presented by their nature in the notes to the financial statements.
Standards and interpretations in issue, not yet adopted
At the date of these financial statements the following standards and interpretations were in issue but not yet effective:
The revised version of IFRS 3 Business Combinations, issued in January 2008, covers definition, identification, accounting for and disclosure of business combinations, inclusive of business combinations achieved in stages. It will be applicable to business combinations occurring in annual periods beginning on or after 1 July 2009. There is not expected to be any material effect on Statoil's reported net income or equity upon adoption of the revised standard on 1 January 2010.
The amended version of IAS 27 Consolidated and Separate Financial Statements, issued in January 2008, primarily covers amendments related to accounting for non-controlling interests and the loss of control of a subsidiary, and is effective for annual periods beginning on or after 1 July 2009. There is not expected to be any material effect on Statoil's reported net income or equity on adoption of the amendment on 1 January 2010.
The Improvements to IFRS 2009 issued in April 2009 include amendments effective for accounting periods beginning on or after 1 July 2009 or 1 January 2010 respectively, depending on the standard involved, and include amendments to a number of accounting standards. None of the amendments are expected to significantly impact Statoil's net profit, equity or classifications in the balance sheet or statement of income.
IFRS 9 Financial Instruments, issued in November 2009, covers the classification and measurement of financial assets and will be effective from 1 January 2013. IFRS 9 also entails amendments to various other IFRSs effective from the same date. Statoil has not yet determined its adoption date for this standard, and is still evaluating the potential impact of this standard.
The revised IAS 24 Related Party Disclosures issued in November 2009 defines the term related party and establishes disclosure requirements to be applied, and will be effective from 1 January 2011. Statoil will comply with the revised standard and provide relevant disclosure upon adoption as applicable.
The amendment to IFRIC 14 Prepayments of a Minimum Funding Requirement issued in November 2009 and effective as of 1 January 2011 is not expected to have any material effect on Statoil's reported net income or equity on adoption.
The amendment to IAS 32 Classification of Rights Issues issued in November 2009 and effective from accounting periods beginning 1 February 2010 or later, the amendment to IFRS 2 Group Cash-settled Share-based Payment Transactions issued in July 2009 and effective from 1 January 2010 and IFRIC 19 Extinguishing Financial Liabilities with Equity Instruments issued in November 2009 and effective for annual periods beginning on or after 1 July 2010 are currently not relevant for Statoil.
Significant changes in accounting policies
With effect from 1 January 2009 Statoil adopted amendments to IAS 1 Presentation of Financial Statements issued in September 2007. The Statement of recognised income and expenses has been replaced with the Consolidated statement of comprehensive income and the Consolidated statement of changes in equity, which Statoil previously presented in the Equity note. The Consolidated statement of changes in equity shows changes in non-controlling interests separately.
Based on amendments to IAS 1 Presentation of Financial Statements included in the improvements to IFRSs effective 1 January 2009, Statoil in 2009 reclassified certain instruments in the IAS 39 Financial Instruments: Recognition and Measurement related held for trading category from current assets or liabilities to non-current assets or liabilities. Statoil's principle as applied in the balance sheet for 31 December 2009 is described in relevant paragraphs below, while information on reclassified amounts is included in note 30. The policy change has been applied retrospectively by adjusting the balance sheets for 31 December 2008 and 1 January 2008 respectively, and in consequence a balance sheet as at 1 January 2008 has been included in these financial statements.
As of 31 December 2009 Statoil adopted revisions to the oil and gas estimation and disclosure requirements. For additional information see "Critical accounting judgements and key sources of estimation uncertainty; Proved oil and gas reserves".
Basis of consolidation
Subsidiaries
The consolidated financial statements include the accounts of Statoil ASA and its subsidiaries. Subsidiaries are entities controlled by the company. Control exists when Statoil has the power, directly or indirectly, to govern the financial and operating policies of an entity so as to obtain benefits from its activities. Subsidiaries are consolidated from the date of their acquisition, being the date on which Statoil obtains control, and continue to be consolidated until the date that such control ceases.
All intercompany balances and transactions, including unrealised profits and losses arising from group internal transactions, have been eliminated in full. Non-controlling interests (minority interests) represent the portion of profit or loss and net assets in subsidiaries that are not directly or indirectly held by the parent company and are presented separately within equity in the balance sheet.
Jointly controlled assets, associates and joint venture entities
Interests in jointly controlled assets are recognised by including Statoil's share of assets, liabilities, income and expenses on a line-by-line basis. Interests in jointly controlled entities are accounted for using the equity method. Investments in companies in which Statoil does not have control or joint control, but has the ability to exercise significant influence over operating and financial policies, are classified as associates and are accounted for using the equity method.
Statoil as operator of jointly controlled assets
Indirect operating expenses such as personnel expenses are accumulated in cost pools. These costs are allocated to business areas and Statoil operated jointly controlled assets (licences) on an hours incurred basis. Costs allocated to the other partners' share of operated jointly controlled assets reduce the costs in the group statements of income. Only Statoil's share of the statement of income and balance sheet items related to Statoil operated jointly controlled assets are reflected in the statement of income and balance sheet.
Foreign currency
Functional currency
A group entity's functional currency is the currency of the primary economic environment in which the entity operates.
Foreign currency translation
In preparing the financial statements of the individual entities, transactions in foreign currencies (those other than functional currency) are translated at the foreign exchange rate at the date of the transaction. Monetary assets and liabilities denominated in foreign currencies are translated to the functional currency at the foreign exchange rate at the balance sheet date. Foreign exchange differences arising on translation are recognised in the statement of income. Non-monetary assets that are measured in terms of historical cost in a foreign currency are translated using the exchange rate at the date of the transactions.
Presentation currency
For the purpose of the consolidated financial statements, the statements of income and balance sheets of each entity are translated into Norwegian kroner (NOK), which is the presentation currency of the consolidated financial statements. The assets and liabilities of entities whose functional currencies are other than NOK are translated into NOK at the foreign exchange rate at the balance sheet date. The revenues and expenses of such entities are translated using average monthly foreign exchange rates, which approximates the foreign exchange rates on the dates of the transactions. Foreign exchange differences arising on translation are recognised separately in Other comprehensive income.
Business combinations and goodwill
In order to meet the criteria for a business combination the acquired asset or group of assets must constitute a business (an integrated set of activities and assets conducted and managed for the purpose of providing a return to investors). This requires judgment to be applied on a case by case basis as to whether the acquisition meets the definition of a business combination. Acquisitions of exploration and evaluation licences are assessed under the relevant criteria to establish whether the transaction represents a business combination or an asset purchase. Acquisitions of licences for which a development decision has not yet been made have largely been concluded to represent asset purchases.
Business combinations, except for transactions between entities under common control, have been accounted for using the purchase method of accounting. The acquired identifiable tangible and intangible assets, liabilities and contingent liabilities are measured at their fair values at the date of the acquisition. Any excess of the cost of purchase over the net fair value of the identifiable assets acquired is recognised as goodwill.
Goodwill on acquisition is initially measured at cost. Following initial recognition, goodwill is measured at cost less any accumulated impairment losses.
Goodwill may also arise upon investments in jointly controlled entities and associates, being the surplus of the cost of investment over the group's share of the net fair value of the identifiable assets. Such goodwill is recorded within investments in jointly controlled entities and associates, and any impairment of the goodwill is included in income from jointly controlled entities and associates.
Revenue recognition
Revenues associated with sale and transportation of crude oil, natural gas, petroleum and chemical products and other merchandise are recognised when title and risk pass to the customer, which is normally at the point of delivery of the goods based on the contractual terms of the agreements.
Revenues from the production of oil and gas properties in which Statoil has an interest with other companies are recognised on the basis of volumes lifted and sold to customers during the period (the sales method). Where Statoil has lifted and sold more than the ownership interest, an accrual is recorded for the cost of the overlift. Where Statoil has lifted and sold less than the ownership interest, costs are deferred for the underlift.
Revenue is presented net of customs, excise taxes and royalties paid in-kind on petroleum products.
Sales and purchases of physical commodities, which are not settled net, are presented on a gross basis as revenue and cost of goods sold in the statements of income. Activities related to trading and commodity-based derivative instruments are reported on a net basis, with the margin included in revenue.
Transactions with the Norwegian State
Statoil markets and sells the Norwegian State's share of oil and gas production from the Norwegian Continental Shelf (NCS). The Norwegian State's participation in petroleum activities is organised through the State's direct financial interest (SDFI). All purchases and sales of SDFI oil production are recorded as purchases [net of inventory variation] and revenue, respectively. Statoil sells, in its own name, but for the Norwegian State's account and risk, the State's production of natural gas. This sale, and related expenditures refunded by the State, are recorded net in Statoil's financial statements.
Employee benefits
Wages, salaries, bonuses, social security contributions, paid annual leave and sick leave are accrued in the period in which the associated services are rendered by employees of the group. The accounting policy for share-based payments and pension obligations is described below.
Share-based payments
Statoil operates an employee bonus share program. The cost of equity-settled transactions (bonus share awards) with employees is measured by reference to the estimated fair value at the date at which they are granted and is recognised as an expense over the average vesting period of 2.5 years. The awarded shares are accounted for as personnel expense, and recorded as an equity transaction (included in additional paid-in capital).
Research and development
Statoil undertakes research and development both on a funded basis for licence holders, and unfunded projects at its own risk. Statoil's share of the licence holders' funding and the total costs of the unfunded projects are development costs that are considered for capitalisation.
Development costs which are expected to generate probable future economic benefits are capitalised as intangible assets if, and only if, all of the following have been demonstrated: The technical feasibility of completing the intangible asset so that it will be available for use or sale; the intention to complete the intangible asset and use or sell it; the ability to use or sell the intangible asset; how the intangible asset will generate probable future economic benefits; the availability of adequate technical, financial and other resources to complete the development and to use or sell the intangible asset, and the ability to reliably measure the expenditure attributable to the intangible asset during its development. All other research and development expenditure is expensed as incurred.
Subsequent to initial recognition, capitalised development costs are reported at cost less accumulated amortisation and accumulated impairment losses.
Income tax
Income tax in the Consolidated statement of income for the year comprises current and deferred tax expense. Income tax is recognised in the Consolidated statement of income except to the extent that it relates to items recognised directly in Other comprehensive income.
Current tax is the expected tax payable on the taxable income for the year and any adjustment to tax payable in respect of previous years. Uncertain tax positions and potential tax exposures are analysed individually and the best estimate of the probable amount for liabilities to be paid (unpaid potential tax exposure amounts, including penalties) and virtually certain amount for assets to be received (disputed tax positions for which payment has already been made) in each case is recognised within current tax or deferred tax as appropriate. Interest income and interest expenses relating to tax issues are estimated and recorded in the period in which they are earned or incurred, and are presented as financial items in the statement of income.
Deferred tax assets and liabilities are recognised for the future tax consequences attributable to differences between the carrying amounts of existing assets and liabilities in the financial statements and their respective tax bases, subject to the initial recognition exemption. The amount of deferred tax provided is based on the expected manner of realisation or settlement of the carrying amount of assets and liabilities, using tax rates enacted or substantially enacted at the balance sheet date.
A deferred tax asset is recognised only to the extent that it is probable that future taxable profits will be available against which the asset can be utilised. In order for a deferred tax asset to be recognized based on future taxable profits, convincing evidence is required taking into account the existence of contracts, production of oil or gas in the near future based on volumes of proved reserves, observable prices in active markets, expected volatility of trading profits and similar facts and circumstances.
A special petroleum tax is levied on profits derived from petroleum production and pipeline transportation on the NCS. The special petroleum tax is currently levied at a rate of 50%. The special tax is applied to relevant income in addition to the standard 28% income tax, resulting in a 78% marginal tax rate on income subject to Norwegian petroleum tax. The basis for computing the special petroleum tax is the same as for income subject to ordinary corporate income tax, except that onshore losses are not deductible against the special petroleum tax, and a tax-free allowance, or uplift, is granted at a rate of 7.5% per year. The uplift is computed on the basis of the original capitalised cost of offshore production installations. The uplift may be deducted from taxable income for a period of four years, starting in the year in which the capital expenditures are incurred. Uplift benefit is recorded when the deduction is included in the current year tax return and impacts taxes payable. Unused up lift may be carried forward indefinitely.
Oil and gas exploration and development expenditure
Statoil uses the "successful efforts" method of accounting for oil and gas exploration costs. Expenditures to acquire mineral interests in oil and gas properties and to drill and equip exploratory wells are capitalised as exploration and evaluation expenditure within intangible assets until the well is complete and the results have been evaluated. If, following evaluation, the exploratory well has not found proved reserves, the previously capitalised costs are evaluated for derecognition or tested for impairment. Geological and geophysical costs and other exploration expenditures are expensed as incurred.
For exploration and evaluation asset acquisitions (farm-in arrangements) in which Statoil has made arrangements to fund a portion of the selling partners' (farmor's) exploration and/or future development expenditures, these expenditures are reflected in the financial statements as and when the exploration and development work progresses. Exploration and evaluation asset dispositions (farm-out arrangements) are accounted for on a historical cost basis with no gain or loss recognition.
Exchanges (swaps) of exploration and evaluation assets are accounted for at the carrying amounts of the assets given up with no gain or loss recognition.
Unproved oil and gas properties are assessed for impairment when facts and circumstances suggest that the carrying amount of the asset may exceed its recoverable amount, and at least once a year. Exploratory wells that have found reserves, but where classification of those reserves as proved depends on whether a major capital expenditure can be justified, will remain capitalised during the evaluation phase for the exploratory finds. Thereafter it will be considered a trigger for impairment evaluation of the well if no development decision is planned for the near future, and there moreover are no concrete plans for future drilling in the licence. Impairment of unsuccessful wells is reversed, as applicable, to the extent that conditions for impairment are no longer present. Impairment and reversals of impairment of exploration and evaluation assets are charged to Exploration expenses in the statement of income.
Capitalised exploration and evaluation expenditure, including expenditures to acquire mineral interests in oil and gas properties, related to wells that find proved reserves are transferred from Exploration expenditure (Intangible assets) to Assets under development (Property, plant and equipment) at the time of sanctioning of the development project.
Property, plant and equipment
Property, plant and equipment is stated at cost, less accumulated depreciation and accumulated impairment losses. The initial cost of an asset comprises its purchase price or construction cost, any costs directly attributable to bringing the asset into operation, the initial estimate of a decommissioning obligation, if any, and, for qualifying assets, borrowing costs. Property, plant and equipment also include assets acquired under the terms of profit sharing agreements (PSAs) in certain countries, and which qualify for recognition as assets of the group. State-owned entities in the respective countries however normally hold the legal title to such PSA-based Property, plant and equipment.
Exchanges of assets are measured at the fair value of the asset given up unless the exchange transaction lacks commercial substance or the fair value of neither the asset received nor the asset given up is reliably measurable.
Expenditure on major maintenance refits or repairs comprises the cost of replacement assets or parts of assets, inspection costs and overhaul costs. Where an asset or part of an asset is replaced and it is probable that future economic benefits associated with the item will flow to the group, the expenditure is capitalised. Inspection and overhaul costs associated with major maintenance programs are capitalised and amortised over the period to the next inspection. All other maintenance costs are expensed as incurred.
Capitalised exploration and evaluation expenditure, development expenditure on the construction, installation or completion of infrastructure facilities such as platforms, pipelines and the drilling of development wells, and field-dedicated transport systems for oil and gas are capitalised as producing oil and gas properties within Property, plant and equipment and are depreciated using the unit of production method based on proved developed reserves expected to be recovered from the area during the concession or contract period. Capitalised acquisition costs of proved properties are depreciated using the unit of production method based on total proved reserves. Depreciation of other assets and transport systems used by several fields is calculated on the basis of their estimated useful lives, normally using the straight-line method. Each part of an item of property, plant and equipment with a cost that is significant in relation to the total cost of the item is depreciated separately. For ex ploration and production (E&P) assets Statoil has established separate depreciation categories for platforms, pipelines, and wells as a minimum.
The estimated useful lives of property, plant and equipment are reviewed on an annual basis and changes in useful lives are accounted for prospectively. An item of property, plant and equipment is derecognised upon disposal or when no future economic benefits are expected to arise from the continued use of the asset. Any gain or loss arising on derecognition of the asset (calculated as the difference between the net disposal proceeds and the carrying amount of the item) is included in other income or operating expenses, respectively, in the period the item is derecognised.
Leases
Leases in terms of which Statoil assumes substantially all the risks and rewards of the ownership are reflected as finance leases within Property, plant and equipment and Financial liabilities, respectively. Assets under development for finance lease purposes, and for which Statoil carries substantially all the risk in the construction period, are recorded as finance leases under development within Property, plant and equipment based on the stage of completion at period end, unless another amount better reflects the realities of the arrangement. All other leases are classified as operating leases and the costs are charged to income on a straight line basis over the lease term, unless another basis is more representative of the benefits of the lease to the group.
Finance lease assets are reflected at an amount equal to the lower of fair value and the present value of the minimum lease payments at inception of the lease, and subsequently reduced by accumulated depreciation and impairment losses, if any. When an asset leased by a jointly controlled asset in which Statoil participates qualifies as a finance lease, Statoil reflects its proportionate share of the leased asset and related obligations in the balance sheet as Property, plant and equipment and Financial liabilities, respectively. Capitalised leased assets are depreciated over the shorter of the estimated useful life of the asset or the lease term using the depreciation methods described under Property, plant and equipment above, depending on the nature of the leased asset.
Statoil distinguishes between leases, which imply the right to use a specific asset for a period of time, and capacity contracts, which confer on the group the right to and the obligation to pay for certain capacity volume availability related to transport, terminalling, storage etc. Such capacity contracts that do not involve specified single assets or that do not involve substantially all the capacity of an undivided interest in a specific asset are not considered by the group to qualify as leases for accounting purposes. Capacity payments are reflected as Operating expenses in the Consolidated statements of income in the period for which the capacity contractually is available to Statoil.
Intangible assets
Intangible assets are stated at cost, less accumulated amortisation and accumulated impairment losses. Intangible assets include expenditure on the exploration for and evaluation of oil and natural gas resources, goodwill and other intangible assets. Intangible assets acquired separately from a business are carried initially at cost. An intangible asset acquired as part of a business combination is recognised separately from goodwill at its fair value if the asset is separable or arises from contractual or other legal rights and its fair value can be measured reliably.
Intangible assets relating to expenditure on the exploration for and evaluation of oil and natural gas resources are not amortised. Such an asset is subject to impairment testing when facts and circumstances suggest that the carrying amount of the asset may exceed its recoverable amount (or at least on an annual basis), and is reclassified to property, plant and equipment when the decision to develop a particular area is made. Other intangible assets are amortised on a straight-line basis over their expected useful lives. The expected useful lives of the assets are reviewed on an annual basis and changes in useful lives are accounted for prospectively.
Financial assets
Financial assets are initially recognised at fair value when Statoil becomes a party to the contractual provisions of the asset. For additional information on fair value methods, refer to the "Measurement of fair values" section below. The subsequent measurement of the financial assets depends on which category they have been classified into at inception.
At initial recognition the group classifies its financial assets into the following three main categories; financial instruments at fair value through profit or loss; loans and receivables; and available-for-sale (AFS) financial assets. The first main category, financial instruments at fair value through profit or loss, further consists of two sub-categories; financial assets held for trading and financial assets that on initial recognition are designated as fair value through profit and loss. The latter may also be referred to as the "fair value option".
Financial assets classified in the loans and receivables category are carried at amortised cost using the effective interest method. Gains and losses are recognised in the statement of income when the loans and receivables are derecognised or impaired, as well as through the amortisation process. Trade and other receivables are carried at the original invoice amount, less a provision for doubtful receivables, which is made when there is objective evidence that Statoil will be unable to recover the balances in full.
Financial assets classified as AFS mainly include non-listed equity instruments. AFS financial assets are carried on the balance sheet at fair value, with the change in fair value recognised directly in Other comprehensive income until the investment is derecognised or until the investment is determined to be impaired, at which time the cumulative change in fair value previously reported in Other comprehensive income is recognised in the statement of income.
A significant part of Statoil's commercial papers, bonds and listed equity securities are managed together as an investment portfolio of the group's captive insurance company and are held in order to comply with specific regulations for capital retention. The investment portfolio is managed and evaluated on a fair value basis in accordance with an investment strategy and is accounted for using the fair value option with changes in fair value recognised through profit or loss.
Current financial investments are initially recognized in the category financial instruments at fair value through profit or loss, either as held for trading or through the group's application of the fair value option. Following from that classification the current financial investments are carried in the balance sheet at fair value with changes in their fair values recognised in the statement of income.
Financial assets are presented as current if they contractually will expire or otherwise are expected to be recovered within 12 months after the balance sheet date, or if they represent derivative financial instruments held for the purpose of being traded. Other financial assets expected to be recovered more than 12 months after the balance sheet date and for which there is no plan of realization are classified as non-current.
Financial assets are derecognised when the contractual rights to the cash flows expire or substantially all risks and rewards related to the ownership of the financial asset are transferred to a third party.
Financial assets and financial liabilities are shown separately in the balance sheet unless Statoil has both a legal right and a demonstrable intention to net settle certain balances payable to and receivable from the same counterparty, in which case they are shown net in the balance sheet. Such offsetting of balances takes place and is reflected within Trade and other receivables and Trade and other payables, and Derivative financial instrument assets and liabilities, respectively.
Inventories
Inventories are stated at the lower of cost and net realisable value. Cost is determined by the first-in first-out method and comprises direct purchase costs, cost of production, transportation and manufacturing expenses.
Impairment
Impairment of intangible assets and property, plant and equipment
Statoil assesses assets or groups of assets for impairment whenever events or changes in circumstances indicate that the carrying value of an asset may not be recoverable. Individual assets are grouped based on levels with separately identifiable and largely independent cash inflows. Normally, separate cash-generating units are individual oil and gas fields or plants. For capitalised exploration expenditure, the cash-generating units are individual wells.
In assessing whether a write-down of the carrying amount of a potentially impaired asset is required, the asset's carrying amount is compared to the recoverable amount. Frequently the recoverable amount of an asset proves to be Statoil's estimated value in use, which is determined using a discounted cash flow model. The estimated future cash flows are adjusted for risks specific to the asset and discounted using a real post-tax discount rate based on Statoil's post-tax weighted average cost of capital (WACC). Statoil considers post-tax calculations sufficiently objective and consistently applicable across the various tax regimes, while still for all significant purposes leading to the same conclusion that application of pre tax rates in accordance with IAS 36 Impairment of assets would have yielded.
If assets are determined to be impaired, the carrying amounts of those assets are written down to the recoverable amount which is the higher of fair value less costs to sell and value in use.
Impairments are reversed as applicable to the extent that conditions for impairment are no longer present.
Impairment of goodwill
Goodwill is reviewed for impairment annually or more frequently if events or changes in circumstances indicate that the carrying value may be impaired. At the acquisition date, any goodwill acquired is allocated to each of the cash-generating units expected to benefit from the business combination's synergies.
Impairment is determined by assessing the recoverable amount of the cash-generating unit to which the goodwill relates. Where the recoverable amount of the cash-generating unit is less than the carrying amount, an impairment loss is recognised, firstly on goodwill and then pro-rata on the other assets of that unit. Impairments of goodwill once recorded are not reversed in future periods.
Impairment of financial assets
Statoil assesses at each balance sheet date whether a financial asset or group of financial assets is impaired, except for the financial assets classified in the fair value through profit and loss category.
If there is objective evidence that an impairment loss has been incurred for assets carried at amortised cost, the carrying amount of the asset is reduced, with the amount of the loss recognised in the statement of income. Any subsequent reversal of an impairment loss correspondingly also is recognised in the statement of income.
If an AFS financial asset is impaired, i.e. a decline in the fair value of an equity instrument has been assessed to be significant or prolonged, the difference between cost and fair value is transferred from Other comprehensive income to the Statement of income. When impairments of equity instruments classified as AFS are reversed this is recognised directly in Other comprehensive income.
Financial liabilities
Financial liabilities are initially recognised at fair value when Statoil becomes a party to the contractual provisions of the liability. For additional information on fair value methods, refer to the "Measurement of fair values" section below. The subsequent measurement of the financial liabilities depends on which category they have been classified into. The categories applicable for Statoil is either financial liabilities at fair value through profit or loss or financial liabilities measured at amortised cost using the effective interest method. The latter applies to Statoil's non-current bank loans and bonds.
Trade and other payables are carried at payment or settlement amounts.
Financial liabilities are presented as current if the liability is due to be settled within 12 months after the balance sheet date, or if they are derivative financial instruments held for the purpose of being traded. Other financial liabilities which contractually will be settled more than 12 months after the balance sheet date are classified as non-current.
Financial liabilities are derecognised when the contractual obligation expires, is discharged or cancelled. Gains and losses arising on the repurchase, settlement or cancellation of liabilities are recognised either in Interest income and other financial items or in Interest and other finance expenses.
Derivative financial instruments
Statoil uses derivative financial instruments to manage certain exposures to fluctuations in foreign currency exchange rates, interest rates and commodity prices. Such derivative financial instruments are initially recognised at fair value on the date on which a derivative contract is entered into and are subsequently re-measured at fair value through profit and loss. Derivatives are carried as assets when the fair value is positive and as liabilities when the fair value is negative. Derivative assets or liabilities expected to be recovered, or with the legal right to be settled more than 12 months after the balance sheet date are classified as non-current, with the exception of derivative financial instruments held for the purpose of being traded.
Contracts to buy or sell a non-financial item that can be settled net in cash or another financial instrument, or by exchanging financial instruments, as if the contracts were financial instruments, are accounted for as financial instruments. However contracts that are entered into and continued to be held for the purpose of the receipt or delivery of a non-financial item in accordance with Statoil's expected purchase, sale or usage requirements, also referred to as "own use", are not accounted for as financial instruments. This is applicable to a significant number of contracts for the purchase or sale of crude oil and natural gas, which are recognised upon delivery.
Derivatives embedded in other financial instruments or other host contracts are treated as separate derivatives when their risks and characteristics are not closely related to those of host contracts and the host contracts are not carried at fair value. Contracts are assessed for embedded derivatives when Statoil becomes a party to them, including at the date of a business combination. Such embedded derivatives are measured at fair value at each period end, and the changes in fair value are recognised in profit or loss for the period.
Pension liabilities
Statoil has pension plans for employees that either provide a defined pension benefit upon retirement, or a pension dependent on defined contributions. For defined benefit schemes, the benefit to be received by employees generally depends on many factors including length of service, retirement date and future salary levels.
Statoil's net obligation in respect of defined benefit pension plans is calculated separately for each plan by estimating the amount of future benefit that employees have earned in return for their services in the current and prior periods. That benefit is discounted to determine its present value, and the fair value of any plan assets is deducted. The discount rate is the yield at the balance sheet date reflecting the maturity dates approximating the terms of the group's obligations. The calculation is performed by an external actuary. Current service cost is an element of net periodic pension cost and recognised in the statement of income.
The interest element of the defined benefit cost represents the change in present value of scheme obligations resulting from the passage of time, and is determined by applying the discount rate to the opening present value of the benefit obligation, taking into account material changes in the obligation during the year. The expected return on plan assets is based on an assessment made at the beginning of the year of long-term market returns on scheme assets, adjusted for the effect on the fair value of plan assets of contributions received and benefits paid during the year. The difference between the expected return on plan assets and the interest cost is recognised in the statement of income as a part of the net periodic pension cost.
Net periodic pension cost is accumulated in cost pools and allocated to business areas and Statoil operated jointly controlled assets (licences) on an hours incurred basis and recognised in the statement of income based on the function of the cost.
Past service cost is recognised immediately when the benefits become vested or on a straight-line basis until the benefits become vested. When a settlement (eliminating all obligations for benefits already accrued) or a curtailment (reducing future obligations as a result of a material reduction in the scheme membership or a reduction in future entitlement) occurs, the obligation and related plan assets are re-measured using current actuarial assumptions and the gain or loss is recognised in the statement of income during the period in which the settlement or curtailment occurs.
Actuarial gains and losses are recognised in full in the statement of comprehensive income in the period in which they occur. Following the parent company Statoil ASA's change in functional currency as of 1 January 2009, the significant part of the group's pension obligations will be payable in a foreign currency (ie. NOK). Actuarial gains and losses related to the parent company's pension obligation as a consequence include the impact of exchange rate fluctuations.
Contributions to defined contribution schemes are recognised in the statement of income in the period in which the contribution amounts are earned by the employees.
Provisions and contingent assets and liabilities
Provisions are recognised when Statoil has a present obligation (legal or constructive) as a result of a past event, it is probable that an outflow of resources embodying economic benefits will be required to settle the obligation and a reliable estimate can be made of the amount of the obligation. If the effect of the time value of money is material, provisions are determined by discounting the expected future cash flows at a pre-tax rate that reflects current market assessments of the time value of money and, where appropriate, the risks specific to the liability. Where discounting is used, the increase in the provision due to the passage of time is recognised as Other finance expenses.
Contingent liabilities arising from past events and for which it is not probable that an outflow of resources will be required to settle the obligation, if any, are not recognised but disclosed with indication of uncertainties relating to amounts and timing involved, unless the possibility of an outflow in settlement is remote.
Possible assets arising from past events that will only be confirmed by future uncertain events and are not wholly within Statoil's control (contingent assets), are not recognised, but are disclosed when an inflow of economic benefits is probable.
Onerous contracts
Statoil recognises as provisions the obligation under contracts defined as onerous. Contracts are deemed to be onerous if the unavoidable cost of meeting the obligations under the contract exceeds the economic benefits expected to be received in relation to the contract. A contract which forms an integral part of the operations of a cash generating unit whose assets are dedicated to that contract, and for which the economic benefits cannot be reliably separated from those of the cash generating unit, is included in impairment considerations for the applicable cash generating unit.
Asset retirement obligations (ARO)
Liabilities for decommissioning costs are recognised when Statoil has an obligation to dismantle and remove a facility or an item of property, plant and equipment and to restore the site on which it is located, and when a reliable estimate of that liability can be made. Cost is estimated upon current regulation and technology, considering relevant risks and uncertainties, to arrive at best estimates. Normally an obligation arises for a new facility, such as an oil and natural gas production or transportation facility, upon construction or installation. An obligation for decommissioning may also crystallise during the period of operation of a facility through a change in legislation or through a decision to terminate operations. At the time of the obligating event, a decommissioning liability is recognised and classified as Asset retirement obligations, other provisions and other liabilities. The amount recognised is the present value of the estimated future expenditure determined in accordance w ith local conditions and requirements. Refining and processing plants that are not limited by licence periods are deemed to have indefinite lives and in consequence no asset retirement obligation has been recorded. For retail outlets, decommissioning provisions are estimated on a portfolio basis.
When a liability for decommissioning cost is recognised, a corresponding amount is recorded to increase the related property, plant and equipment. This is subsequently depreciated as part of the costs of the facility or item of property, plant and equipment.
Any change in the present value of the estimated expenditure is reflected as an adjustment to the provision and the corresponding property, plant and equipment.
Measurement of fair values
Observable prices quoted in an active market represent the best evidence of fair value, and are used by Statoil in determining the fair values of assets and liabilities to the extent possible.
A financial instrument is regarded as quoted in an active market if the prices quoted are readily and regularly available, normally through an exchange, and the prices quoted by the exchange represent actual and regularly occurring market transactions that in all significant aspects are identical to the instrument being valued. Statoil considers both the actual volume and the timing of recent market transactions in determining whether prices are quoted in a sufficiently active market. Financial instruments quoted in active markets will typically include commodity based futures, exchange traded option contracts, commercial papers, bonds and equity instruments with quoted market prices obtained from the relevant exchanges or clearing houses. The fair values of quoted financial assets, financial liabilities and derivative instruments are determined by reference to bid and ask prices, at the close of business on the balance sheet date.
Where there is no active market, fair value is determined using valuation techniques. These include using recent arm's-length market transactions; reference to other instruments that are substantially the same; discounted cash flow analysis; and pricing models. In the valuation techniques the group also takes into consideration counterparty and own credit risk. This is either reflected in the discount rate used, or through direct adjustments to the calculated cash flows. Consequently, where Statoil records elements of long-term physical delivery commodity contracts at fair value, such fair value estimates to the extent possible are based on quoted forward prices in the market and underlying indexes in the contracts, as well as assumptions of forward prices and margins where market prices are not available. Similarly, the fair values of interest and currency swaps are estimated based on relevant quotations from active markets, quotes of comparable instruments, and other appropriate valuation t echniques.
Critical accounting judgements and key sources of estimation uncertainty
Critical judgements in applying accounting policies
The following are the critical judgements, apart from those involving estimations (see below), that Statoil has made in the process of applying the accounting policies and that have the most significant effect on the amounts recognised in the financial statements:
Revenue recognition - gross versus net presentation of traded SDFI volumes of oil and gas production
As described under Transactions with the Norwegian State above, Statoil markets and sells the Norwegian State's share of oil and gas production from the NCS. Statoil includes the costs of purchase and proceeds from the sale of the SDFI oil production in Purchases [net of inventory variation] and Revenues, respectively. In making the judgement Statoil considered the detailed criteria for the recognition of revenue from the sale of goods, and in particular assessed whether the risk and reward of the ownership of the goods had been transferred from the SDFI to Statoil.
As also described above, Statoil sells, in its own name, but for the Norwegian State's account and risk, the State's production of natural gas. This sale, and related expenditures refunded by the State, are recorded net in Statoil's financial statements. In making the judgment Statoil considered the same criteria as for the oil production and concluded that the risk and reward of the ownership of the gas had not been transferred from the SDFI to Statoil.
Method of accounting applied for the Hydro Petroleum merger
The merger between former Statoil ASA and Hydro Petroleum in 2007 was accounted for using the carrying amounts of the assets and liabilities. When making this judgement Statoil considered firstly whether the former Statoil ASA and Hydro Petroleum were under the common control of the Norwegian State, and secondly, given the conclusion that both entities were under the control of the Norwegian State, assessed what method of accounting would provide the most meaningful portrayal of the merger for accounting purposes. Statoil concluded that such a reorganisation would be best presented using the carrying amounts of assets and liabilities, and it is presented in the financial statements for all periods presented as if the companies had always been combined.
Key sources of estimation uncertainty
The preparation of consolidated financial statements requires that management make estimates and assumptions that affect reported amounts of assets and liabilities, income and expenses. The estimates and associated assumptions are based on historical experience and various other factors that are believed to be reasonable under the circumstances, the result of which form the basis of making the judgements about carrying values of assets and liabilities that are not readily apparent from other sources. Actual results may differ from these estimates. The estimates and underlying assumptions are reviewed on an ongoing basis considering the current and expected future market conditions.
Statoil is exposed to a number of underlying economic factors, such as liquids prices, natural gas prices, refining margins, foreign exchange rates, interest rates as well as financial instruments with fair values derived from changes in these factors, which affect the overall results. In addition, Statoil's results are influenced by the level of production, which in the short term may be influenced by for instance maintenance programmes. In the long term, the results are impacted by the success of exploration and field development activities.
The matters described below are considered to be the most important in understanding the key sources of estimation uncertainty that are involved in preparing these financial statements and the uncertainties that could most significantly impact the amounts reported on the results of operations, financial position and cash flows.
Proved oil and gas reserves.
Proved oil and gas reserves have been estimated by internal experts on the basis of industry standards and governed by criteria established by regulations of the SEC. The SEC revised Rule 4-10 of Regulation S-X and changed a number of oil and gas reserve estimation requirements effective for the year ending 31 December 2009. This required, on a prospective basis, the use of a price based on a 12-month average for reserve estimation instead of a single end-of-year price and allows for non-traditional sources such as bitumen extracted from oil sands to be included as reserves. The Financial Accounting Standards Board (FASB) also aligned the requirements for supplemental oil and gas disclosures with the changes made by the SEC. Statoil estimates that implementation of the revisions had an immaterial impact on proved reserves as of 31 December 2009 and will have an immaterial impact on unit of production depreciation starting in 2010. However, the comparability of disclosures between years is impact ed by the new requirements.
Reserves estimates are based on subjective judgments involving geological and engineering assessments of in-place hydrocarbons volumes, the production, historical extraction recovery and processing yield factors and installed plant operating capacity. For future development projects, proved reserves estimates are included only where there is a significant commitment to project funding and execution and when relevant governmental and regulatory approvals have been secured or are reasonably certain to be secured. The reliability of these estimates at any point in time depends on both the quality and quantity of the technical and economic data and the efficiency of extracting and processing the hydrocarbons. An independent third party has evaluated Statoil's proved reserves estimates, and the results of such evaluation do not differ materially from management estimates. Proved oil and gas reserves are those quantities of oil and gas, which, by analysis of geoscience and engineering data, can be estimated with reasonable certainty to be economically producible from a given date forward, from known reservoirs, and under existing economic conditions, operating methods, and government regulations. Unless evidence indicates that renewal is reasonably certain, estimates of economically producible reserves only reflect the period before the contracts providing the right to operate expire. The project to extract the hydrocarbons must have commenced or the operator must be reasonably certain that it will commence within a reasonable time. Future changes in proved oil and gas reserves, for instance as a result of changes in prices, could have a material impact on unit of production rates used for depreciation and amortisation.
Expected oil and gas reserves.
Expected oil and gas reserves have been estimated by internal experts on the basis of industry standards and are used for impairment testing purposes and for calculation of asset retirement obligations. Reserves estimates are based on subjective judgments involving geological and engineering assessments of in-place hydrocarbons volumes, the production, historical extraction recovery and processing yield factors, installed plant operating capacity and operating approval limits. The reliability of these estimates at any point in time depends on both the quality and quantity of the technical and economic data and the efficiency of extracting and processing the hydrocarbons. Future changes in expected oil and gas reserves, for instance as a result of changes in prices, could have a material impact on asset retirement obligations, as well as for the impairment testing of upstream assets, which could have a material effect on operating income as a result of changed impairment charges.
Exploration and leasehold acquisition costs.
Statoil capitalises the costs of drilling exploratory wells pending determination of whether the wells have found proved oil and gas reserves. Statoil also capitalises leasehold acquisition costs and signature bonuses paid to obtain access to undeveloped oil and gas acreage. Judgments as to whether these expenditures should remain capitalised or written down due to impairment losses in the period may materially affect the operating income for the period.
Impairment/reversal of impairment.
Statoil has significant investments in property, plant and equipment and intangible assets. Changes in the circumstances or expectations of future performance of an individual asset may be an indicator that the asset is impaired requiring the book value to be written down to its recoverable amount. Impairments are reversed if conditions for impairment are no longer present. Evaluating whether an asset is impaired or if an impairment should be reversed requires a high degree of judgement and may to a large extent depend upon the selection of key assumptions about the future.
Unproved oil and gas properties are assessed for impairment when facts and circumstances suggest that the carrying amount of the asset may exceed its recoverable amount and at least annually. If, following evaluation, an exploratory well has not found proved reserves, the previously capitalised costs are tested for impairment. Subsequent to the initial evaluation phase for a well it will be considered a trigger for impairment testing of a well if no development decision is planned for the near future, and there moreover is no concrete plan for future drilling in the licence. Impairment of unsuccessful wells is reversed, as applicable, to the extent that conditions for impairment are no longer present.
Estimating recoverable amounts involves complexity in estimating relevant future cash flows, based on assumptions about the future, and discounted to their present value. Impairment testing requires long-term assumptions to be made concerning a number of often volatile economic factors such as future market prices, refinery margins, currency exchange rates and future output, discount rates and political and country risk among others, in order to establish relevant future cash flows. Impairment testing frequently also requires judgement to be applied as regards applicable probabilities and probability distributions as well as levels of sensitivity inherent in the establishment of recoverable amount estimates, and consequently in ensuring that the recoverable amount estimates' robustness where relevant is factored sufficiently into the impairment evaluations and reflected in the impairment or reversal of impairment recorded in the financial statements. Long-term assumptions for major economic f actors are made at group level, and there is a high degree of reasoned judgement involved in establishing these assumptions, in determining other relevant factors such as forward price curves, in estimating production outputs, and in determining the ultimate termination value of an asset.
Employee retirement plans.
When estimating the present value of defined pension benefit obligations that represent a gross long-term liability in the balance sheet, and indirectly, the period's net pension expense in the statement of income, management make a number of critical assumptions affecting these estimates. Most notably, assumptions made about the discount rate to be applied to future benefit payments, the expected return on plan assets and the annual rate of compensation increase have a direct and potentially material impact on the amounts presented. Significant changes in these assumptions between periods can have a material effect on the financial statements.
Asset retirement obligations.
Statoil has significant obligations to decommission and remove offshore installations at the end of the production period. Legal obligations associated with the retirement of non-current assets are recognised at their fair value at the time the obligations are incurred. Upon initial recognition of a liability, that cost is capitalised as part of the related non-current asset and allocated to expense over the useful life of the asset.
It is difficult to estimate the costs of these decommissioning and removal activities, which are based on current regulations and technology, considering relevant risks and uncertainties. Most of the removal activities are many years into the future and the removal technology and costs are constantly changing. The estimates include assumptions of both the time required and the day rates for rigs, marine operations and heavy lift vessels that can vary considerably depending on the assumed removal complexity. As a result, the initial recognition of the liability and the capitalised cost associated with decommissioning and removal obligations, and the subsequent adjustment of these balance sheet items, involve the application of significant judgement.
Derivative financial instruments.
When not directly observable in active markets, the fair value of derivative contracts must be computed internally based on internal assumptions as well as directly observable market information, including forward and yield curves for commodities, currencies and interest. Changes in internal assumptions and forward curves could materially impact the internally computed fair value of derivative contracts, particularly long-term contracts, resulting in corresponding impact on income or loss in the statement of income.
Income tax.
Statoil annually incurs significant amounts of income taxes payable to various jurisdictions around the world, and also recognises significant changes to deferred tax assets and deferred tax liabilities, all of which are based on management's interpretations of applicable laws, regulations and relevant court decisions. The quality of these estimates is highly dependent upon management's ability to properly apply at times very complex sets of rules, to recognise changes in applicable rules and, in the case of deferred tax assets, management's ability to project future earnings from activities that may apply loss carry forward positions against future income taxes.
8.1.3 Business combinations
In 2008 Statoil increased the interest in the Peregrino heavy-oil field offshore Brazil from 50% to 100%, after closing the deal to acquire Anadarko's 50% stake on 10 December 2008. Statoil paid a cash consideration of USD 1.8 billion, including expenditures incurred in the period 1 January to 10 December 2008, for 100% of the shares in Anadarko's wholly owned company Anadarko Petroleo Ltda and Anadarko's 50% share of the company South Atlantic Holding BV. Conditional on future oil prices above pre-defined threshold levels, Statoil will pay an additional maximum pre-tax amount of USD 0.3 billion to be earned by 2020, related to the Peregrino field. The value of the contingent consideration element at the time of closing the deal, estimated to USD 0.2 billion, has been recognised as part of the acquisition price. The Peregrino acquisition has been assessed to constitute a business combination under IFRS 3 and changes in the fair value of the contingent consideration element will be recorded as an adjustment to the book value of the assets acquired. The transaction was recorded in the segment International Exploration and Production.
8.1.4 Asset acquisitions and disposals
In November 2008 Statoil acquired a 32.5% interest in the Marcellus shale gas acreage from Chesapeake Appalachia, L.L.C. The Marcellus shale gas acreage covers 1.8 million net acres (7,300 square kilometres) in the Appalachia region of the Northeastern USA. Statoil paid a cash consideration of USD 1.3 billion and are paying an additional USD 2.1 billion in the form of funding of 75% of Chesapeake's expenditures for drilling and completion of wells during the period 2009 to 2012. The Marcellus assets are in the exploration and evaluation phase and the funding of Chesapeake's expenditures will be recorded in the financial statements at the time the expenditures for the wells are incurred. The transaction was recorded in the segment International Exploration and Production.
In February 2008 Statoil's participation in the Petrocedeño project (former Sincor project) was reduced from 15% to 9.677% as a result of the transformation of the Sincor project into the incorporated joint venture Petrocedeño, S.A., which has 60% participation by the Venezuelan state through its wholly owned company Petroleos de Venezuela, S.A. The Petrocedeño project involves the exploitation of extra heavy crude oil from the reservoirs in the Orinoco Belt offshore Venezuela. An accounting gain from the reduction of the participation interest was recognised in the Consolidated statements of income in 2008 by NOK 1.1 billion net of tax. The transaction was recorded in the segment International Exploration and Production. The remaining interest in Petrocedeño is reflected in the Consolidated financial statements under the equity method, while the previous interest in the Sincor project was accounted for as a jointly controlled asset consolidated on a line-by-line b asis.
In the second quarter of 2007 Statoil acquired all shares of North American Oil Sands Corporation (NAOSC) for a consideration of CAD 2.2 billion. The principle asset in the acquisition was the 257,200 acres (1,110 square kilometres) of oil sands leases that NAOSC operates, located in the Athabasca region of Alberta, northeast of Edmonton. The transaction was recorded in the segment International Exploration and Production.
In the first quarter of 2007 Statoil acquired two of Anadarko Petroleum Corporation's US Gulf of Mexico discoveries and one prospect at a cost of USD 0.9 billion. The assets are located in the Greater Tahiti and Walker Ridge areas. As part of the transaction Statoil acquired an additional 15% working interest in the Big Foot discovery and has now a 27.5% working interest. The transaction was recorded in the segment International Exploration and Production.
8.1.5 Segments
Operating segments
Statoil manages its operations in four operating segments; Exploration and Production Norway, International Exploration and Production, Natural Gas and Manufacturing and Marketing. The Exploration and Production Norway and International Exploration and Production segments explore for, develop and produce crude oil and natural gas, and extract natural gas liquids. The Natural Gas segment transports and markets natural gas and natural gas products. Manufacturing and Marketing is responsible for petroleum refining operations and the marketing of crude oil and refined petroleum products except for natural gas and natural gas products.
The "Other" section consists of the activities of Corporate services, Corporate center, Group Finance, Technology & New energy and Projects. The "Eliminations" section encompasses elimination of inter-segment sales and related unrealised profits, mainly from the sale of crude oil and products. Inter-segment revenues are based upon estimated market prices.
Operating segments align with internal management reporting to the company's chief operating decision maker, defined as the Corporate Excecutive Committee (CEC). The operating segments are determined based on differences in the nature of their operations, products, services and geographical location of the activity. The measure of segment profit is Net operating income. Financial items and tax expense are not allocated to the operating segments. The measurement basis for the net operating income for each operating segment follows the accounting principles used in the financial statements as described in note 2 Significant accounting policies.
Segment data for the years ended 31 December, 2009, 2008 and 2007 is presented below:
(in NOK million) | Exploration and Production Norway | International Exploration and Production | Natural Gas | Manufacturing and Marketing | Other | Eliminations | Total |
|
|
|
|
|
|
|
|
|
|
|
|
|
|
|
|
|
|
|
|
|
|
|
|
Year ended 31 December 2009 |
|
|
|
|
|
|
|
Revenues third party and Other income | 4,153 | 12,301 | 96,973 | 348,941 | 1,287 | 0 | 463,655 |
Revenues inter-segment | 154,431 | 28,459 | 1,241 | 2,014 | 2,295 | (188,440) | 0 |
Net income from associated companies | 79 | 1,075 | 399 | 280 | (55) | 0 | 1,778 |
|
|
|
|
|
|
|
|
Total revenues and other income | 158,663 | 41,835 | 98,613 | 351,235 | 3,527 | (188,440) | 465,433 |
|
|
|
|
|
|
|
|
Net operating income | 104,318 | 2,599 | 18,488 | (541) | (1,146) | (2,078) | 121,640 |
|
|
|
|
|
|
|
|
Significant non-cash items recognised in segment profit or loss |
|
|
|
|
|
|
|
- Depreciation and amortisation | 25,653 | 16,231 | 1,778 | 2,390 | 687 | 0 | 46,739 |
- Impairment losses | 0 | 873 | 1,001 | 5,369 | 74 | 0 | 7,317 |
- Inventory valuation | 0 | 0 | (24) | (5,171) | 0 | 1,377 | (3,818) |
- Commodity based derivatives | (1,781) | 0 | (2,814) | 1,072 | (122) | 0 | (3,645) |
- Exploration expenditure written off | 1,177 | 5,821 | 0 | 0 | 0 | 0 | 6,998 |
|
|
|
|
|
|
|
|
Investments in associated companies | 214 | 4,962 | 2,829 | 917 | 1,134 | 0 | 10,056 |
Other segment non-current assets | 175,998 | 152,678 | 34,797 | 28,587 | 3,028 | 0 | 395,088 |
Non-current assets, not allocated to segments* |
|
|
|
|
|
| 41,312 |
|
|
|
|
|
|
|
|
Total non-current assets |
|
|
|
|
|
| 446,456 |
|
|
|
|
|
|
|
|
Additions to PP&E and intangible assets** | 34,875 | 39,354 | 2,528 | 7,618 | 1,340 | 0 | 85,715 |
|
|
|
|
|
|
|
|
* Deferred tax assets, post employment benefit assets and non-current financial instruments are not allocated to segments. |
|
|
| ||||
** Excluding movements due to changes in abandonment and removal obligations. |
|
|
|
|
| ||
(in NOK million) | Exploration and Production Norway | International Exploration and Production | Natural Gas | Manufacturing and Marketing | Other | Eliminations | Total |
|
|
|
|
|
|
|
|
Year ended 31 December 2008 |
|
|
|
|
|
|
|
Revenues third party and Other income | 2,879 | 10,289 | 108,704 | 530,165 | 2,700 | 0 | 654,737 |
Revenues inter-segment | 216,882 | 35,031 | 1,882 | 966 | 2,212 | (256,973) | 0 |
Net income from associated companies | 82 | 809 | 225 | 216 | (49) | 0 | 1,283 |
Total revenues and other income | 219,843 | 46,129 | 110,811 | 531,347 | 4,863 | (256,973) | 656,020 |
Net operating income | 166,907 | 12,784 | 12,541 | 4,548 | (731) | 2,783 | 198,832 |
|
|
|
|
|
|
|
|
Significant non-cash items recognised in segment profit or loss: |
|
|
|
|
|
|
|
- Depreciation and amortisation | 24,043 | 11,619 | 2,310 | 2,117 | 596 | 0 | 40,685 |
- Impairment losses | 0 | 2,063 | 0 | 0 | 248 | 0 | 2,311 |
- Inventory valuation | 0 | 0 | 24 | 5,203 | 0 | (1,377) | 3,850 |
- Commodity based derivatives | (109) | 0 | (1,341) | (1,306) | (37) | 0 | (2,793) |
- Exploration expenditure written off | 749 | 2,957 | 0 | 0 | 0 | 0 | 3,706 |
|
|
|
|
|
|
|
|
Investments in associated companies | 149 | 6,114 | 4,898 | 1,063 | 416 | 0 | 12,640 |
Other segment non-current assets | 165,493 | 160,580 | 35,735 | 34,420 | 3,854 | 0 | 400,082 |
Non-current assets, not allocated to segments* |
|
|
|
|
|
| 20,889 |
|
|
|
|
|
|
|
|
Total non-current assets |
|
|
|
|
|
| 433,611 |
|
|
|
|
|
|
|
|
Additions to PP&E and intangible assets** | 34,941 | 48,694 | 2,041 | 8,488 | 1,256 | 0 | 95,420 |
|
|
|
|
|
|
|
|
* Deferred tax assets, post employment benefit assets and non-current financial instruments are not allocated to segments. |
|
| |||||
** Excluding movements due to changes in abandonment and removal obligations. |
|
|
|
|
| ||
(in NOK million) | Exploration and Production Norway | International Exploration and Production | Natural Gas | Manufacturing and Marketing | Other | Eliminations | Total |
|
|
|
|
|
|
|
|
Year ended 31 December 2007 |
|
|
|
|
|
|
|
Revenues third party and Other income | 5,925 | 13,483 | 72,447 | 427,342 | 2,851 | 140 | 522,188 |
Revenues inter-segment | 173,259 | 27,746 | 927 | 468 | 1,600 | (204,000) | 0 |
Net income from associated companies | 60 | 372 | 60 | 233 | (116) | 0 | 609 |
|
|
|
|
|
|
|
|
Total revenues and other income | 179,244 | 41,601 | 73,434 | 428,043 | 4,335 | (203,860) | 522,797 |
|
|
|
|
|
|
|
|
Net operating income | 123,150 | 12,161 | 1,562 | 3,776 | (2,260) | (1,185) | 137,204 |
|
|
|
|
|
|
|
|
Significant non-cash items recognised in segment profit or loss: |
|
|
|
|
|
|
|
- Depreciation and amortisation | 23,030 | 9,857 | 1,595 | 1,896 | 564 | 0 | 36,942 |
- Impairment losses | 0 | 1,246 | 250 | 937 | (3) | 0 | 2,430 |
- Pension costs* | 5,300 | 738 | 700 | 700 | 1,300 | 0 | 8,738 |
- Commodity based derivatives | (2,920) | 577 | 3,318 | 1,031 | (88) | 0 | 1,918 |
- Exploration expenditure written off | 50 | 1,610 | 0 | 0 | 0 | 0 | 1,660 |
|
|
|
|
|
|
|
|
Investments in associated companies | 125 | 2,253 | 4,516 | 1,066 | 461 | 0 | 8,421 |
Other segment non-current assets | 153,115 | 107,261 | 35,552 | 27,627 | 2,933 | 0 | 326,488 |
Non-current assets, not allocated to segments** |
|
|
|
|
|
| 18,519 |
|
|
|
|
|
|
|
|
Total non-current assets |
|
|
|
|
|
| 353,428 |
|
|
|
|
|
|
|
|
Additions to PP&E and intangible assets*** | 31,100 | 36,200 | 2,100 | 4,800 | 800 | 0 | 75,000 |
|
|
|
|
|
|
|
|
* Pension cost includes early retirement cost (exclusive of curtailment effects) and past service cost. |
|
|
|
| |||
** Deferred tax assets, post employment benefit assets and non-current financial instruments are not allocated to segments. |
|
|
| ||||
*** Excluding movements due to changes in abandonment and removal obligations. |
|
|
|
|
| ||
| |||||||
For the year ending 31 December 2009, the International Exploration and Production segment recognised net impairment losses of NOK 6.3 billion, mainly related to assets in the Gulf of Mexico. The net impairment losses consist of impairment losses of NOK 8.0 billion and reversals of previous periods impairment losses of NOK 1.7 billion. The net impairment losses have been presented as Exploration expenses of NOK 5.4 billion and Depreciation, amortisation and net impairment losses of NOK 0.9 billion on the basis of their nature as intangible assets (exploration assets) and property, plant and equipment (development and producing assets), respectively.
In 2009, Statoil also recognised impairment losses of NOK 5.4 billion related to refinery assets in the Manufacturing and Marketing segment. The basis for the impairment losses are value in use estimates triggered by decreasing expectations on refining margins in NOK. The impairment losses have been presented as Depreciation, amortisation and net impairment losses. In addition, Statoil has recognised an impairment loss of NOK 1.4 billion in 2009 related to an investment in a refinery company which was classified as an available for sale financial asset. This impairment loss was not allocated to a specific segment but was presented as a financial item.
In 2008, Statoil recognised net impairment losses of NOK 4.5 billion in the International Exploration and Production segment, of which the main part relates to assets in the Gulf of Mexico. The impairment charges have been presented as Exploration expenses of NOK 2.4 billion and Depreciation, amortisation and impairment losses of NOK 2.1 billion.
In 2007, the International Exploration and Production segment recognised net impairment losses of NOK 1.2 billion, of which the main part related to exploration and production assets (Intangible assets and Property, plant and equipment) in the Gulf of Mexico while the Manufacturing and Marketing segment recognised an impairment loss of NOK 0.9 billion related to property plant and equipment and intangible assets in the Energy and Retail business in Sweden.
In assessing the need for impairment of the carrying amount of a potentially impaired asset, the asset's carrying amount is compared to the recoverable amount. The recoverable amount is the higher of fair value less costs to sell and estimated value in use. When preparing a value in use calculation the estimated future cash flows are adjusted for risks specific to the asset and discounted using a real post-tax discount rate adjusted for asset specific differences, such as tax rates and horizon of cash flows. The discount rate is 6.5% real after tax in a 28% tax regime and is derived from Statoil's weighted average cost of capital.
With effect from 1 January 2008, the internal price for natural gas sold between the segments Exploration and Production Norway and Natural Gas was updated to better reflect changes in the markets for competing energies.
The 2007 Financial statements included an expense of NOK 10.7 billion before tax related to restructuring expenses and other expenses related to the merger between Statoil and Hydro's oil and gas division in 2007. The major part of these expenses was related to pensions and early retirement packages offered to all employees above the age of 58 years. The total expense impacted the net operating income of all segments, and most significantly the segment Exploration and Production Norway. Based on a settlement and estimate changes in 2008, Statoil recognised NOK 1.7 billion before tax as a cost reduction in 2008. The main part of this amount relates to the segment Exploration and Production Norway.
Geographical areas
Statoil is present in 42 countries, and manages its business segments on a worldwide basis. In presenting information on the basis of geographical areas, revenues from external customers are attributed to the country of the legal entity executing the external sale.
Assets are based on the geographical location of the assets.
Geographical data for the year ended 31 December 2009, 2008 and 2007 is presented below:
(in NOK million) | Crude oil | Gas | NGL | Refined products | Other | Total sale |
|
|
|
|
|
|
|
Year ended 31 December 2009 |
|
|
|
|
|
|
Norway | 182,353 | 80,018 | 34,655 | 45,927 | 18,137 | 361,090 |
USA | 19,836 | 5,555 | 117 | 14,017 | 672 | 40,197 |
Sweden | 0 | 0 | 0 | 16,556 | 3,795 | 20,351 |
Denmark | 0 | 0 | 0 | 15,105 | 1,957 | 17,062 |
Other | 9,978 | 2,959 | 154 | 10,762 | 1,102 | 24,955 |
|
|
|
|
|
|
|
Total revenues (excluding net income from associated companies) | 212,167 | 88,532 | 34,926 | 102,367 | 25,663 | 463,655 |
(in NOK million) | Crude oil | Gas | NGL | Refined products | Other | Total sale |
|
|
|
|
|
|
|
Year ended 31 december 2008 |
|
|
|
|
|
|
Norway | 260,171 | 79,813 | 44,536 | 79,659 | 31,105 | 495,284 |
United States | 24,712 | 8,795 | 1,660 | 20,182 | 2,545 | 57,894 |
Sweden | 0 | 0 | 0 | 23,428 | 2,618 | 26,046 |
Denmark | 0 | 0 | 0 | 16,858 | 2,558 | 19,416 |
Singapore | 11,203 | 1,906 | 0 | 0 | 0 | 13,109 |
UK | 1,982 | 10,878 | 2 | 0 | 2,800 | 15,662 |
Other | 7,305 | 930 | 198 | 16,885 | 2,008 | 27,326 |
|
|
|
|
|
|
|
Total revenues (excluding net income from associated companies) | 305,373 | 102,322 | 46,396 | 157,012 | 43,634 | 654,737 |
(in NOK million) | Crude oil | Gas | NGL | Refined products | Other | Total sale |
|
|
|
|
|
|
|
Year ended 31 December 2007 |
|
|
|
|
|
|
Norway | 209,764 | 62,911 | 47,119 | 52,537 | 14,342 | 386,673 |
United States | 24,142 | 5,269 | 1,766 | 22,823 | (864) | 53,136 |
Sweden | 0 | 0 | 0 | 15,217 | 7,892 | 23,109 |
Denmark | 0 | 0 | 0 | 13,161 | 1,759 | 14,920 |
Singapore | 13,861 | 0 | 0 | 367 | 0 | 14,228 |
Other | 13,290 | 2,485 | 139 | 11,517 | 2,691 | 30,122 |
|
|
|
|
|
|
|
Total revenues (excluding net income from associated companies) | 261,057 | 70,665 | 49,024 | 115,622 | 25,820 | 522,188 |
Assets by geographic areas |
|
|
|
|
|
|
|
|
|
|
|
(in NOK million) | 2009 | 2008 | 2007 |
|
|
|
|
Norway | 228,153 | 220,794 | 204,401 |
United States | 38,993 | 50,587 | 38,672 |
Brazil | 29,549 | 15,743 | 2,266 |
Angola | 23,345 | 23,807 | 15,906 |
Canada | 20,533 | 17,151 | 14,423 |
Azerbaijan | 17,331 | 21,396 | 16,279 |
Algeria | 9,265 | 11,270 | 8,371 |
Other areas | 37,975 | 47,769 | 31,305 |
|
|
|
|
Total non-current asset (excluding deferred tax asset, pension and financial non-current items) at 31 December | 405,144 | 408,517 | 331,623 |
Major customers
Statoil does not have transactions with single external customers where revenues amount to more than 10% of the group's total revenues.
8.1.6 Financial risk management
General information relevant to risks
Statoil's business activities naturally expose the group to financial risk. The group's approach to risk management includes identifying, evaluating, and managing risk in all activities using a top-down approach with the purpose of avoiding sub-optimisation and utilising correlations observed from a group perspective. Only summing up the different market risks without including the correlations will overestimate our total market risk. Due to this the group utilises correlations between all the most important market risks, such as oil and natural gas prices, product prices, currencies, and interest rates, to calculate the overall market risk and thereby utilise the natural hedges embedded in our portfolio. This approach also reduces the number of unnecessary transactions which reduces transaction costs and avoids sub-optimisation.
In order to achieve the above results, the group has centralised trading mandates such that all major/strategic transactions are co-ordinated through our Corporate Risk Committee. Local mandates are relatively small.
The group's Corporate Risk Committee, which is headed by the Chief Financial Officer and includes representatives from the principal business segments, is responsible for defining, developing, and reviewing the group's risk policies. The Chief Financial Officer assisted by the Corporate Risk Committee is also responsible for overseeing and developing Statoil's Enterprise-Wide Risk Management and proposing appropriate measures to adjust risk at the corporate level. The Committee meets at least six times per year and regularly receives risk information relevant for the group from our Corporate Risk Department.
Financial risks
Statoil's activities expose the group to financial risks as defined by IFRS 7:
- Market risk (including commodity price risk, interest rate risk, currency risk and equity price risk)
- Liquidity risk
- Credit risk
Market risk
Statoil operates in the worldwide crude oil, refined products, natural gas, and electricity markets and is exposed to market risks including fluctuations in hydrocarbon prices, foreign currency rates, interest rates and electricity prices that can affect the revenues and costs of operating, investing and financing. These risks are managed primarily on a short-term basis with a focus on achieving the highest risk adjusted returns for the group within the given mandate. Long-term positions, defined as having a time horizon of six months or more, are managed at the corporate level while short-term positions are managed at segment and lower levels according to trading strategies and mandates approved by the group's Corporate Risk Committee.
The group has established guidelines for entering into contractual arrangements (derivatives) in order to manage our commodity price, foreign currency rate, and interest rate risks. The group uses both financial and commodity-based derivatives to manage the risks in revenues, financial items and the present value of future cash flows.
Commodity price risk
Commodity price risk represents the group's most important short-term market risk and is monitored every day against established mandates as defined by the group's governing policies. To manage short-term commodity risk, the group enters into commodity-based derivative contracts, which consist of futures, options, over-the-counter (OTC) forward contracts, market swaps and contracts for differences related to crude oil, petroleum products, natural gas and electricity.
Derivatives associated with crude oil and petroleum products are traded mainly on the Inter Continental Exchange (ICE) in London, the New York Mercantile Exchange (NYMEX), the OTC Brent market, and in crude and refined products swaps markets. Derivatives associated with natural gas and electricity are mainly OTC physical forwards and options, Nordpool forwards and futures traded on the NYMEX and ICE.
The term of oil and refined oil products derivatives is usually less than one year and the term for natural gas and electricity derivatives is usually three years or less.
Currency risk
Statoil's operating results and cash flows are affected by price developments of its main products, oil and gas, in addition to foreign currency fluctuations of the most significant currencies, the NOK, EUR and GBP, against the USD.
Statoil is managed as a USD company for currency management purposes. Foreign exchange risk is managed at corporate level in accordance with policies and mandates.
The group's cash flows derived from oil and gas sales, operating expenses and capital expenditures are mainly in USD, but taxes and dividends are mainly in NOK. Accordingly, the group's currency management is primarily linked to secure tax and dividend payments in NOK. This means that the group regularly purchase substantial NOK amounts on a forward basis using conventional derivative instruments.
Interest rate risk
Statoil has assets and liabilities with variable interest rate that expose the group to cash flow risk caused by market interest rate fluctuations. The group enters into interest rate derivatives, particularly interest rate swaps, to alter interest rate exposures, to lower expected funding costs over time and to diversify sources of funding. By using the fixed interest rate debt market when issuing new debt and at the same time altering the interest rate exposure by entering into interest rate swaps, funding sources becomes more diversified than by only being able to use the US floating rate debt market.
Statoil principally manages the group's interest rates by converting cash flows from the long-term debt portfolio issued with fixed coupon rates into floating rate interest payments. Bonds are normally issued at fixed rates in local currency (JPY, EUR, CHF, GBP and USD). These bonds are converted to floating USD bonds by using interest rate- and currency swaps. The group's interest rate policy also includes a mandate to deviate from base policy and keep part of the long term debt in fixed interest rates.
Equity price risk
The group's captive insurance company holds listed equity securities as a part of its portfolio. In addition, the group holds some other non-listed equity securities for long-term strategic purposes. By holding these assets the group is exposed to equity price risk, defined as the risk of declining equity prices, which can result in a decline in the carrying value of the group's assets recognised in the balance sheet. The equity price risk in the portfolio held by the group's captive insurance company is managed, with the aim of maintaining a moderate risk profile, through geographical diversification and the use of broad benchmark indexes.
Liquidity risk
Liquidity risk is the risk that Statoil will not be able to meet obligations associated with financial liabilities when due. The purpose of liquidity and current liability management is to make certain that the group has sufficient funds available at all times to cover its financial obligations.
Statoil manages liquidity and funding at the corporate level, ensuring adequate liquidity to cover group operational requirements. The challenging market conditions during the last couple of years have led to an increased focus and attention on credit and liquidity risk throughout Statoil's entire organisation. Planned capital expenditures have been adjusted and Statoil has, and will continue, to implement initiatives to cut costs. In order to secure necessary financial flexibility, which includes meeting the group's financial obligations, Statoil maintains what is believed to be a conservative liquidity management policy. To secure financial flexibility and identify future long-term financing needs, Statoil carries out three-year cash forecasts at least on a monthly basis.
Statoil's operating cash flows are significantly impacted by the volatility in the oil and gas prices; however, during 2009 the group's overall liquidity position remained strong and the policies for managing liquidity remained unchanged.
The main cash outflows are the annual dividend payment and Norwegian Petroleum Tax payments six times per year. If liquid assets one month after tax- and dividend payment dates are below defined policy level, new long-term funding will be considered.
Current funding needs will normally be covered by using the US Commercial Papers Programme (CP), USD 4 billion which is backed by a revolving credit facility of USD 2 billion, supported by 17 core banks. The facility is undrawn and provides secure access to funding, supported by best available (A1/P1) short-term rating. This credit facility matures in December 2011 and is expected to be renewed and increased during 2010.
For non-current funding purposes Statoil raises debt in all main capital markets (USA, Europe and Japan). In order to comply with the group's financial policies, Statoil uses derivatives such as currency and interest rate swaps to convert cash flows into floating rate USD interest payments. Our policy is to have a smooth maturity profile with repayments not exceeding 5% of capital employed in any year for the nearest five years. Statoil's long term debt has an average maturity of approximately 10 years.
For more information about the group's non-current financial liabilities see note 22 Non-current financial liabilities.
The table below shows a maturity analysis of the group's financial liabilities and financial assets held to manage liquidity risk based on undiscounted contractual cash flows. Included in the assets held to manage liquidity risk are certain foreign currency derivative instruments.
(in NOK million) | Due within 1 year | Due between 1 and 2 years | Due between 3 and 4 years | Due between 5 and 10 years | Due after 10 years | Total specified |
|
|
|
|
|
|
|
At 31 December 2009 |
|
|
|
|
|
|
Non-derivative financial liabilities | (72,540) | (17,910) | (24,854) | (49,836) | (52,349) | (217,489) |
Derivative financial instruments | (613) | 24 | (766) | (1,672) | (1,064) | (4,091) |
|
|
|
|
|
|
|
Financial assets held for managing liquidity risk |
|
|
|
|
|
|
Current derivative financial instruments | 335 | 0 | 0 | 0 | 0 | 335 |
Current financial investments | 7,022 | 0 | 0 | 0 | 0 | 7,022 |
Cash & cash equivalent | 24,723 | 0 | 0 | 0 | 0 | 24,723 |
Total asset held | 32,080 | 0 | 0 | 0 | 0 | 32,080 |
|
|
|
|
|
|
|
At 31 December 2008 |
|
|
|
|
|
|
Non-derivative financial liabilities | (98,820) | (8,197) | (11,150) | (13,056) | (28,073) | (159,296) |
Derivative financial instruments | (13,634) | (120) | (73) | (174) | (421) | (14,422) |
|
|
|
|
|
|
|
Financial assets held for managing liquidity risk |
|
|
|
|
|
|
Current derivative financial instruments | 173 | 0 | 0 | 0 | 0 | 173 |
Current financial investments | 9,747 | 0 | 0 | 0 | 0 | 9,747 |
Cash & cash equivalent | 18,638 | 0 | 0 | 0 | 0 | 18,638 |
Total asset held | 28,558 | 0 | 0 | 0 | 0 | 28,558 |
As of 31 December 2009 Statoil's liquid assets amounted to NOK 31.7 billion and total liquidity reserve, defined as the total of the group's liquid assets and unused credit facility, amounted to NOK 43.3 billion .
Credit risk
Credit risk is the risk that the group's customers or counterparties will cause the group financial loss by failing to honour their obligations. Credit risk arises from credit exposures with customer accounts receivables as well as from financial investments, derivative financial instruments and deposits with financial institutions. Theoretically, the group's maximum credit exposure for financial assets is the aggregated balance sheet carrying amounts of financial investments (excluding equity investments of NOK 6.5 billion in 2009 and NOK 6.5 billion in 2008), derivative financial instruments, financial receivables, trade and other receivables, and cash and cash equivalents.
Key elements of our credit risk management approach include:
- A global credit risk policy
- Credit mandates
- An internal credit rating process
- Credit risk mitigation tools
- Continuous monitoring and managing credit exposures
Prior to entering into transactions with new counterparties, the group's credit policy requires all counterparties to be formally identified, approved, and assigned internal credit ratings as well as exposure limits. Once established, all counterparties are re-assessed at a minimum annually and monitored continuously. Counterparty risk assessments are based on a quantitative and qualitative analysis of recent financial statements and other relevant business information. In addition, Statoil evaluates any past payment performance, the counterparties' size and business diversification, and the inherent industry risk. The internal credit ratings reflect our assessment of the counterparties' credit risk. Exposure limits are determined based on assigned internal credit ratings combined with other factors, such as expected transaction and industry characteristics. Credit mandates define acceptable credit risk thresholds and are endorsed by management and regularly reviewed with regard to changes in market conditions.
The group uses risk mitigation tools to reduce or control credit risk both on a counterparty and portfolio level. The main tools are variations of bank and parental guarantees, prepayments and cash collateral. For bank guarantees only investment grade international banks are accepted.
The group has pre-defined limits for the minimum average credit rating allowed at any given time on the group portfolio level as well as maximum credit exposures for individual counterparties. The group monitors the portfolio on a regular basis and individual exposures against limits on a daily basis. The total credit exposure portfolio of Statoil is geographically diversified among a number of counterparties within the oil and energy sector, as well as larger oil and gas consumers and financial counterparties. The majority of the group's credit exposure is with investment grade counterparties.
The following table contains the carrying amount of Statoil's financial receivables and derivative financial instruments that are neither past due nor impaired split by the group's assessment of the counter-party's credit risk. Included in current and non-current derivative financial instruments are only non exchange traded instruments.
| Non-current | Trade and other | Current derivative | Non-current derivative |
(in NOK million) | financial receivables | receivables | financial instruments | financial instruments |
|
|
|
|
|
At 31 December 2009 |
|
|
|
|
Investment grade, rated A or above | 1,081 | 25,119 | 3,501 | 10,975 |
Other investment grade | 1,387 | 5,417 | 1,060 | 6,669 |
Non-investment grade or not rated | 696 | 22,471 | 635 | - |
|
|
|
|
|
Total financial asset | 3,164 | 53,007 | 5,196 | 17,644 |
|
|
|
|
|
At 31 December 2008 |
|
|
|
|
Investment grade, rated A or above | 1,360 | 33,737 | 6,243 | 15,484 |
Other investment grade | 3 | 8,431 | 1,296 | 5,798 |
Non-investment grade or not rated | 1,408 | 24,476 | 761 | - |
|
|
|
|
|
Total financial asset | 2,771 | 66,644 | 8,300 | 21,282 |
As of 31 December 2009, NOK 4.7 billion is received in cash as collateral to offset a portion of this group credit exposure. See note 26 Current financial liabilities for more information on collateral held.
8.1.7 Capital management
Capital management
Statoil's capital management policy is to maximise value creation over time, while maintaining a strong financial position and a long-term credit rating at least within the single A category.
Management makes regular use of Free funds from operations over Net adjusted debt (FFO/ND) and Net adjusted debt over Capital employed (ND/CE) ratios in its assessment of Statoil's financial flexibility and ability to incur additional debt.
FFO is net operating cash flows from operations after tax with the addition of certain adjustments employed by major rating agencies. These adjustments include cash effects from operating leases, post retirement benefit obligations, capitalised interest, asset retirement obligations and reclassifications of working capital cash flow changes.
ND in this respect is defined as Statoil's current and non-current interest bearing debt adjusted for Statoil's liquidity positions and adjusted for the adjustments defined above. In addition certain adjustments are made through the addition of project financing, balances related to the Marketing instruction, and balances held by the group's captive insurance company.
CE is Statoil's total equity plus net interest bearing debt, including debt adjustments defined above.
Credit rating
Credit rating is important for Statoil to provide necessary financial flexibility to support a dynamic strategy and provide flexibility through economic and market cycles. Statoil have credit ratings from Moody's and Standard & Poor's and our stated objective is to have credit ratings at least within the single A category. This rating ensures necessary predictability when it comes to funding access to relevant capital markets at favourable terms and conditions. Our current long-term credit ratings are Aa2 and AA- from Moody's and Standard & Poor's respectively. The short-term rating from Moody's is P-1 and A-1+ from Standard & Poor's. We have the intention to keep financial ratios that we consider adequate for maintaining credit ratings at levels consistent with our rating target.
Funding of subsidiaries, associates and jointly controlled entities
Normally the parent company, Statoil ASA, incurs debt and then extends loans or equity to fully owned subsidiaries to fund capital requirements within the group. With effect from 1 January 2009, Statoil ASA transferred the ownership of its Norwegian Continental Shelf (NCS) net assets to Statoil Petroleum AS. Following the transfer, the majority of corporate assets are owned by Statoil Petroleum AS. Effective from the same date, Statoil Petroleum AS became co-obligor or guarantor of existing debt securities and other loan arrangements of Statoil ASA. As co-obligor, Statoil Petroleum AS assumes and agrees to perform, jointly and severally with Statoil ASA, all payment and covenant obligations for this debt.
When partially owned subsidiaries or investments in associates and jointly controlled entities are financed, it is Statoil's policy to finance according to ownership share and on equal terms with the other owners. All financing of subsidiaries, associates and jointly controlled entities is based on arm's-length principles. Project specific financing may also be used with the primary objective to mitigate risk.
Capital distribution
Shareholder return consists of dividend payments, share buy-backs and share price development. Present dividend policy reflects:
It is Statoil's ambition to grow the annual cash dividend, measured in NOK per share in line with long-term underlying earnings. When deciding the annual dividend level, Statoil will take into consideration expected cash flows, capital expenditure plans, financing requirements and appropriate financial flexibility. In addition to cash dividend, Statoil might buy back shares as part of total distribution of capital to the shareholders.
The direct link to the IFRS net income has been removed, and the focus will be on growing the annual cash dividend per share in line with long-term underlying earnings. The new policy does not imply a change in the long-term dividend level, including potential share buy-backs, compared to the previous policy. Statoil emphasises the importance of maintaining an attractive dividend level also in the future.
8.1.8 Remuneration
| For the year ended 31 December | ||
(in NOK million except number of man-labour year) | 2009 | 2008 | 2007 |
|
|
|
|
Salaries** | 18,472 | 18,670 | 17,243 |
Pension costs | 3,538 | 2,851 | 3,131 |
Payroll tax | 3,023 | 2,676 | 2,930 |
Other compensations and social costs | 2,177 | 2,102 | 1,997 |
|
|
|
|
Total payroll costs | 27,210 | 26,299 | 25,301* |
|
|
|
|
|
|
|
|
Average man-labour year | 28,107 | 28,001 | 27,641 |
*Total payroll cost for 2007 is exclusive of termination benefits.
** Salaries are exclusive of reimbursement from the The Norwegian Labour and Welfare Administration.
Total payroll expenses are accumulated in cost-pools and partly charged to partners of Statoil-operated licences on an hours incurred basis.
The calculation of pension costs and pension assets/liabilities is described in note 23 Pension liabilities.
Share based compensation
Statoil's share saving plan provides employees with the opportunity to purchase Statoil shares through monthly salary deductions and a contribution by Statoil. If the shares are kept for two full calendar years of continued employment, the employees will be allocated one bonus share for each one they have purchased.
Estimated compensation expense including the contribution by Statoil for purchased shares, amount vested for bonus shares granted and related social security tax was NOK 370, NOK 340 and NOK 246 million related to the 2009, 2008 and 2007 programs, respectively. For the 2010 program (granted in 2009) the estimated compensation expense is NOK 427 million. At 31 December 2009 the amount of compensation cost yet to be expensed throughout the vesting period is NOK 816 million.
8.1.9 Other expenses
Auditors' remuneration
(in NOK million, excluding VAT) | Audit fee | Audit related fee | Other service fee | Total |
|
|
|
|
|
2009 |
|
|
|
|
Ernst & Young - Norway | 34.2 | 5.3 | 3.7 | 43.2 |
Ernst & Young - outside Norway | 27.1 | 1.5 | 0.9 | 29.5 |
|
|
|
|
|
Total | 61.3 | 6.8 | 4.6 | 72.7 |
|
|
|
|
|
2008 |
|
|
|
|
Ernst & Young - Norway | 35.0 | 4.9 | 0.1 | 40.0 |
Ernst & Young - outside Norway | 25.3 | 3.8 | 0.1 | 29.2 |
|
|
|
|
|
Total | 60.3 | 8.7 | 0.2 | 69.2 |
|
|
|
|
|
2007 |
|
|
|
|
Ernst & Young - Norway | 20.7 | 7.3 | 0.1 | 28.1 |
Ernst & Young - outside Norway | 24.1 | 0.8 | 0.3 | 25.2 |
|
|
|
|
|
Total | 44.8 | 8.1 | 0.4 | 53.3 |
In addition to the figures in the table above, the audit fees and audit related fees to Ernst & Young related to Statoil-operated licences amount to NOK 8.9, NOK 8.5 and NOK 6.1 million for 2009, 2008 and 2007, respectively.
The increase in audit fees from 2007 to 2008 are mainly due to the increase in activity in connection with the merger with Hydro Petroleum.
Research and development expenditures
Research and development expenditures were NOK 2,073, NOK 2,243 and NOK 1,969 million in 2009, 2008 and 2007, respectively. R&D expenditures are partly financed by partners of Statoil-operated licences. Statoil's share of the expenditures has been recognised as expense in the Statement of income.
8.1.10 Financial items
| For the year ended 31 December | ||
(in NOK million) | 2009 | 2008 | 2007 |
|
|
|
|
Foreign exchange gains (losses) non-current financial liabilities | 0 | (11,252) | 5,944 |
Foreign exchange gains (losses) derivative financial instruments | 9,722 | (25,001) | 8,276 |
Foreign exchange gains (losses) taxes payable | (1,930) | - | - |
Other foreign exchange gains (losses) | (5,799) | 3,690 | (4,177) |
Net foreign exchange gains (losses) | 1,993 | (32,563) | 10,043 |
|
|
|
|
Dividends received | 66 | 290 | 523 |
Gains (losses) financial investments | 875 | 4,796 | (723) |
Interest income financial investments | 354 | 975 | 338 |
Interest income non-current financial receivables | 106 | 130 | 197 |
Interest income current financial assets and other financial income | 2,307 | 6,016 | 1,970 |
Interest income and other financial items | 3,708 | 12,207 | 2,305 |
|
|
|
|
Capitalised borrowing costs | 1,351 | 1,225 | 2,680 |
Accretion expense asset retirement obligation | (2,432) | (2,107) | (2,099) |
Interest expense non-current financial liabilities incl. derivatives | (2,386) | (1,850) | (2,447) |
Gains (losses) derivative financial instruments | (6,593) | 5,632 | 513 |
Interest expense current financial liabilities and other finance expenses | (2,391) | (909) | (1,388) |
Interest and other finance expenses | (12,451) | 1,991 | (2,741) |
Net financial items | (6,750) | (18,365) | 9,607 |
Foreign exchange gains (losses) derivative financial instruments include fair value changes of currency derivatives related to liquidity and currency risk management. Weakening of USD versus NOK for the year ended 31 December 2009 resulted in fair value gains on these positions which are recognised in the statement of income. Correspondingly, strengthening of USD versus the NOK for the year ended 31 December 2008 resulted in fair value losses and weakening of USD versus NOK for the year ended 31 December 2007 resulted in fair value gains.
For comparison of Other foreign exchange gains and (losses) in 2009 with 2008 and 2007, one need to take into account that the parent company Statoil ASA changed its functional currency from NOK to USD effective from 1 January 2009. For further information see note 1 Organisation.
Gains (losses) derivative financial instruments include fair value changes of interest rate derivatives which are used to manage the interest rate risk of the loan portfolio. Increasing USD interest rates for the year ended 31 December 2009 resulted in fair value losses on these positions. Correspondingly, decreasing USD interest rates for the year ended 31 December 2008 and the year ended 31 December 2007 resulted in fair value gains.
Included in Interest expense current financial liabilities and other finance expenses is an impairment loss of NOK 1.4 billion related to the Pernis refinery investment for the year ended 31 December 2009.
Capitalised borrowing costs were reduced due to more fields going into production in 2009 and 2008 compared to 2007.
All hedge accounting relationships, which related to a portion of the non-current debt portfolio, were discontinued in the first quarter of 2009. Fair value hedge adjustments of NOK 2.5 billion are amortised over the remaining life of these loans (14 to 19 years). The amortised income recognised in Gains (losses) derivative financial instruments is NOK 198 million for the year ended 31 December 2009.
8.1.11 Income taxes
Significant components of income tax expense were as follows
(in NOK million) | 2009 | 2008 | 2007 |
|
|
|
|
Norway offshore | 80,944 | 124,775 | 93,838 |
Norway onshore | 4,027 | 3,378 | 1,924 |
Other countries upstream (1) | 5,149 | 9,704 | 9,928 |
Other countries downstream (1) | 770 | 306 | 535 |
|
|
|
|
Current income tax expense | 90,890 | 138,163 | 106,225 |
|
|
|
|
Norway offshore | 9,358 | 3,567 | (555) |
Norway onshore | 242 | (4,992) | 373 |
Other countries upstream (1) | (3,094) | 993 | (3,688) |
Other countries downstream (1) | (221) | (534) | (185) |
|
|
|
|
Deferred tax expense | 6,285 | (966) | (4,055) |
|
|
|
|
Income tax expense | 97,175 | 137,197 | 102,170 |
|
|
|
|
(1) Includes Norwegian taxes on income in other countries. |
|
| |
Reconciliation of Norwegian nominal statutory tax rate of 28% to effective tax rate
(in NOK million) | 2009 | 2008 | 2007 |
|
|
|
|
Norway offshore | 122,074 | 171,150 | 124,707 |
Norway onshore | (10,700) | (6,260) | 7,331 |
Other countries upstream | 2,733 | 14,610 | 13,727 |
Other countries downstream | 783 | 967 | 1,046 |
|
|
|
|
Total income before tax | 114,890 | 180,467 | 146,811 |
|
|
|
|
Calculated income taxes at statutory rates: |
|
|
|
Calculated income taxes at statutory rate (Norwegian statutory tax rate 28%) | 32,169 | 50,531 | 41,107 |
Petroleum surtax at statutory rate (Norwegian special tax rate 50%)* | 61,037 | 85,575 | 62,353 |
Uplift* | (5,052) | (5,047) | (4,365) |
Other countries upstream | 1,289 | 6,606 | 2,397 |
Other countries downstream | 330 | (497) | 57 |
Permanent differences caused by USD as functional currency | 6,935 | 0 | 0 |
Other items | 467 | 29 | 621 |
|
|
|
|
Income tax expense | 97,175 | 137,197 | 102,170 |
|
|
|
|
Effective tax rate (%) | 84.58 | 76.02 | 69.59 |
*Uplift is deducted by 7.5% per year for four years, as from the year of investment. At the end of 2009 and 2008 unrecognised uplift credits amounted to NOK 15.5 and 15.1 billion, respectively.
The higher tax rate for the year ended 31 December 2009 compared to 2008 is mainly caused by significant taxable exchange gains in the NOK based tax return in the parent company. These taxable exchange gains do not impact the Statement of income in the parent company, whose functional currency is USD. The effect amounts to NOK 6.9 billion.
Deferred tax assets and liabilities comprise
(in NOK million) | Inventory | Other current items | Tax losses carried forwards | Property, plant and equipment | Exploration expenditure | ARO | Pensions | Other non-current items | Total |
|
|
|
|
|
|
|
|
|
|
Deferred tax at 31 December 2008 |
|
|
|
|
|
|
|
|
|
Deferred tax assets | 1,356 | 5,970 | 3,505 | 1,864 | 0 | 28,195 | 10,607 | 5,693 | 57,190 |
Deferred tax liabilities | 0 | (9,063) | 0 | (91,816) | (18,528) | 0 | 0 | (4,625) | (124,032) |
|
|
|
|
|
|
|
|
|
|
Net asset (liability) at 31 December 2008 | 1,356 | (3,093) | 3,505 | (89,952) | (18,528) | 28,195 | 10,607 | 1,068 | (66,842) |
|
|
|
|
|
|
|
|
|
|
Deferred tax at 31 December 2009 |
|
|
|
|
|
|
|
|
|
Deferred tax assets | 907 | 2,123 | 3,098 | 10,162 | 0 | 34,072 | 8,148 | 2,668 | 61,178 |
Deferred tax liabilities | 0 | (9,014) | 0 | (96,799) | (20,091) | 0 | 0 | (9,636) | (135,540) |
|
|
|
|
|
|
|
|
|
|
Net asset (liability) at 31 December 2009 | 907 | (6,891) | 3,098 | (86,637) | (20,091) | 34,072 | 8,148 | (6,968) | (74,362) |
Analysis of movements during the year | 2009 | 2008 | 2007 |
|
|
|
|
Deferred tax liability at 1 January | 66,842 | 66,684 | 71,276 |
Charged (credited) to the Consolidated statement of income | 6,285 | (966) | (4,055) |
Other comprehensive income | 759 | 1,166 | 364 |
Charged (credited) to Equity | 155 | (364) | (189) |
Translation differences and other | 321 | 322 | (712) |
|
|
|
|
Deferred tax liability at 31 December | 74,362 | 66,842 | 66,684 |
Deferred tax assets and liabilities are offset to the extent that the deferred taxes relate to the same fiscal authority and there is a legally enforceable right to offset current tax assets against current tax liabilities.
Deferred tax assets
At the end of 2009, Statoil had recognised net deferred tax assets of NOK 1.96 billion, primarily in the International Exploration and Production segment, as it is considered probable that taxable profit will be available to utilise the deferred tax assets.
Unrecognised deferred tax assets
| At 31 December | |
(in NOK million) | 2009 | 2008 |
|
|
|
Deductible temporary differences | 14,519 | 8,016 |
Tax losses carry forward | 4,461 | 4,744 |
The tax losses carry-forwards that have not been recognised, primarily in the US, expire in the period 2019-2025. The unrecognised deductible temporary differences, primarily in Angola, do not expire under the current tax legislation. Deferred tax assets have not been recognised in respect of these items because evidence as required by prevailing accounting standards is currently not sufficient to support that future taxable profits will be available to secure utilisation of the benefits.
8.1.12 Earnings per share
Basic earnings per share
The calculation of basic earnings per share is based on the net income attributable to ordinary shareholders of the parent company and a weighted average number of ordinary shares outstanding during the years ended 31 December 2009, 2008 and 2007 respectively, calculated as follows:
| 2009 | 2008 | 2007 |
|
|
|
|
Net income attributable to equity holders of the parent company (in NOK million) | 18,313 | 43,265 | 44,096 |
|
|
|
|
Weighted average number of ordinary shares outstanding (in thousands of shares): |
|
|
|
Issued ordinary shares at 1 January | 3,189,902 | 3,188,647 | 2,166,144 |
Effect of own shares held | (6,029) | (2,693) | (21,681) |
Effect of shares issued in the merger with Hydro Petroleum | - | - | 1,051,404 |
Weighted average number of ordinary shares at 31 December | 3,183,874 | 3,185,954 | 3,195,867 |
Earnings per share for income attributable to equity holders of the company - basic and diluted (NOK) | 5.75 | 13.58 | 13.80 |
The group has no share programs with significant dilutive effects and the calculated diluted earnings per share rounds to be the same amount as the calculated basic earnings per share.
For the purposes of calculating earnings per share in connection with the merger with Hydro Petroleum, weighted average number of ordinary shares outstanding was set as the total of former Statoil's weighted average number of ordinary shares outstanding and Hydro's weighted average number of outstanding shares multiplied by the number of Statoil's ordinary shares which Hydro shareholders received for each Hydro share in connection with the merger.
8.1.13 Property, plant and equipment
(in NOK million) | Machinery, | Production plants | Refining and | Buildings and land | Vessels | Assets under development | Total |
|
|
|
|
|
|
|
|
Cost at 31 December 2007 | 14,041 | 521,542 | 41,162 | 14,742 | 4,647 | 49,110 | 645,244 |
Acquisitions through business combinations | 160 | 0 | 0 | 0 | 0 | 14,068 | 14,228 |
Additions and transfers | 3,139 | 47,327 | 3,234 | 1,103 | 819 | 9,627 | 65,249 |
Disposals assets at cost | (1,265) | (7,907) | (4,622) | (546) | (33) | (1,089) | (15,462) |
Effect of movements in foreign exchange - assets | 2,149 | 21,104 | 1,710 | 1,229 | 171 | 6,167 | 32,530 |
|
|
|
|
|
|
|
|
Cost at 31 December 2008 | 18,224 | 582,066 | 41,484 | 16,528 | 5,604 | 77,883 | 741,789 |
Accumulated depr. and impairment losses at 31 December 2007 | (9,745) | (323,491) | (25,761) | (5,487) | (430) | (1,978) | (366,892) |
Depreciation and amortisation | (1,005) | (36,872) | (1,607) | (672) | (396) | 0 | (40,552) |
Transfers | 0 | (2,343) | 0 | 0 | 0 | 2,343 | 0 |
Net impairment losses | 0 | (735) | 0 | 0 | 0 | (1,409) | (2,144) |
Accumulated depreciation and impairment disposed assets | 1,138 | 6,667 | 1,446 | 336 | 0 | 117 | 9,704 |
Effect of movements in foreign exchange – depreciation and impairment losses | (1,241) | (8,801) | (897) | (488) | (43) | (594) | (12,064) |
|
|
|
|
|
|
|
|
Accumulated depr. and impairment losses at 31 December 2008 | (10,853) | (365,575) | (26,819) | (6,311) | (869) | (1,521) | (411,948) |
|
|
|
|
|
|
|
|
Carrying amount at 31 December 2008 | 7,371 | 216,491 | 14,665 | 10,217 | 4,735 | 76,362 | 329,841 |
|
|
|
|
|
|
|
|
Estimated useful lives (years) | 3 - 10 | * | 15 - 20 | 20 - 33 | 20 - 25 |
|
|
(in NOK million) | Machinery, | Production plants | Refining and | Buildings and land | Vessels | Assets under development | Total |
|
|
|
|
|
|
|
|
Cost at 31 December 2008 | 18,224 | 582,066 | 41,484 | 16,528 | 5,604 | 77,883 | 741,789 |
Additions and transfers | 4,379 | 58,269 | 2,528 | 1,431 | (788) | 20,068 | 85,887 |
Disposals assets at cost | (1,411) | (514) | (223) | (348) | 0 | 0 | (2,496) |
Effect of movements in foreign exchange - assets | (2,650) | (21,334) | (435) | (1,876) | (737) | (8,730) | (35,762) |
|
|
|
|
|
|
|
|
Cost at 31 December 2009 | 18,542 | 618,487 | 43,354 | 15,735 | 4,079 | 89,221 | 789,418 |
|
|
|
|
|
|
|
|
Accumulated depr. and impairment losses at 31 December 2008 | (10,853) | (365,575) | (26,819) | (6,311) | (869) | (1,521) | (411,948) |
Depreciation and amortisation | (1,305) | (42,347) | (1,994) | (617) | (333) | 0 | (46,596) |
Net impairment losses | (2,162) | (1,223) | (3,248) | 0 | 0 | 319 | (6,314) |
Accumulated depreciation and impairment disposed assets | 867 | 513 | 139 | 214 | 0 | 0 | 1,733 |
Effect of movements in foreign exchange – depreciation and impairment losses | 1,252 | 11,041 | 219 | 711 | 184 | 1,135 | 14,542 |
|
|
|
|
|
|
|
|
Accumulated depr. and impairment losses at 31 December 2009 | (12,201) | (397,591) | (31,703) | (6,003) | (1,018) | (67) | (448,583) |
|
|
|
|
|
|
|
|
Carrying amount at 31 December 2009 | 6,341 | 220,896 | 11,651 | 9,732 | 3,061 | 89,154 | 340,835 |
|
|
|
|
|
|
|
|
Estimated useful lives (years) | 3 - 10 | * | 15 - 20 | 20 - 33 | 20 - 25 |
|
|
In 2009 and 2008, capitalised borrowing cost amounted to NOK 1.4 and NOK 1.2 billion, respectively. In addition to depreciation, amortisation and impairment losses specified above, certain intangible assets, see note 14 Intangible assets, have been amortised by NOK 1.2 and NOK 0.3 billion in 2009 and 2008, respectively.
Transfer of assets to Property, plant and equipment from Intangible assets in 2009 and 2008 amounted to NOK 4.9 and NOK 1.5 billion, respectively.
*Depreciation according to Unit of production method, see note 2 Significant accounting policies.
See note 5 Segments for description of asset impairments.
8.1.14 Intangible assets
(in NOK million) | Exploration | Other | Total |
|
|
|
|
Cost at 31 December 2007 | 40,511 | 6,598 | 47,109 |
Acquisitions through business combinations | 1,748 | 0 | 1,748 |
Other additions | 17,472 | 176 | 17,648 |
Disposals intangible assets at cost | (160) | (1,696) | (1,856) |
Transfers of intangible assets | (1,464) | 12 | (1,452) |
Expensed exploration expenditures previously capitalised | (3,706) | 0 | (3,706) |
Effect of movements in foreign exchange | 7,087 | 441 | 7,528 |
|
|
|
|
Cost at 31 December 2008 | 61,488 | 5,531 | 67,019 |
|
|
|
|
Accumulated amortisation and impairment losses at 31 December 2007 |
| (2,259) | (2,259) |
Depreciation, impairments and amortisation for the year |
| (300) | (300) |
Disposals amortisation and impairment losses |
| 1,686 | 1,686 |
Effect of movements in foreign exchange - amortisation and imp. losses |
| (110) | (110) |
|
|
|
|
Accumulated amortisation and impairment losses at 31 December 2008 |
| (983) | (983) |
|
|
|
|
Carrying amount at 31 December 2008 | 61,488 | 4,548 | 66,036 |
(in NOK million) | Exploration | Other | Total |
|
|
|
|
Cost at 31 December 2008 | 61,488 | 5,531 | 67,019 |
Other additions | 7,816 | 1,614 | 9,430 |
Disposals intangible assets at cost | (774) | (49) | (823) |
Transfers of intangible assets | (4,888) | 10 | (4,878) |
Expensed exploration expenditures previously capitalised | (6,998) | 0 | (6,998) |
Effect of movements in foreign exchange | (7,284) | (457) | (7,741) |
|
|
|
|
Cost at 31 December 2009 | 49,360 | 6,649 | 56,009 |
|
|
|
|
Accumulated amortisation and impairment losses at 31 December 2008 |
| (983) | (983) |
Depreciation, impairments and amortisation for the year |
| (1,161) | (1,161) |
Disposals amortisation and impairment losses |
| 15 | 15 |
Effect of movements in foreign exchange - amortisation and imp. losses |
| 373 | 373 |
|
|
|
|
Accumulated amortisation and impairment losses at 31 December 2009 |
| (1,756) | (1,756) |
|
|
|
|
Carrying amount at 31 December 2009 | 49,360 | 4,893 | 54,253 |
The useful lives of intangible assets are assessed to be either finite or indefinite. Intangible assets with finite useful lives are amortised systematically over their estimated economic lives, ranging between 10-20 years.
Included in Other intangible assets is goodwill of NOK 4.0 billion as of 31 December 2009 (NOK 3.0 billion as of 31 December 2008 and as of 31 December 2007).
See note 5 Segments for description of asset impairments.
For 2008, additions in Intangible assets of NOK 19.4 billion include acquisition of business from Anadarko Petroleum Corporation and assets acquired from Chesapeake Energy Corporation in addition to other exploration activity capitalised during 2008. See note 3 Business combinations and note 4 Asset acquisitions and disposals for details on the acquisitions during 2008.
8.1.15 Investments in associated companies
(in NOK million) | 2009 | 2008 |
|
|
|
Carrying amount associated companies at 31 December | 10,056 | 12,640 |
Net income from associated companies | 1,778 | 1,283 |
The most significant associated companies included in the table above are Petrocedeño S.A (ownership share 9.68%), BTC Pipeline company (ownership share 8.71%) and South Caucasus PHC Ltd (ownership share 25.5%). Statoil has assessed that through contractual agreements the group has significant influence over the BTC Pipeline company and Petrocedeño S.A., and consequently the ownership interests in these companies are accounted for using the equity method.
8.1.16 Non-current financial assets
| At 31 December | |
(in NOK million) | 2009 | 2008 |
|
|
|
Bonds | 6,726 | 9,984 |
Listed equity securities | 4,318 | 2,276 |
Non-listed equity securities | 2,223 | 4,205 |
Financial investments | 13,267 | 16,465 |
Of the Financial investments at 31 December 2009, NOK 11.1 billion relate to investment portfolios held by the group's captive insurance company and is accounted for using the fair value option. Correspondingly NOK 12.3 billion were related to the group's captive insurance portfolios at 31 December 2008.
All non-listed equity securities in the above table are classified as available for sale assets and changes in fair value are recognised in Other comprehensive income except for impairment losses which are recognised in the Statement of income. The total change of NOK 2.0 billion in 2009 is mainly caused by an impairment loss of NOK 1.4 billion related to the Pernis refinery investment.
During 2009 NOK 0.07 billion has been transferred out of Other comprehensive income. For 2008 a loss of NOK 1.4 billion was recognised in Other comprehensive income.
| At 31 December | |
(in NOK million) | 2009 | 2008 |
|
|
|
Financial receivables interest bearing | 3,164 | 2,771 |
Non-financial receivables | 2,583 | 2,143 |
Financial receivables | 5,747 | 4,914 |
Included in Financial receivables interest bearing are project financing related to the associated company BTC, Petrocedeño (former Sincor) and Naturkraft.
Included in Non-financial receivables are long term prepayments.
Of the Financial receivables NOK 3.2 billion is classified in the loan and receivables category, the remaining is classified as non-financial assets. Financial receivables' carrying amounts reasonably approximate fair value.
8.1.17 Inventories
Inventories are valued at the lower of cost and net realisable value. Inventories of crude oil, refined products and non-petroleum products are determined under the first-in, first-out (FIFO) method.
The carrying amount of inventory at the beginning of the year has in all material respects been recognised as an expense through Purchases [net of inventory variation] during the year.
| At 31 December | |
(in NOK million) | 2009 | 2008 |
|
|
|
Crude oil | 11,371 | 7,249 |
Petroleum products | 7,778 | 6,338 |
Other | 1,047 | 1,564 |
|
|
|
Inventories | 20,196 | 15,151 |
A write-down of inventory to net realisable value has been recognised as an expense in the period. The write-down was insignificant at year end 2009 and amounted to NOK 3.9 billion at year end 2008.
8.1.18 Trade and other receivables
| At 31 December | |
(in NOK million) | 2009 | 2008 |
|
|
|
Financial trade and other receivables: |
|
|
Trade receivables | 48,827 | 57,796 |
Receivables joint ventures | 3,579 | 7,131 |
Receivables associated companies and other related parties | 601 | 1,717 |
|
|
|
Total financial trade and other receivables | 53,007 | 66,644 |
Non-financial trade and other receivables | 5,888 | 3,287 |
|
|
|
Trade and other receivables | 58,895 | 69,931 |
For more information about the credit quality of Statoils financial assets see note 6 Financial risk management. For currency sensitivities see note 31 Financial instruments: measurement and market risk sensitivities.
8.1.19 Current financial investments
| At 31 December | |
(in NOK million) | 2009 | 2008 |
|
|
|
Commercial papers | 5,356 | 7,131 |
Money market funds | 1,584 | 2,602 |
Other | 82 | 14 |
Financial investments | 7,022 | 9,747 |
Current financial investments at 31 December 2009 are classified as held for trading, except for NOK 5.0 billion related to investment portfolios held by the group's captive insurance company which are accounted for using the fair value option. The corresponding balance at 31 December 2008 was NOK 1.9 billion accounted for using the fair value option.
Current financial investments at 31 December 2009 and 2008 are measured at fair value with gains and losses recognised in the statement of income.
8.1.20 Cash and cash equivalents
| At 31 December | |
(in NOK million) | 2009 | 2008 |
Cash at bank | 9,872 | 12,165 |
Time deposits and collateral deposits | 14,851 | 6,473 |
Cash and cash equivalents | 24,723 | 18,638 |
Cash and cash equivalents at 31 December 2009 include restricted cash of NOK 1.8 billion related to trading activities, correspondingly restricted cash at 31 December 2008 was NOK 4.1 billion. This restricted cash is related to certain collateral requirements set out by exchanges where the group is participating. The terms and conditions related to these requirements are determined by the respective exchanges.
The overdraft bank balances and overdraft facilities are included in note 26 Current financial liabilities. For reconciliation of Cash and cash equivalents reported in the Consolidated balance sheet, see Consolidated statement of cash flows.
8.1.21 Transactions impacting shareholders equity
For information regarding changes in equity related to the merger with Hydro Petroleum, see information in note 32 Merger with Hydro Petroleum.
The annual general meeting in 2006 authorised the board of directors to acquire treasury shares for subsequent annulment. Under an agreement with the Norwegian State a proportion of the State's shares should later be redeemed and annulled, so that the State's ownership interest remained unchanged. Both the acquired shares and the firm obligation have been included in Treasury shares since the date the treasury shares have been acquired in the market according to the authorisation. The extraordinary general meeting on 5 July 2007 approved a reduction of the share capital by NOK 50,397,120 through the annulment of 5,867,000 acquired treasury shares, and redemption and annulment of an additional 14,291,848 shares held by the State. The State, represented by the Ministry of Petroleum and Energy, received a payment of NOK 2,441,899,894 for the shares. The amount corresponded to the average volume-weighted price of the company's treasury shares acquired in the market with the addition of interest. As of 31 December 2009 the Norwegian State had an ownership interest in Statoil of 67% (excluding Folketrygdfondet (Norwegian national insurance fund) of 3.26%). The Norwegian State is defined as a related party, see note 29 Related parties.
After the annulment in 2007, Statoil share capital of NOK 7,971,617,757.50 comprised 3,188,647,103 shares at a nominal value of NOK 2.50.
The board of directors is authorised on behalf of the company to acquire Statoil shares in the market. The authorisation may be used to acquire Statoil shares with an overall nominal value of up to NOK 15 million. Such shares acquired in accordance with the authorisation may only be used for sale and transfer to employees of the Statoil group as part of the group's share saving plan approved by the board. The minimum and maximum amount that may be paid per share will be NOK 50 and 500, respectively. The authorisation is valid until the next ordinary general meeting.
During 2009 a total of 2,663,357 treasury shares were purchased for NOK 343 million. At 31 December 2009 Statoil had 6,028,607 treasury shares all of which are related to the group's share saving plan.
Statoil ASA has only one class of shares and all shares have voting rights. The holders of ordinary shares are entitled to receive dividends as declared from time to time and are entitled to one vote per share at general meetings of the company.
Dividends declared and paid per share were NOK 7.25 in 2009 for Statoil ASA and NOK 8.50 and NOK 9.12 in 2008 and 2007, respectively for the former Statoil ASA. In addition, under terms of the merger plan Hydro Petroleum was charged the dividend payment of NOK 6.1 billion paid by Norsk Hydro ASA to its shareholders in 2007. Dividend payments for 2007 included in Statoil's equity include both the former Statoil ASA and Hydro Petroleum dividend payments. A dividend for 2009 of NOK 6.00 per share, amounting to a total dividend of NOK 19.1 billion, will be proposed at the annual general meeting in May 2010. The proposed dividend is not recognised as a liability in the financial statements.
Retained earnings available for distribution of dividends at 31 December 2009 is limited to the retained earnings of the parent company based on Norwegian accounting principles and legal regulations and amounted to NOK 117,160 million (before provisions for proposed dividend for the year ended 31 December 2009 of NOK 19,100 million). This differs from retained earnings in the Consolidated financial statements of NOK 145,909 million. In accordance with legal requirements dividends is not allowed to reduce the shareholders' equity of the parent company below 10% of total assets.
8.1.22 Non-current financial liabilities
| Weighted average interest rates in % | Carrying amount in NOK million at 31 December | Fair value in NOK million at 31 December | |||
| 2009 | 2008 | 2009 | 2008 | 2009 | 2008 |
Financial liabilities measured at amortised cost |
|
|
|
|
|
|
|
|
|
|
|
|
|
Unsecured bonds |
|
|
|
|
|
|
US dollar (USD) | 5.85 | 6.84 | 40,610 | 23,617 | 43,632 | 25,312 |
Euro (EUR) | 5.13 | 5.58 | 27,515 | 6,101 | 30,397 | 6,458 |
Swiss franc (CHF) |
| 4.01 | - | 1,023 | - | 1,032 |
Japanese yen (JPY) | 1.66 | 1.65 | 312 | 388 | 322 | 376 |
Great Britain Pound (GBP) | 6.71 | 6.13 | 9,556 | 2,271 | 11,391 | 1,935 |
Total |
|
| 77,993 | 33,400 | 85,742 | 35,113 |
Unsecured loans |
|
|
|
|
|
|
US dollar (USD) | 0.71 | 2.74 | 5,697 | 6,899 | 5,639 | 6,726 |
Japanese yen (JPY) | 1.65 | 1.65 | 501 | 620 | 516 | 607 |
|
|
|
|
|
|
|
Secured bank loans |
|
|
|
|
|
|
US dollar (USD) | 3.74 | 5.86 | 864 | 1,252 | 894 | 1,262 |
Other currencies | 4.63 | 6.82 | 135 | 63 | 135 | 63 |
|
|
|
|
|
|
|
Financial lease liabilities |
|
| 13,747 | 5,665 | 13,747 | 5,665 |
Other liabilities |
|
| 293 | 864 | 293 | 855 |
Total |
|
| 21,237 | 15,363 | 21,224 | 15,178 |
Financial liabilities measured at amortised cost |
|
|
|
|
|
|
subject for hedge accounting |
|
|
|
|
|
|
US dollar (USD) |
| 5.94 | - | 9,957 | - | 7,403 |
Euro (EUR) |
| 5.13 | - | 2,097 | - | 2,050 |
Total |
|
| - | 12,054 | - | 9,453 |
Grand total liabilities outstanding |
|
| 99,230 | 60,817 | 106,966 | 59,744 |
Less current portion |
|
| 3,268 | 6,211 | 3,268 | 6,183 |
Financial liabilities |
|
| 95,962 | 54,606 | 103,698 | 53,561 |
On 11 March 2009 Statoil ASA executed the issuance of a GBP 0.8 billion bond maturing in March 2031, a EUR 1.2 billion bond maturing in March 2021 and a EUR 1.3 billion bond maturing in March 2015. All bonds were issued under Statoil ASA's Euro Medium Term Note Programme and have been listed on the London Stock Exchange.
On 23 April 2009 Statoil ASA executed the issuance of a USD 0.5 billion bond maturing in April 2014 and a USD 1.5 billion bond maturing in April 2019. These registered bonds were issued under the Registration Statement on Form F-3 ("Shelf Registration") filed with the SEC in the United States.
On 15 October 2009 Statoil ASA executed the issuance of a USD 0.9 billion bond maturing in October 2014. The registered bond was issued under the Registration Statement on Form F-3 ("Shelf Registration") filed with the SEC in the United States.
Non-current financial liabilities include financial lease obligations. More information is given in note 27 Leases.
The third section of the table above contains bonds valued at amortised cost as adjusted for the fair value of hedged interest rate risk for the bonds that qualify for hedge accounting. As of 1 January 2009 no bonds are subject to hedge accounting. The table does not illustrate the economic effects of agreements entered into to swap the various currencies into USD. For further information see note 30 Financial instruments by category.
Weighted average interest rates are calculated based on the contractual rates on the loans per currency at 31 December and do not reflect swap agreements.
Fair value is calculated by discounting cash flows based on year-end market interest rates from external sources. Year-end market interest rates used as discount rates are derived from LIBOR and EURIBOR adjusted for credit premiums. Credit premiums are based on indicative pricing from external financial institutions.
Details of largest unsecured bonds: |
|
|
|
|
|
|
|
|
|
|
|
|
|
|
| Carrying amount in NOK million at 31 December | |
Bond agreement | Fixed interest rate | Issued (year) | Maturity (year) | 2009 | 2008 |
|
|
|
|
|
|
USD 1500 million | 5.250% | 2009 | 2019 | 8,613 | - |
USD 900 million | 2.900% | 2009 | 2014 | 5,174 | - |
USD 500 million | 3.875% | 2009 | 2014 | 2,870 | - |
USD 500 million | 5.125% | 2004 | 2014 | 2,887 | 3,498 |
USD 500 million | 6.500% | 1998 | 2028 | 2,859 | 3,462 |
USD 481 million | 7.250% | 2000 | 2027 | 2,776 | 3,363 |
USD 300 million | 7.750% | 1993 | 2023 | 1,733 | 2,100 |
EUR 1300 million | 4.375% | 2009 | 2015 | 10,782 | - |
EUR 1200 million | 5.625% | 2009 | 2021 | 9,887 | - |
EUR 500 million | 5.125% | 1999 | 2011 | 4,148 | 4,915 |
EUR 300 million | 6.250% | 1999 | 2010 | 2,494 | 2,960 |
GBP 800 million | 6.875% | 2009 | 2031 | 7,421 | - |
GBP 225 million | 6.125% | 1998 | 2028 | 2,096 | 2,277 |
Currency swaps are used for risk management purposes. Unsecured bonds are either denominated in US dollar, amounting to NOK 41.1 billion or the bonds are swapped into US dollar, amounting to NOK 37.9 billion. Interest rate swaps are used to manage the interest rate risk on the unsecured bond contracts with fixed interest rates. As a resul the majority of the portfolio is swapped from fixed to floating interest rate.
Substantially all unsecured bond and unsecured bank loan agreements contain provisions restricting the pledging of assets to secure future borrowings without granting a similar secured status to the existing bondholders and lenders.
The group's secured bank loans in USD have been secured by mortgage of shares in a subsidiary and investments in associated companies with a combined book value of NOK 2.3 billion, and the group's pro-rata share of income from certain applicable projects.
The group has 27 unsecured bond agreements outstanding, which contain provisions allowing the group to call the debt prior to its final redemption at par or at certain specified premiums if there are changes to the Norwegian tax laws. The agreements carrying value are NOK 75.9 billion at the 31 December 2009 closing rate.
The group has a revolving credit facility supported by core banks. For more information see note 6 Financial risk management.
Non-current financial liabilities maturity profile |
|
|
|
|
|
| At 31 December | |
(in NOK million) | 2009 | 2008 |
|
|
|
Year 2 and 3 | 11,757 | 9,653 |
Year 4 and 5 | 11,496 | 9,739 |
After 5 years | 72,709 | 35,214 |
Total repayment of non-current financial liabilities | 95,962 | 54,606 |
Redemption profile for undiscounted cash flows is shown in note 6 Financial risk management.
Non-current financial liabilities |
|
|
|
|
|
| At 31 December | |
(in NOK million) | 2009 | 2008 |
|
|
|
Non-current financial liabilities | 95,962 | 54,606 |
Weighted average maturity | 9 | 9 |
Weighted average annual interest rate | 4.77 | 5.64 |
8.1.23 Pension liabilities
The Norwegian companies in the group are obligated to follow the Act on Mandatory company pensions. The pension scheme follows the requirement as included in the Act.
Statoil ASA and many of its subsidiaries have defined benefit retirement plans, which cover substantially all of their employees. Plan benefits are generally based on years of service and final salary level. The cost of pension benefit plans is expensed over the period that the employee renders services and becomes eligible to receive benefits. The obligations related to defined benefit plans are calculated by external actuaries.
Some companies in Statoil have defined contribution plans. The period's contributions are recognised in the Statement of income as pension cost for the period.
In Norway, Statoil is - due to National agreements - a member of the "agreement-based early retirement plan" (AFP). The members pay an annual fee per active employee. This part of the plan is defined as a multi-employer plan. The administrator of this plan is not able to calculate the members' share of assets and liabilities and this plan is consequently accounted for as a defined contribution plan. In addition the members have an obligation to pay a percentage of the benefits when an employee retires through AFP. This obligation is accounted for as a defined benefit plan. When an employee retires through AFP, Statoil also offers a gratuity. This is also a defined benefit plan, and included in the provision related to the defined benefit plans.
A new legislation on the AFP was passed by the Norwegian Parliament 19 February 2010. This law is one part of the Norwegian pension and insurance reform effective from 1 January 2011. Several new laws affecting Norwegian pension and insurance schemes will be passed during 2010. Together with the revised national state pension and insurance legislation this forthcoming legislation will establish a new framework for private sector pension schemes in Norway which requires review and adaptations of existing schemes. Statoil will undertake a review of the total pension scheme during 2010 as a basis for deciding a revised model based on the new legislation.
The obligations related to the defined benefit plans were measured at 31 December, 2009 and 2008. The present values of the projected defined benefit obligation and the related current service cost and past service cost are measured using the projected unit credit method. The assumptions for salary increases, increases in pension payments and social security base amount have been tested against historical observations. At 31 December 2009 the discount rate for the defined benefit plans in Norway was estimated to be 4.75% based on the long-term interest rate on Norwegian government bonds extrapolated based on a 20 year yield curve to match Statoil's payment portfolio for earned benefits.
Actuarial gains and losses are recorded directly in Other comprehensive income in the period in which they occur, outside the Statement of income. Actuarial gains and losses related to the provision for termination benefits are recognised in the Statement of income in the period in which they occur.
Social security tax is calculated based on the pension plan's net unfunded status. Social security tax is included in the projected benefit obligation.
Statoil has more than one defined benefit plan but the disclosure is made in total since the plans are not subject to materially different risks. Pension plans outside Norway are insignificant and not disclosed separately.
Net periodic pension cost | |||
(in NOK million) | 2009 | 2008 | 2007 |
Current service cost | 2,747 | 2,361 | 2,611 |
Interest cost on prior years' benefit obligation | 2,550 | 2,456 | 1,713 |
Expected return on plan assets | (1,896) | (2,101) | (1,829) |
Amortisation of actuarial gain or loss related to termination benefits | (172) | (215) | 0 |
Amortisation of past service cost | 0 | 17 | 2,075 |
Losses (gains) from curtailment or settlement | 0 | (7) | (1,641) |
Defined benefit plans | 3,229 | 2,511 | 2,929 |
Defined contribution plans | 240 | 268 | 160 |
Multi-employer plans | 69 | 72 | 42 |
Termination benefits | 0 | 0 | 8,633 |
Total net pension cost | 3,538 | 2,851 | 11,764 |
Pension cost includes social security tax.
Pension cost is partly charged to partners of Statoil operated licences.
For information regarding pension benefits for key management personnel, see note 29 Related parties.
In 2007, Statoil ASA offered early retirement (termination benefits) to employees above the age of 58 years (contingent upon certain conditions). The expenses related to termination benefits of NOK 5.6 billion and NOK 3.0 billion were recognised as Operating expenses and Selling, general and administrative expenses, respectively.
Change in projected benefit obligation (PBO) |
|
|
(in NOK million) | 2009 | 2008 |
Projected benefit obligation at 1 January | 59,206 | 52,791 |
Current service cost | 2,747 | 2,361 |
Interest cost on prior years' benefit obligation | 2,550 | 2,456 |
Actuarial loss (gain) | (1,308) | 3,581 |
Past service cost | 0 | 18 |
Benefits paid | (1,520) | (1,302) |
Acquisition and sale | 0 | (670) |
Foreign currency translation | (248) | (29) |
Projected benefit obligation at 31 December | 61,427 | 59,206 |
Change in pension plan assets |
|
|
(in NOK million) | 2009 | 2008 |
Fair value of plan assets at 1 January | 33,698 | 35,158 |
Expected return on plan assets | 1,896 | 2,101 |
Actuarial gain (loss) | 2,819 | (4,149) |
Company contributions (including payroll tax) | 4,956 | 1,377 |
Benefits paid | (385) | (346) |
Acquisition and sale | 0 | (443) |
Foreign currency translation | (5) | 0 |
Fair value of plan assets at 31 December | 42,979 | 33,698 |
The tables above for Change in projected benefit obligation (PBO) and Change in pension plan assets do not include currency effects for Statoil ASA. For more information see table Actuarial gains and losses recognised directly in Other comprehensive income below.
Total provision for pensions | ||
(in NOK million) | 2009 | 2008 |
Balance sheet provision at 1 January | (25,508) | (17,633) |
Net periodic pension costs defined benefit plans | (3,229) | (2,511) |
Net actuarial (loss) gain recognised in Other Comprehensive Income | 3,191 | (7,945) |
Less employer contributions/benefit paid during year | 4,956 | 1,377 |
Less benefit paid during year | 1,135 | 956 |
Acquisition and sale | 0 | 227 |
Foreign currency translation and other changes | 1,007 | 21 |
Balance sheet provision at 31 December | (18,448) | (25,508) |
Surplus (deficit) at 31 December | |||
(in NOK million) | 2009 | 2008 | 2007 |
| |||
Surplus (deficit) at 31 December | (18,448) | (25,508) | (17,633) |
Represented by: |
|
|
|
Asset recognised as non-current pension asset | 2,694 | 30 | 1,622 |
Liability recognised as non-current pension liability | (21,142) | (25,538) | (19,092) |
Liability recognised as current liability | 0 | 0 | (163) |
Projected benefit obligation splitted on funded and unfunded plans | |||
(in NOK million) | 2009 | 2008 | 2007 |
Funded pension plans | (40,212) | (37,446) | (33,278) |
Unfunded pension plans | (21,215) | (21,760) | (19,513) |
PBO at 31 December | (61,427) | (59,206) | (52,791) |
Actuarial gains and losses recognised directly in Other comprehensive income | |||
(in NOK million) | 2009 | 2008 | 2007 |
| |||
Unrecognised actuarial losses (gains) at 1 January | 0 | 0 | 0 |
Actuarial losses (gains) on plan assets occurred during the year | (2,819) | 4,149 | (272) |
Actuarial losses (gains) on benefit obligation occurred during the year | (1,308) | 3,581 | 198 |
Actuarial losses (gains) related to currency effects on net obligation | 3,867 | 0 | 0 |
Foreign exchange translation | (3,103) | 0 | 0 |
Recognised in the income statement during the year | 172 | 215 | 0 |
Recognised in Other comprehensive income during the year | 3,191 | (7,945) | 74 |
Unrecognised actuarial losses (gains) at 31 December | 0 | 0 | 0 |
Statoil ASA changed its functional currency as of 1 January 2009, for further information see note 1 Organisation and note 2 Significant accounting policies. In the table above Actuarial losses (gains) related to currency effects on net obligation refer to translation of the net pension obligation in ASA in NOK to the functional currency US dollar. The line Foreign exchange translation refer to translation from functional currency US dollar to presentation currency NOK.
Actual return on plan assets |
|
|
|
(in NOK million) | 2009 | 2008 | 2007 |
Actual return on plan assets | 4,715 | (2,048) | 1,593 |
History of experience gains and losses
(in NOK million) | 2009 |
|
|
Difference between the expected and actual return on plan assets |
|
a) Amount | (2,819) |
b) Percentage of plan assets | (6.56%) |
| |
Experience (gain) loss on plan liabilities |
|
a) Amount | (1,996) |
b) Percentage of present value of plan liabilities | (3.40%) |
The cumulative amount of actuarial gains and losses recognised directly in Other comprehensive income amounted to NOK 10.9, NOK 13.3 and NOK 4.2 billion net of tax (negative effect on Other comprehensive income) in 2009, 2008 and 2007, respectively.
Weighted-average assumptions for the year ended (Profit and Loss items) in % | 2009 | 2008 |
Discount rate | 4.50 | 5.00 |
Expected return on plan assets | 5.75 | 6.25 |
Rate of compensation increase | 4.00 | 4.50 |
Expected rate of pension increase | 2.75 | 3.25 |
Expected increase of social security base amount (G-amount) | 3.75 | 4.25 |
Inflation | 2.00 | 2.25 |
| ||
Weighted-average assumptions at end of year (Balance sheet items) in % | 2009 | 2008 |
Discount rate | 4.75 | 4.50 |
Expected return on plan assets | 6.00 | 5.75 |
Rate of compensation increase | 4.25 | 4.00 |
Expected rate of pension increase | 3.00 | 2.75 |
Expected increase of social security base amount (G-amount) | 4.00 | 3.75 |
Inflation | 2.25 | 2.00 |
| ||
Average remaining service period in years | 15 | 15 |
The assumptions presented are for the Norwegian companies in Statoil which are members of Statoil's pension fund. The defined benefit plans of other subsidiaries are not significant to the consolidated pension assets and liabilities.
Expected attrition at 31 December 2009 was 2.0%, 2.0%, 1.5%, 0.5% and 0.0% for the employees under 30 years, 30-39 years, 40-49 years, 50-59 years and 60-67 years, respectively. Expected attrition at 31 December 2008 was 2.0%, 2.0%, 1.5%, 0.5% and 0.0% for the employees under 30 years, 30-39 years, 40-49 years, 50-59 years and 60-67 years, respectively.
Expected utilisation of AFP is 50% for employees at 62 years and 30% for the remaining employees at 63-66 years.
For the population in Norway, the mortality table K 2005 including the minimum requirements from The Financial Supervisory Authority of Norway (Finanstilsynet), hence reducing the mortality rate with a minimum of 15% for male and 10% for female for each employee is used as the best mortality estimate. The disability table, KU, developed by the insurance company Storebrand, aligns with the actual disability risk for Statoil in Norway.
Below is shown a selection related to demographic assumptions used at 31 December 2009. The table shows the probability of disability or death, within one year, by age groups as well as expected lifetime.
| Disability in % | Mortality in % | Expected lifetime | |||
Age | Men | Women | Men | Women | Men | Women |
20 | 0.12 | 0.15 | 0.02 | 0.02 | 82.46 | 85.24 |
40 | 0.21 | 0.35 | 0.09 | 0.05 | 82.74 | 85.47 |
60 | 1.48 | 1.94 | 0.75 | 0.41 | 84.02 | 86.31 |
80 | N/A | N/A | 6.69 | 4.31 | 89.26 | 90.29 |
Sensitivity analysis
The table below shows an estimate of the potential effects of changes in the key assumptions for the defined benefit plans. The following estimates are based on facts and circumstances as of 31 December 2009. Actual results may materially deviate from these estimates.
| Discount rate | Rate of compensation increase | Social security base amount | Expected rate of pension increase | ||||
(in NOK billion) | 0,25% | -0,25% | 0,25% | -0,25% | 0,25% | -0,25% | 0,25% | -0,25% |
Changes in: | ||||||||
Projected benefit obligation at 31 December 2009 | (2.07) | 2.21 | 0.91 | (0.92) | (1.86) | 2.06 | 1.00 | (0.95) |
Service cost 2010 | (0.14) | 0.15 | 0.06 | (0.06) | (0.13) | 0,15 | 0.06 | (0.06) |
Pension assets
The plan assets related to the defined benefit plans were measured at fair value at 31 December 2009 and 2008. The long-term expected return on pension assets is based on long-term risk-free interest rate adjusted for the expected long-term risk premium for the respective investment classes. A risk free interest rate (the Norwegian Government bond with a life of 10 year included markup for estimating a longer interest rate than ten year) is applied as a starting point for calculation of return on plan assets. The return in the money market is calculated by taking a deduction on bond yield. Based on historical data, equities and real estate are expected to give a long-term additional return above money market.
In its asset management, the pension fund aims at achieving long-term returns which contribute towards meeting future pension liabilities. Assets are managed to achieve a return as high as possible within a framework of public regulation and risk management policies. The pension fund's target returns require investments in assets with a higher risk than risk-free investments. Risk is reduced through maintaining a well diversified asset portfolio. Assets are diversified both in terms of location and different asset classes. Derivatives are used within set limits to facilitate effective asset management.
Pension assets allocated on respective investments classes | ||
| ||
(in %) | 2009 | 2008 |
Equity securities | 39.60 | 19.10 |
Bonds | 39.40 | 70.20 |
Commercial papers | 14.70 | 3.30 |
Real estate | 5.10 | 6.90 |
Other assets | 1.20 | 0.50 |
Total | 100.00 | 100.00 |
Properties owned by Statoil Pension fund amounted to NOK 2.1 billion and NOK 2.2 billion of total pension assets at 31 December 2009 and 2008, respectively, and are rented to Statoil companies.
Statoil's pension fund invests in both financial assets and real estate. The expected rate of return on real estate is expected to be between the rate of return on equity securities and debt securities. The table below presents the portfolio weight and expected rate of return of the finance portfolio as approved by the Board of the Statoil pension fund for 2010. The portfolio weight during a year will depend on the risk capacity.
Finance portfolio Statoil's pension funds | |||
(All figures in %) | Portfolio weight 1) | Expected rate of return | |
Equity securities | 40.00 | (+/- 5) | X + 4 |
Bonds | 59.50 | (+/- 5) | X |
Commercial papers | 0.50 | (+15/- 0.5) | X - 0.4 |
Total finance portfolio | 100.00 |
|
|
1) The brackets express the scope of tactical deviation by Statoil Kapitalforvaltning ASA (the asset manager).
X) Long-term rate of return on debt securities.
Contributions to pension plans may either be paid in cash or be deducted from the pension premium fund. The pension premium fund amounted to NOK 7.2 billion and NOK 4.5 billion at 31 December 2009 and 2008, respectively. The decision whether to pay in cash or deduct from the pension premium fund is made on an annual basis. In 2009 a pension premium amounting to NOK 4.1 billion was paid. In addition Statoil intends to pay to the pension premium fund approximately NOK 3.3 billion late March 2010. In 2008, NOK 2.9 billion was deducted from the pension premium fund. The company contribution in 2008, paid in cash, was NOK 0.2 billion (exclusive social security tax). In addition, NOK 1.2 billion was paid to Statoil pension fund as a capital increase in 2008.
The expected company contribution related to 2010 amounts to NOK 2.1 billion.
8.1.24 Asset retirement obligations, other provisions and other liabilities
(in NOK million) |
|
|
|
Asset retirement obligations at 1 January 2008 | 39,581 |
Liabilities incurred/revision in estimates | 5,470 |
Amounts used and charged against provisions | (675) |
Unused amounts reversed | 0 |
Effects of change in the discount rate | (2,234) |
Reduction due to disposals | (1,402) |
Accretion | 2,107 |
Currency exchange difference | 1,239 |
|
|
Asset retirement obligations at 31 December 2008 | 44,086 |
|
|
Current portion of asset retirement obligations | 905 |
|
|
Analysis of provisions and other liabilities at 31 December 2008: |
|
Non current portion of asset retirement obligations | 43,181 |
Other provisions | 11,178 |
|
|
Asset retirement obligations, other provisions and other liabilities at 31 December 2008 | 54,359 |
|
|
|
|
|
(in NOK million) | Asset retirement obligations | Other provisions | Other liabilities | Total Provisions |
|
|
|
|
|
Non-current portion at 1 January 2009 | 43,181 | 9,660 | 1,518 | 54,359 |
Current portion at 1 January 2009 | 1,260 | 500 | 0 | 1,760 |
Provisions at 1 January 2009 | 44,441 | 10,160 | 1,518 | 56,119 |
|
|
|
|
|
Liabilities incurred/revision in estimates | 1,853 | (2,002) | 15 | (134) |
Amounts used and charged against provisions | (523) | (608) | 0 | (1,131) |
Unused amounts reversed | 0 | (153) | 0 | (153) |
Effects of change in the discount rate | 3,090 | 0 | 0 | 3,090 |
Reduction due to disposals | (767) | 0 | 0 | (767) |
Accretion | 2,432 | 0 | 0 | 2,432 |
Currency exchange difference | (1,599) | (171) | 0 | (1,770) |
|
|
|
|
|
Provisions at 31 December 2009 | 48,927 | 7,226 | 1,533 | 57,686 |
|
|
|
|
|
Current portion at 31 December 2009 | 515 | 1,044 | 0 | 1,559 |
Long term interest bearing provisions reported as financial liability | 0 | 293 | 0 | 293 |
Non-current portion at 31 December 2009 | 48,412 | 5,889 | 1,533 | 55,834 |
Asset retirement obligations
A majority of expenditures related to asset retirement obligations are currently expected to be paid in the period between 2015 and 2025. Only a minor portion of expenditures are expected to be paid in the next five years. The timing depends primarily on when the production ceases at the various facilities. For further discussion of methods applied and estimates required, see note 2 Significant accounting policies.
Obligations related to environmental remediation and cleanup related to oil and gas producing assets are included in the estimated asset retirement obligations.
8.1.25 Trade and other payables
| At 31 December | |
(in NOK million) | 2009 | 2008 |
|
|
|
Financial trade and other payables: |
|
|
Trade payables | 17,362 | 15,582 |
Non-trade payables and accrued expenses | 31,542 | 35,945 |
Payables to associated companies and other related parties | 9,144 | 7,463 |
|
|
|
Total financial trade and other payables | 58,048 | 58,990 |
Non-financial trade and other payables | 1,753 | 2,210 |
| ||
Trade and other payables | 59,801 | 61,200 |
Non-trade payables and accrued expenses include provisions for certain claims and litigations that are further described in note 28 Other commitments and contingencies.
For currency sensitivities see note 31 Financial instruments: measurement and market risk sensitivities.
8.1.26 Current financial liabilities
| At 31 December | |
(in NOK million) | 2009 | 2008 |
|
|
|
Bank loans and overdraft facilities | 196 | 906 |
Collateral liabilities | 4,654 | 10,123 |
Commercial paper liabilities | 0 | 2,989 |
Current portion of non-current loans | 2,686 | 5,604 |
Current portion of financial lease obligations | 582 | 607 |
Other financial liabilities | 32 | 466 |
Financial liabilities | 8,150 | 20,695 |
|
|
|
Weighted interest rate (%) | 2.24 | 2.50 |
Carrying amount for Current financial liabilities, at amortised cost and accrued interest reasonably approximate fair value.
Collateral liabilities relate to cash received as security for a portion of the group's credit exposure.
Commercial paper liabilities relate to the US Commercial Paper (CP) program available for short term funding. For more information see note 6 Financial risk management.
At 31 December 2009 and 2008 the group had no committed short-term credit facilities available or drawn.8.1.27 Leases
Statoil leases certain assets, notably vessels and drilling rigs.
Statoil has entered into certain operational lease contracts for a number of drilling rigs as of 31 December 2009. The remaining significant contracts' terms range from three months to four years. Certain contracts contain renewal options. Rig lease agreements are for the most part based on fixed day rates. Statoil's rig leases have been entered into in order to ensure drilling capacity for sanctioned projects and planned wells and to secure long-term strategic capacity for future exploration and production drilling. Certain rigs have been subleased in whole or for parts of the lease term for the most part to Statoil-operated licences on the NCS. These leases are shown gross as operating leases in the table below. However, for rig leases where the joint venture is the original lessee, Statoil only includes its proportional share of the rig lease.
As a member of the Snøhvit sellers' group Statoil has entered into leasing arrangements for three LNG vessels on behalf of Statoil and the SDFI. Statoil accounts for the combined Statoil and SDFI share of these agreements as finance leases in the balance sheet, and further accounts for the SDFI related portion as operating sub-leases. The finance leases included in the balance sheet reflect the original lease term of 20 years from 2006. In addition, Statoil has the option to extend the leases for two additional periods of five years each.
In 2009, net rental expense was NOK 10.9 billion (NOK 10.2 billion in 2008 and NOK 5.7 billion in 2007) of which minimum lease payments were NOK 12.7 billion (NOK 11.8 billion in 2008 and NOK 7.1 billion in 2007) and sublease payments received were NOK 1.8 billion (NOK 1.7 billion in 2008 and NOK 1.5 billion in 2007). No material contingent rents have been expensed in 2009, 2008 or 2007.
The information in the table below shows future minimum lease payments under non-cancellable leases at 31 December 2009.
Amounts related to finance leases include future minimum lease payments for assets recognised in the financial statements at year-end 2009.
|
|
| Financial lease | ||
(in NOK million) | Operating | Operating | Minimum | Interest | Net present value minimum lease payments |
2010 | 14.017 | (1,560) | 627 | (93) | 534 |
2011 | 10.929 | (736) | 638 | (106) | 532 |
2012 | 7.990 | (585) | 636 | (105) | 531 |
2013 | 5.262 | (589) | 444 | (107) | 337 |
2014 | 1.860 | (146) | 431 | (116) | 315 |
Thereafter | 3.097 | (1,324) | 3,992 | (1,477) | 2,515 |
Total future minimum lease payments | 43,155 | (4,940) | 6,768 | (2,004) | 4,764 |
In addition to the Net present value of minimum lease payments set out above (NOK 4,764 million), total finance lease obligations include an amount of NOK 8,983 million relating to leased assets under development. When calculating the obligations for leased assets under development, the net present value presented reflects the assets' estimated percentage of completion, unless another value better reflects the realities of the obligation.
Property, plant and equipment include the following amounts for leases that have been capitalised at 31 December 2009 and 2008:
(in NOK million) | 2009 | 2008 |
|
|
|
Leased assets under development | 8,983 | 0 |
Vessels and equipment | 4,876 | 6,501 |
Accumulated depreciation | (1,404) | (1,205) |
|
|
|
Capitalised amount | 12,455 | 5,296 |
8.1.28 Other commitments and contingencies
Contractual commitments
(in NOK million) | 2010 | 2011 | Thereafter | Total |
|
|
|
|
|
Joint Venture related: |
|
|
|
|
Construction in progress | 12,136 | 8,643 | 6,756 | 27,535 |
Property, plant and equipment and other investments | 1,946 | 68 | 3 | 2,017 |
Acquisition of intangible assets | 253 | 9 | 0 | 262 |
|
|
|
|
|
Subtotal joint venture related commitments | 14,335 | 8,720 | 6,759 | 29,814 |
|
|
|
|
|
Non Joint Venture related: |
|
|
|
|
Construction in progress | 734 | 0 | 0 | 734 |
|
|
|
|
|
Total | 15,069 | 8,720 | 6,759 | 30,548 |
The contractual commitments reflect Statoil's share and mainly comprise construction and acquisition of property, plant and equipment.
Other long-term commitments
Statoil has entered into various long-term agreements for pipeline transportation as well as terminal, processing, storage and entry/exit capacity commitments and commitments related to specific purchase agreements. The agreements ensure the rights to the capacity or volumes in question, but also impose on the group the obligation to pay for the agreed-upon service or commodity, irrespectively of actual use. The contracts' terms vary, with duration of up to 30 years.
Take-or-pay contracts for the purchase of commodity quantities are only included in the tables below if their contractually agreed pricing is of a nature that will or may deviate from the obtainable market prices for the commodity at the time of delivery.
Obligations payable by the group to entities accounted for using the equity method are included gross in the tables below. As regards assets (e.g. pipelines) that the group accounts for by including its share of assets, liabilities, income and expenses (capacity costs) on a line-by-line basis in the Consolidated financial statements, the amounts in the table include the net commitment payable by Statoil (gross commitment less Statoil's ownership share).
Nominal minimum commitments at 31 December 2009:
(in NOK million) | Transport and | Refinery related | Total |
2010 | 8,676 | 715 | 9,391 |
2011 | 8,266 | 740 | 9,006 |
2012 | 7,121 | 938 | 8,059 |
2013 | 6,898 | 955 | 7,853 |
2014 | 5,881 | 971 | 6,852 |
Thereafter | 37,558 | 21,670 | 59,228 |
| |||
Total | 74,400 | 25,989 | 100,389 |
The above table outlines nominal minimum obligations for future years, and mainly includes commitments within Statoil's natural gas operations in addition to various other transport and similar commitments. Statoil has entered into pipeline transportation for most of its prospective gas sales contracts. These agreements ensure the right to transport the production of gas through the pipelines, while also imposing an obligation to pay for booked capacity.
Statoil has contractual commitments to the US-based energy company Dominion for terminal capacity at the Cove Point liquefied natural gas terminal in the USA. At year end 2009 the commitment includes an annual capacity of approximately 10.1 bcm for a remaining period of 19 years. Such commitments have been included in full in the table above, but have been made in part on behalf of and for the account and risk of the SDFI. Statoil's and the SDFI's respective future shares of the Cove Point terminal capacity and related commitments depend on actual usage of the terminal. Statoil will cover substantially all the cost of unused capacity, if any, while the cost of used capacity will be split in proportion to the produced natural gas volumes of Statoil and the SDFI, respectively.
The Mongstad refinery has entered into a long-term take-or-pay contract related to purchase of heat from the Troll licence partners. The contract term expires in 2040, and future expected minimum annual obligations under this contract represents the most significant part of Refinery related commitments included in the table above.
Statoil has entered into a number of general or field specific long-term frame agreements mainly related to crude oil loading and transport capacity availability. The main contracts run up until the end of the respective field lives. Such contracts have not been included in the above table of contractual commitments unless they entail specific minimum payment obligations.
Guarantees
Statoil has guaranteed certain recoverable reserves of crude oil in the Veslefrikk field on the NCS as part of an asset exchange with Petro Canada in 1996. Under the guarantee, Statoil is obligated to deliver indemnity reserves to Petro Canada in the event that recoverable reserves prove lower than a specified volume. At year end the value of the remaining volume covered by the guarantee has been estimated to a total of NOK 1.7 billion. A provision of NOK 0.3 billion has been recognised at year end 2009 related to this guarantee.
Statoil has guaranteed for 50%, corresponding to its ownership percentage, of the contractual commitments entered into by Scira Offshore Energy Ltd. (Scira) in connection with the development of the Sheringham Shoal Offshore Wind Farm in the UK. Scira is included in the group financial statements using the equity method. At year end 2009 the maximum exposure under Statoil's guarantee has been estimated to NOK 3.0 billion. The carrying amount of the guarantee is immaterial.
Under the Norwegian public limited companies act section 14-11, Statoil and Norsk Hydro are jointly and severally liable for certain guarantee commitments entered into by Norsk Hydro prior to the merger between Statoil and Hydro Petroleum in 2007. The total amount Statoil is jointly liable for is approximately NOK 3.8 billion with terms extending until 2050. As of the current date, the probability that these guarantee commitments will impact Statoil is deemed to be remote. No liability has been recognised in the financial statements at year end 2009.
Insurance
The group has taken out insurance to cover certain potential liabilities arising from its operations world wide. This includes liabilities for claims arising from pollution damage. Most of the group's production installations are covered through Statoil Forsikring a.s, which reinsures parts of the risk in the international insurance market. As all significant activities of Statoil Forsikring a.s. relate to insurance for entities and operations consolidated in the group financial statements, IFRS 4 has not been applied to such activities in the group financial statements.
Statoil Forsikring a.s is member of two mutual insurance companies, Oil Insurance Ltd and sEnergy Insurance Ltd. sEnergy ceased operations on 15 May 2006 and the company is in the wind-up phase. Membership in these companies means that Statoil Forsikring is liable for its proportionate share of any losses which might arise in connection with the business operations of the companies. Members of the companies have joint and several liability for any losses that arise within the insurance pool.
Other commitments and contingencies
As a condition for being awarded oil and gas exploration and production licenses, participants may be committed to drill a certain number of wells. At the end of 2009, Statoil was committed to participate in 16 wells in Norway and 37 wells outside Norway, with an average ownership interest of approximately 40%. Statoil's share of estimated expenditures to drill these wells amounts to approximately NOK 9 billion. Additional wells that Statoil may become committed to participate in depending on future discoveries in certain licenses are not included in these numbers.
Statoil ASA issued a declaration to the Norwegian Ministry of Petroleum and Energy (MPE) in 1999 in connection with a dispute between four Åsgard partners and Statoil related to the construction of new facilities for the Åsgard development at the Kårstø Terminal. The declaration confirmed that the MPE will receive similar treatment as the four Åsgard partners with respect to the disputed issues. On the basis of the declaration, the MPE alleged the right to compensation and initiated legal proceedings against Statoil on 29 April 2008 in a writ involving a multi-component claim. The aggregate principal exposure for the claim is estimated to be between NOK 4 and 7 billion after tax. Following a verdict in Stavanger district court on 15 January 2010, Statoil and the MPE on 5 March 2010 reached an amicable settlement of the case in which both parties waived their rights to appeal the court verdict. Under the settlement Statoil agreed to pay the MPE a cash compensatio n of NOK 500 million after tax, and NOK 375 million in pre-tax interest, corresponding to NOK 270 million after tax.
During the fourth quarter of 2008 ExxonMobil, the final Åsgard partner at the time of the original dispute, issued a similar writ with a compensation claim approximating an estimated exposure of up to NOK 1 billion after tax. The dispute with ExxonMobil was settled in October 2009. The impact of this settlement on the Consolidated financial statements was not material.
Statoil was informed on 26 September 2007 of possible consultancy agreements and transactions associated with Hydro's petroleum activities in Libya, which were transferred to Statoil as of 1 October 2007 as part of the merger with Hydro Petroleum, and which could be in conflict with applicable Norwegian and US anti-corruption legislation. Following a preliminary assessment by Statoil, an external review of the relevant aspects was initiated. The external US and Norwegian legal counsels that have conducted the review delivered their report to Statoil ASA's CEO on 6 October 2008. The report has also been delivered to the National Authority for Investigation and Prosecution of Economic and Environmental Crime in Norway (Økokrim), the US Department of Justice, the US Securities and Exchange Commission and Libyan authorities. The report does not draw any legal conclusions. In accordance with the mandate for the review, the report entails the facts relevant to applicable Norwegian and US ant i-corruption legislation to which Statoil ASA may be subject as a result of the merger. Økokrim informed on 15 May 2009 that there will be no investigation related to the international activities of former Hydro Oil & Energy. Neither US authorities nor Libyan authorities have as of today initiated any steps in relation to the matters described in the investigation reports.
During the normal course of its business Statoil is involved in legal proceedings, and several other unresolved claims are currently outstanding. The ultimate liability or asset in respect of such litigation and claims cannot be determined at this time. Statoil has provided in its financial statements for probable liabilities related to litigation and claims based on the group's best judgement. Statoil does not expect that the financial position, results of operations or cash flows will be materially affected by the resolution of these legal proceedings.
8.1.29 Related parties
Transactions with the Norwegian State
The Norwegian State is the majority shareholder of Statoil and also holds major investments in other Norwegian companies. This ownership structure means that Statoil participates in transactions with many parties that are under a common ownership structure and therefore meet the definition of a related party. All transactions are considered to be on a normal arm's length basis.
The ownership interests of the Norwegian State in Statoil are administrated by the Norwegian Ministry of Petroleum and Energy (MPE). The following transactions with SDFI volumes were made between Statoil and MPE for the years presented:
Total purchases of oil and natural gas liquid from the Norwegian State amounted to NOK 74,338 million (204 million barrels oil equivalents), NOK 112,682 million (223 million barrels oil equivalents) and NOK 98,498 million (237 million barrels oil equivalents) in 2009, 2008 and 2007, respectively. Purchases of natural gas from the Norwegian State (excluding purchases from licenses) amounted to NOK 265 million, NOK 375 million and NOK 287 million in 2009, 2008 and 2007, respectively. The significant amounts included in the line item Payables to associated companies and other related parties in note 25 Trade and other payables, are amounts payable to the Norwegian State for these purchases.
The State's natural gas production, which Statoil is selling, in its own name, but for the Norwegian State's account and risk as well as related expenditures refunded by the State, are presented at net value in Statoil's financial statements.
Other transactions
In relation to its ordinary business operations such as pipeline transport, gas storage and processing of petroleum products, Statoil also has regular transactions with certain unconsolidated affiliated entities. Such transactions are carried out on an arm's length basis, and are included within the applicable captions in the Statements of income.
Compensation of key management personnel
The remuneration to key management personnel (members of board of directors and the corporate executive committee) during the year was as follows:
(in NOK thousand) | 2009 | 2008 | 2007 |
Current benefits | 50,573 | 50,949 | 44,463 |
Post-employment benefits | 11,391 | 12,534 | 12,764 |
Other non-current benefits | 137 | 129 | 111 |
Share based compensation benefits | 444 | 278 | 94 |
Total | 62,545 | 63,890 | 57,432 |
Loans to key management total less than NOK 0.2 million.
8.1.30 Financial instruments by category
Reclassification of derivative financial instruments
Statoil has, as further described in the Significant changes in accounting policies section of note 2 Significant accounting policies, in 2009 reclassified from current assets and liabilities to non-current assets and liabilities certain derivative financial instruments (mainly earn-out agreements, certain embedded derivative contracts and interest rate swap agreements) classified as held for trading in accordance with IAS 39 Financial instruments: Recognition and Measurement, as provided for in the amended version of IAS 1 Presentation of Financial Statements, which became effective 1 January 2009. This affects the classification between current and non-current assets and liabilities of the line items, "Derivative financial instruments". The following table sets forth the restatement of derivative financial instruments between current assets and liabilities and non-current assets and liabilities in the 31 December and 1 January 2008 balance sheets.
(in NOK million) | As earlier reported | Reclassification | As reclassified |
|
|
|
|
31 December 2008 |
|
|
|
Non-current assets |
|
|
|
Derivative financial instruments | 2,383 | 18,899 | 21,282 |
|
|
|
|
Total non-current assets | 433,611 | 18,899 | 452,510 |
|
|
|
|
Current assets |
|
|
|
Derivative financial instruments | 27,505 | (18,139) | 9,366 |
|
|
|
|
Total current assets | 144,812 | (18,139) | 126,673 |
|
|
|
|
TOTAL ASSETS | 578,423 | 760 | 579,183 |
|
|
|
|
|
|
|
|
Non-current liabilities |
|
|
|
Derivative financial instruments | 0 | 1,617 | 1,617 |
|
|
|
|
Total non-current liabilities | 202,647 | 1,617 | 204,264 |
|
|
|
|
Current liabilities |
|
|
|
Derivative financial instruments | 20,752 | (857) | 19,895 |
|
|
|
|
Total current liabilities | 159,721 | (857) | 158,864 |
|
|
|
|
|
|
|
|
TOTAL EQUITY AND LIABILITIES | 578,423 | 760 | 579,183 |
(in NOK million) | As earlier reported | Reclassified | As restated |
|
|
|
|
1 January 2008 |
|
|
|
Non-current assets |
|
|
|
Derivative financial instruments | 609 | 12,159 | 12,768 |
|
|
|
|
Total non-current assets | 353,428 | 12,159 | 365,587 |
|
|
|
|
Current assets |
|
|
|
Derivative financial instruments | 21,093 | (12,291) | 8,802 |
|
|
|
|
Total current assets | 129,790 | (12,291) | 117,499 |
|
|
|
|
TOTAL ASSETS | 483,218 | (132) | 483,086 |
|
|
|
|
|
|
|
|
Non-current liabilities |
|
|
|
Derivative financial instruments | 0 | 27 | 27 |
|
|
|
|
Total non-current liabilities | 174,788 | 27 | 174,815 |
|
|
|
|
Current liabilities |
|
|
|
Derivative financial instruments | 7,632 | (159) | 7,473 |
|
|
|
|
Total current liabilities | 129,363 | (159) | 129,204 |
|
|
|
|
|
|
|
|
TOTAL EQUITY AND LIABILITIES | 483,218 | (132) | 483,086 |
Financial instruments by IAS 39 category
The following tables provide a view of financial instruments and their carrying amounts as defined by IAS 39 categories. All financial instruments' carrying amounts are measured at fair value or their carrying amounts reasonably approximate fair value except non-current financial liabilities. See note 22 Non-current financial liabilities for fair value information of non-current financial liabilities.
See also note 2 Significant accounting policies for further information regarding measurement of fair values.
|
|
|
| Fair value through profit or loss |
|
| ||||
|
|
|
|
|
|
|
|
|
| Total |
|
| Loans and | Available- | Held for |
| Hedge |
| Fair value | Non-financial | carrying |
(in NOK million) | Note | receivables | for-sale | trading |
| accounting |
| option | assets | amount |
|
|
|
|
|
|
|
|
|
|
|
31 December 2009 |
|
|
|
|
|
|
|
|
|
|
Assets |
|
|
|
|
|
|
|
|
|
|
Non-current financial investments | 16 | - | 2,223 | - |
| - |
| 11,044 | - | 13,267 |
Non-current derivative financial instruments | 31 | - | - | 17,644 |
| - |
| - | - | 17,644 |
Non-current financial receivables | 16 | 3,164 | - | - |
| - |
| - | 2,583 | 5,747 |
|
|
|
|
|
|
|
|
|
|
|
Current trade and other receivables | 18 | 53,007 | - | - |
| - |
| - | 5,888 | 58,895 |
Current derivative financial instruments | 31 | - | - | 5,369 |
| - |
| - | - | 5,369 |
Current financial investments | 19 | 55 | - | 1,962 |
| - |
| 5,005 | - | 7,022 |
Cash and cash equivalents | 20 | 24,723 | - | - |
| - |
| - | - | 24,723 |
Total |
| 80,949 | 2,223 | 24,975 |
| - |
| 16,049 | 8,471 | 132,667 |
|
|
|
| Fair value through profit or loss |
|
| ||||
|
|
|
|
|
|
|
|
|
| Total |
|
| Loans and | Available- | Held for |
| Hedge |
| Fair value | Non-financial | carrying |
(in NOK million) | Note | receivables | for-sale | trading |
| accounting |
| option | assets | amount |
|
|
|
|
|
|
|
|
|
|
|
31 December 2008 |
|
|
|
|
|
|
|
|
|
|
Assets |
|
|
|
|
|
|
|
|
|
|
Non-current financial investments | 16 | - | 4,164 | - |
| - |
| 12,301 | - | 16,465 |
Non-current derivative financial instruments | 31 | - | - | 18,899 |
| 2,383 |
| - | - | 21,282 |
Non-current financial receivables | 16 | 2,771 | - | - |
| - |
| - | 2,143 | 4,914 |
|
|
|
|
|
|
|
|
|
|
|
Current trade and other receivables | 18 | 66,644 | - | - |
| - |
| - | 3,287 | 69,931 |
Current derivative financial instruments | 31 | - | - | 9,297 |
| 69 |
| - | - | 9,366 |
Current financial investments | 19 | 15 | - | 7,874 |
| - |
| 1,858 | - | 9,747 |
Cash and cash equivalents | 20 | 18,638 | - | - |
| - |
| - | - | 18,638 |
Total |
| 88,068 | 4,164 | 36,070 |
| 2,452 |
| 14,160 | 5,430 | 150,343 |
|
|
|
| Fair value through profit or loss |
|
| ||||
|
|
|
|
|
|
|
|
|
| Total |
|
| Loans and | Available- | Held for |
| Hedge |
| Fair value | Non-financial | carrying |
(in NOK million) | Note | receivables | for-sale | trading |
| accounting |
| option | assets | amount |
|
|
|
|
|
|
|
|
|
|
|
1 January 2008 |
|
|
|
|
|
|
|
|
|
|
Assets |
|
|
|
|
|
|
|
|
|
|
Non-current financial investments | 16 | - | 3,291 | - |
| - |
| 11,975 | - | 15,266 |
Non-current derivative financial instruments | 31 | - | - | 12,159 |
| 609 |
| - | - | 12,768 |
Non-current financial receivables | 16 | 3,515 | - | - |
| - |
| - | - | 3,515 |
|
|
|
|
|
|
|
|
|
|
|
Current trade and other receivables | 18 | 69,378 | - | - |
| - |
| - | - | 69,378 |
Current derivative financial instruments | 31 | - | - | 8,760 |
| 42 |
| - | - | 8,802 |
Current financial investments | 19 | - | - | 3,359 |
| - |
| - | - | 3,359 |
Cash and cash equivalents | 20 | 18,264 | - | - |
| - |
| - | - | 18,264 |
Total |
| 91,157 | 3,291 | 24,278 |
| 651 |
| 11,975 | - | 131,352 |
|
|
|
|
|
|
|
(in NOK million) | Note | Amortised cost | Hedge accounting | Fair value through profit or loss | Non-financial liabilities | Total carrying amount |
|
|
|
|
|
|
|
31 December 2009 |
|
|
|
|
|
|
Liabilities |
|
|
|
|
|
|
Non-current financial liabilities | 22 | 95,962 | - | - | - | 95,962 |
Non-current derivative financial instruments | 31 | - | - | 1,657 | - | 1,657 |
|
|
|
|
|
|
|
Current trade and other payables | 25 | 58,048 | - | - | 1,753 | 59,801 |
Current financial liabilities | 26 | 8,150 | - | - | - | 8,150 |
Current derivative financial instruments | 31 | - | - | 2,860 | - | 2,860 |
Total |
| 162,160 | - | 4,517 | 1,753 | 168,430 |
(in NOK million) | Note | Amortised cost | Hedge accounting | Fair value through profit or loss | Non-financial liabilities | Total carrying amount |
|
|
|
|
|
|
|
31 December 2008 |
|
|
|
|
|
|
Liabilities |
|
|
|
|
|
|
Non-current financial liabilities | 22 | 52,065 | 2,541 | - | - | 54,606 |
Non-current derivative financial instruments | 31 | - | - | 1,617 | - | 1,617 |
|
|
|
|
|
|
|
Current trade and other payables | 25 | 58,990 | - | - | 2,210 | 61,200 |
Current financial liabilities | 26 | 20,695 | - | - | - | 20,695 |
Current derivative financial instruments | 31 | - | - | 19,895 | - | 19,895 |
Total |
| 131,750 | 2,541 | 21,512 | 2,210 | 158,013 |
|
|
|
|
| ||
(in NOK million) | Note | Amortised cost | Hedge accounting | Fair value through profit or loss | Non-financial liabilities | Total carrying amount |
|
|
|
|
|
|
|
1 January 2008 |
|
|
|
|
|
|
Liabilities |
|
|
|
|
|
|
Non-current financial liabilities | 22 | 43,649 | 724 | - | - | 44,373 |
Non-current derivative financial instruments | 31 | - |
| 27 | - | 27 |
|
|
|
|
|
|
|
Current trade and other payables | 25 | 64,624 | - | - | - | 64,624 |
Current financial liabilities | 26 | 6,166 | - | - | - | 6,166 |
Current derivative financial instruments | 31 | - | - | 7,473 | - | 7,473 |
Total |
| 114,439 | 724 | 7,500 | - | 122,663 |
The following tables include amounts from the Consolidated statements of income related to financial instruments.
| Fair value through profit or loss |
|
|
|
|
| ||
|
|
|
|
| Financial | Available- | Non-financial |
|
| Held for | Hedge | Fair value | Loans & | liabilities at | for-sale | assets or |
|
(in NOK million) | trading | accounting | option | receivables | amortised cost | assets | liabilities | Total |
|
|
|
|
|
|
|
|
|
For the year ended 31 December 2009 |
|
|
|
|
|
|
|
|
Net operating income | 12,337 | - | - | - | - | (159) | 109,462 | 121,640 |
|
|
|
|
|
|
|
|
|
Net financial items |
|
|
|
|
|
|
|
|
Net foreign exchange gains (losses) | 16,661 | - | - | (10,568) | (4,076) | - | (24) | 1,993 |
| - | - | - | - | - | - | - |
|
Interest income | 1,290 | - | 326 | 1,088 | - | - | - | 2,704 |
Other financial items | 518 | - | 403 | 111 | - | (28) | - | 1,004 |
Interest income and other financial items | 1,808 | - | 729 | 1,199 | - | (28) | - | 3,708 |
|
|
|
|
|
|
|
|
|
Interest expenses | 2,123 | - | - | - | (3,748) | - | - | (1,625) |
Impairment loss recognised | - | - | - | - | - | (1,404) | - | (1,404) |
Other financial expenses | (6,807) | - | - | - | (183) | - | (2,432) | (9,422) |
Interest and other financial expenses | (4,684) | - | - | - | (3,931) | (1,404) | (2,432) | (12,451) |
|
|
|
|
|
|
|
|
|
Net financial items | 13,785 | - | 729 | (9,369) | (8,007) | (1,432) | (2,456) | (6,750) |
|
|
|
|
|
|
|
|
|
Total | 26,122 | - | 729 | (9,369) | (8,007) | (1,591) | 107,006 | 114,890 |
| Fair value through profit or loss |
|
|
|
|
| ||
|
|
|
|
| Financial | Available- | Non-financial |
|
| Held for | Hedge | Fair value | Loans & | liabilities at | for-sale | assets or |
|
(in NOK million) | trading | accounting | option | receivables | amortised cost | assets | liabilities | Total |
|
|
|
|
|
|
|
|
|
|
|
|
|
|
|
|
|
|
For the year ended 31 December 2008 |
|
|
|
|
|
|
|
|
Net operating income | 19,917 | - | - | - | - | (346) | 179,261 | 198,832 |
|
|
|
|
|
|
|
|
|
Net financial items |
|
|
|
|
|
|
|
|
Net foreign exchange gains (losses) | (24,266) | - | - | 3,848 | (12,145) | - | - | (32,563) |
|
|
|
|
|
|
|
|
|
Interest income | 3,230 | - | 437 | 3,392 | - | - | - | 7,059 |
Other financial items | 6,006 | - | (971) | 52 | - | 61 | - | 5,148 |
Interest income and other financial items | 9,236 | - | (534) | 3,444 | - | 61 | - | 12,207 |
|
|
|
|
|
|
|
|
|
Interest expenses | 959 | - | - | - | (2,243) | - |
| (1,284) |
Other financial expenses | 5,660 | (27) | - | - | (251) | - | (2,107) | 3,275 |
Interest and other financial expenses | 6,619 | (27) | - | - | (2,494) | - | (2,107) | 1,991 |
|
|
|
|
|
|
|
|
|
Net financial items | (8,411) | (27) | (534) | 7,292 | (14,639) | 61 | (2,107) | (18,365) |
|
|
|
|
|
|
|
|
|
Total | 11,506 | (27) | (534) | 7,292 | (14,639) | (285) | 177,154 | 180,467 |
| Fair value through profit or loss |
|
|
|
|
| ||
|
|
|
|
| Financial | Available- | Non-financial |
|
| Held for | Hedge | Fair value | Loans & | liabilities at | for-sale | assets or |
|
(in NOK million) | trading | accounting | option | receivables | amortised cost | assets | liabilities | Total |
|
|
|
|
|
|
|
|
|
|
|
|
|
|
|
|
|
|
For the year ended 31 December 2007 |
|
|
|
|
|
|
|
|
Net operating income | (2,043) | - | - | - | - | 129 | 139,118 | 137,204 |
|
|
|
|
|
|
|
|
|
Net financial items |
|
|
|
|
|
|
|
|
Net foreign exchange gains (losses) | 9,092 | - | - | (8,516) | 9,467 | - | - | 10,043 |
|
|
|
|
|
|
|
|
|
Interest income | 234 | - | 281 | 1,390 | - | - | - | 1,905 |
Other financial items | (313) | - | (185) | 541 | - | 357 | - | 400 |
Interest income and other financial items | (79) | - | 96 | 1,931 | - | 357 | - | 2,305 |
|
|
|
|
|
|
|
|
|
Interest expenses | (379) | - | - | - | (584) | - |
| (963) |
Other financial expenses | 504 | 9 | - | - | (192) | - | (2,099) | (1,778) |
Interest and other financial expenses | 125 | 9 | - | - | (776) | - | (2,099) | (2,741) |
|
|
|
|
|
|
|
|
|
Net financial items | 9,138 | 9 | 96 | (6,585) | 8,691 | 357 | (2,099) | 9,607 |
|
|
|
|
|
|
|
|
|
Total | 7,095 | 9 | 96 | (6,585) | 8,691 | 486 | 137,019 | 146,811 |
8.1.31 Financial instruments: measurement and market risk sensitivities
Fair value hedges
The fair value hedge relationships for which Statoil in 2007 and 2008 applied hedge accounting have been discontinued since the group revoked the designation in the first quarter of 2009. The fair value adjustment total of NOK 2.5 billion recognised in the Consolidated balance sheet at 31 December 2008 is being amortised over the remaining duration, 14 to 19 years, of the loans that were originally identified as hedging objects in these hedge relationships.
Fair value measurement of financial instruments
Derivative financial instruments
Statoil recognises all derivative financial instruments in the balance sheet at fair value. Changes in the fair value of the derivative financial instruments are recognised in the Statement of income, within Revenues or within Net financial items, respectively, depending on their nature as commodity based derivative contracts or interest rate and foreign exchange rate derivative instruments.
When calculating fair value of derivative financial instruments Statoil uses prices quoted in an active market for identical assets to the extent possible. When such prices are not available Statoil uses inputs that are observable either directly or indirectly. The valuation techniques most frequently used by Statoil when valuing derivative financial instruments are mark to market calculation or a net present value calculation of expected future cash flows. For more information about the methodology and assumption used when calculating the fair value of Statoil's derivative financial instruments see note 2 Significant accounting policies.
The following table contains the estimated fair values and net carrying amounts of Statoil's derivative financial instruments. Of the total ending balance at 31 December 2009 NOK 13.0 billion relates to certain earn-out agreements and embedded derivatives recognised as derivative financial instruments in accordance with IAS 39. At the end of 2008 the estimated fair value of these agreements was NOK 9.4 billion.
(in NOK million) | Fair value of assets | Fair value of liabilities | Net carrying amount |
|
|
|
|
At 31 December 2009 |
|
|
|
Debt-related instruments | 6,405 | (1,708) | 4,697 |
Non-debt-related instruments | 347 | (867) | (520) |
Crude oil and refined products | 8,034 | (842) | 7,192 |
Natural gas and electricity | 8,227 | (1,100) | 7,127 |
Total | 23,013 | (4,517) | 18,496 |
|
|
|
|
At 31 December 2008 |
|
|
|
Debt-related instruments | 13,083 | (989) | 12,094 |
Non-debt-related instruments | 403 | (14,032) | (13,629) |
Crude oil and refined products | 13,136 | (2,491) | 10,645 |
Natural gas and electricity | 4,026 | (4,000) | 26 |
Total | 30,648 | (21,512) | 9,136 |
Financial investments
Statoil recognises all financial investments in the balance sheet at fair value. Statoil's financial investments consist of the portfolios held by the group's captive insurance company (mainly bonds, listed equity securities and commercial papers) and investments in money market funds held for liquidity management purposes. The group also holds some other non-listed equity securities for long term strategic purposes. These are classified as available-for-sale assets (AFS). Changes in fair value of the financial investments are recognised in the Statement of income within Net financial items, with the exception of the investments that are classified as AFS assets. Changes in fair value of these investments are recognised in the Statement of comprehensive income, while any impairment losses are recognised in the Statement of income within Net financial items.
When calculating fair value of financial investments, the group uses prices quoted in an active market for identical assets to the extent possible. This will typically be for listed equity securities and government bonds. Where there is no active market, fair value is determined using valuation techniques such as net present value calculations of expected future cash flows. For more information about methodology and assumptions used when calculating fair value of the group's financial investments see note 2 Significant accounting policies. For information about fair values of the group's financial investments recognised in the balance sheet see note 16 Non-current financial assets and note 19 Current financial investments.
Fair value hierarchy
The following table summarises each class of financial instruments which are recognised in the balance sheet at fair value, split by the group's basis for fair value measurement.
(in NOK million) | Non-current financial investment | Non-current derivative financial instruments-assets | Current financial investments | Current derivative financial instruments-assets | Non-current derivative financial instruments-liabilities | Current derivative financial instruments-liabilities | Net fair value |
|
|
|
|
|
|
|
|
At 31 December 2009 |
|
|
|
|
|
|
|
Fair value based on prices quoted in an active market for identical assets or liabilities (Level 1) | 6,663 | 0 | 4,339 | 42 | 0 | (18) | 11,026 |
Fair value based on price inputs other than quoted prices but are from observable market transactions (Level 2) | 4,683 | 6,191 | 2,683 | 3,827 | (1,657) | (2,756) | 12,971 |
Fair value based on unobservable inputs (Level 3) | 1,921 | 11,453 | 0 | 1,500 | 0 | (86) | 14,788 |
Total fair value | 13,267 | 17,644 | 7,022 | 5,369 | (1,657) | (2,860) | 38,785 |
|
|
|
|
|
|
|
|
|
|
|
|
|
|
|
|
At 31 December 2008 |
|
|
|
|
|
|
|
Fair value based on prices quoted in an active market for identical assets or liabilities (Level 1) | 6,402 | 0 | 1,744 | 399 |
| (544) | 8,001 |
Fair value based on price inputs other than quoted prices but are from observable market transactions (Level 2) | 6,575 | 12,430 | 8,003 | 7,648 | (857) | (19,260) | 14,539 |
Fair value based on unobservable inputs (Level 3) | 3,488 | 8,852 | 0 | 1,319 | (760) | (91) | 12,808 |
Total fair value | 16,465 | 21,282 | 9,747 | 9,366 | (1,617) | (19,895) | 35,348 |
The first level in the above table, Fair value based on prices quoted in an active market for identical assets or liabilities, includes financial instruments actively traded and for which the values recognised in Statoil's balance sheet are calculated based on observable prices on identical instruments. This category will, in most cases, only be relevant for exchange traded financial instruments.
The second level in the above table, Fair value based on price inputs, other than quoted prices, which are derived from observable market transactions, includes Statoil's non-standardised contracts for which fair values are calculated on the basis of price inputs from observable market transactions. This will typically be when the group uses forward prices on crude oil, natural gas, interest rates, and foreign exchange rates as inputs to the valuation models.
The third level in the above table, Fair value based on unobservable inputs, includes financial instruments for which fair values are calculated on the basis of input and assumptions that are not from observable market transactions. The fair values presented in this category are mainly based on internal assumptions. The internal assumptions are only used in the absence of quoted prices from an active market or other observable price inputs for the financial instruments subject to the valuation.
The major part of the fair value of certain earn-out agreements and embedded derivative contracts are calculated with price inputs from observable market transactions. They have been classified in their entirety in the third category within Current and Non-current derivative financial instruments - assets in the above table, as the value is partly derived from internally generated assumptions. Another reasonable assumption, which could have been used when calculating the fair value of these contracts, could be to extrapolate the last observed forward prices. By extrapolating the forward curves with inflation, the fair value of the contracts included would have increased by approximately NOK 1.5 billion. Such a change in fair value would have been recognised in the Statement of income.
The reconciliation of the changes in fair value during 2009 for all financial assets and liabilities classified in the third level in the hierarchy are presented in the following table.
(in NOK million) | Non-current financial investment | Non-current derivative financial instruments-assets | Current derivative financial instruments-assets | Non-current derivative financial instruments-liabilities | Current derivative financial instruments-liabilities |
|
|
|
|
|
|
For the year ended 31 December 2009 |
|
|
|
| |
Opening balance | 3,488 | 8,852 | 1,319 | (760) | (91) |
Total gains and losses recognised |
|
|
|
|
|
- in income statement | (1,499) | 2,601 | 1,500 | 760 | (86) |
- in other comprehensive income | 0 | 0 | 0 | 0 | 0 |
Purchases | 941 | 0 | 0 | 0 | 0 |
Settlement | (327) | 0 | (1,319) | 0 | 91 |
Transfer into level 3 | 307 | 0 | 0 | 0 | 0 |
Transfer out of level 3 | (989) | 0 | 0 | 0 | 0 |
Closing balance | 1,921 | 11,453 | 1,500 | 0 | (86) |
Practically all gains and losses recognised in the Statement of income during 2009 are related to assets and liabilities held by the group at the end of 2009.
Certain divestment requirements were set out by the European Commission (EC) in relation to Statoil's acquisition of the Jet automated petrol retail station network in 2008. As a consequence the investment was classified as an available for sale asset at end 2008. During 2009 the divestment requirements have been fulfilled. By end of 2009 the remaining Jet activity is fully consolidated and the values previously included in level 3 in the above table have been transferred out.
Market risk sensitivities
Commodity price risk
The table below contains the fair value and related commodity price risk sensitivities of Statoil's commodity based derivatives contracts. For further information related to the type of commodity risks and how the group manages these risks see note 6 Financial risk management.
Statoil's assets and liabilities resulting from commodity based derivatives contracts are mainly related to non-exchange traded derivative instruments, including embedded derivatives that in accordance with IAS 39 have been bifurcated and recognised with fair value in the balance sheet.
Price risk sensitivities by end of 2009 have been calculated by assuming a 30% change in crude oil, refined products and electricity prices, and 50% for natural gas prices. Compared to the sensitivities calculated by end of 2008 and 2007, the group's assessment of what are reasonably possible changes in the commodity prices for the coming year, have been changed following an assessment of the recent developments in the markets in which Statoil operates. By end of 2008 and 2007 these sensitivities were calculated by assuming a 50% and 10% change respectively.
Since none of the derivative financial instruments included in the table below are part of hedging relationships, any changes in the fair value will be recognised in the Statement of income.
(in NOK million) | Net fair | -30% sensitivity | 30% sensitivity |
|
|
|
|
At 31 December 2009 |
|
|
|
Crude Oil and Refined Products | 7,192 | (2,087) | 1,580 |
|
|
|
|
|
| -50% / -30% sensitivity | 50% / 30% sensitivity |
At 31 December 2009 |
|
|
|
Natural Gas and Electricity | 7,127 | 3,871 | (3,886) |
|
|
|
|
|
| -50% sensitivity | 50% sensitivity |
At 31 December 2008 |
|
|
|
Crude Oil and Refined Products | 10,645 | (4,124) | 4,440 |
Natural Gas and Electricity | 26 | 3,447 | (3,431) |
|
|
|
|
|
| -10% sensitivity | 10% sensitivity |
At 31 December 2007 |
|
|
|
Crude Oil and Refined Products | 8,582 | (651) | 652 |
Natural Gas and Electricity | (702) | 1,530 | (1,522) |
As part of the tools to monitor and manage risk, the group uses the value at risk (VaR) method for certain parts of its commodity trading activity within the Natural Gas and Manufacturing and Marketing segments.
Oil sales, trading and supply (OTS), within the Manufacturing and Marketing segment, uses the historical simulation method where daily percentage market price and volatility changes for all significant products in the OTS portfolio over a given time period are applied to the current portfolio value, in order to estimate a probability distribution of future market value changes for the portfolio. Non-linear instruments such as options are revalued on a daily basis over the simulation interval using the historical price and volatility inputs; and the daily historical value changes are an integral part of the portfolio value changes. The relationship between VaR estimates and actual portfolio value changes are monitored on a monthly basis using a 12 month rolling observation window and input parameters such as simulation intervals are recalibrated when model performance moves outside acceptable bounds.
The Natural Gas segment mainly measures its market risk exposure using a variance/covariance VaR method. Furthermore a 95% confidence interval and a one day holding period is applied. The variance/covariance method is applied to the current portfolio in order to quantify portfolio movements caused by possible future changes in the market prices over a 24-hour holding period. The variance/covariance method calculates the VaR as a function of standard deviation per instrument in the portfolio and the correlation between the instruments. The practical understanding is that there is a 95% probability that the value of the portfolio will change by less than the calculated VaR number during the next trading day. VaR does not quantify the worst case loss.
The variance/covariance method calculates the VaR as a function of the standard deviation per instrument in the portfolio and the correlation between the instruments. The historical simulation method derives daily percentage market price and volatility changes for all significant products in the portfolio over a given time period and apply those to the current portfolio value, in order to estimate a probability distribution of future market value changes for the portfolio. Different VaR-methods are used within OTS and the Natural Gas segment to best reflect the nature of the relevant commodity markets.
Within OTS all physical and financial contracts that are managed together for risk management purposes are subject to VaR limits, independently of how they are recognised in Statoil's Consolidated balance sheet. Within Natural Gas embedded derivatives as well as certain physical forward contracts recognised as derivative financial instrument that are not held as part of a trading position are not included in the portfolio subject to VaR limits.
The calculated VaR numbers for 2009 and 2008 and a summary of the assumptions used are presented in the following table.
(in NOK million) | High | Low | Average |
|
|
|
|
For the year ended 31 December 2009 |
|
|
|
Crude Oil and Refined Products | 189 | 42 | 103 |
Natural Gas and Electricity | 219 | 8 | 80 |
|
|
|
|
For the year ended 31 December 2008 |
|
|
|
Crude Oil and Refined Products | 143 | 28 | 79 |
Natural Gas and Electricity | 218 | 40 | 116 |
|
|
|
|
|
|
|
|
Assumptions used | Method used | Confidence level | Holding period |
|
|
|
|
Crude Oil and Refined Products | Historical simulation VaR | 95% | 1 day |
Natural Gas and Electricity | Variance/Covariance | 95% | 1 day |
Interest rate and currency risk
Interest rate and currency risks constitute significant financial risks for the Statoil group. Total exposure is managed at a portfolio level, in accordance with approved strategies and mandates, on a regular basis. For further information related to the interest and currency risks and how the group manages these risks see note 6 Financial risk management.
By end of 2009 the following currency risk sensitivities have been calculated by assuming a 12 % change in foreign exchange rates that the group is exposed to. Compared to the sensitivities calculated by end of 2008 and 2007 the group's assessment of what are reasonably possible changes in foreign exchange rates for the coming year have been changed. By end of 2008 and 2007 a 20% and a 10% change respectively, was assumed in the calculation.
As of 1 January 2009 Statoil ASA's functional currency changed from NOK to USD, see note 1 Organisation. The change of functional currency has impacted the currency risk sensitivities when comparing 2009 with previous years.
(in NOK million) |
| USD | EUR | GBP | CAD | NOK | SEK | DKK |
At 31 December 2009 |
|
|
|
|
|
|
| |
Net gains (losses) (12% sensitivity) | (3,589) | (323) | 365 | (299) | 2,423 | 558 | 861 | |
Net gains (losses) (-12% sensitivity) | 3,589 | 323 | (365) | 299 | (2,423) | (558) | (861) | |
At 31 December 2008 |
|
|
|
|
|
|
| |
Net gains (losses) (20% sensitivity) | (31,369) | (11,906) | 11 | (170) | 39,856 | 1,976 | 1,636 | |
Net gains (losses) (-20% sensitivity) | 31,369 | 11,906 | (11) | 170 | (39,856) | (1,976) | (1,636) | |
| ||||||||
At 31 December 2007 |
|
|
|
|
|
|
| |
Net gains (losses) (10% sensitivity) | (9,391) | (3,541) | 926 | (297) | 11,567 | 129 | 591 | |
Net gains (losses) (-10% sensitivity) | 9,391 | 3,541 | (926) | 297 | (11,567) | (129) | (591) | |
For the interest rate risk sensitivity a 1.5 percentage point change in the interest rates have been used in the calculation. Compared to the sensitivities calculated by end of 2008 and 2007 Statoil's assessment of what are reasonably possible changes in interest rates that the group is exposed to for the coming year has been changed. By end of 2008 and 2007 a one percentage point change in the interest rates was used. The estimated gains following from a decline in the interest rates and the estimated losses following from an interest rate increases that would impact the Statement of income are presented in the following table.
(in NOK million) | Gains | Losses |
At 31 December 2009 |
|
|
Interest rate risk (1.5 percentage point sensitivity) | 8,456 | (8,456) |
| ||
At 31 December 2008 |
|
|
Interest rate risk (1 percentage point sensitivity) | 3,395 | (3,395) |
At 31 December 2007 |
|
|
Interest rate risk (1 percentage point sensitivity) | 2,714 | (2,714) |
Equity risk
The following table contains the fair value and related equity price risk sensitivity of Statoil's listed and non-listed equity securities. The equity price risk sensitivity has been calculated based on what Statoil views to be reasonably possible changes in the equity prices for the coming year. For 2009, as for 2008, the group's view is a 20% and 40% change in the equity price for the listed and non-listed equity securities respectively. In 2007 a 10% change in the equity price was used.
For the listed equity securities changes in fair values would be recognised as gains or losses in the Statement of income. While for the non-listed equity securities that are classified as available for sale assets, a decline in the fair value would be recognised in the Statement of income as an impairment loss, while an increase in the fair value would be recognised in Other comprehensive income.
|
|
|
|
(in NOK million) | Fair value | -20% sensitivity | 20% sensitivity |
At 31 December 2009 |
|
|
|
Listed equity securities | 4,318 | (864) | 864 |
|
|
|
|
At 31 December 2008 |
|
|
|
Listed equity securities | 2,276 | (455) | 455 |
|
| -40% | 40% |
(in NOK million) | Fair value | sensitivity | sensitivity |
At 31 December 2009 |
|
|
|
Non-listed equity securities | 2,223 | (889) | 889 |
|
|
|
|
At 31 December 2008 |
|
|
|
Non-listed equity securities | 4,205 | (1,682) | 1,682 |
|
|
|
|
(in NOK million) | Fair value | -10% sensitivity | 10% sensitivity |
| |||
At 31 December 2007 |
|
|
|
Listed equity securities | 4,230 | (423) | 423 |
Non-listed equity securities | 3,291 | (329) | 329 |
8.1.32 Merger with Hydro Petroleum
The shareholders of Statoil ASA and Norsk Hydro ASA (Hydro) at extraordinary General Meetings on 5 July 2007 approved a merger between Statoil ASA and the oil and gas activities of Norsk Hydro ASA (Hydro Petroleum). The merger was effective 1 October 2007.
As a result of the merger in 2007 Statoil's share capital increased by NOK 2,606,655,590 from NOK 5,364,962,167.50 to NOK 7,971,617,757.50 from the issuing of 1,042,662,236 shares with a nominal value of NOK 2.50 to Hydro's shareholders. Hydro's shareholders received 0.8622 shares in the merged company for each Hydro share. After the increase Hydro's shareholders held 32.7% and former Statoil's shareholders held 67.3% of the merged company, Statoil ASA.
Given that both Statoil ASA and Norsk Hydro ASA were under the control of the Norwegian State, the merger was accounted for as a business combination between entities under common control. Management concluded that for a merger of entities under common control, the most meaningful portrayal for accounting purposes was to combine Statoil and Hydro Petroleum using the carrying amounts of assets and liabilities and restating the financial statements for all periods presented as if the companies had always been combined. Consistent with this accounting treatment, the financial statements of Hydro Petroleum were adjusted to conform to the accounting policies of Statoil ASA for the tax benefit of uplift in Norway, the sales method of accounting for revenues for over- and underlift in the production of oil and gas and pension accounting. The combined impact of these changes was to decrease net equity by approximately NOK 3 billion for the year ended 31 December 2006.
Under provisions of the merger plan, an inter-company balance was established between former Statoil and Norsk Hydro ASA as of 31 December 2006 that provides that debt less cash and short term investments of Hydro Petroleum be set at a defined level by an adjustment to a merger payable or receivable between the companies. This resulted in Statoil having a merger receivable from Norsk Hydro ASA that was included in the 2007 cash flows upon its settlement.
Hydro Petroleum was not a separate legal entity from Hydro and, therefore, had combined cash and equity balances with Hydro. As a consequence in accounting for the merger, certain cash flows to or from Hydro were treated as equity distributions or injections to or from Hydro. This is reflected in the Consolidated statements of cash flows as "Norsk Hydro ASA merger balance" and in the Consolidated shareholders equity of Statoil as "Merger related adjustments", see the Consolidated statement of changes in equity.
Statoil, subsequent to the merger, recorded a total expense in 2007 of NOK 10.7 billion before tax related to restructuring expenses and other expenses related to the merger. The major part of these expenses was related to pensions and early retirement packages offered to employees in Statoil ASA above the age of 58 years (contingent upon certain conditions).
8.1.33 Subsequent events
Statoil's board of directors has approved a proposal to create a stand-alone Energy & Retail (E&R) business through an initial public offering (IPO) on the Oslo Stock Exchange. The IPO will take place at the earliest in the fourth quarter of 2010 or at a time when the capital market is deemed favourable for such an offering.
Statoil intends to remain a majority shareholder of E&R at the time of the initial public offering and listing. The size and time horizon of Statoil's future ownership in E&R will be tailored to support and develop company value both for E&R and for the Statoil Group.
8.1.34 Condensed consolidating financial information related to guaranteed debt securities issued by parent company
At 31 December 2008, Statoil's oil and gas activities and net assets on the Norwegian Continental Shelf (NCS) were owned by Statoil ASA and by Statoil Petroleum AS. With effect from 1 January 2009, Statoil ASA has transferred the ownership of its NCS net assets to Statoil Petroleum AS, a 100% owned operating subsidiary. Following the transfer, all NCS net assets are owned by Statoil Petroleum AS. Effective from the same date, Statoil Petroleum AS became the co-obligor of certain existing debt securities of Statoil ASA that are registered under the US Securities Act of 1933 ("US registered debt securities"). As co-obligor, Statoil Petroleum AS fully, unconditionally and irrevocably assumes and agrees to perform, jointly and severally with Statoil ASA, the payment and covenant obligations for these US registered debt securities. In addition, Statoil ASA also became the co-obligor of a US registered debt security of Statoil Petroleum AS. As co-obligor, Statoil ASA fully, unconditionall y and irrevocably assumes and agrees to perform, jointly and severally with Statoil Petroleum AS, the payment and covenant obligations of that security.
During 2009, Statoil ASA issued three additional US registered debt securities which are fully and unconditionally guaranteed by Statoil Petroleum AS, with Statoil Petroleum AS being the sole guarantor of such securities. In the future, Statoil ASA may issue future US registered debt securities from time to time for which debt securities Statoil Petroleum AS will be the co-obligor or guarantor.
The following financial information on a condensed consolidating basis provides investors with financial information about Statoil ASA, as issuer and co-obligor, Statoil Petroleum AS, as co-obligor and guarantor, and all other subsidiaries as required by SEC Rule 3-10 of Regulation S-X. The transfer of ownership of the NCS net assets from Statoil ASA to Statoil Petroleum AS was a common control transaction. Statoil ASA accounts for common control transactions by recognising the carrying amounts of assets and liabilities transferred and restating the financial statements for all periods presented to reflect the transaction as if it occurred at the beginning of the periods presented. The condensed consolidating information presented below reflects the transfer of NCS assets to the Statoil Petroleum AS for all periods presented. The condensed consolidating information is prepared in accordance with the group's IFRS accounting policies as described in note 2 Significant accounting policies, excep t that investments in subsidiaries are accounted for using the equity method as required by Rule 3-10.
The following is condensed consolidated financial information as of 31 December, 2009 and 2008 and for the years ended 31 December 2009, 2008 and 2007.
CONSOLIDATED STATEMENT OF INCOME |
|
|
|
|
|
|
|
|
| ||
| Statoil ASA | Statoil Petroleum AS | Other subsidiaries | Consolidation adjustments |
|
2009 (in NOK million) | Group | ||||
|
|
|
|
|
|
REVENUES AND OTHER INCOME |
|
|
|
|
|
Revenues | 313,684 | 195,318 | 155,555 | ( 202,265) | 462,292 |
Net income from associated companies | 28,187 | ( 3,693) | 3,313 | ( 26,029) | 1,778 |
Other income | 5 | 1,121 | 237 | 0 | 1,363 |
|
|
|
|
|
|
Total revenues and other income | 341,876 | 192,746 | 159,105 | ( 228,294) | 465,433 |
|
|
|
|
|
|
OPERATING EXPENSES |
|
|
|
|
|
Purchases [net of inventory variation] | ( 294,442) | ( 5,276) | ( 93,256) | 187,104 | ( 205,870) |
Operating expenses | ( 10,649) | ( 34,979) | ( 13,247) | 2,015 | ( 56,860) |
Selling, general and administrative expenses | ( 7,928) | ( 610) | ( 12,112) | 10,329 | ( 10,321) |
Depreciation, amortisation and net impairment losses | ( 814) | ( 27,316) | ( 25,926) | 0 | ( 54,056) |
Exploration expenses | ( 861) | ( 5,187) | ( 10,638) | 0 | ( 16,686) |
|
|
|
|
|
|
Total operating expenses | ( 314,694) | ( 73,368) | ( 155,179) | 199,448 | ( 343,793) |
|
|
|
|
|
|
Net operating income | 27,182 | 119,378 | 3,926 | ( 28,846) | 121,640 |
|
|
|
|
|
|
FINANCIAL ITEMS |
|
|
|
|
|
Net foreign exchange gains (losses) | 10,608 | ( 4,632) | 3,002 | ( 6,985) | 1,993 |
Interest income and other financial items | 4,693 | 1,017 | ( 9,995) | 7,993 | 3,708 |
Interest and other finance expenses | ( 10,629) | ( 4,118) | ( 5,059) | 7,355 | ( 12,451) |
|
|
|
|
|
|
Net financial items | 4,672 | ( 7,733) | ( 12,052) | 8,363 | ( 6,750) |
|
|
|
|
|
|
Income before tax | 31,854 | 111,645 | ( 8,126) | ( 20,483) | 114,890 |
|
|
|
|
|
|
Income tax | ( 6,556) | ( 88,266) | ( 3,141) | 788 | ( 97,175) |
|
|
|
|
|
|
Net income | 25,298 | 23,379 | ( 11,267) | ( 19,695) | 17,715 |
CONSOLIDATED STATEMENT OF INCOME | |||||
| Statoil ASA | Statoil Petroleum AS | Other subsidiaries | Consolidation adjustments |
|
2008 (in NOK million) | Group | ||||
REVENUES AND OTHER INCOME |
|
|
|
|
|
Revenues | 389,618 | 249,432 | 242,995 | ( 230,068) | 651,977 |
Net income from associated companies | 57,648 | 4,408 | 1,105 | ( 61,878) | 1,283 |
Other income | 521 | 20 | 2,572 | ( 353) | 2,760 |
|
|
|
|
|
|
Total revenues and other income | 447,787 | 253,860 | 246,672 | ( 292,299) | 656,020 |
OPERATING EXPENSES |
|
|
|
|
|
Purchases [net of inventory variation] | ( 360,897) | ( 4,045) | ( 181,803) | 217,563 | ( 329,182) |
Operating expenses | ( 13,718) | ( 37,081) | ( 14,293) | 5,743 | ( 59,349) |
Selling, general and administrative expenses | ( 11,500) | 36 | ( 8,789) | 9,289 | ( 10,964) |
Depreciation, amortisation and net impairment losses | ( 693) | ( 26,215) | ( 16,088) | 0 | ( 42,996) |
Exploration expenses | ( 551) | ( 5,540) | ( 8,606) | 0 | ( 14,697) |
| |||||
Total operating expenses | ( 387,359) | ( 72,845) | ( 229,579) | 232,595 | ( 457,188) |
|
|
|
|
|
|
Net operating income | 60,428 | 181,015 | 17,093 | ( 59,704) | 198,832 |
FINANCIAL ITEMS |
|
|
|
|
|
Net foreign exchange gains (losses) | ( 38,112) | 2,154 | 3,395 | 0 | ( 32,563) |
Interest income and other financial items | 10,449 | 1,895 | 10,740 | ( 10,877) | 12,207 |
Interest and other finance expenses | 1,025 | ( 4,705) | ( 5,206) | 10,877 | 1,991 |
| |||||
Net financial items | ( 26,638) | ( 656) | 8,929 | 0 | ( 18,365) |
Income before tax | 33,790 | 180,359 | 26,022 | ( 59,704) | 180,467 |
| |||||
Income tax | 9,476 | ( 132,310) | ( 13,612) | ( 751) | ( 137,197) |
| |||||
Net income | 43,266 | 48,049 | 12,410 | ( 60,455) | 43,270 |
CONSOLIDATED STATEMENT OF INCOME |
|
|
|
|
|
|
|
|
| ||
| Statoil ASA | Statoil Petroleum AS | Other subsidiaries | Consolidation adjustments |
|
2007 (in NOK million) | Group | ||||
|
|
|
|
|
|
REVENUES AND OTHER INCOME |
|
|
|
|
|
Revenues | 272,614 | 200,680 | 197,452 | ( 149,081) | 521,665 |
Net income from associated companies | 38,221 | 847 | 667 | ( 39,126) | 609 |
Other income | 2 | 165 | 356 | 0 | 523 |
|
|
|
|
|
|
Total revenues and other income | 310,837 | 201,692 | 198,475 | ( 188,207) | 522,797 |
|
|
|
|
|
|
OPERATING EXPENSES |
|
|
|
|
|
Purchases [net of inventory variation] | ( 257,608) | ( 3,739) | ( 135,677) | 136,628 | ( 260,396) |
Operating expenses | ( 10,149) | ( 42,166) | ( 12,604) | 4,601 | ( 60,318) |
Selling, general and administrative expenses | ( 9,656) | ( 1,534) | ( 9,422) | 6,438 | ( 14,174) |
Depreciation, amortisation and net impairment losses | ( 631) | ( 24,747) | ( 13,994) | 0 | ( 39,372) |
Exploration expenses | ( 713) | ( 4,074) | ( 6,546) | 0 | ( 11,333) |
|
|
|
|
|
|
Total operating expenses | ( 278,757) | ( 76,260) | ( 178,243) | 147,667 | ( 385,593) |
|
|
|
|
|
|
Net operating income | 32,080 | 125,432 | 20,232 | ( 40,540) | 137,204 |
|
|
|
|
|
|
FINANCIAL ITEMS |
|
|
|
|
|
Net foreign exchange gains (losses) | 15,979 | ( 639) | ( 5,297) | 0 | 10,043 |
Interest income and other financial items | 4,134 | 241 | 3,875 | ( 5,945) | 2,305 |
Interest and other finance expenses | ( 5,128) | ( 2,208) | ( 1,350) | 5,945 | ( 2,741) |
|
|
|
|
|
|
Net financial items | 14,985 | ( 2,606) | ( 2,772) | 0 | 9,607 |
|
|
|
|
|
|
Income before tax | 47,065 | 122,826 | 17,460 | ( 40,540) | 146,811 |
|
|
|
|
|
|
Income tax | ( 2,971) | ( 92,897) | ( 6,730) | 428 | ( 102,170) |
|
|
|
|
|
|
Net income | 44,094 | 29,929 | 10,730 | ( 40,112) | 44,641 |
CONSOLIDATED BALANCE SHEET |
|
|
|
|
|
| Statoil ASA | Statoil Petroleum AS | Other subsidiaries | Consolidation adjustments |
|
At 31 December 2009 (in NOK million) | Group | ||||
|
|
|
|
|
|
ASSETS |
|
|
|
|
|
Non-current assets |
|
|
|
|
|
Property, plant and equipment | 4,771 | 197,537 | 138,527 | 0 | 340,835 |
Intangible assets | 29 | 8,365 | 45,859 | 0 | 54,253 |
Shares in subsidiaries | 290,648 | 87,156 | (0) | (377,804) | 0 |
Investments in associated companies | 605 | 823 | 9,416 | (788) | 10,056 |
Deferred tax assets | 2,380 | 3,732 | 0 | (4,153) | 1,960 |
Pension assets | 2,665 | 0 | 29 | 0 | 2,694 |
Financial investments | 11 | 5 | 13,251 | 0 | 13,267 |
Derivative financial instruments | 7,132 | 10,512 | 0 | 0 | 17,644 |
Financial receivables | 1,285 | 1,323 | 3,139 | 0 | 5,747 |
Financial receivables from subsidiaries | 47,651 | 97 | 30,327 | (78,076) | 0 |
|
|
|
|
|
|
Total non-current assets | 357,177 | 309,551 | 240,549 | (460,821) | 446,456 |
|
|
|
|
|
|
Current assets |
|
|
|
|
|
Inventories | 11,976 | 50 | 12,124 | (3,954) | 20,196 |
Trade and other receivables | 31,983 | 9,354 | 17,558 | 0 | 58,895 |
Current tax receivables | 179 | 0 | 0 | 0 | 179 |
Receivables from subsidiaries | 0 | 4,184 | 129,227 | (133,411) | 0 |
Derivative financial instruments | 3,888 | 1,200 | 281 | 0 | 5,369 |
Financial investments | 1,905 | 0 | 5,117 | 0 | 7,022 |
Cash and cash equivalents | 14,460 | 3 | 10,260 | 0 | 24,723 |
|
|
|
|
|
|
Total current assets | 64,391 | 14,792 | 174,566 | (137,365) | 116,384 |
|
|
|
|
|
|
TOTAL ASSETS | 421,568 | 324,344 | 415,114 | (598,186) | 562,840 |
CONSOLIDATED BALANCE SHEET |
|
|
|
|
|
| Statoil ASA | Statoil Petroleum AS | Other subsidiaries | Consolidation adjustments |
|
At 31 December 2009 (in NOK million) | Group | ||||
|
|
|
|
|
|
EQUITY AND LIABILITIES |
|
|
|
|
|
Equity |
|
|
|
|
|
Paid in Capital and Retained Earnings | 201,736 | 105,975 | 295,004 | (407,964) | 194,751 |
Other reserves | (3,417) | (4,543) | (15,012) | 26,540 | 3,568 |
|
|
|
|
|
|
Statoil shareholders' equity | 198,319 | 101,432 | 279,992 | (381,424) | 198,319 |
|
|
|
|
|
|
Non-controlling interest (Minority interest) | 0 | 0 | 1,799 | 0 | 1,799 |
|
|
|
|
|
|
Total equity | 198,319 | 101,432 | 281,791 | (381,424) | 200,118 |
|
|
|
|
|
|
Non-current liabilities |
|
|
|
|
|
Financial liabilities | 83,443 | 292 | 12,227 | 0 | 95,962 |
Non-current liabilities to subsidiaries | 50 | 46,545 | 31,480 | (78,076) | 0 |
Derivative financial instruments | 1,657 | 0 | 0 | 0 | 1,657 |
Deferred tax liabilities | 0 | 80,740 | 862 | (5,280) | 76,322 |
Pension liabilities | 20,682 | 0 | 460 | 0 | 21,142 |
Asset retirement obligations, other provisions and other liabilities | 1,916 | 40,138 | 13,780 | 0 | 55,834 |
|
|
|
|
|
|
Total non-current liabilities | 107,748 | 167,715 | 58,809 | (83,356) | 250,917 |
|
|
|
|
|
|
Current liabilities |
|
|
|
|
|
Trade and other payables | 27,243 | 14,104 | 18,454 | 0 | 59,801 |
Current tax payable | 4,182 | 33,472 | 3,340 | 0 | 40,994 |
Financial liabilities | 7,386 | 0 | 764 | 0 | 8,150 |
Derivative financial instruments | 2,530 | 18 | 312 | 0 | 2,860 |
Current liabilities to subsidiaries | 74,160 | 7,602 | 51,644 | (133,406) | 0 |
|
|
|
|
|
|
Total current liabilities | 115,501 | 55,196 | 74,514 | (133,406) | 111,805 |
|
|
|
|
|
|
Total liabilities | 223,249 | 222,912 | 133,323 | (216,762) | 362,722 |
|
|
|
|
|
|
TOTAL EQUITY AND LIABILITIES | 421,568 | 324,344 | 415,114 | (598,186) | 562,840 |
CONSOLIDATED BALANCE SHEET |
|
|
|
|
|
| Statoil ASA | Statoil Petroleum AS | Other subsidiaries | Consolidation adjustments |
|
At 31 December 2008 (in NOK million) | Group | ||||
|
|
|
|
|
|
ASSETS |
|
|
|
|
|
Non-current assets |
|
|
|
|
|
Property, plant and equipment | 5,698 | 187,739 | 136,404 | 0 | 329,841 |
Intangible assets | 7 | 6,888 | 59,141 | 0 | 66,036 |
Shares in subsidiaries | 314,779 | 69,586 | 4,750 | (389,115) | 0 |
Investments in associated companies | 845 | 1,070 | 11,078 | (353) | 12,640 |
Deferred tax assets | 7,187 | 0 | 1,302 | (7,187) | 1,302 |
Pension assets | 0 | 0 | 30 | 0 | 30 |
Financial investments | 12 | 7 | 16,446 | 0 | 16,465 |
Derivative financial instruments | 12,430 | 8,852 | 0 | 0 | 21,282 |
Financial receivables | 343 | 539 | 4,032 | 0 | 4,914 |
Financial receivables from subsidiaries | 44,148 | 56 | 26,332 | (70,536) | 0 |
|
|
| 0 |
|
|
Total non-current assets | 385,449 | 274,737 | 259,515 | (467,191) | 452,510 |
|
|
|
|
|
|
Current assets |
|
|
|
|
|
Inventories | 5,884 | 942 | 9,858 | (1,533) | 15,151 |
Trade and other receivables | 36,394 | 12,918 | 20,619 | 0 | 69,931 |
Current tax receivables | 2,959 | 881 | 0 | 0 | 3,840 |
Receivables from subsidiaries | 10,740 | 39,059 | 97,912 | (147,711) | 0 |
Derivative financial instruments | 5,011 | 899 | 3,456 | 0 | 9,366 |
Financial investments | 2,616 | 0 | 7,131 | 0 | 9,747 |
Cash and cash equivalents | 6,272 | 0 | 12,366 | 0 | 18,638 |
|
|
|
|
|
|
Total current assets | 69,876 | 54,699 | 151,342 | (149,244) | 126,673 |
|
|
|
|
|
|
TOTAL ASSETS | 455,325 | 329,436 | 410,857 | (616,435) | 579,183 |
CONSOLIDATED BALANCE SHEET |
|
|
|
|
|
| Statoil ASA | Statoil Petroleum AS | Other subsidiaries | Consolidation adjustments |
|
At 31 December 2008 (in NOK million) | Group | ||||
|
|
|
|
|
|
EQUITY AND LIABILITIES |
|
|
|
|
|
Equity |
|
|
|
|
|
Paid in Capital and Retained Earnings | 196,825 | 104,827 | 281,473 | (386,300) | 196,825 |
Other reserves | 17,254 | 2,738 | 1,226 | (3,964) | 17,254 |
|
|
|
|
|
|
Statoil shareholders' equity | 214,079 | 107,565 | 282,699 | (390,264) | 214,079 |
|
|
|
|
|
|
Non-controlling interest (Minority interest) | 0 | 0 | 1,976 | 0 | 1,976 |
|
|
|
|
|
|
Total equity | 214,079 | 107,565 | 284,675 | (390,264) | 216,055 |
|
|
|
|
|
|
Non-current liabilities |
|
|
|
|
|
Financial liabilities | 49,858 | 767 | 3,981 | 0 | 54,606 |
Non-current liabilities to subsidiaries | 37 | 42,623 | 27,897 | (70,557) | 0 |
Derivative financial instruments | 1,617 | 0 | 0 | 0 | 1,617 |
Deferred tax liabilities | 0 | 69,722 | 5,948 | (7,526) | 68,144 |
Pension liabilities | 20,649 | 4,312 | 577 | 0 | 25,538 |
Asste retirement obligations, other provisions and other liabilities | 1,233 | 34,838 | 18,686 | (398) | 54,359 |
|
|
|
|
|
|
Total non-current liabilities | 73,394 | 152,262 | 57,089 | (78,481) | 204,264 |
|
|
|
|
|
|
Current liabilities |
|
|
|
|
|
Trade and other payables | 22,992 | 16,966 | 21,242 | 0 | 61,200 |
Current tax payable | 1,896 | 50,746 | 4,432 | 0 | 57,074 |
Financial liabilities | 18,784 | 255 | 1,656 | 0 | 20,695 |
Derivative financial instruments | 17,957 | 20 | 1,918 | 0 | 19,895 |
Current liabilities to subsidiaries | 106,223 | 1,622 | 39,845 | (147,690) | 0 |
|
|
|
|
|
|
Total current liabilities | 167,852 | 69,609 | 69,093 | (147,690) | 158,864 |
|
|
|
|
|
|
Total liabilities | 241,246 | 221,871 | 126,182 | (226,171) | 363,128 |
|
|
|
|
|
|
TOTAL EQUITY AND LIABILITIES | 455,325 | 329,436 | 410,857 | (616,435) | 579,183 |
CONSOLIDATED BALANCE SHEET |
|
|
|
|
|
| Statoil ASA | Statoil Petroleum AS | Other subsidiaries | Consolidation adjustments |
|
At 1 January 2008 (restated, in NOK million) | Group | ||||
|
|
|
|
|
|
ASSETS |
|
|
|
|
|
Non-current assets |
|
|
|
|
|
Property, plant and equipment | 5,317 | 179,446 | 93,589 | 0 | 278,352 |
Intangible assets | 8 | 4,946 | 39,896 | 0 | 44,850 |
Shares in subsidiaries | 201,251 | 53,208 | 2,811 | (257,270) | 0 |
Investments in associated companies | 952 | 1,470 | 5,999 | 0 | 8,421 |
Deferred tax assets | 0 | 0 | 3,610 | (2,817) | 793 |
Pension assets | 1,561 | 0 | 61 | 0 | 1,622 |
Financial investments | 13 | 15 | 15,238 | 0 | 15,266 |
Derivative financial instruments | 3,155 | 9,613 | 0 | 0 | 12,768 |
Financial receivables | 214 | 337 | 2,964 | 0 | 3,515 |
Financial receivables from subsidiaries | 46,774 | 31 | 52 | (46,857) | 0 |
|
|
|
|
|
|
Total non-current assets | 259,245 | 249,066 | 164,220 | (306,944) | 365,587 |
|
|
|
|
|
|
Current assets |
|
|
|
|
|
Inventories | 7,296 | 1,526 | 12,536 | (3,662) | 17,696 |
Trade and other receivables | 38,939 | 9,587 | 20,852 | 0 | 69,378 |
Current tax receivables | 0 | 0 | 0 | 0 | 0 |
Receivables from subsidiaries | 10,271 | 10,999 | 48,941 | (70,211) | 0 |
Derivative financial instruments | 4,649 | 91 | 4,062 | 0 | 8,802 |
Financial investments | 155 | 0 | 3,204 | 0 | 3,359 |
Cash and cash equivalents | 21 | (7) | 18,250 | 0 | 18,264 |
|
|
|
|
|
|
Total current assets | 61,331 | 22,196 | 107,845 | (73,873) | 117,499 |
|
|
|
|
|
|
TOTAL ASSETS | 320,576 | 271,262 | 272,065 | (380,817) | 483,086 |
CONSOLIDATED BALANCE SHEET |
|
|
|
|
|
| Statoil ASA | Statoil Petroleum AS | Other subsidiaries | Consolidation adjustments |
|
At 1 January 2008 (restated, in NOK million) | Group | ||||
|
|
|
|
|
|
EQUITY AND LIABILITIES |
|
|
|
|
|
Equity |
|
|
|
|
|
Paid in Capital and Retained Earnings | 189,886 | 76,111 | 188,292 | (264,401) | 189,888 |
Other reserves | (12,611) | (4,484) | (77) | 4,559 | (12,613) |
|
|
|
|
|
|
Statoil shareholders' equity | 177,275 | 71,627 | 188,215 | (259,842) | 177,275 |
|
|
|
|
|
|
Non-controlling interest (Minority interest) | 0 | 0 | 1,792 | 0 | 1,792 |
|
|
|
|
|
|
Total equity | 177,275 | 71,627 | 190,007 | (259,842) | 179,067 |
|
|
|
|
|
|
Non-current liabilities |
|
|
|
|
|
Financial liabilities | 35,425 | 4,615 | 4,334 | 0 | 44,374 |
Non-current liabilities to subsidiaries | 27 | 42,670 | 4,162 | (46,859) | 0 |
Derivative financial instruments | 27 | 0 | 0 | 0 | 27 |
Deferred tax liabilities | 468 | 63,683 | 7,233 | (3,907) | 67,477 |
Pension liabilities | 18,384 | 0 | 708 | 0 | 19,092 |
Asset retirement obligations, other provisions and other liabilities | 2,001 | 32,941 | 8,903 | 0 | 43,845 |
|
|
|
|
|
|
Total non-current liabilities | 56,332 | 143,909 | 25,340 | (50,766) | 174,815 |
|
|
|
|
|
|
Current liabilities |
|
|
|
|
|
Trade and other payables | 33,668 | 13,701 | 17,255 | 0 | 64,624 |
Current tax payable | 6,261 | 40,542 | 4,138 | 0 | 50,941 |
Financial liabilities | 4,718 | 13 | 1,435 | 0 | 6,166 |
Derivative financial instruments | 3,742 | 531 | 3,200 | 0 | 7,473 |
Current liabilities to subsidiaries | 38,580 | 939 | 30,690 | (70,209) | 0 |
|
|
|
|
|
|
Total current liabilities | 86,969 | 55,726 | 56,718 | (70,209) | 129,204 |
|
|
|
|
|
|
Total liabilities | 143,301 | 199,635 | 82,058 | (120,975) | 304,019 |
|
|
|
|
|
|
TOTAL EQUITY AND LIABILITIES | 320,576 | 271,262 | 272,065 | (380,817) | 483,086 |
CASH FLOW STATEMENT |
|
|
|
|
|
|
|
|
| ||
| Statoil ASA | Statoil Petroleum AS | Other subsidiaries | Consolidation adjustments |
|
At 31 December 2009 (in NOK million) | Group | ||||
|
|
|
|
|
|
Cash flows provided by operating activities | ( 3,547) | 64,133 | 27,711 | ( 15,296) | 73,001 |
Cash flows used in investing activities | 21,639 | ( 62,931) | ( 44,366) | 10,302 | ( 75,356) |
Cash flows provided by (used in) financing activities | ( 8,809) | ( 1,199) | 16,305 | 4,994 | 11,291 |
|
|
|
|
|
|
Net increase (decrease) in cash and cash equivalents | 9,283 | 3 | ( 350) | 0 | 8,936 |
|
|
|
|
|
|
Effect of exchange rate changes on cash and cash equivalents | ( 1,095) | 0 | ( 1,756) | 0 | ( 2,851) |
Cash and cash equivalents at the beginning of the period | 6,272 | 0 | 12,366 | 0 | 18,638 |
|
|
|
|
|
|
Cash and cash equivalents at the end of the period | 14,460 | 3 | 10,260 | 0 | 24,723 |
|
|
|
|
|
|
|
|
|
|
|
|
CASH FLOW STATEMENT |
|
|
|
|
|
|
|
|
| ||
| Statoil ASA | Statoil Petroleum AS | Other subsidiaries | Consolidation adjustments |
|
At 31 December 2008 (in NOK million) | Group | ||||
|
|
|
|
|
|
Cash flows provided by operating activities | ( 11,182) | 75,887 | 44,181 | ( 6,353) | 102,533 |
Cash flows used in investing activities | ( 70,188) | ( 52,003) | ( 36,492) | 72,846 | ( 85,837) |
Cash flows provided by (used in) financing activities | 87,618 | ( 23,879) | ( 14,275) | ( 66,493) | ( 17,029) |
|
|
|
|
|
|
Net increase (decrease) in cash and cash equivalents | 6,248 | 5 | ( 6,586) | 0 | ( 333) |
|
|
|
|
|
|
Effect of exchange rate changes on cash and cash equivalents | 0 | ( 5) | 712 | 0 | 707 |
Cash and cash equivalents at the beginning of the period | 23 |
| 18,241 | 0 | 18,264 |
|
|
|
|
|
|
Cash and cash equivalents at the end of the period | 6,271 | 0 | 12,367 | 0 | 18,638 |
|
|
|
|
|
|
|
|
|
|
|
|
CASH FLOW STATEMENT |
|
|
|
|
|
|
|
|
| ||
| Statoil ASA | Statoil Petroleum AS | Other subsidiaries | Consolidation adjustments |
|
At 31 December 2007 (in NOK million) | Group | ||||
|
|
|
|
|
|
Cash flows provided by operating activities | 15,343 | 56,394 | 34,902 | ( 12,713) | 93,926 |
Cash flows used in investing activities | ( 29,400) | ( 46,679) | ( 27,910) | 28,877 | ( 75,112) |
Cash flows provided by (used in) financing activities | 14,084 | ( 9,728) | 3,900 | ( 16,164) | ( 7,908) |
|
|
|
|
|
|
Net increase (decrease) in cash and cash equivalents | 27 | ( 13) | 10,892 | 0 | 10,906 |
|
|
|
|
|
|
Effect of exchange rate changes on cash and cash equivalents | 0 | 0 | ( 160) | 0 | ( 160) |
Cash and cash equivalents at the beginning of the period | ( 4) | 8 | 7,514 | 0 | 7,518 |
|
|
|
|
|
|
Cash and cash equivalents at the end of the period | 23 | ( 5) | 18,246 | 0 | 18,264 |
8.1.35 Supplementary oil and gas information (unaudited)
In accordance with FASB Accounting Standards Codification "Extractive Activities - Oil and Gas" (Topic 932), Statoil is making certain supplemental disclosures about oil and gas exploration and production operations as previously required by Statement of Financial Accounting Standards No. 69 " Disclosures about Oil and Gas Producing Activities" (FAS 69). While this information is developed with reasonable care and disclosed in good faith, it is emphasised that some of the data is necessarily imprecise and represents only approximate amounts because of the subjective judgment involved in developing such information. Accordingly, this information may not necessarily represent the present financial condition of Statoil or its expected future results.
Financial Accounting Standard Board aligned in January 2010 the oil and gas reserves estimation and disclosure requirements of "Extractive Activities - Oil and Gas" (Topic 932) with the requirements in the Securities and Exchange Commission's final rule, "Modernization of the Oil and Gas Reporting Requirements" (the Final Rule) issued December 2008. Our reporting in 2009 is in accordance with the updated requirements. Prior period disclosures are not adjusted. For further information regarding revision of the reserves estimation requirement see note 2 Significant accounting policies - Critical judgement and key sources of estimation uncertainty - Proved oil and gas reserves.
No events have occurred since 31 December 2009 that would mean a significant change in the estimated proved reserves or other figures reported as of that date.
The subtotals and totals in some of the tables may not equal the sum of the amounts shown due to rounding.
Oil and gas reserve quantities
Statoil's oil and gas reserves have been estimated by its experts in accordance with industry standards under the requirements of the US Securities and Exchange Commission (SEC), Rule 4-10 of Regulation S-X. Reserves are net of royalty oil paid in kind and quantities consumed during production. Statements of reserves are forward-looking statements.
The determination of these reserves is part of an ongoing process subject to continual revision as additional information becomes available. Estimates of proved reserve quantities are imprecise and change over time as new information becomes available. Moreover, identified reserves and contingent resources that may become proved in the future, are excluded from the calculations.
In 2002, Statoil entered into a buy-back contract in Iran. Statoil also participates in a number of production sharing agreements (PSAs) in Algeria, Angola, Azerbaijan, Libya, Nigeria and Russia. Reserves from such agreements are based on the volumes to which Statoil has access (cost oil and profit oil), limited to available market access. Proved reserves at end of year associated with PSA and buy-back agreements are disclosed separately in the following tables.
Statoil is recording, as proved reserves, volumes equivalent to our tax liabilities payable in-kind under negotiated fiscal arrangements (production sharing agreements or income sharing agreements).
Rule 4-10 of Regulation S-X requires that the appraisal of reserves is based on existing economical conditions including a 12-month average price. Reserves at year-end 2009 have been determined based on a 12-month average 2009 Brent price equivalent to $59.9/bbl. The increase in oil price from year end 2008 (Brent blend price of $36.6/bbl) to an average 2009 price has increased the profitable oil to be recovered from the accumulations while Statoil's proved oil reserves under PSAs and similar contracts have as a result decreased. The gas prices have in general, decreased from year end 2008 to an average 2009 price and has affected the profitable gas reserves to be recovered accordingly. These changes are included in the revision category in the tables below.
From the Norwegian Continental Shelf (NCS) Statoil is required, on behalf of the Norwegian State's direct financial interest (SDFI), to manage, transport and sell the Norwegian State's oil and gas. These reserves are sold in conjunction with our own reserves. As part of this arrangement, Statoil will deliver gas to customers in accordance with various types of sales contracts. In order to fulfil the commitments, Statoil will utilise a field supply schedule which provides the highest possible total value for the joint portfolio of oil and gas between Statoil and SDFI.
Statoil and SDFI receive income from the joint natural gas sales portfolio based upon their respective share in the supply volumes. For sales of the SDFI natural gas, both to Statoil and to third parties, the payment to the Norwegian State is based on either achieved prices, a net back formula calculated price or market value. All of the Norwegian State's oil and NGL is acquired by Statoil. Pricing of the crude oil is based on market reflective prices; NGL prices are either based on achieved prices, market value or market reflective prices.
The owner's instruction may be changed or withdrawn by the Statoil general meeting. Due to this uncertainty and the Norwegian State's estimate of proved reserves not being available to Statoil, it is not possible to determine the total quantities to be purchased by Statoil under the owner's instruction from properties in which it participates in the operations.
Topic 932 requires the presentation of reserves and certain other supplemental oil and gas disclosures by geographical area, defined as country or continent containing 15% or more of total proved reserves. Norway contains 80% of total proved reserves at 31 December 2009 and no other country or continent contains reserves approaching 15% of total proved reserves. Accordingly, management has determined that the most meaningful presentation of geographical areas would be to include Norway and the continents of Eurasia (excluding Norway), Africa and America.
The following tables reflect the estimated proved reserves of oil and gas at 31 December 2006 to 2009, and the changes therein.
| Net proved oil and NGL | Net proved gas reserves in | Net proved oil, NGL and | ||||||
| Norway | Outside | Total | Norway | Outside | Total | Norway | Outside | Total |
|
|
|
|
|
|
|
|
|
|
Reserves in consolidated companies |
|
|
|
|
|
|
|
|
|
At 31 December 2006 | 1,667 | 756 | 2,423 | 19,129 | 1,567 | 20,696 | 5,068 | 1,032 | 6,101 |
Of which: |
|
|
|
|
|
|
|
|
|
Proved developed reserves | 1,188 | 334 | 1,523 | 13,378 | 283 | 13,661 | 3,566 | 385 | 3,951 |
Proved reserves under PSA and buy-back agreements | 0 | 441 | 441 | 0 | 1,169 | 1,169 | 0 | 649 | 649 |
Production from PSA and buy-back agreements | 0 | 47 | 47 | 0 | 56 | 56 | 0 | 57 | 57 |
|
|
|
|
|
|
|
|
|
|
Revisions and improved recovery | 197 | 16 | 214 | 598 | (27) | 571 | 311 | 14 | 325 |
Extensions and discoveries | 38 | 105 | 143 | 405 | 0 | 405 | 110 | 105 | 215 |
Purchase of reserves-in-place | 0 | 0 | 0 | 0 | 0 | 0 | 0 | 0 | 0 |
Sales of reserves-in-place | 0 | 0 | 0 | 0 | 0 | 0 | 0 | 0 | 0 |
Production | (299) | (92) | (391) | (1,238) | (114) | (1,352) | (519) | (112) | (632) |
At 31 December 2007 | 1,604 | 785 | 2,389 | 18,893 | 1,426 | 20,319 | 4,971 | 1,039 | 6,010 |
Of which: |
|
|
|
|
|
|
|
|
|
Proved developed reserves | 1,187 | 323 | 1,510 | 15,084 | 748 | 15,832 | 3,875 | 456 | 4,331 |
Proved reserves under PSA and buy-back agreements | 0 | 387 | 387 | 0 | 977 | 977 | 0 | 561 | 561 |
Production from PSA and buy-back agreements | 0 | 67 | 67 | 0 | 80 | 80 | 0 | 82 | 82 |
|
|
|
|
|
|
|
|
|
|
Revisions and improved recovery | 81 | 95 | 177 | 7 | 141 | 148 | 83 | 120 | 203 |
Extensions and discoveries | 12 | 0 | 12 | 29 | 0 | 29 | 17 | 0 | 17 |
Purchase of reserves-in-place | 0 | 69 | 69 | 0 | 0 | 0 | 0 | 69 | 69 |
Sales of reserves-in-place | 0 | (3) | (3) | 0 | (43) | (43) | 0 | (10) | (10) |
Transfer to associated company * | 0 | (191) | (191) | 0 | 0 | 0 | 0 | (191) | (191) |
Production | (302) | (78) | (380) | (1,348) | (121) | (1,469) | (542) | (100) | (642) |
At 31 December 2008 | 1,396 | 677 | 2,074 | 17,581 | 1,403 | 18,984 | 4,529 | 927 | 5,456 |
Of which: |
|
|
|
|
|
|
|
|
|
Proved developed reserves | 1,113 | 381 | 1,494 | 14,482 | 727 | 15,209 | 3,693 | 510 | 4,204 |
Proved reserves under PSA and buy-back agreements | 0 | 433 | 433 | 0 | 1,106 | 1,106 | 0 | 630 | 630 |
Production from PSA and buy-back agreements | 0 | 66 | 66 | 0 | 88 | 88 | 0 | 82 | 82 |
| Net proved oil and NGL | Net proved gas reserves in | Net proved oil, NGL and | ||||||
| Norway | Outside | Total | Norway | Outside | Total | Norway | Outside | Total |
|
|
|
|
|
|
|
|
|
|
Reserves in associated companies |
|
|
|
|
|
|
|
|
|
Remaining reserves after transfer* | 0 | 123 | 123 | 0 | 0 | 0 | 0 | 123 | 123 |
Revisions and improved recovery | 0 | 11 | 11 | 0 | 0 | 0 | 0 | 11 | 11 |
Production | 0 | (6) | (6) | 0 | 0 | 0 | 0 | (6) | (6) |
At 31 December 2008 | 0 | 127 | 127 | 0 | 0 | 0 | 0 | 127 | 127 |
|
|
|
|
|
|
|
|
|
|
|
|
|
|
|
|
|
|
|
|
Total Proved Reserves including reserves in associated companies at 31 December 2008 | 1,396 | 805 | 2,201 | 17,581 | 1,403 | 18,984 | 4,529 | 1,055 | 5,584 |
Of which: |
|
|
|
|
|
|
|
|
|
Proved developed reserves | 1,113 | 406 | 1,519 | 14,482 | 727 | 15,209 | 3,693 | 536 | 4,229 |
|
|
|
|
|
|
|
|
|
|
*Sincor to Petrocedeño; reduction from 15% to 9.677% interest |
|
|
|
|
|
|
|
| |
The transformation process of the Sincor joint venture in Venezuela, into the new mixed company Petrocedeño was finalised in February 2008 reducing Statoil's shareholding interest from 15.0 % in the Sincor joint venture to 9.677 % in Peterocedeño. The change in Statoil share resulted in a reduction of proved reserves corresponding to 68 million boe in 2008.
Statoil acquired Anadarco's 50.0% share in Peregrino, Brazil, in 2008 resulting in a 100% ownership of the asset, and becoming the operator. The related increase in proved reserves was 69 million boe.
| Net proved oil and NGL | ||||
| Norway | Eurasia excluding Norway | Africa | America | Total |
|
|
|
|
|
|
Reserves in consolidated companies |
|
|
|
|
|
At 31 December 2008 | 1,396 | 177 | 265 | 235 | 2,074 |
|
|
|
|
|
|
Revisions and improved recovery | 195 | (22) | 64 | 6 | 243 |
Extensions and discoveries | 39 | 6 | 44 | 45 | 134 |
Purchase of reserves-in-place | 0 | 0 | 0 | 0 | 0 |
Sales of reserves-in-place | 0 | (4) | 0 | 0 | (4) |
Production | (279) | (19) | (63) | (15) | (376) |
At 31 December 2009 | 1,351 | 138 | 310 | 272 | 2,070 |
Of which: |
|
|
|
|
|
Proved developed reserves | 1,028 | 94 | 208 | 83 | 1,413 |
Proved reserves under PSA and buy-back agreements | 0 | 124 | 310 | 0 | 434 |
Production from PSA and buy-back agreements | 0 | 17 | 63 | 0 | 80 |
|
|
|
|
|
|
Reserves in associated companies |
|
|
|
|
|
At 31 December 2008 | 0 | 0 | 0 | 127 | 127 |
Revisions and improved recovery | 0 | 0 | 0 | (18) | (18) |
Extensions and discoveries | 0 | 0 | 0 | 0 | 0 |
Purchase of reserves-in-place | 0 | 0 | 0 | 0 | 0 |
Sales of reserves-in-place | 0 | 0 | 0 | 0 | 0 |
Production | 0 | 0 | 0 | (5) | (5) |
At 31 December 2009 | 0 | 0 | 0 | 105 | 105 |
|
|
|
|
|
|
|
|
|
|
|
|
Total Proved Oil and NGL Reserves including reserves in associated companies at 31 December 2009 | 1,351 | 138 | 310 | 376 | 2,174 |
Of which: |
|
|
|
|
|
Proved developed reserves | 1,028 | 94 | 208 | 111 | 1,442 |
| Net proved gas reserves in | ||||
| Norway | Eurasia excluding Norway | Africa | America | Total |
|
|
|
|
|
|
Reserves in consolidated companies |
|
|
|
|
|
At 31 December 2008 | 17,581 | 827 | 481 | 95 | 18,984 |
|
|
|
|
|
|
Revisions and improved recovery | 690 | (31) | (89) | (9) | 561 |
Extensions and discoveries | 35 | 0 | 0 | 87 | 122 |
Purchase of reserves-in-place | 0 | 0 | 0 | 0 | 0 |
Sales of reserves-in-place | 0 | 0 | 0 | 0 | 0 |
Production | (1,367) | (49) | (54) | (48) | (1,519) |
At 31 December 2009 | 16,938 | 747 | 338 | 125 | 18,148 |
Of which: |
|
|
|
|
|
Proved developed reserves | 14,138 | 523 | 256 | 73 | 14,990 |
Proved reserves under PSA and buy-back agreements | 0 | 548 | 338 | 0 | 886 |
Production from PSA and buy-back agreements | 0 | 46 | 54 | 0 | 101 |
|
|
|
|
|
|
Reserves in associated companies |
|
|
|
|
|
At 31 December 2008 | 0 | 0 | 0 | 0 | 0 |
Revisions and improved recovery | 0 | 0 | 0 | 0 | 0 |
Extensions and discoveries | 0 | 0 | 0 | 0 | 0 |
Purchase of reserves-in-place | 0 | 0 | 0 | 0 | 0 |
Sales of reserves-in-place | 0 | 0 | 0 | 0 | 0 |
Production | 0 | 0 | 0 | 0 | 0 |
At 31 December 2009 | 0 | 0 | 0 | 0 | 0 |
|
|
|
|
|
|
|
|
|
|
|
|
Total Proved Gas Reserves including reserves in associated companies at 31 December 2009 | 16,938 | 747 | 338 | 125 | 18,148 |
Of which: |
|
|
|
|
|
Proved developed reserves | 14,138 | 523 | 256 | 73 | 14,990 |
| Net proved oil, NGL and gas reserves | ||||
| Norway | Eurasia excluding Norway | Africa | America | Total |
|
|
|
|
|
|
Reserves in consolidated companies |
|
|
|
|
|
At 31 December 2008 | 4,529 | 324 | 351 | 252 | 5,456 |
|
|
|
|
|
|
Revisions and improved recovery | 318 | (28) | 48 | 5 | 343 |
Extensions and discoveries | 45 | 6 | 44 | 60 | 155 |
Purchase of reserves-in-place | 0 | 0 | 0 | 0 | 0 |
Sales of reserves-in-place | 0 | (4) | 0 | 0 | (4) |
Production | (523) | (28) | (73) | (24) | (647) |
At 31 December 2009 | 4,369 | 271 | 370 | 294 | 5,304 |
Of which: |
|
|
|
|
|
Proved developed reserves | 3,548 | 187 | 254 | 96 | 4,084 |
Proved reserves under PSA and buy-back agreements | 0 | 222 | 370 | 0 | 592 |
Production from PSA and buy-back agreements | 0 | 25 | 73 | 0 | 98 |
|
|
|
|
|
|
Reserves in associated companies |
|
|
|
|
|
At 31 December 2008 | 0 | 0 | 0 | 127 | 127 |
Revisions and improved recovery | 0 | 0 | 0 | (18) | (18) |
Extensions and discoveries | 0 | 0 | 0 | 0 | 0 |
Purchase of reserves-in-place | 0 | 0 | 0 | 0 | 0 |
Sales of reserves-in-place | 0 | 0 | 0 | 0 | 0 |
Production | 0 | 0 | 0 | (5) | (5) |
At 31 December 2009 | 0 | 0 | 0 | 105 | 105 |
|
|
|
|
|
|
|
|
|
|
|
|
Total Proved Reserves including reserves in associated companies at 31 December 2009 | 4,369 | 271 | 370 | 398 | 5,408 |
Of which: |
|
|
|
|
|
Proved developed reserves | 3,548 | 187 | 254 | 124 | 4,113 |
Statoil's proved reserves of extra heavy oil in Venezuela and Canada are included as oil in the tables above.
The conversion rates used are 1 standard cubic meter = 35.3 standard cubic feet, 1 standard cubic meter oil equivalent = 6.29 barrels of oil equivalent (boe) and 1,000 standard cubic meter gas = 1 standard cubic meter oil equivalent.
Capitalised cost related to Oil and Gas production activities
| Consolidated companies | |||
| At 31 December | ||
(in NOK million) | 2009 | 2008 | 2007 |
|
|
|
|
Unproved Properties | 49,497 | 61,484 | 40,513 |
Proved Properties, wells, plants and other equipment | 655,886 | 611,251 | 526,634 |
|
|
|
|
Total Capitalised cost | 705,383 | 672,735 | 567,147 |
Accumulated depreciation, depletion, amortisation and valuation allowances | (379,575) | (349,428) | (309,527) |
|
|
|
|
Net Capitalised cost | 325,808 | 323,307 | 257,620 |
Net capitalised cost related to associated companies as of 31 December 2009 was NOK 3.7 billion, NOK 4.6 billion in 2008 and 0 in 2007.
Expenditures incurred in Oil and Gas Property Acquisition, Exploration and Development Activities
These expenditures include both amounts capitalised and expensed for 2009.
Consolidated companies | |||||
(in NOK million) | Norway | Eurasia excluding Norway | Africa | America | Total |
|
|
|
|
|
|
Year ended 31 December 2009 |
|
|
|
|
|
Exploration costs | 8,170 | 1,310 | 2,465 | 4,950 | 16,895 |
Development costs 1) | 30,704 | 3,611 | 10,627 | 11,958 | 56,900 |
Acquired unproved properties | 0 | 0 | 12 | 1,313 | 1,325 |
Total | 38,874 | 4,921 | 13,104 | 18,221 | 75,120 |
Expenditures incurred in Oil and Gas Property Acquisition, Exploration and Development Activities | ||||||
These expenditures include both amounts capitalised and expensed in 2008 and 2007 |
| |||||
|
|
|
|
|
|
|
(in NOK million) |
|
| Norway | Outside Norway | Total | |
|
|
|
|
|
|
|
Year ended 31 December 2008 |
|
|
|
| ||
Exploration costs |
|
| 8,672 | 9,136 | 17,808 | |
Development costs 1) |
|
| 29,478 | 14,215 | 43,693 | |
Acquired proved properties 2) |
| 0 | 12,435 | 12,435 | ||
Acquired unproved properties 3) |
| 1,255 | 12,323 | 13,578 | ||
Total |
|
|
| 39,405 | 48,109 | 87,514 |
|
|
|
|
|
|
|
Year ended 31 December 2007 |
|
|
|
| ||
Exploration costs |
|
| 5,749 | 8,499 | 14,248 | |
Development costs 1) |
|
| 28,428 | 13,330 | 41,758 | |
Acquired unproved properties |
| 0 | 17,133 | 17,133 | ||
Total |
|
|
| 34,177 | 38,962 | 73,139 |
(1) Includes minor development costs in unproved properties.
(2) Includes the acquisition of Anadarco's 50% share in Peregrino, Brazil.
(3) Includes signature bonuses and the acquisition of a share in Goliat and Marcellus shale gas development.
Expenditures incurred in Oil and Gas Development Activities related to associated companies in 2009 was NOK 286 million, NOK 448 million in 2008 and 0 in 2007.
Results of Operation for Oil and Gas Producing Activities
As required by Topic 932, the revenues and expenses included in the following table reflect only those relating to the oil and gas producing operations of Statoil.
Activities included in Statoil's segment disclosures in note 5 Segments to the financial statements but excluded from the table below relates to gas trading activities, commodity based derivatives, transportation, business development as well as effects of disposals of oil and gas interests.
Income tax expense is calculated on the basis of statutory tax rates in addition to uplift and tax credits only. No deductions are made for interest or overhead.
Consolidated companies |
|
|
|
|
|
(in NOK million) | Norway | Eurasia excluding Norway | Africa | America | Total |
Year ended December 2009 |
|
|
|
|
|
Sales | 5 | 2,968 | 7,950 | 689 | 11,612 |
Transfers | 154,440 | 5,320 | 16,877 | 6,085 | 182,722 |
Total revenues | 154,445 | 8,288 | 24,827 | 6,774 | 194,334 |
|
|
|
|
|
|
Exploration expenses | (5,187) | (1,047) | (2,238) | (8,218) | (16,690) |
Production costs | (19,395) | (1,440) | (3,432) | (1,768) | (26,035) |
Depreciation, amortisation and impairment losses | (25,566) | (2,464) | (9,721) | (4,902) | (42,653) |
Total costs | (50,148) | (4,951) | (15,391) | (14,888) | (85,378) |
|
|
|
|
|
|
Results of operations before tax | 104,297 | 3,337 | 9,436 | (8,114) | 108,956 |
Tax expense | (75,690) | (102) | (3,182) | 1,684 | (77,290) |
Result of operations | 28,607 | 3,235 | 6,254 | (6,430) | 31,666 |
(in NOK million) |
|
| Norway | Outside Norway | Total |
|
|
|
|
|
|
Year ended December 2008 |
|
|
|
| |
Sales |
|
| 151 | 8,274 | 8,425 |
Transfers |
|
| 216,809 | 34,718 | 251,527 |
Total revenues |
|
| 216,960 | 42,992 | 259,952 |
|
|
|
|
|
|
Exploration expense |
|
| (5,536) | (9,157) | (14,693) |
Production costs |
|
| (19,744) | (6,009) | (25,753) |
Depreciation, depletion and amortisation (DD&A) | (24,043) | (13,689) | (37,732) | ||
Total costs |
|
| (49,323) | (28,855) | (78,178) |
|
|
|
|
|
|
Results of operations before tax |
| 167,637 | 14,137 | 181,774 | |
Tax expense |
|
| (124,564) | (9,710) | (134,274) |
Result of operations |
|
| 43,073 | 4,427 | 47,500 |
|
|
|
|
|
|
Year ended December 2007 |
|
|
|
| |
Sales |
|
| 36 | 13,064 | 13,100 |
Transfers |
|
| 173,238 | 27,705 | 200,943 |
Total revenues |
|
| 173,274 | 40,769 | 214,043 |
|
|
|
|
|
|
Exploration expense |
|
| (3,638) | (7,695) | (11,333) |
Production costs |
|
| (22,793) | (7,132) | (29,925) |
DD&A |
|
| (23,030) | (11,103) | (34,133) |
Total costs |
|
| (49,461) | (25,930) | (75,391) |
|
|
|
|
|
|
Results of operations before tax |
| 123,813 | 14,839 | 138,651 | |
Tax expense |
|
| (92,058) | (4,327) | (96,385) |
Result of operations |
|
| 31,754 | 10,512 | 42,266 |
The results of operations for oil and gas producing activities of equity method investees outside of Norway amounts to NOK 26 million in the year ended December 2009, NOK 428 million in the year ended December 2008 and NOK 0 in the year ended December 2007.
Standardised measure of discounted future net cash flows relating to proved oil and gas reserves
The table below shows the standardised measure of future net cash flows relating to proved reserves. The analysis is computed in accordance with Topic 932, by applying average market prices for 2009 and year end market prices for 2008 and 2007 as defined by the SEC, year end costs, year end statutory tax rates, and a discount factor of 10% to year end quantities of net proved reserves. The standardised measure of discounted future net cash flows is a forward-looking statement.
Future price changes are limited to those provided by contractual arrangements in existence at the end of each reporting year. Future development and production costs are those estimated future expenditures necessary to develop and produce year end estimated proved reserves based on year end cost indices, assuming continuation of year end economic conditions. Pre-tax future net cash flow is net of decommissioning and removal costs. Estimated future income taxes are calculated by applying the appropriate year end statutory tax rates. These rates reflect allowable deductions and tax credits and are applied to estimated future pretax net cash flows, less the tax basis of related assets. Discounted future net cash flows are calculated using a discount rate of 10% per year. Discounting requires a year-by-year estimate of when future expenditures will be incurred and when reserves will be produced. The standardised measure of discounted future net cash flows prescribed under Topic 932 requires assu mptions as to the timing and amount of future development and production costs and income from the production of proved reserves. The information does not represent management's estimate or Statoil's expected future cash flows or the value of its proved reserves and therefore should not be relied upon as an indication of Statoil's future cash flow or value of its proved reserves.
(in NOK million) | Norway | Eurasia excluding Norway | Africa | America | Total |
|
|
|
|
|
|
At 31 December 2009 |
|
|
|
|
|
Consolidated companies |
|
|
|
|
|
Future net cash inflows | 1,387,084 | 66,055 | 113,642 | 90,548 | 1,657,329 |
Future development costs | (118,505) | (12,362) | (22,047) | (12,095) | (165,009) |
Future production costs | (437,396) | (22,806) | (33,665) | (42,932) | (536,799) |
Future income tax expenses | (624,221) | (3,033) | (21,199) | (7,642) | (656,095) |
Future net cash flows | 206,962 | 27,854 | 36,731 | 27,879 | 299,426 |
10 % annual discount for estimated timing of cash flows | (94,462) | (11,806) | (11,479) | (7,537) | (125,284) |
Standardised measure of discounted future net cash flows | 112,500 | 16,048 | 25,252 | 20,342 | 174,142 |
|
|
|
|
|
|
Associated companies |
|
|
|
|
|
Standardised measure of discounted future net cash flows | 0 | 0 | 0 | 2,097 | 2,097 |
|
|
|
|
|
|
Total Standardised measure of discounted future net cash flows including associated companies | 112,500 | 16,048 | 25,252 | 22,439 | 176,239 |
(in NOK million) | Norway | Outside Norway | Total |
|
|
|
|
At 31 December 2008 |
|
|
|
Consolidated companies |
|
|
|
Future net cash inflows | 1,738,693 | 204,808 | 1,943,501 |
Future development costs | (109,456) | (44,920) | (154,376) |
Future production costs | (412,340) | (77,398) | (489,738) |
Future income tax expenses | (919,740) | (30,118) | (949,858) |
Future net cash flows | 297,157 | 52,372 | 349,529 |
10 % annual discount for estimated timing of cash flows | (150,919) | (15,019) | (165,938) |
Standardised measure of discounted future net cash flows | 146,238 | 37,353 | 183,591 |
|
|
|
|
Associated companies |
|
|
|
Standardised measure of discounted future net cash flows | 0 | 2,024 | 2,024 |
|
|
|
|
Total standardised measure of discounted future net cash flows including associated companies | 146,238 | 39,377 | 185,615 |
|
|
|
|
At 31 December 2007 |
|
|
|
Future net cash inflows | 1,788,440 | 429,335 | 2,217,775 |
Future development costs | (107,966) | (57,332) | (165,298) |
Future production costs | (338,834) | (102,838) | (441,672) |
Future income tax expenses | (1,009,179) | (97,850) | (1,107,029) |
Future net cash flows | 332,461 | 171,315 | 503,776 |
10 % annual discount for estimated timing of cash flows | (135,717) | (67,289) | (203,006) |
Standardised measure of discounted future net cash flows | 196,744 | 104,026 | 300,770 |
Changes in the standardised measure of discounted future net cash flows from proved reserves
(in NOK million) | 2009 | 2008 | 2007 |
Consolidated companies |
|
|
|
Standardised measure at beginning of year | 183,591 | 300,770 | 245,714 |
Net change in sales and transfer prices and in production (lifting) costs related to future production | (288,973) | (74,453) | 239,091 |
Changes in estimated future development costs | (48,980) | (56,924) | (30,740) |
Sales and transfers of oil and gas produced during the period, net of production cost | (179,072) | (234,199) | (189,992) |
Net change due to extensions, discoveries, and improved recovery | 9,403 | 1,866 | 15,967 |
Net change due to purchases and sales of minerals in place | (530) | (4,936) | 0 |
Net change due to revisions in quantity estimates | 101,298 | 51,574 | 78,122 |
Previously estimated development costs incurred during the period | 56,900 | 56,128 | 41,758 |
Accretion of discount | 214,065 | 50,960 | (54,374) |
Net change in income taxes | 126,440 | 92,805 | (44,776) |
Total change in the standardised measure during the year | (9,449) | (117,179) | 55,056 |
Standardised measure at end of year | 174,142 | 183,591 | 300,770 |
|
|
|
|
Associated companies |
|
|
|
Standardised measure at end of year | 2,097 | 2,024 | 0 |
|
|
|
|
Standardised measure at end of year including associated companies | 176,239 | 185,615 | 300,770 |
8.2 Report of independent registered public accounting firms
8.2.1 Report of Ernst & Young AS on the financial statements of Statoil ASA
Report of Independent Registered Public Accounting Firm
The Board of Directors and Shareholders of Statoil ASA
We have audited the accompanying consolidated balance sheets of Statoil ASA as of 31 December 2009, 2008 and 1 January 2008, and the related consolidated statements of income, comprehensive income, changes in equity and cash flows for each of the three years in the period ended 31 December 2009. These financial statements are the responsibility of the Company's management. Our responsibility is to express an opinion on these financial statements based on our audits.
We conducted our audits in accordance with the standards of the Public Company Accounting Oversight Board (United States). Those standards require that we plan and perform the audit to obtain reasonable assurance about whether the financial statements are free of material misstatement. An audit includes examining, on a test basis, evidence supporting the amounts and disclosures in the financial statements. An audit also includes assessing the accounting principles used and significant estimates made by management, as well as evaluating the overall financial statement presentation. We believe that our audits provide a reasonable basis for our opinion.
In our opinion, the financial statements referred to above present fairly, in all material respects, the consolidated financial position of Statoil ASA at 31 December 2009, 2008 and 1 January 2008, and the consolidated results of their operations and their cash flows for each of the three years in the period ended 31 December 2009, in conformity with International Financial Reporting Standards as issued by the International Accounting Standards Board and International Financial Reporting Standards as adopted by the European Union.
As discussed in Note 8.1.2, Significant changes in accounting policies, to the consolidated financial statements, the Company has changed its reserve estimates and related disclosures as a result of adopting new oil and gas reserve estimation and disclosure requirements.
We also have audited, in accordance with the standards of the Public Company Accounting Oversight Board (United States), Statoil ASA's internal control over financial reporting as of 31 December 2009, based on criteria established in Internal Control-Integrated Framework issued by the Committee of Sponsoring Organizations of the Treadway Commission and our report dated 17 March 2010 expressed an unqualified opinion thereon.
Ernst & Young AS
Stavanger, Norway
17 March 2010
8.2.2 Report of Ernst & Young AS on Statoil's internal control over financial reporting
Report of Independent Registered Public Accounting Firm
The Board of Directors and Shareholders of Statoil ASA
We have audited Statoil ASA's ("Statoil") internal control over financial reporting as of 31 December 2009, based on criteria established in Internal Control-Integrated Framework issued by the Committee of Sponsoring Organizations of the Treadway Commission ("the COSO criteria"). Statoil's management is responsible for maintaining effective internal control over financial reporting, and for its assessment of the effectiveness of internal control over financial reporting included in the accompanying Management's report on internal control of financial reporting. Our responsibility is to express an opinion on the company's internal control over financial reporting based on our audit.
We conducted our audit in accordance with the standards of the Public Company Accounting Oversight Board (United States). Those standards require that we plan and perform the audit to obtain reasonable assurance about whether effective internal control over financial reporting was maintained in all material respects. Our audit included obtaining an understanding of internal control over financial reporting, assessing the risk that a material weakness exists, testing and evaluating the design and operating effectiveness of internal control based on the assessed risk, and performing such other procedures as we considered necessary in the circumstances. We believe that our audit provides a reasonable basis for our opinion.
A company's internal control over financial reporting is a process designed to provide reasonable assurance regarding the reliability of financial reporting and the preparation of financial statements for external purposes in accordance with generally accepted accounting principles. A company's internal control over financial reporting includes those policies and procedures that (1) pertain to the maintenance of records that, in reasonable detail, accurately and fairly reflect the transactions and dispositions of the assets of the company; (2) provide reasonable assurance that transactions are recorded as necessary to permit preparation of financial statements in accordance with generally accepted accounting principles, and that receipts and expenditures of the company are being made only in accordance with authorizations of management and directors of the company; and (3) provide reasonable assurance regarding prevention or timely detection of unauthorized acquisition, use or disposition of the company's assets that could have a material effect on the financial statements.
Because of its inherent limitations, internal control over financial reporting may not prevent or detect misstatements. Also, projections of any evaluation of effectiveness to future periods are subject to the risk that controls may become inadequate because of changes in conditions, or that the degree of compliance with the policies or procedures may deteriorate.
In our opinion, Statoil maintained, in all material respects, effective internal control over financial reporting as of 31 December 2009, based on the COSO criteria.
We also have audited, in accordance with the standards of the Public Company Accounting Oversight Board (United States), the consolidated balance sheets of Statoil ASA as of 31 December 2009, 2008 and 1 January 2008, and the related consolidated statements of income, comprehensive income, changes in equity and cash flows for each of the three years in the period ended 31 December 2009 and our report dated 17 March 2010 expressed an unqualified opinion thereon.
Ernst & Young AS
Stavanger, Norway
17 March 2010
9 Terms and definitions
An overview of organisational abbreviations.
- ACG - Azeri-Chirag-Gunashli
- ACQ - Annual Contract Quantity
- APA - Awards in Predefined Areas
- AFP - Agreement-based Early Retirement Plan
- AnLNG - Angola LNG
- BTC - Pipeline Baku-Tbilisi-Ceyhan
- CCS - Carbon Capture and Storage
- CHP - Combined heat and power plant
- CO2 - Carbon Dioxide
- E&P - Exploration & Production
- EEA - European Economic Agreement
- EFTA - European Free Trade Association
- EMTN - Euro Medium Term Note
- EPN - Exploration & Production Norway Business Area
- FCC - Fluid Catalytic Cracking
- FPSO - Floating Production Storage Offloading
- GBS - Gravity-Based Structure
- GDP - Gross Domestic Product
- GoM - Gulf of Mexico
- GTL - Gas to Liquids
- HSE - Health, Safety, Environment
- HTHP - High-temperature/high pressure
- IASB - International Accounting Standards Board
- IEA - International Energy Agency
- IFRS - International Financial Reporting Standards
- INT - International Exploration & Production business area
- IO - Integrated Operations
- IOR - Increased Oil Recovery
- ISG - In Salah Gas
- KEP2010 - Kårstø Upgrading Project
- LNG - Liquefied Natural Gas
- LPG - Liquefied Petroleum Gas
- M&M - Manufacturing and Marketing business area
- MPE - Norwegian Ministry of Petroleum and Energy
- NAOSC - North American Oil Sands Corporation
- NCS - Norwegian Continental Shelf
- NG - Natural Gas Business Area
- NGO - Non Governmental Organization
- NIOC - National Iranian Oil Company
- NOC - National Oil Companies
- NOK - Norwegian Kroner
- NOx- Nitrogen Oxide
- OECD - Organisation of Economic Co-Operation and Development
- OTC - Over the Counter
- OTS - Oil Trading and Supply Department
- PBO - Project Benefit Obligation
- PDO - Plan for Development and Operation
- PRO - Projects Functional Area
- PSA - Production Sharing Agreement
- R&D - Research and Development
- ROACE - Return on Average Capital Employed
- SAGD - Steam Assisted Gravity Drainage
- SCP - South Caucasus Pipeline System
- SDFI - Norwegian State's Direct Financial Interest
- SORIE - Statement of Recognised Income and Expense
- TAP - Trans Adriatic Pipeline
- TNE - Technology & New energy Functional Area
- TSP - Technical Service Provider
- UKCS - UK Continental Shelf
- USD - United States Dollar
- ÅTS - Åsgard Transport System
Metric abbreviations etc:
- bbl - barrel
- mbbl - thousand barrels
- mmbbl - million barrels
- boe - barrels-of-oil equivalent
- mboe - thousand barrels-of-oil equivalent
- mmboe - million barrels-of-oil equivalent
- mmcf - million cubic feet
- bcf - billion cubic feet
- tcf - trillion cubic feet
- scm - standard cubic metre
- mcm - thousand cubic metres
- mmcm - million cubic metres
- bcm - billion cubic metres
- mmtpa - million tonnes per annum
- km - kilometre
- ppm - part per million
- one billion - one thousand million
Equivalent measurements are based upon:
- 1 barrel equals 0.134 tonnes of oil (33 degrees API)
- 1 barrel equals 42 US gallons
- 1 barrel equals 0.159 standard cubic metres
- 1 barrel of oil equivalent equals 1 barrel of crude oil
- 1 barrel of oil equivalent equals 159 standard cubic metres of natural gas
- 1 barrel of oil equivalent equals 5,612 cubic feet of natural gas
- 1 barrel of oil equivalent equals 0.0837 tonnes of NGLs
- 1 billion standard cubic metres of natural gas equals 1 million standard cubic metres of oil equivalent
- 1 cubic metre equals 35.3 cubic feet
- 1 kilometre equals 0.62 miles
- 1 square kilometre equals 0.39 square miles
- 1 square kilometre equals 247.105 acres
- 1 cubic metre of natural gas equals one standard cubic metre of natural gas
- 1000 standard cubic metres of natural gas equals 6.29 boe
- 1 standard cubic foot equals 0.0283 standard cubic metres
- 1 standard cubic foot equals 1000 British thermal units (btu)
- 1 tonne of NGLs equals 1.9 standard cubic metres of oil equivalents
- 1 degree Celsius equals minus 32 plus five-ninths of the number of degrees Fahrenheit
Miscellaneous terms:
- Biofuel: A solid, liquid or gaseous fuel derived from relatively recently dead biological material and is distinguished from fossil fuels, which are derived from long dead biological material.
- BOE: Barrels of oil-equivalent A measure to quantify crude oil, natural gas liquids and natural gas amounts using the same basis. Natural gas volumes are converted to barrels on the basis of energy content.
- Carbon footprint: Total set of greenhouse gas emissions caused directly and indirectly by an individual, organization, event or product.
- Condensates: The heavier natural gas components, such as pentane, hexane, iceptane and so forth, which are liquid under atmospheric pressure - also called natural gasoline or naphtha
- Crude oil, or oil: Includes condensate and natural gas liquids
- Development: The drilling, construction, and related activities following discovery that are necessary to begin production of crude oil and natural gas fields.
- Downstream: The selling and distribution of products derived from upstream activties.
- Equity and entitlement volumes of oil and gas: Equity volumes represent volumes produced under a Production Sharing Agreement (PSA) that correspond to Statoil's percentage ownership in a particular field. Entitlement volumes, on the other hand, represent Statoil's share of the volumes distributed to the partners in the field, which are subject to deductions for, among other things, royalties and the host government's share of profit oil. Under the terms of a PSA, the amount of profit oil deducted from equity volumes will normally increase with the cumulative return on investment to the partners and/or production from the licence. The distinction between equity and entitlement is relevant to most PSA regimes, whereas it is not applicable in most concessionary regimes such as those in Norway, the UK, Canada and Brazil. The overview of equity production provides additional information for readers, as certain costs described in the profit and loss analysis were directly associated with equity volumes produced during the reported years.
- FCC: Fluid catalytic cracking A process used to convert the high-boiling hydrocarbon fractions of petroleum crude oils to more valuable gasoline, gases and other products.
- GTL: Gas to liquids, means the technology used for chemical conversion of natural gas into transportable liquids (diesel and naphtha) and specialty products (base oils).
- Heavy Oil: Crude oil with high viscosity (typically above 10 cp), and high specific gravity. The API classifies heavy oil as crudes with a gravity below 22.3° API. In addition to high viscosity and high specific gravity, heavy oils typically have low hydrogen-to-carbon ratios, high asphaltene, sulfur, nitrogen, and heavy-metal content, as well as higher acid numbers.
- High Grade: Relates to selectively harvesting goods, to cut the best and leave the rest. In reference to exploration and production this entails strict prioritisation and sequencing of drilling targets.
- Hydro: A reference to the oil and energy activities of Norsk Hydro ASA which merged with Statoil ASA.
- IOR: Increased oil recovery is used about actual measures resulting in an increased oil recovery factor from a reservoir as compared with the expected value at a certain reference point in time. IOR comprises both of conventional and emerging technologies.
- Liquids: Refers to oil, condensates and NGL.
- LNG: Liquefied Natural Gas,lean gas - primarily methane - converted to liquid form through refrigeration to minus 163 degrees Celsius under atmospheric pressures
- LPG: Liquefied petroleum gas and consists primarily of propane and butane, which turn liquid under a pressure of six to seven atmospheres. LPG is shipped in special vessels.
- Midstream: Processing, storage, and transport of crude oil, natural gas, natural gas liquids and sulphur.
- Naphtha is an inflammable oil obtained by the dry distillation of petroleum
- Natural gas: Petroleum that consists principally of light hydrocarbons. It can be divided into 1) lean gas, primarily methane but often containing some ethane and smaller quantities of heavier hydrocarbons (also called sales gas) and 2) wet gas, primarily ethane, propane and butane as well as smaller amounts of heavier hydrocarbons; partially liquid under atmospheric pressure
- NGL: Natural gas liquids, light hydrocarbons mainly consisting of ethane, propane and butane which are liquid under pressure at normal temperature
- Oil sands: A naturally occurring mixture of bitumen, water, sand, and clay. A heavy viscous form of crude oil.
- Petroleum: A collective term for hydrocarbons, whether solid, liquid or gaseous. Hydrocarbons are compounds formed from the elements hydrogen (H) and carbon (C). The proportion of different compounds, from methane and ethane up to the heaviest components, in a petroleum find varies from discovery to discovery. If a reservoir primarily contains light hydrocarbons, it is described as a gas field. If heavier hydrocarbons predominate, it is described as an oil field. An oil field may feature free gas above the oil and contain a quantity of light hydrocarbons, also called associated gas.
- Proved reserves: Proved reserves are those reserves claimed to have a reasonable certainty (normally at least 90% confidence) of being recoverable under existing economic and political conditions, and using existing technology. They are the only type the U.S. Securities and Exchange Commission allows oil companies to report.
- Share turnover: Turnover of shares is a measure of stock liquidity calculated by dividing the total number of shares traded over a period by the average number of shares outstanding for the period. The higher the share turnover, the more liquid the share of the company.
- Syncrude: The output from bitumen extra heavy oil upgrader facility used in connection with oil sand production.
- Upstream: Includes the searching for potential underground or underwater oil and gas fields, drilling of exploratory wells, subsequent operating wells which bring the liquids and or natural gas to the surface.
- VOC: Volatile Organic Compounds, are organic chemical compounds that have high enough vapor pressures under normal conditions to significantly vaporise and enter the earth's atmosphere, e.g. gasses formed under loading and offloading of crude oil.
- Økokrim: Prosecution of Economic and Environmental Crime in Norway
10 Forward looking statements
This Annual Report on Form 20-F contains certain forward-looking statements that involve risks and uncertainties, in particular in the sections "Business overview" and "Operational review". In some cases, we use words such as "aim", "anticipate", "believe", "continue", "estimate", "expect", "goal", "intend", "likely", "may", "objective", "plan", "seek", "should", "target", "will" and similar expressions to identify forward-looking statements. All statements other than statements of historical fact, including, among others, statements such as those regarding: goals and objectives relating to employees, recruitment of employees and employee compensation; future ability to identify, develop and apply existing and new technologies; efficiency and productivity goals for future operations and projects; our future response to climate c hange; environmental objectives; our future financial position; our future market position; business strategy; expected changes in ownership interests and structures; restructuring plans; competitive position; budgets; expected project development expenditures; plans for future development (including redevelopment) and operation of projects; reserve information; reserve replacement rates; reserve recovery factors; future ability to utilise and develop our expertise; projected levels of capacity; anticipated growth in geographical areas and market segments; oil and gas production forecasts; anticipated areas of market growth and decline; production growth; future composition of our exploration and project portfolios; exploration expenditure; expected exploration and development activities and plans; expected costs of decommissioning and removal activities; impact of facility maintenance activities; our ability to create value; planned turnarounds; expected unit production cost for equity volumes; expectations , objectives and plans for the employee pension plans; expected refining margins; expected start-up dates for projects and expected production and capacity of projects; projected impact of laws and regulations (including taxation laws and HSE regulations); HSE goals and objectives of management for future operations; plans for share repurchases; plans for payment of dividends and amounts of dividends; plans for marketing our products; expectations of the synergies produced by our recent acquisitions and our merger with Hydro; the impact of the uncertain world economy; expected capital expenditures; our expected ability to obtain short term and long term financing; our ability to manage our risk exposure; the projected levels of risk exposure with respect to financial counterparties; our ability to lower our funding costs; the expected impact of USD/NOK exchange rate fluctuations on our financial position; oil, gas and alternative fuel price levels and volatility; oil, gas and alternative fuel supply and dema nd; the markets for oil, gas and alternative fuel; renewable energy industry outlook; alternate fuel market outlook; projected operating costs; expected useful and economic lives of assets; the completion of acquisitions; obtaining licenses; obtaining licenses in the future; and the obtaining of regulatory and contractual approvals, are forward-looking statements. You should not place undue reliance on these forward-looking statements. Our actual results could differ materially from those anticipated in the forward-looking statements for many reasons, including the risks described above in "Risk review" and in "Operational review" and elsewhere in this Annual Report on Form 20-F.
These forward-looking statements reflect current views with respect to future events and are, by their nature, subject to significant risks and uncertainties because they relate to events and depend on circumstances that will occur in the future. There are a number of factors that could cause actual results and developments to differ materially from those expressed or implied by these forward-looking statements, including levels of industry product supply, demand and pricing; currency exchange rates; interest rates; trading activities; the political and economic policies of Norway and other oil-producing countries; general economic conditions; political stability and economic growth in relevant areas of the world; global political events and actions, including war, terrorism and sanctions; changes in laws and governmental regulations; the lack of necessary transportation infrastructure when a field is in a remote location; the timing of bringing new fields on stream; material differences from reserves est imates; an inability to find and develop reserves; adverse changes in tax regimes; the development and use of new technology; geological or technical difficulties; operational problems; security breaches; the actions of competitors; our ability to successfully exploit growth opportunities; the actions of field partners; industrial actions by workers; failing to attract and retain senior management and skilled personnel; failing to meet our ethical and social standards; natural disasters and adverse weather conditions and other changes to business conditions; and other factors discussed elsewhere in this report.
Although we believe that the expectations reflected in the forward-looking statements are reasonable, we cannot assure you that our future results, level of activity, performance or achievements will meet these expectations. Moreover, neither we nor any other person assumes responsibility for the accuracy and completeness of the forward-looking statements. Unless we are required by law to update these statements, we will not necessarily update any of these statements after the date of this Annual Report, either to make them conform to actual results or changes in our expectations.
11 Signature page
The registrant hereby certifies that it meets all of the requirements for filing on Form 20-F and that it has duly caused and authorized the undersigned to sign this Annual Report on its behalf.
| Statoil ASA | |
|
By:/s/ Eldar Sætre | |
| Name: Title: | Eldar Sætre Chief Financial Officer | |
Dated: 26 March, 2010 |
| |
12 Exhibits
The following exhibits are filed as part of this Annual Report:
Exhibit no | Description |
Exhibit 1 | Articles of Association of Statoil ASA, as amended, effective from 2 November 2009. (English translation) |
Exhibit 4(a)(i) | Technical Services Agreement between Gassco AS and Statoil ASA, dated February 27, 2002 (incorporated by reference to Exhibit 4(a)(i) to Statoil’s Annual Report and Form 20-F for the fiscal year ended December 31, 2001 (File No. 1-15200)). |
Exhibit 4(b) | Merger Plan (included as Appendix A to the circular/prospectus contained in Amendment No. 3 to the Registration Statement on Form F-4 filed on May 22, 2007 (File No. 333-141445)). |
Exhibit 4(c) | Employment agreement with Helge Lund (English translation) (incorporated by reference to Exhibit 4(c) to Statoil’s Annual Report and Form 20-F for the fiscal year ended December 31, 2003 |
Exhibit 7 | Calculation of ratio of earnings to fixed charges. |
Exhibit 8 | Subsidiaries (see Section 3.7.4 “Organisational Structure” included in this Annual Report). |
Exhibit 12.1 | Rule 13a-14(a) Certification of Chief Executive Officer. |
Exhibit 12.2 | Rule 13a-14(a) Certification of Chief Financial Officer. |
Exhibit 13.1 | Rule 13a-14(b) Certification of Chief Executive Officer.* |
Exhibit 13.2 | Rule 13a-14(b) Certification of Chief Financial Officer.* |
Exhibit 15(a)(i) | Consent of Ernst & Young AS. |
Exhibit 15(a)(ii) | Consent of DeGolyer and MacNaughton. |
Exhibit 15(a)(iii) | Report of DeGolyer and MacNaughton. |
* Furnished only
The total amount of long-term securities of the Registrant and its subsidiaries authorized under any one instrument does not exceed 10% of the total assets of Statoil ASA and its subsidiaries on a consolidated basis. The company agrees to furnish copies of any or all such instruments to the Securities and Exchange Commission upon request.
13 Cross reference to Form 20-F
| Sections | |
|---|---|---|
Item 1. | Identity of Directors, Senior Management and Advisers | N/A |
Item 2. | Offer Statistics and Expected Timetable | N/A |
Item 3. | Key Information |
|
| Selected Financial Data | 1.2; 1.4; 4.1.2; 6; 6.1; 6.8 |
| Capitalization and Indebtedness | N/A |
| Reasons for the Offer and Use of Proceeds | N/A |
| Risk Factors | 5.1 |
Item 4. | Information on the Company |
|
| History and Development of the Company | 2.1; 2.2; 3.1-3.6; 3.1.5; 3.2.1; 4.1.6; 4.2.5; 8.1.4 |
| Business Overview | 2; 3; 4.1.3; 4.1.4 |
| Organizational Structure | 2.1; 3.7.4 |
| Property, Plants and Equipment | 3.1- 3.5; 3.8; 3.12 |
| Oil and Gas Disclosures | 2; 3; 8.1.2; 8.1.35; Exhibit 15(a)(iii) |
Item 4A. | Unresolved Staff Comments | None |
Item 5. | Operating and Financial Review and Prospects |
|
| Operating Results | 3.10; 4.1; 4.2.8; 5.1.1; 5.1.2; 5.1.3; 5.2.1
|
| Liquidity and Capital Resources | 4.2.1; 4.2.3; 4.2.5; 5.2.1; 5.2.2; 8.1.22; 8.1.26; 8.1.30; 8.1.31
|
| Research and development, Patents and Licenses, etc. | 3.5; 8.1.9
|
| Trend Information | 2.4; 2.5.2; 2.6.2; 2.7.2; 2.8.2; 2.9.2; 2.10.2; 3.1.5; 3.2.2; 3.2.5; 3.3.1; 3.3.2; 3.5; 3.11; 4.1.3; 4.1.5.2; 4.1.6.2; 4.1.7.2; 4.1.8.2; 4.2; 5.1; 5.2; 5.3; 8.1.28 |
| Off-Balance Sheet Arrangements | 4.2.4; 4.2.6; 8.1.28 |
| Tabular Disclosure of Contractual Obligations | 4.2.4 |
| Safe Harbor | 10 |
Item 6. | Directors, Senior Management and Employees |
|
| Directors and Senior Management | 7.6; 7.8 |
| Compensation | 7.9 |
| Board Practices | 7.5; 7.6; 7.8 |
| Employees | 3.7 |
| Share Ownership | 7.5; 7.10 |
Item 7. | Major Shareholders and Related Party Transactions |
|
| Major Shareholders | 6.4 |
| Related Party Transactions | 3.13; 7.6 |
| Interests of Experts and Counsel | N/A |
Item 8. | Financial Information |
|
| Consolidated Statements and | 5.3; 6.1; 8 |
| Significant Changes | 8.1.33; 8.1.35 |
Item 9. | The Offer and Listing |
|
| Offer and Listing Details | 6.5 |
| Plan of Distribution | N/A |
| Markets | 6; 7.7 |
| Selling Shareholders | N/A |
| Dilution | N/A |
| Expenses of the Issue | N/A |
Item 10. | Additional Information |
|
| Share Capital | N/A |
| Memorandum and Articles of Association | 6.1; 6.4; 7.2; 7.3; 7.10; 8.1.21 |
| Material Contracts | 4.2.7 |
| Exchange Controls | 6.7 |
| Taxation | 3.10.5; 6.6; 8.1.2 |
| Dividends and Paying Agents | N/A |
| Statements by Experts | N/A |
| Documents On Display | 1.3 |
| Subsidiary Information | N/A |
Item 11. | Quantitative and Qualitative Disclosures About Market Risk | 5; 8.1.6; 8.1.7; 8.1.30; 8.1.31 |
Item 12. | Description of Securities Other than Equity Securities |
|
| A. Debt Securities | N/A |
| B. Warrants and Rights | N/A |
| C. Other Securities | N/A |
| D. American Depositary Shares | 6.5.2 |
Item 13. | Defaults, Dividend Arrearages and Delinquencies | None |
Item 14. | Material Modifications to the Rights of Security Holders and Use of Proceeds | None |
Item 15. | Controls and Procedures | 7.12; 8.2.2 |
Item 16A. | Audit Committee Financial Expert | 7.6.1.1 |
Item 16B. | Code of Ethics | 7.1 |
Item 16C. | Principal Accountant Fees and Services | 7.11 |
Item 16D. | Exemptions from the Listing Standards for Audit Committees | 7.7 |
Item 16E. | Purchases of Equity Securities by the Issuer and Affiliated Purchases | 6.1.1; 6.2 |
Item 16F. | Changes in Registrant’s Certifying Accountant | N/A |
Item 16G. | Corporate Governance | 7.7 |
Item 17. | Financial Statements | N/A |
Item 18. | Financial Statements | 8 |
Item 19. | Exhibits | 12 |