2.1Strategy and market overview |

Gina Krog, NCS
Equinor’s business environment
Market overview
While the global economy grew largely above the historical trend in 2017, last year turned out more modest, driven by trade frictions and uneven performance in emerging markets. Estimated economic growth for 2018 by the OECD1 was 3.6%.
The US achieved a significant growth rate above historical average at 2.9% for 2018, owing to the effects of tax cuts, increased fiscal spending and accommodative monetary policies. Eurozone growth showed weakness through 2018, achieving an expected growth rate of a modest 1.8%, with the German economy close to recession and Italy contracting in the fourth quarter of 2018.
Due to prolonged uncertainty around Brexit, the UK realised an annualised growth rate of 0.8% in the fourth quarter of 2018. The full-year 2018 GDP growth projection is revised down to 1.4%.
The Chinese GDP growth rate abated from the 6.8% experienced in 2017 to 6.6% as domestic consumption weakened and uncertainty concerning trade issues took its toll. In line with the global trend, Japanese economic growth came off from 2017 to an expected annual GDP growth of a meagre 0.7% for 2018 as energy costs rose, and exports slowed.
India, on the other hand, is expected to deliver a GDP growth rate of 7.2% for 2018, benefitting from structural reforms implemented in 2017.
Following the presidential election in 2018 and consistent economic growth since the 2015-2016 recession, Brazil showed positive signs through 2018. In contrast, Russia developed less favourably due to a mix of fiscal and monetary policy decisions.
Looking ahead, it appears that the global economic expansion has lost momentum as uncertainty now poses a dominant theme. Trade tensions between the US and China as well as the monetary policy of key central banks and the development in key emerging economies will be important for the unfolding of the world economy in 2019.
.
1 All GDP numbers based on OECD information
Equinor, Annual Report on Form 20-F 2018 13
Oil prices and refining margins
2018 was characterised by high volatility both in crude prices and refinery margins. The average price for Dated Brent was 71.1 USD/bbl, 31% higher than the 54.2 USD/bbl average in 2017.
Oil prices opened 2018 at USD 66 USD/bbl, the strongest start to a calendar year since 2014. Because of decisions by the Organization of the Petroleum Exporting Counties (OPEC) and their non-OPEC allies to extend the production cut agreement in 2018, storage levels were significantly reduced, reaching the target 5-year average benchmark before the summer. Despite elevated oil price levels incentivising a rapid surge in US production, unplanned additional declines in supply from Venezuela, Mexico and Angola resulted in a tighter market during the first quarter, with prices rising steadily until May.
In June, OPEC and non-OPEC allies, concerned by tight market conditions and the forthcoming disruptions to Iran’s supply due to US sanctions, decided to collectively ramp up production to offset any potential losses and maintain prices on a healthy level. Prices remained relatively steady around 74 USD/bbl throughout the summer, but already in September another price rally started on fears that production might not be sufficient to offset supply losses from Iran when sanctions were to take effect in November. Brent peaked at USD 86.1 per barrel in October.
During November the market sentiment started shifting from fears of undersupply and low spare capacity towards the potential disruptive effect on demand from the trade disputes between the US and China and the effect of high oil prices. This, coupled with the unexpected softening of Iranian sanctions and record US production, led to serious worries about oversupply. Faced again with potential oversupply, OPEC and non-OPEC allies decided at the December meeting in Vienna to reintroduce a production cut agreement starting January 2019. By the end of the year, prices had dropped by more than 40% since the peak in October, closing the year at USD 50.2 per barrel on 28th December 2018. In essence, the new year started in the same fashion as in 2018 – albeit with significantly lower stock levels this second round.
Refining margins
Refinery margins in Europe in 2018 were weaker than in 2017, and volatile throughout the year. Demand in Europe was strong, with a normal seasonal summer peak. Diesel demand was the strongest ever, and gasoline demand the highest since 2012. In the US the peak demand occurred during the summer months, with the strongest refinery margin in August. Overall, the gasoline prices averaged USD 2.72 per gallon in 2018, 13% higher than in 2017. Between May and November, prices were affected negatively by low water
14 Equinor, Annual Report on Form 20-F 2018
levels on the Rhine, restricting normal barge traffic in and out of the Rotterdam pricing hub. This also restricted supply of naphtha to inland petrochemical plants. From September, margins for gasoline and naphtha collapsed. The wholesale gasoline prices in the US dropped about 20%. Export opportunities into the US fell due to high stock levels there. Import requirements into Asia fell on higher local supply and weak demand due to concerns over the effect of the US - China trade conflict. Diesel and fuel oil margins rose to compensate, though. Through most of the year, margins were supported by weak physical crude vs. the paper market at the International Currency Exchange (ICE).
Natural gas prices
Gas prices – Europe
The National Balancing Point (NBP) fell in the beginning of 2018 from the December 2017 monthly average of 7.8 USD/MMBtu due to abnormally warm and windy weather and nuclear plants returning to full capacity. During a significant cold period in March, NBP day-ahead rocketed to 15 USD/MMBtu before settling down to pre-event levels of 7 USD/MMBtu. In the second and third quarter of 2018 the supply/demand balance was tight and there was a consistent growth in European gas prices, and the NBP monthly average in September was 9.6 USD/MMBtu. This was caused by an overall rallying energy complex (oil, CO2, coal and Asian LNG prices), call for gas to fill storage, strong Asian demand drawing LNG out of Europe, high level of maintenance and the extraordinarily warm summer in Northwest Europe. The fourth quarter of 2018 continued with warmer than normal seasonal weather, reducing gas demand. There was also an influx of LNG spot cargoes arriving in Europe rather than Asia as shipping rates were high. In addition, the storage inventory levels were comfortable, thus putting downward pressure on prices. Average annual price in 2018 was 8.0 USD/MMBtu compared to 5.8 USD/MMBtu in 2017.
Gas prices – North America
The Henry Hub price remained quite stable throughout 2018, averaging 3.15 USD/MMBtu for the year, 6% higher than in 2017. Dry gas production set record highs in 2018, but storage levels ended the year 17% below the five-year average as strong demand and a lack of price incentive depressed storage build during injection season. Winter periods continued to drive upside price risks. In November, prices reached 7 USD/MMBtu levels that had not been seen since the winter of 2014.
Global LNG prices
The Asian LNG average price for December 2017 was 10.6 USD/MMBtu, while the average price for 2017 was 7.1 USD/MMBtu. 2018 started with a tight LNG market and comparatively high prices due to strong Asian demand. From here, monthly prices fell throughout first quarter until April. With warm summer weather driving gas demand for cooling and planned maintenance, prices increased to 10.4 USD/MMBtu over the summer. September saw continued strong LNG demand with average price of 11.5 USD/MMBtu, before the market started softening with ramp up of new LNG supplies, fall in crude prices and a comparatively mild start of winter in Asia. At the end of the year, the Asian LNG price dropped below 9 USD/MMBtu, well below the average price for 2018 of 9.7 USD/MMBtu.
Equinor’s corporate strategy
Equinor is an international energy company committed to long-term value creation in a low carbon future inspired by its vision of shaping the future of energy.
“ | Equinor continues to pursue its strategy of always safe, high value and low carbon through developing and maximising the value of its unique Norwegian continental shelf position, its international oil and gas business, its manufacturing and trading activities and its growing new energy business. |
The energy context is expected to remain volatile characterised by geopolitical shifts, challenges in liquids resource replenishments, market cyclicality, structural changes to costs and increasing momentum towards low carbon. The company expects volatility in prices both upwards and downwards. Equinor’s strategic response is focused on creating value by building a more resilient, diverse and option-rich portfolio, delivered by an empowered organisation. To do so, Equinor will continue to concentrate its strategy realisation and development around the following areas:
· Norwegian continental shelf – transforming the NCS for continued high value creation and low carbon emissions for the coming decades
· International oil and gas – deepen core areas and develop growth options
· New energy solutions – create a material new industrial position
· Midstream and marketing – secure premium market access and grow value creation through cycles
Equinor’s unique position at the Norwegian continental shelf has enabled the company to develop new technologies and scale them industrially. Equinor has today a strong set of industrial value drivers:
Equinor, Annual Report on Form 20-F 2018 15
· Operational excellence
· World-class recovery
· Leading project deliveries
· Premium market access
· Digital leadership
In sum, these drivers strengthen the company’s competitiveness. Internationally, Equinor is increasingly taking the role as operator, allowing the company to leverage its industrial value drivers even more. Across its business, Equinor is targeting opportunities that play to its strength.
Melkøya in Hammerfest, Norway
Equinor is actively shaping its future portfolio guided by the following strategic principles:
· Cash generation capacity – generating positive cash flows from operations, even at low oil and gas prices, in order to sustain dividend and investment capacity through the economic cycles
· Capex flexibility – having sufficient flexibility in organic capital expenditure to be able to respond to market downturns and avoid value destructive measures as well as ability to always prioritise
· Capture value from cycles – ensuring the ability and capacity to act counter-cyclically to capture value through the cycles
· Low-carbon advantage – maintaining competitive advantage as a leading company in carbon-efficient oil and gas production, while building a low-carbon business to capture new opportunities in the energy transition
To deliver on the strategy, Equinor has identified four key strategic enablers that will continue to support the business’s needs:
· Safe and secure operations: Safety and security is Equinor’s top priority. In 2018, measures to reinforce safety in all areas including continued collaboration with partners and suppliers, were initiated. The corporate wide activities focus on safety (I am safety), security (2020 Security roadmap), and IT security (New information technology strategy). In 2018, Equinor achieved an all-time low serious incident frequency.
· Technology and innovation: Equinor's technology strategy provides long-term guidance for technology development and implementation. In 2018, Equinor continued delivering on its digital roadmap. A key activity is building a cloud-based data platform designed to make data available anytime, anywhere. Safeguarding the company from cyber threats remains a key focus area for the company. In 2018, integrated operation centers were opened in Austin and Bergen as well as the Geo operations centre and automated drilling control is increasingly being used to reduce drilling cost.
16 Equinor, Annual Report on Form 20-F 2018
· Empowered people: Equinor promotes a culture of collaboration, innovation and safety, guided by its values. A diverse and inclusive Equinor continues to develop its employees and attract talents to deliver on the future-fit portfolio ambition.
· Stakeholder engagement: Equinor engages with stakeholders to secure industrial legitimacy, its social contract, trust and strategic support from stakeholders. This engagement extends to internal and external collaboration, partnerships, and other co-operation with suppliers, partners, governments, NGOs and communities in which Equinor operates.
Equinor maintains its advantage as a leading company in carbon- efficient oil and gas production while building a low-carbon business to capture new opportunities in the energy transition. The company believes a lower carbon footprint will make it more competitive in the future and climate-related principles are embedded in the corporate strategy and performance and risk management. Further information can be found in section 2.12 Safety, security and sustainability.
Norwegian continental shelf – Transforming the NCS for continued high value creation and low carbon emissions for the coming decades
For more than 40 years, Equinor has explored, developed and produced oil and gas from the NCS. It represents approximately 60% of Equinor’s equity production at 1,288 mboe per day in 2018. Equinor aims to deepen and prolong its position by accessing and maturing opportunities into valuable production. At the same time, Equinor aims to continue to improve the efficiency, reliability, carbon emissions and lifespan of fields already in production. Strong volume growth is expected towards historically high production levels in 2025, representing significant value creation.
Equinor believes that the NCS holds substantial future potential and demonstrates its strategic commitment to the NCS through new development projects, new ways of working and asset optimisation, and continued exploration efforts for near infrastructure explorations as well as testing new plays. An extensive project portfolio holds large field developments, life-time extensions, subsea tie-back projects, and CO2-reducing measures. In the next few years, Equinor will bring several large projects on stream including Johan Sverdrup, Martin Linge, and Johan Castberg.
More information on assets in operations and projects under development is provided in section 2.3 E&P Norway – Exploration & Production Norway.
International oil and gas – Deepen core areas and develop growth options
Equinor has been growing its international portfolio for over 25 years. International oil and gas production represented approximately 40% of Equinor’s equity production at 823 mboe per day in 2018, a record-high year for production. During the year Equinor acquired and won attractive exploration licences in Brazil, Canada, the UK and the Gulf of Mexico to strengthen the exploration portfolio further.
As Equinor deepens in its international core areas in Brazil and the US, it will also develop future growth options across a broad portfolio. The share of operated equity production is expected to double over the next few years, allowing Equinor to add even more value as an operator. Equinor is drawing on more than 40 years of experience from the NCS in the future development of Bay du Nord and Rosebank. Other major assets in Equinor’s project portfolio include Mariner, Vito, Peregrino phase 2, Carcará, BM-C-33, North Komsomolskoye, North Platte and Block 17 satellites in Angola.
As well as pursuing growth options, Equinor is focused on continuing to deliver on cost improvements across its international portfolio, reducing carbon emissions and implementing digital solutions to maximise value.
In the United States, Equinor continued to focus on increasing and sustaining the profitability of existing assets in the portfolio, achieving a portfolio net operating income break-even below the target of USD 50 per barrel and contributing substantial positive cash flow. In Brazil, Equinor is sustaining and growing a competitive portfolio of high-quality assets in all development phases, including a strong exploration portfolio.
More information on assets in operations and projects under development internationally is provided in section 2.4 E&P International – Exploration & Production International.
New energy solutions – Create a material new industrial position
Equinor continues to explore new business opportunities in offshore wind, solar, hydrogen and carbon capture and storage (CCS). Equinor is building a new energy portfolio and expects 15-20% of its investments to be directed towards new energy solutions by 2030.
The development of the Arkona offshore wind farm (operated by E.ON) is progressing and is expected to be in full operation in 2019. Equinor has also acquired three early phase offshore wind projects in Poland during 2018: MFW Bałtyk I, II and III. In the US, Equinor continues to mature the New York Wind energy area and will bid for offtake contracts both in New York and New Jersey. In 2018, Equinor acquired one of three offshore wind leases offered outside Massachusetts and a minority stake in Scatec Solar.
Equinor is operating three offshore windfarms in the UK: Sheringham Shoal, Dudgeon and Hywind Scotland. The Apodi solar plant in Brazil (operated by Scatec Solar) started commercial operations in November 2018. In 2018, Equinor Energy Ventures continued its investments in potential high-impact technologies supporting the company’s strategy of growth in new energy solutions.
More information on new energy assets in operation and projects under development is provided in section 2.6 Other group.
Equinor, Annual Report on Form 20-F 2018 17
Midstream and marketing – Secure premium market access and grow value creation through cycles
The main objective for Equinor’s Midstream, Marketing & Processing unit’s (MMP) mid- and downstream activities is to process and transport its oil and gas production (including the Norwegian State’s petroleum) competitively to premium markets, securing maximum value realisation. In addition, MMP is expanding its marketing of a small, but growing electricity portfolio. Focus in 2018 has been on:
· Safe, secure and efficient operations
· Securing flow assurance and premium market access for Equinor’s equity production and the Norwegian State’s direct financial interest volumes
· Building and maintaining resilience through asset backed trading, value chain positioning and counter-cyclical actions
· Reducing carbon emissions and intensity
· Focus on regional piped gas value chains and pursue selective trading positions in liquefied natural gas (LNG)
In 2018, Equinor announced the acquisition of Danske Commodities and closed the transaction in the beginning of 2019. This is strengthening the company’s ability to capture value from its current and future equity production of renewable energy and supports Equinor’s aim to grow in new energy solutions. Equinor has continued to take positions to strengthen its asset backed trading business and focused on renewing its contracted shipping portfolio. More information on mid- and downstream activities is provided in section 2.5 MMP – Marketing, Midstream & Processing.
Group outlook
Equinor’s plans address the current business environment while continuing to invest in high-quality projects. Equinor continues to reiterate its efforts and commitment to deliver on its strategy.
· Organic capital expenditures1 for 2019 are estimated at around USD 11 billion
· Equinor intends to continue to mature its large portfolio of exploration assets and estimates a total exploration activity level of around USD 1.7 billion for 2019, excluding signature bonuses
· Equinor’s ambition is to keep the unit of production cost in the top quartile of its peer group
· For the period 2019 – 2025, production growth2 is expected to come from new projects resulting in around 3% CAGR (Compound annual growth rate)
· Production for 2019 is estimated to be around the 2018 level
· Scheduled maintenance activity is estimated to reduce quarterly production by approximately 15 mboe per day in the first quarter of 2019. In total, maintenance is estimated to reduce equity production by around 40 mboe per day for the full year of 2019
These forward-looking statements reflect current views about future events and are, by their nature, subject to significant risks and uncertainties because they relate to events and depend on circumstances that will occur in the future. Deferral of production to create future value, gas off-take, timing of new capacity coming on stream, operational regularity, activity level in the US onshore, as well as uncertainty around the closing of the announced transactions represent the most significant risks related to the foregoing production guidance. For further information, see section 5.7 Forward-looking statements.
1 See section 5.2 for non-GAAP measures.
2 The production guidance reflects our estimates of proved reserves calculated in accordance with US Securities and Exchange Commission (SEC) guidelines and additional production from other reserves not included in proved reserves estimates. The growth percentage is based on historical production numbers, adjusted for portfolio measures.
18 Equinor, Annual Report on Form 20-F 2018
History in brief
“ | Equinor has grown along with the emergence of the Norwegian oil and gas industry, dating back to the late 1960s. Today, Equinor are evolving into a broad energy company, with a significant and growing renewables business. |
On 18 September 1972, Equinor, formerly Statoil, was formed by a decision of the Norwegian parliament and incorporated as a limited liability company under the name Den norske stats oljeselskap AS. Owned 100% by the Norwegian State, Equinor's initial role was to be the government's commercial instrument in the development of the oil and gas industry in Norway. Growing in parallel with the Norwegian oil and gas industry, Equinor’s operations were primarily focused on exploration, development and production of oil and gas on the Norwegian continental shelf (NCS).
Two years later the Statfjord field was discovered in the North Sea. In 1979, the Statfjord field commenced production, and in 1981 Equinor was the first Norwegian company to be given operatorship for a field, at Gullfaks in the North Sea.
During the 1980s and 1990s, Equinor grew substantially through the development of the NCS (Statfjord, Gullfaks, Oseberg, Troll and others). Equinor also became a major player in the European gas market by entering into large sales contracts for the development and operation of gas transport systems and terminals. During the same decade, Equinor was involved in manufacturing and marketing in Scandinavia and established a comprehensive network of service stations. This line of business was fully divested in 2012.
In 2001, Equinor was listed on the Oslo and New York stock exchanges and became a public limited company under the name Statoil ASA, now Equinor ASA, 67% majority owned by the Norwegian State. Equinor’s ability to fully realise the potential of the NCS and grow internationally was strengthened through the merger with Hydro's oil and gas division on 1 October 2007.
Equinor’s business has grown as a result of substantial investments on the NCS and internationally. Equinor has delivered the world’s longest multiphase pipelines on the Ormen Lange and Snøhvit gas fields, and the giant Ormen Lange development project was completed in 2007. Equinor has also expanded into Algeria, Angola, Azerbaijan, Brazil, Nigeria, UK, the US Gulf of Mexico, among others. The US onshore operations are the largest international production outside Norway, and with the Peregrino field, we are the largest international operator in Brazil.
In addition, our access to crude oil in the form of equity, governmental and third-party volumes make Equinor a large seller of crude oil, and Equinor is the second-largest supplier of natural gas to the European market. Processing, refining, offshore wind and carbon capture and storage are also part of our operations.
In recent years, Equinor has utilised its expertise to design and manage operations in various environments to grow upstream activities outside the traditional area of offshore production. This includes the development of shale oil and gas projects.
As part of Equinor’s strategy, the company is investing actively in new energy, such as offshore wind, and solar energy, in order to expand energy production, strengthen energy security and combat climate change.
In 2018, Statoil ASA changed its name to Equinor ASA following approval of the name change by the company’s annual general meeting on 15 May 2018. The new name supports the company’s strategy and development as a broad energy company in addition to reflecting Equinor’s evolution and identity as a company for the generations to come.
Equinor, Annual Report on Form 20-F 2018 19
“ | Equinor is among the world’s largest offshore operators, the second-largest gas exporter to Europe, and a growing force in renewables. Equinor is the world leader in carbon capture, storage and carbon efficiency in oil and gas production. While seeking to satisfy growing energy demand, Equinor recognises the need to minimise impact on the environment. |
Equinor operates in more than 30 countries and employs 20,525 people worldwide.
Equinor’s registered office is at Forusbeen 50, 4035 Stavanger, Norway. The telephone number of its registered office is +47 51 99 00 00.
Equinor’s competitive position
Key factors affecting competition in the oil and gas industry are oil and gas supply and demand, exploration and production costs, global production levels, alternative fuels, and environmental and governmental regulations. When acquiring assets and licences for exploration, development and production and in refining, marketing and trading of crude oil, natural gas and related products, Equinor competes with other integrated oil and gas companies.
Equinor continues to explore new business opportunities in offshore wind, solar, hydrogen and carbon capture and storage (CCS). Improvements in cost and technology for renewables have rapidly changed the landscape. Equinor competes with other companies within the renewable business.
Equinor's ability to remain competitive will depend, among other things, on continuous focus on reducing costs and improving efficiency. It will also depend on technological innovation to maintain long-term growth in reserves and production, the ability to seize opportunities in new areas and utilise new opportunities for digitalisation.
The information about Equinor's competitive position in the strategic report is based on a number of sources; e.g. investment analyst reports, independent market studies, and internal assessments of market share based on publicly available information about the financial results and performance of market players.
Corporate structure
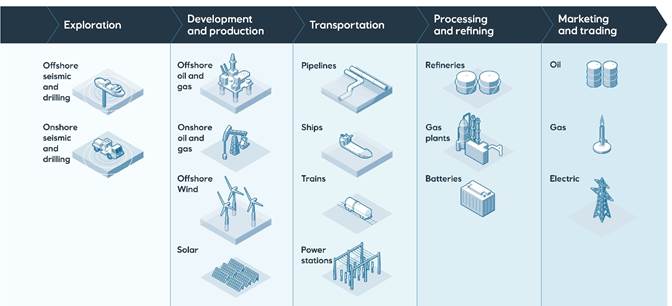
Equinor is a broad international energy company, its value chain includes all phases from exploration of hydrocarbons through developing, production and manufacturing marketing and trading, while growing the renewables business. Equinor consists of eight business areas, staffs and support divisions.
Equinor’s value chain
Equinor’s operations are managed through eight business areas: Development & Production Norway (DPN), Development & Production International (DPI), Development & Production Brazil (DPB), Marketing, Midstream & Processing (MMP), New Energy Solutions (NES), Technology, Projects & Drilling (TPD), Exploration (EXP) and Global Strategy & Business Development (GSB). With
20 Equinor, Annual Report on Form 20-F 2018
effect from the third quarter 2018, DPB is a new business area, and former Development & Production USA (DPUSA) is included in DPI.
On 28 April 2018, Equinor announced changes of its business area structure to strengthen its ability to deliver on Equinor’s always safe, high value and low carbon strategy as it develops as a broad energy company. Brazil was established as a separate business area representing a new core area, holding promising offshore oil and gas basins with a significant resource base. Equinor’s US operations were integrated in DPI as US operations have been maturing over the last few years. Equinor is pursuing unconventional onshore business opportunities globally and sees synergies in having US onshore operations which are organised within DPI.
Development & Production Norway (DPN)
Managing Equinor’s upstream activities on the NCS, DPN explores for and extracts crude oil, natural gas and natural gas liquids in the North Sea, the Norwegian Sea and the Barents Sea. DPN aims to ensure safe and efficient operations and transform the NCS to deliver sustainable value for many decades. DPN is shaping the future of the NCS with a digital transformation and solutions to achieve a lower carbon footprint and high recovery rates.
Development & Production International (DPI)
DPI manages Equinor’s worldwide upstream activities in all countries outside Norway and Brazil. DPI operates across six continents covering offshore and onshore exploration and extraction of crude oil, natural gas and natural gas liquids; and implementing rigorous safety standards, technological innovations and environmental awareness. DPI's intent is to build and grow a competitive international portfolio - always safe, high value and low carbon.
Development & Production Brazil (DPB)
DPB manages the development and production of oil and gas resources in Brazil, which has been defined as a core area for long-term growth. Equinor has a diverse portfolio with activities in all development stages from exploration to production. Most of Brazil licences are in deep-water areas, some of them more than 2,900 metres deep. Equinor has been producing in Brazil since 2011 with the Peregrino field, in the Campos Basin. DPB's intent is to grow a competitive portfolio creating value by increasing capacity and increasing recovery from mature fields; reducing emissions and safety as priority.
Marketing, Midstream & Processing (MMP)
MMP works to maximise the value creation in Equinor’s global mid- and downstream positions. MMP is responsible for global marketing and trading of crude, petroleum products, natural gas and electricity, including marketing of the Norwegian State’s natural gas and crude on the Norwegian continental shelf. MMP is also responsible for onshore plants, transportation and for the development of value chains to ensure flow assurance for Equinor’s upstream production and to maximise value creation.
Technology, Projects & Drilling (TPD)
TPD is responsible for field development, well deliveries, technology development and procurement in Equinor. TPD delivers safe, secure and efficient field development, including well construction, founded on world-class project execution and technology excellence. TPD utilises innovative technologies, digital solutions and carbon-efficient concepts to shape a competitive project portfolio at the forefront of the energy industry transformation. Sustainable value is being created together with suppliers through a simplified and standardised fit-for-purpose approach.
Exploration (EXP)
EXP manages Equinor’s worldwide exploration activities with the aim of positioning Equinor as one of the leading global exploration companies. This is achieved through accessing high potential new acreage in priority basins, globally prioritising and drilling more significant wells in growth and frontier basins, delivering near-field exploration on the NCS and other select areas, and achieving step-change improvements in performance.
New Energy Solutions (NES)
NES reflects Equinor’s long-term goal to complement Equinor’s oil and gas portfolio with profitable renewable energy and other low-carbon energy solutions. NES is responsible for wind farms and carbon capture and storage as well as other renewable energy and low-carbon energy solutions. NES aims to do this by combining Equinor’s oil and gas competence, project delivery capacities and ability to integrate technological solutions.
Global Strategy & Business Development (GSB)
GSB develops the corporate strategy and manages business development and merger and acquisition activities for Equinor. The ambition of the GSB business area is to closely link corporate strategy, business development and merger and acquisition activities to actively drive Equinor's corporate development.
Equinor, Annual Report on Form 20-F 2018 21
Segment reporting
The business areas DPI and DPB are aggregated into the reporting segment Exploration & Production International (E&P International). The aggregation has its basis in similar economic characteristics, such as the assets’ long term and capital-intensive nature and exposure to volatile oil and gas commodity prices, the nature of products, service and production processes, the type and class of customers, the methods of distribution and regulatory environment. The reporting segments Exploration & Production Norway (E&P Norway) and MMP consists of the business areas DPN and MMP respectively. The business areas NES, GSB, TPD, EXP and corporate staffs and support functions are aggregated into the reporting segment “Other” due to the immateriality of these areas. The changes in the business area structure had no effect on the reporting segments.
Most of costs within the business areas GSB, TPD and EXP are allocated to the E&P International, E&P Norway and MMP reporting segments. Activities relating to the EXP business area are fully allocated to the relevant exploration and production reporting segments. Activities relating to the TPD, GSB business areas and corporate staffs and support functions are partly allocated to the relevant exploration and production and MMP reporting segments.
Internal transactions in oil and gas volumes occur between reporting segments before being sold in the market. The pricing policy for internal transfers is based on estimated market prices. For further information, see section 2.8 Operational performance under Production volumes and prices.
Equinor eliminates intercompany sales when combining the results of reporting segments. Intercompany sales include transactions recorded in connection with oil and natural gas production in the E&P Norway and the E&P International reporting segments, and in connection with the sale, transportation or refining of oil and natural gas production in the MMP reporting segment. Certain types of transportation costs are reported in both the MMP and the E&P International segments.
The E&P Norway segment produces oil and natural gas which is sold internally to the MMP segment. A large share of the oil produced by the E&P International segment is also sold through the MMP segment. The remaining oil and gas from the E&P International segment is sold directly in the market. For intercompany sales and purchases, Equinor has established a market-based transfer pricing methodology for the oil and natural gas that meets the requirements for applicable laws and regulations.
In 2018, the average transfer price for natural gas was USD 5.65 per mmbtu. The average transfer price was USD 4.33 per mmbtu in 2017 and USD 3.42 in 2016. For the oil sold from the E&P Norway segment to the MMP segment, the transfer price is the applicable market-reflective price minus a cost recovery rate.
22 Equinor, Annual Report on Form 20-F 2018
The following table shows certain financial information for the four reporting segments, including intercompany eliminations for each of the years in the three-year period ending 31 December 2018.
For additional information, see note 3 Segments to the Consolidated financial statements.
Presentation
In the following sections of this report, the description of the operations and financial review are discussed following the reporting segments presentation.
As required by the SEC, Equinor prepares its disclosures about oil and gas reserves and certain other supplementary oil and gas disclosures based on geographic areas. Equinor’s geographical areas are defined by country and continent and consist of Norway, Eurasia excluding Norway, Africa, US and Americas excluding US.
Segment performance | | | |
| | | | |
| For the year ended 31 December |
(in USD million) | 2018 | 2017 | 2016 |
| | | | |
Exploration & Production Norway | | | |
Total revenues and other income | 22,475 | 17,692 | 13,077 |
Net operating income/(loss) | 14,406 | 10,485 | 4,451 |
Non-current segment assets1) | 30,762 | 30,278 | 27,816 |
| | | | |
Exploration & Production International | | | |
Total revenues and other income | 12,399 | 9,256 | 6,657 |
Net operating income/(loss) | 3,802 | 1,341 | (4,352) |
Non-current segment assets1) | 38,672 | 36,453 | 36,181 |
| | | | |
Marketing, Midstream & Processing | | | |
Total revenues and other income | 75,794 | 59,071 | 44,979 |
Net operating income/(loss) | 1,906 | 2,243 | 623 |
Non-current segment assets1) | 5,148 | 5,137 | 4,450 |
| | | | |
Other | | | |
Total revenues and other income | 280 | 87 | 39 |
Net operating income/(loss) | (79) | (239) | (423) |
Non-current segment assets1) | 353 | 390 | 352 |
| | | | |
Eliminations2) | | | |
Total revenues and other income | (31,355) | (24,919) | (18,880) |
Net operating income/(loss) | 103 | (59) | (219) |
Non-current segment assets1) | - | - | - |
| | | | |
Equinor group | | | |
Total revenues and other income | 79,593 | 61,187 | 45,873 |
Net operating income/(loss) | 20,137 | 13,771 | 80 |
Non-current segment assets1) | 74,934 | 72,258 | 68,799 |
| | | | |
1) | Equity accounted investments, deferred tax assets, pension assets and non-current financial assets are not allocated to segments. |
2) | Includes elimination of inter-segment sales and related unrealised profits, mainly from the sale of crude oil and products. Inter-segment revenues are based upon estimated market prices. |
| |
Equinor, Annual Report on Form 20-F 2018 23
The following tables show total revenues and other income by country.
2018 Total revenues and other income by country | Crude oil | Natural gas | Natural gas liquids | Refined products | Other | Total sales |
(in USD million) |
| | | | | | |
Norway | 30,221 | 12,441 | 5,969 | 8,299 | 1,483 | 58,412 |
US | 9,113 | 1,575 | 1,198 | 1,790 | 444 | 14,120 |
Denmark | 0 | 0 | 0 | 2,533 | 22 | 2,556 |
United Kingdom | 653 | 0 | 0 | 0 | 124 | 777 |
Other | 962 | 543 | 0 | 502 | 1,430 | 3,436 |
| | | | | | |
Total revenues and other income1) | 40,948 | 14,559 | 7,167 | 13,124 | 3,503 | 79,301 |
| | | | | | |
2017 Total revenues and other income by country | Crude oil | Natural gas | Natural gas liquids | Refined products | Other | Total sales |
(in USD million) |
| | | | | | |
Norway | 23,087 | 9,741 | 4,948 | 6,463 | 1,026 | 45,264 |
US | 5,726 | 1,237 | 668 | 1,497 | 1,237 | 10,365 |
Sweden | 0 | 0 | 0 | 1,268 | 10 | 1,277 |
Denmark | 0 | 0 | 0 | 2,195 | 12 | 2,208 |
Other | 706 | 442 | 31 | 0 | 705 | 1,884 |
| | | | | | |
Total revenues and other income1) | 29,519 | 11,420 | 5,647 | 11,423 | 2,990 | 60,999 |
| | | | | | |
| | | | | | |
2016 Total revenues and other income by country | Crude oil | Natural gas | Natural gas liquids | Refined products | Other | Total sales |
(in USD million) |
| | | | | | |
Norway | 20,544 | 7,973 | 3,580 | 4,135 | (497) | 35,735 |
US | 3,073 | 957 | 455 | 1,110 | 867 | 6,463 |
Sweden | 0 | 0 | 0 | 1,379 | (53) | 1,326 |
Denmark | 0 | 0 | 0 | 1,518 | 14 | 1,532 |
Other | 690 | 272 | 1 | 0 | (26) | 936 |
| | | | | | |
Total revenues and other income1) | 24,307 | 9,202 | 4,036 | 8,142 | 305 | 45,993 |
|
1) Excluding net income (loss) from equity accounted investments |
| | | | | | |
| | | | | | |
Research and development
Equinor is a technology-intensive company and research and development is an integral part of our strategy. The technology strategy is about prioritising technology for value creation that enables growth and access, and sets the direction for technology development and implementation for the future. The focus is on low cost, low carbon solutions and re-using standardised technologies.
We continuously research, develop and deploy innovative technologies to create opportunities and enhance the value of Equinor’s current and future assets. Equinor’s technology development activities aim to reduce field development, drilling and operating costs, and CO2 and other greenhouse gas emissions. We utilise a range of tools for the development of new technologies:
· In-house research and development
· Cooperation with academia and research institutes
· Collaborative development projects with major suppliers
· Project related development as part of field development activities
· Direct investment in technology start-up companies through Equinor Technology Invest venture activities
· Invitation to open innovation challenges as part of Equinor Innovate
24 Equinor, Annual Report on Form 20-F 2018
For additional information, see note 7 Other expenses to the Consolidated financial statements.
Equinor, Annual Report on Form 20-F 2018 25
Key figures | | | | | |
| | | | | | |
(in USD million, unless stated otherwise) | For the year ended 31 December |
2018 | 2017 | 2016 | 2015 | 2014 |
| | | | | | |
Financial information | | | | | |
Total revenues and other income | 79,593 | 61,187 | 45,873 | 59,642 | 99,264 |
Operating expenses | (9,528) | (8,763) | (9,025) | (10,512) | (11,657) |
Net operating income/(loss) | 20,137 | 13,771 | 80 | 1,366 | 17,878 |
Net income/(loss) | 7,538 | 4,598 | (2,902) | (5,169) | 3,887 |
Non-current finance debt | 23,264 | 24,183 | 27,999 | 29,965 | 27,593 |
Net interest-bearing debt before adjustments | 11,130 | 15,437 | 18,372 | 13,852 | 12,004 |
Total assets | 112,508 | 111,100 | 104,530 | 109,742 | 132,702 |
Total equity | 42,990 | 39,885 | 35,099 | 40,307 | 51,282 |
Net debt to capital employed ratio before adjustments1) | 20.6% | 27.9% | 34.4% | 25.6% | 19.0% |
Net debt to capital employed ratio adjusted1) | 22.2% | 29.0% | 35.6% | 26.8% | 20.0% |
ROACE2) | 12.0% | 8.2% | (0.4%) | 4.1% | 8.7% |
| | | | | | |
Operational data | | | | | |
Equity oil and gas production (mboe/day) | 2,111 | 2,080 | 1,978 | 1,971 | 1,927 |
Proved oil and gas reserves (mmboe) | 6,175 | 5,367 | 5,013 | 5,060 | 5,359 |
Reserve replacement ratio (annual) | 2.13 | 1.50 | 0.93 | 0.55 | 0.62 |
Reserve replacement ratio (three-year average) | 1.53 | 1.00 | 0.70 | 0.81 | 0.97 |
Production cost equity volumes (USD/boe) | 5.2 | 4.8 | 5.0 | 5.9 | 7.6 |
Average Brent oil price (USD/bbl) | 71.1 | 54.2 | 43.7 | 52.4 | 98.9 |
| | | | | | |
Share information3) | | | | | |
Diluted earnings per share (in USD) | 2.27 | 1.40 | (0.91) | (1.63) | 1.21 |
Share price at OSE (Norway) on 31 December (in NOK) | 183.75 | 175.20 | 158.40 | 123.70 | 131.20 |
Share price at NYSE (USA) on 31 December (in USD) | 21.17 | 21.42 | 18.24 | 13.96 | 17.61 |
Dividend paid per share (in USD)4) | 0.91 | 0.88 | 0.88 | 0.90 | 1.73 |
Weighted average number of ordinary shares outstanding (in millions) | 3,326 | 3,268 | 3,195 | 3,179 | 3,180 |
| | | | | | |
1) | See section 5.2 Use and reconciliation of non-GAAP financial measures for net debt to capital employed ratio. |
2) | See section 5.2 Use and reconciliation of non-GAAP financial measures for return on average capital employee (ROACE). |
3) | See section 5.1 Shareholder information for a description of how dividends are determined and information on share repurchases. |
4) | Dividends for the third and fourth quarter 2017 and the first and second quarter 2018 were paid in 2018. Dividend paid in 2014 includes yearly dividend related to 2013 and two quarterly dividends related to 2014 due to change from yearly to quarterly dividend. From and including the third quarter of 2015, dividends were declared in USD. Dividends in previous periods were declared in NOK. Figures for 2015 and earlier periods are presented using the Central Bank of Norway year end rates for NOK. |
26 Equinor, Annual Report on Form 20-F 2018
2.3Exploration & Production Norway
(E&P Norway) |
Overview
The Exploration & Production Norway segment covers exploration, field development and operations on the NCS, which includes the North Sea, the Norwegian Sea and the Barents Sea. E&P Norway aims to ensure safe and efficient operations, maximising the value potential from the NCS.
For 2018, Equinor reports production on the NCS from 40 Equinor-operated fields, 10 partner-operated fields, as well as equity-accounted production from Lundin Petroleum AB.
Key events and portfolio developments in 2018 and early 2019:
· Equinor was on 16 January 2018 awarded 31 licences (17 as operator) on the NCS in the Awards for predefined areas round 2017 for mature areas
· Equinor acquired Total’s equity share of the Martin Linge oil and gas field development, effective as of 1 January, and assumed operatorship on 19 March
· A subsea development of the Askeladd gas /condensate discovery near the Snøhvit field in the Barents Sea was sanctioned on 7 March
· Two newbuild category J jack-up rigs were brought in operation: Askepott started drilling on 25 February, spudding the first well at the new field Oseberg Vestflanken 2. The second rig, Askeladden, started operations at Gullfaks on 26 March. These newbuilds increase the safety and efficiency of drilling operations
· In the 24th concession round for frontier areas Equinor was on 18 June awarded seven licences (five as operator) in the Norwegian Sea and the Barents Sea
· The Ministry of Petroleum and Energy approved the Plan for development and operation of the Johan Castberg oil field in the Barents Sea on 28 June
· The Ministry of Petroleum and Energy on 5 July approved the plan for development and operation of Snorre Expansion, expected to increase the oil recovery from the Snorre field and extend field life beyond 2040
· Visund Nord improved oil recovery came on stream on 2 September. This record fast-track development took 21 months from concept selection until production started and will provide additional oil barrels from Visund, 6% more than originally estimated
· A new gas treatment module Z at Troll B came on stream on 22 September, expected to boost production at Troll B by 4.7 million barrels of oil
· The power solution which will provide the Johan Sverdrup field with electric power from Kårstø through an 80 kV submarine cable, was officially opened on 9 October
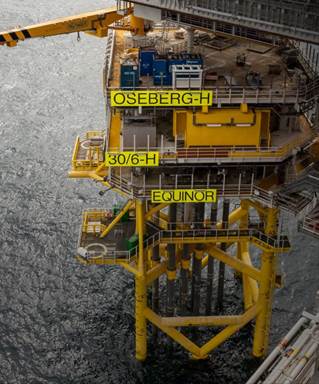
“ | Oseberg Vestflanken 2 achieved first oil on 14 October. The new Oseberg H platform is Norway’s first unmanned platform and will be remotely controlled from the Oseberg field centre |
Equinor, Annual Report on Form 20-F 2018 27
· Equinor announced on 15 October the sales of its equity share in two gas and condensate discoveries in the Ekofisk area of the NCS. An operated interest in King Lear was sold to Aker BP for USD 250 million, and a non-operated interest in Tommeliten to PGNiG for USD 220 million. The transactions were completed on 28 December
· Strengthening the position in the Norwegian Sea, Equinor on 5 December agreed with Faroe Petroleum on several swap transactions with no cash considerations, effective as of 1 January 2019. The transactions increase Equinor’s equity share of the prolific Njord area and reduce its share in non-core assets
· The Ministry of Petroleum and Energy approved on 7 December the plan for development and operation of Troll phase 3, expected to boost gas recovery from the Troll field and extend field life beyond 2050
· The power solution which will provide the Martin Linge field with electric power from Kollsnes through the 100 kV alternating current 163-km submarine cable, was connected on 12 December. This is the world’s longest high-voltage alternating current submarine cable
· The Government issued a white paper to the Norwegian parliament on 14 December, recommending approval of the plan for development and operation of the second phase of the Johan Sverdrup oil and gas field, Norway’s largest industrial project. The plan was submitted to the Ministry of Petroleum and Energy on 27 August
“ | First gas from the Aasta Hansteen field in the Norwegian Sea was achieved on 16 December. At 1,300 metres, the development is the deepest ever on the NCS. The gas is piped from three subsea templates to the floating platform and transported in the Polarled pipeline to the Nyhamna processing plant in Norway for further export through the Langeled pipeline to the UK. The subsea development of the adjacent Snefrid North discovery is underway and will be tied in to the Aasta Hansteen platform |
28 Equinor, Annual Report on Form 20-F 2018
· The plan for development and operation of Shetland/Lista phase 2 was submitted to the Ministry of Petroleum and Energy on 15 January 2019. Water injection and new horizontal wells are expected to boost production at Gullfaks by 17 million barrels of oil
· Equinor was on 15 January 2019 awarded 29 licences (13 as operator) on the NCS in the Awards for predefined areas round 2018 for mature areas
· Two new onshore digital support centres, expected to increase value creation, improve safety and lower emissions from Equinor’s installations on the NCS, were officially opened at Sandsli, Bergen, on 7 January 2019. Within a few years, all Equinor-operated fields on the NCS will be supported by onshore operational centres
· Equinor and its partners made nine commercial discoveries on the NCS in 2018

Demonstration of the digital twin of the Valemon platform, remotely controlled from Bergen, Norway.
Equinor, Annual Report on Form 20-F 2018 29
Major producing fields and field developments operated by Equinor and Equinor’s licence partners
Fields in production on the NCS
The table below shows E&P Norway's average daily entitlement production for the years ending 31 December 2018, 2017 and 2016. Production in 2018 decreased owing to natural decline and higher losses associated with turnarounds.
Average daily entitlement production | | | | | | | | | | |
| | | | | | | | | | | |
| For the year ended 31 December |
| 2018 | | 2017 | | 2016 |
| Oil and NGL | Natural gas | | | Oil and NGL | Natural gas | | | Oil and NGL | Natural gas | |
Area production | mbbl/day | mmcm/day | mboe/day | | mbbl/day | mmcm/day | mboe/day | | mbbl/day | mmcm/day | mboe/day |
| | | | | | | | | | | |
Equinor operated fields | 470 | 99 | 1,090 | | 505 | 100 | 1,136 | | 511 | 86 | 1,049 |
Partner operated fields | 79 | 16 | 181 | | 70 | 17 | 179 | | 70 | 17 | 177 |
Equity accounted production | 16 | - | 16 | | 19 | - | 19 | | 8 | - | 8 |
| | | | | | | | | | | |
Total | 565 | 115 | 1,288 | | 594 | 118 | 1,334 | | 589 | 103 | 1,235 |
30 Equinor, Annual Report on Form 20-F 2018
The following tables show the NCS entitlement production by fields in which Equinor was participating during the year ended 31 December 2018.
Equinor operated fields, average daily entitlement production | | | | | |
| | | | | | | |
| Geographical area | Equinor's equity interest in % | | On stream | Licence expiry date | | Average production in 2018 mboe/day |
| |
Field | |
| | | | | | | |
Troll Phase 1 (Gas) | The North Sea | 30.58 | | 1996 | 2030 | | 207 |
Gullfaks | The North Sea | 51.00 | | 1986 | 2036 | | 99 |
Åsgard | The Norwegian Sea | 34.57 | | 1999 | 2030 | 7) | 85 |
Oseberg | The North Sea | 49.30 | | 1988 | 2031 | | 76 |
Visund | The North Sea | 53.20 | | 1999 | 2034 | | 76 |
Snøhvit | The Barents Sea | 36.79 | | 2007 | 2035 | | 50 |
Tyrihans | The Norwegian Sea | 58.84 | | 2009 | 2029 | | 49 |
Kvitebjørn | The North Sea | 39.55 | | 2004 | 2031 | | 47 |
Grane | The North Sea | 36.61 | | 2003 | 2030 | | 44 |
Sleipner Vest | The North Sea | 58.35 | | 1996 | 2028 | | 38 |
Troll Phase 2 (Oil) | The North Sea | 30.58 | | 1995 | 2030 | | 34 |
Snorre | The North Sea | 33.28 | | 1992 | 2040 | 1) | 31 |
Statfjord Unit | The North Sea | 44.34 | | 1979 | 2026 | | 31 |
Gina Krog | The North Sea | 58.70 | | 2017 | 2032 | | 30 |
Gudrun | The North Sea | 36.00 | | 2014 | 2028 | | 27 |
Valemon | The North Sea | 53.78 | | 2015 | 2031 | | 23 |
Mikkel | The Norwegian Sea | 43.97 | | 2003 | 2024 | | 22 |
Fram | The North Sea | 45.00 | | 2003 | 2024 | | 18 |
Kristin | The Norwegian Sea | 55.30 | | 2005 | 2027-2033 | 2) | 17 |
Alve | The Norwegian Sea | 53.00 | | 2009 | 2029 | 3) | 14 |
Vigdis area | The North Sea | 41.50 | | 1997 | 2040 | 1) | 11 |
Heidrun | The Norwegian Sea | 13.04 | | 1995 | 2024-2025 | | 9 |
Morvin | The Norwegian Sea | 64.00 | | 2010 | 2027 | | 9 |
Urd | The Norwegian Sea | 63.95 | | 2005 | 2026 | | 7 |
Tordis area | The North Sea | 41.50 | | 1994 | 2040 | 1) | 7 |
Sleipner Øst | The North Sea | 59.60 | | 1993 | 2028 | | 7 |
Norne | The Norwegian Sea | 60.00 | | 1997 | 2036 | 7) | 5 |
Gungne | The North Sea | 62.00 | | 1996 | 2028 | | 4 |
Byrding | The North Sea | 70.00 | | 2017 | 2024-2035 | | 3 |
Sigyn | The North Sea | 60.00 | | 2002 | 2022 | 1) | 2 |
Veslefrikk | The North Sea | 18.00 | | 1989 | 2020-2031 | | 2 |
Statfjord Nord | The North Sea | 21.88 | | 1995 | 2026 | | 2 |
Tune | The North Sea | 50.00 | | 2002 | 2020-2032 | | 1 |
Statfjord Øst | The North Sea | 31.69 | | 1994 | 2026-2040 | | 1 |
Heimdal | The North Sea | 29.44 | | 1985 | 2021 | | 1 |
Sygna | The North Sea | 30.71 | | 2000 | 2026-2040 | | 1 |
Aasta Hansteen | The Norwegian Sea | 51.00 | | 2018 | 2041 | 4) | 0 |
Fram H Nord | The North Sea | 49.20 | | 2014 | 2024-2035 | 4) | 0 |
Sindre | The North Sea | 52.34 | | 2017 | 2023-2034 | 4) | 0 |
Gimle | The North Sea | 65.13 | | 2006 | 2023-2034 | 4) | 0 |
| | | | | | | |
Total Equinor operated fields | | | | | 1,090 |
| | | | | | | |
| | | | | | | |
| | | | | | | |
| | | | | | | |
| | | | | | | |
Equinor, Annual Report on Form 20-F 2018 31
Partner operated fields, average daily entitlement production | | | | | |
| | | | | | | |
| Geographical area | Equinor's equity interest in % | Operator | On stream | Licence expiry date | | Average production in 2018 mboe/day |
| |
Field | |
| | | | | | | |
Ormen Lange | The Norwegian Sea | 25.35 | A/S Norske Shell | 2007 | 2040-2041 | | 72 |
Skarv | The Norwegian Sea | 36.17 | Aker BP ASA | 2013 | 2029-2033 | | 37 |
Ivar Aasen | The North Sea | 41.47 | Aker BP ASA | 2016 | 2029-2036 | | 27 |
Goliat | The Barents Sea | 35.00 | Vår Energi AS5) | 2016 | 2042 | 5) | 22 |
Ekofisk area | The North Sea | 7.60 | ConocoPhillips Skandinavia AS | 1971 | 2028 | | 13 |
Marulk | The Norwegian Sea | 33.00 | Vår Energi AS5) | 2012 | 2025 | 3) | 6 |
Vilje | The North Sea | 0.00 | Aker BP ASA | 2008 | 2021 | 3) | 2 |
Ringhorne Øst | The North Sea | 0.00 | Vår Energi AS6) | 2006 | 2030 | 3) | 1 |
Enoch | The North Sea | 11.78 | Repsol Sinopec North Sea Ltd. | 2007 | 2024 | 4) | 0 |
Flyndre | The North Sea | 0.00 | Maersk Oil UK Ltd. | 2017 | 2028 | 3) 4) | 0 |
| | | | | | | |
Total partner operated fields | | | | | 181 |
| | | | | | | |
Equity accounted production | | | | | | | |
Lundin Petroleum AB | | 20.10 | Lundin Petroleum AB | | | | 16 |
| | | | | | | |
Total E&P Norway including share of equity accounted production | | | 1,288 |
1) Licence extended in 2018.
2) The field has licences with different expiration dates.
3) A swap of interests was agreed with Faroe Petroleum in 2018, effective 1 January 2019. The transactions are subject to authority approval. The table reflects the new Equinor ownership share, effective 1 January 2019 for the fields Vilje, Ringhorne Øst, Marulk and Alve.
4) The production is less than 1 mboe/day.
5) Formerly Eni Norge AS.
6) Formerly Point Resources AS.
7) Licence extended in early 2019.
.
Main producing fields on the NCS
Equinor-operated fields
Troll (Equinor 30.58%) is the largest gas field on the NCS and a major oil field. The Troll field regions are connected to the Troll A, B and C platforms. Troll gas is produced mainly at Troll A, and oil mainly at Troll B and C. Fram, Fram H Nord and Byrding are tie-ins to Troll C. The third phase of the Troll field is under development.
Gullfaks (Equinor 51%) was developed with three platforms. Since production started on Gullfaks in 1986, several satellite fields have been developed with subsea wells which are remotely controlled from the Gullfaks A and C platforms. Gullfaks Shetland Lista is being developed, with drilling of seven new horizontal wells.
The Åsgard field (Equinor 34.57%) includes the Åsgard A production and storage ship for oil, the Åsgard B semi-submersible floating production platform for gas and condensate, and the Åsgard C storage vessel for oil and condensate. Åsgard C is also storage for oil produced at Kristin and Tyrihans. In 2015 Equinor started the world’s first subsea gas compression train on Åsgard. The Trestakk development will be a tie-in to Åsgard A.
The Oseberg area (Equinor 49.30%) includes the Oseberg field centre, Oseberg C, Oseberg East and Oseberg South production platforms. Oil and gas from the satellites are transported to the Oseberg field centre for processing and transportation. The new Oseberg H unmanned platform came on stream in mid-October.
32 Equinor, Annual Report on Form 20-F 2018
Partner-operated fields
Ormen Lange (Equinor 25.35%, operated by A/S Norske Shell) is a deepwater gas field in the Norwegian Sea. The well stream is transported to an onshore processing and export plant at Nyhamna. Gassco became operator of Nyhamna from 1 October 2017, with Shell as technical service provider.
Skarv (Equinor 36.17%, operated by Aker BP ASA) is an oil and gas field in the Norwegian Sea. The field development includes a floating production, storage and offloading vessel and five subsea multi-well installations.
Ivar Aasen (Equinor 41.47%, operated by Aker BP ASA) is an oil and gas field in the North Sea. The development includes a fixed steel jacket with partial processing and living quarters tied in as a satellite to Edvard Grieg for further processing and export.
Goliat (Equinor 35%, operated by Vår Energi AS, formerly Eni Norge AS) is the first oil field developed in the Barents Sea. The field consists of subsea wells tied back to a circular floating production, storage and offloading vessel. The oil is offloaded to shuttle tankers.
Ekofisk area (Equinor 7.60%, operated by ConocoPhillips Skandinavia AS) consists of the Ekofisk, Tor, Eldfisk and Embla fields.
Marulk (Equinor 33%, operated by Vår Energi AS, formerly Eni Norge AS) is a gas and condensate field developed as a tie-back to the Norne FPSO.
Exploration on the NCS
Equinor holds exploration acreage and actively explores for new resources in all three regions on the NCS, the Norwegian Sea, the North Sea and the Barents Sea.
Equinor was awarded seven licences (five as operator) in the 24th concession round for frontier areas and 29 licences (13 as operator) in the Awards for predefined areas (APA) round 2018 for mature areas and completed several farm-in transactions with other companies.
Throughout 2018, as part of the industry initiative Barents Sea exploration collaboration (BaSEC), Equinor and its partners have continued drilling wells in the Barents Sea and are planning to continue drilling in 2019.
In 2018 Equinor and its partners completed 18 exploratory wells and made nine commercial and three non-commercial discoveries in Norway.
Exploratory wells drilled1) | | | |
| | | |
| For the year ended 31 December |
| 2018 | 2017 | 2016 |
| | | |
North Sea | | | |
Equinor operated | 5 | 7 | 9 |
Partner operated | 2 | 0 | 2 |
Norwegian Sea | | | |
Equinor operated | 4 | 4 | 2 |
Partner operated | 4 | 0 | 0 |
Barents Sea | | | |
Equinor operated | 2 | 5 | 0 |
Partner operated | 1 | 1 | 1 |
Total (gross) | 18 | 17 | 14 |
|
1) Wells completed during the year, including appraisals of earlier discoveries. |
Fields under development on the NCS
Equinor’s major development projects on the NCS as of 31 December 2018:
Equinor, Annual Report on Form 20-F 2018 33
Johan Sverdrup (Equinor 40.03%, operator, with additional 4.54% indirect interest held through Lundin) is an oil and gas discovery in the North Sea. The first phase of the development will consist of 18 producers, 16 water injectors, one observation well and a field centre with four platforms: A living quarter platform, a wellhead platform with permanent drilling facility, a processing platform and a riser and utility platform. Crude oil will be exported to Mongstad through a 283-km designated pipeline, and gas will be exported to the gas processing facility at Kårstø through a 156-km pipeline via a subsea connection to the Statpipe pipeline. The laying of the 36-inch oil pipe and the 18-inch gas pipe was completed in autumn 2018. The power-from-shore solution was officially opened on 9 October 2018. As at the end of 2018, eight production wells and twelve water injection wells have been drilled. First oil is expected in late 2019.
The plan for development and operation for the second phase of the Johan Sverdrup field was submitted to the Ministry of Petroleum and Energy on 27 August. The development includes a new processing platform linked to the field centre, five new subsea templates and 28 wells. Around one fourth of the oil from the Johan Sverdrup full field will be produced in the second phase. First oil is expected in late 2022
Johan Castberg (Equinor 50%, operator) is the development of the three oil discoveries Skrugard, Havis and Drivis, located some 240 kilometres northwest of Hammerfest in the Barents Sea. The development includes a production vessel and a subsea development with 30 wells, ten subsea templates and two satellite structures. On 28 June 2018, the Norwegian authorities approved the Plan for development and operation of the field. The first steel cut for the topside of the Johan Castberg floating production, storage and offloading unit was made at Kværner’s yard at Stord in November 2018. First oil is expected in late 2022.
Martin Linge (Equinor 70%, operator from 19 March 2018) is an oil and gas field near the British sector of the North Sea. The reservoir is complex with gas under high pressure and high temperatures. Effective as of January 1, 2018, Equinor acquired Total’s interest and assumed the operatorship. The development includes a fixed steel jacket platform with processing and export facilities, with electric power to be supplied from Kollsnes. The two process modules, living quarter and flare modules were successfully installed offshore in July 2018. The power-from-shore solution was energised on 12 December 2018. First oil is expected in 2020.
Snorre expansion (Equinor 33.28%, operator) is expected to increase oil recovery from the Snorre field and extend field life beyond 2040. The Ministry of Petroleum and Energy approved the plan for development and operation on 5 July 2018. The concept consists of six subsea templates, with four well slots each. Each slot will have the possibility for either production or injection. 24 wells will be drilled, twelve production wells and twelve injection wells. First oil is expected in 2021.
Njord future (Equinor 20%, operator) is a development to enable safe, reliable and efficient exploitation of the Njord and Hyme oil discoveries through to 2040. The development includes an upgrade of the Njord A floating platform, an optimal oil export solution and drilling of ten new wells. As part of the upgrade, the platform will be prepared to bring the nearby fields Bauge and Fenja on stream. The Plan for development and operation was approved on 20 June 2017. First oil is expected in late 2020.
Ærfugl (Equinor 36.17%, operated by Aker BP) is the development of the gas and condensate discoveries Ærfugl and Snadd Outer fields in the Norwegian Sea, near the Skarv field, some 200 km west of Sandnessjøen. The field is being developed in two phases and includes six new production wells which will be tied into the Skarv floating production, storage and offloading vessel for processing and storage. The Ministry of Petroleum and Energy approved the plan for development and operation on 6 April 2018. The operator plans for first gas in late 2020.
Troll phase 3 (Equinor 30.58%, operator) is expected to increase gas recovery from the Troll field and extend field life beyond 2050. The Ministry of Petroleum and Energy approved the plan for development and operation on 7 December 2018. The subsea development includes two subsea templates, eight production wells, a 36-inch export pipeline and a new process module on the Troll A platform. First gas is expected in 2021.
Askeladd (Equinor 36.79%, operator) is the next plateau extender of the Snøhvit gas field in the Barents Sea. The development includes two subsea templates, a 42-km tie-back to Snøhvit and drilling of three gas producers. The project was sanctioned in March 2018. First gas is expected in late 2020.
Trestakk (Equinor 59.1%, operator) is an oil discovery with associated gas on Haltenbanken in the Norwegian Sea. It will be developed as a subsea tie-back to Åsgard A, comprising one subsea template and one satellite with three producers and two injectors. In March 2017, the Plan for development and operation was approved by the Norwegian authorities. During summer 2018, subsea production systems and pipelines were installed at the field. The first well of the Trestakk field development was spudded in November 2018. First oil is expected in 2019.
Utgard (Equinor 38.44% interest in the Norwegian and 38% in the UK sector, operator) is a gas and condensate discovery. The development includes two wells in a standard subsea concept, with one drilling target on each side of the UK-Norwegian maritime border in the North Sea. Gas and condensate will be piped through a new 21-km pipeline to the Sleipner field for processing and further transportation to market. In January 2017, the Plan for development and operation and the field development plan were approved by the Norwegian and UK authorities. The first well of the Utgard field development was spudded in September 2018. First gas is expected in second half of 2019.
34 Equinor, Annual Report on Form 20-F 2018
Decommissioning on the NCS
Under the Petroleum Act, the Norwegian government has imposed strict procedures for removal and disposal of offshore oil and gas installations. The convention for the protection of the marine environment of the Northeast Atlantic (OSPAR) stipulates similar procedures.
Volve (Equinor formerly 59.6%, operator) ceased production in September 2016, after more than eight years in production. The permanent plugging of wells was finalised during 2016, and the removal of the subsea facilities was completed in 2018. On 14 June 2018,
“ | Equinor and its partners announced the disclosure of all subsurface and operating data from Volve, to foster research, study, development and innovation. This is the most comprehensive NCS data release ever made. |
Huldra (Equinor 70%, operator) ceased production in September 2014, after 13 years in production. The permanent plugging and abandonment of wells was finalised in 2017, and the platform removal will take place in 2019.
Ekofisk (Equinor 7.6%, operated by ConocoPhillips Skandinavia AS): In the third removal campaign, some installations will be removed in 2019.
For further information about decommissioning, see note 2 Significant accounting policies to the Consolidated financial statements.
Equinor, Annual Report on Form 20-F 2018 35
2.4Exploration & Production International(E&P International) |
Overview
Equinor is present in several of the most important oil and gas provinces in the world. The E&P International segment covers development and production of oil and gas outside the Norwegian continental shelf (NCS).
E&P International is present in nearly 30 countries and had production in 12 countries in 2018. E&P International produced 39% of Equinor’s total equity production of oil and gas in 2018, compared to 36% in 2017. For information about proved reserves development see section 2.8 Operational Performance under Proved oil and gas reserves.
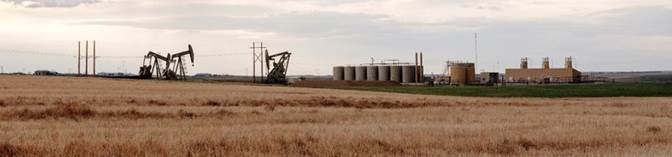
Bakken in North Dakota, US
Key events and portfolio developments in 2018 and early 2019:
· On 31 January, Equinor finalised the farm-in transaction for a 50% share in the Deepwater Durban licence in South Africa
· On 21 March, Equinor was awarded five leases in the US Gulf of Mexico
· On 29 March, Equinor in a consortium comprising other partners was awarded four blocks offshore Brazil in the Campos basin in the 15th licensing round
· On 29 March, the extension of In Amenas licence in Algeria from 2022 to 2027 with a restated production sharing agreement (PSA) was formally approved by authorities
· On 10 April, Equinor completed the acquisition of 40% non-operated interest in the North Platte deep water discovery in the US Gulf of Mexico from Cobalt International Energy, with an effective date of 1 January 2018. Total is the operator
· On 23 May, Equinor was awarded nine new licences in the 30th offshore licensing round on the UK continental shelf, eight as operator and one as partner
· On 30 May, Equinor and Azerbaijan’s state oil company SOCAR signed a risk service agreement related to the appraisal and development of the Karabagh oil field and a PSA for the Ashrafi, Dan Ulduzu, Aypara area
· On 5 June, the transactions for Equinor’s sales of equity shares to ExxonMobil and Galp in the BM-S-8 block in the Santos basin, Brazil, were closed. Equinor agreed on 4 July additional equity share transactions with its partners in the BM-S-8 block, pending approval. Equinor will own a 40% operated interest in the neighbouring BM-S-8 and Carcará North blocks following the approval
· On 7 June, Equinor in a consortium comprising other partners won 28% interest in the Uirapuru block in the Santos basin and 25% in Dois Irmãos block in the Campos basin in the 4th production sharing bidding round in Brazil. Petrobras is the operator of both blocks
· On 14 June, Equinor and Petrobras completed their transaction, whereby Equinor acquired a 25% non-operated interest in the Roncador oil field in Brazil’s Campos basin. Petrobras retains operatorship and a 75% interest. The effective date for the Roncador transaction is 1 January 2018
· On 15 August, Equinor was awarded 16 leases in US Gulf of Mexico
36 Equinor, Annual Report on Form 20-F 2018
“ | Equinor acquired 40% interest and assumed operatorship of Rosebank, one of the largest undeveloped fields on the UK continental shelf. The transaction was closed on 10 January 2019. |
· On 7 November, Equinor was awarded three new licences in the Jeanne d’Arc basin, offshore Newfoundland, two as operator and one as partner
· On 23 November, Equinor completed the sale of its 17% non-operated interest in the Alba oil field on the UK continental shelf to Verus Petroleum
For more information about the transactions see note 4 Acquisitions and divestments to the Consolidated financial statements.
International production
Entitlement production volumes are Equinor’s share of the volumes distributed to the partners according to production sharing agreement (PSA) (see section 5.6 Terms and abbreviations). For US assets entitlement production is expressed net of royalty interests. For all other countries royalties paid in-cash are included in entitlement production and royalties payable in-kind are excluded. Equity production represents volumes that correspond to Equinor’s percentage ownership in a particular field and is larger than Equinor’s entitlement production if the field is governed by a PSA.
Equinor's equity production outside Norway was 39% of Equinor's total equity production of oil and gas in 2018. Equinor's entitlement production outside Norway was 34% of Equinor's total entitlement production in 2018.
The following table shows E&P International's average daily entitlement production of liquids and natural gas for the years ending 31 December 2018, 2017 and 2016.
Average daily entitlement production | | | | | | | | | |
| | | | | | | | | | | |
| For the year ended 31 December |
| 2018 | | 2017 | | 2016 |
| Oil and NGL | Natural gas | | | Oil and NGL | Natural gas | | | Oil and NGL | Natural gas | |
Production area | mboe/day | mmcm/day | mboe/day | | mboe/day | mmcm/day | mboe/day | | mboe/day | mmcm/day | mboe/day |
| | | | | | | | | | | |
Americas | 245 | 25 | 403 | | 186 | 19 | 304 | | 189 | 18 | 299 |
Africa | 168 | 6 | 209 | | 197 | 6 | 233 | | 203 | 5 | 232 |
Eurasia | 21 | 3 | 40 | | 26 | 3 | 46 | | 32 | 3 | 50 |
Equity accounted production | 0 | - | 0 | | 5 | - | 5 | | 10 | - | 10 |
Total | 434 | 35 | 652 | | 415 | 27 | 588 | | 435 | 25 | 592 |
The table below provides information about the fields that contributed to production in 2018. Equity production per field is included in this table.
Average daily equity production | | | | | |
| | | | | | | | |
Field | Country | Equinor's equity interest in % | Operator | On stream | | Licence expiry date | Average daily equity production in 2018 mboe/day |
|
|
| | | | | | | | |
Americas | | | | | | | 462 |
Appalachian1) 2) | US | Varies | Equinor/others3) | 2008 | | HBP6) | 174 |
Bakken 1) | US | Varies | Equinor/others4) | 2011 | | HBP6) | 63 |
Eagle Ford 1) | US | Varies | Equinor/others5) | 2010 | | HBP6) | 43 |
Peregrino | Brazil | 60.00 | Equinor Brasil Energia Ltda. | 2011 | | 20347) | 37 |
Tahiti | US | 25.00 | Chevron USA Inc. | 2009 | | HBP6) | 28 |
Roncador | Brazil | 25.00 | Petróleo Brasileiro S.A. | 2018 | | 2025 | 28 |
St. Malo | US | 21.50 | Chevron USA Inc. | 2014 | | HBP6) | 23 |
Caesar Tonga | US | 23.55 | Anadarko U.S. Offshore LLC | 2012 | | HBP6) | 16 |
Julia | US | 50.00 | ExxonMobil Corporation | 2016 | | HBP6) | 13 |
Jack | US | 25.00 | Chevron USA Inc. | 2014 | | HBP6) | 9 |
Hibernia/Hibernia Southern Extension8) | Canada | Varies | Hibernia Management and Development Corporation Ltd. | 1997 | | HBP6) | 8 |
Hebron | Canada | 9.01 | ExxonMobil Canada Properties | 2017 | | HBP6) | 6 |
Terra Nova | Canada | 15.00 | Suncor Energy Inc. | 2002 | | HBP6) | 5 |
Stampede | US | 25.00 | Hess Corporation | 2018 | | HBP6) | 4 |
Heidelberg | US | 12.00 | Anadarko U.S. Offshore LLC | 2016 | | HBP6) | 4 |
Titan | US | 100.00 | Equinor USA E&P Inc. | 2018 | | HBP6) | 2 |
Big Foot9) | US | 27.50 | Chevron USA Inc. | 2018 | | HBP6) | 0 |
| | | | | | | | |
| | | | | | | | |
| | | | | | | | |
| | | | | | | | |
| | | | | | | | |
Field | Country | Equinor's equity interest in % | Operator | On stream | | Licence expiry date | Average daily equity production in 2018 mboe/day |
|
|
Africa | | | | | | | 287 |
Block 17 | Angola | 23.33 | Total E&P Angola Block 17 | 2001 | | 2022-3410) | 124 |
In Salah | Algeria | 31.85 | Sonatrach11) | 2004 | | 2027 | 46 |
| | | | BP Exploration (El Djazair) Limited | | | | |
| | | | Equinor In Salah AS | | | | |
Agbami | Nigeria | 20.21 | Star Deep Water Petroleum Limited (an affiliate of Chevron in Nigeria) | 2008 | | 2024 | 43 |
Block 15 | Angola | 13.33 | Esso Exploration Angola Block 15 | 2004 | | 2026-3210) | 31 |
In Amenas | Algeria | 45.90 | Sonatrach11) | 2006 | | 2027 | 21 |
| | | | BP Amoco Exploration (In Amenas) Limited | | | | |
| | | | Equinor In Amenas AS | | | | |
Block 31 | Angola | 13.33 | BP Exploration Angola | 2012 | | 2031 | 15 |
Murzuq | Libya | 10.00 | Akakus Oil Operations | 2003 | | 2035 | 8 |
| | | | | | | | |
Eurasia | | | | | | | 73 |
ACG | Azerbaijan | 7.27 | BP Exploration (Caspian Sea)Limited | 1997 | | 2049 | 42 |
Corrib | Ireland | 36.50 | Vermilion Exploration and Production Ireland Limited | 2015 | | 2031 | 19 |
Kharyaga | Russia | 30.00 | Zarubezhneft-Production Kharyaga LLC | 1999 | | 2031 | 9 |
Alba12) | UK | 17.00 | Chevron North Sea Limited | 1994 | | HBP6) | 2 |
| | | | | | | | |
Total E&P International | | | | 823 |
| | | | | | | | |
Equity accounted production | | | | | | | |
North Komsomolskoye 13) | Russia | 33.33 | LLC SevKomNeftegaz | 2018 | | 2112 | 0 |
| | | | | | | | |
Total E&P International including share of equity accounted production | | | 823 |
| | | | | | | | |
1) | Equinor’s actual equity interest can vary depending on wells and area. |
2) | Appalachian basin contains Marcellus and Utica formations. |
3) | Operators are Equinor USA Onshore Properties Inc, Chesapeake Operating INC., Southwestern Energy, Alta Resources Development LLC, Chief Oil & Gas LLC and several other operators. |
4) | Operators are Equinor Energy LP, Continental Resources INC, Oasis Petroleum North America LLC, Hess Corporation, EOG Resources INC, Whiting Petroleum Corporation and several other operators. |
5) | Operators are Equinor Texas Onshore Properties LLC and several other operators. |
6) | Held by Production (HBP): A company’s right to own and operate an oil and gas lease beyond its original primary term. |
7) | Licence BMC-7 expires in 2034, and licence BMC-47 related to the second phase of the development, expires in 2040 |
8) | Equinor's equity interests are 5.0% in Hibernia and 9.26% in Hibernia Southern Extension. |
9) | Production started in November 2018. Equinor share of average daily equity production is only 0.30 mboe/day in 2018. |
10) | Licence expiry varies by field. |
11) | The complete name for Sonatrach is Société Nationale de transport et de commercialisation d’hydrocarbures. |
12) | On 23 November, Equinor completed the sale of its share in Alba to Verus Petroleum. |
13) | Test production started in December 2018. Equinor share of average daily equity production is only 0.02 mboe/day in 2018. |
Equinor, Annual Report on Form 20-F 2018 37
38 Equinor, Annual Report on Form 20-F 2018
Americas
US – Offshore Gulf of Mexico
The Titan oil field is Equinor-operated asset located in the Mississippi Canyon and is producing through a floating spar facility. Equinor acquired the Titan and the gas and oil export lines in November 2017 following the bankruptcy of Bennu Oil & Gas. During 2018, Equinor reinstated production from three wells.
The Tahiti, Caesar Tonga, Stampede and Heidelberg oil fields are partner operated assets located in the Green Canyon area. Tahiti oil field is producing through a floating spar facility. In 2018, Tahiti vertical expansion, the field’s next development phase, commenced production through four shallower production wells including subsea infrastructure. The Caesar Tonga oil field is tied back to the Anadarko-operated Constitution spar host. The Stampede oil field is producing through a tension-leg platform with downhole gas lift. Stampede commenced production in February 2018 and is expected to ramp up in 2019. The Heidelberg oil field is producing through a floating spar facility.
The Jack, St. Malo, Julia and Big Foot oil fields are partner operated assets located in the Walker Ridge area. The Jack, St. Malo and Julia oil fields are subsea tie-backs to the Chevron-operated Walk Ridge regional host facility. The Big Foot oil field is producing through a dry tree tension-leg platform with a drilling rig. Big Foot commenced production in November 2018 and a total of seven production wells are planned for the project.
US – Onshore
Since the entry in US shale in 2008, Equinor has continued to grow and optimise its portfolio through acreage acquisition and divestments. In September 2018, Equinor successfully acquired 100% ownership interest in 60,000 net acres in the prolific Austin Chalk basin in Louisiana.
“ | The US onshore operations are the largest international contributor to Equinor production. |
Equinor has an ownership interest in the Marcellus shale gas play, located in the Appalachian region in north east US. The position is mostly partner operated through Chesapeake Energy Corporation in Pennsylvania and Southwestern Energy in West Virginia and southern Pennsylvania. The total partner operated net acreage position at the end of 2018 was around 220,000 net acres. In 2012, Equinor also became an operator in the Appalachian region in the state of Ohio. Within the operated acreage, Equinor is developing two formations: Marcellus and Utica. Equinor’s operated net acreage position in Appalachian is around 27,000 net acres.
Equinor has an ownership interest in the Eagle Ford shale formation located in south west Texas through a joint venture with Repsol. Through transactions in 2013 and 2015, Equinor obtained full operatorship in the joint venture and increased its working interest to 63%. Equinor's net acreage position in Eagle Ford at the end of 2018 was around 71,000 net acres.
Equinor has an ownership interest in the Bakken tight oil play through the acquisition of Brigham Exploration Company. Equinor’s net acreage position in Bakken and Three Forks shale formations at the end of 2018 was around 236,000 net acres. The majority of Equinor’s acreage position in the Bakken shale is operated by Equinor with an average working interest of approximately 70%.
In addition to the operated oil and gas producing assets, Equinor participates in gathering and facilities for initial processing of oil and gas in the Bakken, Eagle Ford and Appalachian basin assets in the US. This includes crude and natural gas gathering systems, fresh water supply systems, salt water gathering and disposal wells, oil and gas treatment and processing facilities to provide flow assurance for Equinor’s upstream production.
Brazil
The Peregrino field is an Equinor-operated heavy oil asset, located in the offshore Campos basin. The oil is produced from two wellhead platforms with drilling capability, processed on the FPSO Peregrino and offloaded to shuttle tankers.
“ | With the Peregrino field, Equinor is the largest international operator in Brazil. |
Equinor, Annual Report on Form 20-F 2018 39
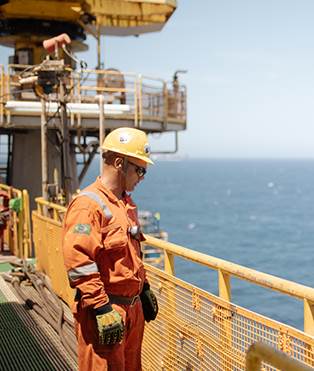
Peregrino well head platform B, Brazil
Production from Peregrino started in 2011. In the second phase of the Peregrino field development, a third wellhead platform is being constructed, expected to significantly extend the field life.
The Roncador field is operated by Petrobras, located in the offshore Campos basin. The field has been in production since 1999. The hydrocarbon is produced from two semi-submersibles and two FPSOs. The oil is offloaded to shuttle tankers, and the gas is drained out through pipelines to shore.
Canada
Equinor has interests in the Jeanne d'Arc basin offshore the province of Newfoundland and Labrador in the partner operated producing oil fields Terra Nova, Hebron, Hibernia and Hibernia Southern Extension.
The Hebron field started production in November 2017. The Hebron field consists of a fixed gravity base structure with drilling capabilities and storage for oil. Oil is offloaded to shuttle tankers.
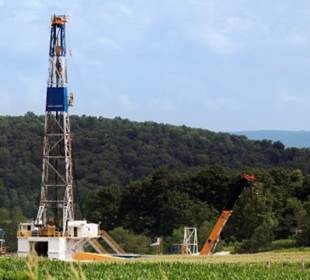
Marcellus, US
40 Equinor, Annual Report on Form 20-F 2018
Africa
Angola
The deep-water blocks 17, 15 and 31 contributed with 30% of Equinor’s equity liquid production outside Norway in 2018. Each block is governed by a PSA which sets out the rights and obligations of the participants, including mechanisms for sharing of the production with the Angolan state oil company Sonangol.
Block 17 has production from four FPSOs; CLOV, Dalia, Girassol and Pazflor. During 2018, CLOV phase II, Dalia phase III and Zinia phase II were all sanctioned, by the partnership, pending approval for CLOV phase II and Dalia phase III from the concessioner. These projects will add reserves and new production to help stem decline.
Block 15 has production from four FPSOs: Kizomba A, Kizomba B, Kizomba C-Mondo, and Kizomba C-Saxi Batuque. In 2018, new wells were added and set into production.
Block 31 has production from one FPSO producing from the PSVM fields. The FPSOs serve as production hubs and each receives oil from more than one field through multiple number of wells.
Nigeria
Equinor has a 20.2% interest in the Agbami deep water field, which is located 110 km off the coast of the Central Niger Delta region. The field is developed with subsea wells connected to an FPSO. The Agbami field straddles the two licences OML 127 and OML 128 and is operated by Chevron under a Unit Agreement. Equinor has 53.85% interest in OML 128.
For information related to the Agbami redetermination process and the dispute between the Nigerian National Petroleum Corporation and the partners in Oil Mining Lease (OML) 128 concerning certain terms of the OML 128 production sharing sontract (PSC), see note 24 Other commitments, contingent liabilities and contingent assets to the Consolidated financial statements.
Algeria
The In Salah onshore gas development is a joint operatorship between Sonatrach, BP and Equinor. The Northern fields have been operating since 2004. The Southern fields project, which was led by Equinor, started production from two fields in 2016 and from another two fields in 2017. The Southern fields are tied back into the Northern fields existing facilities.
The In Amenas onshore development is a gas development which contains significant liquid volumes. The In Amenas infrastructure includes a gas processing plant with three trains. The production facility is connected to the Sonatrach distribution system. The facilities are operated through a joint operatorship between Sonatrach, BP and Equinor. The In Amenas gas compression project, which was led by BP, came into operation in February 2017. The compressors have made it possible to increase production and thereby utilise the capacity of all three trains. In 2017, Equinor and the rest of the In Amenas partners secured a licence extension of 5 years beyond 2022.
Separate PSAs including mechanisms for revenue sharing, govern the rights and obligations of the Parties and establish joint operatorships between Sonatrach, BP and Equinor for In Salah and In Amenas.
Eurasia
Production consists mainly of the output from the Azeri-Chirag-Gunashli (ACG) oil field offshore Azerbaijan, the Corrib gas field off Ireland’s northwest coast, and the Kharyaga oil field onshore in the Timan-Pechora basin in northwestern Russia.
Azerbaijan
The ACG licence was extended in 2017 until the end of 2049 through an amended and restated PSA. Equinor’s interest was adjusted from 8.56% to 7.27% due to ratified licence extension. The ACG new platform project is an additional production platform in the ACG contract area and work is ongoing to optimise the chosen concept.
International exploration
Equinor has increased exploration activity outside Norway compared with 2017, and drilled offshore wells in the US GoM, Tanzania and Brazil. Onshore exploration activity is ongoing in Argentina, Turkey and Russia. Continued focus on access has strengthened the exploration portfolio further.
Brazil is one of Equinor’s core exploration areas. In 2018 Equinor and partners were the highest bidders for four blocks in the Campos basin in Brazil’s 15th licensing round. Through the fourth pre-salt offshore licensing round Equinor and its partners also further strengthened its position with the Dois Irmãos block adjacent to the blocks awarded in the 15th licensing round and with the Uirapuru block in the Carcará area in the Santos Basin. With the new licences, Equinor reinforces its ambition of long-term growth in Brazil and increases synergies with current projects.
Equinor, Annual Report on Form 20-F 2018 41
Equinor and the Azerbaijan’s state oil company SOCAR signed a Risk service agreement related to the appraisal and development of the Karabagh oil field and a production sharing agreement (PSA) for the Aypara area. The agreement will strengthen our position in a prolific basin and develop growth options.
Equinor was awarded 21 leases in US Gulf of Mexico in 2018 and is strengthening its position in the area.
In the 30th Offshore licensing round on the UK continental shelf Equinor was awarded nine licences, eight as operator and one as partner. These awards strengthen our position in UK exploration.
Equinor and its partners were the successful bidders for three exploration parcels in the prolific Jeanne d’Arc basin, offshore Newfoundland in Canada. Equinor will be operator for two of the parcels. The successful bids align with Equinor’s strategy of developing our position in prolific basins.
Equinor and its partners completed six exploratory wells and made one non-commercial discovery internationally. The Guanxuma well in Brazil is under evaluation.
Exploratory wells drilled1) | | | |
| | | |
| For the year ended 31 December |
2018 | 2017 | 2016 |
| | | |
Americas | | | |
Equinor operated | 1 | 2 | 5 |
Partner operated | 4 | 4 | 2 |
Africa | | | |
Equinor operated | 1 | 0 | 0 |
Partner operated | 0 | 0 | 0 |
Other regions | | | |
Equinor operated | 0 | 4 | 0 |
Partner operated | 0 | 1 | 2 |
Total (gross) | 6 | 11 | 9 |
| | | |
1) Wells completed during the year, including appraisals of earlier discoveries. |
Fields under development internationally
Americas
US – Offshore Gulf of Mexico
Vito development project (Equinor 36.89%, operated by Shell) is located in the Mississippi Canyon area. The development project consists of a light-weight semi-submersible platform with a single eight-well subsea manifold. The wells will have an approximate depth of 10,000 meters and will have downhole gas lift to assist production. The project was sanctioned for development in April 2018. Production is expected to start in first half of 2021.
Brazil
Peregrino Phase II (Equinor 60%, operator) develops the southwestern area of the Peregrino oil field in the Campos basin, 85 km off the coast of the state of Rio de Janeiro.
42 Equinor, Annual Report on Form 20-F 2018
“ | Peregrino phase 1 was brought on stream in 2011, and the second phase of the development will prolong the field’s productive life. The licence period extends until 2040. Fifteen oil producers and seven water injectors will be drilled in the new area from a third wellhead platform, to be tied back to the existing floating production, storage and offloading vessel. The construction of the third Peregrino wellhead platform is well underway. Production is expected to start in late 2020. |
Eurasia
United Kingdom
Mariner (Equinor 65.11%, operator) is a heavy oil development in the North Sea, some 150 km east of Shetland, UK. The field development includes a production, drilling and living quarter platform based on a steel jacket. Oil will be exported by offshore loading from a floating storage unit. The development includes a possible future subsea tie-in of Mariner East, a small heavy oil discovery. Offshore hook-up and commissioning is currently ongoing. Production is expected to start in 2019.
Discoveries with potential development
Americas
US – Offshore Gulf of Mexico
In April 2018, Equinor completed the acquisition of 40% interest in the North Platte discovery from Cobalt International Energy, with an effective date of 1 January 2018. North Platte is a paleogene oil discovery in the Garden Banks area. It has been fully appraised since its discovery with three drilled wells and three sidetracks.
Brazil
Carcará (Equinor 40%, operator) oil and gas discovery straddles BM-S-8 and Carcará North in the Santos basin, some 200 km off the coast of the state of São Paulo in Brazil.
“ | A phased development of Carcará is being considered, with an initial development of the appraised southern part. Upon completion of the Carcará North appraisal programme, a full-field development will be progressed to fully exploit the value potential. |
BM-C-33 (Equinor 35%, operator) includes the oil and gas discoveries Pão de Açúcar, Gávea and Seat in the southwestern part of the Campos basin, off the coast of the state of Rio de Janeiro, Brazil. An FPSO development of Pão with partial gas injection and rich gas export is being assessed. The project is currently in the early phase, maturing towards concept selection. The adjacent Dois Irmãos block will be explored by Equinor and its partners.
Canada
Bay du Nord (Equinor 65%, operator) oil field in the Flemish pass basin, some 500 km northeast of St. John’s in Newfoundland and Labrador, Canada, was discovered by Equinor in 2013. A framework agreement with the provincial government of Newfoundland and Labrador was entered into in July 2018. A tie-in of the adjacent Baccalieu discovery is being considered. Drawing upon the experience from the Johan Castberg development in Norway, Equinor is considering developing the Bay du Nord field using an FPSO solution. Concept studies have begun, and sanction is expected in the early 2020s.
Africa
Tanzania
Block 2 (Equinor 65%, operator): Equinor made several large gas discoveries in Block 2 in the Indian Ocean, off southern Tanzania, during 2012-2015. Options for developing the discoveries with an onshore LNG solution are being assessed. Equinor’s Block 2 exploration licence in Tanzania was formally due to expire in June 2018, but based on communication with the applicable Tanzanian authorities, the block continues to be in operation while the process related to the grant of a new exploration licence for the block is ongoing. See also note 11 Intangible assets to the Consolidated financial statements.
Equinor, Annual Report on Form 20-F 2018 43
Eurasia
United Kingdom
Rosebank (Equinor 40%, operator): The Rosebank oil and gas field some 130 km northwest of Shetland is one of the largest undeveloped fields on the UK continental shelf. In October, Equinor entered into an agreement to acquire Chevron’s 40% interest and assume operatorship in Rosebank. The transaction was completed in January 2019. Equinor will use its experience to improve the business case together with the licence partners and is in dialogue with the authorities on achieving a licence extension.
Russia
North Komsomolskoye (Equinor 33.33%, operated by SevKomNeftegaz) is a complex viscous oil field in Western Siberia, Russia. In 2017, Equinor and Rosneft entered into a shareholders’ and operating agreement for the North Komsomolskoye field. In 2018, Equinor Russia AS acquired 33.33% of the shares in the JV company LLC SevKomNeftegaz, and the deal was closed on 21 December 2018. The joint venture started test production from the field in 2018 to improve reservoir understanding and lay the ground for a potential full field development decision.
For information about risks related to activity in Russia see section 2.11 Risk review under Risks related to our business
44 Equinor, Annual Report on Form 20-F 2018
2.5Marketing, Midstream & Processing (MMP) |
Overview
The Marketing, Midstream & Processing reporting segment is responsible for the marketing, trading, processing and transportation of crude oil and condensate, natural gas, NGL and refined products, including the operation of the Equinor-operated refineries, terminals and processing plants. In addition, MMP is responsible for power and emissions trading and for developing transportation solutions for natural gas, liquids and crude oil from Equinor assets, including pipelines, shipping, trucking and rail. The business activities within MMP are organised in the following business clusters: Marketing and Trading, Asset Management and Processing and Manufacturing.
MMP markets, trades and transports approximately 50% of all Norwegian liquids export, including Equinor equity, the Norwegian State's direct financial interest (SDFI) equity production of crude oil and NGL, and third-party volumes. MMP is also responsible for the marketing, trading and transportation of Equinor’s and SDFI’s gas together with third-party gas. This represents approximately 70% of all Norwegian gas exports. For more information, see note 2 Significant accounting policies to the Consolidated financial statement for Transactions with the Norwegian State, and the Norwegian State’s participation and SDFI oil and gas marketing and sale in Applicable laws and regulations in section 2.7 Corporate.
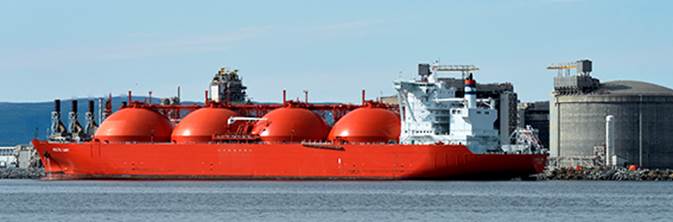
Melkøya in Hammerfest, Norway
Key events in 2018 and early 2019:
· A long-term contract was awarded on 26 September to Knutsen NYK Offshore for two new built shuttle tankers for lifting of the Equinor equity crude production from the Roncador field in Brazil.
· The divestment of the 27.3% ownership in Norsea Petroleum Ltd, the owner of the Teesside Terminal in the UK, became effective on 20 July.
· An agreement for terminal and storage for LPG in Port Klang Malaysia with Global Petro Storage was signed on 30 October.
“ | Equinor expands in energy trading through the acquisition of Danske Commodities, effective on 31 January 2019. |
Marketing and trading of gas and LNG
Equinor’s gas marketing and trading business is conducted from Norway and from the offices in Belgium, the UK, Germany, the US and Singapore.
Europe
The major export markets for gas from the Norwegian continental shelf (NCS) are Germany, France, the UK, Belgium, the Netherlands, Italy and Spain. LNG from the Snøhvit field, combined with third-party LNG cargoes, allow Equinor to reach the global gas markets. The gas is sold to counterparties through bilateral sales agreements and over the trading desks through all the main
Equinor, Annual Report on Form 20-F 2018 45
European trading hubs. The bilateral sales are mainly carried out with large industrial customers, power producers and local distribution companies. A few of Equinor’s long-term gas contracts contain contractual price review mechanisms that can be triggered by the buyer or seller as regulated by the contracts. For the ongoing price reviews, Equinor provides in its financial statements for probable liabilities based on Equinor’s best judgement. For further information, see note 24 Other commitments, contingent liabilities and contingent assets to the Consolidated financial statements.
Equinor is active on both the physical and exchange markets such as the Intercontinental Exchange (ICE). Equinor expects to continue to optimise the market value of the gas volumes through a mix of bilateral contracts and trading via its production and transportation systems and downstream assets.
US
Equinor Natural Gas LLC (ENG), a wholly-owned subsidiary, has a gas marketing and trading organisation in Stamford, Connecticut that markets natural gas to local distribution companies, industrial customers and power generators. ENG also markets equity production volumes from the Gulf of Mexico, Eagle Ford and the Appalachian Basin and transports some of the Appalachian production to New York City and to Niagara, providing access to the greater Toronto area.
In addition, ENG has long-term capacity contracts at the Cove Point LNG re-gasification terminal, that enables sourcing of LNG from the Snøhvit LNG facility in Norway. Due to the low gas prices in the US compared to the global LNG prices over the last years, all of Equinor's LNG cargoes have been diverted away from the US and delivered into the higher priced markets in Europe, South-America and Asia.
Marketing and trading of liquids
MMP is responsible for the sale of Equinor's and SDFI’s crude oil and NGL, in addition to the commercial optimisation of the refineries and terminals. The liquids marketing and trading business is conducted from Norway, the UK, Singapore, the US and Canada. The main crude oil market for Equinor is Northwest Europe.
MMP also markets the equity volumes from the E&P International assets located in the US, Brazil, Angola, Nigeria, Algeria, Azerbaijan and the UK, as well as third-party volumes. The value is maximised through marketing, physical and financial trading and through the optimisation of the own and leased capacity such as refineries, processing, terminals, storages, pipelines, railcars and vessels.
Manufacturing
Equinor owns and operates the Mongstad refinery in Norway, including the Mongstad heat and power plant (MHPP). The refinery is a medium-sized refinery built in 1975, with a crude oil and condensate distillation capacity of 226,000 barrels per day. The refinery is directly linked to the offshore fields through two crude oil pipelines, to the crude oil terminal at Sture and the gas processing plant at Kollsnes through an NGL/condensate pipeline, and to Kollsnes by a gas pipeline. MHPP produces heat and power from gas received from Kollsnes and from the refinery. It has capacity of generating approximately 280 megawatts of electric power and 350 megawatts of process heat. Following the termination of the existing gas agreement between the Troll licence and Equinor Refining Norway AS, Equinor has decided to redesign a part of the heat and power plant to a heater plant which is planned to be operational in 2020. When operational the heater plant will run on refinery gas and provide heat and steam to the refinery. A new gas arrangement with the Troll partners has been agreed to continue the operation of the MHPP until the heater plant is in operation.
Equinor has an ownership interest in Vestprosess (34%), which transports and processes NGL and condensate. The Vestprosess pipeline connects the Kollsnes and Sture plants to Mongstad. The operatorship of Vestprosess was transferred to Gassco as of 1 January 2018, with Equinor as the technical service provider.
Equinor owns and is the operator of the Kalundborg refinery in Denmark, which has a crude oil and condensate distillation capacity of 108,000 barrels per day. The refinery is connected via one gasoline and one gas oil pipeline to the terminal at Hedehusene near Copenhagen, and most of its products are sold locally.
Equinor has an ownership interest in the methanol plant (82.0%) at Tjeldbergodden. The plant receives natural gas from the Norwegian Sea through the Haltenpipe pipeline. In addition, Equinor holds an ownership interest in the air separation unit Tjeldbergodden Luftgassfabrikk DA (50.9%).
The following table shows the operating statistics for the plants at Mongstad, Kalundborg and Tjeldbergodden. The lower throughput and the on-stream factor in 2018 were mainly influenced by higher unplanned shut downs for Mongstad, Kalundborg and Tjeldbergodden compared to 2017. In addition, Kalundborg had two planned shutdowns and Tjeldbergodden one planned shutdown in 2018. In 2016 both Mongstad and Tjeldbergodden had planned shutdowns.
| Throughput1) | Distillation capacity2) | On stream factor %3) | Utilisation rate %4) |
Refinery | 2018 | 2017 | 2016 | 2018 | 2017 | 2016 | 2018 | 2017 | 2016 | 2018 | 2017 | 2016 |
| | | | | | | | | | | | | |
Mongstad | 11.5 | 12.0 | 9.4 | 9.3 | 9.3 | 9.3 | 95.3 | 97.5 | 94.4 | 93.8 | 94.7 | 93.9 |
Kalundborg | 5.3 | 5.5 | 5.0 | 5.4 | 5.4 | 5.4 | 94.1 | 99.7 | 98.0 | 90.3 | 90.4 | 91.0 |
Tjeldbergodden | 0.8 | 0.9 | 0.8 | 1.0 | 1.0 | 1.0 | 94.3 | 99.4 | 94.8 | 94.3 | 99.4 | 94.8 |
| | | | | | | | | | | | | |
1) | Actual throughput of crude oils, condensates and other feed, measured in million tonnes. Throughput may be higher than the distillation capacity for the plants because the volumes of fuel oil etc. may not go through the crude-/condensate distillation unit. |
2) | Nominal crude oil and condensate distillation capacity, and methanol production capacity, measured in million tonnes. |
3) | Composite reliability factor for all processing units, excluding turnarounds. |
4) | Composite utilisation rate for all processing units, based on throughput and capacity (per stream day). |
| | | | | | | | | | | | | |
46 Equinor, Annual Report on Form 20-F 2018
Terminals and storage
Equinor operates the Mongstad crude oil terminal (Equinor 65%). The crude oil is landed at Mongstad through pipelines from the NCS and by crude tankers from the market. The Mongstad terminal has a storage capacity of 9.4 million barrels of crude oil.
Equinor operates the Sture crude oil terminal. The crude oil is landed at Sture through pipelines from the North Sea. The terminal is part of the Oseberg Transportation System (Equinor 36.2%). The processing facilities at Sture stabilise the crude oil and recover an LPG mix (propane and butane) and naphtha.
Equinor operates the South Riding Point Terminal, which is located on the Grand Bahamas Island and consists of two shipping berths and ten storage tanks, with a storage capacity of 6.75 million barrels of crude oil. The terminal has facilities to blend crude oils, including heavy oils.
Equinor UK holds an interest in the Aldbrough Gas Storage (Equinor 33.3%) in the UK, which is operated by SSE Hornsea Ltd.
Equinor Deutschland Storage GmbH holds an interest in the Etzel Gas Lager (Equinor 23.7%) in the northern part of Germany which has a total of 19 caverns and secures the regularity for gas deliveries from the NCS.
During 2018 Equinor divested the 27,3% share in Norsea Petroleum Ltd (the owner of the Teesside Terminal in the UK) and awarded a long-term contract to Global Petro Storage for terminal and storage for LPG in Malaysia.
Pipelines
Equinor is a significant shipper in the NCS gas pipeline system. Most of the gas pipelines on the NCS that are accessed by third-party customers are owned by a single joint venture, Gassled (Equinor 5%), with regulated third-party access. The Gassled system is operated by the independent system operator Gassco AS, which is wholly owned by the Norwegian State. See Gas sales and transportation from the NCS in section 2.7 Corporate for further information.
Equinor is technical service provider for the Kårstø and Kollsnes gas processing plants in accordance with the technical service agreement between Equinor and Gassco AS, included as Exhibit 4(a)(i) to the Form 20-F. Equinor also performs the TSP role for the majority of the Gassco-operated gas pipeline infrastructure.
In addition, MMP manages Equinor’s ownership in the following pipelines in the Norwegian oil and gas transportation system: The Grane oil pipeline (Equinor 23.5%), the Kvitebjørn oil pipeline (Equinor 39.6%), the Troll oil pipeline I and II (Equinor 30.6%), the Edvard Grieg oil pipeline (Equinor 16.6%), the Utsira High gas pipeline (Equinor 24.9%), the Valemon rich gas pipeline (Equinor 53.2%) and the Haltenpipe, Norpipe and Mongstad gas pipeline (Equinor 30.6%).
Equinor holds interest in the Nyhamna gas processing plant (Equinor 30.1%) in Aukra via the recently established Nyhamna Joint Venture. The venture is operated by Gassco.
The Polarled pipeline (Equinor 37.1%), operated by Gassco, connects fields in the Norwegian Sea with the Nyhamna gas processing plant. Transportation through the pipeline commenced on 17 December 2018, subsequent to the Aasta Hansteen production start on 16 December 2018.
Equinor, Annual Report on Form 20-F 2018 47
“ | The laying of the Johan Sverdrup oil and gas export pipelines (Equinor 40%, operator) was completed in the autumn of 2018. Crude oil will be exported from the Johan Sverdrup field to the terminal at Mongstad through the 36-inch, 283-kilometre designated pipeline, and gas will be exported to the gas processing facility at Kårstø through the 18-inch, 156-kilometre pipeline via a subsea connection to the Statpipe pipeline. |
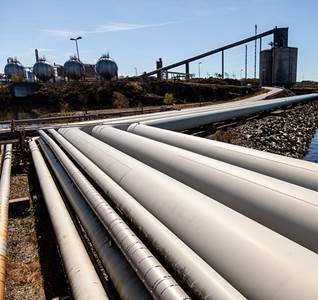
Johan Sverdrup pipeline installation at Mongstad, Norway
48 Equinor, Annual Report on Form 20-F 2018
The Other reporting segment includes activities in New Energy Solutions (NES), Global Strategy & Business Development (GSB), Technology, Projects & Drilling (TPD) and corporate staffs and support functions.
New Energy Solutions (NES)
The New Energy Solutions business area reflects Equinor’s aspirations to gradually complement its oil and gas portfolio with profitable renewable energy and other low-carbon energy solutions. Offshore wind, solar and carbon capture and storage have been key strategic focus areas in 2018.
“ | In 2018, Equinor participated in offshore wind and solar assets with a total capacity of 1.3 gigawatts, of which 0.75 gigawatts are operated by Equinor. The equity renewable power production in 2018 was 1.25 terawatt hours. |
Key events and portfolio developments in 2018:
· Acquired 50% of three early phase offshore wind development projects in Poland; MFW Bałtyk II and III in March 2018 and MFW Bałtyk I in December 2018
· Announced Hywind Tampen on 28 August 2018; a floating offshore wind farm being considered to provide wind power to the Snorre and Gullfaks installations on the NCS
· First power delivered from the Arkona wind farm in Germany 24 September 2018. Arkona is operated by E.ON and is expected to be in full operation from early 2019
· Winner of offshore wind lease outside Massachusetts in the US government’s wind lease sale in December 2018. Closed early 2019
· Start-up of commercial operations at the Apodi solar plant in Brazil 28 November 2018. Apodi is operated by Scatec Solar.
· Acquired 50% of the Guanizul 2A solar plant in Argentina from Martifer Renewables in June 2018. The project is operated by Scatec Solar
· Acquired minority shareholding (9.7%) in Scatec Solar ASA in November 2018, and now owns a total of 10.1%
Offshore wind
Assets in production
The Sheringham Shoal offshore wind farm (Equinor 40%, operator) located off the coast of Norfolk, UK, was formally opened in September 2012. The wind farm is in full production with 88 turbines and an installed capacity of 317 megawatts (MW). The wind farm's annual production is approximately 1.1 terawatt hours (TWh).
The Dudgeon offshore wind farm (Equinor 35%, operator) lies in the Greater Wash area off the English east coast, a short distance from Sheringham Shoal. The wind farm has been in operation since November 2017, with an annual production of approximately 1.7 TWh from 67 turbines.
Equinor, Annual Report on Form 20-F 2018 49
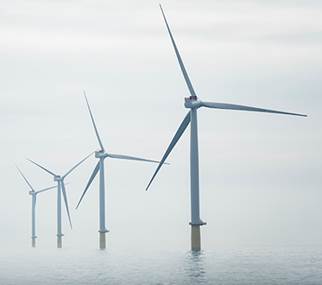
Dudgeon offshore wind park off the Norfolk coast, Great Britain.
The Hywind Scotland wind farm (Equinor 75%, operator) is a floating wind pilot farm using the Hywind concept, developed and owned by Equinor. The wind farm is placed at Buchan Deep, approximately 25 km off Peterhead on the east coast of Scotland, UK. Equinor completed the project during 2017 and has installed five 6 MW turbines. Production is around 0.14 TWh per year. This is the next step in Equinor’s strategy towards deployment of the first utility large scale floating wind farms.
The Arkona offshore wind farm (Equinor 50%, operated by E.ON) is located in the German part of the Baltic Sea, while the operations and maintenance base is in Port Mukran on the island of Rügen in Mecklenburg-Vorpommern. First power from Arkona was supplied to the grid in September 2018, and all 60 turbines have been generating power since November 2018. The wind farm will have a capacity of 385 MW and is scheduled to be in full operation from early 2019.
Potential developments
The Dogger Bank wind farms (Equinor 50%, joint operatorship with SSE) are three proposed 1,200 MW offshore wind farms, Creyke Beck A and B and Teeside A, off the coast of Yorkshire, UK. Including the 3,600 MW Dogger bank wind farms and an adjacent 1,200 MW wind farm project, the Dogger bank area is potentially the largest offshore wind farm development in the world, with a 4,800 MW total capacity consented by the UK authorities.
“ | Hywind Tampen (Equinor 33.28% (Snorre) and 51% (Gullfaks), operator), a floating offshore wind farm on the NCS to provide wind power to the Snorre and Gullfaks installations, is being considered. The proposed development includes eleven 8 MW wind turbines based on Equinor’s floating offshore wind concept Hywind. With a total capacity of 88 MW, the wind farm is expected to cover more than one third of the power need of the five platforms Snorre A and B and Gullfaks A, B and C. In windy months, this portion will be significantly higher. |
During 2018 Equinor has signed agreements with Polenergia to acquire a 50% interest in three offshore wind development projects in Poland, Bałtyk I, II and III. The wind farm areas are in the Baltic Sea approximately 80, 27 and 40 kilometres from shore with water depths of 20-40 meters. The three projects have a potential capacity of more than 2,500 MW. The closing of the acquisition of the Bałtyk I project is subject to certain conditions, including Office of Competition and Consumer Protection in Poland.
In the US, Equinor was the winner of the New York Wind energy area lease, following the December 2016 BOEM lease sale, with a winning bid of USD 42.5 million. The lease is 321 km2, large enough to support one or more offshore wind developments with a total
50 Equinor, Annual Report on Form 20-F 2018
capacity of up to 2,000 MW. The lease is approximately 20 km off the south shore of Long Island. Equinor has bid for offtake contracts in both New York and New Jersey in late 2018/early 2019. The New York project has been named “Empire Wind”, and the New Jersey project “Boardwalk Wind”.
“ | In December 2018 Equinor submitted the winning bid of USD 135 million for lease OCS-A 0520 outside Massachusetts in the US government’s wind lease sale. The lease is 65 km south of Cape Cod and 110 km east of Long Island, New York. The lease is 521 km2 and is large enough to support one or more offshore wind developments with a capacity in the range of 2,000 MW. The new acreage adds to Equinor’s portfolio in the northeastern US, strengthening the potential to become a future hub for offshore wind. |
Solar
The Apodi solar plant (Equinor 43.75%, operated by Scatec Solar) is located in the municipality of Quixeré, Ceará State in Brazil. The plant, with an installed capacity of 162 MW, started commercial operations in November 2018 and is expected to provide about 0.34 TWh of solar power per year.
In June 2018 Equinor acquired a 50% interest in the Guanizul 2A solar project in Argentina. The plant will be operated by Scatec Solar and situated in the San Juan region of Argentina. The plant is expected to be in operation by end of 2019, will have an installed capacity of 117 MW.
In November 2018 Equinor ASA acquired 11,020,000 shares in Scatec Solar ASA, corresponding to 9.7% of the shares and votes and now owns a total of 10.1%. Scatec Solar, an integrated independent solar power producer, with an asset portfolio of 1.5 gigawatt (GW) in operation and under construction.

Apodi solar plant, Brazil.
Carbon Capture and Storage
Since 1996, Equinor has proven experience in carbon capture and storage (CCS) from the offshore oil and gas business and has continued to develop competence through research engagement at Technology Centre Mongstad, the world’s largest facility for testing and improving CO2 capture. Equinor will seek to deploy its competence and experience in other CCS projects, both to reduce
Equinor, Annual Report on Form 20-F 2018 51
carbon dioxide emissions from several sources and to drive new opportunities, including enhanced oil recovery possibilities and carbon neutral value chains based on hydrogen.
Northern Lights (Equinor 33.33%, operator): Capture and storage of CO2 can contribute to reaching the climate goal of the Paris agreement. Equinor is, together with Shell and Total, developing infrastructure on the NCS for transport and storage of CO2 from various onshore industries. The solution being considered will have an initial storage capacity of around 1.5 million tons CO2 per year. The project is part of the Norwegian authorities’ plans for full-scale carbon capture, transport and storage in Norway.
Equinor Energy Ventures Fund
Equinor Energy Ventures fund, dedicated to invest in attractive and ambitious growth companies in low carbon and new energy solutions, has been operating since February 2016. Nearly half of the original USD 200 million has been committed. The fund currently holds eight direct investments across different segments and is a limited partner to two financial venture capital funds in two different continents.
Global Strategy & Business Development (GSB)
The Global Strategy and Business Development business area is Equinor’s functional centre for strategy and business development. GSB is responsible for Equinor’s global strategy processes and identifies and delivers inorganic business development opportunities, including corporate mergers and acquisitions. This is achieved through close collaboration across geographic locations and business areas. Equinor's strategy forms the basis for guiding the company’s business development focus.
GSB also hosts several corporate functions, including Equinor’s Corporate Sustainability function, which is shaping the company’s strategic response to sustainability issues and reporting on Equinor’s sustainability performance.
Corporate staffs and support functions
Corporate staffs and support functions comprise the non-operating activities supporting Equinor, and include head office and central functions that provide business support such as finance and control, corporate communication, safety, audit, legal services and people and leadership.
Technology, projects and drilling (TPD)
The Technology, projects and drilling business area is responsible for field development, well deliveries, technology development and procurement in Equinor.
Research and technology is responsible for research and technology development and implementation to meet Equinor’s business needs, and for providing specialist technology advisory services within selected areas.
Project development is responsible for planning, developing and executing major field development, brownfield and field decommissioning projects where Equinor is the operator.
Drilling and well is responsible for designing wells and delivering drilling and well operations onshore and offshore globally (except for US onshore).
Procurement and supplier relations is responsible for global procurement aligned with Equinor’s business needs.
52 Equinor, Annual Report on Form 20-F 2018

Johan Sverdrup, NCS
The table on the following page displays major projects operated by Equinor, as well as projects operated by Equinor’s licence partners. More information about ongoing projects are given in the E&P Norway, E&P International, MMP and NES sections. In our world-class portfolio, an additional 30-35 projects are in the early phase, maturing towards sanction.
Equinor, Annual Report on Form 20-F 2018 53
Completed projects | | | |
Project startups and completions 2018 | Equinor's interest | Operator | Area | Type |
Tahiti vertical expansion | 25.00% | Chevron USA Inc | Gulf of Mexico | Oil |
Stampede | 25.00% | Hess Corporation | Gulf of Mexico | Oil |
Oseberg Cat J rig Askepott | 49.30% | Equinor Energy AS | North Sea | Jack-up drilling rig |
Gullfaks Cat J rig Askeladden | 51.00% | Equinor Energy AS | North Sea | Jack-up drilling rig |
Visund North improved oil recovery | 53.20% | Equinor Energy AS | North Sea | Improved oil recovery |
Troll B gas module Z | 30.58% | Equinor Energy AS | North Sea | Increased processing capacity |
Oseberg Vestflanken 2 | 49.30% | Equinor Energy AS | North Sea | Oil and gas |
Johan Sverdrup export pipelines | 40.03% | Equinor Energy AS | North Sea | Oil and gas export pipelines |
- held through Lundin | 4.54% | - | - | - |
Big Foot | 27.50% | Chevron USA Inc | Gulf of Mexico | Oil |
Volve decommissioning | 59.60% | Equinor Energy AS | North sea | Field decommissioning |
Apodi solar power plant1) | 43.75% | Scatec Solar Brazil BV (NL) | Ceará, northeastern Brazil | Solar |
Aasta Hansteen | 51.00% | Equinor Energy AS | Norwegian Sea | Gas |
| | | | |
1) Technical service provider is Scatec Solar Brazil Servicos de Engenharia Ltda |
| | | | |
Projects under development | | | |
Ongoing projects with expected startups and completions 2019-2023 | Equinor's interest | Operator | Area | Type |
Mariner | 65.11% | Equinor UK Ltd | North Sea | Oil |
Johan Sverdrup phase 1 | 40.03% | Equinor Energy AS | North Sea | Oil and associated gas |
- held through Lundin | 4.54% | - | - | - |
Utgard Norwegian sector | 38.44% | Equinor Energy AS | North Sea | Gas and condensate |
UK sector | 38.00% | - | - | - |
Trestakk | 59.10% | Equinor Energy AS | Norwegian Sea | Oil and associated gas |
Arkona offshore wind farm1) | 50.00% | Arkona Windpark Entw.-GmbH | Baltic sea, off Germany | Wind |
Gullfaks Shetland / Lista phase 2 | 51.00% | Equinor Energy AS | North Sea | Oil |
Guanizul 2A solar power project2) | 50.00% | Cordillera Solar VIII.S.A | San Juan, Argentina | Solar |
Snefrid North | 51.00% | Equinor Energy AS | Norwegian Sea | Gas |
Huldra decommissioning | 19.87% | Equinor Energy AS | North Sea | Field decommissioning |
Troll C gas module | 45.00% | Equinor Energy AS | North Sea | Gas |
Martin Linge3) | 70.00% | Equinor Energy AS | North Sea | Oil and gas |
Njord future | 27.50% | Equinor Energy AS | Norwegian Sea | Oil |
Peregrino phase 2 | 60.00% | Equinor Brasil Energia Ltd | Campos basin, off Brazil | Oil |
Bauge, tie-in to Njord A | 42.50% | Equinor Energy AS | Norwegian Sea | Oil and gas |
Askeladd, tie-in to Snøhvit | 36.79% | Equinor Energy AS | Barents Sea | Gas and condensate |
Ærfugl | 36.17% | Aker BP ASA | Norwegian Sea | Gas and condensate |
Zinia phase 2, block 17 satellite | 23.33% | Total E&P Angola Block 17 | Congo basin, off Angola | Oil |
CLOV phase 2, block 17 satellite4) | 23.33% | Total E&P Angola Block 17 | Congo basin, off Angola | Oil |
Dalia phase 3, block 17 satellite4) | 23.33% | Total E&P Angola Block 17 | Congo basin, off Angola | Oil |
Snorre expansion | 33.28% | Equinor Energy AS | North Sea | Oil |
Troll phase 3 | 30.58% | Equinor Energy AS | North Sea | Gas and oil |
Vito | 36.89% | Shell Offshore Inc | Gulf of Mexico | Oil |
Johan Castberg | 50.00% | Equinor Energy AS | Barents Sea | Oil |
Johan Sverdrup phase 25) | 40.03% | Equinor Energy AS | North Sea | Oil and associated gas |
- held through Lundin | 4.54% | - | - | - |
Ekofisk removal campaign 3 | 7.60% | ConocoPhillips Skandinavia AS | North Sea | Field decommissioning |
| | | | |
1) Technical service provider is E.ON Climate and Renewables Services GmbH |
2) Technical service provider is Scatec Equinor Solutions AS |
3) Total E&P Norge AS was operator before 19 March 2018 |
4) The project has been sanctioned by the partnership, awaiting approval from the concessioner |
5) The government has issued a white paper to the Norwegian parliament, recommending approval of the plan for development and operation |
54 Equinor, Annual Report on Form 20-F 2018
Applicable laws and regulations
Equinor operates in more than 30 countries and is exposed and committed to compliance with numerous laws and regulations globally.
This section gives a general description on the legal and regulatory framework in the various jurisdictions where Equinor operates and in particular in the countries in which Equinor has its core activities. For further information about the jurisdictions in which Equinor operates, see sections 2.2 Business overview and 2.11 Risk review. Further, see chapter 3 Governance for domicile and legal form of Equinor, including the current articles of association, information on listing on the Oslo Børs and New York Stock Exchange (NYSE) and corporate governance.
Upstream regulatory framework oil & gas
Currently, Equinor is subject to two main regimes applicable to petroleum activities worldwide:
· Corporate income tax regimes; and/or
· Production sharing agreements (PSAs).
A general description of these regimes is provided below and a more detailed description of the applicable regulations in some core areas in which Equinor has activities.
Equinor is also subject to a wide variety of HSE laws and regulations concerning its products, operations and activities. Laws and regulations may be jurisdiction specific, but also international regulations, conventions or treaties, as well as EU directives and regulations, are relevant.
Income tax regimes
Under an income tax regime, companies are granted licences, also known as concession regimes, - by the government to extract petroleum, similar to the Norwegian system, see below. Typically, the licensees are offered to pre-qualified companies following bidding rounds. The criteria for the evaluation of bidding offers under these regimes can be the level of offered signature bonus (bid amount), minimum exploration programme, and/or local content. The successful bidder(s) will receive a right to explore, develop and produce petroleum within a specified geographical area and a limited period of time in exchange for those commitments. The terms of the licences are usually not negotiable. The fiscal regime may entitle the state to royalties, profit tax or special petroleum tax.
PSA regimes
PSAs are normally awarded to the contractor parties after bidding rounds announced by the government. Main bid parameters are a minimum exploration programme and signature bonuses.
Under a PSA, the host government typically retains the right to the hydrocarbons in place. The contractor receives a share of the production for services performed. Normally, the contractors carry the exploration costs and risk prior to a commercial discovery and are then entitled to recover those costs during the production phase. The remaining share of the production, the profit share, is split between the government and the contractor. The contractor is usually subject to income tax on its own share of the profit oil. Fiscal provisions in a PSA are to a large extent negotiable and are unique to each PSA.
Norway
The principal laws governing Equinor’s petroleum activities in Norway are the Norwegian Petroleum Act and the Norwegian Petroleum Taxation Act.
Norway is not a member of the European Union (EU), but Norway is a member of the European Free Trade Association (EFTA). The EU and the EFTA Member States have entered into the Agreement on the European Economic Area, referred to as the EEA Agreement, which provides for the inclusion of EU legislation in the national law of the EFTA Member States (except Switzerland). Equinor’s business activities are subject to both the EFTA Convention and EU laws and regulations adopted pursuant to the EEA Agreement.
Under the Petroleum Act, the Norwegian Ministry of Petroleum and Energy (MPE) is responsible for resource management and for administering petroleum activities on the NCS. The main task of the MPE is to ensure that petroleum activities are conducted in
Equinor, Annual Report on Form 20-F 2018 55
accordance with the applicable legislation, the policies adopted by the Norwegian Parliament (the Storting) and relevant decisions of the Norwegian State.
The Storting's role in relation to major policy issues in the petroleum sector can affect Equinor in two ways: firstly, when the Norwegian State acts in its capacity as majority owner of Equinor shares and, secondly, when the Norwegian State acts in its capacity as regulator:
· The Norwegian State's shareholding in Equinor is managed by the Ministry of Petroleum and Energy. The MPE will normally decide how the Norwegian State will vote on proposals submitted to general meetings of the shareholders. However, in certain exceptional cases, it may be necessary for the Norwegian State to seek approval from the Storting before voting on a certain proposal. This will normally be the case if Equinor issues additional shares and such issuance would significantly dilute the Norwegian State's holding, or if such issuance would require a capital contribution from the Norwegian State in excess of government mandates. A decision by the Norwegian State to vote against a proposal on Equinor’s part to issue additional shares would prevent Equinor from raising additional capital in this manner and could adversely affect Equinor’s ability to pursue business opportunities. For more information about the Norwegian State's ownership, see Risks related to state ownership in section 2.11 Risk review, chapter 3 Governance, and Major shareholders in section 5.1 Shareholder information
· The Norwegian State exercises important regulatory powers over Equinor, as well as over other companies and corporations on the NCS. As part of its business, Equinor or the partnerships to which Equinor is a party, frequently need to apply for licences and other approval of various kinds from the Norwegian State. Although Equinor is majority-owned by the Norwegian State, it does not receive preferential treatment with respect to licences granted by or under any other regulatory rules enforced by the Norwegian State
The principal laws governing Equinor’s petroleum activities in Norway and on the NCS are the Norwegian Petroleum Act of 29 November 1996 (the Petroleum Act) and the regulations issued thereunder, and the Norwegian Petroleum Taxation Act of 13 June 1975 (the Petroleum Taxation Act). The Petroleum Act sets out the principle that the Norwegian State is the owner of all subsea petroleum on the NCS, that exclusive right to resource management is vested in the Norwegian State and that the Norwegian State alone is authorised to award licences for petroleum activities as well as determine its terms. Licensees are required to submit a plan for development and operation (PDO) to the MPE for approval. For fields of a certain size, the Storting has to accept the PDO before it is formally approved by the MPE. Equinor is dependent on the Norwegian State for approval of its NCS exploration and development projects and its applications for production rates for individual fields.
Production licences are the most important type of licence awarded under the Petroleum Act and are normally awarded for an initial exploration period, which is typically six years, but which can be shorter. The maximum period is ten years. During this exploration period, the licensees must meet a specified work obligation set out in the licence. If the licensees fulfil the obligations set out in the initial licence period, they are entitled to require that the licence be prolonged for a period specified at the time when the licence is awarded, typically 30 years.
The terms of the production licences are decided by the Ministry of Petroleum and Energy. A production licence grants the holder an exclusive right to explore for and produce petroleum within a specified geographical area. The licensees become the owners of the petroleum produced from the field covered by the licence. Production licences are awarded to group of companies forming a joint venture at the Ministry’s discretion. The members of the joint venture are jointly and severally responsible to the Norwegian State for obligations arising from petroleum operations carried out under the licence. The Ministry of Petroleum and Energy decides the form of the joint operating agreements and accounting agreements.
The governing body of the joint venture is the management committee. In licences awarded since 1996 where the State's direct financial interest (SDFI) holds an interest, the Norwegian State, acting through Petoro AS, may veto decisions made by the joint venture management committee, which, in the opinion of the Norwegian State, would not be in compliance with the obligations of the licence with respect to the Norwegian State's exploitation policies or financial interests. This power of veto has never been used.
Interests in production licences may be transferred directly or indirectly subject to the consent of the MPE and the approval of the Ministry of Finance of a corresponding tax treatment position. In most licences, there are no pre-emption rights in favour of the other licensees. However, the SDFI, or the Norwegian State, as appropriate, still holds pre-emption rights in all licences.
The day-to-day management of a field is the responsibility of an operator appointed by the MPE. The operator is in practice always a member of the joint venture holding the production licence, although this is not legally required. The terms of engagement of the operator are set out in the joint operating agreement.
If important public interests are at stake, the Norwegian State may instruct the operators on the NCS to reduce the production of petroleum. The last time the Norwegian State instructed a reduction in oil production was in 2002.
A licence from the MPE is also required in order to establish facilities for the transportation and utilisation of petroleum. Ownership of most facilities for the transportation and utilisation of petroleum in Norway and on the NCS is organised in the form of joint ventures. The participants' agreements are similar to joint operating agreements for production.
56 Equinor, Annual Report on Form 20-F 2018
Licensees are required to prepare a decommissioning plan before a production licence or a licence to establish and use facilities for the transportation and utilisation of petroleum expires or is relinquished, or the use of a facility ceases. On the basis of the decommissioning plan, the Ministry of Petroleum and Energy makes a decision as to the disposal of the facilities.
For an overview of Equinor’s activities and shares in Equinor’s production licences on the NCS, see section 2.3 E&P Norway.
Gas sales and transportation from the NCS
Equinor markets gas from the NCS on its own behalf and on the Norwegian State's behalf. Gas is transported through the Gassled pipeline network to customers in the UK and mainland Europe. The gas is mainly transported trough the Norwegian gas transport system (Gassled) to customers in the UK and mainland Europe.
The Norwegian gas transport system, consisting of the pipelines and terminals through which licensees on the NCS transport their gas, is owned by a joint venture called Gassled. The Norwegian Petroleum Act of 29 November 1996 and the pertaining Petroleum Regulation establish the basis for non- discriminatory third-party access to the Gassled transport system.
The tariffs for the use of capacity in the transport system are determined by applying a formula set out in separate tariff regulations stipulated by the Ministry of Petroleum and Energy. The tariffs are paid on the basis of booked capacity, not on the basis of the volumes actually transported.
For further information, see section 2.5 MMP – Marketing, Midstream & Processing under Pipelines.
The Norwegian State's participation
In 1985, the Norwegian State established the State's direct financial interest (SDFI) through which the Norwegian State has direct participating interests in licences and petroleum facilities on the NCS. As a result, the Norwegian State holds interests in a number of licences and petroleum facilities in which Equinor also hold interests. Petoro AS, a company wholly owned by the Norwegian State, was formed in 2001 to manage the SDFI assets.
The Norwegian State has a coordinated ownership strategy aimed at maximising the aggregate value of its ownership interests in Equinor and the Norwegian State`s oil and gas. This is reflected in the owner`s instruction, which contains a general requirement that, in our activities on the NCS, we are required to take account of these ownership interests in decisions that may affect the execution of this marketing arrangement. See also below.
SDFI oil and gas marketing and sale
Equinor markets and sells the Norwegian State's oil and gas together with Equinor’s own production. The arrangement has been implemented by the Norwegian State.
In an extraordinary shareholder meeting in 2001, the Norwegian State, as sole shareholder, approved an instruction to Equinor setting out specific terms for the marketing and sale of the Norwegian State's oil and gas; the “Owner's instruction”.
Equinor is obliged under the Owner's instruction to jointly market and sell the Norwegian State's oil and gas as well as Equinor’s own oil and gas. The overall objective of the marketing arrangement is to obtain the highest possible total value for Equinor’s oil and gas and the Norwegian State's oil and gas, and to ensure an equitable distribution of the total value creation between the Norwegian State and Equinor.
The Norwegian State may at any time utilise its position as majority shareholder of Equinor to withdraw or amend the marketing instruction
US
Petroleum activities in the US are extensively regulated by multiple agencies in the US federal government, and by tribal, state and local regulation. The US government directly regulates development of hydrocarbons on federal lands, in the US Gulf of Mexico, and in other offshore areas. Different federal agencies directly regulate portions of the industry, and other general regulations related to environmental, safety, and physical controls apply to all aspects of the industry. In addition to regulation by the US federal government, any activities on US tribal lands (indigenous persons’ semi-sovereign territory) are regulated by governments and agencies in those areas. Very significantly for Equinor’s US onshore interests, each individual state has its own regulations of all aspects of hydrocarbon development within its borders. A recent trend also includes local municipalities adopting their own hydrocarbon regulations.
In the US, hydrocarbon interests are considered as private property right. In areas owned by the US government, that means that the government owns the minerals in its capacity as land owner. The federal government, and each tribal and state government, establish the terms of their own leases, including the length of time of the lease, the royalty rate, and other terms. A very significant percentage of onshore minerals (the vast majority in every state in which Equinor has onshore interests), including hydrocarbons, belong to private individuals.
Equinor, Annual Report on Form 20-F 2018 57
In order to explore for or develop hydrocarbons, a company must enter into a lease agreement from the governmental agency for federal, state or tribal land, and for private lands, from each one of the individuals owning the minerals the company wishes to develop. In each lease, the lessor retains a royalty interest in the production from the leased area (if any). The lessee owns a working interest and has the right to explore and produce oil and gas. A lessee incurs all the costs and liabilities, but will share only the portion of the revenue that is net of costs and expenses and not reserved to the lessor through its royalty interest.
Leases typically have a primary term for a specified number of years (from one to ten years) and a conditional secondary term that is tied to the production life of the properties. If oil and gas is being produced in paying quantities at the end of the primary term or the operator satisfies other obligations specified in the agreement, the lease typically continues beyond the primary term (Held by Production). Leases typically involve paying the lessor both signing bonus based on the number of leased acres and royalty payment based on the production.
Each state has its own agencies that regulate the development, exploration, and production of oil and gas activities. These state agencies issue drilling permits and control pipeline transportation within state boundaries. Particularly relevant to Equinor’s US onshore activities, these state agencies include: 1) Railroad Commission of Texas; 2) Pennsylvania Department of Environmental Protection's Office of Oil and Gas Management; 3) Ohio Department of Natural Resources, Division of Oil and Gas; 4) West Virginia Department of Environmental Protection; and 5) North Dakota Industrial Commission, Department of Mineral Resources, Oil and Gas Division. In addition, some state utility departments handle pipeline transportation within state boundaries, and each state also has its own department regulating environmental, health, and safety issues arising from oil and gas operations.
The fiscal regime in the US entitles the state to income tax and royalties where the state is the lessor. Federal tax regulations also provide numerous special rules and deductions relating to the income taxes charged for exploration and production of oil and gas.
Brazil
In Brazil, licences are mainly awarded according to a concession regime or a production sharing regime (the latter specifically for areas within the pre-salt polygon area or strategic areas) by the Federal Government. All state-owned and private oil companies may participate in the bidding rounds provided they follow the bidding rules and meet the qualification criteria. The tender protocol issued for each bidding round contains the draft of the concession agreement or the production sharing agreement that the winners must adhere to without the possibility of negotiating its terms, i.e., all the agreements signed under a certain bidding round contain the same general provisions and only differ in the particular items presented in the offers as the case may be. There is no restriction on foreign participation, provided that the foreign investor incorporates a company under the Brazilian law for signing the agreement and complies with the requirements established by the National Agency of Oil, Natural Gas and Biofuels (ANP).
The current criteria for the evaluation of bidding offers under the concession regime are: (a) signature bonus; and (b) minimum exploration programme but in past bidding rounds the participants also had to offer a local content percentage as a firm commitment. The companies can bid individually or in consortium always observing the qualification criteria for operator and non-operators.
The concession agreements are signed by ANP on behalf of the Federal Government. In general terms, concessions are granted for the total period of 30 years and typically the exploration phase lasts from two to eight years, usually divided into different periods with specific commitments, while the production phase may last 27 years as of the declaration of commerciality. Concessionaires are entitled to request the extension of each of these phases, subject to ANP approval.
As to bidding rounds involving the production sharing regime, the law grants to the Brazilian mixed company Petroleo Brasileiro S.A. - Petrobras a right of preference to be the sole operator in the pre-salt fields with a minimum 30% of participating interest. If this right is exercised, Petrobras may still participate in the bidding round and present offers for the remaining 70% in equal conditions to any other companies. Likewise, the concession bidding rounds, the companies are allowed to bid individually or together with other companies. The winners are also obliged to form a consortium with Pre-Sal Petroleo S.A. (PPSA), a Brazilian state-owned company, which will be responsible for managing the production sharing agreement and selling the production allocated to the Government under the profit oil. PPSA shall also have the role of chairman in the operating committee with 50% of the votes in addition to certain veto rights and casting vote.
The current criteria for the evaluation of bidding offers under the production sharing regime is the percentage of profit oil. The winner will be the one which offers the highest percentage to the government in accordance with the technical and economic parameters established for each block in the tender documents under a certain bidding round.
The production sharing contracts are signed by the Ministry of Mines and Energy on behalf of the Federal Government. In general terms, the contracts are valid for the total period of 35 years which currently, in accordance with the law, cannot be extended. There are also two phases – the exploration and production phases. The exploration phase can be extended provided that the total period of the contract remains as 35 years.
58 Equinor, Annual Report on Form 20-F 2018
In order to perform the exploration and exploitation of oil and gas reserves, the companies must obtain an environmental licence granted by the Federal Environmental Protection Agency (IBAMA), which, together with ANP, is responsible for the safety and environmental regulations regarding upstream activities.
Income and capital gains earned by Brazilian legal entities are subject to Corporate Income Tax and Social Contribution on Net Profits. Gains realised by a non-resident on the sale or disposal of any assets located in Brazil are subject to withholding income tax.
The Social Security Financing Contribution and the contribution to the Social Integration Program are federal taxes levied on monthly gross revenues.
HSE regulation relevant for the Norwegian upstream oil & gas activities in Norway
Equinor’s petroleum operations are subject to extensive laws and regulations relating to health, safety and the environment ("HSE").
Equinor’s oil and gas operations in Norway must be conducted in compliance with a reasonable standard of care, taking into consideration the safety of workers, the environment and the economic values represented by installations and vessels. The Petroleum Act specifically requires that petroleum operations be carried out in such a manner that a high level of safety is maintained and developed in step with technological developments. Equinor is also required at all times to have a plan to deal with emergency situations in Equinor's petroleum operations. During an emergency, the Norwegian Ministry of Labour/Norwegian Ministry of Fisheries and Coastal Affairs/Norwegian Coastal Administration may decide that other parties should provide the necessary resources, or otherwise adopt measures to obtain the necessary resources, to deal with the emergency for the licensees' account.
Liability for pollution damage
The Norwegian Petroleum Act imposes strict liability for pollution damage on all licensees, and a licensee is liable for pollution damage without regard to fault.
A claim against the licence holders for compensation relating to pollution damage shall initially be directed to the operator, which in accordance with the terms of the joint operating agreement, - will distribute the claim to the other licensees in accordance with their participating interest in the licence.
As a holder of licences on the NCS, Equinor is subject to statutory strict liability under the Petroleum Act in respect of losses or damage suffered as a result of pollution caused by spills or discharges of petroleum from petroleum facilities covered by any of Equinor's licences. This means that anyone within the State or the delineation of the NCS who suffers losses or damage as a result of pollution caused by operations in any of Equinor's NCS licence areas can claim compensation from Equinor without having to demonstrate that the damage is due to any fault on Equinor's part.
Discharge permits
Emissions and discharges from Norwegian petroleum activities are regulated through several acts, including the Petroleum Act, the CO2 Tax Act, the Sales Tax Act, the Greenhouse Gas Emission Trading Act and the Pollution Control Act. Discharge of oil and chemicals in relation to exploration, development and production of oil and natural gas are regulated under the Pollution Control Act. In accordance with the provisions of this Act, the operator must apply for a discharge permit from relevant authorities on behalf of the licence group in order to discharge any pollutants into the water. Further, the Petroleum Act states that burning of gas in flares beyond what is necessary for safety reasons to ensure normal operations is not permitted without approval from the MPE. All operators on the NSC have an obligation, and are responsible, for establishing sufficient procedures for the monitoring and reporting of any discharge into the sea. The Environment Agency, the Norwegian Petroleum Directorate and the Norwegian Oil Industry Association have established a joint database for reporting emissions to air and discharges to sea from the petroleum activities, Environmental Web (EW). All operators on the NCS report emission and discharge data directly into the database.
Emission regulations – reduction of carbon emissions
Equinor's operations in Norway are subject to emissions taxes as well as emissions allowances granted for Equinor's larger European operations under the emissions trading scheme. The agreed strengthening of the EU's emission trading scheme may result in a significant reduction in the total emissions from relevant energy and industry installations which includes Equinor’s installations at the NCS. The price of the emissions allowances is also expected to increase significantly towards 2030. The Climate Act, applicable only for the Government’s following up on the Parliaments climate related decisions and expectations might also impact on the industry’s regulatory framework.
The EU directive 2009/31/EU on storage of CO2 is implemented in the Pollution Control Act and the Petroleum Act. The CO2 catch and storage at Equinor’s Sleipner and Snøhvit fields are governed by these regulations.
HSE regulation relevant for upstream oil and gas activities in the US
Equinor’s upstream activities in the US are heavily regulated at multiple levels, including federal, state, and local municipal regulation. Equinor is subject to those regulations as a part of its activities in the US onshore (including Equinor’s assets in Texas, North Dakota, Montana, Ohio, and West Virginia), and activities in the US Gulf of Mexico.
Equinor, Annual Report on Form 20-F 2018 59
On a nationwide basis, The National Environmental Policy Act is an umbrella procedural statute that requires federal agencies to consider the environmental impacts of their actions.
Several substantive US federal statutes specifically cover parts of potential environmental effects of hydrocarbon extraction activities. Those include: the Clean Air Act, which regulates air quality and emissions; the Clean Water Act, which regulates water quality and discharges; the Safe Drinking Water Act, which establishes drinking water standards for tap water and underground injection rules; the Resource Conservation and Recovery Act, which regulates hazardous and solid waste management; the Comprehensive Environmental Response, Compensation and Liability Act, which addresses remediation of legacy disposal sites and release reporting; and, the Oil Pollution Act, which provides for oil spill prevention and response.
Other US federal statutes are resource-specific. The Endangered Species Act protects listed endangered and threatened species and critical habitat. Other statutes protect certain species, including the Migratory Bird Treaty Act, the Bald and Golden Eagle Protection Act and the Marine Mammal Protection Act. Other statutes govern natural resource planning and development on federal lands onshore and on the Outer Continental Shelf, including: the Mineral Leasing Act; the Outer Continental Shelf Lands Act; the Federal Land Policy and Management Act; the Mining Law 1872; the National Forest Management Act; the National Park Service Organic Act; the Wild and Scenic Rivers Act; the National Wildlife Refuge System Administration Act; the Rivers and Harbors Act; and, the Coastal Zone Management Act.
The federal government regulates offshore exploration and production for the Outer Continental Shelf (OCS), which extends from the edge of state waters (either 3 or 9 nautical miles from the coast, depending on the state) out to the edge of national jurisdiction, 200 nautical miles from shore. The Bureau of Ocean Energy Management (BOEM) manages federal OCS leasing programmes, conducts resource assessments, and licences seismic surveys. The Bureau of Safety and Environmental Enforcement (BSEE) regulates all OCS oil and gas drilling and production. The Office of Natural Resources Revenue (ONRR) collects and disburses rents and royalties from offshore and onshore federal and Native American lands. BOEM, BSEE, and ONRR were formed in the 2010 and 2012 reorganisations of the Minerals Management Service.
BSEE drilling and production regulations have been extensively revised in response to the 2010 Deepwater Horizon blowout and oil spill. The regulations include requirements for enhanced well design, improved blowout preventer design, testing and maintenance, and an increased number of trained inspectors. The current Administration is in the process of reviewing and revising these regulations, and Equinor is engaged with relevant governmental and industry stakeholders to ensure that Equinor's operations remain in compliance with current regulations and any potential changes to those regulations.
Additional federal statutes cover certain products or wastes, and focus on human health and safety: the Toxic Substances Control Act regulates new and existing chemicals and products that contain these chemicals; the Hazardous Materials Transportation Act regulates transportation of hazardous materials; the Occupational Safety and Health Act regulates hazards in the workplace; the Emergency Planning and Community Right-to-Know Act provides emergency planning and notification for hazardous and toxic chemicals.
The federal and state governments share authority to administer some federal environmental programmes (eg, the Clean Air Act and Clean Water Act). States also have their own, sometimes more stringent, environmental laws. Counties, cities and other local government entities may have their own requirements as well.
On both the federal and state levels, the legislative and regulatory framework, and specific regulatory and legislative provisions affecting Equinor’s activities, are subject to the ebb and flow in administrative agencies as political parties and administrations change at the federal and state levels. Equinor continually monitors the pace of regulatory and legislative changes at all levels and engages in the stakeholder process through trade associations and direct comments to suggested regulatory and legislative regimes, in order to remain in compliance.
HSE regulation relevant for the upstream oil & gas activities in Brazil
Equinor’s oil and gas operations in Brazil must also be conducted in compliance with reasonable standard of care, taking into consideration the safety and health of workers and the environment. The Brazilian Petroleum Law (Law No. 9,478/97) describes the government’s policy objectives for the rational use of the country’s energy resources, including among them the protection of the environment. In addition to the Petroleum Law, Equinor is also subject to many other laws and regulation issued by different authorities including but not limited to the National Agency of Petroleum, Natural Gas and Biofuels (ANP), Federal Environmental Agency (IBAMA), Federal Environmental Council (CONAMA) and Brazilian Navy. All those authorities have the power for imposing fines in case of non-compliance with the respective rules. The concession and production sharing contracts also impose obligations to the operator and consortium members, who are jointly and severally liable. They must, at their own account and risk, assume and fully respond to all losses and damages caused directly or indirectly by the operations and their performance irrespective of fault, to the ANP, the Federal Government and third parties.
60 Equinor, Annual Report on Form 20-F 2018
The extraction and production of oil and gas depend on environmental licences which define the conditions on the implementation of the project and compliance measures to mitigate and control environment impact. Equinor is subject to fines in case of non-compliance with such conditions.
In Brazil, Equinor is also required to have an emergency response system as per ANP Ordinance 44/2009 to deal with emergency situations in its petroleum operations, as well as an individual oil soil plan for each asset to minimise the environmental impact of any environmental unexpected situation that may generate spill of oil or chemical to sea.
Discharge permits
Discharges from Brazilian petroleum activities are regulated through several acts, including the CONAMA Resolution 393/2007 for produced water, CONAMA Resolution No. 357/2005 for effluents (sewage, etc) and IBAMA technical Instruction No. 01/2018 for drilling waste. Discharge of chemicals in relation to exploration, development and production of oil and natural gas are assessed as part of the permitting process, as per CONAMA Ordinance No. 422/2011. In accordance with the provisions of these requirements, the operator shall apply for any discharge permit from relevant authorities on behalf of the licence group in order to discharge any pollutants into the water.
Emission regulations – reduction of carbon emissions
Equinor's operations in Brazil are not subject to emissions taxes (CO2 limit) yet, but there is a proposal sent to the government by the Brazilian Business Council for Sustainable Development (CEBDS) proposing USD 10/ton CO2eq. Further, CONAMA No. 436/11 regulates air emissions limits (e.g. NOx) from all fix sources that have total power consumption higher than 100MW.
ANP Ordinance No. 249/00 allows burning of gas in flares for safety reasons to ensure normal operations but it is limited to 3% of the monthly production of associated gas. Any additional volume shall be pre-approved.
Brazil government signed the Paris Agreement in 2016. The country's ambition is to reduce its greenhouse gas emissions by 37% until 2025 and 43% until 2030, compared to 2005 levels. [Due to the need of boosting the economy and an expected growing energy demand, the focus on emissions reduction is on improved control of Forests and Land Use. To meet the growing energy demand challenge, the national government has indicated acceptance for an increase in the total emissions in short term from the industrial & power generation sectors, although the efficiency in power generation and usage will certainly be an important part of the puzzle.]
Taxation of Equinor
Equinor is subject to ordinary Norwegian corporate income tax and to a special petroleum tax relating to its offshore activities in Norway. Equinor’s profits, both from offshore oil and natural gas activities and from onshore activities, are subject to Norwegian corporate income tax. The standard corporate income tax rate has been reduced from 23% in 2018 to 22% in 2019. In addition, a special petroleum tax is levied on profits from petroleum production and pipeline transportation on the NCS. The special petroleum tax rate has been increased from 55% in 2018 to 56% in 2019. The special petroleum tax rate is applied to relevant income in addition to the standard income tax rate, resulting in a 78% marginal tax rate on income subject to the special petroleum tax. For further information, see note 9 Income taxes to the Consolidated financial statements.
Equinor's international petroleum activities are subject to tax pursuant to local legislation. Fiscal regulation of Equinor’s upstream operations is generally based on corporate income tax regimes and/or PSAs. Equinor expects the impact of the US tax reform enacted in 2017 to be favourable to Equinor and its US operations, primarily due to the reduction in the US corporate income tax rate from 35% to 21%. This change in US tax legislation (effective 1 January 2018) has no impact on Equinor’s deferred tax balance as Equinor has not recognised any net deferred tax asset or liability related to our US operations as of 31 December 2018. See note 9 Income taxes and note 10 Property, plant and equipment to the Consolidated financial statements.
Equinor, Annual Report on Form 20-F 2018 61
Subsidiaries and properties
Significant subsidiaries
The following table shows significant subsidiaries and significant equity accounted companies within Equinor group as of 31 December 2018.
Significant subsidiaries and significant equity accounted companies | | | |
| | | | | | |
Name | in % | Country of incorporation | | Name | in % | Country of incorporation |
| | | | | | |
Equinor Angola Block 15 AS | 100 | Norway | | Equinor International Netherlands BV | 100 | Netherlands |
Equinor Angola Block 17 AS | 100 | Norway | | Equinor Murzuq AS | 100 | Norway |
Equinor Angola Block 31 AS | 100 | Norway | | Equinorl Natural Gas LLC | 100 | USA |
Equinor Apsheron AS | 100 | Norway | | Equinor New Energy (Group) | 100 | Norway |
Equinor Brasil Energia Ltda. | 100 | Brazil | | Equinor Nigeria Energy Company Ltd. | 100 | Nigeria |
Equinor BTC (Group) | 100 | Norway | | Equinor Norsk LNG AS | 100 | Norway |
Equinor Canada Ltd (Group) | 100 | Canada | | Equinor OTS AB | 100 | Sweden |
Equinor Danmark (Group) | 100 | Denmark | | Equinor Refining Norway AS | 100 | Norway |
Equinor Deutschland GmbH (Group) | 100 | Germany | | Equinor Sincor Netherlands BV | 100 | Netherlands |
Equinor Dezassete AS | 100 | Norway | | Equinor Tanzania AS | 100 | Norway |
Equinor Energy AS | 100 | Norway | | Equinor UK Ltd (Group) | 100 | United Kingdom |
Equinor Energy Brazil AS | 100 | Norway | | Equinor US Holding Inc. (Group) | 100 | USA |
Equinor Energy do Brasil Ltda. | 100 | Brazil | | Statholding AS (Group) | 100 | Norway |
Equinor Energy Netherlands BV | 100 | Netherlands | | Statoil Kharyaga AS | 100 | Norway |
Equinor Energy Nigeria AS | 100 | Norway | | Statoil Sverige Kharyaga AB | 100 | Sweden |
Equinor Exploration Ireland Ltd. | 100 | Ireland | | South Atlantic Holding BV | 60 | Netherlands |
Equinor Holding Netherlands BV | 100 | Netherlands | | AWE-Arkona-Windpark Entwicklungs-GmbH1) | 50 | Germany |
Equinor In Amenas AS | 100 | Norway | | Roncador BV2) | 25 | Netherlands |
Equinor In Salah AS | 100 | Norway | | Lundin Petroleum AB1) | 20 | Sweden |
Equinor Insurance AS | 100 | Norway | | | | |
| | | | | | |
1) Equity accounted entities. |
2) Roncador BV is accounted for as a jointly controlled operation and is proportionally consolidated |
| | | | | | |
Real estate
Equinor has interests in real estate in many countries throughout the world. However, no individual property is significant. The largest office buildings are the Equinor's head office located at Forusbeen 50, NO-4035, Stavanger, Norway which comprises approximately 135,000 square meters of office space, and the 65,500 square metre office building located at Fornebu on the outskirts of Norway's capital Oslo. Both office buildings are leased.
For a description of significant reserves and sources of oil and natural gas, see Proved oil and gas reserves in section 2.8 Operational performance and section 4.2 Supplementary oil and gas information (unaudited) later in this report. For a description of operational refineries, terminals and processing plants, see section 2.5 MMP – Marketing, Midstream & Processing.
For more information, see note 10 Property, plant and equipment to the Consolidated financial statement.
Related party transactions
See note 25 Related parties to the Consolidated financial statements. See also section 3.4 Equal treatment of shareholders and transactions with close associates.
62 Equinor, Annual Report on Form 20-F 2018
Insurance
Equinor maintains insurance coverage that includes coverage for physical damage to its oil and gas properties, third-party liability, workers' compensation and employers' liability, general liability, sudden pollution and other coverage. See also section 2.11 Risk review under Risk factors.
Equinor, Annual Report on Form 20-F 2018 63
2.8 Operational performance |
Proved oil and gas reserves
Proved oil and gas reserves were estimated to be 6,175 million boe at year end 2018, compared to 5,367 million boe at the end of 2017.
Changes in proved reserves estimates are most commonly the result of revisions of estimates due to observed production performance, extensions of proved areas through drilling activities or the inclusion of proved reserves in new discoveries through the sanctioning of new development projects. These are sources of additions to proved reserves that are the result of continuous business processes and can be expected to continue to add reserves in the future.
Proved reserves can also be added or subtracted through the acquisition or disposal of assets or due to factors outside management control, such as changes in oil and gas prices.
Higher oil and gas prices normally allow more oil and gas to be recovered from the accumulations. However, for fields with PSAs and similar contracts, an increased oil price may result in lower entitlement to the produced volume. These changes are included in the revisions category.
The principles for booking proved gas reserves are limited to contracted gas sales or gas with access to a robust gas market.
In Norway, the UK and Ireland, Equinor recognises reserves as proved when a development plan is submitted, as there is reasonable certainty that such a plan will be approved by the regulatory authorities. Outside these territories, reserves are generally booked as proved when regulatory approval is received, or when such approval is imminent. Reserves from new discoveries, upward revisions of reserves and purchases of proved reserves are expected to contribute to maintaining proved reserves in future years. Undrilled well locations in the US onshore are generally booked as proved undeveloped reserves when a development plan has been adopted and the well locations are scheduled to be drilled within five years.

Approximately 90% of Equinor’s proved reserves are located in OECD countries. Norway is by far the most important contributor in this category, followed by the US and Canada. Of Equinor's total proved reserves, 5% are related to PSAs in non-OECD countries such as Azerbaijan, Angola, Algeria, Nigeria, Libya and Russia. Other non-OECD reserves are related to concessions in Brazil, representing 5% of Equinor's total proved reserves. These are included in proved reserves in Americas excluding the US.
Development of reserves
The total volume of proved reserves increased by 808 million boe in 2018.
Change in proved reserves | | | |
| | | |
| For the year ended 31 December |
(million boe) | 2018 | 2017 | 2016 |
| | | |
Revisions and improved recovery (IOR) | 479 | 605 | 409 |
Extensions and discoveries | 848 | 441 | 179 |
Purchase of petroleum-in-place | 196 | 50 | 65 |
Sales of petroleum-in-place | (2) | (38) | (27) |
Total reserve additions | 1,521 | 1,059 | 626 |
Production | (713) | (705) | (673) |
| | | |
Net change in proved reserves | 808 | 354 | (47) |
| | | |
64 Equinor, Annual Report on Form 20-F 2018
Equinor, Annual Report on Form 20-F 2018 65
Significant changes in proved reserves in 2018
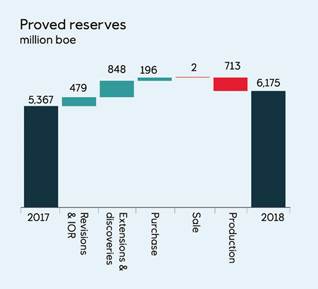
Revisions and IOR
Revisions of previously booked reserves, including the effect of improved recovery, increased the proved reserves by 479 million boe in 2018. This included the effect of the increased commodity prices, increasing the proved reserves by approximately 275 million boe through extended economic life time on several fields. Many producing fields also had positive revisions due to better performance, maturing of new wells and improved recovery projects, as well as reduced uncertainty due to further drilling and production experience. About two thirds of the total revisions came from fields in Norway, where many of the larger offshore fields continue to decline less than previously assumed for the proved reserves. This category also includes additional volumes at In Amenas in Algeria, where the production sharing agreement was extended by five years.
Extensions and discoveries
A total of 848 million boe of new proved reserves were added through extensions and new discoveries booking proved reserves for the first time. The largest addition came from the Troll field in Norway, where the Troll Phase 3 development project was sanctioned in 2018. Through this project, production from the Troll West reservoir which has previously focused on optimising recovery of the oil in this part of the reservoir, will now be extended vertically to also include recovery from the overlying gas cap. Sanctioning of the Johan Sverdrup phase 2 development in Norway and the Vito field development in the US Gulf of Mexico, also added significant volumes. In addition, this category includes extensions of the proved areas through drilling of new wells in previously undrilled areas in the US onshore plays and at some producing fields offshore Norway. New discoveries with proved reserves booked in 2018 are all expected to start production within a period of five years.
Purchase and sale of reserves
A total of 196 million boe of new proved reserves were purchased in 2018. This primarily includes the purchase of a 25% interest in the Roncador field offshore Brazil and an additional 51% interest in the Martin Linge field offshore Norway. In addition, this category includes minor volumes related to ownership changes in some US onshore assets (<1 million boe) and the sale of 2 million boe of proved reserves from the Alba field in the UK and the Flyndre field in Norway.
Production
The 2018 entitlement production was 713 million boe, an increase of 1.3% compared to 2017.
66 Equinor, Annual Report on Form 20-F 2018

In 2018, approximately 578 million boe were converted from proved undeveloped to proved developed reserves. The start-up of production from Aasta Hansteen in Norway and the effect of sanctioning of Troll Phase 3 increased the proved developed reserves by 288 million boe during 2018. The remaining 290 million boe of the converted volume is related to activities on developed assets. Over the last 5 years Equinor has converted 2,050 million boe of proved undeveloped reserves to proved developed reserves.
Equinor, Annual Report on Form 20-F 2018 67
Development of reserves in 2018 | | | |
| | | |
(million boe) | Total | Developed | Undeveloped |
| | | |
At 31 December 2017 | 5,367 | 3,342 | 2,025 |
Revisions and improved recovery | 479 | 345 | 134 |
Extensions and discoveries | 848 | 64 | 783 |
Purchase of reserves-in-place | 196 | 118 | 78 |
Sales of reserves-in-place | (2) | (2) | (0) |
Production | (713) | (713) | - |
Moved from undeveloped to developed | - | 578 | (578) |
| | | |
At 31 December 2018 | 6,175 | 3,733 | 2,442 |
| | | |
Net proved developed and undeveloped reserves | | | | |
| | | | | |
Proved reserves end of year | Oil and Condensate | NGL | Natural gas | Total |
(mmboe) | (mmboe) | (bcf) | (mmboe) |
| | | | | |
2018 | | 2,558 | 393 | 18,094 | 6,175 |
Developed | | 1,216 | 277 | 12,570 | 3,733 |
Undeveloped | | 1,342 | 116 | 5,524 | 2,442 |
2017 | | 2,302 | 379 | 15,073 | 5,367 |
Developed | | 1,112 | 278 | 10,958 | 3,342 |
Undeveloped | | 1,191 | 101 | 4,115 | 2,025 |
2016 | | 2,033 | 372 | 14,637 | 5,013 |
Developed | | 1,105 | 277 | 10,584 | 3,268 |
Undeveloped | | 928 | 95 | 4,054 | 1,746 |
| | | | | |
Proved reserves | | | | |
| | | | |
As of 31 December 2018 | Proved reserves |
Oil and Condensate | NGL | Natural Gas | Total oil and gas |
(mmboe) | (mmboe) | (bcf) | (mmboe) |
| | | | |
Developed | | | | |
Norway | 493 | 192 | 10,459 | 2,549 |
Eurasia excluding Norway | 46 | - | 111 | 66 |
Africa | 152 | 18 | 240 | 212 |
US | 279 | 68 | 1,740 | 657 |
Americas excluding US | 247 | - | 20 | 250 |
Total Developed proved reserves | 1,216 | 277 | 12,570 | 3,733 |
| | | | |
Undeveloped | | | | |
Norway | 1,028 | 95 | 4,841 | 1,986 |
Eurasia excluding Norway | 78 | - | 24 | 82 |
Africa | 13 | 3 | 26 | 21 |
US | 91 | 18 | 634 | 222 |
Americas excluding US | 131 | - | - | 131 |
Total Undeveloped proved reserves | 1,342 | 116 | 5,524 | 2,442 |
| | | | |
Total proved reserves | 2,558 | 393 | 18,094 | 6,175 |
| | | | |
| | | | |
68 Equinor, Annual Report on Form 20-F 2018
As of 31 December 2018, the total proved undeveloped reserves amounted to 2,442 million boe, 81% of which are related to fields in Norway. The Troll and Snøhvit fields, which have continuous development activities, together with fields not yet in production, such as Johan Sverdrup and Johan Castberg have the largest proved undeveloped reserves in Norway. The largest assets with respect to proved undeveloped reserves outside Norway are the Appalachian basin in the US, Mariner in the UK, ACG in Azerbaijan and Vito in the US.
All these fields are either producing or will start production within the next five years. For fields with proved reserves where production has not yet started, investment decisions have already been sanctioned and investments in infrastructure and facilities have commenced. Some development activities will take place more than five years from the disclosure date, but these are mainly related to incremental type of spending, such as drilling of additional wells from existing facilities, in order to secure continued production. There are no material development projects, which would require a separate future investment decision by management, included in our proved reserves. For our onshore plays in the US, the Appalachian basin, Eagle Ford and Bakken, all proved undeveloped reserves are limited to wells that are scheduled to be drilled within five years.
In 2018, Equinor incurred USD 8,172 million in development costs relating to assets carrying proved reserves, USD 7,297 million of which was related to proved undeveloped reserves.
Additional information about proved oil and gas reserves is provided in section 4.2 Supplementary oil and gas information.
Reserves replacement
The reserves replacement ratio is defined as the sum of additions and revisions of proved reserves divided by produced volumes in any given period. The following table presents the changes in reserves including equity accounted entities in each category relating to the reserve replacement ratio for the years 2018, 2017 and 2016.
“ | The 2018 reserves replacement ratio was 2.13 and the corresponding three-year
average was 1.53. |
The relative changes in the proved reserves in equity accounted and consolidated entities are similar in 2018. As a result, the reserves replacement ratio is 2,13 also when equity accounted entities are excluded.
The organic reserves replacement ratio, excluding sales and purchases was 1.89 compared to 1.48 in 2017. The organic average three-year replacement ratio, excluding sales and purchases, was 1.44 at the end of 2018. All numbers are including equity accounted entities.
For additional information regarding changes in proved reserves and the reliability of proved reserves estimates, see the sections 4.2 Supplementary oil and gas information and 2.11 Risk review, respectively.
Reserves replacement ratio | | | |
| | | |
| For the year ended 31 December |
(including purchases and sales) | 2018 | 2017 | 2016 |
| | | |
Annual | 2.13 | 1.50 | 0.93 |
Three-year-average | 1.53 | 1.00 | 0.70 |
| | | |
Proved reserves by region
Equinor, Annual Report on Form 20-F 2018 69
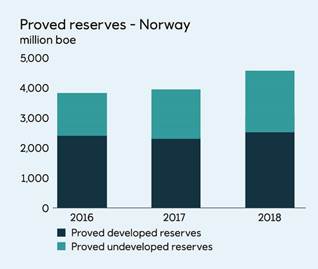
Proved reserves in Norway
A total of 4,534 million boe is recognised as proved reserves in 64 fields and field development projects on the NCS, representing 74% of Equinor's total proved reserves. Of these, 54 fields and field areas are currently in production, 421 of which are operated by Equinor.
Two major field development projects added proved reserves categorised as extensions and discoveries during 2018, the Troll Phase 3 development and the Johan Sverdrup phase 2 development. Production experience, further drilling and improved recovery on several of Equinor’s producing fields in Norway and the increased commodity prices also contributed positively to the revisions of the proved reserves in 2018.
Proved reserves in equity accounted companies in Norway represent Equinor’s relative share of Lundin’s share in fields carrying proved reserves, only where Equinor as a shareholder has sufficient access to data to be able to estimate proved reserves with reasonable certainty.
Of the proved reserves on the NCS, 2,549 million boe, or 56%, are proved developed reserves. Of the total proved reserves in this area, 60% are gas reserves related to large offshore gas fields such as Troll, Snøhvit, Oseberg, Ormen Lange, Visund, Aasta Hansteen, Åsgard and Tyrihans, and 40% are liquid reserves.
.
1 Fields carrying proved reserves at year-end 2018, whereas the number of fields with production during the year referred to in section 2.3 E&P Norway may be different depending on how production is allocated and reported.
70 Equinor, Annual Report on Form 20-F 2018
Proved reserves in Eurasia, excluding Norway
In this area, Equinor has proved reserves of 148 million boe related to four fields in Azerbaijan, Ireland, United Kingdom and Russia. Eurasia excluding Norway represents 2% of Equinor's total proved reserves, Azerbaijan being the main contributor with the Azeri-Chirag-Gunashli fields. All fields in this area except Mariner in the United Kingdom are producing. The largest change in this area in 2018 is a positive revision at Mariner which is mainly related to the increased oil price. Of the proved reserves in Eurasia, 66 million boe or 44% are proved developed reserves.
Of the total proved reserves in this area, 84% are liquid reserves and 16% are gas reserves.

Proved reserves in Africa
Equinor recognises proved reserves of 233 million boe related to 28 fields and field developments in several West and North African countries, including Algeria, Angola, Libya and Nigeria. Africa represents 4% of Equinor's total proved reserves. Angola is the primary contributor to the proved reserves in this area, with 24 of the 28 fields.
In Angola, Equinor has proved reserves in Block 15, Block 17 and Block 31, with production from all three blocks.
In Algeria, Libya and Nigeria, all fields are in production.
For information related to the Agbami redetermination process and the dispute between the Nigerian National Petroleum Corporation and the partners in Oil Mining Lease (OML) 128 concerning certain terms of the OML 128 Production Sharing Contract (PSC), see note 24 Other commitments, contingent liabilities and contingent assets to the Consolidated financial statements. The effect of this redetermination on the proved reserves, which is estimated to be less than 10 million boe, is not yet included.
In Algeria, the In Amenas PSA extension was approved by the authorities in 2018, resulting in a positive revision of the proved reserves.
Most of the fields in Africa other than in Algeria, are mature and many are on decline or approaching the expiration date of the current PSA. High production in 2018 combined with limited positive revisions resulted in further reduction of the total proved reserves in this area.
Equinor, Annual Report on Form 20-F 2018 71
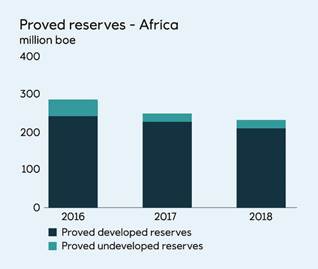
Of the total proved reserves in Africa, 212 million boe, or 91%, are proved developed reserves. Of the total proved reserves in this area, 80% are liquid reserves and 20% are gas reserves.
Proved reserves in the Americas
In North and South America, Equinor has proved reserves equal to 1,261 million boe in a total of 19 fields and field development projects. This represents 20% of Equinor's total proved reserves. Thirteen of these fields are located in the US, ten of which are offshore field developments in the Gulf of Mexico and three are onshore tight reservoir assets. Four are located in Canada and two in Brazil in South America.
In the US, nine of the ten fields in the Gulf of Mexico are producing. Stampede, Big Foot and Titan all started production during 2018. Vito, which was sanctioned in 2018, is the only field in this area that is not yet producing. The onshore tight reservoir assets in the Appalachian basin, Eagle Ford and Bakken are all in production.
In Canada, proved reserves are related to offshore field developments only. All four fields are producing.
The increase in proved reserves in this area is mainly due to purchase of the producing Roncador field in Brazil, adding new proved reserves in South America. New wells extending the proved areas in our US onshore assets, and positive effects of the increased oil price, also contributes to the increase. Proved reserves in the US now represent 14% of total proved reserves but is still disclosed as a separate geographic area in the tables since it represented 16% in 2017.
Of the total proved reserves in the Americas, 907 million boe, or 72%, are proved developed reserves. Of the total proved reserves in this area, 66% are liquid reserves and 34% gas reserves.
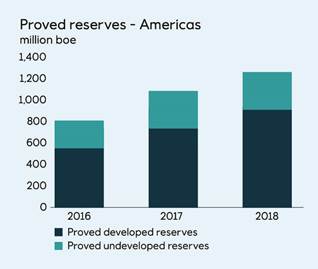
72 Equinor, Annual Report on Form 20-F 2018
Preparation of reserves estimates
Equinor's annual reporting process for proved reserves is coordinated by a central corporate reserves management (CRM) team consisting of qualified professionals in geosciences, reservoir and production technology and financial evaluation. The team has an average of more than 28 years' experience in the oil and gas industry. CRM reports to the vice president of finance and control in the Technology, Projects & Drilling business area and is thus independent of the Development & Production business areas in Norway, Brazil and International. All the reserves estimates have been prepared by Equinor's technical staff.
Although the CRM team reviews the information centrally, each asset team is responsible for ensuring that it is in compliance with the requirements of the SEC and Equinor's corporate standards. Information about proved oil and gas reserves, standardised measures of discounted net cash flows related to proved oil and gas reserves and other information related to proved oil and gas reserves, is collected from the local asset teams and checked by CRM for consistency and conformity with applicable standards. The final numbers for each asset are quality-controlled and approved by the responsible asset manager, before aggregation to the required reporting level by CRM.
The aggregated results are submitted for approval to the relevant business area management teams and the corporate executive committee.
The person with primary responsibility for overseeing the preparation of the reserves estimates is the manager of the CRM team. The person who presently holds this position has a bachelor's degree in earth sciences from the University of Gothenburg, and a master's degree in petroleum exploration and exploitation from Chalmers University of Technology in Gothenburg, Sweden. She has 33 years' experience in the oil and gas industry, 32 of them with Equinor. She is a member of the Society of Petroleum Engineering (SPE) and of the Technical Advisory Group to the UNECE Expert Group on Resource Management (EGRM).
DeGolyer and MacNaughton report
Petroleum engineering consultants DeGolyer and MacNaughton have carried out an independent evaluation of Equinor’s proved reserves as of 31 December 2018 using data provided by Equinor. The evaluation accounts for 100% of Equinor's proved reserves including equity accounted entities. The aggregated net proved reserves estimates prepared by DeGolyer and MacNaughton do not differ materially from those prepared by Equinor when compared on the basis of net equivalent barrels.
A reserves audit report summarising this evaluation is included as Exhibit 15 (a)(iii).
Net proved reserves | | | | |
| | | | |
| Oil and Condensate | NGL/LPG | Natural Gas | Oil Equivalent |
At 31 December 2018 | (mmbbl) | (mmbbl) | (bcf) | (mmboe) |
| | | | |
Estimated by Equinor | 2,558 | 393 | 18,094 | 6,175 |
Estimated by DeGolyer and MacNaughton | 2,771 | 359 | 17,584 | 6,264 |
| | | | |
Equinor, Annual Report on Form 20-F 2018 73
Operational statistics
The table below shows the total gross and net developed and undeveloped oil and gas acreage, in which Equinor had interests at 31 December 2018.
A gross value reflects the number of wells or acreage in which Equinor owns a working interest. The net value corresponds to the sum of the fractional working interests owned in the same gross wells or acres.
Developed and undeveloped oil and gas acreage | | | | | | | | |
| | | | | | | | |
At 31 December 2018 (in thousands of acres) | | Norway | Eurasia excluding Norway | Africa | US | Americas excluding US | Oceania | Total |
|
| | | | | | | | |
Acreage developed | - gross | 912 | 70 | 834 | 495 | 364 | - | 2,674 |
| - net | 346 | 16 | 268 | 117 | 61 | - | 809 |
Acreage undeveloped | - gross | 18,680 | 34,827 | 40,131 | 1,881 | 35,982 | 11,749 | 143,250 |
| - net | 8,443 | 13,904 | 17,214 | 1,022 | 14,917 | 6,928 | 62,427 |
| | | | | | | | |
The largest concentrations of developed acreage in Norway are in the Troll, Skarv, Oseberg area, Snøhvit and Ormen Lange fields. In Africa, the Algerian gas development projects In Amenas and In Salah represent the largest concentrations of developed acreage. Bakken (onshore US) has the largest developed acreage in the Americas.
Equinor's largest undeveloped acreage concentration is in South Africa. This represents 21% of Equinor’s total net undeveloped acreage and is followed by Russia and Norway, each representing 14%.
The largest undeveloped net acreage in the Americas is in Canada, Surinam and Nicaragua, with each more than 20% of the total for this geographic area. The country with the largest undeveloped net acreage in Eurasia excluding Norway is Russia. New Zealand and Australia constitutes the largest undeveloped net acreage in Oceania.
Equinor holds acreage in numerous concessions, blocks and leases. The terms and conditions regarding expiration dates vary significantly from property to property. Work programmes are designed to ensure that the exploration potential of any property is fully evaluated before expiration.
Acreage related to several of these concessions, blocks and leases are scheduled to expire within the next three years. Any acreage which has already been evaluated to be non-profitable may be relinquished prior to the current expiration date. In other cases, Equinor may decide to apply for an extension if more time is needed in order to fully evaluate the potential of the properties. Historically, Equinor has generally been successful in obtaining such extensions.
Most of the undeveloped acreage that will expire within the next three years is related to early exploration activities where no production is expected in the foreseeable future. The expiration of these leases, blocks and concessions will therefore not have any material impact on our proved reserves.
Productive oil and gas wells
The number of gross and net productive oil and gas wells, in which Equinor had interests at 31 December 2018, are shown in the table below. The number of wells has increased from last year mainly due to continued drilling in all the onshore US assets.
The total gross number of productive wells as of end 2018 includes 378 oil wells and 12 gas wells with multiple completions or wells with more than one branch.
Number of productive oil and gas wells | | | | | | | |
| | | | | | | |
At 31 December | | Norway | Eurasia excluding Norway | Africa | US | Americas excluding US | Total |
|
| | | | | | | |
Oil wells | - gross | 906 | 159 | 424 | 2,533 | 159 | 4,181 |
| - net | 304.0 | 21.3 | 67.3 | 633.3 | 44.6 | 1,070.5 |
Gas wells | - gross | 210 | 6 | 109 | 2,470 | - | 2,795 |
| - net | 91.8 | 2.2 | 41.7 | 626.8 | - | 762.6 |
| | | | | | | |
74 Equinor, Annual Report on Form 20-F 2018
Net productive and dry oil and gas wells drilled
The following table shows number of net productive oil and gas development wells drilled and completed during the past three years. Also shown is number of dry development wells, i.e. wells planned as producers, but incapable of producing either oil or gas in sufficient quantities to justify completion.
In addition to development wells, the table shows exploration wells defined as either productive discovery (economic quantities proven) or dry (quantities not sufficient to justify development).
Number of net productive and dry oil and gas wells drilled | Norway | Eurasia excluding Norway | Africa | US | Americas excluding US | Total | |
| |
| | | | | | | |
Year 2018 | | | | | | | |
Net productive and dry exploratory wells drilled | 8.6 | - | 0.7 | 0.6 | 0.5 | 10.3 | |
- Net dry exploratory wells | 4.5 | - | 0.7 | 0.6 | 0.5 | 6.2 | |
- Net productive exploratory wells | 4.0 | - | - | - | - | 4.0 | |
| | | | | | | |
Net productive and dry development wells drilled | 42.7 | 3.3 | 4.2 | 102.8 | 3.3 | 156.3 | |
- Net dry development wells | 13.6 | 0.5 | 0.2 | 0.3 | 1.0 | 15.6 | |
- Net productive development wells | 29.2 | 2.8 | 4.0 | 102.5 | 2.2 | 140.7 | |
| | | | | | | |
Year 2017 | | | | | | | |
Net productive and dry exploratory wells drilled | 8.1 | 2.6 | - | 0.7 | 1.9 | 13.3 | |
- Net dry exploratory wells | 3.5 | 2.1 | - | - | 1.9 | 7.5 | |
- Net productive exploratory wells | 4.6 | 0.5 | - | 0.7 | - | 5.8 | |
| | | | | | | |
Net productive and dry development wells drilled | 37.5 | 5.0 | 4.3 | 103.2 | 2.3 | 152.2 | |
- Net dry development wells | 10.1 | - | 0.1 | - | 0.1 | 10.3 | |
- Net productive development wells | 27.4 | 5.0 | 4.2 | 103.2 | 2.2 | 142.0 | |
| | | | | | | |
Year 2016 | | | | | | | |
Net productive and dry exploratory wells drilled | 5.5 | 0.7 | - | 1.6 | 4.8 | 12.6 | |
- Net dry exploratory wells | 1.4 | 0.7 | - | - | 1.9 | 3.9 | |
- Net productive exploratory wells | 4.1 | - | - | 1.6 | 3.0 | 8.7 | |
| | | | | | | |
Net productive and dry development wells drilled | 47.4 | 1.6 | 5.2 | 116.6 | 17.0 | 187.8 | |
- Net dry development wells | 4.2 | 0.2 | 0.2 | - | - | 4.6 | |
- Net productive development wells | 43.3 | 1.5 | 4.9 | 116.6 | 17.0 | 183.2 | |
Equinor, Annual Report on Form 20-F 2018 75
Exploratory and development drilling in process
The following table shows the number of exploratory and development oil and gas wells in the process of being drilled by Equinor at 31 December 2018.
Number of wells in progress | | | | | | | |
| | | | | | | |
At 31 December 2018 | | Norway | Eurasia excluding Norway | Africa | US | Americas excluding US | Total |
|
| | | | | | | |
Development wells1) | - gross | 32 | 11 | 7 | 325 | 2 | 377 |
| - net | 15.1 | 3.4 | 3.0 | 78.2 | 0.2 | 99.9 |
Exploratory wells | - gross | 5 | 4 | - | - | 4 | 13 |
| - net | 1.6 | 2.0 | - | - | 1.8 | 5.4 |
| | | | | | | |
1) Mainly wells related to US onshore developments | | | | | |
| | | | | | | |
Delivery commitments
On behalf of the Norwegian State's direct financial interest (SDFI), Equinor is responsible for managing, transporting and selling the Norwegian State's oil and gas from the NCS. These reserves are sold in conjunction with Equinor’s own reserves. As part of this arrangement, Equinor delivers gas to customers under various types of sales contracts. In order to meet the commitments, a field supply schedule is utilised to ensure the highest possible total value for Equinor and SDFI's joint portfolio of oil and gas.
Equinor’s and SDFI's delivery commitments under bilateral agreements for the calendar years 2019, 2020, 2021 and 2022, expressed as the sum of expected off-take, are equal to 51.5, 41.7, 36.4 and 31.3 bcm, respectively. The number of bilateral agreements is steadily declining as our customers are increasingly requesting more and more short-term contracts and higher volumes are traded on the spot market.
Equinor’s currently developed gas reserves on the NCS are more than sufficient to meet our share of these commitments for the next four years.
Any remaining volumes after covering our delivery commitments under the bilateral agreements, will be sold by trading activities at the hubs.
Production volumes and prices
The business overview is in accordance with our segment's operations as of 31 December 2018, whereas certain disclosures on oil and gas reserves are based on geographical areas as required by the Securities and Exchange Commission (SEC). For further information about extractive activities, see sections 2.3 E&P Norway and 2.4 E&P International.
Equinor prepares its disclosures for oil and gas reserves and certain other supplemental oil and gas disclosures by geographical area, as required by the SEC. The geographical areas are defined by country and continent. They are Norway, Eurasia excluding Norway, Africa, US and the Americas excluding US.
For further information about disclosures concerning oil and gas reserves and certain other supplemental disclosures based on geographical areas as required by the SEC, see section 4.2 Supplementary oil and gas information (unaudited).
76 Equinor, Annual Report on Form 20-F 2018
Entitlement production
The following table shows Equinor's Norwegian and international entitlement production of oil and natural gas for the periods indicated. The stated production volumes are the volumes to which Equinor is entitled, pursuant to conditions laid down in licence agreements and production sharing agreements. The production volumes are net of royalty oil paid in-kind, and of gas used for fuel and flaring. Production is based on proportionate participation in fields with multiple owners and does not include production of the Norwegian State's oil and natural gas. Production of an immaterial quantity of bitumen is included as oil production. NGL includes both LPG and naphtha. For further information on production volumes see section 5.6 Terms and abbreviations.
Entitlement production | | | | | | | | |
| | | | | | | | | | | |
| Consolidated companies | Equity accounted | Total |
Norway | Eurasia excluding Norway | Africa | US | Americas excluding US | Subtotal | Norway | Eurasia excluding Norway | Americas excluding US | Subtotal | |
| | | | | | | | | | | |
Oil and Condensate (mmbbls) | | | | | |
2016 | 169 | 12 | 72 | 34 | 26 | 313 | 2 | 0 | 4 | 6 | 320 |
2017 | 165 | 10 | 68 | 38 | 21 | 302 | 6 | 0 | 2 | 8 | 310 |
2018 | 155 | 8 | 57 | 48 | 29 | 298 | 5 | - | - | 5 | 303 |
| | | | | | | | | | | |
NGL (mmbbls) | | | | | |
2016 | 46 | - | 2 | 9 | - | 58 | 0 | - | - | 0 | 58 |
2017 | 48 | - | 4 | 9 | 0 | 61 | - | - | - | - | 61 |
2018 | 46 | - | 4 | 12 | - | 62 | 0 | - | - | 0 | 62 |
| | | | | | | | | | | |
Natural gas (bcf) | | | | | |
2016 | 1,338 | 34 | 60 | 226 | 0 | 1,659 | 1 | 0 | - | 2 | 1,661 |
2017 | 1,515 | 41 | 72 | 240 | 0 | 1,868 | 4 | 0 | - | 5 | 1,873 |
2018 | 1,502 | 39 | 84 | 318 | 5 | 1,949 | 4 | - | - | 4 | 1,953 |
| | | | | | | | | | | |
Combined oil, condensate, NGL and gas (mmboe) | | | | | |
2016 | 454 | 18 | 85 | 83 | 26 | 666 | 3 | 0 | 4 | 7 | 673 |
2017 | 483 | 17 | 85 | 90 | 21 | 696 | 6 | 0 | 2 | 9 | 705 |
2018 | 469 | 15 | 76 | 116 | 30 | 707 | 6 | - | - | 6 | 713 |
| | | | | | | | | | | |
| | | | | | | | | | | |
The only field containing more than 15% of total proved reserves based on barrels of oil equivalent is the Troll field. |
| | | | | | | | | | | |
Entitlement production | | | | | | | | |
| | | | | | | | | | | |
| | | | | | | | 2018 | 2017 | 2016 |
| | | | | | | | | | | |
Troll field 1) | | | | | | | | |
Oil and Condensate (mmbbls) | | | | | | 13 | 14 | 15 |
NGL (mmbbls) | | | | | | 2 | 2 | 2 |
Natural gas (bcf) | | | | | | 417 | 384 | 321 |
Combined oil, condensate, NGL and gas (mmboe) | | | | | 89 | 85 | 74 |
| | | | | | | | | | | |
1) Note that Troll is also included in Norway stated above. | | | | |
Equinor, Annual Report on Form 20-F 2018 77
Operational data
The following tables presents operational data for 2018, 2017 and 2016.
| For the year ended 31 December | | |
Operational data | 2018 | 2017 | 2016 | 18-17 change | 17-16 change |
| | | | | |
Prices | | | | | |
Average Brent oil price (USD/bbl) | 71.1 | 54.2 | 43.7 | 31% | 24% |
E&P Norway average liquids price (USD/bbl) | 64.3 | 50.2 | 39.4 | 28% | 27% |
E&P International average liquids price (USD/bbl) | 61.6 | 47.6 | 35.8 | 29% | 33% |
Group average liquids price (USD/bbl) | 63.1 | 49.1 | 37.8 | 29% | 30% |
Group average liquids price (NOK/bbl) | 513 | 405 | 317 | 27% | 28% |
Transfer price natural gas (USD/mmBtu) | 5.65 | 4.33 | 3.42 | 31% | 27% |
Average invoiced gas prices - Europe (USD/mmBtu) | 7.04 | 5.55 | 5.17 | 27% | 7% |
Average invoiced gas prices - North America (USD/mmBtu) | 3.04 | 2.73 | 2.12 | 11% | 28% |
Refining reference margin (USD/bbl) | 5.3 | 6.3 | 4.8 | (16%) | 31% |
| | | | | |
Entitlement production (mboe per day) | | | | | |
E&P Norway entitlement liquids production | 565 | 594 | 589 | (5%) | 1% |
E&P International entitlement liquids production | 434 | 415 | 435 | 5% | (5%) |
Group entitlement liquids production | 999 | 1,009 | 1,024 | (1%) | (1%) |
E&P Norway entitlement gas production | 722 | 740 | 646 | (2%) | 15% |
E&P International entitlement gas production | 218 | 173 | 157 | 26% | 10% |
Group entitlement gas production | 940 | 913 | 803 | 3% | 14% |
Total entitlement liquids and gas production | 1,940 | 1,922 | 1,827 | 1% | 5% |
| | | | | |
Equity production (mboe per day) | | | | | |
E&P Norway equity liquids production | 565 | 594 | 589 | (5%) | 1% |
E&P International equity liquids production | 567 | 545 | 555 | 4% | (2%) |
Group equity liquids production | 1,132 | 1,139 | 1,144 | (1%) | (0%) |
E&P Norway equity gas production | 722 | 740 | 646 | (2%) | 15% |
E&P International equity gas production | 256 | 200 | 188 | 28% | 7% |
Group equity gas production | 979 | 941 | 834 | 4% | 13% |
Total equity liquids and gas production | 2,111 | 2,080 | 1,978 | 1% | 5% |
| | | | | |
Liftings (mboe per day) | | | | | |
Liquids liftings | 1,002 | 1,012 | 1,017 | (1%) | (1%) |
Gas liftings | 975 | 936 | 824 | 4% | 14% |
Total liquids and gas liftings | 1,976 | 1,948 | 1,842 | 1% | 6% |
| | | | | |
MMP sales volumes | | | | | |
Crude oil sales volumes (mmbbl) | 845 | 817 | 811 | 3% | 1% |
Natural gas sales Equinor entitlement (bcm) | 52.8 | 52.0 | 44.3 | 1% | 18% |
Natural gas sales third-party volumes (bcm) | 5.7 | 6.4 | 8.6 | (12%) | (26%) |
| | | | | |
Production cost (USD/boe) | | | | | |
Production cost entitlement volumes | 5.7 | 5.2 | 5.4 | 10% | (3%) |
Production cost equity volumes | 5.2 | 4.8 | 5.0 | 9% | (3%) |
78 Equinor, Annual Report on Form 20-F 2018
Sales prices
The following tables present realised sales prices.
Realised sales prices | Norway | Eurasia excluding Norway | Africa | Americas |
| | | | |
Year ended 31 December 2018 | | | | |
Average sales price oil and condensate in USD per bbl | 70.2 | 70.5 | 69.9 | 62.4 |
Average sales price NGL in USD per bbl | 42.9 | - | 41.3 | 27.1 |
Average sales price natural gas in USD per mmBtu | 7.0 | 7.5 | 5.7 | 3.0 |
| | | | |
Year ended 31 December 2017 | | | | |
Average sales price oil and condensate in USD per bbl | 54.0 | 53.6 | 53.5 | 46.0 |
Average sales price NGL in USD per bbl | 35.8 | - | 33.2 | 20.9 |
Average sales price natural gas in USD per mmBtu | 5.6 | 5.3 | 5.2 | 2.7 |
| | | | |
Year ended 31 December 2016 | | | | |
Average sales price oil and condensate in USD per bbl | 43.1 | 42.0 | 41.4 | 32.9 |
Average sales price NGL in USD per bbl | 24.4 | - | 21.9 | 13.1 |
Average sales price natural gas in USD per mmBtu | 5.2 | 4.8 | 4.0 | 2.1 |
| | | | |
Equinor, Annual Report on Form 20-F 2018 79
Sales volumes
Sales volumes include lifted entitlement volumes, the sale of SDFI volumes and marketing of third-party volumes. In addition to Equinor’s own volumes, we market and sell oil and gas owned by the Norwegian State through the Norwegian State's share in production licences. This is known as the State's Direct Financial Interest or SDFI. For additional information, see section 2.7 Corporate under SDFI oil and gas marketing and sale.
The following table shows the SDFI and Equinor sales volume information on crude oil and natural gas for the periods indicated.
| For the year ended 31 December |
Sales Volumes | 2018 | 2017 | 2016 |
| | | | |
Equinor1) | | | |
Crude oil (mmbbls)2) | 366 | 369 | 372 |
Natural gas (bcm) | 56.5 | 54.3 | 48.0 |
| | | | |
Combined oil and gas (mmboe) | 721 | 711 | 674 |
| | | | |
Third party volumes3) | | | |
Crude oil (mmbbls)2) | 359 | 302 | 294 |
Natural gas (bcm) | 5.7 | 6.4 | 8.6 |
| | | | |
Combined oil and gas (mmboe) | 394 | 342 | 348 |
| | | | |
SDFI assets owned by the Norwegian State4) | | | |
Crude oil (mmbbls)2) | 131 | 147 | 148 |
Natural gas (bcm) | 43.7 | 44.0 | 39.8 |
| | | | |
Combined oil and gas (mmboe) | 406 | 424 | 398 |
| | | | |
Total | | | |
Crude oil (mmbbls)2) | 855 | 819 | 814 |
Natural gas (bcm) | 105.9 | 104.7 | 96.4 |
| | | | |
Combined oil and gas (mmboe) | 1,521 | 1,477 | 1,420 |
| | | | |
1) | The Equinor volumes included in the table above are based on the assumption that volumes sold were equal to lifted volumes in the relevant year. Volumes lifted by E&P International but not sold by MMP, and volumes lifted by E&P Norway or E&P International and still in inventory or in transit may cause these volumes to differ from the sales volumes reported elsewhere in this report by MMP. |
2) | Sales volumes of crude oil include NGL and condensate. All sales volumes reported in the table above include internal deliveries to our manufacturing facilities |
3) | Third party volumes of crude oil include both volumes purchased from partners in our upstream operations and other cargos purchased in the market. The third party volumes are purchased either for sale to third parties or for our own use. Third party volumes of natural gas include third party LNG volumes related to our activities at the Cove Point regasification terminal in the US. |
4) | The line item SDFI assets owned by the Norwegian State includes sales of both equity production and third party. |
80 Equinor, Annual Report on Form 20-F 2018
Group financial performance
After the low liquids and gas prices in 2016 and the increased prices in 2017, we continued to see the positive trend in 2018. Our result was heavily influenced by higher average prices for liquids and gas and higher volumes. With high activity on operations and maintenance, higher investment and increased exploration activity, the operation and administrative expenses increased along with depreciation and exploration expenses. We delivered solid operational performance, and an all-time high entitlement production in 2018 with 1,940 mboe per day, up 1% from 2017. Net income was USD 7.5 billion, up from USD 4.6 billion in 2017.
Total equity liquids and gas production was 2,111 mboe, 2,080 mboe, 1,978 mboe per day in 2018, 2017 and 2016, respectively.
The 1% increase in total equity production from 2017 to 2018 was mainly due new wells especially in the US onshore business, portfolio changes and new fields coming on stream. Expected natural decline partially offset the increase.
From 2016 to 2017, the 5% increase was primarily due to start-up and ramp-up on various fields and higher flexible gas offtake on the NCS, partially offset by expected natural decline and divestments.
Total entitlement liquids and gas production was 1,940 mboe per day in 2018 compared to 1,922 mboe in 2017 and 1,827 mboe per day in 2016. In 2018, the total entitlement liquids and gas production was up 1% for the reasons as described above, partially offset by higher negative effect from US royalties mainly driven by higher prices.
From 2016 to 2017, the total entitlement liquids and gas production was up 5% for the reasons as described above, partially offset by higher negative effect from production sharing agreements (PSA effect) and US royalties, mainly driven by higher prices.
The combined effect of production sharing agreements (PSA effect) and US royalties was 171 mboe, 158 mboe and 151 mboe per day in 2018, 2017 and 2016, respectively. Over time, the volumes lifted and sold will equal the entitlement production, but they may be higher or lower in any period due to differences between the capacity and timing of the vessels lifting our volumes and the actual entitlement production during the period.
Income statement under IFRS | For the year ended 31 December | | |
(in USD million) | 2018 | 2017 | 2016 | 18-17 change | 17-16 change |
| | | | | |
Revenues | 78,555 | 60,971 | 45,688 | 29% | 33% |
Net income/(loss) from equity accounted investments | 291 | 188 | (119) | 55% | N/A |
Other income | 746 | 27 | 304 | >100% | (91%) |
| | | | | |
Total revenues and other income | 79,593 | 61,187 | 45,873 | 30% | 33% |
| | | | | |
Purchases [net of inventory variation] | (38,516) | (28,212) | (21,505) | 37% | 31% |
Operating, selling, general and administrative expenses | (10,286) | (9,501) | (9,787) | 8% | (3%) |
Depreciation, amortisation and net impairment losses | (9,249) | (8,644) | (11,550) | 7% | (25%) |
Exploration expenses | (1,405) | (1,059) | (2,952) | 33% | (64%) |
| | | | | |
Net operating income/(loss) | 20,137 | 13,771 | 80 | 46% | >100% |
| | | | | |
Net financial items | (1,263) | (351) | (258) | >(100%) | (36%) |
| | | | | |
Income/(loss) before tax | 18,874 | 13,420 | (178) | 41% | N/A |
| | | | | |
Income tax | (11,335) | (8,822) | (2,724) | 28% | >100% |
| | | | | |
Net income/(loss) | 7,538 | 4,598 | (2,902) | 64% | N/A |
| | | | | |
Equinor, Annual Report on Form 20-F 2018 81
82 Equinor, Annual Report on Form 20-F 2018
Total revenues and other income amounted to USD 79,593 million in 2018 compared to USD 61,187 million in 2017 and USD 45,873 million in 2016.
Revenues are generated from both the sale of lifted crude oil, natural gas and refined products produced and marketed by Equinor, and from the sale of liquids and gas purchased from third parties. In addition, we market and sell the Norwegian State's share of liquids from the NCS. All purchases and sales of the Norwegian State's production of liquids are recorded as purchases [net of inventory variations] and revenues, respectively, while sales of the Norwegian State's share of gas from the NCS are recorded net.
For additional information regarding sales, see the Sales volume table in section 2.8 above in this report.
Revenues were USD 78,555 million in 2018, up 29% compared to 2017. The increase was mainly due to higher average prices both for liquids and gas, and higher liquids volumes sold. The effect of a reduction in provision related to the Agbami redetermination process in Nigeria of USD 774 million added to the increase. The 33% increase in revenues from 2016 to 2017 was mainly due to increased prices both for liquids and gas, increased gas volumes sold and the reversal of provisions related to our operations in Angola in 2017.
Net income from equity accounted investments was USD 291 million in 2018, up from of USD 188 million in 2017 due to a dividend in excess of book value related to an equity accounted investment in 2018. In 2016, net income from equity accounted investments was a loss of USD 119 million. For further information, please see note 12 Equity accounted investments to the Consolidated financial statements.
Other income was USD 746 million in 2018 compared to USD 27 million in 2017 and USD 304 million in 2016. In 2018, other income was positively impacted by gain of sale of assets mainly related to King Lear, Tommeliten and Norsea pipeline. In 2017, other income was insignificant and mainly related to proceeds from minor insurance claims. In 2016, other income was mainly related to gain from sale of the Edvard Grieg field on the NCS and proceeds from an insurance settlement.
Because of the factors explained above, total revenue and other income was up by 30% in 2018. In 2017 and 2016, total revenues and other income increased by 33% and decreased by 23%, respectively.
Purchases [net of inventory variation] include the cost of liquids purchased from the Norwegian State, which is pursuant to the Owner's instruction, and the cost of liquids and gas purchased from third parties. See SDFI oil and gas marketing and sale in section 2.7 Corporate for more details.
Purchases [net of inventory variation] amounted to USD 38,516 million in 2018 compared to USD 28,212 million in 2017 and USD 21,505 million in 2016. The 37% increase in 2018, as well as the 31% increase from 2016 to 2017, was mainly related to higher prices for all products.
Operating, selling, general and administrative expenses amounted to USD 10,286 million in 2018 compared to USD 9,501 million in 2017 and USD 9,787 million in 2016. The 8% increase from 2017 to 2018 was mainly driven by higher operating costs due to acquired fields, increased transportation costs and higher operation and maintenance activity, partially offset by the NOK/USD exchange rate development. The 3% decrease from 2016 to 2017 was mainly due to divestments and reduced asset retirement provisions, partially offset by net losses from sale of assets and increased costs from new fields coming on stream. Ramp-up on various fields and higher royalty costs also offset the decrease.
Depreciation, amortisation and net impairment losses amounted to USD 9,249 million compared to USD 8,644 million in 2017 and USD 11,550 million in 2016. The 7% increase in depreciation, amortisation and net impairment losses in 2018 was mainly due to increased production in the E&P International segment, effect of a reduction in provision related to the Agbami redetermination process in Nigeria, effects from net impairment reversals in previous periods and lower impairment reversals in 2018. Higher proved reserves estimate on several fields partially offset the increase.
Included in the total for 2018 were net impairment reversals of USD 604 million, of which impairment reversals amounted to USD 1,398 million mainly related to operational improvements, updated exchange rate assumptions, increased refinery margin assumptions, and extension of a production share agreement (PSA). The impairment reversals were partially offset by impairment losses of USD 794 million, mainly related to long term prices assumptions.
The 25% decrease in 2017 compared to 2016, was mainly due to lower net impairment of assets in 2017, net increased proved reserves estimates on several fields and a lower depreciation basis due to impairments of assets in previous periods. Start-up and ramp-up of production on new fields partially offset the reduction.
Included in the total for 2017 and 2016, were net impairment reversals of USD 1,055 million, of which impairment reversals amounted to USD 1,972 million mainly related to increased production estimates, cost reductions and increased prices, operational improvements and updated calculation assumptions due to changes in the US tax legislation. The impairment reversals were partially offset by impairment losses of USD 917 million, mainly related to decreased production estimates.
Equinor, Annual Report on Form 20-F 2018 83
For further information, please see note 3 Segments and note 10 Property, plant and equipment to the Consolidated financial statements.
84 Equinor, Annual Report on Form 20-F 2018
Exploration expenses | | | | | |
| | | | | |
| For the year ended 31 December | | |
(in USD million) | 2018 | 2017 | 2016 | 18-17 change | 17-16 change |
| | | | | |
Exploration expenditures (activity) | 1,438 | 1,234 | 1,437 | 17% | (14%) |
Expensed, previously capitalised exploration expenditures | 68 | 73 | 808 | (8%) | (91%) |
Capitalised share of current period's exploration activity | (390) | (167) | (285) | >100% | (41%) |
Net impairments / (reversals) | 289 | (81) | 992 | N/A | N/A |
| | | | | |
Total exploration expenses | 1,405 | 1,059 | 2,952 | 33% | (64%) |
| | | | | |
In 2018, exploration expenses were USD 1,405 million, a 33% increase compared to 2017 when exploration expenses were USD 1,059 million. Exploration expenses were USD 2,952 million in 2016.
The 33% increase in exploration expenses in 2018 primarily due to higher drilling costs because of more expensive wells being drilled and higher net impairments compared to 2017. The increase was partially offset by a higher portion of exploration expenses being capitalised compared to 2017. In 2018 there was exploration activity in 36 wells compared with 34 wells in 2017. 24 wells were completed with 9 commercial discoveries in 2018 compared with 28 wells completed and 14 commercial discoveries in 2017.
In 2017, exploration expenses were down 64% compared to 2016 mainly due to a lower portion of expenditures capitalised in previous years being expensed in 2017 compared to 2016. Exploration activity was higher in 2017. However, as the exploration wells drilled in 2017 were less expensive due to improved drilling efficiency, exploration expenditures were reduced in 2017 compared to 2016. Net impairment reversals of exploration prospects and signature bonuses in 2017 compared to net impairment charges in 2016, added to the decrease. The decrease was partially offset by a lower capitalisation rate on exploration expenditures incurred in 2017 compared to 2016.
Net operating income was USD 20,137 million in 2018 compared to USD 13,771 million in 2017 and USD 80 million in 2016. With reference to the development in revenues and costs as discussed above, the 46% increase in 2018 was primarily driven by higher liquids and gas prices and higher volumes. The increase was partially offset by lower impairment reversals compared to 2017, increased operating and administrative expenses due to higher operation and maintenance activity, increased depreciation expenses due to higher investments and production, and increased exploration expenses due to higher drilling activity.
The increase in 2017 compared to 2016 was mainly driven by higher prices for both liquids and gas, increased gas volumes, significant net impairments reversals in 2017 compared to net impairment charges in 2016 and the reversal of provisions related to our operations in Angola. Reduced depreciation and exploration expenses added to the increase.
Net financial items amounted to a loss of USD 1,263 million in 2018. In 2017 and 2016, net financial items were also a loss of USD 351 million and USD 258 million, respectively.
The increased loss of USD 912 million in 2018 was mainly due to the reversal of the provision related to our operations in Angola in the second quarter of 2017 of USD 319 million and a currency loss of USD 166 million in 2018 compared to a gain of USD 126 million in 2017. In addition, a loss on derivatives related to our long-term debt portfolio of USD 341 million in 2018, compared to a loss of USD 61 million in 2017 contributed to the increase.
The increased loss of USD 93 million in 2017 was mainly due to loss on derivatives due to increase in EUR and USD interest rates related to our long-term debt portfolio of USD 61 million for 2017, compared to a gain of USD 470 million for 2016, partially offset by a reversal of interest expense of USD 319 million in 2017 previously provided for related to a resolved dispute regarding Equinor’s participation offshore Angola in the period 2002 to 2016.
Income taxes were USD 11,335 million in 2018, equivalent to an effective tax rate of 60.1%, compared to USD 8,822 million in 2017, equivalent to an effective tax rate of 65.7%. In 2016, income taxes were USD 2,724 million, equivalent to an effective tax rate of more than 100%.
The effective tax rate in 2018 was primarily influenced by positive net operating income in entities without recognised taxes and a tax exempted divestment of interest at the Norwegian continental shelf. The effective tax rate was also influenced by recognition of previously unrecognised deferred tax assets. For further information, see note 9 Income taxes to the Consolidated financial statements.
The effective tax rate in 2017 was primarily influenced by the agreement with the Angolan Ministry of Finance related to Equinor’s participation in several blocks offshore Angola.
Equinor, Annual Report on Form 20-F 2018 85
In 2016, income before tax was a loss of USD 178 million and was a combination of large profits in territories with higher statutory tax rates (taking account of Norwegian Petroleum Tax including uplift) and approximately the same amount of losses in territories with lower statutory tax rates. Hence, our effective tax rate is distorted. In addition, the “weighted average statutory tax rate”, calculate before taking into account the Norwegian petroleum tax including uplift for comparability, was also distorted.
In 2016, the effective tax rate of tax on profit earning by E&P Norway, approximated the statutory tax rate (taking account of Norwegian Petroleum Tax including uplift). However, the effective tax rate on E&P International losses was negative due to the inability to currently recognise tax losses and other deferred tax assets arising from losses, primarily in the US. Overall, this results in a significant income tax charge on a relatively small group loss before tax.
The effective tax rate is calculated as income taxes divided by income before taxes. Fluctuations in the effective tax rates from year to year are principally the result of non-taxable items (permanent differences) and changes in the relative composition of income between Norwegian oil and gas production, taxed at a marginal rate of 78%, and income from other tax jurisdictions. Other Norwegian income, including the onshore portion of net financial items, is taxed at 23% (24% in 2017 and 25% in 2016), and income in other countries is taxed at the applicable income tax rates in the various countries.
In 2018, net income was USD 7,538 million compared to USD 4,598 million in 2017 and negative USD 2,902 million in 2016.
The significant increase in 2018 was mainly a result of the increase in net operating income, partially offset by higher income taxes and negative change in the net financial items, as explained above.
The increase from 2016 to 2017 was mainly due to significantly higher net operating income in 2017, partially offset by higher income taxes.
The board of directors proposes to the AGM to increase the dividend by 13% to USD 0.26 per ordinary share for the fourth quarter of 2018.
The annual ordinary dividends for 2018 amounted to an aggregate total of USD 2,826 million, net after scrip dividend of USD 338 million. Considering the proposed dividend, USD 3,558 million will be allocated to retained earnings in the parent company.
For 2017 and 2016, annual ordinary dividends amounted to an aggregate total of USD 1,586 million, net after scrip dividend of USD 1,357 million and an aggregate total of USD 1,934 million, net after scrip dividend of USD 904 million, respectively.
For further information, see note 17 Shareholders’ equity and dividends to the Consolidated financial statements.
In accordance with §3-3a of the Norwegian Accounting Act, the board of directors confirms that the going concern assumption on which the financial statements have been prepared, is appropriate.
New accounting standards
Equinor will implement the new accounting standard IFRS 16 Leases on 1 January 2019. IFRS 16 covers the recognition of leases and related disclosure in the financial statements and will replace IAS 17 Leases. The new standard defines a lease as a contract that conveys the right to control the use of an identified asset for a period of time in exchange for consideration. In the financial statement of lessees, IFRS 16 requires recognition in the balance sheet for each contract that meets its definition of a lease as right-of-use asset and a lease liability, while lease payments are to be reflected as interest expense and a reduction of lease liabilities. The right-of-use assets are to be depreciated over the shorter of each contract’s term and the assets’ useful life. IFRS 16 will also lead to changes in the classification of lease-related payments in the statement of cash flows, where the portion of lease payments representing down-payments of lease liabilities will be classified as cash flows used in financing activities.
The standard implies a significant change in lessees’ accounting for leases currently defined as operating leases under IAS 17. Equinor is for the most part a lessee in applying lease accounting, and the new leases to be recognised relates to leases of rigs, vessels, storage facilities and office buildings. Reference is made to note 23 Implementation of IFRS 16 to the Consolidated Financial Statements for further description of the expected impact of the new standard, including impact on balance sheet, income statement, cash flow statement and segment presentation.
Segments financial performance
E&P Norway profit and loss analysis
Net operating income in 2018 was USD 14,406 million, compared to USD 10,485 million in 2017 and USD 4,451 million in 2016. The USD 3,921 million increase from 2017 to 2018 was primarily driven by higher liquids prices and gas transfer price, partially offset by reduced volumes. The USD 6,034 million increase from 2016 to 2017 was mainly due to higher liquids and gas prices, and net impairment reversals of USD 905 million in 2017 compared to impairment of USD 829 million in 2016.
86 Equinor, Annual Report on Form 20-F 2018
The average daily production of liquids and gas was 1,288 mboe, 1,334 mboe and 1,235 mboe per day in 2018, 2017 and 2016 respectively.
The average daily total production level decreased from 2017 to 2018 mainly due to expected natural decline, lower production efficiency and higher losses due to turnarounds, partially offset by positive contribution from new wells at producing fields.
The average daily total production level increased from 2016 to 2017 mainly due to higher flex gas off-take from Troll and Oseberg, contributions from new fields Ivar Aasen and Gina Krog, and fewer turnarounds.
Over time, the volumes lifted and sold will equal entitlement production, but may be higher or lower in any period due to differences between the capacities and timing of the vessels lifting the volumes and the actual entitlement production during the period.
Equinor, Annual Report on Form 20-F 2018 87
E&P Norway - income statement under IFRS | | | | | |
| | | | | |
| For the year ended 31 December | | |
(in USD million) | 2018 | 2017 | 2016 | 18-17 change | 17-16 change |
| | | | | |
Revenues | 21,909 | 17,558 | 13,036 | 25% | 35% |
Net income/(loss) from equity accounted investments | 10 | 129 | (78) | (92%) | N/A |
Other income | 556 | 5 | 119 | >100% | (96%) |
| | | | | |
Total revenues and other income | 22,475 | 17,692 | 13,077 | 27% | 35% |
| | | | | |
Operating, selling, general and administrative expenses | (3,270) | (2,954) | (2,547) | 11% | 16% |
Depreciation, amortisation and net impairment losses | (4,370) | (3,874) | (5,698) | 13% | (32%) |
Exploration expenses | (431) | (379) | (383) | 14% | (1%) |
| | | | | |
Net operating income/(loss) | 14,406 | 10,485 | 4,451 | 37% | >100% |
| | | | | |
Total revenues and other income were USD 22,475 million in 2018, USD 17,692 million in 2017 and USD 13,077 million in 2016.
The 25% increase in revenues from 2017 to 2018 was mainly due to increased liquids and gas prices, partly offset by decreased liquid volumes. The 35% increase in revenues from 2016 to 2017 was mainly due to increased liquids and gas prices, and increased gas volumes.
Other income was impacted by gains from the sale of exploration assets of USD 490 million in 2018. In 2017 other income was immaterial. Other income in 2016 was impacted by gain from sale of Edvard Grieg of USD 114 million.
Operating expenses and selling, general and administrative expenses were USD 3,270 million in 2018, compared to USD 2,954 million in 2017 and USD 2,547 million in 2016. The increase from 2017 to 2018 is mainly due to increased transportation cost and new fields coming on stream. In 2017, expenses increased compared to 2016 mainly due to change in the internal allocation of gas transportation costs between E&P Norway and MMP. The change in internal allocation also increased the revenues due to a higher transfer price.
Depreciation, amortisation and net impairment losses were USD 4,370 million in 2018, compared to USD 3,874 million in 2017 and USD 5,698 million in 2016. The increase from 2017 to 2018 is mainly due to new fields coming on stream, increased field specific investment level and effects from impairment reversals, partially offset by changes in reserves. The decrease of 32% from 2016 to 2017 was mainly due to reversal of impairments in 2017 and impairments in 2016.
Exploration expenses were USD 431 million in 2018, compared to USD 379 million in 2017 and USD 383 million in 2016. The increase from 2017 to 2018 was primarily due to higher drilling cost mainly because of more expensive wells being drilled, partially offset by a higher portion of exploration expenditure being capitalised in 2018. In 2018 there was exploration activity in 23 wells with 18 wells completed, compared to activity in 19 wells with 17 wells completed in 2017.
The reduction from 2016 to 2017 was mainly due to lower field development activity and lower portion of previously capitalised exploration expenditures being expensed in 2017, partially offset by a lower portion of current exploration expenditures being capitalised.
E&P International profit and loss analysis
Net operating income in 2018 was USD 3,802 million, compared to USD 1,341 million in 2017 and negative USD 4,352 million in 2016. The positive development from 2017 to 2018 was caused primarily by higher liquids and gas prices combined with higher production. The positive development from 2016 to 2017 was caused primarily by higher liquids and gas prices, and by net reversal of impairments in 2017 compared to net impairment losses in 2016.
The average daily equity liquids and gas production (see section 5.6 Terms and abbreviations) was 823 mboe per day in 2018, compared to 745 mboe per day in 2017 and 743 mboe per day in 2016. The increase of 10% from 2017 to 2018 was driven by new wells in the US onshore, particularly at Appalachia, as well as the effect of new fields in Brazil and offshore North America. The increase was partially offset by natural decline, primarily at mature fields in Angola.
The minor increase from 2016 to 2017 was due to new wells in the US, as well as the effect of ramp-up of fields, mainly in Ireland and Algeria. The increase was partially offset by the divestment of Kai Kos Dehseh oil sands and natural decline.
88 Equinor, Annual Report on Form 20-F 2018
The average daily entitlement liquids and gas production (see section 5.6 Terms and abbreviations) was 652 mboe per day in 2018, compared to 588 mboe per day in 2017, and 592 mboe per day in 2016. Entitlement production in 2018 increased by 11% due to higher equity production as described above, partially offset by increased US royalties driven by the higher equity production and higher prices. Entitlement production in 2017 was down 1% from 2016 due to higher negative effect from production sharing agreements (PSA effect) and US royalties, mainly driven by higher prices. The combined effect of production sharing agreements (PSA effect) and US royalties was 171 mboe, 158 mboe and 151 mboe per day in 2018, 2017 and 2016, respectively.
Equinor, Annual Report on Form 20-F 2018 89
Over time, the volumes lifted and sold will equal our entitlement production, but they may be higher or lower in any period due to differences between the capacity and timing of the vessels lifting our volumes and the actual entitlement production during the period. See section 5.6 Terms and abbreviations for more information.
E&P International - income statement under IFRS | | | | | |
| | | | | |
| For the year ended 31 December | | |
(in USD million) | 2018 | 2017 | 2016 | 18-17 change | 17-16 change |
| | | | | |
Revenues | 12,322 | 9,219 | 6,623 | 34% | 39% |
Net income/(loss) from equity accounted investments | 31 | 22 | (100) | 41% | N/A |
Other income | 45 | 14 | 134 | >100% | (90%) |
| | | | | |
Total revenues and other income | 12,399 | 9,256 | 6,657 | 34% | 39% |
| | | | | |
Purchases [net of inventory] | (26) | (7) | (7) | >100% | 2% |
Operating, selling, general and administrative expenses | (3,006) | (2,804) | (2,923) | 7% | (4%) |
Depreciation, amortisation and net impairment losses | (4,592) | (4,423) | (5,510) | 4% | (20%) |
Exploration expenses | (973) | (681) | (2,569) | 43% | (74%) |
| | | | | |
Net operating income/(loss) | 3,802 | 1,341 | (4,352) | >100% | N/A |
| | | | | |
E&P International generated total revenues and other income of USD 12,399 million in 2018, compared to USD 9,256 million in 2017 and USD 6,657 million in 2016.
Revenues in 2018 were positively impacted primarily by higher realised liquids and gas prices, combined with higher entitlement production. In addition, revenues increased by USD 774 million due to effects from change in provisions related to a redetermination process in Nigeria in 2018. The increase from 2016 to 2017 was mainly caused by higher realised liquids and gas prices, in addition to positive effects from reversal of provisions related to our operations in Angola of USD 754 million in 2017. For information related to the reversal of provisions and disputes, see note 24 Other commitments, contingent liabilities and contingent assets to the Consolidated financial statements.
Other income was USD 45 million in 2018, compared to USD 14 million in 2017 and USD 134 million in 2016. In 2018, other income was mainly related to a gain from divestment of the Alba field. In 2017, other income was mainly related to proceeds from minor insurance claims. In 2016, other income was mainly related to proceeds from an insurance settlement.
As a result of the factors explained above, total revenues and other income increased by 34% in 2018. In 2017, total revenues and other income increased by 39%.
Operating, selling, general and administrative expenses were USD 3,006 million in 2018, compared to USD 2,804 million in 2017 and USD 2,923 million in 2016. The 7% increase from 2017 to 2018 was mainly due to acquired fields, higher operations and maintenance activities, and increased transportation expenses and royalties driven by volume growth and increased liquids prices. In addition, reduced provisions in 2017 related to future abandonment costs contributed to the increase. The increases were partially offset by net losses from sale of assets in 2017. The 4% decrease from 2016 to 2017 was mainly due to portfolio changes and reduced provisions related to future abandonment costs. The decreases were partially offset by net losses from sale of assets in 2017, and higher royalties, costs related to preparation for operation for new fields and transportation expenses.
Depreciation, amortisation and net impairment losses were USD 4,592 million in 2018, compared to USD 4,423 million in 2017 and USD 5,510 million in 2016. The 4% increase from 2017 to 2018 was primarily caused by net impairment losses in 2018, compared with net reversal of impairments in 2017. Net impairment losses amounted to USD 154 million in 2018, with impairments of unconventional onshore assets in North America as the largest contributors, caused by changes in long-term price assumptions and reduced fair value for one asset. In addition, depreciations increased mainly due to higher investments and increased production, offset by higher reserve estimates.
The 20% decrease from 2016 to 2017 was primarily caused by net reversal of impairments in 2017, compared to net impairment losses in 2016. Net reversal of impairments amounted to USD 102 million in 2017, with the reversal of impairment related to an unconventional onshore asset in North America as the main contributor, caused by changes in US tax legislation, operational improvements and increased recovery rate. Net impairment losses amounted to USD 541 million in 2016 and resulted mainly from reduced long-term price assumptions with the largest effect being on the unconventional onshore assets in North America. In addition, depreciations decreased due to higher reserves estimates and effects from previous periods’ impairments, partially offset by production ramp-up from new fields.
90 Equinor, Annual Report on Form 20-F 2018
Exploration expenses were USD 973 million in 2018, compared to USD 681 million in 2017 and USD 2,569 million in 2016. The increase from 2017 to 2018 was mainly due to higher drilling cost and seismic and field development activity and net impairment of exploration prospects and signature bonuses in 2018 of USD 280 million compared with USD 82 million in 2017. This was partially offset by a higher portion of exploration expenditures being capitalised and lower portion of capitalised expenditures from earlier years being expensed in 2018. In 2018 there was exploration activity in 13 wells with 6 wells completed, compared to 15 wells with 11 wells completed in 2017.
The reduction from 2016 to 2017 was mainly due to net impairment of exploration prospects and signature bonuses in 2016 of USD 992 million compared with USD 82 million in 2017. Lower portion of capitalised expenditures from earlier years being expensed in 2017 of USD 60 million compared with USD 785 million in 2016 contributed to the reduction, in addition to less expensive wells drilled in 2017 despite higher exploration activity. This was partially offset by lower capitalisation rate in 2017.
MMP profit and loss analysis
Net operating income was USD 1,906 million, USD 2,243 million and USD 623 million in 2018, 2017 and 2016, respectively. In 2018 the net operating income was impacted by negative operational storage effects amounting to USD 132 million compared to positive effects amounting to USD 94 million in 2017, lower liquids trading results and reduced processing margins in 2018 compared to 2017. The decrease was partially offset by improved LNG results, the sale of the ownership share in infrastructure assets amounting to USD 129 million in 2018 and the net change in impairment reversals amounting to USD 107 million between the periods. The total decrease was USD 337 million from 2017 to 2018.
The increase of USD 1,620 million from 2016 to 2017 was mainly due to changes in the fair value of derivatives, periodisation of inventory hedging, higher refinery margins and increased production from the processing plants.
The total natural gas sales volumes were 58.4 bcm in 2018, 58.4 bcm in 2017 and 52.9 bcm in 2016. The total gas volumes sold in 2018 were equal to the total volumes for 2017. The reduction in the entitlement production on the NCS and third party gas volumes was offset by an increase in the entitlement production internationally. The chart does not include any volumes sold on behalf of the Norwegian State's direct financial interest (SDFI).
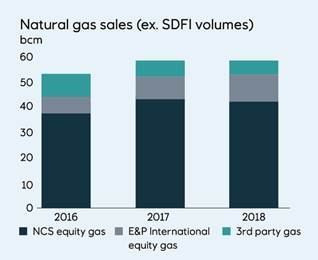
In 2018, the average invoiced natural gas sales price in Europe was USD 7.04 per mmBtu, up 27% from 2017 (USD 5.55 per mmBtu). The 2017 average invoiced natural gas price in Europe was up 7% from 2016 (USD 5.17 per mmBtu).
In 2018, the average invoiced natural gas sales price in North Americas was USD 3.04 per mmBtu, up 11% from 2017 (USD 2.73 per mmBtu). The 2017 average invoiced natural gas sales price in North Americas was up 28% from 2016 (USD 2.12 per mmBtu).
All of Equinor's gas produced on the NCS is sold by MMP and purchased from E&P Norway at the fields’ lifting point at a market-based internal price with deduction for the cost of bringing the gas from the field to the market and a marketing fee element. Our NCS transfer price for gas was USD 5.65 per mmBtu in 2018, an increase of 31% compared to USD 4.33 per mmBtu in 2017. The 2017 NCS transfer price was up 27% from 2016 (USD 3.42 per mmBtu).
The average crude, condensate and NGL sales were 2.3 mmbbl per day in 2018 of which approximately 0.98 mmbbl were sales of our equity volumes, 0.98 mmbbl were sales of third-party volumes and 0.36 mmbbl were sales of volumes purchased from SDFI. Our average sales volumes in both 2017 and 2016 were 2.2 mmbbl per day. The average daily third-party sales volumes were 0.83 and 0.80 mmbbl in 2017 and 2016.
Equinor, Annual Report on Form 20-F 2018 91
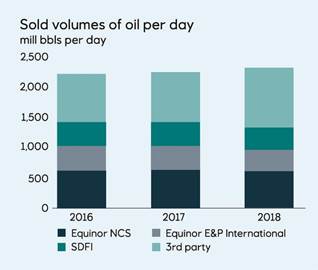
MMP’s refining margins were lower in 2018 than in 2017. Equinor's refining reference margin was 5.3 USD/bbl in 2018, compared to 6.3 USD/bbl in 2017, a decrease of 16%. The refining reference margin was 4.8 USD/bbl in 2016.
92 Equinor, Annual Report on Form 20-F 2018
MMP - income statement under IFRS | | | | | |
| | | | | |
| For the year ended 31 December | | |
(in USD million) | 2018 | 2017 | 2016 | 18-17 change | 17-16 change |
| | | | | |
Revenues | 75,636 | 59,017 | 44,847 | 28% | 32% |
Net income/(loss) from equity accounted investments | 16 | 53 | 61 | (70%) | (14%) |
Other income | 142 | 1 | 72 | >100% | (98%) |
| | | | | |
Total revenues and other income | 75,794 | 59,071 | 44,979 | 28% | 31% |
| | | | | |
Purchases [net of inventory] | (69,296) | (52,647) | (39,696) | 32% | 33% |
Operating, selling, general and administrative expenses | (4,377) | (3,925) | (4,439) | 11% | (12%) |
Depreciation, amortisation and net impairment losses | (215) | (256) | (221) | (16%) | 16% |
| | | | | |
Net operating income/(loss) | 1,906 | 2,243 | 623 | (15%) | >100% |
| | | | | |
Total revenues and other income were USD 75,794 million in 2018, compared to USD 59,071 million in 2017 and USD 44,979 million in 2016.
The increase in revenues from 2017 to 2018 was mainly due to an increase in the prices for all products. The average crude price in USD increased by approximately 31% in 2018 compared to 2017.
The increase in revenues from 2016 to 2017 was mainly due to an increase in the prices for all products. The average crude price in USD increased by approximately 25% in 2017 compared to 2016.
Other income in 2018 was mainly impacted by a gain on the sale of assets amounting to USD 133 million. In 2017 other income was negligible.
Because of the factors explained above, total revenues and other income increased by 28% from 2017 to 2018 and increased by 31% from 2016 to 2017.
Purchases [net of inventory] were USD 69,296 million in 2018, compared to USD 52,647 million in 2017 and USD 39,696 million in 2016. The increase from 2017 to 2018 as well as the increase from 2016 to 2017 was mainly due to an increase in the price for all products.
Operating expenses and selling, general and administrative expenses were USD 4,377 million in 2018, compared to USD 3,925 million in 2017 and USD 4,439 million in 2016. The increase from 2017 to 2018 was mainly due to higher transportation cost for crude and gas, and higher maintenance and electricity cost on the plants. The decrease from 2016 to 2017 was mainly due to a change in the internal allocation of gas transportation cost between MMP and E&P Norway, partially offset by higher maintenance cost on the plants.
Depreciation, amortisation and net impairment losses were USD 215 million in 2018, USD 256 million in 2017 and USD 221 million in 2016. The decrease in depreciation, amortisation and net impairment losses from 2017 to 2018 was mainly caused by higher reversal of impairments in 2018 compared to 2017, partially offset by depreciation from a new infrastructure asset. Net reversal of impairments in 2018 was related to the refinery assets, due to an increased refinery margin forecast. The increase in depreciation, amortisation and net impairment losses from 2016 to 2017 was mainly caused by a lower reversal of impairments in 2017 compared to 2016. The net reversal of impairments in 2017 was mainly related to the refinery assets, impacted by an expected lower cost base in the future cash flows.
Other group
The Other reporting segment includes activities within New Energy Solutions; Global Strategy & Business Development; Technology, Projects & Drilling; and Corporate staffs and support functions.
In 2018, the Other reporting segment recorded a net operating loss of USD 79 million compared to a net operating loss of USD 239 million in 2017 and a net operating loss of USD 423 million in 2016.
Equinor, Annual Report on Form 20-F 2018 93
2.10 Liquidity and capital resources |
Review of cash flows
Equinor’s cash flow generation in 2018 was strong across the business and total cash flows increased by USD 4,595 million compared to 2017.
Consolidated statement of cash flows | | | |
| Full year | |
| 2018 | 2017 | 2016 |
(in USD million) | | (restated*) | (restated*) |
| | | |
Cash flows provided by operating activities | 19,694 | 14,802 | 8,818 |
| | | |
Cash flows used in investing activities | (11,212) | (10,117) | (10,230) |
| | | |
Cash flows provided by (used in) financing activities | (5,024) | (5,822) | (1,959) |
| | | |
Net increase (decrease) in cash and cash equivalents | 3,458 | (1,137) | (3,371) |
| | | |
| | | |
Cash flows provided by operating activities
The most significant drivers of cash flows provided by operations were the level of production and prices for liquids and natural gas that impact revenues, purchases [net of inventory], taxes paid and changes in working capital items.
In 2018, cash flows provided by operating activities were increased by USD 4,892 million compared to 2017. The increase was mainly due to higher liquids and gas prices and a change in working capital, partially offset by increased tax payments.
In 2017, cash flows provided by operating activities were increased by USD 5,984 million compared to 2016. The increase was mainly due to increased liquids and gas prices, combined with higher production and a reduction in working capital, partially offset by increased tax payments.
Cash flows used in investing activities
In 2018, cash flows used in investing activities were increased by USD 1,095 million compared to 2017. The increase was mainly due to increased additions through business combinations and increased capital expenditures, partially offset by increased proceeds from the sale of assets, reduced financial investments and increased cash flow from derivatives.
In 2017, cash flows used in investing activities were reduced by USD 113 million compared to 2016. The decrease was due to decreased capital expenditures, partially offset by reduced proceeds from sale of assets and increased financial investments.
Cash flows provided by (used in) financing activities
In 2018, cash flows used in financing activities were reduced by USD 798 million compared to 2017. The decrease was mainly due to reduced repayment of finance debt and a bond issue, partially offset by increased dividends paid and increased collateral payments related to derivatives.
In 2017, cash flows used in financing activities were increased by USD 3,863 million compared to 2016. The cash outflow was mainly due to repayment of finance debt, partially offset by increased cash flow from collateral related to derivatives.
Financial assets and debt
Equinor's financial position is strong. The net debt to capital employed ratio before adjustments at year end decreased from 27.9% in 2017 to 20.6% in 2018. See section 5.2 for non-GAAP measures for net debt ratio. Net interest-bearing debt decreased from USD 15.4 billion to USD 11.1 billion. During 2018 Equinor's total equity increased from USD 39.9 billion to USD 43.0 billion, mainly due to a positive net income in 2018. Cash flows provided by operating activities increased in 2018 mainly due to increased prices and change
94 Equinor, Annual Report on Form 20-F 2018
in working capital, partially offset by increased tax payments. Cash flows used in investing activities increased in 2018, while cash flows used in financing activities decreased. Equinor has paid out four quarterly dividends in 2018. For the fourth quarter of 2018 the board of directors will propose to the AGM to increase the dividend from USD 0.23 to USD 0.26 per share. For further information, see note 17 Shareholders equity and dividends to the Consolidated financial statements.
Equinor believes that, given its current liquidity reserves, including committed credit facilities of USD 5.0 billion and its access to various capital markets, Equinor has sufficient funds available to meet its liquidity needs, including working capital.
Funding needs arise as a result of Equinor’s general business activities. Equinor generally seeks to establish financing at the corporate (top company) level. Project financing may also be used in cases involving joint ventures with other companies. Equinor aims to have access to a variety of funding sources in respect of markets and instruments at all times, as well as maintaining relationships with a core group of international banks that provide a wide range of banking services.
Moody's and Standard & Poor's (S&P) provide credit ratings on Equinor. Equinor’s current long-term ratings are AA- with a stable outlook and Aa2 with a stable outlook from S&P and Moody’s, respectively. The rating from S&P was revised from A+ to AA- on 18 May 2018 and the rating from Moody’s was revised from Aa3 to Aa2 on 9 August 2018. Both upgrades were primarily based on stronger than expected cash flow generation. The short-term ratings are P-1 from Moody's and A-1+ from S&P. In order to maintain financial flexibility going forward, Equinor intends to keep key financial ratios at levels consistent with the objective of maintaining a long-term credit rating at least within the single A category on a stand-alone basis (Current corporate rating includes one notch uplift from Standard & Poor’s and two notch uplift from Moody’s).
The management of financial assets and liabilities takes into consideration funding sources, the maturity profile of non-current debt, interest rate risk, currency risk and available liquid assets. Equinor’s borrowings are denominated in various currencies and normally swapped into USD. In addition, interest rate derivatives, primarily interest rate swaps, are used to manage the interest rate risk of the long-term debt portfolio. Equinor’s funding and liquidity activities are handled centrally.
Equinor has diversified its cash investments across a range of financial instruments and counterparties to avoid concentrating risk in any one type of investment or any single country. As of 31 December 2018, approximately 36% of Equinor’s liquid assets were held in USD-denominated assets, 27% in NOK, 27% in EUR, 6% in GBP, 2% in DKK and 2% in SEK, before the effect of currency swaps and forward contracts. Approximately 48% of Equinor’s liquid assets were held in time deposits, 28% in treasury bills and commercial paper, 17% in money market funds and 2% in bank deposits. As of 31 December 2018, approximately 3.9% of Equinor’s liquid assets were classified as restricted cash (including collateral deposits).
Equinor’s general policy is to keep a liquidity reserve in the form of cash and cash equivalents or other current financial investments in Equinor’s balance sheet, as well as committed, unused credit facilities and credit lines in order to ensure that Equinor has sufficient financial resources to meet short-term requirements.
Long-term funding is raised when a need is identified for such financing based on Equinor’s business activities, cash flows and required financial flexibility or when market conditions are considered to be favourable.
The Group's borrowing needs are usually covered through the issuance of short-, medium- and long-term securities, including utilisation of a US Commercial Paper Programme (programme limit USD 5.0 billion) and a Shelf Registration Statement filed with the Securities and Exchange Commission (SEC) in the US as well as through issues under a Euro Medium-Term Note (EMTN) Programme listed on the London Stock Exchange. Committed credit facilities and credit lines may also be utilised. After the effect of currency swaps, the major part of Equinor’s borrowings is in USD.
On 5 September 2018, Equinor issued USD 1 billion in new bonds. Effective 14 December 2017, Equinor bought back USD 2.25 billion of issued bonds. During 2017, Equinor issued no new bonds, while in 2016 new debt securities equivalent to USD 1.3 billion were issued. All the bonds are unconditionally guaranteed by Equinor Energy AS. For more information, see note 18 Finance debt to the Consolidated financial statements.
Financial indicators | | | |
| | | | |
| For the year ended 31 December |
(in USD million) | 2018 | 2017 | 2016 |
| | | | |
Gross interest-bearing debt 1) | 25,727 | 28,274 | 31,673 |
Net interest-bearing debt before adjustments | 11,130 | 15,437 | 18,372 |
Net debt to capital employed ratio 2) | 20.6% | 27.9% | 34.4% |
Net debt to capital employed ratio adjusted 3) | 22.2% | 29.0% | 35.6% |
Cash and cash equivalents | 7,556 | 4,390 | 5,090 |
Current financial investments | 7,041 | 8,448 | 8,211 |
| | | | |
1) | Defined as non-current and current finance debt. |
2) | As calculated according to IFRS. Net debt to capital employed ratio is the net debt divided by capital employed. Net debt is interest-bearing debt less cash and cash equivalents and current financial investments. Capital employed is net debt, shareholders' equity and minority interest. |
3) | In order to calculate the net debt to capital employed ratio adjusted, Equinor makes adjustments to capital employed as it would be reported under IFRS. Restricted funds held as financial investments in Equinor Insurance AS and Collateral deposits has been added to the net debt whilst the SDFI part of the financial lease in the Snøhvit vessel has been taken out of the net debt. See section 5.2 Net debt to capital employed ratio for a reconciliation of capital employed and a description of why Equinor considers this measure to be useful. |
| | | | |
Equinor, Annual Report on Form 20-F 2018 95
Gross interest-bearing debt
Gross interest-bearing debt was USD 25.7 billion, USD 28.3 billion and USD 31.7 billion at 31 December 2018, 2017 and 2016, respectively. The USD 2.6 billion net decrease from 2017 to 2018 was due to a decrease in current finance debt of USD 1.6 billion and non-current finance debt of USD 0.9. The USD 3.4 billion net decrease from 2016 to 2017 was due to a decrease in non-current finance debt of USD 3.8 billion, offset by an increase in current finance debt of USD 0.4 billion. The weighted average annual interest rate was 3.67%, 3.50% and 3.41% at 31 December 2018, 2017 and 2016, respectively. Equinor’s weighted average maturity on finance debt was nine years at 31 December 2018, nine years at 31 December 2017 and nine years at 31 December 2016.
Net interest-bearing debt
Net interest-bearing debt before adjustments were USD 11.1 billion, USD 15.4 billion and USD 18.4 billion at 31 December 2018, 2017 and 2016, respectively. The decrease of USD 4.3 billion from 2017 to 2018 was mainly related to a decrease in gross interest-bearing debt of USD 2.5 billion, an increase in cash and cash equivalents of USD 3.2 billion offset by a USD 1.4 billion decrease in current financial investments. The decrease of USD 2.9 billion from 2016 to 2017 was mainly related to a decrease in gross interest-bearing debt of USD 3.4 billion, an increase of current financial investments of USD 0.2 billion offset by a USD 0.7 billion decrease in cash and cash equivalents.
The net debt to capital employed ratio
The net debt to capital employed ratio before adjustments was 20.6%, 27.9% and 34.4% in 2018, 2017 and 2016 respectively.
The net debt to capital employed ratio adjusted (non-GAAP financial measure, see footnote three above) was 22.2%, 29.0% and 35.6% in 2018, 2017, and 2016, respectively.
The 7.3 percentage points decrease in net debt to capital employed ratio before adjustments from 2017 to 2018 was related to the decrease in net interest-bearing debt of USD 4.3 billion in combination with a decrease in capital employed of USD 1.2 billion. The 6.5 percentage points decrease in net debt to capital employed ratio before adjustments from 2016 to 2017 was related to the decrease in net interest-bearing debt of USD 2.9 billion in combination with an increase in capital employed of USD 1.9 billion.
The 6.8 percentage points decrease in net debt to capital employed ratio adjusted from 2017 to 2018 was related to the decrease in net interest-bearing debt adjusted of USD 4.0 billion in combination with a decrease in capital employed adjusted of USD 0.9 billion. The 6.6 percentage points decrease in net debt to capital employed ratio adjusted from 2016 to 2017 was related to the decrease in net interest-bearing debt adjusted of USD 3.1 billion in combination with an increase in capital employed adjusted of USD 1.7 billion.
Cash, cash equivalents and current financial investments
Cash and cash equivalents were USD 7.6 billion, USD 4.4 billion and USD 5.1 billion at 31 December 2018, 2017 and 2016 respectively. See note 16 Cash and cash equivalents to the Consolidated financial statements for information concerning restricted cash. Current financial investments, which are part of Equinor’s liquidity management, amounted to USD 7.0 billion, USD 8.4 billion and USD 8.2 billion at 31 December 2018, 2017 and 2016, respectively.
Investments
In 2018, capital expenditures, defined as Additions to PP&E, intangibles and equity accounted investments in note 3 Segments to the Consolidated financial statements, amounted to USD 15.2 billion of which USD 9.9 billion were organic capital expenditures.
In 2017, capital expenditures were USD 10.8 billion, as per note 3 Segments to the Consolidated financial statements, of which organic capital expenditures amounted to USD 9.4 billion.
In Norway, a substantial proportion of 2019 capital expenditures will be spent on ongoing development projects such as Johan Sverdrup, Johan Castberg and Martin Linge in addition to various extensions, modifications and improvements on currently producing fields.
Internationally, we currently estimate that a substantial proportion of 2019 capital expenditure will be spent on the following ongoing and planned development projects: Mariner in the UK, Peregrino in Brazil, and onshore activity in the US.
96 Equinor, Annual Report on Form 20-F 2018
Within renewable energy, a proportion of 2019 capital expenditure is expected to be spent on the Arkona offshore wind project in Germany.
Equinor finances its capital expenditures both internally and externally. For more information, see Financial assets and debt earlier in this section.
As illustrated in section Principal contractual obligations later in this report, Equinor has committed to certain investments in the future. The further into the future, the more flexibility we will have to revise expenditure. This flexibility is partly dependent on the expenditure joint venture partners agree to commit to. A large part of the capital expenditure for 2019 is committed.
Equinor may alter the amount, timing or segmental or project allocation of capital expenditures in anticipation of, or as a result of a number of factors outside our control.
Equinor, Annual Report on Form 20-F 2018 97
Principal contractual obligations
The table summarises principal contractual obligations, excluding derivatives and other hedging instruments, as well as, asset retirement obligations, which for the most part are expected to lead to cash disbursements more than five years in the future.
Non-current finance debt in the table represents principal payment obligations, including interest obligation. Obligations related to an ownership interest and the transport capacity cost for a pipeline and exceeding Equinor ownership in unconsolidated equity affiliates are included as part of the other long-term commitments.
Principal contractual obligations | | | | | |
| | | | | | |
| As at 31 December 2018 |
| Payment due by period 1) |
(in USD million) | Less than 1 year | 1-3 years | 3-5 years | More than 5 years | Total |
| | | | | | |
Undiscounted finance debt- principal and interest2) | 2,230 | 5,624 | 5,042 | 20,379 | 33,275 |
Minimum operating lease payments3) | 2,001 | 2,520 | 1,791 | 1,942 | 8,253 |
Nominal minimum other long-term commitments4) | 1,584 | 2,766 | 2,184 | 4,947 | 11,479 |
| | | | | | |
Total contractual obligations | 5,814 | 10,909 | 9,017 | 27,267 | 53,007 |
| | | | | | |
1) | "Less than 1 year" represents 2019; "1-3 years" represents 2020 and 2021, "3-5 years" represents 2022 and 2023, while "More than 5 years" includes amounts for later periods. |
2) | See note 18 Finance debt to the Consolidated financial statements. The main differences between the table and the note is interest. |
3) | See note 22 Leases to the Consolidated financial statements. |
4) | See note 24 Other commitments and contingencies to the Consolidated financial statements. |
| | | | | | |
Equinor had contractual commitments of USD 6,269 million at 31 December 2018. The contractual commitments reflect Equinor's share and mainly comprise construction and acquisition of property, plant and equipment.
Equinor’s projected pension benefit obligation was USD 8,176 million, and the fair value of plan assets amounted to USD 5,187 million as of 31 December 2018. Company contributions are mainly related to employees in Norway. See note 19 Pensions to the Consolidated financial statements for more information.
Off balance sheet arrangements
Equinor is party to various agreements, such as operational leases and transportation and processing capacity contracts, that are not recognised in the balance sheet. For more information, see Principal contractual obligations in section 2.10 Liquidity and capital resources, and note 22 Leases to the Consolidated financial statements. From January 1 2019 Equinor will implement IFRS 16 Leases which requires that all leases shall be recognised in the balance sheet, as described in note 23 Implementation of IFRS 16 to the Consolidated financial statements. Equinor is also party to certain guarantees, commitments and contingencies that, pursuant to IFRS, are not necessarily recognised in the balance sheet as liabilities. See note 24 Other commitments and contingencies to the Consolidated financial statements for more information.
98 Equinor, Annual Report on Form 20-F 2018
Risk factors
Equinor is exposed to risks that separately, or in combination, could affect its operational and financial performance. In this section, some of the key factors are addressed.
Risks related to our business
This section describes the most significant potential risks relating to Equinor`s business.
Oil and natural gas price risks
Fluctuating prices of oil and/or natural gas impact our financial performance
The prices of oil and natural gas have fluctuated significantly over the last few years. There are several reasons for these fluctuations, but fundamental market forces beyond the control of Equinor or other similar market participants have impacted and will continue to impact oil and natural gas prices in the future.
Generally, Equinor will not have control over the factors that affect the prices of oil and natural gas which include:
· economic and political developments in resource-producing regions
· global and regional supply and demand
· the ability of the Organization of the Petroleum Exporting Countries (OPEC) and/or other producing nations to influence global production levels and prices
· prices of alternative fuels that affect the prices realised under Equinor's long-term gas sales contracts
· government regulations and actions; including changes in energy and climate policies
· global economic conditions
· war or other international conflicts
· changes in population growth and consumer preferences
· the price and availability of new technology,
· increased supply from new oil and gas sources and
· weather conditions
Decreases in oil and/or natural gas prices could have an adverse effect on Equinor's business, the results of operations, financial condition and liquidity and Equinor's ability to finance planned capital expenditure, including possible reductions in capital expenditures which in turn could lead to reduced reserve replacement.
A significant or prolonged period of low oil and natural gas prices or other indicators could, if deemed to have longer term impact, lead to reviews for impairment of the group's oil and natural gas assets. Such reviews would reflect management's view of long-term oil and natural gas prices and could result in a charge for impairment that could have a significant effect on the results of Equinor's operations in the period in which it occurs. Changes in management’s view on long-term oil and/or natural gas prices or further material reductions in oil, gas and/or product prices could have an adverse impact on the economic viability of projects that are planned or in development.
Proved reserves and expected reserves calculation risks
Equinor’s crude oil and natural gas reserves are only estimates and Equinor’s future production, revenues and expenditures with respect to its reserves may differ materially from these estimates. The reliability of proved reserve estimates depends on:
· the quality and quantity of Equinor’s geological, technical and economic data
· the production performance of Equinor’s reservoirs
· extensive engineering judgments and
· whether the prevailing tax rules and other government regulations, contracts and oil, gas and other prices will remain the same as on the date estimates are made
Proved reserves are calculated based on the US Securities and Exchange Commission (SEC) requirements and may therefore differ substantially from Equinor’s view on expected reserves.
Equinor, Annual Report on Form 20-F 2018 99
Many of the factors, assumptions and variables involved in estimating reserves are beyond Equinor’s control and may prove to be incorrect over time. The results of drilling, testing and production after the date of the estimates may require substantial upward or downward revisions in Equinor’s reserve data. The prices used for proved reserves are defined by the SEC and are calculated based on a 12 month un-weighted arithmetic average of the first day of the month price for each month during the reporting year, leading to a forward price strongly linked to last year’s price environment.
Fluctuations in oil and gas prices will have a direct impact on Equinor’s proved reserves. For fields governed by production sharing agreements (PSAs), a lower price may lead to higher entitlement to the production and increased reserves for those fields.
Conversely, a lower price environment may also lead to lower activity resulting in reduced reserves. For PSAs these two effects may to some degree offset each other. In addition, a low-price environment may result in earlier shutdown due to uneconomic production. This will affect both PSAs and fields with concession types of agreement.
Technical, commercial and country specific risks
Equinor is engaged in global exploration activities that involve several technical, commercial and country-specific risks.
Technical risks are related to Equinor’s ability to conduct its seismic and drilling operations in a safe and efficient manner and to encounter commercially productive oil and gas reservoirs. Commercial risks are related to Equinor’s ability to secure access to new acreage in an uncertain global competitive and political environment and competent personnel to perform exploration activities for the value-chain.
Country-specific risks are inter alia related to security threats and compliance with and understanding of local laws or licence agreements.
These risks may adversely affect Equinor’s current operations and financial results, and its long-term replacement of reserves.
Decline of reserves risks
Failure to acquire, discover and develop additional reserves, will result in material decline of reserves and production from current levels
Successful implementation of Equinor's group strategy for value growth is dependent on sustaining its long-term reserve replacement. If upstream resources are not progressed to prove reserves in a timely manner, Equinor’s reserve base and thereby future production will gradually decline and future revenue will be reduced.
Equinor's future production is dependent on its success in acquiring or finding and developing additional reserves adding value. If unsuccessful, future total proved reserves and production will decline.
In a number of resource-rich countries, national oil companies control a significant proportion of oil and gas reserves that remain to be developed. To the extent that national oil companies choose to develop their oil and gas resources without the participation of international oil companies, or if Equinor is unable to develop partnerships with national oil companies, its ability to find and acquire or develop additional reserves will be limited.
Equinor’s US onshore portfolio contains significant amount of undeveloped resources that depend on Equinor’s ability to develop these successfully. If commodity prices are low over a sustained period of time, this may result in Equinor deciding not to develop these resources or at least deferring development awaiting improved prices.
Health, safety and environmental risks
Equinor is exposed to a wide range of health, safety and environmental risks that could result in significant losses.
Exploration, project development, operation and transportation related to oil and natural gas, as well as development and operation of renewable energy production, can be hazardous. Risk factors include: human error, operational failures, detrimental substances, subsurface behavior, technical integrity failures, vessel collisions, natural disasters, adverse weather conditions or other occurrences. These risk factors could; among other things, lead to blowouts, structural collapses, loss of containment of hydrocarbons or other hazardous materials, fires, explosions and water contamination that cause harm to people, loss of life or environmental damage.
All modes of transportation of hydrocarbons - including road, rail, sea or pipeline - are particularly susceptible to a loss of containment of hydrocarbons and other hazardous materials and represent a significant risk to people and the environment.
The risks associated with Equinor's activities and operations are affected by external risk factors like difficult geographies, climate zones and environmentally sensitive regions.
As operations are subject to inherent uncertainty, it is not possible to guarantee that the management system or other policies and procedures will be able to identify all aspects of health, safety and environmental risks. It is also not possible to say with certainty that all activities will be carried out in accordance with these systems.
100 Equinor, Annual Report on Form 20-F 2018
Transition to a lower carbon economy risks
A transition to a lower carbon economy could impact Equinor’s business.
A transition to a low-carbon energy future entails risks related to policy, legal, regulatory, market and technology changes and reputation.
Risk related to changes in policies, laws and regulations: Equinor expects and is preparing for regulatory changes and policy measures targeted at reducing greenhouse gas emissions. Stricter climate regulations and policies could impact Equinor's financial outlook, whether directly through changes in taxation or other costs to operations and projects, or indirectly through changes in consumer behavior or technology developments. Equinor expects greenhouse gas emission costs to increase from current levels beyond 2020 and to have a wider geographical range than today. Other regulatory risks entail litigation risk and potential direct regulations, for example fuel efficiency standards (e.g. in the EU), restrictions on use of e.g. diesel vehicles and requirements to assess the use of power from shore for new offshore developments at the NCS. Climate-related policy changes may also reduce access to prospective geographical areas for exploration and production in the future. Disruptive developments may not be ruled out, possibly triggered by severe weather events affecting public perception and policy making.
Market-related risk: A transition to a low carbon economy contributes to uncertainty over future demand and prices for oil and gas as described in the section “Oil and natural gas price risks”. Such price sensitivities of the project portfolio are illustrated in the “portfolio stress test” as described in section 2.12 and in the Annual Sustainability Report 2018. Increased demand for and improved cost-competitiveness of renewable energy, and innovation and technology changes supporting the further development and use of renewable energy and low-carbon technologies, represent both threats and opportunities for Equinor. The competitiveness of the choices Equinor makes regarding what renewable business opportunities are pursued and invested in is subject to risk and uncertainty.
Reputational impact: Increased concern over climate change could lead to increased expectations to fossil fuel producers, as well as a more negative perception of the oil and gas industry. This could lead to litigation and divestment risk and could have an impact on talent attraction and retention.
Hydraulic fracturing risk
Equinor is exposed to risks as a result of its hydraulic fracturing usage
Equinor's US operations use hydraulic fracturing which is subject to a range of applicable federal, state and local laws, including those discussed under the heading "Legal and Regulatory Risks". A case of subsurface migration of hydraulic fracturing fluids or a case of spillage or mishandling of hydraulic fracturing fluids during these activities could potentially subject Equinor to civil and/or criminal liability and the possibility of substantial costs, including environmental remediation. In addition, various states and local governments have implemented, or are considering, increased regulatory oversight of hydraulic fracturing through additional permit requirements, operational restrictions, disclosure requirements and temporary or permanent bans, which could make it more difficult to complete oil and natural gas wells in shale formations, cause operational delays, increase costs of regulatory compliance or in exploration and production, which could adversely affect Equinor's US onshore business and the demand for fracturing services.
Security threats and Cyber-attacks risks
Equinor is exposed to security threats that could have a materially adverse effect on Equinor's results of operations and financial condition.
Security threats such as acts of terrorism and cyber-attacks against Equinor's production and exploration facilities, offices, pipelines, means of transportation, digital infrastructure or computer- or information systems or breaches of Equinor's security system, could result in losses.
Failure to manage the aforementioned risks could result in injury or loss of life, damage to the environment, damage to or the destruction of wells and production facilities, pipelines and other property. Equinor could face, among other things, regulatory action, legal liability, damage to its reputation, a significant reduction in revenues, an increase in costs, a shutdown of operations and a loss of its investments in affected areas.
Equinor’s IT security barriers are intended to protect its information systems and digital infrastructure from being compromised by unauthorised parties. Failure to maintain and develop these barriers may affect the confidentiality, integrity and availability of its information systems and digital infrastructure, including those critical to Equinor’s operations. Threats to Equinor’s information systems could result in significant financial damage to Equinor. Threats to Equinor’s industrial control systems are not limited by geography as Equinor’s digital infrastructure is accessible globally. Such attacks could result in material losses or loss of life with consequent financial implications.
Crisis management systems risks
Equinor's crisis management systems may prove inadequate
If Equinor does not respond or is perceived not to have responded in an appropriate manner to either an external or internal crisis, or if its plans to carry on or recover operations following a disruption or incident are not effectuated, or not effectuated quickly enough, its
Equinor, Annual Report on Form 20-F 2018 101
business, operations and reputation could be severely affected. Inability to restore or replace critical capacity could prolong the impact of any disruption and could severely affect Equinor's business and operations.
Competition risks
Equinor encounters competition from other companies in all areas of its operations
Equinor may experience increased competition from larger players with stronger financial resources and smaller ones with increased agility and flexibility. Gaining access to commercial resources via licence acquisition, exploration, or development of existing assets is key to ensuring the long-term economic viability of the business and failure to address this could negatively impact future performance.
Technology is a key competitive advantage in Equinor's industry, and competitors may be able to invest more in developing or acquiring intellectual property rights to technology, than Equinor may be able to in order to remain competitive. Should Equinor's innovation and digitalisation lag behind the industry, its performance could be impeded.
Project development and production operations risks
Equinor's development projects and production operations involve uncertainties and operating risks which could prevent Equinor from realising profits and cause substantial losses.
Oil and gas projects may be curtailed, delayed or cancelled because of many reasons, including equipment shortages or failures, natural hazards, unexpected drilling conditions or reservoir characteristics, irregularities in geological formations, accidents, mechanical and technical difficulties, challenges due to new technology or inadequate investment decision basis. This is particularly relevant for Equinor‘s activities in deep waters or other harsh environments. Climate change could affect Equinor's operations through restrained water availability, rising sea level, changes in sea currents and increasing extreme weather frequency. In US onshore, low regional prices may render certain areas unprofitable, and the company may curtail production until prices recover. Prolonged low oil and gas prices, combined with high levels of tax and government take in several jurisdictions, could therefore erode the profitability of some of Equinor’s activities.
Strategic objective risks
Equinor may not achieve its strategic objectives of successfully exploiting profitable opportunities
Equinor intends to continue to nurture attractive commercial opportunities to create value. This may involve acquisition of new businesses, properties or moving into new markets.
Equinor’s ability to achieve its strategic objectives depends on several factors, including the ability to:
· maintain Equinor’s zero-harm safety culture
· identify suitable opportunities
· negotiate favourable terms
· compete efficiently in the rising global competition for access to new opportunities
· develop new market opportunities or acquire properties or businesses in an agile and efficient way
· effectively integrate acquired properties or businesses into Equinor's operations
· arrange financing, if necessary and
· comply with legal regulations
Equinor anticipates significant investments and costs as it cultivates business opportunities in new and existing markets, including, without limitations, unanticipated liabilities, losses or costs related to acquired assets or businesses.
Failure by Equinor to successfully pursue and exploit new business opportunities, including in new energy solutions, could result in financial losses and inhibit value creation.
New projects may have different embedded risks than Equinor's existing portfolio. These and other effects of such acquisitions could result in Equinor having to revise its forecasts either or both with respect to unit production costs and production.
In addition, the pursuit of acquisitions or new business opportunities could divert financial and management resources away from Equinor's day-to-day operations to the integration of acquired operations or properties. Equinor may require additional debt or equity financing to undertake or consummate future acquisitions or projects, and such financing may not be available on terms satisfactory to Equinor, if at all, and it may, in the case of equity, be dilutive to Equinor's earnings per share.
Limited transportation infrastructure risks
The profitability of Equinor’s oil and gas production in a remote area may be affected by an infrastructure constraint
Equinor's ability to commercially exploit discovered petroleum resources will depend, among other factors, on infrastructure to transport oil and gas to potential buyers at a commercial price. Oil is transported by vessels, rail or pipelines to refineries, and natural
102 Equinor, Annual Report on Form 20-F 2018
gas by pipeline or vessels (for liquefied natural gas) to processing plants and end users. Equinor may be unsuccessful in its efforts to secure transportation and markets for all its potential production.
International political, social and economic risks
Equinor has international interests located in regions where political, social and economic instability could adversely affect Equinor’s business.
Equinor has assets and operations located in diverse regions globally where potentially negative economic, social, and political developments could occur. These political risks and security threats require continuous monitoring. Uncertainty exists around the UK`s exit from the EU and the potential market impact.
Political instability, civil strife, strikes, insurrections, acts of terrorism and acts of war, adverse and hostile actions against Equinor's staff, its facilities, its transportation systems and its digital infrastructure (cybersecurity) may cause harm to people and disrupt or curtail Equinor's operations and further business opportunities, lead to a decline in production and otherwise adversely affect Equinor's business, its operations’ results and financial condition.
International governmental and regulatory framework risks
Equinor's operations are subject to dynamic political and legal factors in the countries in which it operates
Equinor has assets in several countries with emerging or transitioning economies that, in part or in whole, lack well-functioning and reliable legal systems, where the enforcement of contractual rights is uncertain or where the governmental and regulatory framework is subject to unexpected change. Equinor's exploration and production activities in these countries are often undertaken together with national oil companies and are subject to a significant degree of state control. In recent years, governments and national oil companies in some regions have begun to exercise greater authority and to impose more stringent conditions on companies engaged in exploration and production activities. Intervention by governments in such countries can take a wide variety of forms, including:
· restrictions on exploration, production, imports and exports
· the awarding or denial of exploration and production interests
· the imposition of specific seismic and/or drilling obligations
· price and exchange controls
· tax or royalty increases, including retroactive claims
· nationalisation or expropriation of Equinor's assets
· unilateral cancellation or modification of Equinor's licence or contractual rights
· the renegotiation of contracts
· payment delays and
· currency exchange restrictions or currency devaluation
The likelihood of these occurrences and their overall effect on Equinor vary greatly from country to country and are hard to predict. If such risks materialise, they could cause Equinor to incur material costs, cause decrease in production, and potentially have a materially adverse effect on Equinor's operations or financial condition.
International tax law risks
Equinor is exposed to potentially adverse changes in the tax regimes of each jurisdiction in which Equinor operates
Changes in the tax laws of the countries in which Equinor operates could have a material adverse effect on its liquidity and results of operations.
Foreign exchange risks
Equinor’s business is exposed to foreign exchange rate fluctuations that could adversely affect the results of Equinor’s operations
Equinor has a large percentage of its revenues and cash receipts denominated in USD and sales of gas and refined products are mainly denominated in EUR and GBP. Further, Equinor pays a large portion of its income taxes, operating expenses, capital expenditures and dividends in NOK. The majority of Equinor's long term debt has USD exposure.
Trading and supply activities risks
Equinor is exposed to risks relating to trading and supply activities
Equinor is engaged in trading and commercial activities in the physical markets. Equinor uses financial instruments such as futures, options, over-the-counter (OTC) forward contracts, market swaps and contracts for differences related to crude oil, petroleum products, natural gas and electricity to manage price differences and volatility. Equinor also uses financial instruments to manage foreign exchange and interest rate risk. Trading activities involve elements of forecasting, and Equinor bears the risk of market movements, the risk of losses if prices develop contrary to expectations, and the risk of default by counterparties and transport of liquids.
Equinor, Annual Report on Form 20-F 2018 103
Failure to comply with anti-corruption, anti-bribery laws and Equinor Code of Conduct risks
Non-compliance with anti-bribery, anti-corruption and other applicable laws, including failure to meet Equinor’s ethical requirements, exposes Equinor to legal liability and damage to its reputation, business and shareholder value.
Equinor has activities in countries which present corruption risks and which may have weak legal institutions, lack of control and transparency. In addition, governments play a significant role in the oil and gas sector, through ownership of resources, participation, licensing and local content which leads to a high level of interaction with public officials. Equinor is subject to anti-corruption and bribery laws in multiple jurisdictions, including the Norwegian Penal code, the US Foreign Corrupt Practices Act and the UK Bribery Act. A violation of any applicable anti-corruption and bribery laws could expose Equinor to investigations from multiple authorities and violations of laws may lead to criminal and/or civil liability with substantial fines. Incidents of non-compliance with applicable anti-corruption and bribery laws and regulations and the Equinor Code of Conduct could be damaging to Equinor's reputation, competitiveness and shareholder value.
Joint arrangements and contractors
Many of Equinor’s activities are conducted through joint arrangements and with contractors and sub-contractors which may limit Equinor’s influence and control over the performance of such operations. This exposes Equinor to financial, operational and safety risks if the partners and contractors fail to fulfill their responsibilities.
Partners and contractors may be unable or unwilling to compensate Equinor against costs incurred on their behalf or on behalf of the arrangement.
Equinor is also exposed to enforcement actions by regulators or claimants in the event of an incident in an operation where we do not exercise operational control.
Liquidity and interest rate risks
Equinor is exposed to liquidity and interest rate risks.
Equinor is exposed to liquidity risk; the risk that Equinor will not be able to meet obligations of financial liabilities when they become due.
The main cash outflows include the quarterly dividend payments and Norwegian petroleum tax payments paid six times per year. Liquidity risk sources include but are not limited to business interruptions and commodity and financial markets price movements.
Interest rate risk
Equinor is exposed to interest rate risk; the possibility that changes in interest rates will affect future cash flows or the fair values of its financial instruments, principally long-term debt and associated derivatives. Equinor’s bonds are normally issued at fixed rates in a variety of local currencies (among others USD, EUR and GBP). Bonds are normally converted to floating USD bonds by using interest rate and currency swaps.
Financial Risk
Equinor is exposed to financial risk.
The main factors influencing Equinor's operational and financial results include: the level of oil/condensate and natural gas prices and trends in the exchange rates between mainly the USD, EUR, GBP and NOK: Equinor's oil and natural gas entitlement production volumes, (which in turn depend on entitlement volumes under PSAs where applicable) and available petroleum reserves and Equinor's own, as well as partners' expertise and cooperation in recovering oil and natural gas from those reserves: and changes in Equinor’s portfolio of assets due to acquisitions and disposals.
Equinor's operational and financial results will also be affected by trends in the international oil industry including possible actions by governments and other regulatory authorities in the jurisdictions in which Equinor operates, or possible or continued actions by members of the Organization of Petroleum Exporting Countries (OPEC) and/or other producing nations that affect price levels and volumes, refining margins, the cost of oilfield services, supplies and equipment, competition for exploration opportunities and operatorships and deregulation of the natural gas markets, all of which may cause substantial changes to existing market structures and to the overall level and volatility of prices and price differentials,
The following table shows the yearly averages for quoted Brent Blend crude oil prices. natural gas average sales prices. refining reference margins and the USD/NOK exchange rates for 2018, 2017 and 2016.
Yearly averages | 2018 | 2017 | 2016 |
| | | |
Average Brent oil price (USD/bbl) | 71.1 | 54.2 | 43.7 |
Average invoiced gas prices - Europe (USD/mmBtu) | 7.0 | 5.6 | 5.2 |
Refining reference margin (USD/bbl) | 5.3 | 6.3 | 4.8 |
USD/NOK average daily exchange rate | 8.1 | 8.3 | 8.4 |
| | | |
104 Equinor, Annual Report on Form 20-F 2018

The illustration shows the indicative full-year effect on the financial result for 2019 qiven certain changes in the oil/condensate price, natural gas contract prices and the USD/NOK exchange rate. The estimated price sensitivity of Equinor's financial results to each of the factors has been estimated based on the assumption that all other factors remain unchanged. The estimated indicative effects of the negative changes in these factors are not expected to be materially asymmetric to the effects shown in the illustration.
Significant downward adjustments of Equinor's commodity price assumptions could result in impairments on certain producing and development assets in the portfolio. See note 10 Property, plant and equipment to the Consolidated financial statements for sensitivity analysis related to impairments.
Fluctuating foreign exchange rates can also have a significant impact on the operating results.
Equinor's revenues and cash flows are mainly on denominated in or driven by USD, while a large portion of the operating expenses, capital expenditures and income taxes payable accrue in NOK. In general, an increase in the value of USD in relation to NOK can be expected to increase Equinor's reported earnings.
Historically, Equinor's revenues have largely been generated by the production of oil and natural gas on the NCS. Norway imposes a 78% marqinal tax rate on income from offshore oil and natural gas activities (a symmetrical tax system). For further information, see section 2.7 Corporate Taxation of Equinor.
Equinor's earnings volatility is moderated as a result of the significant proportion of its Norwegian offshore Income that is subject to 78% tax rate in profitable periods and the significant tax assets generated by its Norwegian offshore operations in any loss-making periods.
Dividends received in Norway are subject to the standard income tax rate (reduced from 23 % in 2018 to 22 % in 2019). The basis for taxation is 3 % of the dividends received giving an effective tax rate of 0.69 % in 2018. Dividends received from Norwegian companies and from similar companies resident in the EEA for tax purposes, in which the recipient holds more than 90% of the shares and votes, are fully exempt from tax. Dividends from companies resident in the EEA that are not similar to Norwegian companies, companies in low-tax countries and portfolio investments outside the EEA will, under certain circumstances, be subject to the standard income tax rate (reduced from 23% in 2018 to 22% in 2019 based on the full amounts received).
Disclosures about market risk
Equinor uses financial instruments to manage commodity price risks, interest rate risks, currency risks and liquidity risks. Significant amounts of assets and liabilities are accounted for as financial instruments.
Equinor, Annual Report on Form 20-F 2018 105
See note 25 Financial instruments: fair value measurement and sensitivity analysis of market risk in the Consolidated financial statements for details of the nature and extent of such positions and for qualitative and quantitative disclosures of the risks associated with these instruments.
Inadequate insurance coverage risk
Equinor’s insurance coverage may not provide adequate protection
Equinor maintains insurance coverage that includes coverage for physical damage to its oil and gas properties, third-party liability, workers' compensation and employers' liability, general liability, sudden pollution and other coverage. Equinor's insurance coverage includes deductibles that must be met prior to recovery. Equinor's external insurance is subject to caps, exclusions and limitations, and there is no assurance that such coverage will adequately protect Equinor against liability from all potential consequences and damages. Uninsured losses could have a material adverse effect on our financial position.
Inefficient operations and lack of new technology risks
Equinor’s future performance depends on efficient operations and the ability to develop and deploy new technologies and new products
The ability to maintain efficient operations, to develop and adapt to innovative technologies and digital solutions, to seek profitable renewable energy and other low-carbon energy solutions, are key success factors for future business. There is a possibility that Equinor could be adversely affected if competitors move faster in the development or use of innovative cost-effective technologies (incl digitalisation) and low-carbon or renewable energy solutions.
Failure to secure capable and competent workforce risk
Equinor may fail to secure the right level of workforce competence and capacity over the short and medium term
The uncertainty of the future of the oil industry in light of reduced oil and natural gas prices and climate policy changes, creates a risk in ensuring a robust workforce through industry cycles. The oil industry is a long-term business and needs to take a long-term perspective on workforce capacity and competence. Given the current extensive change agenda there is a risk that Equinor will fail to secure the right level of workforce competence and capacity.
International sanctions and trade restrictions risks
Equinor’s activities may be affected by international sanctions and trade restrictions
Equinor, like other major international energy companies, has a diverse portfolio of projects which may expose its business and financial affairs to political and economic risks, including operations in markets or sectors targeted by sanctions and international trade restrictions.
Sanctions and trade restrictions are often complex and changes can come about on short notice and be hard to predict. For example, in 2018 new trade restrictions were introduced in relation to Nicaragua where Equinor has activities. While this remains the case, Equinor's business portfolio is evolving and will constantly be subject to review. Accordingly, Equinor could in the future decide to take part in new business activity in markets or sectors where sanctions and trade restrictions are particularly relevant.
While Equinor remains committed to do business in compliance with sanctions and trade restrictions, there can be no assurance that no Equinor entity, officer, director, employee or agent is not in violation of such laws. Any such violation of applicable laws could result in substantial civil and/or criminal penalties and could materially adversely affect Equinor's business and results of operations or financial condition.
Equinor holds an interest in several on- and offshore oil and gas projects in Russia. Most of these projects result from a strategic cooperation with Rosneft Oil Company (Rosneft) initiated in 2012. In each of these projects, Rosneft holds the majority interest. A minority of the projects are in Arctic offshore and/or deep-water areas. The Norwegian, EU and US sanctions adopted on Russia target several sectors - including the financial and energy sector. Accordingly, certain Russian energy companies have been particularly targeted under the sanctions - including Rosneft. This being the case, the sanctions in place affect the way Equinor conducts its business in the country. Moreover, Equinor’s ability to continue to progress its projects in Russia is in part relying on government authorisations as well as the future of sanctions and trade controls. While Equinor continues to pursue its business in Russia within existing sanctions and trade controls, possible future developments could impact Equinor’s ability to continue and conclude these projects as envisaged.
In Venezuela, Equinor is a 9,67% shareholder in the mixed company Petrocedeno majority owned by Venezuelan national oil company, Petróleos de Venezuela, SA (PDVSA). In addition, Equinor holds a 51% interest in a gas licence offshore Venezuela. Since 2017, various international sanctions and trade controls have targeted certain Venezuelan individuals as well as the Government of Venezuela and PDVSA. PDVSA, and consequently its subsidiary Petrocedeno, were designated as blocked parties (SDN) in January 2019 by the US Office of Foreign Asset Control. The international sanctions and trade controls in place restrict the way Equinor can conduct its business in Venezuela, and could, alone or in combination with other factors, further negatively impact Equinor’s position and ability to continue its business projects in Venezuela.
106 Equinor, Annual Report on Form 20-F 2018
Disclosure Pursuant to Section 13 (r) of the Exchange Act
Equinor is providing the following disclosure pursuant to Section 13(r) of the Exchange Act.
Equinor is a party to agreements with the National Iranian Oil Company (NIOC), namely, a Development Service Contract for South Pars Gas Phases 6, 7 & 8 (offshore part), an Exploration Service Contract for the Anaran Block and an Exploration Service Contract for the Khorramabad Block, which are located in Iran. Equinor's operational obligations under these agreements have terminated and the licences have been abandoned. The cost recovery programme for these contracts was completed in 2012, except for the recovery of tax and obligations to the Social Security Organization (SSO).
Since 2013, after closing Equinor’s office in Iran, Equinor's activity was focused on a final settlement with the Iranian tax and SSO authorities relating to the above-mentioned agreements.
During 2018 Equinor paid the equivalent of USD 20,000 in tax to Iranian authorities. Also, during 2018 Equinor paid the equivalent of USD 50 in stamp duty to Iran Tax Organization. All payments were made in local currency (Iranian Rials). The funds utilised for these purposes were held by Equinor in EN Bank (Iran). Additionally, NIOC, on behalf of Equinor, in 2018 paid a tax obligation of USD 0.53 million equivalent in Iranian Rial to the local tax authorities and a social security obligation of USD 2.61 million equivalent in Iranian Rial to the social security authorities. The amount was settled towards historical recoverable costs from NIOC to Equinor.
Equinor has provided information about its Iran related activity to the US State Department as well as to the Norwegian Ministry of Foreign Affairs.
In a letter from the US State Department of 1 November 2010, Equinor was informed that the company was not considered to be a company of concern based on its previous Iran-related activities.
Equinor earned no net profit from the aforementioned 2018 activities.
Legal and regulatory risk
Health, safety and environmental laws and regulations risks
Compliance with health, safety and environmental laws and regulations that apply to Equinor's operations could materially increase Equinor’s costs. The enactment of or changes to such laws and regulations in the future is uncertain.
Equinor incurs, and expects to continue to incur, substantial capital, operating, maintenance and remediation costs relating to compliance with increasingly complex laws and regulations for the protection of the environment and human health and safety, including:
· higher price on greenhouse gas emissions
· costs of preventing, controlling, eliminating or reducing certain types of emissions to air and discharges to the sea
· remedying of environmental contamination and adverse impacts caused by Equinor's activities
· decommissioning obligations and related costs
· compensation of cost related to persons and/or entities claiming damages as a result of Equinor's activities
Equinor`s activity is increasingly subject to statutory strict liability in respect of losses or damage suffered as a result of pollution caused by spills or discharges of petroleum from petroleum facilities.
Compliance with laws, regulations and obligations relating to climate change and other environmental regulations could result in substantial capital expenditure, reduced profitability as a result of changes in operating costs, and adverse effects on revenue generation and strategic growth opportunities. However, more stringent climate change regulations could also represent business opportunities for Equinor. For more information about climate change related legal and regulatory risks, see the risks described under the heading “Transition to a lower carbon economy” in Risks related to our business in Risk Factors in this section 2.7 Corporate.
Equinor's investments in US onshore producing assets will be subject to evolving regulations that could affect these operations and their profitability. In the United States, Federal agencies have taken steps to rescind, delay, or revise regulations seen as overly burdensome to the upstream oil and gas sector, including methane emission controls. Equinor supports Federal regulation of methane emissions and aims to operate in compliance with all current requirements. To the extent new or revised regulations impose additional compliance or data gathering requirements, Equinor could incur higher operating costs. Equinor has also joined voluntary emission reduction programmes (One Future and API’s Environmental Partnership) and implemented a climate roadmap to reduce CO2 and methane emissions.
Supervision, regulatory reviews, and financial reporting risks
Equinor conducts business in many countries and its products are marketed and traded worldwide. Equinor is exposed to risk of supervision, review and sanctions for violations of laws and regulations at the supranational, national and local level. These include,
Equinor, Annual Report on Form 20-F 2018 107
among others, laws and regulations relating to financial reporting, taxation, bribery and corruption, securities and commodities trading, fraud, competition and antitrust, safety and the environment, and labor and employment practices.
Violations of the applicable laws and regulations may lead to legal liability, substantial fines and other sanctions for noncompliance.
Equinor is also exposed to financial review from financial supervisory authorities such as the Norwegian Financial Supervisory Authority (FSA) and the US Securities and Exchange Commission (the SEC). Reviews performed by these authorities could result in changes to previously published financial statements and future accounting practices. In addition, failure of external reporting to report data accurately and in compliance with applicable standards could result in regulatory action, legal liability and damage to our reputation.
Equinor is listed on both the Oslo Børs and New York Stock Exchange (NYSE), and is registered with the SEC. Equinor is required to comply with the continuing obligations of these regulatory authorities, and violation of these obligations may result in legal liability, the imposition of fines and other sanctions.
The Norwegian Petroleum Supervisor (PSA) supervises all aspects of Equinor's operations, from exploration drilling through development and operation, to cessation and removal. Its regulatory authority covers the whole NCS as well as petroleum-related plants on land in Norway. Equinor is exposed to supervision from PSA, and as its business grows internationally other regulators, and such supervision could result in audit reports, orders and investigations.
The EU-wide quantity of carbon allowances issued each year under the Emission Trading Scheme (ETS) for greenhouse gas emission allowances began to decrease in a linear manner in 2013. The ETS can have a positive or negative impact on Equinor, depending on the price of carbon, which will consequently have an impact on the development of gas-fired power generation in the EU. Failure to remediate a material weakness could cause internal controls over financial reporting to be ineffective and could cause investors to lose confidence in reported financial information and potentially impact the share price.
Political and economic policies of the Norwegian State could affect Equinor’s business
The Norwegian State plays an active role in the management of NCS hydrocarbon resources. In addition to its direct participation in petroleum activities through the State's direct financial interest (SDFI) and its indirect impact through legislation, such as tax and environmental laws and regulations, the Norwegian State, among other things, awards licences for exploration, production and transportation, approves exploration and development projects and applications for production rates for individual fields and may, based on a provision in the Norwegian Petroleum Act, if important public interests are at stake, also instruct operators on the NCS to reduce petroleum production. Furthermore, in the production licences in which the SDFI holds an interest, the Norwegian State has the power to direct petroleum licences’ actions in certain circumstances. See also section 2.7.
If the Norwegian State were to take additional action under its activities on the NCS or to change laws, regulations, policies or practices relating to the oil and gas industry, Equinor's NCS exploration, development and production activities and the results of its operations could be affected.
Risks related to state ownership
This section discusses some of the potential risks relating to Equinor’s business that could derive from the Norwegian State's majority ownership and from Equinor’s involvement in the SDFI.
Equinor’s shareholder alignment risks
The interests of Equinor`s majority shareholder, the Norwegian State, may not always be aligned with the interests of Equinor`s other shareholders, and this may affect Equinor`s decisions relating to the NCS
The Norwegian State has resolved that the Norwegian State's shares in Equinor and the SDFI's interest in NCS licences must be managed in accordance with a coordinated ownership strategy for the Norwegian State's oil and gas interests. Under this strategy, the Norwegian State has required Equinor to market the Norwegian State's oil and gas together with Equinor's own oil and gas as a single economic unit.
Pursuant to this coordinated ownership strategy, the Norwegian State requires Equinor, in its activities on the NCS, to take account of the Norwegian State's interests in all decisions that may affect the development and marketing of Equinor's own and the Norwegian State's oil and gas.
The Norwegian State directly held 67% of Equinor's ordinary shares as of 31 December 2018 and has effectively the power to influence the outcome of any vote of shareholders, including amending its articles of association and electing all non-employee members of the corporate assembly.
The corporate assembly is responsible for electing Equinor's board of directors. It also makes recommendations to the general meeting concerning the board of directors' proposals relating to the company's annual accounts, balance sheet, allocation of profit and coverage of loss. The interests of the Norwegian State in deciding these and other matters and the factors it considers when casting its votes, especially under the coordinated ownership strategy for the SDFI and Equinor's shares held by the Norwegian State, could be different from the interests of Equinor's other shareholders.
108 Equinor, Annual Report on Form 20-F 2018
If the Norwegian State's coordinated ownership strategy is not implemented and pursued in the future, then Equinor's mandate to continue to sell the Norwegian State's oil and gas together with its own oil and gas as a single economic unit is likely to be prejudiced. Loss of the mandate to sell the SDFI's oil and gas could have an adverse effect on Equinor's position in the markets in which it operates.
Risk management
Equinor activities carry risk, and risk management is therefore an integrated part of Equinor business operations. Equinor’s risk management includes identifying, analysing, evaluating and managing risk in all its activities in order to create value and avoiding incidents, always with Equinor’s best interest in mind.
In order to achieve optimal solutions Equinor bases its risk management on an enterprise risk management (ERM) approach where:
• focus is on the value impact for Equinor including upside and downside risk
• risk is managed in compliance with Equinor’s requirements with a strong focus on avoiding HSE and integrity-related incidents (such as accidents, fraud and corruption).
Risk is an integral part of any manager’s responsibility. In general, risk is managed in the business line, but some risks are managed at corporate level to ensure optimal solutions. This includes oil and natural gas price risks, interest and currency risks, risk dimension in the strategy work, prioritisation processes and capital structure discussions.
ERM involves using a holistic approach where correlations between risks and the natural hedges inherent in Equinor’s portfolio are considered. This approach allows Equinor to reduce the number of risk management transactions and avoid sub-optimisation. Some risks related to operations are partly insurable and insured via Equinor’s captive insurance company operating in the Norwegian and international insurance markets. Equinor also assesses oil and gas price hedging opportunities on a regular basis as a tool to increase financial robustness and strengthen flexibility.
Risk is integrated into the company’s Management Information System (IT tool) where Equinor’s purpose, vision and strategy are translated into strategic objectives, risks, actions and KPIs. This allows for aligning risk with strategic objectives and performance and make risk an embedded part of a holistic decision basis. Equinor’s risk management process is aligned with ISO31000 Risk management – principles and guidelines. A standardised process across Equinor allows for comparing risk on a like-for-like basis and support efficiency in decisions. The process seeks to ensure that risks are identified, analysed, evaluated and managed. In general, risk adjusting actions are subject to a cost benefit evaluation (except certain safety related risks which could be subject to specific regulations).
Equinor’s corporate risk committee, which is headed by the chief financial officer and includes representatives from the business areas, is responsible for defining, developing and reviewing Equinor's risk policies and methodology. The committee is also responsible for overseeing and developing Equinor's Enterprise Risk Management and proposing appropriate measures to adjust risk.
Equinor, Annual Report on Form 20-F 2018 109
2.12 Safety, security and sustainability |
Safety and security
”Always safe” is one of the three elements of Equinor’s strategy, and our ambition is to be a leader in safety and security in the energy industry. A comprehensive review of the performance and best practices from a broad set of companies was done in 2017 and 2018 to accelerate safety improvements. Four main areas for improvement are identified: safety visibility, leadership and behaviour, safety indicators and learning and follow-up.
Equinor is a member of a recently established international emergency management work group and has established an international agreement with selected peers regarding joint training and exercises to increase emergency response capability and competency.
As our international presence develops, Equinor is presented with different sets of security risks that we need to manage. (See also chapter 2.11). We continue to address these risks through a strengthened security culture and organisation which seeks to manage all security risks to people, assets and information. Building a stronger security culture is an important component of awareness development. In 2018 this was prioritised by promoting and reinforcing the company’s security rules which include business travel, protecting sensitive information, preventing unauthorised access, intervening and reporting incidents.
“ | In 2018, we experienced no major accidents or incidents with fatalities1. The total serious incident frequency including incidents with potential consequence, ended up at 0.5 incidents per million work hours in 2018, down from 0.6 in 2017. |
The total recordable injury frequency per million hours worked (TRIF) remained unchanged in 2018 compared to the 2017 result of 2.8.
We continued to see a reduction in the number of oil and gas leakages (with a leakage rate ≥ 0.1 kg per second) for the fourth consecutive year. The number of leakages decreased by 27% compared to 20172. This is the lowest number of leakages since 2012.
The number of oil spills per year and the corresponding total volumes increased from 2017 to 2018. In both years, close to 90% of the total number was spills with volume less than a barrel. The largest spill in 2018, a 70 m3 naphtha leak at the Mongstad refinery in Norway, accounts for about half of the total volume. The leak occurred during loading of naphtha from the refinery to a ship. The underlying causes were related to technical conditions, as well as understanding and implementation of work processes.
No serious well control incidents were recorded in 2018.

.
1 A sub-contractor employee died while working on a construction project. The authorities have not concluded on the cause of death in their investigation. However, the employing company has concluded that the fatality was not work related. In November 2018, the Norwegian Armed Forces’ frigate HNoMS Helge Ingstad and the tanker Sola TS collided close to the Sture terminal north of Bergen, Norway. Although Equinor was not directly involved in the collision, the incident that had a major accident potential is included in our statistics in accordance with current reporting boundaries
2 A 2017 incident has been reclassified in 2018 and the percentage reduction takes this into account.
110 Equinor, Annual Report on Form 20-F 2018
Health and work environment
A healthy work environment is important for people to perform and thrive, and to secure safe and efficient operations. The most significant risk factors related to the work environment are noise, ergonomics, chemical risk and psychosocial conditions. We systematically monitor trends related to sickness, and particularly work-related illness. Psychosocial risk factors are significant contributors to work-related illness, and as such these factors are actively managed. The annual global people survey is used to gather information from employees about their perception of the relevant risk factors. The average score for these issues showed a slight increase in 2018 compared to 2017, which indicates a healthier workforce and organisation. Our workforce is also exposed to risk factors such as noise and chemicals, and these areas are given attention in the improvement agenda.
We have seen a continuous decline in the number of work-related illness cases since 2014. Improvements in psychosocial factors such as e.g. work load, are the most important contributors to this positive development.
The 2018 sickness absence rate for Equinor ASA employees remained at the 2017 level of 4.6%.
Climate change
“ | Equinor supports the ambition set by the Paris Climate Agreement to limit the average global temperature rise to well below two degrees Celsius compared to pre-industrial levels by 2100. |
The strategy and climate roadmap form the basis for how we respond to climate-related risks and opportunities. The climate roadmap describes how we plan to create a low-carbon advantage by reducing emissions, grow new energy solutions and collaborate to amplify our impacts. The roadmap sets out ambitions, targets and an action plan towards 2030. (More information is available on Equinor.com). As part of this, we have embedded climate considerations into incentives, reporting and decision-making, and have targets in place to measure progress and incentivise performance across the entire company – starting at the top. CO2 intensity (upstream) is a key performance indicator and influences executive pay.
Equinor’s investment principles take climate into consideration. We require all potential projects to be assessed for carbon intensity and emission reduction opportunities, at every decision phase – from exploration and business development to project development and operations. We apply an internal carbon price of at least USD 55 per tonne of CO2 in investment analysis. In countries where the actual or predicted carbon price is higher than USD 55 per tonne of CO2, we apply the actual or expected cost, such as in Norway where both a CO2 tax and the EU Emission Trading System (EU ETS) apply.
To achieve the emission reduction target of 3 million tonnes of CO2 from 2017 to 2030, we pursue energy efficiency measures, electrification and other low-carbon energy sources at our installations. In 2018, we implemented several emission reduction measures, largely through better energy management, technical design and flaring reductions.
Methane is the second most important greenhouse gas contributing to human induced climate change. While gas releases significantly less CO2 than coal when combusted, methane emissions during production and distribution reduce this advantage. Minimising methane emissions is therefore essential. We have estimated methane intensity for the upstream and midstream part of the value chain which we control to be as low as approximately 0.03%. We aim to maintain this low methane intensity.
“ | In 2018, we maintained a carbon intensity of 9 kg CO2 per barrel of oil equivalent for our operated upstream production, in line with our 2020 target of 9 kg/boe. This is considerably lower than the industry average of 18 kg CO2 /boe. |
Equinor, Annual Report on Form 20-F 2018 111
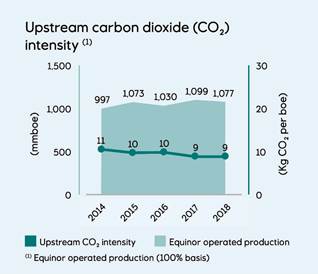
Scope 1 greenhouse gas emissions (GHG) were 14.9 million tonnes of CO2 equivalents (operated control basis). This is a decrease of around 3% compared to 2017. The reduction is mainly caused by reduced flaring levels at Hammerfest LNG and a power outage followed by a temporary shutdown at the onshore plant at Mongstad.
Equinor achieved 264,000 tonnes of CO2 emission reductions in 2018, mainly due to many smaller energy efficiency projects. So far, we have achieved around 0.6 million of the 2030 target of 3 million tonnes[3].
Equinor’s 2018 flaring intensity was around 0.2% of hydrocarbons produced, aligned with the 2020 target (operated control). This is significantly lower than the industry average of 1.2%[4]. Still, the upstream flaring intensity in Equinor increased from 2.1 to 2.4 tonnes/1000 tonnes compared to 2017. The increase in upstream hydrocarbon flared intensity is mainly caused by flaring increase at Bakken due to pipeline capacity constraints.
Equinor believes that our oil and gas competence can be leveraged to create business opportunities within new energy solutions. 2018 Equinor’s equity renewable energy production was 1.25 TWh, more than 50% increase compared to 2017.
Equinor’s low carbon and energy efficiency R&D projects[5] represented a share of 21% of the total R&D expenditure, an increase from 18% in 2017.
Climate-related risk and disclosure: The Task Force on Climate-related Financial Disclosures
‘Equinor’s climate roadmap serves to enhance disclosure on climate-related business risks, in line with the recommendations put forward by the Financial Stability Board’s Task Force on Climate-related Financial Disclosure (TCFD), which is supported by Equinor.
During 2018 we have supported the implementation of the TCFD recommendations to drive convergence of disclosure practices across the industry. We joined the TCFD Oil and Gas Preparer Forum in 2017, to identify efficient and feasible ways to implement the recommendations. The Forum’s report was launched in 2018. Throughout 2018, we also prepared a joint case study on TCFD implementation together with asset manager Storebrand and the UN Principles for Responsible Investment (PRI). Equinor’s TCFD reference index for 2018 may be found in the appendix section in our sustainability report.
In 2018, we tested our portfolio against the three scenarios, i.e. the Current Policies, New Policies and Sustainable Development scenarios, in the World Energy Outlook 2018 report from the International Energy Agency. More information about the portfolio stress test is available in Equinor ASA’s 2018 Sustainability Report.
[3] Equinor aims to achieve by 2030 annual CO2 emissions that are 3 million tonnes less than they would have been, had no reduction measures been implemented between 2017 and 2030.
[4] The International Association of Oil and Gas Producers (IOGP) in their Environmental Performance Indicators report 2018.
[5] Includes energy efficiency projects and projects with energy efficiency as a secondary effect.
112 Equinor, Annual Report on Form 20-F 2018
“ | In 2018, Equinor was rated as the oil and gas company most prepared for energy transition by CDP in their report “Beyond the cycle”. |
Climate-related risks and opportunities and strategic response to these are discussed frequently by the corporate executive committee and board of directors. In 2018, the board of directors specifically discussed climate-related issues in four of eight meetings, and in relation to relevant investment decisions. The board of directors’ safety, sustainability and ethics committee discussed climate-related issues in all committee meetings in 2018.
A detailed overview of climate-related risk factors is provided in section 2.11 Risk review under Risk Factors in this report. .
Stakeholder engagement and collaboration
Climate change is complex and requires global and cross sector cooperation. Equinor is committed to working with suppliers, customers, governments and peers to find innovative and commercially viable ways to reduce emissions across the oil and gas value chain. We are members of the CEO-led Oil and Gas Climate Initiative (OGCI). Through participation in the government-led Climate and Clean Air Coalition’s Oil and Gas Methane Partnership we continued efforts to systematically address methane emissions and report on annual progress.
We work with governments and other organisations to support climate and energy policies that encourage fuel switching from coal to gas, growth in renewables, the deployment of carbon capture usage and storage and other low carbon solutions, and efficient production, distribution and use of energy globally. We have also teamed up with global peers through OGCI to help shape the industry’s climate response.
Through the World Bank led Carbon Pricing Leadership Coalition and our membership in the International Emission Trading Association we continued advocacy for a price on carbon during 2018. Equinor is an endorser of the World Bank Global Gas Flaring Reduction Partnership and we have made a commitment to contribute to stopping routine flaring by 2030 through the World Bank Zero Routine Flaring by 2030 initiative.
In 2018, Equinor announced that we are ready to invest in the protection of tropical forest as soon as a well-functioning jurisdictional forest carbon market is in place for the private sector. The investments will be a supplement to our climate roadmap. Over time, we plan to invest in reduced deforestation corresponding to the emissions (operated) not covered by any CO2 price, aligned with strong support for a global price on carbon. Protecting and restoring forests and lands is an effective global climate measure which also contributes to preserving biodiversity and livelihood for local communities, aligned with the UN Sustainable Development Goals.
Environmental impact and resource efficiency
Equinor is committed to using resources efficiently and the responsible management of waste, emissions to air and impacts on biodiversity and ecosystems. This reduces the impact on the local environment and can also save costs.
During 2018 we focused attention on:
· Improved management of produced and processed water and chemicals for operations in Norway
· Minimising the use and disposal of water in US onshore operations
· Strengthening efforts on sustainable management of the oceans and becoming a patron of the UN Global Compact Platform for Sustainable Ocean Business
· Assessing and managing impacts and protecting biodiversity when preparing for new exploration and development activities, including the exploration drilling campaign in the Barents Sea
· Continued development, testing and application of new sensor technologies for environmental surveillance
Equinor’s SOx and NOx emissions increased by about 5% in 2018 compared to 2017, mainly due to a higher level of drilling and well activities. Discharges of oil to water decreased from 1,200 tonnes in 2017 to 1,100 tonnes in 2018, mainly due to improved water treatment performance after turnarounds.
Freshwater withdrawal increased to 16 million cubic metres in 2018 mainly due to a more water-intense fracking method being used in the shale gas segment. In addition, increased well activity in the tight oil segment and increased use of water for cleaning of tanks and pressure testing of pipelines at refineries contributed to the increase. Most of Equinor’s operations are offshore or in areas of abundant water availability. However, the main part of the Eagle Ford asset and a smaller part of the Bakken asset onshore US are located in areas with high or extremely high water stress, according to the baseline water stress indicator defined by the World Resources Institute Aqueduct® tool. Production in Eagle Ford and from the relevant well clusters in the Bakken constituted 2.1% of operated oil and gas production in 2018.
Regarding biodiversity, Equinor did not have operations in protected areas in 2018. Six subsea pipelines operated by us are adjacent to protected areas on islands in Norway. In normal operations there will be no interaction between the pipelines and the protected areas.
Equinor, Annual Report on Form 20-F 2018 113
Hazardous waste quantities continued to decrease as large process water volumes from Norwegian offshore fields are
remediated at our facilities rather than being shipped to external contractors as waste. There has also been a decrease in non-hazardous waste, which is associated with disposal of polluted soil at Kalundborg in 2017. The volume of drill cuttings from US onhore operations, classified as exempt waste, decreased significantly in 2018. Large volumes of cuttings that were previously dried up on site and disposed of as solids, are now disposed of as liquids and included in produced water and flowback waste.
Working with suppliers
Equinor is committed to using suppliers who operate in accordance with our values and who maintain high standards of safety, security and sustainability. These aspects are incorporated in all phases of the procurement process.
Understanding high-risk areas of the supply chains has been a focus area for 2018. We have developed new approaches to how we assess risk, raise awareness, and conduct site inspections and supplier verifications, including how we address findings.
In 2018, Equinor, BP, Shell and Total established a joint initiative to create a collaborative industry approach to human rights supplier assessments. The purpose is to align expectations to suppliers and to establish a mechanism for sharing assessments. This will allow suppliers to be more efficient in their demonstration of respect for human rights and at the same time support the human rights efforts of the companies.
During 2018, we conducted the highest number of supplier verifications performed during an annual cycle to date, covering select suppliers in our first and second tier supply chain identified as being particularly exposed to potential breaches of workers’ human rights. Throughout the year we conducted 75 supplier verifications, interviewing more than 1,000 workers.
Human rights
The safety of employees and others affected by our operations, including workers of contractors, are at the heart of Equinor’s business. The strategic commitment to always safe also translates into an expectation to respect the internationally recognised human rights of people affected by our operations. Since human rights are under increasing pressure across the world, we recognise that Equinor’s commitment to respect human rights becomes increasingly important.
Equinor’s human rights policy has been created to be consistent with the United Nations Guiding Principles on Business and Human Rights (the UNGPs). The policy addresses the most relevant human rights issues pertaining to our operations and role as an employer, business partner and buyer, and to our presence in local communities. We express commitment to provide a safe, healthy and secure working environment, and to treat them and those impacted by our operations fairly and without discrimination.
Implementing and adhering to our human rights policy is a journey of continuous improvement. The process is overseen by Equinor’s corporate human rights steering committee, which reports bi-annually to the corporate executive committee and the board of directors’ safety, security and ethics committee.
Implementation activities in 2018 included:
· Human rights risk assessments – we introduced human rights as a risk in our risk management framework. The approach assesses the risk to individuals, where the risk levels are based on the severity criteria set forth in the UNGPs. We expect that this tool will strengthen the ability to identify potential human rights effects of our operations and business partners’ conduct.
· Awareness raising and training – during 2018, we saw an increased focus in the company around human rights. We have delivered awareness sessions reaching more than 500 prioritised employees and leaders.
· Human rights in supply chain training, which includes modern slavery aspects, continued and more than 500 employees were trained. In addition to all contract owners, it is now requested that all employees responsible for establishing contracts exceeding NOK 10 million complete this training.
Impact assessments are important to understand projects’ impact on nearby communities and environment. Completed assessments can be found on Equinor’s website. Ongoing assessments include the Norwegian CCS project, due for consultation in the summer 2019, and ripple effect studies which will be completed for Gina Krog in 2019 and Aasta Hansteen in 2020.
Other consultations with affected people include exploration activities in the Great Australian Bight, Australia. Since becoming the operator of exploration permit EPP39, Equinor has met with stakeholders across Western Australia, South Australia, Victoria, Tasmania and New South Wales. Equinor has conducted over 100 meetings with more than 60 organisations including local, state and national governments, fisheries, communities and Aboriginal representatives. Equinor has committed to publish the draft environmental plan for the first exploration well for public commenting.
During 2018, Equinor conducted a company-wide review of progress on implementing the human rights policy. The review resulted in the establishment of a corporate project with the aim of strengthening human rights capabilities and due diligence processes in the company.
Transparency, ethics and anti-corruption
With a global footprint and new business development opportunities constantly being evaluated, 2018 represented a year of continued focus on ethics and anti-corruption. Equinor has a zero-tolerance policy towards all forms of corruption, a policy which is embedded across the
114 Equinor, Annual Report on Form 20-F 2018
company through our values, code of conduct and anti-corruption compliance programme. The anti-corruption compliance programme manual summarises the standards, requirements and procedures implemented to comply with applicable laws and regulations and maintaining high ethical standards. We work with partners and suppliers to ensure that ethics and anti-corruption is embedded in business relationships.
Equinor provides regular training across the organisation to build awareness and understanding of the code of conduct and anti-corruption compliance programme. In addition to in-person workshops, we have a mandatory Code of Conduct e-learning.
The Code of Conduct imposes a duty to report possible violations of the Code or other unethical conduct. We require leaders to take their control responsibilities seriously to prevent, detect and respond to ethical issues. Employees are encouraged to discuss concerns with their immediate supervisor or other leader, or use internal channels which are available to provide support. Concerns may also be reported through the Ethics Helpline which is available 24 hours a day for two-way communication. The helpline allows for anonymous reporting and is open to employees, business partners and the general public. Equinor has a strict non-retaliation policy for anyone who reports in good faith. The number of cases received through the Ethics Helpline increased from 107 in 2017 to 182 in 2018. A contributing factor to the increase could be the promotion of the Ethics Helpline through training and communication efforts during 2018. We also experienced an increase in cases regarding suppliers. The cases received included 68 reported concerns relating to harassment, discrimination and personal misconduct.
We believe that through disclosure of payments to governments we promote accountability and build trust in the societies where we operate. We have reported payments to governments on a country-by-country basis for more than a decade. Since 2014, we have reported such payments on a project-by-project and legal entities basis. This reporting represents a core element of transparent corporate tax disclosure. In 2018, we published a global tax strategy, available on Equinor’s website. These disclosures are in line with our commitment to conduct business activities in a transparent way.
In 2018, we updated the anti-corruption compliance manual to reflect our evolving compliance programme. We maintain a global network of compliance officers responsible for ensuring that ethical and anti-corruption considerations are integrated into Equinor activities no matter where they take place.
We continued working to improve the implementation of the Employee Fraud Prevention Programme in the organisation. Discussions were held in the ethics committees of all business areas during 2018, focusing on fraud risk awareness and the organisation’s role in maintaining a sound business culture, to combat employee fraud.
In 2018 we continued to raise awareness of the Ethics Helpline through training. To encourage continued use of the helpline, we are reviewing the reporting and processing of concerns, to ensure confidence in the Ethics Helpline is maintained. The number and types of cases from the Ethics Helpline are reported quarterly to the board of directors.
Equinor believes in the value of collective action to actively promote anti-corruption and transparency. Equinor has long standing relationships with the UN Global Compact Anti-Corruption Working Group, the World Economic Forum’s Partnering Against Corruption Initiative, the Extractives Industries Transparency Initiative (EITI), Transparency International and Transparency International Norway. In 2018, we were present in ten EITI-implementing countries: Colombia, Germany, Indonesia, Mexico, the Netherlands, Nigeria, Norway, Suriname, Tanzania and the UK. In Norway, we actively took part in the national EITI multi-stakeholder group. We provided USD 60,000 in financial support to the international EITI and USD 5,000 towards the beneficial ownership conference in Jakarta.
Equinor, Annual Report on Form 20-F 2018 115
In Equinor we work together to shape the future of energy in a partnership between the organisation and the individual. We all apply our skills and personal commitment to help Equinor towards achieving our vision.
Equinor aims to offer challenging and meaningful job opportunities that attract and retain the right people. Through our engagement, creativity and collaboration, we aim to build a better Equinor for tomorrow.
“ | We are committed to creating a caring and collaborative working environment, promoting diversity, inclusion and equal opportunities for all employees. |
Our actions: Developing our people
A key part of our people and leadership strategy is to increase the level of flexibility by encouraging employees to move across business areas and the value chain. This enables the company to leverage existing experience in new business areas and use resources more effectively. Through the internal job market, we provide opportunities for deployment and learning.
We focus on continuous feedback and ongoing development that leverages individual’s strengths. In 2018, we provided tools, leadership training and internal communication campaigns to further build a values-based performance culture.
The Digital Academy
Equinor University consists of a group of specialised academies delivering learning that is designed to enhance safety, secure Equinor’s core competence, and build new competence for the future. As part of this, a digital academy was established in 2018, offering relevant courses and training. Many of the courses are offered as webinars to reach our global workforce.
“ | By the end of 2018, a total of 28,000 digital trainings were registered across the company from 50 different digital courses and activities including Digital Basics for All, Build your Expertise and Digital for Leaders. |
Digital market sessions (½ day events) have been arranged in main locations, gathering more than 1,000 participants to learn about Equinor’s digital roadmap.
The academy is also enhancing its offerings to build more specialised digital competence within data science, programming, machine learning and artificial intelligence to complement existing technical expertise. Several thousand employees have participated in these offerings.
116 Equinor, Annual Report on Form 20-F 2018
Permanent employees and percentage of women in the Equinor group | | | |
| | | | | | |
| Number of employees | Women |
Geographical region | 2018 | 2017 | 2016 | 2018 | 2017 | 2016 |
| | | | | | |
Norway | 17,762 | 17,632 | 18,034 | 31% | 30% | 30% |
Rest of Europe | 978 | 947 | 838 | 25% | 25% | 28% |
Africa | 79 | 78 | 78 | 38% | 37% | 36% |
Asia | 75 | 69 | 73 | 53% | 52% | 59% |
North America | 1,191 | 1,174 | 1,230 | 32% | 33% | 35% |
South America | 439 | 345 | 286 | 32% | 35% | 37% |
Australia | 1 | - | - | 0% | 0% | 0% |
| | | | | | |
Total | 20,525 | 20,245 | 20,539 | 31% | 30% | 31% |
| | | | | | |
Non-OECD | 701 | 599 | 541 | 35% | 37% | 40% |
Total workforce by region, employment type and new hires in the Equinor group in 2018 |
| | | | | | | |
Geographical region | Permanent employees | Consultants | Total workforce1) | Consultants (%) | Part time (%) | New hires |
| | | | | | | |
Norway | 17,762 | 897 | 18,659 | 5% | 3% | 547 |
Rest of Europe | 978 | 80 | 1,058 | 8% | 2% | 82 |
Africa | 79 | 2 | 81 | 2% | 0% | 3 |
Asia | 75 | 4 | 79 | 5% | 0% | 9 |
North America | 1,191 | 156 | 1,347 | 12% | 0% | 145 |
South America | 439 | 2 | 441 | 0% | 0% | 119 |
Australia | 1 | - | 1 | 0% | 0% | 0 |
| | | | | | | |
Total | 20,525 | 1,141 | 21,666 | 5% | 3% | 905 |
| | | | | | | |
Non-OECD | 701 | 8 | 709 | 1% | NA | 141 |
| | | | | | | |
1) | Contractor personnel, defined as third-party service providers who work at our onshore and offshore operations, are not included. These were roughly estimated to be 36,006 in 2018. |
Equinor, Annual Report on Form 20-F 2018 117
Employees in Equinor
The Equinor group employs 20,525 employees. Of these, 17,762 are employed in Norway and 2,763 outside Norway.
Equinor works systematically to build a diverse workforce by attracting, recruiting, developing and retaining people from many different backgrounds across all types of positions. In 2018, 20% of employees and 24% of our managerial staff held nationalities other than Norwegian. Outside Norway, Equinor aims to increase the number of employees and managers who are locally recruited and to reduce the long-term use of expats in business operations. In 2018, 49% of new hires in Equinor held nationalities other than Norwegian and 32% were women.
People performance data relates to permanent employees in our direct employment. Equinor defines consultants as contracted personnel that are mainly based in our offices. Temporary employees and contractor personnel, defined as third party service providers to onshore and offshore operations, are not included in the table. These were roughly estimated to be 36,006 in 2018. The information about people policies applies to Equinor ASA and its subsidiaries.
Attracting new talent
In 2018, we continued to systematically position Equinor as an attractive employer and to attract more diverse competence profiles, including digital skills and renewables skills. Throughout 2018 we increased presence at career fairs, in schools and at universities. We also strengthened entry level talent programmes, such as the graduate programme and intake of apprentices. Equinor’s recruitment of graduates increased from 69 in 2017 to 153 in 2018. We also increased intake of apprentices, and in 2018 we accepted 165 apprentices, including the first apprentices within offshore wind. The number of apprentices being offered permanent employment after concluding their apprenticeship in 2018 increased. In recruitment of graduates specifically, Equinor has set an ambition to achieve a 50-50 balance on gender and international background in 2019.
Equal opportunities
Workforce diversity and inclusion
“ | “We aspire to be an inclusive workplace where all individuals can share their perspectives, be themselves, develop and thrive in a safe working environment. This includes working actively to ensure that everyone has equal opportunities at Equinor. |
During 2018, we continued to focus on strengthening the diversity in Equinor- emphasising genders, experience, competence, age, education, ethnicity, sexual orientation and disabilities – everything that helps shape our thoughts and perspectives We monitor diversity in our workforce, at all levels and locations. Equinor developed a team diversity index and an inclusion index that make up the diversity and inclusiveness KPI. The KPI is expected to be implemented during 2019.
We work towards eliminating biases in recruitment and deployment and launched unconscious bias training in 2018. The corporate executive committee and their leadership teams attended this training in 2018. The plan for 2019 is to train all leadership teams throughout the organisation.
118 Equinor, Annual Report on Form 20-F 2018
Another focus area has been to increase awareness around sexual harassment. In 2018, training sessions were conducted for leaders within the People and leadership function, to enable them to facilitate awareness discussions across the organisation. In addition, this topic has been addressed in internal communications. Sexual harassment is in breach with Equinor’s code of conduct and is not tolerated.
Women in our workforce
We aim to enhance gender diversity in all leadership activities such as talent and succession reviews, leadership assessments, leadership development courses and top tier leadership deployment. We pay close attention to male-dominated positions and discipline areas.
Global parental leave
A global parental leave policy will be effective from January 2019. Consistent with our values and to strengthen the employer brand and attractiveness, a minimum of 16 weeks paid leave will be given to all employees in the group. The parental leave benefit will be combined with any entitlements from social security/ insurance schemes or equivalent in the employment country. We believe that introducing this benefit for all employees becoming parents through birth or adoption supports our agenda on diversity and inclusion.
Health insurance
In 2018, we introduced a health insurance scheme for all employees in Equinor ASA, effective from January 2019, to supplement public health services. The insurance offers access to private specialists, medical examinations and treatments, and is similar to local health insurance already provided in other subsidiaries. We expect the scheme to have a positive impact on sick leave frequency and enhance our position as an attractive employer.
Unions and employee representatives
Employee relations
We believe in involving our people in the development of the company. In all countries we are present we involve employees and/or their appropriate representatives according to local laws and practices. This varies from formal bodies with employee representatives to employee engagement and involvement through team or townhall meetings.
In our European Works Council, we conducted two meetings, where strategic matters, such as Equinor´s strategy, safety improvement work and digitalisation were high on the agenda.
In Norway, the formal basis for collaboration with labour unions is established in the Basic Agreements between the Confederation of Norwegian Enterprise (NHO) and the corresponding respective national labour confederations (unions). We have local collective wage agreements with five trade unions in Equinor ASA.
In 2018, we maintained close cooperation with employee representatives in Norway. In November we held a collaboration conference, in which members of our works councils were invited to participate.
Equinor promotes good employee and industrial relations practices through various networks and forums, including IndustriALL Global Union.
Equinor, Annual Report on Form 20-F 2018 119
3 Corporate governance
120 Equinor, Annual Report on Form 20-F 2018
3.1 Introduction
Articles of association
Equinor's current articles of association were adopted at the annual general meeting of shareholders on 15 May 2018.
Summary of Equinor’s articles of association:
Name of the company
The registered name is Equinor ASA. Equinor is a Norwegian public limited company.
Registered office
Equinor’s registered office is in Stavanger, Norway, registered with the Norwegian Register of Business Enterprises under number 923 609 016.
Objective of the company
The objective of Equinor is, either by itself or through participation in or together with other companies, to engage in the exploration, production, transportation, refining and marketing of petroleum and petroleum-derived products, and other forms of energy, as well as other business.
Share capital
Equinor’s share capital is NOK 8,346,653,047.50 divided into 3,338,661,219 ordinary shares.
Nominal value of shares
The nominal value of each ordinary share is NOK 2.50.
Board of directors
Equinor’s articles of association provide that the board of directors shall consist of nine to 11 directors. The board, including the chair and the deputy chair, shall be elected by the corporate assembly for a period of up to two years.
Corporate assembly
Equinor has a corporate assembly comprising 18 members who are normally elected for a term of two years. The general meeting elects 12 members with four deputy members, and six members with deputy members are elected by and among the employees.
General meetings of shareholders
Equinor’s annual general meeting is held no later than 30 June each year. The meeting will consider the annual report and accounts, including the distribution of any dividend and any other matters required by law or the articles of association.
Documents relating to matters to be dealt with at general meetings do not need to be sent to all shareholders if the documents are accessible on Equinor’s website. A shareholder may nevertheless request that such documents be sent to him/her.
Shareholders may vote in writing, including through electronic communication, for a period before the general meeting. In order to practise advance voting, the board of directors must stipulate applicable guidelines. Equinor's board of directors adopted guidelines for such advance voting in March 2012, and these guidelines are described in the notices of the annual general meetings.
Marketing of petroleum on behalf of the Norwegian State
Equinor’s articles of association provide that Equinor is responsible for marketing and selling petroleum produced under the SDFI's shares in production licences on the Norwegian continental shelf as well as petroleum received by the Norwegian State paid as royalty together with its own production. Equinor’s general meeting adopted an instruction in respect of such marketing on 25 May 2001, as most recently amended by authorisation of the annual general meeting on 15 May 2018.
Nomination committee
The tasks of the nomination committee are to make recommendations to the general meeting for the election of shareholder-elected members and deputy members of the corporate assembly, the remuneration of members of the corporate assembly, the election and remuneration of the nomination committee, and to make recommendations to the corporate assembly for the election of shareholder-elected members of the board of directors and remuneration of the members of the board of directors and the election of the chair and deputy chair of the corporate assembly. The general meeting may adopt instructions for the nomination committee.
Equinor, Annual Report on Form 20-F 2018 121
Code of Conduct
Ethics – Equinor’s approach
Equinor believes that responsible and ethical behaviour is a necessary condition for a sustainable business. Equinor’s Code of Conduct is based on its values and reflects Equinor’s commitment to high ethical standards in all its activities.
Our Code of Conduct
The Code of Conduct describes Equinor’s code of business practice and the requirements to expected behaviour in areas such as anti-corruption, fair competition, human rights and non-discriminating working environments with equal opportunities. The Code of Conduct applies to Equinor’s board members, employees and hired personnel. It is divided into five main categories: The Equinor way, Respecting our people, Conducting our operations, Relating to our business partners and Working with our communities.
The Code of Conduct is approved by the board of directors.
Equinor seeks to work with others who share its commitment to ethics and compliance, and Equinor manages its risks through in-depth knowledge of suppliers, business partners and markets. Equinor expects its suppliers and business partners to comply with applicable laws, respect internationally recognised human rights and adhere to ethical standards which are consistent with Equinor’s ethical requirements when working for or together with Equinor. In joint ventures and entities where Equinor does not have control, Equinor makes good faith efforts to encourage the adoption of ethics and anti-corruption policies and procedures that are consistent with its standards. Equinor will not tolerate any breaches of the Code of Conduct. Remedial measures may include termination of employment and reporting to relevant authorities.
In 2018, the Code of Conduct Section 3.6. Financial and Business Records and Reporting was changed to underline that if persons covered by the Code of Conduct suspect or become aware of any improper financial and business records and reporting or allegations of such, this must be reported to their leader or the Ethics Helpline immediately.
Training and Certifying the Code of Conduct
The Code of Conduct training and comprehensive trainings on specific issues, including anti-corruption, anti-trust and reporting, is carried out to explain how the Code of Conduct applies and to describe the tools that Equinor has made available to address risk. The Code of Conduct e-learning is mandatory for all Equinor employees and hired contractors.
All Equinor employees have to annually confirm electronically that they understand and will comply with the Code of Conduct (Code certification). The Code certification reminds the individuals of their duty to comply with Equinor’s values and ethical requirements and creates an environment with open dialogue on ethical issues, both internally and externally.
Anti-corruption compliance programme
Equinor is against all forms of corruption including bribery, facilitation payments and trading in influence and has a company-wide anti-corruption compliance programme which implements its zero-tolerance policy. The programme includes mandatory procedures designed to comply with applicable laws and regulations and guidance and training on relevant topics such as gifts, hospitality and conflicts of interest. A global network of compliance officers, who support the integration of ethics and anti-corruption considerations into Equinor’s business activities, constitute an important part of the programme.
In 2018, the Equinor Anti-Corruption Compliance Manual was updated to reflect Equinor’s evolving compliance programme. Equinor continues to maintain its global network of compliance officers responsible for supporting the business to ensure that ethical and anti-corruption considerations are integrated into Equinor’s activities no matter where they take place. Equinor continues to work with its partners and suppliers on ethics and anti-corruption and has initiated dialogue with several partners on the risks that we jointly face and actions that can be taken to address them.
The Equinor Joint Venture Anti-Corruption Compliance Programme was updated in 2018 to strengthen Equinor’s management of third-party corruption risk in non-operated joint ventures. The updated programme includes revised working requirements, in-depth guidelines and tools for everyday follow-up.
Speak Up
Equinor is committed to maintain an open dialogue on ethical issues. The Code of Conduct requires those who suspect a violation of the Code of Conduct or other unethical conduct to raise their concern. Employees are encouraged to discuss concerns with their leader. Equinor recognises that raising a concern is not always easy so there are several internal channels for taking concerns forward, including through human resources or the ethics and compliance function in the legal department. Concerns can also be raised through the externally operated Ethics Helpline which is available 24/7 and allows for anonymous reporting and two-way communication. Equinor has a non-retaliation policy for anyone who raises an ethical or legal concern in good faith.
More information about Equinor’s policies and requirements related to the Code of Conduct is available on www.equinor.com/ethics.
122 Equinor, Annual Report on Form 20-F 2018
Compliance with NYSE listing rules
Equinor's primary listing is on the Oslo Børs, but Equinor is also registered as a foreign private issuer with the US Securities and Exchange Commission and listed on the New York Stock Exchange.
American Depositary Receipts represent the company's ordinary shares listed on the New York Stock Exchange (NYSE). While Equinor's corporate governance practices follow the requirements of Norwegian law, Equinor is also subject to the NYSE's listing rules.
As a foreign private issuer, Equinor is exempted from most of the NYSE corporate governance standards that domestic US companies must comply with. However, Equinor is required to disclose any significant ways in which its corporate governance practices differ from those applicable to domestic US companies under the NYSE rules. A statement of differences is set out below:
Corporate governance guidelines
The NYSE rules require domestic US companies to adopt and disclose corporate governance guidelines. Equinor's corporate governance principles are developed by the management and the board of directors, in accordance with the Norwegian Code of Practice for Corporate Governance and applicable law. Oversight of the board of directors and management is exercised by the corporate assembly.
Director independence
The NYSE rules require domestic US companies to have a majority of "independent directors". The NYSE definition of an "independent director" sets out five specific tests of independence and also requires an affirmative determination by the board of directors that the director has no material relationship with the company.
Pursuant to Norwegian company law, Equinor's board of directors consists of members elected by shareholders and employees. Equinor's board of directors has determined that, in its judgment, all of the shareholder-elected directors are independent. In making its determinations of independence, the board focuses inter alia on there not being any conflicts of interest between shareholders, the board of directors and the company's management. It does not strictly make its determination based on the NYSE's five specific tests, but takes into consideration all relevant circumstances which may in the board’s view affect the directors’ independence. The directors elected from among Equinor's employees would not be considered independent under the NYSE rules because they are employees of Equinor. None of the employee-elected directors are an executive officer of the company.
For further information about the board of directors, see 3.8 Corporate assembly, board of directors and management.
Board committees
Pursuant to Norwegian company law, managing the company is the responsibility of the board of directors. Equinor has an audit committee, a safety, sustainability and ethics committee and a compensation and executive development committee. They are responsible for preparing certain matters for the board of directors. The audit committee and the compensation and executive development committee operate pursuant to charters that are broadly comparable to the form required by the NYSE rules. They report on a regular basis to, and are subject to, oversight by the board of directors. For further information about the board’s sub-committees, see 3.9 The work of the board of directors.
Equinor complies with the NYSE rule regarding the obligation to have an audit committee that meets the requirements of Rule 10A-3 of the US Securities Exchange Act of 1934.
The members of Equinor's audit committee include an employee-elected director. Equinor relies on the exemption provided for in Rule 10A-3(b)(1)(iv)(C) from the independence requirements of the US Securities Exchange Act of 1934 with respect to the employee-elected director. Equinor does not believe that its reliance on this exemption will materially adversely affect the ability of the audit committee to act independently or to satisfy the other requirements of Rule 10A-3 relating to audit committees. The other members of the audit committee meet the independence requirements under Rule 10A-3.
Among other things, the audit committee evaluates the qualifications and independence of the company's external auditor. However, in accordance with Norwegian law, the auditor is elected by the annual general meeting of the company's shareholders.
Equinor does not have a nominating/corporate governance sub-committee formed from its board of directors. Instead, the roles prescribed for a nominating/corporate governance committee under the NYSE rules are principally carried out by the corporate assembly and the nomination committee which are elected by the general meeting of shareholders. NYSE rules require the compensation committee of US companies to comprise independent directors under the NYSE rules, recommend senior management remuneration and make a determination on the independence of advisors when engaging them. Equinor, as foreign private issuer, is exempt from complying with these rules and is permitted to follow its home country regulations. Equinor considers all its compensation
Equinor, Annual Report on Form 20-F 2018 123
committee members to be independent (under Equinor’s framework which, as discussed above, is not identical to that of NYSE). Equinor's compensation committee makes recommendations to the board about management remuneration, including that of the CEO. The compensation committee assesses its own performance and has the authority to hire external advisors. The nomination committee, which is elected by the general meeting of shareholders, recommends to the corporate assembly the candidates and remuneration of the board of directors. The nomination committee also recommends to the general meeting of shareholders the candidates and remuneration of the corporate assembly and the nomination committee.
Shareholder approval of equity compensation plans
The NYSE rules require that, with limited exemptions, all equity compensation plans must be subject to a shareholder vote. Under Norwegian company law, although the issuance of shares and authority to buy back company shares must be approved by Equinor's annual general meeting of shareholders, the approval of equity compensation plans is normally reserved for the board of directors.
3.2 General meeting of shareholders
The general meeting of shareholders is Equinor’s supreme corporate body. It serves as a democratic and effective forum for interaction between the company’s shareholders, board of directors and management.
The next annual general meeting (AGM) is scheduled for 15 May 2019 in Stavanger, Norway, with simultaneous transmission by webcast through our website. The AGM is conducted in Norwegian, with simultaneous English translation during the webcast. At Equinor's AGM on 15 May 2018, 75.70% of the share capital was represented either by advance voting, in person or by proxy.
The main framework for convening and holding Equinor's AGM is as follows:
Pursuant to Equinor’s articles of association, the AGM must be held by the end of June each year. Notice of the meeting and documents relating to the AGM are published on Equinor's website and notice is sent to all shareholders with known addresses at least 21 days prior to the meeting. All shareholders who are registered in the Norwegian Central Securities Depository (VPS) will receive an invitation to the AGM. Other documents relating to Equinor's AGMs will be made available on Equinor's website. A shareholder may nevertheless request that documents that relate to matters to be dealt with at the AGM be sent to him/her.
Shareholders are entitled to have their proposals dealt with at the AGM if the proposal has been submitted in writing to the board of directors in sufficient time to enable it to be included in the notice of meeting, i.e. no later than 28 days before the meeting. Shareholders who are unable to attend may vote by proxy.
As described in the notice of the general meeting, shareholders may vote in writing, including through electronic communication, for a period before the general meeting.
The AGM is normally opened and chaired by the chair of the corporate assembly. If there is a dispute concerning individual matters and the chair of the corporate assembly belongs to one of the disputing parties or is for some other reason not perceived as being impartial, another person will be appointed to chair the AGM. This is in order to ensure impartiality in relation to the matters to be considered. As Equinor has a large number of shareholders with a wide geographic distribution, Equinor offers shareholders the opportunity to follow the AGM by webcast.
The following matters are decided at the AGM:
· Approval of the board of directors' report, the financial statements and any dividend proposed by the board of directors and recommended by the corporate assembly
· Election of the shareholders' representatives to the corporate assembly and approval of the corporate assembly's fees
· Election of the nomination committee and approval of the nomination committee's fees
· Election of the external auditor and approval of the auditor's fee
· Any other matters listed in the notice convening the AGM
All shares carry an equal right to vote at general meetings. Resolutions at general meetings are normally passed by simple majority. However, Norwegian company law requires a qualified majority for certain resolutions, including resolutions to waive preferential rights in connection with any share issue, approval of a merger or demerger, amendment of the articles of association or authorisation to increase or reduce the share capital. Such matters require the approval of at least two-thirds of the aggregate number of votes cast as well as two-thirds of the share capital represented at the general meeting.
If shares are registered by a nominee in the Norwegian Central Securities Depository (VPS), cf. section 4-10 of the Norwegian Public Limited Liability Companies Act, and the beneficial shareholder wants to vote for their shares, the beneficial shareholder must re-register the shares in a separate VPS account in their own name prior to the general meeting. If the holder can prove that such steps have been taken and that the holder has a de facto shareholder interest in the company, the company will allow the shareholder to vote for the shares. Decisions regarding voting rights for shareholders and proxy holders are made by the person opening the meeting, whose decisions may be reversed by the general meeting by simple majority vote.
124 Equinor, Annual Report on Form 20-F 2018
The minutes of the AGM are made available on Equinor’s website immediately after the AGM.
As regards to extraordinary general meetings (EGM), an EGM will be held in order to consider and decide a specific matter if demanded by the corporate assembly, the chair of the corporate assembly, the auditor or shareholders representing at least 5% of the share capital. The board must ensure that an EGM is held within a month of such demand being submitted.
In the following, certain types of resolutions by the general meeting of shareholders are outlined:
New share issues
If Equinor issues any new shares, including bonus shares, the articles of association must be amended. This requires the same majority as other amendments to the articles of association. In addition, under Norwegian law, the shareholders have a preferential right to subscribe for new shares issued by Equinor. The preferential right to subscribe for an issue may be waived by a resolution of a general meeting passed by the same percentage majority as required to approve amendments to the articles of association. The general meeting may, with a majority as described above, authorise the board of directors to issue new shares, and to waive the preferential rights of shareholders in connection with such share issues. Such authorisation may be effective for a maximum of two years, and the par value of the shares to be issued may not exceed 50% of the nominal share capital when the authorisation was granted.
The issuing of shares through the exercise of preferential rights to holders who are citizens or residents of the US may require Equinor to file a registration statement in the US under US securities laws. If Equinor decides not to file a registration statement, these holders may not be able to exercise their preferential rights.
Right of redemption and repurchase of shares
Equinor’s articles of association do not authorise the redemption of shares. In the absence of authorisation, the redemption of shares may nonetheless be decided upon by a general meeting of shareholders by a two-thirds majority on certain conditions. However, such share redemption would, for all practical purposes, depend on the consent of all shareholders whose shares are redeemed.
A Norwegian company may purchase its own shares if authorisation to do so has been granted by a general meeting with the approval of at least two-thirds of the aggregate number of votes cast as well as two-thirds of the share capital represented at the general meeting. The aggregate par value of such treasury shares held by the company must not exceed 10% of the company's share capital, and treasury shares may only be acquired if, according to the most recently adopted balance sheet, the company's distributable equity exceeds the consideration to be paid for the shares. Pursuant to Norwegian law, authorisation by the general meeting cannot be granted for a period exceeding 18 months.
Distribution of assets on liquidation
Under Norwegian law, a company may be wound up by a resolution of the company's shareholders at a general meeting passed by both a two-thirds majority of the aggregate votes cast and a two-thirds majority of the aggregate share capital represented at the general meeting. The shares are ranked equally in the event of a return on capital by the company upon winding up or otherwise.
3.3 Nomination committee
Pursuant to Equinor's articles of association, the nomination committee shall consist of four members who are shareholders or representatives of shareholders. The duties of the nomination committee are set forth in the articles of association, and the instructions for the committee are adopted by the general meeting of shareholders.
The duties of the nomination committee are to submit recommendations to:
· The annual general meeting for the election of shareholder-elected members and deputy members of the corporate assembly, and the remuneration of members of the corporate assembly
· The annual general meeting for the election and remuneration of members of the nomination committee
· The corporate assembly for the election of shareholder-elected members of the board of directors and remuneration of the members of the board of directors and
· The corporate assembly for the election of the chair and deputy chair of the corporate assembly
The nomination committee would like to ensure that the shareholders’ views are taken into consideration when candidates to the governing bodies of Equinor ASA are proposed. The nomination committee invites in writing Equinor's largest shareholders to propose shareholder-elected candidates of the corporate assembly and the board of directors, as well as members of the nomination committee. The shareholders are also invited to provide input to the nomination committee in respect of the composition and competence of Equinor's governing bodies in light of Equinor's strategies and challenges going forward. The deadline for providing input is normally set to early/mid-January in order to secure that the response is taken into account in the upcoming nominations. In addition, all shareholders have an opportunity to submit proposals through an electronic mailbox as described on Equinor’s website. In the board nomination process, the board shares with the nomination committee the results from the annual, normally externally
Equinor, Annual Report on Form 20-F 2018 125
facilitated, board evaluation with input from both management and the board. Separate meetings are held between the nomination committee and each board member, including employee-elected board members. The chair of the board and the chief executive officer are invited, without having the right to vote, to attend at least one meeting of the nomination committee before it makes its final recommendations. The committee regularly utilises external expertise in its work and provides reasons for its recommendations of candidates.
The members of the nomination committee are elected by the annual general meeting. The chair of the nomination committee and one other member are elected from among the shareholder-elected members of the corporate assembly. Members of the nomination committee are normally elected for a term of two years.
Personal deputy members for one or more of the nomination committee's members may be elected in accordance with the same criteria as described above. A deputy member normally only meets for the permanent member if the appointment of that member terminates before the term of office has expired.
Equinor's nomination committee consists of the following members as per 31 December 2018 and are elected for the period up to the annual general meeting in 2020:
· Tone Lunde Bakker (chair), General Manager, Swedbank Norge (also chair of Equinor’s corporate assembly)
· Elisabeth Berge, Secretary General, Norwegian Ministry of Petroleum and Energy (personal deputy for Elisabeth Berge is Bjørn Ståle Haavik, Director, Department of Economic and Administrative Affairs, at the Norwegian Ministry of Petroleum and Energy)
· Jarle Roth, CEO of Arendals Fossekompani ASA (also a member of Equinor’s corporate assembly)
· Berit L. Henriksen, self-employed advisor
The board considers all members of the nomination committee to be independent of Equinor's management and board of directors. The general meeting decides the remuneration of the nomination committee.
The nomination committee held 12 ordinary meetings and 6 telephone meetings in 2018.
The instructions for the nomination committee are available at www.equinor.com/nominationcommittee.
3.4 Corporate assembly
Pursuant to the Norwegian Public Limited Liability Companies Act, companies with more than 200 employees must elect a corporate assembly unless otherwise agreed between the company and a majority of its employees.
In accordance with Equinor's articles of association, the corporate assembly normally consists of 18 members, 12 of whom (with four deputy members) are nominated by the nomination committee and elected by the annual general meeting. They represent a broad cross-section of the company's shareholders and stakeholders. Six members, with deputy members, and three observers are elected by and among our employees. Such employees are non-executive personnel. The corporate assembly elects its own chair and deputy chair from and among its members.
Members of the corporate assembly are normally elected for a term of two years. Members of the board of directors and management cannot be members of the corporate assembly, but they are entitled to attend and to speak at meetings of the corporate assembly unless the corporate assembly decides otherwise in individual cases. All members of the corporate assembly live in Norway. Members of the corporate assembly do not have service contracts with the company or its subsidiaries providing for benefits upon termination of office.
An overview of the members and observers of the corporate assembly as of 31 December 2018 follows below.
126 Equinor, Annual Report on Form 20-F 2018
Name | Occupation | Place of residence | Year of birth | Position | Family relations to corporate executive committee, board or corporate assembly members | Share ownership for members as of 31.12.2018 | Share ownership for members as of 14.03.2019 | First time elected | Expiration date of current term |
| | | | | | | | | |
Tone Lunde Bakker | General Manager, Swedbank Norge | Oslo | 1962 | Chair, Shareholder-elected | No | 0 | 0 | 2014 | 2020 |
Nils Bastiansen | Executive director of equities in Folketrygdfondet | Oslo | 1960 | Deputy chair, Shareholder-elected | No | 0 | 0 | 2016 | 2020 |
Jarle Roth | CEO, Arendals Fossekompani ASA | Bærum | 1960 | Shareholder-elected | No | 43 | 300 | 2016 | 2020 |
Greger Mannsverk | Managing director, Kimek AS | Kirkenes | 1961 | Shareholder-elected | No | 0 | 0 | 2002 | 2020 |
Finn Kinserdal | Associate professor, Norwegian School of Economics and Business (NHH) | Bergen | 1960 | Shareholder-elected | No | 0 | 0 | 2018 | 2020 |
Kari Skeidsvoll Moe | General Counsel, Trønderenergi AS | Trondheim | 1975 | Shareholder-elected | No | 0 | 0 | 2018 | 2020 |
Ingvald Strømmen | Professor at the Faculty of Engineering at Norwegian University of Science and Technology | Trondheim | 1950 | Shareholder-elected | No | 0 | 0 | 2006 | 2020 |
Rune Bjerke | CEO, DNB ASA | Oslo | 1960 | Shareholder-elected | No | 0 | 0 | 2007 | 2020 |
Birgitte Ringstad Vartdal | CEO of Golden Ocean Management AS, managing the dry bulk shipping company Golden Ocean Group Ltd. | Oslo | 1977 | Shareholder-elected | No | 250 | 250 | 2016 | 2020 |
Siri Kalvig | CEO, Nysnø Klimainvesteringer AS | Stavanger | 1970 | Shareholder-elected | No | 0 | 0 | 2010 | 2020 |
Terje Venold | Independent advisor with various directorships | Bærum | 1950 | Shareholder-elected | No | 500 | 500 | 2014 | 2020 |
Kjersti Kleven | Co-owner of John Kleven AS | Ulsteinvik | 1967 | Shareholder-elected | No | 0 | 0 | 2014 | 2020 |
Steinar Kåre Dale | Union representative, NITO, Principle Analyst IT Infrastr. | Mongstad | 1961 | Employee-elected | No | 1027 | 1320 | 2013 | 2019 |
Anne K.S. Horneland | Union representative, Industri Energi. Employee Representative RIR | Stavanger | 1956 | Employee-elected | No | 6217 | 6561 | 2006 | 2019 |
Hilde Møllerstad | Union representative, Tekna, Proj Leader Petech | Oslo | 1966 | Employee-elected | No | 4148 | 4577 | 2013 | 2019 |
Terje Enes | Union representative, SAFE, Discipl Resp Maint Mech | Stavanger | 1958 | Employee-elected | No | 4779 | 5000 | 2017 | 2019 |
Lars Olav Grøvik | Union representative, Tekna, Advisor Petech | Bergen | 1961 | Employee-elected | No | 6438 | 6854 | 2017 | 2019 |
Dag-Rune Dale | Union representative, Industri Energi, Safety officer, Employee representative O&M | Kollsnes | 1963 | Employee-elected | No | 4355 | 4626 | 2017 | 2019 |
Per Helge Ødegård | Union representative, Lederne, Discipl resp operation process | Porsgrunn | 1963 | Employee-elected, observer | No | 532 | 755 | 1994 | 2019 |
Sun Lehmann | Union representative, Tekna, Leading, Engineer IT | Trondheim | 1972 | Employee-elected, observer | No | 5000 | 5392 | 2015 | 2019 |
Dag Unnar Mongstad | Union representative, Industri Energi, Operator Ops Labratory | Bergen | 1954 | Employee-elected, observer | No | 1861 | 1885 | 2017 | 2019 |
Total | | | | | | 35,150 | 38,020 | | |
Equinor, Annual Report on Form 20-F 2018 127
An election of shareholder-elected members of the corporate assembly was held at Equinor’s annual general meeting 15 May 2018. Effective as of 16 May 2018, Finn Kinserdal and Kari Skeidsvoll Moe (former deputy member) were elected as new members of the corporate assembly while Marit Hansen and Martin Wien Fjell were elected as new deputy members. Steinar Olsen, Kathrine Næss and Håkon Volldal (deputy member) left the corporate assembly as of the same date.
The duties of the corporate assembly are defined in section 6-37 of the Norwegian Public Limited Liability Companies Act. The corporate assembly elects the board of directors and the chair of the board and can vote separately on each nominated candidate. Its responsibilities also include overseeing the board and the CEO's management of the company, making decisions on investments of considerable magnitude in relation to the company's resources, and making decisions involving the rationalisation or reorganisation of operations that will entail major changes in or reallocation of the workforce.
Equinor's corporate assembly held four ordinary meetings in 2018. The chair of the board participated at all four meetings, and the CEO at three meetings (with the CFO acting on his behalf at one meeting). Other members of management were also present at the meetings.
The procedure for the work of the corporate assembly, as well as an updated overview of its members, is available at www.equinor.com/corporateassembly.
128 Equinor, Annual Report on Form 20-F 2018
3.5 Board of directors
Pursuant to Equinor's articles of association, the board of directors consists of between nine and 11 members elected by the corporate assembly. The chair of the board and the deputy chair of the board are also elected by the corporate assembly. At present, Equinor's board of directors consists of 11 members. As required by Norwegian company law, the company's employees are represented by three board members.
The employee-elected board members, but not the shareholder-elected board members, have three deputy members who attend board meetings in the event an employee-elected member of the board is unable to attend. The management is not represented on the board of directors. Members of the board are elected for a term of up to two years, normally for one year at a time. There are no board member service contracts that provide for benefits upon termination of office.
The board considers its composition to be diverse and competent with respect to the expertise, capacity and diversity appropriate to attend to the company's goals, main challenges, and the common interest of all shareholders. The board also deems its composition to be made up of individuals who are willing and able to work as a team, resulting in the board working effectively as a collegiate body. At least one board member qualifies as "audit committee financial expert", as defined in the US Securities and Exchange Commission requirements. Equinor’s board of directors has determined that, in its judgment, all the shareholder representatives on the board are considered independent. Four board members are women and four board members are non-Norwegians resident outside of Norway.
The board held eight ordinary board meetings and two extraordinary meetings in 2018. Average attendance at these board meetings was 98.08%.
Further information about the members of the board and its sub-committees, including information about expertise, experience, other directorships, independence, share ownership and loans, is available below as well as on our website at www.equinor.com/board which is regularly updated.
Equinor, Annual Report on Form 20-F 2018 129
Members of the board of directors as of 31 December 2018:

Jon Erik Reinhardsen
Born: 1956
Position: Shareholder-elected chair of the board and chair of the board's compensation and executive development committee.
Term of office: Chair of the board of Equinor ASA since 1 September 2017. Up for election in 2019.
Independent: Yes
Other directorships: Member of the board of directors of Oceaneering International, Inc.,Telenor ASA and Awilhelmsen AS.
Number of shares in Equinor ASA as of 31 December 2018: 2,584
Loans from Equinor: None
Experience: Reinhardsen was the chief executive officer of Petroleum Geo-Services (PGS) from 2008 to August 2017. PGS delivers global geophysical- and reservoir services. In the period 2005 to 2008, Reinhardsen was President Growth, Primary Products in the international aluminium company Alcoa Inc. with headquarters in the US, and he was in this period based in New York. From 1983 to 2005, Reinhardsen held various positions in the Aker Kværner group, including group executive vice president of Aker Kværner ASA, Deputy chief executive officer and executive vice president of Aker Kværner Oil & Gas AS in Houston and executive vice president in Aker Maritime ASA.
Education: Reinhardsen has a Master’s Degree in Applied Mathematics and Geophysics from the University of Bergen. He has also attended the International Executive Program at the Institute for Management Development (IMD) in Lausanne, Switzerland.
Family relations: No family relations to other members of the board, members of the corporate executive committee or the corporate assembly.
Other matters: In 2018, Reinhardsen participated in eight ordinary board meetings, two extraordinary board meetings, six meetings of the compensation and executive development committee and four meetings of the audit committee. Reinhardsen is a Norwegian citizen and resident in Norway.
Roy Franklin
Born: 1953
Position: Shareholder-elected deputy chair of the board, chair of the board’s safety, sustainability and ethics committee and member of the board’s audit committee.
Term of office: Board member and deputy chair of the board of Equinor ASA since 1 July 2015. Franklin was also previously a member of the board of Equinor from October 2007 until June 2013. Chair of the board’s safety, sustainability and ethics committee and member of the board’s audit committee. Up for election in 2019.
Independent: Yes
Other directorships: Non-executive chair of the boards of Premier Oil plc, Cuadrilla Resources Holdings Limited and Energean Israel Ltd. Board member of the private equity firm Kerogen Capital Ltd and Wood plc.
Number of shares in Equinor ASA as of 31 December 2018: None
Loans from Equinor: None
Experience: Franklin has broad oil and gas experience from management positions in several countries, including positions with BP, Paladin Resources plc and Clyde Petroleum plc.
Education: Franklin has a Bachelor of Science in Geology from the University of Southampton, UK.
Family relations: No family relations to other members of the board, members of the corporate executive committee or the corporate assembly.
130 Equinor, Annual Report on Form 20-F 2018
Other matters: In 2018, Franklin participated in seven ordinary board meetings, two extraordinary board meetings, six meetings of the audit committee and four meetings of the safety, sustainability and ethics committee. Franklin is a UK citizen and resident in the UK.

Bjørn Tore Godal
Born: 1945
Position: Shareholder-elected member of the board, the board's compensation and executive development committee and the board's safety, sustainability and ethics committee.
Term of office: Member of the board of Equinor ASA since 1 September 2010. Up for election in 2019.
Independent: Yes
Other directorships: Vice chair of the board of the Fridtjof Nansen Institute (FNI).
Number of shares in Equinor ASA as of 31 December 2018: None
Loans from Equinor: None
Experience: Godal was a member of the Norwegian parliament for 15 years during the period 1986 to 2001. At various times, he served as minister for trade and shipping, minister for defense and minister of foreign affairs for a total of eight years between 1991 and 2001. From 2007 to 2010, Godal was special adviser for international energy and climate issues at the Norwegian Ministry of Foreign Affairs. From 2003 to 2007, Godal was Norway's ambassador to Germany and from 2002 to 2003 he was senior adviser at the department of political science at the University of Oslo. From 2014 to 2016, Godal led a government-appointed committee responsible for the evaluation of the civil and military contribution from Norway in Afghanistan in the period 2001 to 2014.
Education: Godal has a bachelor of arts degree in political science, history and sociology from the University of Oslo.
Family relations: No family relations to other members of the board, members of the corporate executive committee or the corporate assembly.
Other matters: In 2018, Godal participated in eight ordinary board meetings, two extraordinary board meetings, six meetings of the compensation and executive development committee and four meetings of the safety, sustainability and ethics committee. Godal is a Norwegian citizen and resident in Norway.

Rebekka Glasser Herlofsen
Born: 1970
Position: Shareholder-elected member of the board and the board's audit committee.
Term of office: Member of the board of Equinor ASA since 19 March 2015. Up for election in 2019.
Independent: Yes
Other directorships: Member of the board of Norwegian Hull Club (NHC)
Number of shares in Equinor ASA as of 31 December 2018: None
Loans from Equinor: None
Experience: In April 2017, Herlofsen took on the position as chief financial officer in Wallenius Willhelmsen ASA, an international shipping company. Before joining Wallenius Willhelmsen ASA she was the chief financial officer in the shipping company Torvald Klaveness since 2012. She has broad financial and strategic experience from several corporations and board directorships. Herlofsen’s professional career began in the Nordic Investment Bank, Enskilda Securities, where she worked with corporate finance from 1995 to 1999 in Oslo and London. During the next ten years Herlofsen worked in the Norwegian shipping company Bergesen d.y. ASA (later BW Group). During her period with Bergesen d.y. ASA/BW Group Herlofsen held leading positions within M&A, strategy and corporate planning and was part of the group management team.
Equinor, Annual Report on Form 20-F 2018 131
Education: MSc in Economics and Business Administration (Siviløkonom) and Certified Financial Analyst Programme (AFA) from the Norwegian School of Economics (NHH). Breakthrough Programme for Top Executives at IMD business school, Switzerland.
Family relations: No family relations to other members of the board, members of the corporate executive committee or the corporate assembly.
Other matters: In 2018, Herlofsen participated in eight ordinary board meetings, two extraordinary board meetings and six meetings of the audit committee. Herlofsen is a Norwegian citizen and resident in Norway.

Wenche Agerup
Born: 1964
Position: Shareholder-elected member of the board and the board’s compensation and executive development committee.
Term of office: Member of the board of Equinor ASA since 21 August 2015. Up for election in 2019.
Independent: Yes
Other directorships: Agerup is a member of the board of the seismic company TGS ASA and a member of Det Norske Veritas Council and its nomination committee. As part of the role as senior vice president in Group Holdings in Telenor, Agerup is a director and chair of the board in Telenor Maritime AS, Telenor Global Services AS and Telenor Eiendom AS.
Number of shares in Equinor ASA as of 31 December 2018: 2,677
Loans from Equinor: None
Experience: Agerup is senior vice president Group Holdings in Telenor ASA. Agerup was previously executive vice president (Corporate Affairs) and general counsel in Telenor from 2015 to 2018 and executive vice president for Corporate Staffs and the general counsel of Norsk Hydro ASA from 2010 to 2015. She has held various executive roles in Hydro since 1997, including within the company’s M&A-activities, the business area Alumina, Bauxite and Energy, as a plant manager at Hydro’s metal plant in Årdal and as a project director for a Joint Venture in Australia where Hydro cooperated with the Australian listed company UMC.
Education: MA in Law from the University of Oslo, Norway (1989) and a Master of Business Administration from Babson College, USA (1991).
Family relations: No family relations to other members of the board, members of the corporate executive committee or the corporate assembly.
Other matters: In 2018, Agerup participated in eight ordinary board meetings, two extraordinary board meetings, six meetings of the compensation and executive development committee and one meeting of the safety, sustainability and ethics committee. Agerup is a Norwegian citizen and resident in Norway.

Jeroen van der Veer
Born: 1947
Position: Shareholder-elected member of the board and chair of the board's audit committee.
Term of office: Member of the board of Equinor ASA since 18 March 2016. Up for election in 2019.
Independent: Yes
Other directorships: van der Veer is the chair of the supervisory boards of Royal Philips Electronics and Boskalis Westminster Groep NV and chair of the supervisory council of Technical University of Delft and Platform Beta Techniek.
Number of shares in Equinor ASA as of 31 December 2018: None
Loans from Equinor: None
Experience: van der Veer was the chief executive officer in the international oil and gas company Royal Dutch Shell Plc (Shell) in the period 2004 to 2009 when he retired. van der Veer thereafter continued as a non-executive director on the board of Shell until 2013. He started to work for Shell in 1971 and has experience within all sectors of the business and has significant competence within corporate governance.
132 Equinor, Annual Report on Form 20-F 2018
Education: van der Veer has a degree in Mechanical Engineering (MSc) from Delft University of Technology, Netherlands and a degree in Economics (MSc) from Erasmus University, Rotterdam, Netherlands. Since 2005 he holds an honorary doctorate from the University of Port Harcourt, Nigeria.
Family relations: No family relations to other members of the board, members of the corporate executive committee or the corporate assembly.
Other matters: In 2018, van der Veer participated in eight ordinary board meetings, two extraordinary board meetings and six meetings of the audit committee. van der Veer is a Dutch citizen and resident in the Netherlands.

Anne Drinkwater
Born: 1956
Position: Shareholder-elected member of the board and member of the board’s audit committee and the board’s safety, sustainability and ethics committee.
Term of office: Member of the board of Equinor ASA since 1 July 2018. Up for election in 2019.
Independent: Yes
Other directorships: Member of the board of Balfour Beatty plc.
Number of shares in Equinor ASA as of 31 December 2018: None
Loans from Equinor: None
Experience: Drinkwater was employed with BP in the period 1978 to 2012, holding a number of different leadership positions in the company. In the period 2009 to 2012 she was chief executive officer of BP Canada. Drinkwater has also been a member of the boards of Aker Solutions from 2011 to 2018 and Tullow Oil from 2012 to 2018.
Education: Drinkwater has a Bachelor of Science in applied mathematics and statistics from Brunel University London
Family relations: No family relations to other members of the board, members of the corporate executive committee or the corporate assembly.
Other matters: In 2018, Drinkwater participated in four ordinary board meetings, two meeting of the audit committee and two meetings of the safety, sustainability and ethics committee. Drinkwater is a British citizen and resident in the United States.

Jonathan Lewis
Born: 1961
Position: Shareholder-elected member of the board and member of the board’s compensation and executive development committee and the board’s safety, sustainability and ethics committee.
Term of office: Member of the board of Equinor ASA since 1 July 2018. Up for election in 2019.
Independent: Yes
Other directorships: Member of the board of Capita plc.
Number of shares in Equinor ASA as of 31 December 2018: None
Loans from Equinor: None
Experience: Lewis assumed the position as chief executive officer of Capita plc in December 2017, having previously spent 30 years working in large multi-national companies in technology-enabled industries. Lewis came to Capita plc from Amec Foster Wheeler plc, a global consulting, engineering and construction company where he was employed in the period 1996 to 2016. Lewis has previously held several directorships within technology and the oil and gas industry.
Education: Lewis has an education from Stanford Executive Program (SEP) at Stanford University Graduate School of Business, a PhD, Reservoir Characterisation, Geology/Sedimentology from University of Reading as well as a Bachelor of Science, Geology from Kingston University.
Equinor, Annual Report on Form 20-F 2018 133
Family relations: No family relations to other members of the board, members of the corporate executive committee or the corporate assembly.
Other matters: In 2018, Lewis participated in four ordinary board meetings, two meetings of the compensation and executive development committee, two meetings of the safety, sustainability and ethics committee and one meeting of the audit committee. Lewis is a British citizen and resident in the UK.

Per Martin Labråten
Born: 1961
Position: Employee-elected member of the board and member of the board's safety, sustainability and ethics committee.
Term of office: Member of the board of Equinor ASA since 8 June 2017. Up for election in 2019.
Independent: No
Other directorships: Labråten is a member of the executive committee of the Industry Energy (IE) trade union and holds a number of offices as a result of this.
Number of shares in Equinor ASA as of 31 December 2018: 1,653
Loans from Equinor: None
Experience: Labråten has worked as a process technician at the petrochemical plant on Oseberg field in the North Sea. Labråten is now a full-time employee representative as the leader of IE Equinor branch.
Education: Labråten has a craft certificate as a process/chemistry worker.
Family relations: No family relations to other members of the board, members of the corporate executive committee or the corporate assembly.
Other matters: In 2018, Labråten participated in seven ordinary board meetings, two extraordinary board meetings and three meetings of the safety, sustainability and ethics committee. Labråten is a Norwegian citizen and resident in Norway.

Ingrid Elisabeth
Di Valerio
Born: 1964
Position: Employee-elected member of the board and member of the board's audit committee.
Term of office: Member of the board of Equinor ASA since 1 July 2013. Up for election in 2019.
Independent: No
Other directorships: Board member of Tekna's central nomination committee.
Number of shares held in Equinor ASA as of 31 December 2018: 5,115
Loans from Equinor: None
Experience: Di Valerio has been employed by Equinor since 2005, and works within materials discipline for Technology, Projects & Drilling. Di Valerio was the union Tekna's main representative in Equinor from 2008 to 2013. She also sat on Tekna's central committee from 2005 to 2013.
Education: Chartered engineer (mathematics and physics) from the Norwegian University of Science and Technology in Trondheim (NTNU).
Familiy relations: No family relationships to other board members, members of the corporate executive committee or the corporate assembly.
Other matters: In 2018, Di Valerio participated in eight ordinary board meetings, two extraordinary board meetings and six meetings of the audit committee. Di Valerio is a Norwegian citizen and resident in Norway.
134 Equinor, Annual Report on Form 20-F 2018

Stig Lægreid
Born: 1963
Position: Employee-elected member of the board and member of the board's safety, sustainability and ethics committee.
Term of office: Member of the board of Equinor ASA since 1 July 2013. Up for election in 2019.
Independent: No
Other directorships: None
Number of shares held in Equinor ASA as of 31 December 2018: 1,995
Loans from Equinor: None
Experience: Employed in ÅSV and Norsk Hydro since 1985. Mainly occupied as project engineer and constructor for production of primary metals until 2005 and from 2005 as weight estimator for platform design. He is now a full-time employee representative as the leader of the union NITO, Equinor.
Education: Bachelor degree, mechanical construction from OIH.
Family relations: No family relationships to other board members, members of the corporate executive committee or the corporate assembly.
Other matters: In 2018, Lægreid participated in eight ordinary board meetings, two extraordinary board meetings and four meetings of the safety, sustainability and ethics committee. Lægreid is a Norwegian citizen and resident in Norway.
The most recent changes to the composition of the board of directors was the election of Anne Drinkwater and Jonathan Lewis elected by the corporate assembly in June, with effect from 1 July 2018. Marja Johanna Oudeman left the board as of the same date.
The work of the board of directors
The board is responsible for managing the Equinor group and for monitoring day-to-day management and the group's business activities. This means that the board is responsible for establishing control systems and for ensuring that Equinor operates in compliance with laws and regulations, with our values as stated in The Equinor Book, the Code of Conduct, as well as in accordance with the owners' expectations of good corporate governance. The board emphasises the safeguarding of the interests of all shareholders, but also the interests of Equinor's other stakeholders.
The board handles matters of major importance, or of an extraordinary nature, and may in addition require the management to refer any matter to it. An important task for the board is to appoint the chief executive officer (CEO) and stipulate his/her job instructions and terms and conditions of employment.
The board has adopted a generic annual plan for its work which is revised with regular intervals. Recurrent items on the board's annual plan are: security, safety, sustainability and climate, corporate strategy, business plans, targets, quarterly and annual results, annual reporting, ethics, management's monthly performance reporting, management compensation issues, CEO and top management leadership assessment and succession planning, project status review, people and organisation strategy and priorities, two yearly discussions of main risks and risk issues and an annual review of the board's governing documentation. In addition, the board has in 2018 also had deep-dive sessions on other topics, including various specific risks. In the beginning of each board meeting, the CEO meets separately with the board to discuss key matters in the company. At the end of all board meetings, the board has a closed session with only board members attending the discussions and evaluating the meeting.
The work of the board is based on rules of procedure that describe the board's responsibilities, duties and administrative procedures, and determines which matters are to be handled by the board. The rules of procedure also determine the handling of matters in which individual board members or a closely related party have a major personal or financial interest. The rules of procedure further describe the duties of the CEO and his/her duties vis-à-vis the board of directors. The board's rules of procedure are available on our website at www.equinor.com/board. In addition to the board of directors, the CEO, the CFO, the COO, the senior vice president for communication, the general counsel and the company secretary attend all board meetings. Other members of the executive committee and senior management attend board meetings by invitation in connection with specific matters.
New members of the board are offered an induction programme where meetings with key members of the management are arranged, an introduction to Equinor’s business is given and relevant information about the company and the board’s work is made available through the company’s web-based board portal.
Equinor, Annual Report on Form 20-F 2018 135
The board carries out an annual board evaluation, with input from various sources and as a main rule with external facilitation. The evaluation report is discussed in a board meeting and is made available to the nomination committee as input to the committee’s work.
The entire board, or part of it, regularly visits several Equinor locations in globally, and a longer board trip for all board members to an international location is made at least every two years. When visiting Equinor locations globally, the board emphasises the importance of improving its insight into, and knowledge about, safety and security in Equinor’s operations, Equinor’s technical and commercial activities as well as the company's local organisations. In 2018, whole or parts of the board visited Equinor’s operations in Norway, the US, Russia and England.
Requirements for board members and management
It follows from our Code of Conduct, which is approved by the board, and which applies to both management, employees and board members, that individuals must behave impartially in all business dealings and not give other companies, organisations or individuals improper advantages. The importance of openness is underlined, and any situations that might lead to an actual or perceived conflict of interest should be discussed with the individual’s leader. All external directorships or other material assignments held or carried out by Equinor employees must be approved by Equinor.
The board's rules of procedures state that members of the board and the chief executive officer may not participate in the discussion or decision of issues which are of special personal importance to them, or to any closely-related party, so that the individual must be regarded as having a major personal or special financial interest in the matter. Each board member and the chief executive officer are individually responsible for ensuring that they are not disqualified from discussing any particular matter. Members of the board are obliged to disclose any interests they themselves or their closely-related parties may have in the outcome of a particular issue. The board must approve any agreement between the company and a member of the board or the chief executive officer. The board must also approve any agreement between the company and a third party in which a member of the board or the chief executive officer may have a special interest. Each member of the board shall also continually assess whether there are circumstances which could undermine the general confidence in the board member's independence. It is incumbent on each board member to be especially vigilant when making such assessments in connection with the board's handling of transactions, investments and strategic decisions. The board member shall immediately notify the chair of the board if such circumstances are present or arise and the chair of the board will determine how the matter will be dealt with.
Equinor’s board has established three sub-committees: the audit committee; the compensation and executive development committee; and the safety, sustainability and ethics committee. The committees prepare items for consideration by the board and their authority is limited to making such recommendations. The committees consist entirely of board members and are answerable to the board alone for the performance of their duties. Minutes of the committee meetings are sent to the whole board, and the chair of each committee regularly informs the board at board meetings about the committee's work. The composition and work of the committees are further described below.
Audit committee
The board of directors elects at least three of its members to serve on the board of directors' audit committee and appoints one of them to act as chair. The employee-elected members of the board of directors may nominate one audit committee member.
At year-end 2018, the audit committee members were Jeroen van der Veer (chair), Roy Franklin, Rebekka Glasser Herlofsen, Anne Drinkwater and Ingrid Di Valerio (employee-elected board member).
The CFO, the general counsel, the senior vice president for accounting and financial compliance and the senior vice president for corporate audit, as well as representatives from the external auditor regularly participate in the audit committee meetings.
The audit committee is a sub-committee of the board of directors, and its objective is to act as a preparatory body in connection with the board's supervisory roles with respect to financial reporting and the effectiveness of the company's internal control system. It also attends to other tasks assigned to it in accordance with the instructions for the audit committee adopted by the board of directors. The audit committee is instructed to assist the board of directors in its supervising of matters such as:
· Approving the internal audit plan on behalf of the board of directors
· Monitoring the financial reporting process, including oil and gas reserves, fraudulent issues and reviewing the implementation of accounting principles and policies
· Monitoring the effectiveness of the company's internal control, internal audit and risk management systems
· Maintaining continuous contact with the external auditor regarding the annual and consolidated accounts
· Reviewing and monitoring the independence of the company's internal auditor and the independence of the external auditor, reference is made to the Norwegian Auditors Act chapter 4, and, in particular, whether services other than audits provided by the external auditor or the audit firm are a threat to the external auditor's independence
136 Equinor, Annual Report on Form 20-F 2018
The audit committee supervises implementation of and compliance with Equinor’s Code of Conduct and supervises compliance activities relating to corruption related to financial matters, as further described in the provisions herein. The audit committee also supervises implementation of and compliance with Equinor’s Global Tax Strategy.
Corporate Audit reports administratively to the president and CEO of Equinor and functionally to the chair of the board of directors’ audit committee.
Under Norwegian law, the external auditor is appointed by the shareholders at the annual general meeting based on a proposal from the corporate assembly. The audit committee issues a statement to the annual general meeting relating to the proposal.
The audit committee meets at least five times a year and both the board and the board’s audit committee hold meetings with the internal auditor and the external auditor on a regular basis without the company’s management being present.
The audit committee is also charged with reviewing the scope of the audit and the nature of any non-audit services provided by external auditors.
The audit committee is tasked with ensuring that the company has procedures in place for receiving and dealing with complaints received by the company regarding accounting, internal control or auditing matters, and procedures for the confidential and anonymous submission, via the group's ethics helpline, by company employees of concerns regarding accounting or auditing matters, as well as other matters regarded as being in breach of the group's Code of Conduct, a material violation of an applicable US federal or state securities law, a material breach of fiduciary duties or a similar material violation of any other US or Norwegian statutory provision. The audit committee is designated as the company's qualified legal compliance committee for the purposes of Part 205 in Title 17 of the US Code of Federal Regulations.
In the execution of its tasks, the audit committee may examine all activities and circumstances relating to the operations of the company. In this regard, the audit committee may request the chief executive officer or any other employee to grant it access to information, facilities and personnel and such assistance as it requests. The audit committee is authorised to carry out or instigate such investigations as it deems necessary in order to carry out its tasks and it may use the company's internal audit or investigation unit, the external auditor or other external advice and assistance. The costs of such work will be covered by the company.
The audit committee is only responsible to the board of directors for the execution of its tasks. The work of the audit committee in no way alters the responsibility of the board of directors and its individual members, and the board of directors retains full responsibility for the audit committee's tasks.
The audit committee held six meetings in 2018. There was 100% attendance at the committee's meetings.
The board of directors has decided that a member of the audit committee, Jeroen van der Veer, qualifies as an "audit committee financial expert", as defined in Item 16A of Form 20-F. The board of directors has also concluded that Jeroen van der Veer, Roy Franklin, Rebekka Glasser Herlofsen and Anne Drinkwater are independent within the meaning of Rule 10A-3 under the Securities Exchange Act.
The committee's mandate is available at www.equinor.com/auditcommittee.
Compensation and executive development committee
The compensation and executive development committee is a sub-committee of the board of directors that assists the board in matters relating to management compensation and leadership development. The main responsibilities of the compensation and executive development committee are:
(1) as a preparatory body for the board, to make recommendations to the board in all matters relating to principles and the framework for executive rewards, remuneration strategies and concepts, the CEO's contract and terms of employment, and leadership development, assessments and succession planning;
(2) to be informed about and advise the company's management in its work on Equinor's remuneration strategy for senior executives and in drawing up appropriate remuneration policies for senior executives; and
(3) to review Equinor's remuneration policies in order to safeguard the owners' long-term interests.
The committee consists of up to four board members. At year-end 2018, the committee members were Jon Erik Reinhardsen (chair), Bjørn Tore Godal, Wenche Agerup and Jonathan Lewis. All the committee members are non-executive directors. All members are deemed independent.
Equinor, Annual Report on Form 20-F 2018 137
The senior vice president People and Leadership regularly participates in the compensation and executive development committee meetings.
The committee held six meetings in 2018 and attendance was 100%.
For a more detailed description of the objective and duties of the compensation and executive development committee, please see the instructions for the committee available at www.equinor.com/compensationcommittee.
Safety, sustainability and ethics committee
The safety, sustainability and ethics committee is a sub-committee of the board of directors that assists the board in matters relating to safety, security, sustainability, climate and ethics.
In its business activities, Equinor is committed to comply with applicable laws and regulations and to act in an ethical, environmental, safe and socially responsible manner. The committee has been established to support our commitment in this regard, and it assists the board of directors in its supervision of the company's safety, security, sustainability, climate and ethics policies, systems and principles with the exception of aspects related to “financial matters”. The committee also reviews the annual Sustainability report.
Establishing and maintaining a committee dedicated to safety, security, sustainability, climate and ethics is intended to ensure that the board of directors has a strong focus on and knowledge of these complex, important and constantly evolving areas.
At year-end 2018, the safety, sustainability and ethics committee was chaired by Roy Franklin and the other members were Bjørn Tore Godal, Anne Drinkwater, Jonathan Lewis, Stig Lægreid (employee-elected board member) and Per Martin Labråten (employee-elected board member).
The senior vice president Safety, the general counsel, the chief operating officer, the senior vice president Corporate Sustainability and the chief compliance officer regularly participate in the safety, sustainability and ethics committee meetings.
The committee held four meetings in 2018, and attendance was on average 96%.
For a more detailed description of the objective, duties and composition of the committee, please see the instructions available at www.equinor.com/ssecommittee.
3.6 Management
The president and CEO has overall responsibility for day-to-day operations in Equinor and appoints the corporate executive committee (CEC). The president and CEO is responsible for developing Equinor's business strategy and presenting it to the board of directors for decision, for the execution of the business strategy and for cultivating a performance-driven, values-based culture.
Members of the CEC have a collective duty to safeguard and promote Equinor's corporate interests and to provide the president and CEO with the best possible basis for deciding the company's direction, making decisions and executing and following up business activities. In addition, each of the CEC members is head of a separate business area or staff function.
Members of Equinor's corporate executive committee as of 31 December 2018:

Eldar Sætre
138 Equinor, Annual Report on Form 20-F 2018
Born: 1956
Position: President and chief executive officer (CEO) of Equinor ASA since 15 October 2014.
External offices: Member of the board of Strømberg Gruppen AS and Trucknor AS.
Number of shares in Equinor ASA as of 31 December 2018: 65,294
Loans from Equinor: None
Experience: Sætre joined Equinor in 1980. Executive vice president and CFO from October 2003 until December 2010. Executive vice president for Marketing, Processing & Renewable Energy from 2011 until 2014.
Education: MA in business economics from the Norwegian School of Economics and Business Administration (NHH) in Bergen.
Family relations: No family relations to other members of the corporate executive committee, members of the board or the corporate assembly.
Other matters: Sætre is a Norwegian citizen and resident in Norway.

Lars Christian Bacher
Born: 1964
Position: Executive vice president and chief financial officer (CFO) of Equinor ASA since 1 August 2018.
External offices: None
Number of shares in Equinor ASA as of 31 December 2018: 27,529
Loans from Equinor: None
Experience: Bacher joined Equinor in 1991 and has held a number of leading positions in Equinor, including that of platform manager on the Norne and Statfjord fields on the Norwegian continental shelf. He was in charge of the merger process involving the offshore installations of Norsk Hydro and Equinor. Bacher has also been senior vice president for Gullfaks operations and subsequently for the Tampen area, and Equinor’s Canadian operations within Development & Production International (DPI). His most recent position, which he held from September 2012, was as executive vice president, DPI.
Education: Master of science in chemical engineering from the Norwegian Institute of Technology (NTH). He also holds a business degree in Finance from the Norwegian School of Economics and Business Administration (NHH).
Family relations: No family relations to other members of the corporate executive committee, members of the board or the corporate assembly.
Other matters: Bacher is a Norwegian citizen and resident in Norway.

Jannicke Nilsson
Born: 1965
Position: Executive vice president and chief operating officer (COO) of Equinor ASA since 1 December 2016.
External offices: Member of the board of Odfjell SE and Toppindustrisenteret AS (“Digital Norway”).
Number of shares in Equinor ASA as of 31 December 2018: 42,597
Loans from Equinor: None
Experience: Jannicke Nilsson joined Equinor in 1999 and has held a number of central management positions within upstream operations Norway, including senior vice president for Technical Excellence in Technology, Projects & Drilling, senior vice president for Operations North Sea, vice president for modifications and project portfolio Bergen and platform manager at Oseberg South. In
Equinor, Annual Report on Form 20-F 2018 139
August 2013, she was appointed programme leader for the Equinor technical efficiency programme (STEP), responsible for a project portfolio delivering yearly efficiency gains of 3.2 billion USD from 2016.
Education: MSc in cybernetics and process automation and a BSc in automation from the Rogaland Regional College/University of Stavanger.
Family relations: No family relations to other members of the corporate executive committee, members of the board or the corporate assembly.
Other matters: Nilsson is a Norwegian citizen and resident in Norway.

Pål Eitrheim
Born: 1971
Position: Executive vice president New Energy Solutions (NES) of Equinor ASA since 17 August 2018.
External offices: None
Number of shares in Equinor ASA as of 31 December 2018: 9,587
Loans from Equinor: None
Experience: Eitrheim joined Equinor in 1998. He has held a range of leadership positions in Equinor in Azerbaijan, Washington DC, the CEO office, and Brazil. In 2013, he led the Secretariat for the investigation into the terrorist attack on the In Amenas gas processing facility in Algeria. His most recent position, which he held from February 2017, was senior vice president and chief procurement officer.
Education: Master degree in Comparative Politics from the University of Bergen, Norway and University College Dublin, Ireland.
Family relations: No family relations to other members of the corporate executive committee, the board of directors or the corporate assembly.
Other matters: Eitrheim is a Norwegian citizen and resident in Norway.

Torgrim Reitan
140 Equinor, Annual Report on Form 20-F 2018
Born: 1969
Position: Executive vice president Development & Production International (DPI) of Equinor ASA since 17 August 2018.
External offices: None
Number of shares in Equinor ASA as of 31 December 2018: 39,876
Loans from Equinor: None
Experience: From 1 August 2015 to 17 August 2018, Reitan held the position as executive vice president of Development and Production USA (DPUSA). Prior to this role, he held the position as executive vice president and chief financial officer of Equinor (CFO).
He has held several managerial positions in Equinor, including senior vice president (SVP) in trading and operations in the Natural Gas business area from 2009 to 2010, SVP in Performance Management and Analysis from 2007 to 2009 and SVP in Performance Management, Tax and M&A from 2005 to 2007. From 1995 to 2004, he held various positions in the Natural Gas business area and corporate functions in Equinor.
Education: Master of science degree from the Norwegian School of Economics and Business Administration (Siviløkonom).
Family relations: No family relations to other members of the corporate executive committee, members of the board or the corporate assembly.
Other matters: Reitan is a Norwegian citizen and resident in Norway

Anders Opedal
Born: 1968
Position: Executive vice president Technology, Projects & Drilling (TPD) of Equinor ASA since 15 October 2018.
External offices: None
Numbers of shares in Equinor ASA as of 31 December 2018: 22,772
Loans from Equinor: None
Experience: Opedal joined Equinor in 1997 as a petroleum engineer in the Statfjord operations. Previosuly he worked for Schlumberger and Baker Hughes. He has held a range of positions in Equinor in Drilling and Well, Procurement and projects. He served as chief procurement officer in Equinor from 2007 to 2010. In 2011 he took on the role as senior vice president for Projects in TPD responsible for Equinor’s approximately NOK 300 billion project profolio.
He served as Eqionors executive vice president and chief operating officer before taking the role as senior vice president for Development & Production International, Brazil. His most recent position, which he held from August 2018, was executive vice president for Development & Production Brazil (DPB)
Education: Opedal has an MBA from Heriot-Watt University and master’s degree in Engineering (sivilingniør) from Norwegian Institute of Technology (NTH) in Trondheim.
Family relations: No family relations to other members of the corporate executive committee, members of the board or the corporate assembly.
Other matters: Opedal is a Norwegian citizen and resident in Norway.
Equinor, Annual Report on Form 20-F 2018 141

Tim Dodson
Born: 1959
Position: Executive vice president Exploration (EXP) of Equinor ASA since 1 January 2011.
External offices: None
Number of shares in Equnor ASA as of 31 December 2018: 31,826
Loans from Equinor: None
Experience: Dodson has worked in Equinor since 1985 and held central management positions in the company, including the positions of senior vice president for Global Exploration, Exploration & Production Norway and the Technology arena.
Education: Bachelor’s degree of science in geology and geography from the University of Keele.
Family relations: No family relations to other members of the corporate executive committee, members of the board or the corporate assembly.
Other matters: Dodson is a British citizen and resident in Norway.

Margareth Øvrum
Born: 1958
Position: Executive vice president Development & Production Brazil (DPB) of Equinor ASA since October 2018.
External offices: Member of the board of Alfa Laval (Sweden) and FMC Corporation (US).
Number of shares in Equinor ASA as of 31 December 2018: 61,610
Loans from Equinor: None
Experience: Øvrum has worked for Equinor since 1982 and has held central management positions in the company, including the position of executive vice president for Health, Safety and the Environment, executive vice president for Technology & Projects and executive vice president for Technology and New Energy. She was the company's first female platform manager, on the Gullfaks field. She was senior vice president for operations for Veslefrikk and vice president of Operations Support for the Norwegian continental shelf. She joined the corporate executive committee in 2004. Her most recent position was executive vice president for Technology, Projects, and Drilling (TPD), which she held from September 2011.
Education: Master's degree in engineering (sivilingeniør) from the Norwegian Institute of Technology (NTH), specialising in technical physics.
Family relations: No family relations to other members of the corporate executive committee, members of the board or the corporate assembly.
Other matters: Øvrum is a Norwegian citizen and resident in Brazil.
142 Equinor, Annual Report on Form 20-F 2018

Arne Sigve Nylund
Born: 1960
Position: Executive vice president Development & Production Norway (DPN) of Equinor ASA since 1 January 2014.
External offices: Member of the board of directors of The Norwegian Oil & Gas Association (Norsk Olje & Gass).
Number of shares in Equinor ASA as of 31 December 2018: 15,729
Loans from Equinor: None
Experience: Nylund was employed by Mobil Exploration Inc. from 1983 to 1987. Since 1987, he has held several central management positions in Equinor.
Education: Mechanical engineer from Stavanger College of Engineering with further qualifications in operational technology from Rogaland Regional College/University of Stavanger (UiS). Business graduate of the Norwegian School of Business and Management (NHH).
Family relations: No family relations to other members of the corporate executive committee, members of the board or the corporate assembly.
Other matters: Nylund is a Norwegian citizen and resident in Norway.

Al Cook
Born: 1975
Position: Executive vice president Global Strategy & Business Development (GSB) of Equinor ASA since 1 May 2018.
External offices: None
Number of shares in Equinor ASA as of 31 December 2018: 2,112
Loans from Equinor: Member of the board of The Power of Nutrition
Experience: Cook joined Equinor in 2016 as senior vice president in Development & Production International (DPI). He joined from BP, where he was chief of staff to the CEO. Cook joined BP in 1996, taking on a series of project development and commercial roles in the North Sea and Gulf of Mexico. He then worked in field operations in the North Sea from 2002 to 2005, becoming offshore installation manager. From 2005, he led the IGB2 Project in Vietnam and acted as president for BP Vietnam. From 2009 to 2014 Cook worked as BP’s vice president, leading the development of the Shah Deniz field in Azerbaijan and construction of the Southern Gas corridor.
Education: MA in Natural Sciences from St. John’s College, Cambridge University and International Executive Programme at INSEAD.
Family relations: No family relations to other members of the corporate executive committee, members of the board or the corporate assembly.
Other matters: Cook is a British citizen and resident in the UK.
Equinor, Annual Report on Form 20-F 2018 143

Irene Rummelhoff
Born: 1967
Position: Executive vice president Marketing, Midstream & Processing (MMP) of Equinor ASA since 17 August 2018.
External offices: Deputy chair of the board of directors of Norsk Hydro ASA.
Number of shares in Equinor ASA as of 31 December 2018: 28,472
Loans from Equinor: None
Experience: Rummelhoff joined Equinor in 1991. She has held a number of management positions within international business development, exploration and the downstream business in Equinor. Her most recent position, which she held from June 2015, was as executive vice president New Energy Solutions (NES).
Education: Master’s degree in petroleum geosciences from the Norwegian Institute of Technology (NTH).
Family relations: No family relations to other members of the corporate executive committee, members of the board or the corporate assembly.
Other matters: Rummelhoff is a Norwegian citizen and resident in Norway.
Equinor has granted loans to the Equinor-employed spouse of certain of the executive vice presidents as part of its general loan arrangement for Equinor employees. Employees in salary grade 12 or higher may take out a car loan from Equinor in accordance with standardised provisions set by the company. The standard maximum car loan is limited to the cost of the car, including registration fees, but not exceeding NOK 300,000. Employees outside the collective labour area are entitled to a car loan up to NOK 575,000 (vice presidents and senior vice presidents) or NOK 475,000 (other positions). The car loan is interest-free, but the tax value, "interest advantage", must be reported as salary. Permanent employees in Equinor ASA may also apply for a consumer loan up to NOK 350,000. The interest rate on consumer loans is corresponding to the standard rate in effect at any time for “reasonable loans” from employer as decided by the Norwegian Ministry of Finance, i.e. the lowest rate an employer may offer without triggering taxation of the advantage for the employee.
144 Equinor, Annual Report on Form 20-F 2018
3.7 Compensation to governing bodies
Remuneration to the board of directors
The remuneration of the board and its sub-committees is decided by the corporate assembly, based on a recommendation from the nomination committee. The members have an annual, fixed remuneration, except for deputy members (only elected for employee-elected board members) who receive remuneration per meeting attended. Separate rates are set for the board's chair, deputy chair and other members, respectively. Separate rates are also adopted for the board's sub-committees, with similar differentiation between the chair and the other members of each committee. The employee-elected members of the board receive the same remuneration as the shareholder-elected members.
The board receives its remuneration by cash payment. Board members from outside Scandinavia and outside Europe, respectively, receive separate travel allowances for each meeting attended. The remuneration is not linked to the board members' performance, option programmes or similar. None of the shareholder-elected board members have a pension scheme or agreement concerning pay after termination of their office with the company. If shareholder-elected members of the board and/or companies they are associated with should take on specific assignments for Equinor in addition to their board membership, this will be disclosed to the full board.
In 2018, the total remuneration to the board, including fees for the board's three sub-committees, was NOK 6,894,704 (USD 847 660).
Detailed information about the individual remuneration to the members of the board of directors in 2018 is provided in the table below.
Members of the board (figures in USD thousand except number of shares) | Total remuneration | Share ownership as of 31 December 2018 |
| | |
Jon Erik Reinhardsen (chair of the board) | 117 | 2,584 |
Roy Franklin (deputy chair of the board) | 111 | - |
Wenche Agerup | 65 | 2,677 |
Bjørn Tore Godal | 70 | - |
Rebekka Glasser Herlofsen | 66 | - |
Maria Johanna Oudeman1) | 48 | n.a. |
Anne Drinkwater2) | 48 | - |
Jonathan Lewis2) | 44 | - |
Jeroen van der Veer | 95 | - |
Per Martin Labråthen | 59 | 1,653 |
Stig Lægreid | 59 | 1,995 |
Ingrid Elisabeth Di Valerio | 66 | 5,115 |
| | |
Total | 848 | 14,024 |
| | |
1) Member until 30 June, 2018 (resigned) | | |
2) Members from 1 July, 2018 | | |
| | |
Remuneration to the corporate assembly
The remuneration of the corporate assembly is decided by the general meeting, based on a recommendation from the nomination committee. The members have an annual, fixed remuneration, except for deputy members who receive remuneration per meeting attended. Separate rates are set for the corporate assembly’s chair, deputy chair and other members, respectively. The employee-elected members of the corporate assembly receive the same remuneration as the shareholder-elected members. The corporate assembly receives its remuneration by cash payment.
In 2018, the total remuneration to the corporate assembly was NOK 1,130,891 (USD 139 036).
Remuneration to the corporate executive committee
In 2018, the aggregate remuneration to the corporate executive committee was USD 11,803,238. The board of directors’ complete declaration on remuneration of executive personnel follows below.
Equinor, Annual Report on Form 20-F 2018 145
146 Equinor, Annual Report on Form 20-F 2018
Main elements - Equinor executive remuneration |
Remuneration element | Objective | Award level | Performance criteria |
Base salary | Attract and retain the right individuals by providing competitive but not market-leading terms. | We offer base salary levels which are aligned with and differentiated according to the individual's responsibility and performance. The level is competitive in the markets in which we operate. | The base salary is normally subject to annual review based on an evaluation of the individual’s performance; see “Annual Variable Pay" below. |
Fixed salary addition | The fixed salary addition is applied as a supplementing fixed remuneration element to be competitive in the market. | Reference is made to the remuneration table. Four of the executive vice presidents receive a fixed salary addition in lieu of pension accrual above 12G[6] with reference to the section on pension and insurance scheme. | No performance criteria are linked to the fived salary addition. The fixed salary addition is not included in the pensionable income. |
Annual variable pay | Encourage a strong performance culture. Rewarding individuals for annual achievement of business objectives, both the (“What”) and the “How”. | Members of the corporate executive committee are entitled to annual variable pay ranging from 0 – 50% of their fixed remuneration. Target2 value is 25%. The threshold principles and the company performance modifier are applied (see explanations below). The company reserves the right to reclaim variable components of the remuneration awarded for performance, if performance data is subsequently proven to be misstated. | Achievement of annual performance goals (“How” and “What” to deliver), in order to create long-term and sustainable shareholder value. Assessment of goals defined in the individual’s performance contract including objectives related to selected KPI’s on the balanced scorecard constitute the basis for annual variable pay. |
Long-term incentive (LTI) | Strengthen the alignment of top management and shareholders’ long-term interests. Retention of key executives. | The LTI is calculated as a portion of the participant’s base salary. On behalf of the participant, the company acquires shares equivalent to the net annual grant amount. The shares are subject to a three-year lock-in period and then released for the participant’s disposal. If the lock-in obligations are not fulfilled, the executive has to pay back the gross value of the locked-in shares limited to the gross value of the grant amount. The level of the annual LTI reward is in the range of 25-30% of the fixed remuneration. The threshold principles are applied to the annual grant. The company performance modifier is not applied to the LTI in Equinor ASA. | In Equinor ASA, LTI participation and grant level are reflective of the level and impact of the position and not directly linked to the incumbent’s performance. |
Threshold | Financial threshold for payment of variable remuneration and award of LTI grant. | The threshold has the following guiding parameters; 1) Cash flows provided by operating activities after tax and before working capital items
2) Net debt ratio and development
3) Company’s overall operational and financial performance. Cash flows provided by operating activities after tax and before working capital items higher than USD 12 billion and a net debt ratio below 30% will normally guide for no reduction of bonus. | Application of the threshold is subject to a discretionary assessment of the company’s overall performance by the board of directors. These measures and targets are indicative and will form part of a broader assessment of bonus award. |
Company performance modifier | Strengthen the alignment between variable remuneration and the company’s performance. | The company performance modifier determines the proportion of the bonus that will be paid, ranging from 50% to 150%. The company performance modifier is subject to approval by the annual general meeting. | Company performance is assessed against two equally weighted measures: relative total shareholder return (TSR) and relative return on average capital employed (ROACE). Application of the modifier is subject to discretionary assessment based on the company’s overall performance. |
Pension & insurance schemes | Provide competitive postemployment and other benefits. | The company offers a general occupational pension plan and insurance scheme aligned with local markets. Reference is made to the section on pension and insurance scheme. | N/A |
Employee share savings plan | Align and strengthen employee and shareholders’ interests and remunerate for long term commitment and value creation. | The share savings plan is offered to all employees in the group, provided no restrictions due to local legislation or business requirements. Participants are offered to purchase Equinor shares in the market limited to 5% of annual base salary. | If shares are kept for two calendar years of continued employment, the participants will be allocated bonus shares proportionate to their purchase. |
1) G represents the basic amount of the Norwegian social security system
2) Target value reflects satisfactory deliveries according to agreed goals
Equinor, Annual Report on Form 20-F 2018 147
Pension and insurance schemes
Members of the corporate executive committee in Equinor ASA are covered by the company’s general occupational pension scheme which is a defined contribution scheme with a contribution level of 7% below 7,1 G and 22% above 7,1 G. A defined benefit scheme is retained by a grandfathered group of employees. For new members of the corporate executive committee appointed after 13 February 2015, a cap on pension contribution at 12 G is applied. In lieu of pension accrual above 12 G a fixed salary addition is provided.
Members of the corporate executive committee appointed before 13 February 2015, will maintain their pension contribution above 12 G based on obligations in previously established agreements.
The chief executive officer and three executive vice presidents have individual early retirement pension agreements with the company.
The chief executive officer and one of the executive vice presidents have individual pension terms according to a previous standard arrangement implemented in October 2006. Subject to specific terms these executives are entitled to a pension amounting to 66% of pensionable salary and a retirement age of 62.
In 2017 it was agreed that the chief executive officer would not use his contractual right to retire at the age of 62. Sætre retains the right to early retirement, with nine months’ notice to the chair of the board, subject to endorsement by the board of directors. Sætre will retire no later than at age 67.
When calculating the number of years of membership in Equinor’s general pension plan, these agreements grant the right to an extra contribution time corresponding to half a year of extra membership for each year the individual has served as executive vice president.
In addition, two members of the corporate executive committee have individually agreed to a retirement age of 65 and an early retirement pension level amounting to 66% of pensionable salary.
The pension terms for executive vice presidents outlined above are the results of previously established individual agreements.
Equinor has implemented a general cap on pensionable income at 12 G for all new hires into the company employed as of 1 September 2017.
In addition to the pension benefits outlined above, the executive vice presidents in the parent company are offered disability and dependents’ benefits in accordance with Equinor’s general pension plan/defined benefit plan. Members of the corporate executive committee are covered by the general insurance schemes applicable within Equinor.
Severance pay arrangements
The chief executive officer and the executive vice presidents are entitled to a severance payment equivalent to six months’ salary, commencing after the six months’ notice period, when the resignation is requested by the company. The same amount of severance payment is also payable if the parties agree that the employment should be discontinued, and the executive vice president gives notice pursuant to a written agreement with the company. Any other payment earned by the executive vice president during the period of severance payment will be fully deducted. This relates to earnings from any employment or business activity where the executive vice president has active ownership.
The entitlement to severance payment is conditional on the chief executive officer or the executive vice president not being guilty of gross misconduct, gross negligence, disloyalty or other material breach of his/her duties.
As a general rule, the chief executive officer’s/executive vice president’s own notice will not instigate any severance payment.
Other benefits
The members of the corporate executive committee have benefits in-kind such as company car and electronic communication. They are also eligible for participation in the share saving scheme as described above.
Performance management, assessment and results essential for variable pay
Individual salary and annual variable pay reviews are based on the performance evaluation in Equinor’s performance development process.
Performance is evaluated in two dimensions; “What” we deliver and “How” we deliver. “What” we deliver (business delivery) is defined through the company’s performance framework “Ambition to Action”, which addresses strategic objectives, key performance Indicators (KPIs) and actions across the five perspectives; Safety, Security and Sustainability, People and Organisation, Operations, Market and Finance. Generally, Equinor believes in setting ambitious targets to inspire and drive strong performance.
148 Equinor, Annual Report on Form 20-F 2018
Goals on “How” we deliver are based on Equinor’s core values and leadership principles and address the behaviour required and expected to achieve the delivery goals.
Performance evaluation is holistic, involving both measurement and assessment. Since KPIs are indicators only, sound judgement is applied. Significant changes in assumptions are taken into account, as well as target ambition levels, sustainability of delivered results and strategic contribution.
The balanced approach, which involves a broad set of goals defined in relation to both “What” and “How” dimensions and an overall performance evaluation, significantly reduces the likelihood that remuneration policies may incentivise excessive risk-taking or have other material adverse effects.
In the performance contracts of the chief executive officer and chief financial officer, one of several targets is related to the company’s relative total shareholder return (TSR). The amount of the annual variable pay is decided based on an overall assessment of the performance of various targets including but not limited to the company's relative TSR.
Equinor, Annual Report on Form 20-F 2018 149
In 2018, the main business objectives and KPIs for each perspective were as outlined below. Each perspective was in addition supported by comprehensive plans and actions.
Strategic objectives | 2018 assessment |
Safety, security and sustainability | The strategic objectives and actions address safety, security and sustainability | Total Serious Incident Frequency (SIF) of 0.5 was on target and continued to improve from the 2017 level. The full year SIF is the lowest ever achieved. The development for the Total Recoverable Injury Frequency (TRIF) did not show similar improvements and the TRIF ended at the 2017 level of 2.8 and did not reach the target of 2.5. The number of oil and gas leakages improved significantly from 2017 and ended at 0.9, a score better than the target of 1.1. The 2018 CO2 intensity for the upstream portfolio ended at 9 kg/boe, around the 2017 level, and Equinor reached its target of being in the top quartile in the IOGP company report on this parameter. |
People and organisation | The strategic objectives and actions address a value based and high performing organisation | The score on Employee engagement exceeded the target, also improving from the 2017 level. The results on People development were above target, showing positive trends both in learning activities and in internal deployment. |
Operations | The strategic objectives and actions address reliable and cost-efficient operations, and industry transformation | The 2018 production was the highest in Equinor’s history (2,111 kboe/day) and exceeded the external guiding and target. The fixed operating costs and SG&A per boe increased somewhat in 2018, mainly due to new activity, and did not meet the target. Production efficiency was below target mainly impacted by regularity issues on a few mature assets and by start-up challenges on a new asset. |
Market | The strategic objectives and actions address a flexible and resilient energy portfolio | Total reserve replacement ratio ended at 213%, and organic ratio ended at 189%. This is well above the target of 100%, This was achieved through the sanctioning and acquisition of new projects, as well as revisions on a number of existing assets. The resource replacement was well above the target. Organic capex ended at USD 9.9 billion and was better than the original guiding and target of around USD 11 billion. This was due to a continuous focus on capital efficiency and strict prioritisation. Value creation from exploration did not reach the target, mainly due to lower-than-expected discovered volumes, with a high number of wells ongoing at year end, which will be completed in 2019. Equinor has secured access to attractive new acreage in 2018, both on NCS, GoM, UK and in Brazil. |
Finance | The strategic objectives and actions address cash generation, profitability and competitiveness | On Relative Shareholder Return, Equinor ranked number 2 in the peer group, a position in first quartile and better than the target of above average. On relative ROACE Equinor ranked number 2 in the peer group, which was better than the target of above average in the peer group. |
Board assessment of the chief executive officer’s performance In its assessment of the chief executive officer’s performance, a solid delivery on production and reserve- and resource replacement has been emphasised. The serious incident frequency is the lowest in the company’s history. The total recordable injury frequency did however not see the improvements targeted. Equinor has increased the production and further reduced the capex due to continuous focus on capital efficiency and strict prioritisation. The cost development (fixed opex and SG&A per barrel) did not reach the target and needs continued strong focus going forward. The value creation from exploration was below target, but Equinor has secured access to attractive new acreage. The sanctioning and acquisition of new projects as well as revision in existing projects, gave a strong all-time high reserve replacement ratio. The TSR and ROACE results are both first quartile. Employee engagement is strong and improving, supported by a dedicated focus on people development. |
| Fixed remuneration | | | | | | | | | | |
Members of the corporate executive committee (figures in USD thousand, except no. of shares)1), 2) | Fixed pay3) | Fixed salary addition4) | LTI 5) | Annual variable pay6) | Taxable benefits | 2018 Taxable compensation | Non-taxable benefits in-kind | Estimated pension cost7) | Estimated present value of pension obligation 8) | | 2017 Taxable compensation9), 15) | Number of shares at 31 December 2018 |
| | | | | | | | | | | | |
Eldar Sætre10) | 1,122 | 0 | 323 | 551 | 72 | 2,069 | 0 | 0 | 15,287 | | 1,812 | 65,294 |
Margareth Øvrum 11) | 516 | 0 | 115 | 234 | 49 | 914 | 5 | 0 | 7,926 | | 837 | 61,610 |
Timothy Dodson | 494 | 0 | 110 | 188 | 37 | 829 | 51 | 155 | 5,435 | | 689 | 31,826 |
Irene Rummelhoff | 433 | 71 | 106 | 258 | 27 | 895 | 0 | 31 | 1,518 | | 692 | 28,472 |
Jens Økland14) | 256 | 42 | 71 | 122 | 14 | 505 | 0 | 16 | 1,171 | | 700 | - |
Arne Sigve Nylund | 478 | 0 | 112 | 259 | 27 | 876 | 0 | 124 | 5,338 | | 720 | 15,729 |
Lars Christian Bacher | 497 | 0 | 107 | 232 | 33 | 869 | 54 | 137 | 3,033 | | 710 | 27,529 |
Hans Jakob Hegge14) | 239 | 41 | 67 | 123 | 21 | 490 | 0 | 15 | 1,641 | | 742 | - |
Jannicke Nilsson | 426 | 66 | 106 | 191 | 31 | 820 | 33 | 38 | 1,488 | | 712 | 42,597 |
Torgrim Reitan11) | 619 | 0 | 107 | 232 | 106 | 1,064 | 13 | 129 | 2,972 | | 1,058 | 39,876 |
Anders Opedal11), 14) | 228 | 27 | 45 | 93 | 35 | 429 | 0 | 11 | 1,521 | | na | 22,772 |
Pål Eitrheim14) | 154 | 23 | 39 | 72 | 4 | 292 | 0 | 11 | 1,202 | | na | 9,587 |
Alasdair Cook11), 12), 14) | 542 | 0 | 0 | 254 | 57 | 853 | 35 | 0 | 0 | | na | 2,112 |
John Knight13) | 597 | 0 | 0 | 0 | 111 | 708 | 0 | 0 | 0 | | 1,824 | - |
150 Equinor, Annual Report on Form 20-F 2018
1) All figures in the table are presented in USD based on average currency rates.
2018: NOK/USD = 0.1231, GBP/USD = 1.3350, BRL/USD = 0.2562 (2017: NOK/USD = 0.1211, GBP/USD = 1.2882).
The figures are presented on accrual basis.
2) All CEC members receive their remuneration in NOK except Alasdair Cook and John Knight who receive the remuneration in GBP, and Margareth Øvrum and Anders Opedal who receive the remuneration in BRL for the part of the year they were CEC members located in Brazil.
3) Fixed pay consists of base salary, fixed remuneration element, holiday allowance, cash compensation (Alasdair Cook) and other administrative benefits.
4) Fixed salary addition in lieu of pension accrual above 12 G (G is the base amount in the national insurance scheme).
5) The long-term incentive (LTI) element implies an obligation to invest the net amount in Equinor shares, including a lock-in period. The LTI element is presented the year it is granted for the members of the corporate executive committee employed by Equinor ASA.
6) Annual variable pay includes holiday allowance for corporate executive committee (CEC) members resident in Norway.
7) Estimated pension cost is calculated based on actuarial assumptions and pensionable salary (mainly base salary) at 31 December 2017 and is recognised as pension cost in the statement of income for 2018.
8) Eldar Sætre, Arne Sigve Nylund, Margareth Øvrum and Timothy Dodson are maintained in the closed defined benefit scheme, whereas the remaining members of corporate executive committee employed by Equinor ASA, is covered by the defined contribution pension scheme.
9) Includes figures for 2017 CEC members who are also CEC members in 2018.
10) Estimated present value of pension obligation for Eldar Sætre is based on retirement at the age of 67. Eldar Sætre has the right to retire at an earlier stage.
11) Terms and conditions for Torgrim Reitan, Alasdair Cook, Margareth Øvrum and Anders Opedal also include compensation according to Equinor’s international assignment terms.
12) Alasdair Cook’s fixed pay includes USD 39 thousand in lieu of pension contribution.
13) John Knight ended his employment as EVP GSB 30 April 2018. His fixed pay includes USD 49 thousand in lieu of pension contribution and a prorated fixed remuneration element of USD 267 thousand that replaced his variable pay arrangements for the performance year 2018.
14) Alasdair Cook was appointed EVP for GSB 1 May. Anders Opedal was appointed EVP for DPB 17 August and later EVP TPD 15 October. Pål Eitrheim was appointed EVP for NES 17 August. Hans Jakob Hegge left the CEC 1 August and Jens Økland left 17 August.
15) 2017 taxable compensation has been updated and increased for 4 executives due to inaccurate historical calculations.
All figures in USD thousand: Rummelhoff 35, Nilsson 34, Hegge 39 and Økland 33.
In addition, the years 2015-2016 have been updated and increased for Rummelhoff 19, Nilsson 1, Hegge 22, Økland 18 and Opedal 22.
There are no loans from the company to members of the corporate executive committee.
Equinor, Annual Report on Form 20-F 2018 151
Company performance modifier
Introduction
Based on initial approval by the annual general meeting in 2016, a company performance modifier was introduced to be applied in calculation of variable pay. The intention is to continue with the performance modifier in 2019. The relative total shareholder return is recommended as one of the criteria in the modifier. Thus, the proposal is submitted to the annual general meeting for approval, pursuant to the provisions in the Public Limited Companies Act § 5-6 third paragraph last sentence ref. § 6-16 a, first paragraph third sentence number 3.
Background
Equinor has an annual variable pay schemes (AVP) for members of the corporate executive committee. The schemes are described in section on remuneration policy and concept for the corporate executive committee of this declaration. Other executives, managers and employees in defined professional positions are also eligible for individual variable pay according to the company’s guidelines.
The company performance modifier is implemented to strengthen the link between the company’s overall financial results and the individual variable pay. The governmental guidelines on executive remuneration also underline that “there shall be a clear connection between the variable salary and the performance of the company.”
Proposal
Based on this, the performance modifier will be continued in 2019. The company performance will be assessed against two equally weighted measures: relative total shareholder return (TSR) and relative return on average capital employed (ROACE). TSR and ROACE are currently also applied as performance indicators in the corporate performance management system.
The results of these two performance measures are compared to our peers and determine Equinor’s relative position. A position of Quartile 1 means that Equinor is amongst the top scoring quartile of peer companies. A position of Quartile 4 means that Equinor is in the bottom performing quartile. In years with strong deliveries on relative TSR and ROACE, the matrix will result in the variable pay being modified with a factor higher than one and, correspondingly, lower than one in weak years. The combination of ratings for both measures, will act as a ‘multiplier’ according to the guideline in the matrix displayed below.

By applying relative numbers, the effect of fluctuating oil price will be reduced. Within the framework of 50 - 150%, the matrix is a guideline and the multiplier (percentages) may be adjusted if oil or gas price effects or other occurrences outside the control of the company are deemed to cause disproportionate results in a given year.
Subject to approval by the 2019 annual general meeting, the company performance modifier will be continued in calculations of annual variable pay for members of the corporate executive committee in the earning year 2019 with subsequent impact on annual variable pay in 2020. The modifier will also be applied in other variable pay schemes below the corporate executive level. Further application of the company performance modifier will also be assessed and decided if deemed appropriate.
The annual variable pay for members of the corporate executive committee will be within a framework of 50% of the fixed remuneration irrespective of the result of the modifier. Any deviations from this framework for members of the corporate executive committee will be explained in the board of director’s annual declaration on remuneration and other employment terms for Equinor’s corporate executive committee.
152 Equinor, Annual Report on Form 20-F 2018
3.8 Share ownership
The number of Equinor shares owned by the members of the board of directors and the executive committee and/or owned by their close associates is shown below. Individually, each member of the board of directors and the corporate executive committee owned less than 1% of the outstanding Equinor shares.
Equinor, Annual Report on Form 20-F 2018 153
154 Equinor, Annual Report on Form 20-F 2018
| | As of 31 December | As of 5 March |
Ownership of Equinor shares (including share ownership of «close associates») | 2018 | 2019 |
| | | |
Members of the corporate executive committee | | |
Eldar Sætre | 65,294 | 67,142 |
Lars Christian Bacher | 27,529 | 27,529 |
Jannicke Nilsson | 42,597 | 43,834 |
Anders Opedal | 22,772 | 23,437 |
Torgrim Reitan | 39,876 | 39,876 |
Alasdair Cook | 2,112 | 2,112 |
Tim Dodson | 31,826 | 33,123 |
Margareth Øvrum | 61,610 | 63,285 |
Arne Sigve Nylund | 15,729 | 15,729 |
Pål Eitrheim | 9,587 | 9,587 |
Irene Rummelhoff | 28,472 | 29,440 |
| | | 0 |
Members of the board of directors | | 0 |
Jon Erik Reinhardsen | 2,584 | 2,584 |
Roy Franklin | 0 | 0 |
Bjørn Tore Godal | 0 | 0 |
Jeroen van der Veer | 0 | 0 |
Anne Drinkwater | 0 | 0 |
Rebekka Glasser Herlofsen | 0 | 0 |
Wenche Agerup | 2,677 | 2,677 |
Per Martin Labråten | 1,653 | 1,836 |
Ingrid Elisabeth Di Valerio | 5,115 | 5,484 |
Stig Lægreid | 1,995 | 1,995 |
| | | |
Individually, each member of the corporate assembly owned less than 1% of the outstanding Equinor shares as of 31 December 2018 and as of 5 March 2019. In aggregate, members of the corporate assembly owned a total of 35,150 shares as of 31 December 2018 and a total of 38,020 shares as of 5 March 2019. Information about the individual share ownership of the members of the corporate assembly is presented in the section 3.8 Corporate assembly, board of directors and management.
The voting rights of members of the board of directors, the corporate executive committee and the corporate assembly do not differ from those of ordinary shareholders.
3.9 External auditor
Our independent registered public accounting firm (external auditor) is independent in relation to Equinor and is elected by the general meeting of shareholders. The external auditor's fee must be approved by the general meeting of shareholders.
Pursuant to the instructions for the board's audit committee approved by the board of directors, the audit committee is responsible for ensuring that the company is subject to an independent and effective external and internal audit. Every year, the external auditor presents a plan to the audit committee for the execution of the external auditor's work. The external auditor attends the meeting of the board of directors that deals with the preparation of the annual accounts.
The external auditor also participates in meetings of the audit committee. The audit committee considers all reports from the external auditor before they are considered by the board of directors. The audit committee meets at least five times a year and both the board and the board’s audit committee hold meetings with the internal auditor and the external auditor on a regular basis without the company’s management being present.
When evaluating the external auditor, emphasis is placed on the firm's qualifications, capacity, local and international availability and the size of the fee.
The audit committee evaluates and makes a recommendation to the board of directors, the corporate assembly and the general meeting of shareholders regarding the choice of external auditor. The committee is responsible for ensuring that the external auditor
Equinor, Annual Report on Form 20-F 2018 155
meets the requirements in Norway and in the countries where Equinor is listed. The external auditor is subject to the provisions of US securities legislation, which stipulates that a responsible partner may not lead the engagement for more than five consecutive years.
The audit committee's policies and procedures for pre-approval
In its instructions for the audit committee, the board of directors has delegated authority to the audit committee to pre-approve assignments to be performed by the external auditor. Within this pre-approval, the audit committee has issued further guidelines. The audit committee has issued guidelines for the management's pre-approval of assignments to be performed by the external auditor.
All audit-related and other services provided by the external auditor must be pre-approved by the audit committee. Provided that the types of services proposed are permissible under SEC guidelines, pre-approval is usually granted at a regular audit committee meeting. The chair of the audit committee has been authorised to pre-approve services that are in accordance with policies established by the audit committee that specify in detail the types of services that qualify. It is a condition that any services pre-approved in this manner are presented to the full audit committee at its next meeting. Some pre-approvals can therefore be granted by the chair of the audit committee if an urgent reply is deemed necessary.
Remuneration of the external auditor in 2016 – 2018
In the annual Consolidated financial statements and in the parent company's financial statements, the independent auditor's remuneration is split between the audit fee and the fee for audit-related and other services. The chair presents the breakdown between the audit fee and the fee for audit-related and other services to the annual general meeting of shareholders.
The following table sets out the aggregate fees related to professional services rendered by Equinor's external auditor KPMG AS, for the fiscal year 2018, 2017 and 2016.
Auditor's remuneration |
| Full year |
(in USD million, excluding VAT) | 2018 | 2017 | 2016 |
| | | |
Audit fee | 7.1 | 6.1 | 6.5 |
Audit related fee | 1.0 | 0.9 | 1.0 |
Tax fee | 0.0 | 0.0 | 0.1 |
Other service fee | 0.0 | 0.0 | 0.0 |
| | | |
Total | 8.1 | 7.0 | 7.5 |
| | | |
All fees included in the table have been approved by the board's audit committee.
Audit fee is defined as the fee for standard audit work that must be performed every year in order to issue an opinion on Equinor's Consolidated financial statements, on Equinor's internal control over annual reporting and to issue reports on the statutory financial statements. It also includes other audit services, which are services that only the independent auditor can reasonably provide, such as the auditing of non-recurring transactions and the application of new accounting policies, audits of significant and newly implemented system controls and limited reviews of quarterly financial results.
Audit-related fees include other assurance and related services provided by auditors, but not limited to those that can only reasonably be provided by the external auditor who signs the audit report, that are reasonably related to the performance of the audit or review of the company's financial statements, such as acquisition due diligence, audits of pension and benefit plans, consultations concerning financial accounting and reporting standards.
Other services fees include services, if any, provided by the auditors within the framework of the Sarbanes-Oxley Act, i.e. certain agreed procedures.
In addition to the figures in the table above, the audit fees and audit-related fees relating to Equinor lated fees relating to Statoil-157157157157157157157157157157157157157157157157157157157157157157157157157157157157157157157157157157157157157157157157157157157157157157157157157157157157157157157157157157157157157157157157157157157157157157157157157157157157157157157157157157157157157157157157157157157157157157157157operated licences paid to KPMG for the years 2018, 2017 and 2016 amounted to USD 0.9 million, USD 0.8 million and USD 0.8 million, respectively.
Item 16 F: Change in Registrant's Certifying Accountant
On 12 December 2018, Equinor’s board of directors decided to propose to the corporate assembly for further approval at its annual general meeting on 15 May 2019 that Ernst & Young AS (EY) be appointed as the company's auditor for the financial year 2019. This decision was taken following a competitive audit tender.
Under Norwegian law, the corporate assembly has the mandate to propose the independent auditor for shareholder approval at the annual general meeting.
156 Equinor, Annual Report on Form 20-F 2018
KPMG AS (KPMG), Equinor’s independent registered public accounting firm since 2012, is responsible for the issuance of the audit reports included in this annual report and Form 20-F for the year ended 31 December 2018. Subject to approval at the annual general meeting, EY will be Equinor’s auditor effective after the annual general meeting on 15 May 2019. EY will be responsible for the issuance of Equinor’s audit report included in the annual report and Form 20-F for the year ending 31 December 2019. A transition between KPMG and EY has been planned during the first quarter of 2019.
KPMG’s reports on Equinor’s Consolidated financial statements for the years ended 31 December 2018 and 2017, did not contain an adverse opinion or a disclaimer of opinion and were not qualified or modified as to uncertainty, audit scope or accounting principle, except KPMG’s report on the Consolidated financial statements of Equinor ASA and subsidiaries as of and for the year ended 31 December 2018, contained a separate paragraph referring to a change in the presentation of certain elements within the Consolidated statement of cash flows, and a change in policy for accounting for lifting imbalances. Also, KPMG’s report on the Consolidated financial statements of Equinor ASA and subsidiaries as of and for the year ended 31 December 2017, contained a separate paragraph referring to a change in the presentation of net interest costs related to defined benefit plans. The audit reports of KPMG on the effectiveness of internal control over financial reporting as of 31 December 2018 and 2017 did not contain any adverse opinion or disclaimer of opinion, nor were they qualified or modified as to uncertainty, audit scope, or accounting principles, except that KPMG’s report as of 31 December 2017 indicates that Equinor did not maintain effective internal control over financial reporting as of 31 December 2017 because of the effect of a material weakness on the achievement of the objectives of the control criteria and contains an explanatory paragraph that states Equinor ASA had a material weakness related to controls and procedures for the identification, assessment and timely and appropriate communication to the board audit committee of questions or concerns (including allegation of misconduct) raised by employees in connection with termination of their employment (otherwise than through Equinor ASA’s external Ethics helpline).
During the years ended 31 December 2018 and 2017, and to 15 March 2019, there were no disagreements with KPMG, whether or not resolved, on any matter of accounting principles or practices, financial statement disclosure, or auditing scope or procedure, which, if not resolved to KPMG’s satisfaction, would have caused them to make reference to the subject matter of the disagreement in connection with any reports it would have issued.
During the years ended 31 December 2018 and 2017, and to 15 March 2019, there were no reportable events as that term is defined in Item 16F(a)(1)(v) of Form 20-F; other than described below.
As discussed in Equinor’s annual report on Form 20-F for the year ended 31 December 2017 (the “2017 20-F”), Equinor’s management concluded that Equinor’s internal control over financial reporting was not effective as of 31 December 2017 due to a material weakness in controls and procedures as described above. The allegations were subject to thorough investigations with external advisors, and no material misstatements were identified. There was no effect on the 2017 Consolidated financial statements, or earlier periods, related to this matter.
Apart from the material weakness described in the 2017 20-F, Equinor’s management did not identify any other deficiencies that would have led management to conclude that Equinor’s internal control over financial reporting was not effective as of 31 December 2017.
Equinor’s board of directors discussed the material weakness with KPMG and Equinor has authorised KPMG to respond fully to the inquires of the successor independent registered public accounting firm concerning this matter.
Equinor has provided KPMG with a copy of the foregoing disclosure and has requested that KPMG furnish to Equinor a letter addressed to the Securities and Exchange Commission stating whether KPMG agrees with such disclosure. We have included as Exhibit 15(a)(iv) to this Form 20-F a copy of the letter from KPMG as required by Item 16F(a)(3) of Form 20-F.
During the fiscal years ended 31 December 2018 and 31 December 2017, and to 15 March 2019, Equinor did not consult with EY regarding the application of accounting principles to a specific completed or contemplated transaction or regarding the type of audit opinion that might be rendered by EY on Equinor’s Consolidated financial statements or the effectiveness of internal control over financial reporting. Further, EY did not provide any written or oral advice that was an important factor considered by Equinor in reaching a decision as to any such accounting, auditing or financial reporting matter or any matter being the subject of disagreement or defined as a reportable event or any other matter as defined in Item 16F(a)(1)(v) of Form 20-F.
3.10 Risk management and internal controls
Risk management
The board focuses on ensuring adequate control of the company's internal control and overall risk management. Two times per year, the board is presented with and discusses the main risks and risk issues Equinor is facing, based on enterprise risk management. The board's audit committee assists the board and acts as a preparatory body in connection with monitoring of the company's internal control,
Equinor, Annual Report on Form 20-F 2018 157
internal audit and risk management systems. The board's safety, sustainability and ethics committee monitors and assesses safety, sustainability and climate risks which are relevant for Equinor's operations and both committees report regularly to the full board.
Equinor manages risk to make sure that operations are safe and in compliance with requirements. Our overall risk management approach includes continuously assessing and managing risks related to the value chain in order to support the achievement of our principal objectives, i.e. value creation and avoiding incidents.
The company has a separate corporate risk committee chaired by the chief financial officer. The committee meets at least five times a year to give advice and make recommendations on Equinor's enterprise risk management. Further information about the company's risk management is presented in section 2.11 of the form 20-F Risk review.
All risks are related to Equinor's value chain - from access, maturing, project execution and operations to market. In addition to the financial impact these risks could have on Equinor's cash flows, we have also implemented procedures and systems to reduce safety, security and integrity incidents (such as fraud and corruption), as well as any reputation impact resulting from human rights, labour standards and transparency issues. Most of the risks are managed by principal business area line managers. Some operational risks are insured by the captive insurance company, which operates in the Norwegian and international insurance markets.
Controls and procedures
This section describes controls and procedures relating to financial reporting.
Evaluation of disclosure controls and procedures
The management, with the participation of the chief executive officer and chief financial officer, has evaluated the effectiveness of the design and operation of disclosure controls and procedures pursuant to Exchange Act Rule 13a-15(b) as of 31 December 2018. Based on that evaluation, the chief executive officer and chief financial officer have concluded that these disclosure controls and procedures are effective at a reasonable level of assurance.
In order to facilitate the evaluation, the disclosure committee reviews material disclosures made by Equinor for any errors, misstatements and omissions. The disclosure committee is chaired by the chief financial officer. It consists of the heads of investor relations, accounting and financial compliance, performance management and controlling, tax and the general counsel and it may be supplemented by other internal and external personnel. The head of the internal audit is an observer at the committee's meetings.
In designing and evaluating disclosure controls and procedures, management, with the participation of the chief executive officer and chief financial officer, recognised that any controls and procedures, no matter how well designed and operated, can only provide reasonable assurance that the desired control objectives will be achieved, and that the management must necessarily exercise judgment when evaluating the cost-benefit aspects of possible controls and procedures. Because of the limitations inherent in all control systems, no evaluation of controls can provide absolute assurance that all control issues and any instances of fraud in the company have been detected.
The management's report on internal control over financial reporting
The management of Equinor ASA is responsible for establishing and maintaining adequate internal control over financial reporting. Our internal control over financial reporting is a process designed, under the supervision of the chief executive officer and chief financial officer, to provide reasonable assurance regarding the reliability of financial reporting and the preparation of Equinor's financial statements for external reporting purposes in accordance with IFRS EU. The accounting policies applied by the group also comply with IFRS IASB.
The management has assessed the effectiveness of internal control over financial reporting based on the Internal Control – Integrated Framework (2013) issued by the Committee of Sponsoring Organizations of the Treadway Commission (COSO). Based on this assessment, the management has concluded that Equinor’s internal control over financial reporting as of 31 December 2018 was effective.
Equinor's internal control over financial reporting includes policies and procedures that pertain to the maintenance of records that, in reasonable detail, accurately and fairly reflect transactions and dispositions of assets, provide reasonable assurance that transactions are recorded in the manner necessary to permit the preparation of financial statements in accordance with IFRS, and that receipts and expenditures are only carried out in accordance with the authorisation of the management and directors of Equinor; and provide reasonable assurance regarding the prevention or timely detection of any unauthorised acquisition, use or disposition of Equinor's assets that could have a material effect on the financial statements.
158 Equinor, Annual Report on Form 20-F 2018
Because of its inherent limitations, internal control over financial reporting may not prevent or detect all misstatements. Moreover, projections of any evaluation of the effectiveness of internal control to future periods are subject to a risk that controls may become inadequate because of changes in conditions and that the degree of compliance with the policies or procedures may deteriorate.
Attestation report of the registered public accounting firm
The effectiveness of internal control over financial reporting as of 31 December 2018 has been audited by KPMG AS, an independent registered accounting firm that also audits the Consolidated financial statements in this report. Their audit report on the internal control over financial reporting is included in section 4.1 Consolidated financial statements in this report.
Remediation of material weakness in prior year
As of 31 December 2018, management has completed the remediation efforts related to the material weakness as of 31 December 2017 to enhance controls and procedures for the identification, assessment and timely and appropriate communication to the board audit committee of questions or concerns (including allegations of misconduct) raised by employees in connection with termination of their employment relating to issues that could potentially have a material impact on the Consolidated financial statements and internal controls over financial reporting (otherwise than through Equinor’s external Ethics help line established by the board audit committee).
Management undertook remediation efforts and completed the remediation plan to address the material weakness as follows:
· Enhancement of the precision level of written controls, policies and procedures regarding identification, assessment and timely communication to the board audit committee
· Enhanced training of Equinor employees, with respect to these policies and relevant procedures
Management believes the foregoing efforts effectively remediated the material weakness.
Changes in internal control over financial reporting
Other than the remediation of the material weakness as of 31 December 2017 as described above, no changes occurred in our internal control over financial reporting during the period that have materially affected, or are reasonably likely to materially affect, our internal control over financial reporting.
Equinor, Annual Report on Form 20-F 2018 159
4.1 Consolidated financial statements
of the Equinor group
Report of Independent Registered Public Accounting Firm
The board of directors and shareholders of Equinor ASA
Opinion on the Consolidated Financial Statements
We have audited the accompanying consolidated balance sheets of Equinor ASA and subsidiaries (the Company) as of 31 December 2018 and 2017, the related consolidated statements of income, comprehensive income, changes in equity, and cash flows for each of the years in the three‑year period ended 31 December 2018, and the related notes (collectively, the consolidated financial statements). In our opinion, the consolidated financial statements present fairly, in all material respects, the financial position of the Company as of 31 December 2018 and 2017, and the results of its operations and its cash flows for each of the years in the three‑year period ended 31 December 2018, in conformity with International Financial Reporting Standards as issued by the International Accounting Standards Board and International Financial Reporting Standards as adopted by the European Union.
We also have audited, in accordance with the standards of the Public Company Accounting Oversight Board (United States) (PCAOB), the Company’s internal control over financial reporting as of 31 December 2018, based on criteria established in Internal Control – Integrated Framework (2013) issued by the Committee of Sponsoring Organizations of the Treadway Commission, and our report dated 5 March 2019 expressed an unqualified opinion on the effectiveness of the Company’s internal control over financial reporting.
Changes in Accounting Policy
As discussed in Note 2 and Note 27 to the consolidated financial statements, with effect from 1 January 2018, the Company has elected to change its policy regarding the presentation of certain elements related to derivatives, non-cash currency effects and working capital in the consolidated statement of cash flows, and the Company also elected to change its policy for accounting for lifting imbalances, impacting the recognition of revenue from the production of oil and gas properties in which the Company shares an interest with other companies.
Basis for Opinion
These consolidated financial statements are the responsibility of the Company’s management. Our responsibility is to express an opinion on these consolidated financial statements based on our audits. We are a public accounting firm registered with the PCAOB and are required to be independent with respect to the Company in accordance with the U.S. federal securities laws and the applicable rules and regulations of the Securities and Exchange Commission and the PCAOB.
We conducted our audits in accordance with the standards of the PCAOB. Those standards require that we plan and perform the audit to obtain reasonable assurance about whether the consolidated financial statements are free of material misstatement, whether due to error or fraud. Our audits included performing procedures to assess the risks of material misstatement of the consolidated financial statements, whether due to error or fraud, and performing procedures that respond to those risks. Such procedures included examining, on a test basis, evidence regarding the amounts and disclosures in the consolidated financial statements. Our audits also included evaluating the accounting principles used and significant estimates made by management, as well as evaluating the overall presentation of the consolidated financial statements. We believe that our audits provide a reasonable basis for our opinion.
We have served as the Company’s auditor since 2012.
160 Equinor, Annual Report on Form 20-F 2018
/s/ KPMG AS
Stavanger, Norway
5 March 2019
Report of KPMG on Equinor’s internal control over financial reporting
The board of directors and shareholders of Equinor ASA
Opinion on Internal Control Over Financial Reporting
We have audited Equinor ASA’s and subsidiaries (the Company) internal control over financial reporting as of 31 December 2018, based on criteria established in Internal Control – Integrated Framework (2013) issued by the Committee of Sponsoring Organizations of the Treadway Commission. In our opinion, the Company maintained, in all material respects, effective internal control over financial reporting as of 31 December 2018, based on criteria established in Internal Control – Integrated Framework (2013) issued by the Committee of Sponsoring Organizations of the Treadway Commission.
We also have audited, in accordance with the standards of the Public Company Accounting Oversight Board (United States) (PCAOB), the consolidated balance sheets of the Company as of 31 December 2018 and 2017, the related consolidated statements of income, comprehensive income, changes in equity, and cash flows for each of the years in the three-year period ended 31 December 2018, and the related notes (collectively, the consolidated financial statements), and our report dated 5 March 2019 expressed an unqualified opinion on those consolidated financial statements.
Basis for Opinion
The Company’s management is responsible for maintaining effective internal control over financial reporting and for its assessment of the effectiveness of internal control over financial reporting, included in the accompanying management's report on internal control over financial reporting. Our responsibility is to express an opinion on the Company’s internal control over financial reporting based on our audit. We are a public accounting firm registered with the PCAOB and are required to be independent with respect to the Company in accordance with the U.S. federal securities laws and the applicable rules and regulations of the Securities and Exchange Commission and the PCAOB.
We conducted our audit in accordance with the standards of the PCAOB. Those standards require that we plan and perform the audit to obtain reasonable assurance about whether effective internal control over financial reporting was maintained in all material respects. Our audit of internal control over financial reporting included obtaining an understanding of internal control over financial reporting, assessing the risk that a material weakness exists, and testing and evaluating the design and operating effectiveness of internal control based on the assessed risk. Our audit also included performing such other procedures as we considered necessary in the circumstances. We believe that our audit provides a reasonable basis for our opinion.
Definition and Limitations of Internal Control Over Financial Reporting
A company’s internal control over financial reporting is a process designed to provide reasonable assurance regarding the reliability of financial reporting and the preparation of financial statements for external purposes in accordance with generally accepted accounting principles. A company’s internal control over financial reporting includes those policies and procedures that (1) pertain to the maintenance of records that, in reasonable detail, accurately and fairly reflect the transactions and dispositions of the assets of the company; (2) provide reasonable assurance that transactions are recorded as necessary to permit preparation of financial statements in accordance with generally accepted accounting principles, and that receipts and expenditures of the company are being made only in accordance with authorizations of management and directors of the company; and (3) provide reasonable assurance regarding prevention or timely detection of unauthorized acquisition, use, or disposition of the company’s assets that could have a material effect on the financial statements.
Because of its inherent limitations, internal control over financial reporting may not prevent or detect misstatements. Also, projections of any evaluation of effectiveness to future periods are subject to the risk that controls may become inadequate because of changes in conditions, or that the degree of compliance with the policies or procedures may deteriorate.
Equinor, Annual Report on Form 20-F 2018 161
/s/ KPMG AS
Stavanger, Norway
5 March 2019
162 Equinor, Annual Report on Form 20-F 2018
CONSOLIDATED STATEMENT OF INCOME | | | | |
| | Full year |
(in USD million) | Note | 2018 | 2017 | 2016 |
| | | | |
Revenues | 3, 27 | 78,555 | 60,971 | 45,688 |
Net income/(loss) from equity accounted investments | 12 | 291 | 188 | (119) |
Other income | 4 | 746 | 27 | 304 |
| | | | |
Total revenues and other income | 3 | 79,593 | 61,187 | 45,873 |
| | | | |
Purchases [net of inventory variation] | | (38,516) | (28,212) | (21,505) |
Operating expenses | | (9,528) | (8,763) | (9,025) |
Selling, general and administrative expenses | | (758) | (738) | (762) |
Depreciation, amortisation and net impairment losses | 10, 11 | (9,249) | (8,644) | (11,550) |
Exploration expenses | 11 | (1,405) | (1,059) | (2,952) |
| | | | |
Net operating income/(loss) | 3 | 20,137 | 13,771 | 80 |
| | | | |
Net financial items | 8 | (1,263) | (351) | (258) |
| | | | |
Income/(loss) before tax | | 18,874 | 13,420 | (178) |
| | | | |
Income tax | 9 | (11,335) | (8,822) | (2,724) |
| | | | |
Net income/(loss) | | 7,538 | 4,598 | (2,902) |
| | | | |
Attributable to equity holders of the company | | 7,535 | 4,590 | (2,922) |
Attributable to non-controlling interests | | 3 | 8 | 20 |
| | | | |
Basic earnings per share (in USD) | | 2.27 | 1.40 | (0.91) |
Diluted earnings per share (in USD) | | 2.27 | 1.40 | (0.91) |
Weighted average number of ordinary shares outstanding (in millions) | | 3,326 | 3,268 | 3,195 |
Weighted average number of ordinary shares outstanding, diluted (in millions) | | 3,335 | 3,288 | 3,207 |
Equinor, Annual Report on Form 20-F 2018 163
CONSOLIDATED STATEMENT OF COMPREHENSIVE INCOME |
| | Full year |
(in USD million) | Note | 2018 | 2017 | 2016 |
| | | | |
Net income/(loss) | | 7,538 | 4,598 | (2,902) |
| | | | |
Actuarial gains/(losses) on defined benefit pension plans | 19 | (110) | 172 | (503) |
Income tax effect on income and expenses recognised in OCI1) | | 22 | (38) | 129 |
Items that will not be reclassified to the Consolidated statement of income | | (88) | 134 | (374) |
| | | | |
Currency translation adjustments | | (1,652) | 1,710 | 17 |
Net gains/(losses) from available for sale financial assets | | 64 | (64) | 0 |
Share of OCI from equity accounted investments | | (5) | (40) | 0 |
Items that may subsequently be reclassified to the Consolidated statement of income | | (1,593) | 1,607 | 17 |
| | | | |
Other comprehensive income/(loss) | | (1,681) | 1,741 | (357) |
| | | | |
Total comprehensive income/(loss) | | 5,857 | 6,339 | (3,259) |
| | | | |
Attributable to the equity holders of the company | | 5,855 | 6,331 | (3,279) |
Attributable to non-controlling interests | | 3 | 8 | 20 |
1) Other Comprehensive Income (OCI).
164 Equinor, Annual Report on Form 20-F 2018
CONSOLIDATED BALANCE SHEET | | | |
| | At 31 December |
(in USD million) | Note | 2018 | 2017 |
| | | |
ASSETS | | | |
Property, plant and equipment | 10 | 65,262 | 63,637 |
Intangible assets | 11 | 9,672 | 8,621 |
Equity accounted investments | 12 | 2,863 | 2,551 |
Deferred tax assets | 9 | 3,304 | 2,441 |
Pension assets | 19 | 831 | 1,306 |
Derivative financial instruments | 26 | 1,032 | 1,603 |
Financial investments | 13 | 2,455 | 2,841 |
Prepayments and financial receivables | 13 | 1,033 | 912 |
| | | |
Total non-current assets | | 86,452 | 83,911 |
| | | |
Inventories | 14 | 2,144 | 3,398 |
Trade and other receivables | 15 | 8,998 | 9,425 |
Derivative financial instruments | 26 | 318 | 159 |
Financial investments | 13 | 7,041 | 8,448 |
Cash and cash equivalents | 16 | 7,556 | 4,390 |
| | | |
Total current assets | | 26,056 | 25,820 |
| | | |
Assets classified as held for sale | 4 | 0 | 1,369 |
| | | |
Total assets | | 112,508 | 111,100 |
| | | |
EQUITY AND LIABILITIES | | | |
Shareholders’ equity | | 42,970 | 39,861 |
Non-controlling interests | | 19 | 24 |
| | | |
Total equity | 17 | 42,990 | 39,885 |
| | | |
Finance debt | 18, 22 | 23,264 | 24,183 |
Deferred tax liabilities | 9 | 8,671 | 7,654 |
Pension liabilities | 19 | 3,820 | 3,904 |
Provisions | 20 | 15,952 | 15,557 |
Derivative financial instruments | 26 | 1,207 | 900 |
| | | |
Total non-current liabilities | | 52,914 | 52,198 |
| | | |
Trade, other payables and provisions | 21 | 8,369 | 9,737 |
Current tax payable | | 4,654 | 4,057 |
Finance debt | 18 | 2,463 | 4,091 |
Dividends payable | 17 | 766 | 729 |
Derivative financial instruments | 26 | 352 | 403 |
| | | |
Total current liabilities | | 16,605 | 19,017 |
| | | |
Total liabilities | | 69,519 | 71,214 |
| | | |
Total equity and liabilities | | 112,508 | 111,100 |
Equinor, Annual Report on Form 20-F 2018 165
CONSOLIDATED STATEMENT OF CHANGES IN EQUITY |
(in USD million) | Share capital | Additional paid-in capital | Retained earnings1) | Currency translation adjustments | OCI from equity accounted investments | Shareholders' equity | Non-controlling interests | Total equity |
| | | | | | | | |
At 31 December 2015 | 1,139 | 5,720 | 38,693 | (5,281) | 0 | 40,271 | 36 | 40,307 |
Net income/(loss) | | | (2,922) | | | (2,922) | 20 | (2,902) |
Other comprehensive income/(loss) | | | (374) | 17 | 0 | (357) | | (357) |
Total comprehensive income/(loss) | | | | | | | | (3,259) |
Dividends | 17 | 887 | (2,824) | | | (1,920) | | (1,920) |
Other equity transactions | | 1 | 0 | | | 2 | (30) | (28) |
| | | | | | | | |
At 31 December 2016 | 1,156 | 6,607 | 32,573 | (5,264) | 0 | 35,072 | 27 | 35,099 |
| | | | | | | | |
Net income/(loss) | | | 4,590 | | | 4,590 | 8 | 4,598 |
Other comprehensive income/(loss) | | | 71 | 1,710 | (40) | 1,741 | | 1,741 |
Total comprehensive income/(loss) | | | | | | | | 6,339 |
Dividends | 24 | 1,333 | (2,891) | | | (1,534) | | (1,534) |
Other equity transactions | | (8) | 0 | | | (8) | (10) | (18) |
| | | | | | | | |
At 31 December 2017 | 1,180 | 7,933 | 34,342 | (3,554) | (40) | 39,861 | 24 | 39,885 |
| | | | | | | | |
Net income/(loss) | | | 7,535 | | | 7,535 | 3 | 7,538 |
Other comprehensive income/(loss) | | | (24) | (1,652) | (5) | (1,681) | | (1,681) |
Total comprehensive income/(loss) | | | | | | | | 5,857 |
Dividends | 5 | 333 | (3,064) | | | (2,726) | | (2,726) |
Other equity transactions | | (19) | 0 | | | (19) | (8) | (27) |
| | | | | | | | |
At 31 December 2018 | 1,185 | 8,247 | 38,790 | (5,206) | (44) | 42,970 | 19 | 42,990 |
1) Numbers previously published under Available for sale financial assets column are transferred to Retained earnings column.
For more information, see note 27 Changes in accounting policies.
Refer to note 17 Shareholders’ equity and dividends.
166 Equinor, Annual Report on Form 20-F 2018
CONSOLIDATED STATEMENT OF CASH FLOWS | | | | |
| | Full year | |
| | 2018 | 2017 | 2016 |
(in USD million) | Note | | (restated*) | (restated*) |
| | | | |
Income/(loss) before tax | | 18,874 | 13,420 | (178) |
| | | | |
Depreciation, amortisation and net impairment losses | 10 | 9,249 | 8,644 | 11,550 |
Exploration expenditures written off | 11 | 357 | (8) | 1,800 |
(Gains) losses on foreign currency transactions and balances | | 166 | (127) | 120 |
(Gains) losses on sales of assets and businesses | 4 | (648) | 395 | (110) |
(Increase) decrease in other items related to operating activities | | (526) | (884) | 877 |
(Increase) decrease in net derivative financial instruments | 26 | 409 | 19 | 1,198 |
Interest received | | 176 | 148 | 134 |
Interest paid | | (441) | (622) | (548) |
| | | | |
Cash flows provided by operating activities before taxes paid and working capital items | | 27,615 | 20,985 | 14,843 |
| | | | |
Taxes paid | | (9,010) | (5,766) | (4,386) |
| | | | |
(Increase) decrease in working capital | | 1,090 | (417) | (1,639) |
| | | | |
Cash flows provided by operating activities | | 19,694 | 14,802 | 8,818 |
| | | | |
Cash used in business combinations | 4 | (3,557) | 0 | 0 |
Capital expenditures and investments | | (11,367) | (10,755) | (12,191) |
(Increase) decrease in financial investments | | 1,358 | 592 | 877 |
(Increase) decrease in derivative financial instruments | | 238 | (439) | 216 |
(Increase) decrease in other items interest bearing | | 343 | 79 | 107 |
Proceeds from sale of assets and businesses | 4 | 1,773 | 406 | 761 |
| | | | |
Cash flows used in investing activities | | (11,212) | (10,117) | (10,230) |
| | | | |
New finance debt | 18 | 998 | 0 | 1,322 |
Repayment of finance debt | | (2,875) | (4,775) | (1,072) |
Dividend paid | 17 | (2,672) | (1,491) | (1,876) |
Net current finance debt and other | | (476) | 444 | (333) |
| | | | |
Cash flows provided by (used in) financing activities | 18 | (5,024) | (5,822) | (1,959) |
| | | | |
Net increase (decrease) in cash and cash equivalents | | 3,458 | (1,137) | (3,371) |
| | | | |
Effect of exchange rate changes on cash and cash equivalents | | (292) | 436 | (152) |
Cash and cash equivalents at the beginning of the period (net of overdraft) | 16 | 4,390 | 5,090 | 8,613 |
| | | | |
Cash and cash equivalents at the end of the period (net of overdraft) | 16 | 7,556 | 4,390 | 5,090 |
| | | | |
* Related to a change in accounting policies, see note 27 Changes in accounting policies for more information.
Cash and cash equivalents include bank overdrafts which were zero at 31 December 2018, 2017 and 2016.
Interest paid in cash flows provided by operating activities is excluding capitalised interest of USD 552 million at 31 December 2018, USD 454 million at 31 December 2017 and USD 355 million at 31 December 2016. Capitalised interest is included in Capital expenditures and investments in cash flows used in investing activities.
Equinor, Annual Report on Form 20-F 2018 167
Notes to the Consolidated financial statements
1 Organisation
Equinor ASA, originally Den Norske Stats Oljeselskap AS, was founded in 1972 and is incorporated and domiciled in Norway. The address of its registered office is Forusbeen 50, N-4035 Stavanger, Norway.
Statoil ASA changed its name to Equinor ASA following approval of the name change by the company’s annual general meeting on 15 May 2018.
Equinor ASA’s shares are listed on the Oslo Børs (OSL, Norway) and the New York Stock Exchange (NYSE, USA).
The Equinor group's business consists principally of the exploration, production, transportation, refining and marketing of petroleum and petroleum-derived products and other forms of energy.
All the Equinor group's oil and gas activities and net assets on the Norwegian continental shelf are owned by Equinor Energy AS, a 100% owned operating subsidiary. Equinor Energy AS is co-obligor or guarantor of certain debt obligations of Equinor ASA.
The Consolidated financial statements of Equinor for the full year 2018 were authorised for issue in accordance with a resolution of the board of directors on 5 March 2019.
2 Significant accounting policies
Statement of compliance
The Consolidated financial statements of Equinor ASA and its subsidiaries (Equinor) have been prepared in accordance with International Financial Reporting Standards (IFRSs) as adopted by the European Union (EU) and with IFRSs as issued by the International Accounting Standards Board (IASB), effective at 31 December 2018.
Basis of preparation
The financial statements are prepared on the historical cost basis with some exceptions, as detailed in the accounting policies set out below. The policies described in the main part of this note are the ones in effect at the balance sheet date, and these policies have been applied consistently to all periods presented in these Consolidated financial statements, except as otherwise noted in disclosure related to the impact of policy changes following the adoption of new accounting standards in 2018. Certain amounts in the comparable years have been restated to conform to current year presentation. The subtotals and totals in some of the tables may not equal the sum of the amounts shown due to rounding.
Operating related expenses in the Consolidated statement of income are presented as a combination of function and nature in conformity with industry practice. Purchases [net of inventory variation] and Depreciation, amortisation and net impairment losses are presented in separate lines based on their nature, while Operating expenses and Selling, general and administrative expenses as well as Exploration expenses are presented on a functional basis. Significant expenses such as salaries, pensions, etc. are presented by their nature in the notes to the Consolidated financial statements.
Changes in significant accounting policies in the current period
With effect from 1 January 2018, Equinor implemented IFRS 9 Financial Instruments and IFRS 15 Revenue from Contracts with Customers. As of the same date, Equinor voluntarily changed its policy for recognition of revenue from the production of oil and gas properties in which Equinor shares an interest with other companies, as well as its policy for presentation of certain elements related to derivatives, non-cash currency effects and working capital items in the statement of cash flows. Reference is made to Note 27 Changes in accounting policies for further information about these policy changes.
Standards, amendments to standards, and interpretations of standards, issued but not yet adopted
At the date of these Consolidated financial statements, the following standards, amendments to standards and interpretations of standards applicable to Equinor have been issued, but were not yet effective:
IFRS 16 Leases
IFRS 16 will be implemented by Equinor on 1 January 2019. Reference is made to note 23 Implementation of IFRS 16 Leases for further information about the standard, the policy choices made by Equinor, and the IFRS 16 implementation impact.
Other standards, amendments to standards and interpretations of standards
The amendments to IFRS 10 Consolidated Financial Statements and IAS 28 Investments in Associates and Joint Ventures, issued in 2014 and effective from a future date to be determined by the IASB, establish requirements for the accounting for sales or contributions of assets between an investor and its associate or joint venture. The amendments are to be applied prospectively. Equinor has not determined an adoption date for the amendments.
168 Equinor, Annual Report on Form 20-F 2018
The amendments to IFRS 3 Business Combinations, issued in October 2018 and effective from 1 January 2020, introduce improvements to the definition of a business. The amendments also establish an optional test to identify a concentration of fair value that, if applied and met, would lead to the conclusion that an acquired set of activities and assets is not a business. The amendments are to be applied for relevant transactions that occur on or after the implementation date. Equinor has not yet determined an adoption date for the amendments.
Other standards, amendments to standards, and interpretations of standards, issued but not yet effective, are either not expected to impact Equinor’s Consolidated financial statements materially, or are not expected to be relevant to Equinor's Consolidated financial statements upon adoption.
Voluntary change in significant accounting policies decided upon, but not yet adopted
In 2018, Equinor voluntarily changed its policy for recognition of revenue from the production of oil and gas properties in which Equinor shares an interest with other companies, from previously recognising revenue on the basis of volumes lifted and sold to customers during the period (the sales method) to instead recognising revenue based on Equinor’s ownership in producing fields. Reference is made to note 27 Changes in accounting policies for further details. The issue of which method is the most appropriate for reflecting revenues related to lifting imbalances, and how to recognise revenue from the production of oil and gas properties in which an entity shares an interest with other companies, has been the subject of discussions in the IFRS Interpretations Committee (IFRIC) during the last months of 2018 and into 2019. Based on the IFRIC discussions, Equinor has decided to return to the sales method. This change in policy will be implemented on 1 January 2019 and the impact on Equinor’s equity upon implementation is expected to be immaterial.
Basis of consolidation
The Consolidated financial statements include the accounts of Equinor ASA and its subsidiaries and include Equinor’s interest in jointly controlled and equity accounted investments.
Subsidiaries
Entities are determined to be controlled by Equinor, and consolidated in Equinor's financial statements, when Equinor has power over the entity, ability to use that power to affect the entity's returns, and exposure to, or rights to, variable returns from its involvement with the entity.
All intercompany balances and transactions, including unrealised profits and losses arising from Equinor's internal transactions, have been eliminated in full.
Non-controlling interests are presented separately within equity in the balance sheet.
Joint operations and similar arrangements, joint ventures and associates
A joint arrangement is present where Equinor holds a long-term interest which is jointly controlled by Equinor and one or more other venturers under a contractual arrangement in which decisions about the relevant activities require the unanimous consent of the parties sharing control. Such joint arrangements are classified as either joint operations or joint ventures.
The parties to a joint operation have rights to the assets and obligations for the liabilities, relating to their respective share of the joint arrangement. In determining whether the terms of contractual arrangements and other facts and circumstances lead to a classification as joint operations, Equinor considers the nature of products and markets of the arrangements and whether the substance of their agreements is that the parties involved have rights to substantially all the arrangement's assets. Equinor accounts for the assets, liabilities, revenues and expenses relating to its interests in joint operations in accordance with the principles applicable to those particular assets, liabilities, revenues and expenses.
Acquisition of ownership shares in joint operations in which the activity constitutes a business, are accounted for in accordance with the principles of business combinations.
Those of Equinor's exploration and production licence activities that are within the scope of IFRS 11 Joint Arrangements have been classified as joint operations. A considerable number of Equinor's unincorporated joint exploration and production activities are conducted through arrangements that are not jointly controlled, either because unanimous consent is not required among all parties involved, or no single group of parties has joint control over the activity. Licence activities where control can be achieved through agreement between more than one combination of involved parties are considered to be outside the scope of IFRS 11, and these activities are accounted for on a pro-rata basis using Equinor's ownership share. Currently there are no significant differences in Equinor's accounting for unincorporated licence arrangements whether in scope of IFRS 11 or not.
Joint ventures, in which Equinor has rights to the net assets, are accounted for using the equity method.
Investments in companies in which Equinor has neither control nor joint control, but has the ability to exercise significant influence over operating and financial policies, as well as Equinor’s participation in joint arrangements that are joint ventures, are classified as Equity accounted investments. These currently include the majority of Equinor’s investments in the New Energy Solutions area. Under the equity method, the investment is carried on the balance sheet at cost plus post-acquisition changes in Equinor’s share of net assets of the entity, less distributions received and less any impairment in value of the investment. Goodwill may arise as the surplus of the cost of investment over Equinor’s share of
Equinor, Annual Report on Form 20-F 2018 169
the net fair value of the identifiable assets and liabilities of the joint venture or associate. Such goodwill is recorded within the corresponding investment. The Consolidated statement of income reflects Equinor’s share of the results after tax of an equity-accounted entity, adjusted to account for depreciation, amortisation and any impairment of the equity-accounted entity’s assets based on their fair values at the date of acquisition. Where material differences in accounting policies arise, adjustments are made to the financial statements of equity-accounted entities in order to bring the accounting policies used into line with Equinor’s. Material unrealised gains on transactions between Equinor and its equity-accounted entities are eliminated to the extent of Equinor’s interest in each equity-accounted entity. Unrealised losses are also eliminated unless the transaction provides evidence of an impairment of the asset transferred. Equinor assesses investments in equity-accounted entities for impairment whenever events or changes in circumstances indicate that the carrying value may not be recoverable.
Equinor as operator of joint operations and similar arrangements
Indirect operating expenses such as personnel expenses are accumulated in cost pools. These costs are allocated on an hours’ incurred basis to business areas and Equinor operated joint operations under IFRS 11 and to similar arrangements (licences) outside the scope of IFRS 11. Costs allocated to the other partners' share of operated joint operations and similar arrangements reduce the costs in the Consolidated statement of income. Only Equinor's share of the statement of income and balance sheet items related to Equinor operated joint operations and similar arrangements are reflected in the Consolidated statement of income and the Consolidated balance sheet.
Reportable segments
Equinor identifies its business areas on the basis of those components of Equinor that are regularly reviewed by the chief operating decision maker, Equinor's corporate executive committee (CEC). Equinor combines business areas when these satisfy relevant aggregation criteria.
Equinor's accounting policies as described in this note also apply to the specific financial information included in reportable segments-related disclosure in these Consolidated financial statements.
Foreign currency translation
In preparing the financial statements of the individual entities, transactions in foreign currencies (those other than functional currency) are translated at the foreign exchange rate at the dates of the transactions. Monetary assets and liabilities denominated in foreign currencies are translated to the functional currency at the foreign exchange rate at the balance sheet date. Foreign exchange differences arising on translation are recognised in the Consolidated statement of income as foreign exchange gains or losses within net financial items. Foreign exchange differences arising from the translation of estimate-based provisions, however, generally are accounted for as part of the change in the underlying estimate and as such may be included within the relevant operating expense or income tax sections of the Consolidated statement of income depending on the nature of the provision. Non-monetary assets that are measured at historical cost in a foreign currency are translated using the exchange rate at the date of the transactions. Loans from Equinor ASA to subsidiaries with other functional currencies than the parent company, and for which settlement is neither planned nor likely in the foreseeable future, are considered part of the parent company’s net investment in the subsidiary. Foreign exchange differences arising on such loans are recognised in Other comprehensive income (OCI) in the Consolidated financial statements.
Presentation currency
For the purpose of the Consolidated financial statements, the statement of income, the balance sheet and the cash flows of each entity are translated from the functional currency into the presentation currency, USD. The assets and liabilities of entities whose functional currencies are other than USD, are translated into USD at the foreign exchange rate at the balance sheet date. The revenues and expenses of such entities are translated using the foreign exchange rates on the dates of the transactions. Foreign exchange differences arising on translation from functional currency to presentation currency are recognised separately in OCI. The cumulative amount of such translation differences relating to an entity and previously recognised in OCI, is reclassified to the Consolidated statement of income and reflected as a part of the gain or loss on disposal of that entity.
Business combinations
Determining whether an acquisition meets the definition of a business combination requires judgement to be applied on a case by case basis. Acquisitions are assessed under the relevant IFRS criteria to establish whether the transaction represents a business combination or an asset purchase. Depending on the specific facts, acquisitions of exploration and evaluation licences for which a development decision has not yet been made, have largely been concluded to represent asset purchases.
Business combinations, except for transactions between entities under common control, are accounted for using the acquisition method of accounting. The acquired identifiable tangible and intangible assets, liabilities and contingent liabilities are measured at their fair values at the date of the acquisition. Acquisition costs incurred are expensed under Selling, general and administrative expenses.
Revenue recognition
Equinor presents ‘Revenue from contracts with customers’ and ‘Other revenue’ as a single caption, Revenues, in the Consolidated statement of income.
Revenue from contracts with customers
Revenue from contracts with customers is recognised upon satisfaction of the performance obligations for the transfer of goods and services in each such contract. The revenue amounts that are recognised reflect the consideration to which Equinor expects to be entitled in exchange for those goods and services. Revenue from the sale of crude oil, natural gas, petroleum products and other merchandise is recognised when a
170 Equinor, Annual Report on Form 20-F 2018
customer obtains control of those products, which normally is when title passes at point of delivery, based on the contractual terms of the agreements. Each such sale normally represents a single performance obligation. In the case of natural gas, sales are completed over time in line with the delivery of the actual physical quantities.
Revenue is presented net of customs, excise taxes and royalties paid in-kind on petroleum products.
Sales and purchases of physical commodities, which are not settled net, are presented on a gross basis as revenues from contracts with customers and purchases [net of inventory variation] in the statement of income.
Other revenue
Items representing a form of revenue, or which are closely connected with revenue transactions, are presented as Other revenue if they do not qualify as revenue from contracts with customers. Other revenue includes taxes paid in-kind under certain production sharing agreements (PSAs) and the net impact of commodity trading and commodity-based derivative instruments connected with sales contracts or revenue-related risk management.
Revenues from the production of oil and gas properties in which Equinor shares an interest with other companies are recognised on the basis of Equinor’s ownership in producing fields. Adjustments for imbalances (overlift or underlift) between oil and gas production and sales are presented as Other revenue, and reflected at fair value in the balance sheet as short-term receivables or payables.
Transactions with the Norwegian State
Equinor markets and sells the Norwegian State's share of oil and gas production from the Norwegian continental shelf (NCS). The Norwegian State's participation in petroleum activities is organised through the SDFI. All purchases and sales of the SDFI's oil production are classified as purchases [net of inventory variation] and revenues from contracts with customers, respectively. Equinor sells, in its own name, but for the Norwegian State's account and risk, the State's production of natural gas. These sales and related expenditures refunded by the Norwegian State are presented net in the Consolidated financial statements.
Employee benefits
Wages, salaries, bonuses, social security contributions, paid annual leave and sick leave are accrued in the period in which the associated services are rendered by employees of Equinor.
Research and development
Equinor undertakes research and development both on a funded basis for licence holders and on an unfunded basis for projects at its own risk. Equinor's own share of the licence holders' funding and the total costs of the unfunded projects are considered for capitalisation under the applicable IFRS requirements. Subsequent to initial recognition, any capitalised development costs are reported at cost less accumulated amortisation and accumulated impairment losses.
Income tax
Income tax in the Consolidated statement of income comprises current and deferred tax expense. Income tax is recognised in the Consolidated statement of income except when it relates to items recognised in OCI.
Current tax consists of the expected tax payable on the taxable income for the year and any adjustment to tax payable for previous years. Uncertain tax positions and potential tax exposures are analysed individually, and the best estimate of the probable amount for liabilities to be paid (unpaid potential tax exposure amounts, including penalties) and for assets to be received (disputed tax positions for which payment has already been made) in each case is recognised within current tax or deferred tax as appropriate. Interest income and interest expenses relating to tax issues are estimated and recognised in the period in which they are earned or incurred, and are presented within net financial items in the Consolidated statement of income. Uplift benefit on the NCS is recognised when the deduction is included in the current year tax return and impacts taxes payable.
Deferred tax assets and liabilities are recognised for the future tax consequences attributable to differences between the carrying amounts of existing assets and liabilities and their respective tax bases, subject to the initial recognition exemption. The amount of deferred tax is based on the expected manner of realisation or settlement of the carrying amount of assets and liabilities, using tax rates enacted or substantively enacted at the balance sheet date. A deferred tax asset is recognised only to the extent that it is probable that future taxable income will be available against which the asset can be utilised. In order for a deferred tax asset to be recognised based on future taxable income, convincing evidence is required, taking into account the existence of contracts, production of oil or gas in the near future based on volumes of proved reserves, observable prices in active markets, expected volatility of trading profits, expected currency rate movements and similar facts and circumstances. A deferred tax liability and a corresponding deferred tax asset are recognised when an asset retirement obligation is initially reflected in the accounts.
Oil and gas exploration, evaluation and development expenditures
Equinor uses the successful efforts method of accounting for oil and gas exploration costs. Expenditures to acquire mineral interests in oil and gas properties and to drill and equip exploratory wells are capitalised as exploration and evaluation expenditures within intangible assets until the well is complete and the results have been evaluated, or there is any other indicator of a potential impairment. Exploration wells that discover
Equinor, Annual Report on Form 20-F 2018 171
potentially economic quantities of oil and natural gas remain capitalised as intangible assets during the evaluation phase of the find. This evaluation is normally finalised within one year after well completion. If, following the evaluation, the exploratory well has not found potentially commercial quantities of hydrocarbons, the previously capitalised costs are evaluated for derecognition or tested for impairment. Geological and geophysical costs and other exploration and evaluation expenditures are expensed as incurred.
Capitalised exploration and evaluation expenditures, including expenditures to acquire mineral interests in oil and gas properties, related to offshore wells that find proved reserves are transferred from exploration expenditures and acquisition costs - oil and gas prospects (intangible assets) to property, plant and equipment at the time of sanctioning of the development project. For onshore wells where no sanction is required, the transfer of acquisition cost – oil and gas prospects (intangible assets) to property, plant and equipment occurs at the time when a well is ready for production.
For exploration and evaluation asset acquisitions (farm-in arrangements) in which Equinor has made arrangements to fund a portion of the selling partner's (farmor's) exploration and/or future development expenditures (carried interests), these expenditures are reflected in the Consolidated financial statements as and when the exploration and development work progresses. Equinor reflects exploration and evaluation asset dispositions (farm-out arrangements) on a historical cost basis with no gain or loss recognition.
A gain related to a post-tax based disposition of assets on the NCS includes the release of tax liabilities previously computed and recognised related to the assets in question. The resulting gross gain is recognised in full in other income in the Consolidated statement of income.
Consideration from the sale of an undeveloped part of an onshore asset reduces the carrying amount of the asset. The part of the consideration that exceeds the carrying amount of the asset, if any, is reflected in the Consolidated statement of income under other income.
Exchanges (swaps) of exploration and evaluation assets are accounted for at the carrying amounts of the assets given up with no gain or loss recognition.
Property, plant and equipment
Property, plant and equipment is reflected at cost, less accumulated depreciation and accumulated impairment losses. The initial cost of an asset comprises its purchase price or construction cost, any costs directly attributable to bringing the asset into operation, the initial estimate of an asset retirement obligation, if any, exploration costs transferred from intangible assets and, for qualifying assets, borrowing costs. Contingent consideration included in the acquisition of an asset or group of similar assets is initially measured at its fair value, with later changes in fair value other than due to the passage of time reflected in the book value of the asset or group of assets, unless the asset is impaired. Property, plant and equipment include costs relating to expenditures incurred under the terms of PSAs in certain countries, and which qualify for recognition as assets of Equinor. State-owned entities in the respective countries, however, normally hold the legal title to such PSA-based property, plant and equipment.
Exchanges of assets are measured at the fair value of the asset given up, unless the fair value of neither the asset received nor the asset given up is measurable with sufficient reliability.
Expenditure on major maintenance refits or repairs comprises the cost of replacement assets or parts of assets, inspection costs and overhaul costs. Where an asset or part of an asset is replaced and it is probable that future economic benefits associated with the item will flow to Equinor, the expenditure is capitalised. Inspection and overhaul costs, associated with regularly scheduled major maintenance programmes planned and carried out at recurring intervals exceeding one year, are capitalised and amortised over the period to the next scheduled inspection and overhaul. All other maintenance costs are expensed as incurred.
Capitalised exploration and evaluation expenditures, development expenditure on the construction, installation or completion of infrastructure facilities such as platforms, pipelines and the drilling of production wells, and field-dedicated transport systems for oil and gas are capitalised as producing oil and gas properties within property, plant and equipment. Such capitalised costs, when designed for significantly larger volumes than the reserves from already developed and producing wells, are depreciated using the unit of production method based on proved reserves expected to be recovered from the area during the concession or contract period. Depreciation of production wells uses the unit of production method based on proved developed reserves, and capitalised acquisition costs of proved properties are depreciated using the unit of production method based on total proved reserves. In the rare circumstances where the use of proved reserves fails to provide an appropriate basis reflecting the pattern in which the asset’s future economic benefits are expected to be consumed, a more appropriate reserve estimate is used. Depreciation of other assets and transport systems used by several fields is calculated on the basis of their estimated useful lives, normally using the straight-line method. Each part of an item of property, plant and equipment with a cost that is significant in relation to the total cost of the item is depreciated separately. For exploration and production assets, Equinor has established separate depreciation categories which as a minimum distinguish between platforms, pipelines and wells.
The estimated useful lives of property, plant and equipment are reviewed on an annual basis, and changes in useful lives are accounted for prospectively. An item of property, plant and equipment is de-recognised upon disposal or when no future economic benefits are expected to arise from the continued use of the asset. Any gain or loss arising on derecognition of the asset (calculated as the difference between the net disposal proceeds and the carrying amount of the item) is included in other income or operating expenses, respectively, in the period the item is de-recognised.
172 Equinor, Annual Report on Form 20-F 2018
Assets classified as held for sale
Non-current assets are classified separately as held for sale in the balance sheet when their carrying amount will be recovered through a sale transaction rather than through continuing use. This condition is met only when the sale is highly probable, the asset is available for immediate sale in its present condition, and management is committed to the sale, which should be expected to qualify for recognition as a completed sale within one year from the date of classification. Liabilities directly associated with the assets classified as held for sale, and expected to be included as part of the sale transaction, are correspondingly also classified separately. Once classified as held for sale, property, plant and equipment and intangible assets are not subject to depreciation or amortisation. The net assets and liabilities of a disposal group classified as held for sale are measured at the lower of their carrying amount and fair value less costs to sell.
Leases
Leases for which Equinor assumes substantially all the risks and rewards of ownership are reflected as finance leases. When an asset leased by a joint operation or similar arrangement to which Equinor is a party qualifies as a finance lease, or when such an asset is leased by Equinor as operator directly on behalf of a joint operation or similar arrangement, Equinor reflects its proportionate share of the leased asset and related obligations. Finance leases are classified in the Consolidated balance sheet within property, plant and equipment and finance debt. All other leases are classified as operating leases, and the costs are charged to the relevant operating expense related caption on a straight-line basis over the lease term, unless another basis is more representative of the benefits of the lease to Equinor.
Equinor distinguishes between lease and capacity contracts. Lease contracts provide the right to use a specific asset for a period of time, while capacity contracts confer on Equinor the right to and the obligation to pay for certain volume capacity availability related to transport, terminal use, storage, etc. Such capacity contracts that do not involve specified assets or that do not involve substantially all the capacity of an undivided interest in a specific asset are not considered by Equinor to qualify as leases for accounting purposes. Capacity payments are reflected as operating expenses in the Consolidated statement of income in the period for which the capacity contractually is available to Equinor.
Intangible assets including goodwill
Intangible assets are stated at cost, less accumulated amortisation and accumulated impairment losses. Intangible assets include acquisition cost for oil and gas prospects, expenditures on the exploration for and evaluation of oil and natural gas resources, goodwill and other intangible assets.
Intangible assets relating to expenditures on the exploration for and evaluation of oil and natural gas resources are not amortised. When the decision to develop a particular area is made, its intangible exploration and evaluation assets are reclassified to property, plant and equipment.
Goodwill is initially measured at the excess of the aggregate of the consideration transferred and the amount recognised for any non-controlling interest over the fair value of the identifiable assets acquired and liabilities assumed in a business combination at the acquisition date. Goodwill acquired is allocated to each cash generating unit (CGU), or group of units, expected to benefit from the combination’s synergies. Following initial recognition, goodwill is measured at cost less any accumulated impairment losses. In acquisitions made on a post-tax basis according to the rules on the NCS, a provision for deferred tax is reflected in the accounts based on the difference between the acquisition cost and the transferred tax depreciation basis. The offsetting entry to such deferred tax amounts is reflected as goodwill, which is allocated to the CGU or group of CGUs on whose tax depreciation basis the deferred tax has been computed.
Financial assets
Financial assets are initially recognised at fair value when Equinor becomes a party to the contractual provisions of the asset. For additional information on fair value methods, refer to the Measurement of fair values section below. The subsequent measurement of the financial assets depends on which category they have been classified into at inception.
At initial recognition, Equinor classifies its financial assets into the following three categories: Financial investments at amortised cost, at fair value through profit or loss, and at fair value through other comprehensive income based on an evaluation of the contractual terms and the business model applied. Certain long-term investments in other entities, which do not qualify for the equity method or consolidation, are included as at fair value through profit or loss.
Cash and cash equivalents include cash in hand, current balances with banks and similar institutions, and short-term highly liquid investments that are readily convertible to known amounts of cash, are subject to an insignificant risk of changes in fair value and have a maturity of three months or less from the acquisition date. Short-term highly liquid investments with original maturity exceeding 3 months are classified as current financial investments. Cash and cash equivalents and current financial investment are accounted for at amortised cost or at fair value through profit or loss.
Trade receivables are carried at the original invoice amount less a provision for doubtful receivables which represent expected losses computed on a probability-weighted basis.
Equinor’s financial asset credit risk is measured and recognised based on expected losses.
A part of Equinor's financial investments is managed together as an investment portfolio of Equinor's captive insurance company and is held in order to comply with specific regulations for capital retention. The investment portfolio is managed and evaluated on a fair value basis in accordance with an investment strategy and is accounted for at fair value through profit or loss.
Equinor, Annual Report on Form 20-F 2018 173
Financial assets are presented as current if they contractually will expire or otherwise are expected to be recovered within 12 months after the balance sheet date, or if they are held for the purpose of being traded. Financial assets and financial liabilities are shown separately in the Consolidated balance sheet, unless Equinor has both a legal right and a demonstrable intention to net settle certain balances payable to and receivable from the same counterparty, in which case they are shown net in the balance sheet.
Inventories
Commodity inventories are stated at the lower of cost and net realisable value. Cost is determined by the first-in first-out method and comprises direct purchase costs, cost of production, transportation and manufacturing expenses. Inventories of drilling and spare parts are reflected according to the weighted average method.
Impairment
Impairment of property, plant and equipment and intangible assets other than goodwill
Equinor assesses individual assets or groups of assets for impairment whenever events or changes in circumstances indicate that the carrying value of an asset may not be recoverable. Assets are grouped into cash generating units (CGUs) which are the smallest identifiable groups of assets that generate cash inflows that are largely independent of the cash inflows from other groups of assets. Normally, separate CGUs are individual oil and gas fields or plants. Each unconventional asset play is considered a single CGU when no cash inflows from parts of the play can be reliably identified as being largely independent of the cash inflows from other parts of the play. In impairment evaluations, the carrying amounts of CGUs are determined on a basis consistent with that of the recoverable amount. In Equinor's line of business, judgement is involved in determining what constitutes a CGU. Development in production, infrastructure solutions, markets, product pricing, management actions and other factors may over time lead to changes in CGUs such as the division of one original CGU into several.
In assessing whether a write-down of the carrying amount of a potentially impaired asset is required, the asset's carrying amount is compared to the recoverable amount. The recoverable amount of an asset is the higher of its fair value less cost of disposal and its value in use. Fair value less cost of disposal is determined based on comparable recent arm’s length market transactions, or based on Equinor’s estimate of the price that would be received for the asset in an orderly transaction between market participants. Such fair value estimates are mainly based on discounted cash flow models, using assumed market participants’ assumptions, but may also reflect market multiples observed from comparable market transactions or independent third-party valuations. Value in use is determined using a discounted cash flow model. The estimated future cash flows applied in establishing value in use are based on reasonable and supportable assumptions and represent management's best estimates of the range of economic conditions that will exist over the remaining useful life of the assets, as set down in Equinor's most recently approved long-term forecasts. Updates of assumptions and economic conditions in establishing the long-term forecasts are reviewed by corporate management on regular basis and updated at least annually. For assets and CGUs with an expected useful life or timeline for production of expected oil and natural gas reserves extending beyond 5 years, the forecasts reflect expected production volumes, and the related cash flows include project or asset specific estimates reflecting the relevant period. Such estimates are established based on Equinor's principles and assumptions and are consistently applied.
In performing a value-in-use-based impairment test, the estimated future cash flows are adjusted for risks specific to the asset and discounted using a real post-tax discount rate which is based on Equinor's post-tax weighted average cost of capital (WACC). The use of post-tax discount rates in determining value in use does not result in a materially different determination of the need for, or the amount of, impairment that would be required if pre-tax discount rates had been used.
Unproved oil and gas properties are assessed for impairment when facts and circumstances suggest that the carrying amount of the asset or CGU to which the unproved properties belong may exceed its recoverable amount, and at least once a year. Exploratory wells that have found reserves, but where classification of those reserves as proved depends on whether major capital expenditure can be justified or where the economic viability of that major capital expenditure depends on the successful completion of further exploration work, will remain capitalised during the evaluation phase for the exploratory finds. Thereafter it will be considered a trigger for impairment evaluation of the well if no development decision is planned for the near future and there are no firm plans for future drilling in the licence.
An assessment is made at each reporting date as to whether there is any indication that previously recognised impairment losses may no longer be relevant or may have decreased. If such an indication exists, the recoverable amount is estimated. A previously recognised impairment loss is reversed only if there has been a change in the estimates used to determine the asset’s recoverable amount since the last impairment loss was recognised. If that is the case, the carrying amount of the asset is increased to its recoverable amount. That increased amount cannot exceed the carrying amount that would have been determined, net of depreciation, had no impairment loss been recognised for the asset in prior years.
Impairment losses and reversals of impairment losses are presented in the Consolidated statement of income as Exploration expenses or Depreciation, amortisation and net impairment losses, on the basis of their nature as either exploration assets (intangible exploration assets) or development and producing assets (property, plant and equipment and other intangible assets), respectively.
Impairment of goodwill
Goodwill is reviewed for impairment annually or more frequently if events or changes in circumstances indicate that the carrying value may be impaired. Impairment is determined by assessing the recoverable amount of the CGU, or group of units, to which the goodwill relates. Where the recoverable amount of the CGU, or group of units, is less than the carrying amount, an impairment loss is recognised. When impairment testing goodwill originally recognised as an offsetting item to the computed deferred tax provision in a post-tax transaction on the NCS, the remaining
174 Equinor, Annual Report on Form 20-F 2018
amount of the deferred tax provision will factor into the impairment evaluations. Once recognised, impairments of goodwill are not reversed in future periods.
Financial liabilities
Financial liabilities are initially recognised at fair value when Equinor becomes a party to the contractual provisions of the liability. The subsequent measurement of financial liabilities depends on which category they have been classified into. The categories applicable for Equinor are either financial liabilities at fair value through profit or loss or financial liabilities measured at amortised cost using the effective interest method. The latter applies to Equinor's non-current bank loans and bonds.
Financial liabilities are presented as current if the liability is due to be settled within 12 months after the balance sheet date, or if they are held for the purpose of being traded. Financial liabilities are de-recognised when the contractual obligations expire, are discharged or cancelled. Gains and losses arising on the repurchase, settlement or cancellation of liabilities are recognised either in interest income and other financial items or in interest and other finance expenses within net financial items.
Derivative financial instruments
Equinor uses derivative financial instruments to manage certain exposures to fluctuations in foreign currency exchange rates, interest rates and commodity prices. Such derivative financial instruments are initially recognised at fair value on the date on which a derivative contract is entered into and are subsequently re-measured at fair value through profit and loss. The impact of commodity-based derivative financial instruments is recognised in the Consolidated statement of income under other revenues, as such derivative instruments are related to sales contracts or revenue-related risk management for all significant purposes. The impact of other financial instruments is reflected under net financial items.
Derivatives are carried as assets when the fair value is positive and as liabilities when the fair value is negative. Derivative assets or liabilities expected to be recovered, or with the legal right to be settled more than 12 months after the balance sheet date are classified as non-current. Derivative financial instruments held for the purpose of being traded are however always classified as short term.
Contracts to buy or sell a non-financial item that can be settled net in cash or another financial instrument, or by exchanging financial instruments, as if the contracts were financial instruments, are accounted for as financial instruments. However, contracts that are entered into and continue to be held for the purpose of the receipt or delivery of a non-financial item in accordance with Equinor's expected purchase, sale or usage requirements, also referred to as own-use, are not accounted for as financial instruments. Such sales and purchases of physical commodity volumes are reflected in the statement of income as revenue from contracts with customers and purchases [net of inventory variation], respectively. This is applicable to a significant number of contracts for the purchase or sale of crude oil and natural gas, which are recognised upon delivery.
Derivatives embedded in host contracts which are not financial assets within the scope of IFRS 9 are recognised as separate derivatives and are reflected at fair value with subsequent changes through profit and loss, when their risks and economic characteristics are not closely related to those of the host contracts, and the host contracts are not carried at fair value. Where there is an active market for a commodity or other non-financial item referenced in a purchase or sale contract, a pricing formula will, for instance, be considered to be closely related to the host purchase or sales contract if the price formula is based on the active market in question. A price formula with indexation to other markets or products will however result in the recognition of a separate derivative. Where there is no active market for the commodity or other non-financial item in question, Equinor assesses the characteristics of such a price related embedded derivative to be closely related to the host contract if the price formula is based on relevant indexations commonly used by other market participants. This applies to certain long-term natural gas sales agreements.
Pension liabilities
Equinor has pension plans for employees that either provide a defined pension benefit upon retirement or a pension dependent on defined contributions and related returns. A portion of the contributions are provided for as notional contributions, for which the liability increases with a promised notional return, set equal to the actual return of assets invested through the ordinary defined contribution plan. For defined benefit plans, the benefit to be received by employees generally depends on many factors including length of service, retirement date and future salary levels.
Equinor's proportionate share of multi-employer defined benefit plans are recognised as liabilities in the balance sheet to the extent that sufficient information is available and a reliable estimate of the obligation can be made.
Equinor's net obligation in respect of defined benefit pension plans is calculated separately for each plan by estimating the amount of future benefit that employees have earned in return for their services in the current and prior periods. That benefit is discounted to determine its present value, and the fair value of any plan assets is deducted. The discount rate is the yield at the balance sheet date, reflecting the maturity dates approximating the terms of Equinor's obligations. The discount rate for the main part of the pension obligations has been established on the basis of Norwegian mortgage covered bonds, which are considered high quality corporate bonds. The cost of pension benefit plans is expensed over the period that the employees render services and become eligible to receive benefits. The calculation is performed by an external actuary.
The net interest related to defined benefit plans is calculated by applying the discount rate to the opening present value of the benefit obligation and opening present value of the plan assets, adjusted for material changes during the year. The resulting net interest element is presented in
Equinor, Annual Report on Form 20-F 2018 175
the statement of income within Net financial items. The difference between estimated interest income and actual return is recognised in the Consolidated statement of comprehensive income.
Past service cost is recognised when a plan amendment (the introduction or withdrawal of, or changes to, a defined benefit plan) or curtailment (a significant reduction by the entity in the number of employees covered by a plan) occurs, or when recognising related restructuring costs or termination benefits. The obligation and related plan assets are re-measured using current actuarial assumptions, and the gain or loss is recognised in the statement of income.
Actuarial gains and losses are recognised in full in the Consolidated statement of comprehensive income in the period in which they occur, while actuarial gains and losses related to provision for termination benefits are recognised in the Consolidated statement of income in the period in which they occur. Due to the parent company Equinor ASA's functional currency being USD, the significant part of Equinor's pension obligations will be payable in a foreign currency (i.e. NOK). As a consequence, actuarial gains and losses related to the parent company's pension obligation include the impact of exchange rate fluctuations.
Contributions to defined contribution schemes are recognised in the statement of income in the period in which the contribution amounts are earned by the employees.
Notional contribution plans, reported in the parent company Equinor ASA, are recognised as pension liabilities with the actual value of the notional contributions and promised return at reporting date. Notional contributions are recognised in the statement of income as periodic pension cost, while changes in fair value of notional assets are reflected in the statement of income under Net financial items.
Periodic pension cost is accumulated in cost pools and allocated to business areas and Equinor operated joint operations (licences) on an hours’ incurred basis and recognised in the statement of income based on the function of the cost.
Onerous contracts
Equinor recognises as provisions the net obligation under contracts defined as onerous. Contracts are deemed to be onerous if the unavoidable cost of meeting the obligations under the contract exceeds the economic benefits expected to be received in relation to the contract. A contract which forms an integral part of the operations of a CGU whose assets are dedicated to that contract, and for which the economic benefits cannot be reliably separated from those of the CGU, is included in impairment considerations for the applicable CGU.
Asset retirement obligations (ARO)
Provisions for ARO costs are recognised when Equinor has an obligation (legal or constructive) to dismantle and remove a facility or an item of property, plant and equipment and to restore the site on which it is located, and when a reliable estimate of that liability can be made. The amount recognised is the present value of the estimated future expenditures determined in accordance with local conditions and requirements. Cost is estimated based on current regulations and technology, considering relevant risks and uncertainties. The discount rate used in the calculation of the ARO is a risk-free rate based on the applicable currency and time horizon of the underlying cash flows, adjusted for a credit premium which reflects Equinor's own credit risk. Normally an obligation arises for a new facility, such as an oil and natural gas production or transportation facility, upon construction or installation. An obligation may also arise during the period of operation of a facility through a change in legislation or through a decision to terminate operations, or be based on commitments associated with Equinor's ongoing use of pipeline transport systems where removal obligations rest with the volume shippers. The provisions are classified under provisions in the Consolidated balance sheet.
When a provision for ARO cost is recognised, a corresponding amount is recognised to increase the related property, plant and equipment and is subsequently depreciated as part of the costs of the facility or item of property, plant and equipment. Any change in the present value of the estimated expenditure is reflected as an adjustment to the provision and the corresponding property, plant and equipment. When a decrease in the ARO provision related to a producing asset exceeds the carrying amount of the asset, the excess is recognised as a reduction of depreciation, amortisation and net impairment losses in the Consolidated statement of income. When an asset has reached the end of its useful life, all subsequent changes to the ARO provision are recognised as they occur in operating expenses in the Consolidated statement of income. Removal provisions associated with Equinor's role as shipper of volumes through third party transport systems are expensed as incurred.
Measurement of fair values
Quoted prices in active markets represent the best evidence of fair value and are used by Equinor in determining the fair values of assets and liabilities to the extent possible. Financial instruments quoted in active markets will typically include financial instruments with quoted market prices obtained from the relevant exchanges or clearing houses. The fair values of quoted financial assets, financial liabilities and derivative instruments are determined by reference to mid-market prices, at the close of business on the balance sheet date.
Where there is no active market, fair value is determined using valuation techniques. These include using recent arm's-length market transactions, reference to other instruments that are substantially the same, discounted cash flow analysis, and pricing models and related internal assumptions. In the valuation techniques, Equinor also takes into consideration the counterparty and its own credit risk. This is either reflected in the discount rate used or through direct adjustments to the calculated cash flows. Consequently, where Equinor reflects elements of long-term physical delivery commodity contracts at fair value, such fair value estimates to the extent possible are based on quoted forward prices in the market and underlying indexes in the contracts, as well as assumptions of forward prices and margins where observable market
176 Equinor, Annual Report on Form 20-F 2018
prices are not available. Similarly, the fair values of interest and currency swaps are estimated based on relevant quotes from active markets, quotes of comparable instruments, and other appropriate valuation techniques.
Critical accounting judgements and key sources of estimation uncertainty
Critical judgements in applying accounting policies
The following are the critical judgements, apart from those involving estimations (see below), that Equinor has made in the process of applying the accounting policies and that have the most significant effect on the amounts recognised in the financial statements:
Revenue recognition - gross versus net presentation of traded SDFI volumes of oil and gas production
As described under Transactions with the Norwegian State above, Equinor markets and sells the Norwegian State's share of oil and gas production from the NCS. Equinor includes the costs of purchase and proceeds from the sale of the SDFI oil production in purchases [net of inventory variation] and revenues from contracts with customers, respectively. In making the judgement, Equinor has considered whether it controls the State originated crude oil volumes prior to onwards sales to third party customers. Equinor directs the use of the volumes, and although certain benefits from the sales subsequently flow to the State, Equinor purchases the crude oil volumes from the State and obtains substantially all the remaining benefits. On that basis, Equinor has concluded that it acts as principal in these sales.
Equinor sells, in its own name, but for the Norwegian State's account and risk, the State's production of natural gas. These gas sales, and related expenditures refunded by the State, are shown net in Equinor's Consolidated financial statements. In making the judgement, Equinor concluded that ownership of the gas had not been transferred from the SDFI to Equinor. Although Equinor has been granted the ability to direct the use of the volumes, all the benefits from the sales of these volumes flow to the State. On that basis, Equinor is not considered the principal in the sale of the SDFI’s natural gas volumes.
Key sources of estimation uncertainty
The preparation of the Consolidated financial statements requires that management make estimates and assumptions that affect reported amounts of assets, liabilities, income and expenses. The estimates and associated assumptions are based on historical experience and various other factors that are believed to be reasonable under the circumstances, the result of which form the basis of making the judgements about carrying values of assets and liabilities that are not readily apparent from other sources. Actual results may differ from these estimates. The estimates and underlying assumptions are reviewed on an on-going basis considering the current and expected future market conditions.
Equinor is exposed to a number of underlying economic factors which affect the overall results, such as liquids prices, natural gas prices, refining margins, foreign exchange rates and interest rates as well as financial instruments with fair values derived from changes in these factors. In addition, Equinor's results are influenced by the level of production, which in the short term may be influenced by, for instance, maintenance programmes. In the long term, the results are impacted by the success of exploration and field development activities.
The matters described below are considered to be the most important in understanding the key sources of estimation uncertainty that are involved in preparing these Consolidated financial statements and the uncertainties that could most significantly impact the amounts reported on the results of operations, financial position and cash flows.
Proved oil and gas reserves
Proved oil and gas reserves may materially impact the Consolidated financial statements, as changes in the proved reserves, for instance as a result of changes in prices, will impact the unit of production rates used for depreciation and amortisation. Proved oil and gas reserves are those quantities of oil and gas, which, by analysis of geoscience and engineering data, can be estimated with reasonable certainty to be economically producible from a given date forward, from known reservoirs, and under existing economic conditions, operating methods and government regulations. Unless evidence indicates that renewal is reasonably certain, estimates of economically producible reserves only reflect the period before the contracts providing the right to operate expire. The project to extract the hydrocarbons must have commenced, or the operator must be reasonably certain that it will commence within a reasonable time.
Proved oil and gas reserves have been estimated by internal qualified professionals on the basis of industry standards and are governed by the oil and gas rules and disclosure requirements in the U.S. Securities and Exchange Commission (SEC) regulations S-K and S-X, and the Financial Accounting Standards Board (FASB) requirements for supplemental oil and gas disclosures. The estimates have been based on a 12-month average product price and on existing economic conditions and operating methods as required, and recovery of the estimated quantities have a high degree of certainty (at least a 90% probability).
Reserves estimates are based on subjective judgements involving geological and engineering assessments of in-place hydrocarbon volumes, the production, historical recovery and processing yield factors and installed plant operating capacity. For future development projects, proved reserves estimates are included only where there is a significant commitment to project funding and execution and when relevant governmental and regulatory approvals have been secured or are reasonably certain to be secured. The reliability of these estimates at any point in time depends on both the quality and availability of the technical and economic data and the efficiency of extracting and processing the hydrocarbons. An independent third party has evaluated Equinor's proved reserves estimates, and the results of this evaluation do not differ materially from Equinor's estimates.
Equinor, Annual Report on Form 20-F 2018 177
Expected oil and gas reserves
Expected oil and gas reserves may materially impact the Consolidated financial statements, as changes in the expected reserves, for instance as a result of changes in prices, will impact asset retirement obligations and impairment testing of upstream assets, which in turn may lead to changes in impairment charges affecting operating income. Expected oil and gas reserves are the estimated remaining, commercially recoverable quantities, based on Equinor's judgement of future economic conditions, from projects in operation or decided for development. Recoverable oil and gas quantities are always uncertain, and the expected value is the weighted average, or statistical mean, of the possible outcomes. Expected reserves are therefore typically larger than proved reserves as defined by the SEC rules. Expected oil and gas reserves have been estimated by internal qualified professionals on the basis of industry standards and classified in accordance with the Norwegian resource classification system issued by the Norwegian Petroleum Directorate, and are used for impairment testing purposes and for calculation of asset retirement obligations. Reserves estimates are based on subjective judgements involving geological and engineering assessments of in-place hydrocarbon volumes, the production, historical recovery and processing yield factors, installed plant operating capacity and operating approval limits. The reliability of these estimates at any point in time depends on both the quality and quantity of the technical and economic data and the efficiency of extracting and processing the hydrocarbons. Such estimates are inherently less reliable in early field life or where the available data is limited following a recently implemented change in the method of production.
Exploration and leasehold acquisition costs
Equinor capitalises the costs of drilling exploratory wells pending determination of whether the wells have found proved oil and gas reserves. Equinor also capitalises leasehold acquisition costs and signature bonuses paid to obtain access to undeveloped oil and gas acreage. Judgements as to whether these expenditures should remain capitalised, be de-recognised or written down in the period may materially affect the operating income for the period.
Acquisition accounting
Equinor applies the acquisition method for transactions involving business combinations, and applies the principles of the acquisition method when an interest or an additional interest is acquired in a joint operation which constitutes a business. Application of the acquisition method may require significant judgement in, among other matters, determining and measuring the full transaction consideration including contingent consideration elements, identifying all tangible and intangible assets acquired as well as liabilities assumed, establishing their fair values, determining deferred tax elements, and allocating the purchase price accordingly, including measurement and allocation of goodwill. The judgements applied in acquisition accounting may materially affect the financial statements both in the transaction period and in terms of future periods’ operating income.
Impairment/reversal of impairment
Equinor has significant investments in property, plant and equipment and intangible assets. Changes in the circumstances or expectations of future performance of an individual asset may be an indicator that the asset is impaired, requiring the carrying amount to be written down to its recoverable amount. Impairments are reversed if conditions for impairment are no longer present. Evaluating whether an asset is impaired or if an impairment should be reversed requires a high degree of judgement and may to a large extent depend upon the selection of key assumptions about the future.
The key assumptions used will bear the risk of change based on the inherent volatile nature of macro-economic factors such as future commodity prices or discount rate and uncertainty in asset specific factors such as reserve estimates and operational decisions impacting the production profile or activity levels for our oil and natural gas properties. When estimating the recoverable amount, the single most likely future cash flows, the point estimate, is the primary method applied to reflect uncertainties in timing and amount inherent in the assumptions used in the estimated future cash flows. For assumptions in which the expected probability distributions or outcome are expected to be significantly skewed the use of decision trees or simulation is applied.
Unproved oil and gas properties are assessed for impairment when facts and circumstances suggest that the carrying amount of the relevant asset or CGU may exceed its recoverable amount, and at least annually. If, following evaluation, an exploratory well has not found proved reserves, the previously capitalised costs are tested for impairment. Subsequent to the initial evaluation phase for a well, it will be considered a trigger for impairment testing of a well if no development decision is planned for the near future and there is no firm plan for future drilling in the licence. Impairment of unsuccessful wells is reversed, as applicable, to the extent that conditions for impairment are no longer present.
Where recoverable amounts are based on estimated future cash flows, reflecting Equinor’s or market participants’ assumptions about the future and discounted to their present value, the estimates involve complexity. Impairment testing requires long-term assumptions to be made concerning a number of economic factors such as future market prices, refinery margins, currency exchange rates and future output, discount rates and political and country risk among others, in order to establish relevant future cash flows. Long-term assumptions for major economic factors are made at a group level, and there is a high degree of reasoned judgement involved in establishing these assumptions, in determining other relevant factors such as forward price curves, in estimating production outputs and in determining the ultimate terminal value of an asset.
Employee retirement plans
When estimating the present value of defined benefit pension obligations that represent a long-term liability in the Consolidated balance sheet, and indirectly, the period's net pension expense in the Consolidated statement of income, management make a number of critical assumptions affecting these estimates. Most notably, assumptions made about the discount rate to be applied to future benefit payments and plan assets, the expected rate of pension increase and the annual rate of compensation increase, have a direct and potentially material impact on the amounts presented. Significant changes in these assumptions between periods can have a material effect on the Consolidated financial statements.
178 Equinor, Annual Report on Form 20-F 2018
Asset retirement obligations
Equinor has significant obligations to decommission and remove offshore installations at the end of the production period. The costs of these decommissioning and removal activities require revisions due to changes in current regulations and technology while considering relevant risks and uncertainties. Most of the removal activities are many years into the future, and the removal technology and costs are constantly changing. The estimates include assumptions of the time required and the day rates for rigs, marine operations and heavy lift vessels that can vary considerably depending on the assumed removal complexity. As a result, the initial recognition of the liability and the capitalised cost associated with decommissioning and removal obligations, and the subsequent adjustment of these balance sheet items, involve the application of significant judgement.
Derivative financial instruments
When not directly observable in active markets, the fair value of derivative contracts must be computed internally based on internal assumptions as well as directly observable market information, including forward and yield curves for commodities, currencies and interest rates. Changes in internal assumptions, forward and yield curves could materially impact the internally computed fair value of derivative contracts, particularly long-term contracts, resulting in a corresponding impact on income or loss in the Consolidated statement of income.
Income tax
Every year Equinor incurs significant amounts of income taxes payable to various jurisdictions around the world and recognises significant changes to deferred tax assets and deferred tax liabilities, all of which are based on management's interpretations of applicable laws, regulations and relevant court decisions. The quality of these estimates is highly dependent upon proper application of at times very complex sets of rules, the recognition of changes in applicable rules and, in the case of deferred tax assets, management's ability to project future earnings from activities that may apply loss carry forward positions against future income taxes.
3 Segments
Equinor’s operations are managed through the following business areas: Development & Production Norway (DPN), Development & Production Brazil (DPB), Development & Production International (DPI), Marketing, Midstream & Processing (MMP), New Energy Solutions (NES), Technology, Projects & Drilling (TPD), Exploration (EXP) and Global Strategy & Business Development (GSB). With effect from the third quarter 2018 DPB was established as a separate business area and former Development and Production USA (DPUSA) was included in DPI. These changes have no effect on the reporting segments.
The development and production business areas are responsible for the commercial development of the oil and gas portfolios within their respective geographical areas: DPN on the Norwegian continental shelf, DPB in Brazil and DPI worldwide outside of DPN and DPB.
Exploration activities are managed by a separate business area, which has the global responsibility across the group for discovery and appraisal of new resources. Exploration activities are allocated to and presented in the respective development and production business areas.
TPD is responsible for the global project portfolio, well delivery, new technology and sourcing across Equinor. The activities are allocated and presented in the respective business areas receiving the deliveries.
The MMP business area is responsible for marketing and trading of oil and gas commodities (crude, condensate, gas liquids, products, natural gas and liquefied natural gas), electricity and emission rights, as well as transportation, processing and manufacturing of the above-mentioned commodities, operations of refineries, terminals, processing and power plants.
The NES business area is responsible for wind parks, carbon capture and storage as well as other renewable energy and low-carbon energy solutions.
The business areas DPI and DPB are aggregated into the reporting segment Exploration & Production International (E&P International). The aggregation has its basis in similar economic characteristics, such as the assets’ long term and capital-intensive nature and exposure to volatile oil and gas commodity prices, the nature of products, service and production processes, the type and class of customers, the methods of distribution and regulatory environment. The reporting segments Exploration & Production Norway (E&P Norway) and MMP consists of the business areas DPN and MMP respectively. The business areas NES, GSB, TPD, EXP and corporate staffs and support functions are aggregated into the reporting segment “Other” due to the immateriality of these areas. The majority of costs within the business areas GSB, TPD and EXP are allocated to the E&P International, E&P Norway and MMP reporting segments.
The eliminations section includes the elimination of inter-segment sales and related unrealised profits, mainly from the sale of crude oil and products. Inter-segment revenues are based upon estimated market prices.
Equinor, Annual Report on Form 20-F 2018 179
Segment data for the years ended 31 December 2018, 2017 and 2016 are presented below. The measurement basis of segment profit is net operating income/(loss). In the tables below, deferred tax assets, pension assets and non-current financial assets are not allocated to the segments. The line additions to PP&E, intangibles and equity accounted investments are excluding movements due to changes in asset retirement obligations.
(in USD million) | E&P Norway | E&P International | MMP | Other | Eliminations | Total |
| | | | | | |
Full year 2018 | | | | | | |
Revenues third party, other revenues and other income | 588 | 3,181 | 75,487 | 45 | 0 | 79,301 |
Revenues inter-segment | 21,877 | 9,186 | 291 | 2 | (31,355) | 0 |
Net income/(loss) from equity accounted investments | 10 | 31 | 16 | 234 | 0 | 291 |
| | | | | | |
Total revenues and other income | 22,475 | 12,399 | 75,794 | 280 | (31,355) | 79,593 |
| | | | | | |
Purchases [net of inventory variation] | 2 | (26) | (69,296) | (0) | 30,805 | (38,516) |
Operating, selling, general and administrative expenses | (3,270) | (3,006) | (4,377) | (288) | 653 | (10,286) |
Depreciation, amortisation and net impairment losses | (4,370) | (4,592) | (215) | (72) | 0 | (9,249) |
Exploration expenses | (431) | (973) | 0 | 0 | 0 | (1,405) |
| | | | | | |
Net operating income/(loss) | 14,406 | 3,802 | 1,906 | (79) | 103 | 20,137 |
| | | | | | |
Additions to PP&E, intangibles and equity accounted investments | 6,947 | 7,403 | 331 | 519 | 0 | 15,201 |
| | | | | | |
Balance sheet information | | | | | | |
Equity accounted investments | 1,102 | 296 | 92 | 1,373 | 0 | 2,863 |
Non-current segment assets | 30,762 | 38,672 | 5,148 | 353 | 0 | 74,934 |
Non-current assets, not allocated to segments | | | | | | 8,655 |
| | | | | | |
Total non-current assets | | | | | | 86,452 |
| | | | | | |
|
| | | | | | |
180 Equinor, Annual Report on Form 20-F 2018
(in USD million) | E&P Norway | E&P International | MMP | Other | Eliminations | Total | |
| | | | | | | |
Full year 2017 | | | | | | | |
Revenues third party, other revenues and other income | (23) | 1,984 | 58,935 | 102 | 0 | 60,999 | |
Revenues inter-segment1) | 17,586 | 7,249 | 83 | 1 | (24,919) | 0 | |
Net income/(loss) from equity accounted investments | 129 | 22 | 53 | (16) | 0 | 188 | |
| | | | | | | |
Total revenues and other income | 17,692 | 9,256 | 59,071 | 87 | (24,919) | 61,187 | |
| | | | | | | |
Purchases [net of inventory variation]1) | 0 | (7) | (52,647) | (0) | 24,442 | (28,212) | |
Operating, selling, general and administative expenses1) | (2,954) | (2,804) | (3,925) | (235) | 418 | (9,501) | |
Depreciation, amortisation and net impairment losses | (3,874) | (4,423) | (256) | (91) | (0) | (8,644) | |
Exploration expenses | (379) | (681) | 0 | 0 | 0 | (1,059) | |
| | | | | | | |
Net operating income/(loss) | 10,485 | 1,341 | 2,243 | (239) | (59) | 13,771 | |
| | | | | | | |
Additions to PP&E, intangibles and equity accounted investments | 4,869 | 5,063 | 320 | 543 | 0 | 10,795 | |
| | | | | | | |
Balance sheet information | | | | | | | |
Equity accounted investments | 1,133 | 234 | 134 | 1,050 | 0 | 2,551 | |
Non-current segment assets | 30,278 | 36,453 | 5,137 | 390 | 0 | 72,258 | |
Non-current assets, not allocated to segments | | | | | | 9,102 | |
| | | | | | | |
Total non-current assets | | | | | | 83,911 | |
| | | | | | | |
1) Parts of the gas transportation costs that previously were allocated to MMP and therefore deducted from the inter segment transfer price, are from 1 January 2017 allocated to E&P Norway. | |
| |
Equinor, Annual Report on Form 20-F 2018 181
(in USD million) | E&P Norway | E&P International | MMP | Other | Eliminations | Total |
| | | | | | |
Full year 2016 | | | | | | |
Revenues third party, other revenues and other income | 184 | 884 | 44,883 | 41 | 0 | 45,993 |
Revenues inter-segment | 12,971 | 5,873 | 35 | 1 | (18,880) | (0) |
Net income/(loss) from equity accounted investments | (78) | (100) | 61 | (3) | 0 | (119) |
| | | | | | |
Total revenues and other income | 13,077 | 6,657 | 44,979 | 39 | (18,880) | 45,873 |
| | | | | | |
Purchases [net of inventory variation] | 1 | (7) | (39,696) | (0) | 18,198 | (21,505) |
Operating, selling, general and administative expenses | (2,547) | (2,923) | (4,439) | (340) | 463 | (9,787) |
Depreciation, amortisation and net impairment losses | (5,698) | (5,510) | (221) | (121) | 0 | (11,550) |
Exploration expenses | (383) | (2,569) | 0 | 0 | 0 | (2,952) |
| | | | | | |
Net operating income /(loss) | 4,451 | (4,352) | 623 | (423) | (219) | 80 |
| | | | | | |
Additions to PP&E, intangibles and equity accounted investments | 6,786 | 6,397 | 492 | 451 | 0 | 14,125 |
| | | | | | |
Balance sheet information | | | | | | |
Equity accounted investments | 1,133 | 365 | 129 | 617 | 0 | 2,245 |
Non-current segment assets | 27,816 | 36,181 | 4,450 | 352 | 0 | 68,799 |
Non-current assets, not allocated to segments | | | | | | 8,090 |
| | | | | | |
Total non-current assets | | | | | | 79,133 |
See note 4 Acquisitions and disposals for information on transactions that affect the different segments.
See note 10 Property, plant and equipment for further information on impairment losses and impairment reversals that affect the different segments.
See note 11 Intangible assets for information on impairment losses and impairment reversals that affect the different segments.
See note 24 Other commitments, contingent liabilities and contingent assets for information on contingencies that affect the segments.
Revenues from contracts with customers by geographical areas
Equinor has business operations in more than 30 countries. When attributing revenues from contracts with customers to the country of the legal entity executing the sale, Norway constitutes 75% and the US constitutes 18%.
182 Equinor, Annual Report on Form 20-F 2018
Non-current assets by country | | | |
| At 31 December |
(in USD million) | 2018 | 2017 | 2016 |
| | | |
Norway | 34,952 | 34,588 | 31,484 |
USA | 19,409 | 19,267 | 18,223 |
Brazil | 7,861 | 4,584 | 5,308 |
UK | 4,588 | 4,222 | 3,108 |
Angola | 1,874 | 2,888 | 3,884 |
Canada | 1,546 | 1,715 | 1,494 |
Azerbaijan | 1,452 | 1,472 | 1,326 |
Algeria | 986 | 1,114 | 1,344 |
Other countries | 5,128 | 4,958 | 4,873 |
| | | |
Total non-current assets1) | 77,797 | 74,809 | 71,043 |
1) Excluding deferred tax assets, pension assets and non-current financial assets.
Revenues from contracts with customers and other revenues | |
| 2018 | 2017 | 2016 | |
(in USD million) | | | | |
| | | | |
Crude oil | 40,948 | 29,519 | 24,307 | |
Natural gas | 14,559 | 11,420 | 9,202 | |
Refined products | 13,124 | 11,423 | 8,142 | |
Natural gas liquids | 7,167 | 5,647 | 4,036 | |
Transportation | 1,033 | | | |
Other sales | 903 | 2,963 | 1 | |
| | | | |
Total revenues from contracts with customers | 77,734 | 60,971 | 45,688 | |
| | | | |
Over/Under lift | 137 | | | |
Taxes paid in-kind | 865 | | | |
Gain (loss) on commodity derivatives | (216) | | | |
Other revenues | 36 | | | |
Total other revenues | 821 | | | |
| | | | |
Revenues | 78,555 | 60,971 | 45,688 | |
| | | | |
For 2017 and 2016, the transportation element included in sales transactions with customers are included in Crude Oil, Refined Products and Natural Gas Liquids. Other transportation was included in other sales. In 2018 these elements are included in Transportation. The elements included in Total other revenues were for 2017 and 2016 included in other sales. | |
| |
| |
The changes are due to implementation of IFRS15, see note 27 Changes in accounting policies. | | | | |
| | | | |
4 Acquisitions and disposals
2018
Acquisition of interests in Martin Linge field and Garantiana discovery
In March 2018 Equinor and Total closed an agreement to acquire Total’s equity stakes in the Martin Linge field (51%) and the Garantiana discovery (40%) on the NCS. Through this transaction Equinor increased the ownership share in the Martin Linge field from 19% to 70%. Equinor has paid Total a consideration of USD 1,541 million and has taken over the operatorships. The assets and liabilities related to the acquired portion of Martin Linge and Garantiana have been reflected in accordance with the principles of IFRS 3 Business Combinations. The acquisition resulted in an increase of Equinor’s property, plant and equipment of USD 1,418 million, intangible assets of USD 116 million, goodwill of USD 265 million,
Equinor, Annual Report on Form 20-F 2018 183
deferred tax liabilities of USD 265 million and other assets of USD 7 million. The partners have joint control and Equinor continues to account for its interest on a pro-rata basis using Equinor's new ownership share. The transaction has been accounted for in the Exploration and Production Norway (E&P Norway) segment.
Acquisition of Cobalt’s North Platte interest in the Gulf of Mexico
In March 2018 Equinor’s co-bid with Total in the bankruptcy auction for Cobalt’s interest in the North Platte discovery was successful with an aggregate bid of USD 339 million. The transaction was closed in April 2018. Upon closing, Total as operator owns 60% of North Platte and Equinor owns the remaining 40%. The value of the acquired exploration assets has been recognised in the Exploration & Production International (E&P International) segment for an amount of USD 246 million as intangible assets. Additionally, the transaction includes a contingent consideration up to USD 20 million.
Acquisition of interest in Roncador field in Brazil
In June 2018 Equinor closed an agreement with Petrobras to acquire a 25% interest in Roncador, an oil field in the Campos Basin in Brazil. Equinor paid Petrobras a cash consideration of USD 2,133 million, in addition to recognising a liability for contingent consideration of USD 392 million. The assets and liabilities related to the acquired portion of Roncador have been reflected in accordance with the principles of IFRS 3 Business Combinations. The acquisition resulted in an increase of Equinor’s property, plant and equipment of USD 2,550 million, intangible assets of USD 392 million and an increase in provisions of USD 808 million. At this stage, both the purchase price and the purchase price allocation are preliminary. The partners have joint control and Equinor will account for its interest on a pro-rata basis. The transaction has been accounted for in the E&P International segment.
Acquisition and divestment of operated interest in Carcara field in Brazil
In November 2016 Equinor acquired a 66% operated interest in the Brazilian offshore licence BM-S-8 in the Santos basin from Petróleo Brasileiro S.A. (“Petrobras”). The value of the acquired exploration assets resulted in an increase in intangible assets of USD 2,271 million at the transaction date.
In October 2017, a consortium comprising Equinor (operator, 40%), ExxonMobil (40%) and Galp (20%) presented the winning bid (67.12% of profit oil) for the Carcará North block in the Santos basin. Equinor’s share of the pre-determined signature bonus paid by the consortium in December 2017 was USD 350 million and was recognised as an intangible asset.
In December 2017 Equinor acquired Queiroz Galvão Exploração e Produção (“QGEP”)’s 10% interest in licence BM-S-8 in Brazil’s Santos basin increasing the operated interest to 76%. The value of the acquired exploration assets resulted in an increase in intangible assets of USD 362 million at the transaction date.
In June 2018 Equinor completed the divestment of 39.5% of its 76% interest in BM-S-8, agreed in October 2017. 36.5% interest was divested to ExxonMobil and 3% to Galp for a total consideration of USD 1,493 million. The transaction is accounted for with no impact on the Consolidated statement of income. The cash proceeds from the sale were USD 1,016 million. The transactions are accounted for in the E&P International segment.
In July 2018 Equinor and Barra Energia (“Barra”) signed an agreement to acquire Barra’s 10% interest in the BM-S-8 licence in Brazil’s Santos basin. Upon closing, Equinor will sell down 3.5% to ExxonMobil and 3% to Galp. The total consideration for Barra’s 10% interest is USD 379 million.
Upon closing, which is subject to customary conditions, including partner and government approval and is expected within a year, Equinor will have fully aligned interests across BM-S-8 licence and Carcará North block, which are expected to be unitised in the future.
Acquisition of 100% shares in Danske Commodities
In July 2018 Equinor entered an agreement to buy 100% of the shares in a Danish energy trading company Danske Commodities (DC) for a consideration of EUR 400 million, which will be adjusted for certain net cash and net working capital positions at closing. In addition, some smaller contingent payments depending on DC’s performance have been agreed. The transaction was closed in January 2019. Upon closing of the transaction, the assets and liabilities related to the acquired business will be reflected according to IFRS 3 Business Combinations. The transaction will be accounted for in the Marketing, Midstream & Processing (MMP) segment and will result in goodwill reflecting the expected synergies on the acquisition. At this stage, both the purchase price and the purchase price allocation are preliminary.
Acquisition of interest in Rosebank project in UK
In October 2018 Equinor signed an agreement to acquire Chevron’s 40% operated interest in the Rosebank project, one of the largest undeveloped fields on the UK continental shelf. The other partners in the field are Suncor Energy (40%) and Siccar Point Energy (20%). The transaction was closed in January 2019 and will be recognised in the E&P International segment.
Divestment of interests in discoveries on the Norwegian continental shelf
In December 2018 Equinor closed an agreement with Aker BP to sell its 77.8% operated interest in the King Lear discovery on the Norwegian continental shelf (NCS) for a total consideration of USD 250 million and an agreement with PGNiG to sell its non-operated interests in the Tommeliten discovery on the NCS for a total consideration of USD 220 million. A gain of USD 449 million has been presented in the line item Other income in the Consolidated statement of income in the E&P Norway segment. The transaction was tax exempt under the Norwegian petroleum tax legislation.
184 Equinor, Annual Report on Form 20-F 2018
Swap of interests in the Norwegian Sea and the North Sea region of the Norwegian continental shelf
In December 2018 Equinor and Faroe Petroleum have agreed a number of transactions in the Norwegian Sea and the North Sea region of the Norwegian continental shelf (NCS). These transactions are considered a balanced swap when it comes to value with no cash consideration. The effective dates of the transactions are 1 January 2019 with closing subject to governmental approval. Upon closing, which is expected within the first half of 2019, the transactions will be recognised in the E&P Norway segment.
Acquisition of offshore wind lease in the US
In December 2018 Equinor submitted a winning bid of USD 135 million for lease OCS-A 0520, during the online offshore wind auction, where Equinor has been declared the provisional winner of one of three leases in an area offshore the Commonwealth of Massachusetts. Upon completion, which is subject to governmental approval, the acquisition will be recognised in the Other segment in the first half of 2019.
2017
Sale of interest in Kai Kos Dehseh
In January 2017 Equinor closed an agreement with Athabasca Oil Corporation to divest its 100% interest in Kai Kos Dehseh (KKD) oil sands. The total consideration consisted of cash consideration of CAD 431 million (USD 328 million), 100 million common shares in Athabasca Oil Corporation and a series of contingent payments, measured at a combined fair value of CAD 185 million (USD 142 million) on the closing date. A loss on the transaction of USD 351 million was recognised as operating expense and included a reclassification of accumulated foreign exchange losses, previously recognised in other comprehensive income/(loss). The transaction was reflected in the E&P International segment.
Extension of the Azeri-Chirag-Deepwater Gunashli production sharing agreement
In September 2017 the Azeri-Chirag-Deepwater Gunashli (ACG) production sharing agreement was extended by 25 years. The transaction was recognised in the E&P International segment in the fourth quarter of 2017, following ratification by the Parliament (Milli Majlis) of the Republic of Azerbaijan. As part of the new agreement, Equinor’s participating interest was adjusted to 7.27% down from 8.56%. Equinor's share of a total payment of USD 3.6 billion to the State Oil Fund of the Republic of Azerbaijan will be approximately USD 349 million to be paid over a period of 8 years.
2016
Acquisition of shares in Lundin Petroleum AB (Lundin) and sale of interests in the Edvard Grieg field
In January 2016 Equinor acquired 11.93% of the issued share capital and votes in Lundin Petroleum AB for a total purchase price of SEK 4.6 billion (USD 541 million). In June 2016 Equinor closed an agreement with Lundin to divest its entire 15% interest in the Edvard Grieg field, a 9% interest in the Edvard Grieg Oil pipeline and a 6% interest in the Utsira High Gas pipeline for an increased ownership share in Lundin up to 20.1% of the outstanding shares and votes. In addition to the divested interests, a cash consideration of SEK 544 million (USD 64 million) was paid to Lundin. Following the completion of the transaction Equinor recognised a total net gain of USD 120 million related to the divestment presented in the line item Other income in the Consolidated statement of income. In the segment reporting, the gain was recognised in the E&P Norway segment (USD 114 million) and in the Marketing, Midstream & Processing (MMP) segment (USD 5 million). The transaction was tax exempt under the Norwegian petroleum tax legislation.
Following the increase in ownership interest on 30 June 2016, Equinor obtained significant influence over Lundin, and accounted for the investment as an associate under the equity method. Excess values were allocated mainly to Lundin`s exploration and production licences on the Norwegian continental shelf. The investment in Lundin was included in the Consolidated balance sheet within line item Equity accounted investments with a book value of USD 1,199 million as per 30 June 2016. The Lundin investment is reported as part of the E&P Norway segment. For summarised financial information relating to investment in Lundin Petroleum AB, see note 12 Equity accounted investments. Following the change in accounting classification, Equinor recognised a gain of USD 127 million representing the cumulative gain on its initial 11.93% shareholding being reclassified from the line item Net gains (losses) from available for sale financial assets in the Consolidated statement of comprehensive income, to the Net financial items line item in the Consolidated statement of income.
Sale of interest in Marcellus operated onshore play
In July 2016 Equinor divested its operated properties in the US state of West Virginia to EQT Corporation for USD 407 million in cash. The transaction was reported as part of E&P International segment with an immaterial effect on the Consolidated statement of income recognised in the third quarter of 2016.
5 Financial risk management
General information relevant to financial risks
Equinor's business activities naturally expose Equinor to financial risk. Equinor’s approach to risk management includes assessing and managing risk in all activities using a holistic risk approach. Equinor takes into account correlations between the most important market risks and the natural hedges inherent in Equinor’s portfolio. This approach allows Equinor to reduce the number of risk management transactions and avoid sub-optimisation.
The corporate risk committee, which is headed by the chief financial officer and includes representatives from the principal business segments, is responsible for defining, developing and reviewing Equinor’s risk policies. The chief financial officer, assisted by the committee, is also responsible
Equinor, Annual Report on Form 20-F 2018 185
for overseeing and developing Equinor’s Enterprise Risk Management and proposing appropriate measures to adjust risk at the corporate level. Major strategic transactions are assessed by Equinor’s corporate risk committee.
An important element in risk management is the use of centralised trading mandates. Mandates in the trading organisations within crude oil, refined products, natural gas and electricity are relatively small compared to the total market risk of Equinor.
Financial risks
Equinor’s activities expose Equinor to market risk (including commodity price risk, currency risk, interest rate risk and equity price risk), liquidity risk and credit risk.
Market risk
Equinor operates in the worldwide crude oil, refined products, natural gas, and electricity markets and is exposed to market risks including fluctuations in hydrocarbon prices, foreign currency rates, interest rates, and electricity prices that can affect the revenues and costs of operating, investing and financing. These risks are managed primarily on a short-term basis with a focus on achieving the highest risk-adjusted returns for Equinor within the given mandate. Long-term exposures are managed at the corporate level, while short-term exposures are managed according to trading strategies and mandates.
For more information on sensitivity analysis of market risk see note 26 Financial instruments: fair value measurement and sensitivity analysis of market risk.
Commodity price risk
Equinor’s most important long-term commodity risk (oil and natural gas) is related to future market prices as Equinor´s risk policy is to be exposed to both upside and downside price movements. To manage short-term commodity risk, Equinor enters into commodity-based derivative contracts, including futures, options, over-the-counter (OTC) forward contracts, market swaps and contracts for differences related to crude oil, petroleum products, natural gas and electricity. Equinor’s bilateral gas sales portfolio is exposed to various price indices and uses derivatives to manage the net gas sales exposure towards a diversified combination of long and short dated gas price markers.
The term of crude oil and refined oil products derivatives are usually less than one year, and they are traded mainly on the Inter Continental Exchange (ICE) in London, the New York Mercantile Exchange (NYMEX), the OTC Brent market, and crude and refined products swap markets. The term of natural gas and electricity derivatives is usually three years or less, and they are mainly OTC physical forwards and options, NASDAQ OMX Oslo forwards and futures traded on the NYMEX and ICE.
Currency risk
Equinor’s cash flows from operating activities deriving from oil and gas sales, operating expenses and capital expenditures are mainly in USD, but taxes, dividends to shareholders on the Oslo Børs and a share of our operating expenses and capital expenditures are in NOK. Accordingly, Equinor’s currency management is primarily linked to mitigate currency risk related to payments in NOK. This means that Equinor regularly purchases NOK, primarily spot, but also on a forward basis using conventional derivative instruments.
Interest rate risk
Bonds are normally issued at fixed rates in a variety of local currencies (among others USD, EUR and GBP). Bonds are normally converted to floating USD bonds by using interest rate and currency swaps. Equinor manages its interest rates exposure on its bond debt based on risk and reward considerations from an enterprise risk management perspective. This means that the fixed/floating mix on interest rate exposure may vary from time to time. For more detailed information about Equinor’s long-term debt portfolio see note 18 Finance debt.
Equity price risk
Equinor’s captive insurance company holds listed equity securities as part of its portfolio. In addition, Equinor holds some other listed and non-listed equities mainly for long-term strategic purposes. By holding these assets Equinor is exposed to equity price risk, defined as the risk of declining equity prices, which can result in a decline in the carrying value of Equinor’s assets recognised in the balance sheet. The equity price risk in the portfolio held by Equinor’s captive insurance company is managed, with the aim of maintaining a moderate risk profile, through geographical diversification and the use of broad benchmark indexes.
Liquidity risk
Liquidity risk is the risk that Equinor will not be able to meet obligations of financial liabilities when they become due. The purpose of liquidity management is to ensure that Equinor has sufficient funds available at all times to cover its financial obligations.
The main cash outflows include the quarterly dividend payments and Norwegian petroleum tax payments paid six times per year. If the cash flow forecasts indicate that the liquid assets will fall below target levels, new long-term funding will be considered.
Short-term funding needs will normally be covered by the USD 5.0 billion US Commercial paper programme (CP) which is backed by a revolving credit facility of USD 5.0 billion, supported by 21 core banks, maturing in 2022. The facility supports secure access to funding, supported by the best available short-term rating. As at 31 December 2018 the facility has not been drawn.
186 Equinor, Annual Report on Form 20-F 2018
Equinor raises debt in all major capital markets (US, Europe and Asia) for long-term funding purposes. The policy is to have a maturity profile with repayments not exceeding 5% of capital employed in any year for the nearest five years. Equinor’s non-current financial liabilities have a weighted average maturity of approximately nine years.
For more information about Equinor’s non-current financial liabilities see note 18 Finance debt.
The table below shows a maturity profile, based on undiscounted contractual cash flows, for Equinor’s financial liabilities.
| At 31 December |
| 2018 | 2017 |
(in USD million) | Non-derivative financial liabilities | Derivative financial liabilities | Non-derivative financial liabilities | Derivative financial liabilities |
| | | | |
Year 1 | 12,020 | 271 | 14,502 | 166 |
Year 2 and 3 | 5,624 | 677 | 5,246 | 85 |
Year 4 and 5 | 5,042 | 203 | 4,441 | 369 |
Year 6 to 10 | 10,761 | 611 | 11,630 | 283 |
After 10 years | 9,617 | 725 | 11,294 | 204 |
| | | | |
Total specified | 43,064 | 2,488 | 47,114 | 1,107 |
Credit risk
Credit risk is the risk that Equinor’s customers or counterparties will cause Equinor financial loss by failing to honor their obligations. Credit risk arises from credit exposures with customer accounts receivables as well as from financial investments, derivative financial instruments and deposits with financial institutions.
Prior to entering into transactions with new counterparties, Equinor’s credit policy requires all counterparties to be formally identified and assigned internal credit ratings as well as exposure limits. The internal credit ratings reflect Equinor’s assessment of the counterparties' credit risk and are based on a quantitative and qualitative analysis of recent financial statements and other relevant business. All counterparties are re-assessed regularly.
Equinor uses risk mitigation tools to reduce or control credit risk both on a counterparty and portfolio level. The main tools include bank and parental guarantees, prepayments and cash collateral.
Equinor has pre-defined limits for the absolute credit risk level allowed at any given time on Equinor’s portfolio as well as maximum credit exposures for individual counterparties. Equinor monitors the portfolio on a regular basis and individual exposures against limits on a daily basis. The total credit exposure portfolio of Equinor is geographically diversified among a number of counterparties within the oil and energy sector, as well as larger oil and gas consumers and financial counterparties. The majority of Equinor’s credit exposure is with investment grade counterparties.
Equinor, Annual Report on Form 20-F 2018 187
The following table contains the carrying amount of Equinor’s financial receivables and derivative financial instruments split by Equinor’s assessment of the counterparty's credit risk. Trade and other receivables include 2% overdue receivables for 30 days and more. The overdue receivables are mainly joint venture receivables pending the settlement of disputed working interest items payable from Equinor’s working interest partners within its US unconventional activities. Provisions have been made for expected losses utilising the expected credit loss model. Only non-exchange traded instruments are included in derivative financial instruments. For more information related to the impact of IFRS 9, see note 27 Changes in accounting policies.
(in USD million) | Non-current financial receivables | Trade and other receivables | Non-current derivative financial instruments | Current derivative financial instruments |
| | | | |
At 31 December 2018 | | | | |
Investment grade, rated A or above | 460 | 1,811 | 682 | 100 |
Other investment grade | 150 | 5,412 | 350 | 183 |
Non-investment grade or not rated | 244 | 1,265 | 0 | 35 |
| | | | |
Total financial asset | 854 | 8,488 | 1,032 | 318 |
| | | | |
At 31 December 2017 | | | | |
Investment grade, rated A or above | 262 | 2,148 | 1,079 | 84 |
Other investment grade | 214 | 6,135 | 525 | 71 |
Non-investment grade or not rated | 247 | 278 | 0 | 5 |
| | | | |
Total financial asset | 723 | 8,560 | 1,603 | 159 |
For more information about Trade and other receivables, see note 15 Trade and other receivables.
At 31 December 2018, USD 213 million of cash was held as collateral to mitigate a portion of Equinor's credit exposure. At 31 December 2017, USD 704 million was held as collateral. The collateral cash is received as a security to mitigate credit exposure related to positive fair values on interest rate swaps, cross currency swaps and foreign exchange swaps. Cash is called as collateral in accordance with the master agreements with the different counterparties when the positive fair values for the different swap agreements are above an agreed threshold.
Under the terms of various master netting agreements for derivative financial instruments as of 31 December 2018, USD 119 million have been offset and USD 655 million presented as liabilities do not meet the criteria for offsetting. At 31 December 2017, USD 141 million were offset and USD 706 million was not offset. The collateral received and the amounts not offset from derivative financial instrument liabilities, reduce the credit exposure in the derivative financial instruments presented in the table above as they will offset each other in a potential default situation for the counterparty. Trade and other receivables subject to similar master netting agreements USD 557 million have been offset as of 31 December 2018, and respectively USD 502 million as of 31 December 2017.
6 Remuneration
| Full year |
(in USD million, except average number of employees) | 2018 | 2017 | 2016 |
| | | |
Salaries1) | 2,863 | 2,671 | 2,576 |
Pension costs | 463 | 469 | 650 |
Payroll tax | 409 | 387 | 394 |
Other compensations and social costs | 318 | 290 | 276 |
| | | |
Total payroll costs | 4,052 | 3,818 | 3,895 |
| | | |
Average number of employees2) | 20,700 | 20,700 | 21,300 |
1) Salaries include bonuses, severance packages and expatriate costs in addition to base pay.
2) Part time employees amount to 3% for each of the years 2018, 2017 and 2016 respectively.
Total payroll expenses are accumulated in cost-pools and partly charged to partners of Equinor operated licences on an hours incurred basis.
188 Equinor, Annual Report on Form 20-F 2018
Compensation to the board of directors (BoD) and the corporate executive committee (CEC)
| Full year |
(in USD thousand)1) | 2018 | 2017 | 2016 |
| | | |
Current employee benefits | 12,471 | 11,067 | 9,270 |
Post-employment benefits | 667 | 636 | 574 |
Other non-current benefits | 21 | 25 | 19 |
Share-based payment benefits | 197 | 175 | 102 |
| | | |
Total | 13,356 | 11,902 | 9,966 |
1) All figures in the table are presented on accrual basis.
At 31 December 2018, 2017 and 2016 there are no loans to the members of the BoD or the CEC.
Share-based compensation
Equinor's share saving plan provides employees with the opportunity to purchase Equinor shares through monthly salary deductions and a contribution by Equinor. If the shares are kept for two full calendar years of continued employment following the year of purchase, the employees will be allocated one bonus share for each one they have purchased.
Estimated compensation expense including the contribution by Equinor for purchased shares, amounts vested for bonus shares granted and related social security tax was USD 72 million, USD 62 million and USD 61 million related to the 2018, 2017 and 2016 programmes, respectively. For the 2019 programme (granted in 2018) the estimated compensation expense is USD 73 million. At 31 December 2018 the amount of compensation cost yet to be expensed throughout the vesting period is USD 153 million.
7 Other expenses
Auditor's remuneration |
| Full year |
(in USD million, excluding VAT) | 2018 | 2017 | 2016 |
| | | |
Audit fee | 7.1 | 6.1 | 6.5 |
Audit related fee | 1.0 | 0.9 | 1.0 |
Tax fee | 0.0 | 0.0 | 0.1 |
Other service fee | 0.0 | 0.0 | 0.0 |
| | | |
Total | 8.1 | 7.0 | 7.5 |
| | | |
In addition to the figures in the table above, the audit fees and audit related fees related to Equinor operated licences amount to USD 0.9 million, USD 0.8 million and USD 0.8 million for 2018, 2017 and 2016, respectively.
Research and development expenditures
Research and development (R&D) expenditures were USD 315 million, USD 307 million and USD 298 million in 2018, 2017 and 2016, respectively. R&D expenditures are partly financed by partners of Equinor operated licences. Equinor's share of the expenditures has been recognised as expense in the Consolidated statement of income.
Equinor, Annual Report on Form 20-F 2018 189
8 Financial items
| Full year |
(in USD million) | 2018 | 2017 | 2016 |
| | | |
Foreign exchange gains (losses) derivative financial instruments | 149 | (920) | 353 |
Other foreign exchange gains (losses) | (315) | 1,046 | (473) |
| | | |
Net foreign exchange gains (losses) | (166) | 126 | (120) |
| | | |
Dividends received | 150 | 63 | 46 |
Gains (losses) financial investments | (72) | 108 | (0) |
Interest income financial investments | 45 | 64 | 63 |
Interest income non-current financial receivables | 27 | 24 | 22 |
Interest income current financial assets and other financial items | 132 | 228 | 305 |
| | | |
Interest income and other financial items | 283 | 487 | 436 |
| | | |
Gains (losses) derivative financial instruments | (341) | (61) | 470 |
| | | |
Interest expense bonds and bank loans and net interest on related derivatives | (922) | (1,004) | (830) |
Interest expense finance lease liabilities | (23) | (26) | (26) |
Capitalised borrowing costs | 552 | 454 | 355 |
Accretion expense asset retirement obligations | (461) | (413) | (420) |
Interest expense current financial liabilities and other finance expense | (185) | 86 | (122) |
| | | |
Interest and other finance expenses | (1,040) | (903) | (1,043) |
| | | |
Net financial items | (1,263) | (351) | (258) |
Equinor's main financial items relate to assets and liabilities categorised in the fair value through profit or loss and the amortised cost category. For more information about financial instruments by category see note 26 Financial instruments: fair value measurement and sensitivity analysis of market risk. For information related to change in categories and impact of IFRS 9 implementation, see note 27 Changes in accounting policies.
The line item Interest expense bonds and bank loans and net interest on related derivatives primarily includes interest expenses of USD 868 million, USD 1,084 million, and USD 1,018 million from the financial liabilities at amortised cost category and net interest on related derivatives from the fair value through profit or loss category with net interest expense of USD 55 million, net interest income of USD 80 million and net interest income of USD 188 million for 2018, 2017 and 2016, respectively.
The line item Gains (losses) derivative financial instruments primarily includes fair value changes from the fair value through profit or loss category on derivatives related to interest rate risk, with a loss of USD 357 million in 2018. Correspondingly a loss of USD 77 million and a gain of USD 454 million for 2017 and 2016, respectively.
The line item Interest expense current financial liabilities and other finance expense includes an income of USD 319 million in 2017 related to release of a provision.
Foreign exchange gains (losses) derivative financial instruments include fair value changes of currency derivatives related to liquidity and currency risk. The line item Other foreign exchange gains (losses) includes a net foreign exchange loss of USD 422 million, a gain of USD 427 million and a loss of USD 205 million from the fair value through profit or loss category for 2018, 2017 and 2016, respectively.
190 Equinor, Annual Report on Form 20-F 2018
9 Income taxes
Significant components of income tax expense |
| Full year |
(in USD million) | 2018 | 2017 | 2016 |
| | | |
Current income tax expense in respect of current year | (10,724) | (7,680) | (3,869) |
Prior period adjustments | (49) | (124) | (158) |
| | | |
Current income tax expense | (10,773) | (7,805) | (4,027) |
| | | |
Origination and reversal of temporary differences | (1,359) | (904) | 1,372 |
Recognition of previously unrecognised deferred tax assets | 923 | 0 | 0 |
Change in tax regulations | (28) | (14) | (50) |
Prior period adjustments | (99) | (100) | (20) |
| | | |
Deferred tax expense | (563) | (1,017) | 1,302 |
| | | |
Income tax expense | (11,335) | (8,822) | (2,724) |
During the normal course of its business, Equinor files tax returns in many different tax regimes. There may be differing interpretation of applicable tax laws and regulations regarding some of the matters in the tax returns. In certain cases it may take several years to complete the discussions with the relevant tax authorities or to reach a resolution of the tax positions through litigations. Equinor has provided for probable income tax related assets and liabilities based on best estimates reflecting consistent interpretations of the applicable laws and regulations.
Equinor, Annual Report on Form 20-F 2018 191
Reconciliation of statutory tax rate to effective tax rate |
| Full year |
(in USD million) | 2018 | 2017 | 2016 |
| | | |
Income/(loss) before tax | 18,874 | 13,420 | (178) |
| | | |
Calculated income tax at statutory rate1) | (5,197) | (3,827) | 676 |
Calculated Norwegian Petroleum tax2) | (8,189) | (5,945) | (2,250) |
Tax effect uplift2) | 736 | 784 | 812 |
Tax effect of permanent differences regarding divestments | 400 | (85) | 153 |
Tax effect of permanent differences caused by functional currency different from tax currency | 116 | (229) | (356) |
Tax effect of other permanent differences | 337 | 291 | (48) |
Tax effect of dispute with Angolan Ministry of Finance3) | 0 | 496 | 0 |
Recognition of previously unrecognised deferred tax assets4) | 923 | 0 | 0 |
Change in unrecognised deferred tax assets | 72 | (169) | (1,625) |
Change in tax regulations | (28) | (14) | (50) |
Prior period adjustments | (148) | (224) | (177) |
Other items including currency effects | (357) | 100 | 141 |
| | | |
Income tax expense | (11,335) | (8,822) | (2,724) |
| | | |
Effective tax rate | 60.1% | 65.7% | >(100%) |
1) The weighted average of statutory tax rates was 27.5% in 2018, 28.5% in 2017 and 379.8% in 2016. The rates are influenced by earnings composition between tax regimes with lower statutory tax rates and tax regimes with higher statutory tax rates. The change in weighted average statutory tax rate from 2017 to 2018 is mainly caused by the reduction in the Norwegian statutory tax rate from 24% in 2017 to 23% in 2018. The high rate in 2016 and the change in weighted average statutory tax rate from 2016 to 2017 is mainly caused by earnings composition between tax regimes with lower statutory tax rates and tax regimes with higher statutory tax rates. In 2016 there were positive income in tax regimes with relatively lower tax rates and losses, including impairments and provisions, in tax regimes with relatively higher tax rates.
2) When computing the petroleum tax of 55% (56% from 2019) on income from the Norwegian continental shelf, an additional tax-free allowance, or uplift, is granted on the basis of the original capitalised cost of offshore production installations. The uplift may be deducted from taxable income for a period of four years starting in the year in which the capital expenditure is incurred. For investments made in 2018 the uplift is calculated at a rate of 5.3% per year, while the rate is 5.4% per year for investments made in 2017 and 5.5% per year for investments made in 2014-2016. The rate is 5.2% per year from 2019 for new investments. Transitional rules apply to investments from 5 May 2013 covered by among others Plans for development and operation (PDOs) or Plans for installation and operation (PIOs) submitted to the Ministry of Oil and Energy prior to 5 May 2013. For these investments the rate is 7.5% per year. Unused uplift may be carried forward indefinitely. At year end 2018 and 2017, unrecognised uplift credits amounted to USD 1,780 million and USD 2,003 million, respectively.
3) In June 2017 Equinor signed an agreement with the Angolan Ministry of Finance which resolved the dispute over previously assessed additional profit oil and taxes due, and established how to allocate profit oil and assess petroleum income tax (PIT) related to Equinor’s participation in Block 4, Block 15, Block 17 and Block 31 offshore Angola for the years 2002 to 2016.
4) An amount of USD 923 million of previously unrecognised deferred tax assets was recognised in the E&P International reporting segment in 2018. The recognition of the deferred tax assets is based on the expectation that sufficient taxable income will be available through reversals of taxable temporary differences or future taxable income supported by business forecast.
192 Equinor, Annual Report on Form 20-F 2018
Deferred tax assets and liabilities comprise |
(in USD million) | Tax losses carried forward | Property, plant and equipment and Intangible assets | Asset removal obligation | Pensions | Derivatives | Other | Total |
| | | | | | | |
Deferred tax at 31 December 2018 | | | | | | |
Deferred tax assets | 5,761 | 351 | 8,118 | 785 | 95 | 1,095 | 16,205 |
Deferred tax liabilities | (0) | (20,987) | 0 | (14) | (96) | (476) | (21,573) |
| | | | | | | |
Net asset (liability) at 31 December 2018 | 5,761 | (20,636) | 8,118 | 771 | (1) | 620 | (5,367) |
| | | | | | | |
Deferred tax at 31 December 2017 | | | | | | |
Deferred tax assets | 4,459 | 259 | 8,049 | 738 | 34 | 763 | 14,302 |
Deferred tax liabilities | (0) | (19,027) | 0 | (11) | (27) | (451) | (19,515) |
| | | | | | | |
Net asset (liability) at 31 December 2017 | 4,459 | (18,768) | 8,049 | 728 | 7 | 312 | (5,213) |
Changes in net deferred tax liability during the year were as follows: |
(in USD million) | 2018 | 2017 | 2016 |
| | | |
Net deferred tax liability at 1 January | 5,213 | 4,231 | 5,399 |
Charged (credited) to the Consolidated statement of income | 563 | 1,017 | (1,302) |
Charged (credited) to Other comprehensive income | (22) | 38 | (129) |
Translation differences and other | (386) | (73) | 264 |
| | | |
Net deferred tax liability at 31 December | 5,367 | 5,213 | 4,231 |
Deferred tax assets and liabilities are offset to the extent that the deferred taxes relate to the same fiscal authority, and there is a legally enforceable right to offset current tax assets against current tax liabilities. After netting deferred tax assets and liabilities by fiscal entity, deferred taxes are presented on the balance sheet as follows:
| At 31 December |
(in USD million) | 2018 | 2017 |
| | |
Deferred tax assets | 3,304 | 2,441 |
Deferred tax liabilities | 8,671 | 7,654 |
Deferred tax assets are recognised based on the expectation that sufficient taxable income will be available through reversal of taxable temporary differences or future taxable income supported by business forecast. At year end 2018 and 2017 the deferred tax assets of USD 3,304 million and USD 2,441 million, respectively, were primarily recognised in Norway, Angola, Brazil, the UK and Canada (2018). Of these amounts USD 1,868 million and USD 924 million, respectively, is recognised in entities which have suffered a loss in either the current or preceding period.
Unrecognised deferred tax assets |
| At 31 December |
| 2018 | 2017 |
(in USD million) | Basis | Tax | Basis | Tax |
| | | | |
Deductible temporary differences | 2,439 | 1,123 | 3,415 | 1,409 |
Tax losses carried forward | 14,802 | 3,940 | 17,412 | 4,661 |
| | | | |
Total | 17,241 | 5,062 | 20,827 | 6,070 |
Approximately 9% of the unrecognised carry forward tax losses can be carried forward indefinitely. The majority of the remaining part of the unrecognised tax losses expire after 2029. The unrecognised deductible temporary differences do not expire under the current tax legislation. Deferred tax assets have not been recognised in respect of these items because currently there is insufficient evidence to support that future taxable profits will be available to secure utilisation of the benefits.
Equinor, Annual Report on Form 20-F 2018 193
At year end 2018 unrecognised deferred tax assets in the US and Angola represents USD 3,480 million and USD 884 million of the total unrecognised deferred tax assets of USD 5,062 million. Similar amounts for 2017 were USD 3,559 million in the US and USD 879 million in Angola of a total of USD 6,070 million.
10 Property, plant and equipment
(in USD million) | Machinery, equipment and transportation equipment, including vessels | Production plants and oil and gas assets | Refining and manufacturing plants | Buildings and land | Assets under development | Total |
| | | | | | |
Cost at 31 December 2017 | 3,470 | 157,533 | 8,646 | 866 | 18,140 | 188,656 |
Additions through business combinations | 76 | 2,473 | 0 | 48 | 1,370 | 3,968 |
Additions and transfers | 90 | 13,017 | 328 | 32 | (3,322) | 10,144 |
Disposals at cost | (12) | (505) | (0) | (1) | (366) | (884) |
Effect of changes in foreign exchange | (28) | (5,752) | (314) | (13) | (861) | (6,967) |
| | | | | | |
Cost at 31 December 2018 | 3,596 | 166,766 | 8,660 | 932 | 14,961 | 194,916 |
| | | | | | |
Accumulated depreciation and impairment losses at 31 December 2017 | (2,853) | (113,781) | (6,200) | (439) | (1,746) | (125,019) |
Depreciation | (137) | (9,249) | (426) | (29) | 0 | (9,841) |
Impairment losses | 0 | (762) | 0 | 0 | (32) | (794) |
Reversal of impairment losses | 155 | 1,087 | 0 | 0 | 156 | 1,398 |
Transfers | (0) | (1,799) | (229) | (1) | 1,067 | (961) |
Accumulated depreciation and impairment on disposed assets | 12 | 602 | 0 | 0 | 366 | 980 |
Effect of changes in foreign exchange | 21 | 4,312 | 242 | 4 | 5 | 4,583 |
| | | | | | |
Accumulated depreciation and impairment losses at 31 December 2018 | (2,802) | (119,589) | (6,613) | (465) | (185) | (129,654) |
| | | | | | |
Carrying amount at 31 December 2018 | 794 | 47,177 | 2,048 | 467 | 14,776 | 65,262 |
| | | | | | |
Estimated useful lives (years) | 3-20 | UoP1) | 15 - 20 | 20 - 332) | | |
194 Equinor, Annual Report on Form 20-F 2018
(in USD million) | Machinery, equipment and transportation equipment, including vessels | Production plants and oil and gas assets | Refining and manufacturing plants | Buildings and land | Assets under development | Total |
| | | | | | |
Cost at 31 December 2016 | 3,394 | 142,750 | 8,262 | 859 | 17,315 | 172,579 |
Additions and transfers | 56 | 10,181 | 331 | 47 | 111 | 10,727 |
Disposals at cost | (7) | 0 | (288) | (50) | (30) | (374) |
Effect of changes in foreign exchange | 27 | 4,602 | 342 | 10 | 743 | 5,724 |
| | | | | | |
Cost at 31 December 2017 | 3,470 | 157,533 | 8,646 | 866 | 18,140 | 188,656 |
| | | | | | |
Accumulated depreciation and impairment losses at 31 December 2016 | (2,767) | (100,971) | (5,772) | (446) | (3,068) | (113,023) |
Depreciation | (122) | (9,051) | (485) | (29) | 0 | (9,688) |
Impairment losses | 0 | (917) | (0) | 0 | 0 | (917) |
Reversal of impairment losses | 48 | 935 | 0 | 0 | 989 | 1,972 |
Transfers | 0 | (422) | (1) | (0) | 370 | (53) |
Accumulated depreciation and impairment on disposed assets | 5 | (24) | 285 | 39 | 18 | 323 |
Effect of changes in foreign exchange | (17) | (3,331) | (227) | (4) | (55) | (3,634) |
| | | | | | |
Accumulated depreciation and impairment losses at 31 December 2017 | (2,853) | (113,781) | (6,200) | (439) | (1,746) | (125,019) |
| | | | | | |
Carrying amount at 31 December 2017 | 617 | 43,753 | 2,446 | 427 | 16,394 | 63,637 |
| | | | | | |
Estimated useful lives (years) | 3-20 | UoP 1) | 15 - 20 | 20 - 33 2) | | |
1) Depreciation according to unit of production method (UoP), see note 2 Significant accounting policies.
2) Land is not depreciated.
The carrying amount of assets transferred to Property, plant and equipment from Intangible assets in 2018 and 2017 amounted to USD 161 million and USD 401 million, respectively.
For additions through business combinations, see note 4 Acquisitions and disposals.
Impairments/reversal of impairments
(in USD million) | Property, plant and equipment | Intangible assets3) | Total |
| | | |
At 31 December 2018 | | | |
Producing and development assets1) | (604) | 237 | (367) |
Acquisition costs related to oil and gas prospects2) | - | 52 | 52 |
| | | |
Total net impairment loss/(reversal) recognised | (604) | 289 | (315) |
| | | |
At 31 December 2017 | | | |
Producing and development assets1) | (1,056) | (326) | (1,381) |
Acquisition costs related to oil and gas prospects2) | - | 245 | 245 |
| | | |
Total net impairment loss/(reversal) recognised | (1,056) | (81) | (1,137) |
1) Producing and development assets and goodwill are subject to impairment assessment under IAS 36. The total net impairment reversal recognised under IAS 36 in 2018 amount to USD 367 million, compared to 2017 when the net impairment reversal amounted to USD 1,381 million, including impairment reversals and impairments of acquisition costs - oil and gas prospects (intangible assets).
2) Acquisition costs related to exploration activities, subject to impairment assessment under the successful efforts method (IFRS 6).
3) See note 11 Intangible assets.
Equinor, Annual Report on Form 20-F 2018 195
For impairment purposes, the asset's carrying amount is compared to its recoverable amount. The recoverable amount is the higher of fair value less cost of disposal (FVLCOD) and estimated value in use (VIU).
The base discount rate for VIU calculations is 6.0% real after tax. The discount rate is derived from Equinor's weighted average cost of capital. A derived pre-tax discount rate would generally be in the range of 7-12%, depending on asset specific characteristics, such as specific tax treatments, cash flow profiles and economic life. For certain assets a pre-tax discount rate could be outside this range, mainly due to special tax elements (for example permanent differences) affecting the pre-tax equivalent. See note 2 Significant accounting policies for further information regarding impairment on property, plant and equipment.
The table below describes per area the assets being impaired (reversed) and the valuation method used to determine the recoverable amount; the net impairment (reversal), and the carrying amount after impairment.
| | 2018 | 2017 | |
(in USD million) | Valuation method | Carrying amount after impairment | Net impairment loss (reversal) | Carrying amount after impairment | Net impairment loss (reversal) | |
| | | | | | |
At 31 December | | | | | | |
Exploration & Production Norway | VIU | 1,966 | (201) | 2,169 | (826) | |
| FVLCOD | 1,232 | (402) | 1,507 | (80) | |
North America - unconventional | VIU | 5,771 | 762 | 5,017 | (1,266) | |
| FVLCOD | 0 | 0 | 1,422 | 856 | |
North America Conventional offshore US Gulf of Mexico | VIU | 3,989 | (246) | 1,200 | (17) | |
| FVLCOD | 0 | 0 | 0 | 0 | |
North Africa | VIU | 451 | (126) | 0 | 0 | |
| FVLCOD | 0 | 0 | 0 | 0 | |
Marketing, Midstream & Processing | VIU | 403 | (155) | 263 | (48) | |
| FVLCOD | 0 | 0 | 0 | 0 | |
| | | | | | |
| | | | | | |
Total | | 13,813 | (367) | 11,578 | (1,381) | |
| | | | | | |
| | | | | | |
Exploration & Production Norway
In Exploration & Production Norway impairment reversals of USD 604 million were recognised in 2018 mainly due to change in long term exchange rate assumptions.
In 2017 net impairment reversal of USD 906 million was recognised, mainly triggered by increased reserves, cost reductions and increased short term price assumptions.
North America - unconventional
In the North America – unconventional area impairment losses of USD 762 million of which USD 237 million was classified as exploration expenses were recognised in 2018 mainly caused by reduced long term price assumptions and reduced fair value of one asset.
In 2017 a net impairment reversal of USD 410 million was recognised.
North America Conventional offshore Gulf of Mexico
In 2018 net impairment reversal of USD 246 million was recognised due to improved production profile and various operational improvements partially offset by negative changes in reserve estimates.
In 2017 the North America Conventional offshore Gulf of Mexico area recognised net impairment reversal of USD 17 million.
Marketing, Midstream & Processing
In 2018 an impairment reversal of USD 155 million was recognised due to increased refinery margin forecast.
Marketing, Midstream & Processing recognised an impairment reversal of USD 48 million in 2017.
North Africa
In 2018 an impairment reversal of USD 126 million was recognised due to an extension of licence period.
No impairments or reversals were recognised in the North Africa area in 2017.
196 Equinor, Annual Report on Form 20-F 2018
Value in Use (VIU) estimates and discounted cash flows used to determine the recoverable amount of assets tested for impairment are based on internal forecasts on costs, production profiles and commodity prices. Short term commodity prices (2019/2020/2021) are forecasted by using observable forward prices for 2019 and a linear projection towards the 2022 internal forecast.
The price assumptions used for impairment calculations were generally as follows (prices used in 2017 impairment calculations for the respective years are indicated in brackets):
Year Prices in real terms1) | 2019 | | 2020 | | 2025 | | 2030 |
| | | | | | | | | | | |
Brent Blend – USD/bbl | 62 | (66) | | 66 | (70) | | 77 | (80) | | 80 | (84) |
NBP - USD/mmBtu | 7.7 | (6.7) | | 7.4 | (6.8) | | 8.0 | (8.4) | | 8.0 | (8.4) |
Henry Hub – USD/mmBtu | 3.1 | (3.4) | | 3.2 | (3.7) | | 4.0 | (4.2) | | 4.0 | (4.2) |
1) Basis year 2018 | | | | | | | | | | | |
Sensitivities
Commodity prices have historically been volatile. Significant downward adjustments of Equinor’s commodity price assumptions would result in impairment losses on certain producing and development assets in Equinor’s portfolio. If a decline in commodity price forecasts over the lifetime of the assets were 20%, considered to represent a reasonably possible change, the impairment amount to be recognised could illustratively be in the region of USD 8 billion before tax effects. This illustrative impairment sensitivity assumes no changes to input factors other than prices; however, a price reduction of 20% is likely to result in changes in business plans as well as other factors used when estimating an asset’s recoverable amount. Changes in such input factors would likely significantly reduce the actual impairment amount compared to the illustrative sensitivity above. Changes that could be expected would include a reduction in the cost level in the oil and gas industry as well as offsetting currency effects, both of which have historically occurred following significant changes in commodity prices. The illustrative sensitivity is therefore not considered to represent a best estimate of an expected impairment impact, nor an estimated impact on revenues or operating income in such a scenario. A significant and prolonged reduction in oil and gas prices would also result in mitigating actions by Equinor and its licence partners, as a reduction of oil and gas prices would impact drilling plans and production profiles for new and existing assets. Quantifying such impacts is considered impracticable, as it requires detailed technical, geological and economical evaluations based on hypothetical scenarios and not based on existing business or development plans.
Equinor, Annual Report on Form 20-F 2018 197
11 Intangible assets
(in USD million) | Exploration expenses | Acquisition costs - oil and gas prospects | Goodwill | Other | Total |
| | | | | |
Cost at 31 December 2017 | 2,715 | 5,363 | 339 | 419 | 8,836 |
Additions through business combinations | 0 | 116 | 265 | 392 | 773 |
Additions | 392 | 917 | 0 | (7) | 1,302 |
Disposals at cost | (272) | (89) | 0 | (4) | (364) |
Transfers | (13) | (148) | 0 | 0 | (161) |
Expensed exploration expenditures previously capitalised | (68) | (289) | 0 | 0 | (357) |
Effect of changes in foreign exchange | (70) | (17) | (39) | (2) | (128) |
| | | | | |
Cost at 31 December 2018 | 2,685 | 5,854 | 565 | 797 | 9,901 |
| | | | | |
Accumulated depreciation and impairment losses at 31 December 2017 | | | | (215) | (215) |
Amortisation and impairments for the year | | | | (13) | (13) |
Amortisation and impairment losses disposed intangible assets | | | | (2) | (2) |
Effect of changes in foreign exchange | | | | 1 | 1 |
| | | | | |
Accumulated depreciation and impairment losses at 31 December 2018 | | | | (229) | (229) |
| | | | | |
Carrying amount at 31 December 2018 | 2,685 | 5,854 | 565 | 568 | 9,672 |
(in USD million) | Exploration expenses | Acquisition costs - oil and gas prospects | Goodwill | Other | Total |
| | | | | |
Cost at 31 December 2016 | 2,856 | 5,907 | 328 | 346 | 9,438 |
Additions | 154 | 861 | 0 | 94 | 1,109 |
Disposals at cost | (0) | (0) | 0 | (26) | (26) |
Transfers | (276) | (124) | 0 | (0) | (401) |
Assets reclassified to held for sale | 0 | (1,369) | 0 | 0 | (1,369) |
Expensed exploration expenditures previously capitalised | (73) | 81 | 0 | 0 | 8 |
Effect of changes in foreign exchange | 56 | 6 | 11 | 4 | 77 |
| | | | | |
Cost at 31 December 2017 | 2,715 | 5,363 | 339 | 419 | 8,836 |
| | | | | |
Accumulated depreciation and impairment losses at 31 December 2016 | | | | (195) | (195) |
Amortisation and impairments for the year | | | | (12) | (12) |
Amortisation and impairment losses disposed intangible assets | | | | (6) | (6) |
Effect of changes in foreign exchange | | | | (2) | (2) |
| | | | | |
Accumulated depreciation and impairment losses at 31 December 2017 | | | | (215) | (215) |
| | | | | |
Carrying amount at 31 December 2017 | 2,715 | 5,363 | 339 | 204 | 8,621 |
The useful lives of intangible assets are assessed to be either finite or indefinite. Intangible assets with finite useful lives are amortised systematically over their estimated economic lives, ranging between 10-20 years.
For additions through business combinations, see note 4 Acquisitions and disposals.
During 2018, intangible assets were impacted by net impairment of signature bonuses and acquisition costs totalling USD 237 million related to North America – unconventional assets, and impairment of acquisition costs related to exploration activities of USD 52 million primarily as a result from dry wells and uncommercial discoveries in South America, North America Conventional offshore US Gulf of Mexico and E&P Norway.
198 Equinor, Annual Report on Form 20-F 2018
Equinor’s Block 2 Exploration Licence in Tanzania was formally due to expire in June 2018, but based on communication with the applicable Tanzanian authorities, continues to be in operation while the process related to the grant of a new exploration licence to the existing licensees for the block is ongoing. The Block 2 asset remains capitalised within Intangible assets in the E&P International segment as of 31 December 2018
Impairment losses and reversals of impairment losses are presented as Exploration expenses and Depreciation, amortisation and net impairment losses on the basis of their nature as exploration assets (intangible assets) and other intangible assets, respectively. The impairment losses and reversal of impairment losses are based on recoverable amount estimates triggered by changes in reserve estimates, cost estimates and market conditions. See note 10 Property, plant and equipment for more information on the basis for impairment assessments.
The table below shows the aging of capitalised exploration expenditures. |
(in USD million) | 2018 | 2017 |
| | |
Less than one year | 392 | 218 |
Between one and five years | 1,406 | 1,799 |
More than five years | 887 | 698 |
| | |
Total | 2,685 | 2,715 |
The table below shows the components of the exploration expenses. |
| Full year |
(in USD million) | 2018 | 2017 | 2016 |
| | | |
Exploration expenditures | 1,438 | 1,234 | 1,437 |
Expensed exploration expenditures previously capitalised | 357 | (8) | 1,800 |
Capitalised exploration | (390) | (167) | (285) |
| | | |
Exploration expenses | 1,405 | 1,059 | 2,952 |
12 Equity accounted investments
(in USD million) | Lundin Petroleum AB | Other equity accounted investments | Total |
| | | |
Investment at 31 December 2017 | 1,125 | 1,426 | 2,551 |
Net income/(loss) from equity accounted investments | 10 | 281 | 291 |
Acquisitions and increase in paid in capital | 0 | 548 | 548 |
Dividend and other distributions | (31) | (244) | (275) |
Other comprehensive income/(loss) | (5) | (66) | (70) |
Divestments, derecognition and decrease in paid in capital | 0 | (183) | (183) |
| | | |
Investment at 31 December 2018 | 1,100 | 1,763 | 2,862 |
For the equity accounted investments, voting rights corresponds to ownership.
Equinor, Annual Report on Form 20-F 2018 199
Summary financial information of equity accounted investments
The following table provides summarised financial information relating to Lundin Petroleum AB. This information is presented on Equinor’s ownership basis (20.1%) and also reflects adjustments made by Equinor to Lundin Petroleum AB’s own results in applying the equity method of accounting. Equinor adjusts Lundin Petroleum AB’s results for depreciation of excess values determined in the purchase price allocation at the date of acquisition. Where there are significant differences in accounting policies, adjustments are made to bring the accounting policies applied in line with Equinor’s. These adjustments have decreased the reported net income for 2018, as shown in the table below, compared with the equivalent amount reported by Lundin Petroleum AB.
| | | | | Lundin Petroleum AB |
(in USD million) | | | | | | 2018 | 2017 |
| | | | | | | |
At 31 December | | | | | | | |
Current assets | | | | | | 79 | 101 |
Non-Current assets | | | | | | 3,010 | 2,920 |
Current liabilities | | | | | | (58) | (62) |
Non-Current liabilities | | | | | | (1,931) | (1,834) |
Net assets | | | | | | 1,100 | 1,125 |
Year ended 31 December | | | | | | | |
Gross revenues | | | | | | 495 | 376 |
Income/(loss) before tax | | | | | | 225 | 226 |
Net income/(loss) | | | | | | 10 | 126 |
| | | | | | | |
Capital expenditures | | | | | | 231 | 250 |
| | | | | | | |
Equinor’s share of Lundin Petroleum AB’s quoted market value as per 31 December 2018 was USD 1,691 million (USD 1,565 million as per 31 December 2017).
200 Equinor, Annual Report on Form 20-F 2018
13 Financial investments and non-current prepayments
Non-current financial investments |
| At 31 December |
(in USD million) | 2018 | 2017 |
| | |
Bonds | 1,261 | 1,611 |
Listed equity securities | 530 | 619 |
Non-listed equity securities | 664 | 611 |
| | |
Financial investments | 2,455 | 2,841 |
Bonds and equity securities mainly relate to investment portfolios held by Equinor's captive insurance company and other listed and non-listed equities held for long-term strategic purposes mainly accounted for using fair value through profit or loss.
| | |
Non-current prepayments and financial receivables |
| At 31 December |
(in USD million) | 2018 | 2017 |
| | |
Financial receivables interest bearing | 345 | 716 |
Prepayments and other non-interest bearing receivables | 688 | 196 |
| | |
Prepayments and financial receivables | 1,033 | 912 |
Financial receivables interest bearing primarily relate to loans to employees and project financing of equity accounted companies.
Current financial investments |
| At 31 December |
(in USD million) | 2018 | 2017 |
| | |
Time deposits | 4,129 | 4,111 |
Interest bearing securities | 2,912 | 4,337 |
| | |
Financial investments | 7,041 | 8,448 |
At 31 December 2018, current financial investments include USD 896 million investment portfolios held by Equinor's captive insurance company which mainly are accounted for using fair value through profit or loss. The corresponding balance at 31 December 2017 was USD 714 million.
For information about financial instruments by category, see note 26 Financial instruments: fair value measurement and sensitivity analysis of market risk.
14 Inventories
| At 31 December |
(in USD million) | 2018 | 2017 |
| | |
Crude oil | 1,173 | 2,323 |
Petroleum products | 345 | 596 |
Natural gas | 274 | 149 |
Other | 351 | 330 |
| | |
Inventories | 2,144 | 3,398 |
Other inventory consists mainly of drilling and well equipment.
The write-down of inventories from cost to net realisable value amounted to an expense of USD 164 million and USD 32 million in 2018 and 2017, respectively.
Equinor, Annual Report on Form 20-F 2018 201
15 Trade and other receivables
| At 31 December |
(in USD million) | 2018 | 2017 |
| | |
Trade receivables from contracts with customers | 6,267 | 7,649 |
Other current receivables | 1,800 | 427 |
Joint venture receivables | 390 | 478 |
Receivables from equity accounted associated companies and other related parties | 31 | 6 |
| | |
Total financial trade and other receivables | 8,488 | 8,560 |
Non-financial trade and other receivables | 510 | 865 |
| | |
Trade and other receivables | 8,998 | 9,425 |
Trade receivables from contracts with customers are shown net of an immaterial provision for expected losses.
For more information about the credit quality of Equinor's counterparties, see note 5 Financial risk management. For currency sensitivities, see note 26 Financial instruments: fair value measurement and sensitivity analysis of market risk.
16 Cash and cash equivalents
| At 31 December |
(in USD million) | 2018 | 2017 |
| | |
Cash at bank available | 1,140 | 591 |
Time deposits | 2,068 | 1,889 |
Money market funds | 2,255 | 381 |
Interest bearing securities | 1,590 | 1,092 |
Restricted cash, including margin deposits | 501 | 437 |
| | |
Cash and cash equivalents | 7,556 | 4,390 |
Restricted cash at 31 December 2018 and 2017 includes collateral deposits related to trading activities of USD 365 million and USD 300 million, respectively. Collateral deposits are related to certain requirements set out by exchanges where Equinor is participating. The terms and conditions related to these requirements are determined by the respective exchanges.
202 Equinor, Annual Report on Form 20-F 2018
17 Shareholders' equity and dividends
At 31 December 2018, Equinor’s share capital of NOK 8,346,653,047.50 (USD 1,184,547,766) comprised 3,338,661,219 shares at a nominal value of NOK 2.50. Share capital at 31 December 2017 was NOK 8,307,919,632.50 (USD 1,179,542,543) comprised 3,323,167,853 shares at a nominal value of NOK 2.50.
Equinor ASA has only one class of shares and all shares have voting rights. The holders of shares are entitled to receive dividends as and when declared and are entitled to one vote per share at general meetings of the company.
A temporary 2-year scrip programme, approved by Equinor’s general assembly in May 2016 ended as planned with the last scrip shares issued in the first quarter of 2018 based on the dividend related to third quarter 2017.
During 2018 dividend for the third and for the fourth quarter of 2017 and dividend for the first and second quarter of 2018 were settled. Dividend declared but not yet settled, is presented as dividends payable in the Consolidated balance sheet. The Consolidated statement of changes in equity shows declared dividend in the period (retained earnings), offset by scrip dividend settled during the period (share capital and additional paid-in-capital). Dividend declared in 2018 relate to the fourth quarter of 2017 and to the first three quarters of 2018.
On 5 February 2019 the board of directors proposed to declare a dividend for the fourth quarter of 2018 of USD 0.26 per share (subject to approval by the AGM). The Equinor share will trade ex-dividend 16 May 2019 on OSE and 17 May 2019 for ADR holders on NYSE. Record date will be 20 May 2019 on OSE and NYSE. Payment date will be around 29 May 2019.
| At 31 December |
(in USD million) | 2018 | 2017 |
| | |
Dividends declared | 3,064 | 2,891 |
USD per share or ADS | 0.9200 | 0.8804 |
| | |
Dividends paid in cash | 2,672 | 1,491 |
USD per share or ADS | 0.9101 | 0.8804 |
NOK per share | 7.4907 | 7.2615 |
| | |
Scrip dividends | 338 | 1,357 |
Number of shares issued (millions) | 15.5 | 78.1 |
| | |
Sum dividends settled | 3,010 | 2,848 |
During 2018 a total of 2,740,657 treasury shares were purchased for USD 68 million and 3,631,220 treasury shares were allocated to employees participating in the share saving plan. During 2017 a total of 3,323,671 treasury shares were purchased for USD 63 million and 3,219,327 treasury shares were allocated to employees participating in the share saving plan. At 31 December 2018 Equinor had 10,352,671 treasury shares and at 31 December 2017 11,243,234 treasury shares, all of which are related to Equinor's share saving plan. For further information, see note 6 Remuneration.
18 Finance debt
Capital management
The main objectives of Equinor's capital management policy are to maintain a strong financial position and to ensure sufficient financial flexibility. One of the key ratios in the assessment of Equinor's financial robustness is the non-GAAP metric net interest-bearing debt adjusted (ND) to capital employed adjusted (CE).
| At 31 December |
(in USD million) | 2018 | 2017 |
| | |
Net interest-bearing debt adjusted (ND) | 12,246 | 16,287 |
Capital employed adjusted (CE) | 55,235 | 56,172 |
| | |
Net debt to capital employed adjusted (ND/CE) | 22.2% | 29.0% |
Equinor, Annual Report on Form 20-F 2018 203
ND is defined as Equinor's interest bearing financial liabilities less cash and cash equivalents and current financial investments, adjusted for collateral deposits and balances held by Equinor's captive insurance company (amounting to USD 1,261 million and USD 1,014 million for 2018 and 2017, respectively) and balances related to the SDFI (amounting to USD 146 million and USD 164 million for 2018 and 2017, respectively). CE is defined as Equinor's total equity (including non-controlling interests) and ND.
Non-current finance debt |
Finance debt measured at amortised cost |
| Weighted average interest rates in %1) | Carrying amount in USD millions at 31 December | Fair value in USD millions at 31 December2) |
| 2018 | 2017 | 2018 | 2017 | 2018 | 2017 |
| | | | | | |
Unsecured bonds | | | | | | |
United States Dollar (USD) | 4.14 | 3.73 | 13,088 | 14,953 | 13,657 | 16,106 |
Euro (EUR) | 2.10 | 2.10 | 8,928 | 9,347 | 9,444 | 10,057 |
Great Britain Pound (GBP) | 6.08 | 6.08 | 1,760 | 1,859 | 2,532 | 2,734 |
Norwegian Kroner (NOK) | 4.18 | 4.18 | 345 | 366 | 388 | 427 |
| | | | | | |
Total | | | 24,121 | 26,524 | 26,021 | 29,325 |
| | | | | | |
Unsecured loans | | | | | | |
Japanese Yen (JPY) | 4.30 | 4.30 | 91 | 89 | 119 | 118 |
| | | | | | |
Finance lease liabilities | | | 432 | 478 | 425 | 496 |
| | | | | | |
Total | | | 523 | 567 | 544 | 614 |
| | | | | | |
Total finance debt | | | 24,644 | 27,090 | 26,565 | 29,938 |
Less current portion | | | 1,380 | 2,908 | 1,379 | 2,924 |
| | | | | | |
Non-current finance debt | | | 23,264 | 24,183 | 25,186 | 27,014 |
1) Weighted average interest rates are calculated based on the contractual rates on the loans per currency at 31 December and do not include the effect of swap agreements.
2) Fair values are mainly determined from external calculation models based on market observations from various sources, classified at level 2 in the fair value hierarchy. If available, the fair value of the non-current financial liabilities is determined from quoted market prices in an active market, classified at level 1 in the fair value hierarchy.
Unsecured bonds amounting to USD 13,088 million are denominated in USD and unsecured bonds denominated in other currencies amounting to USD 10,062 million are swapped into USD. One bond denominated in EUR amounting to USD 972 million is not swapped. The table does not include the effects of agreements entered into to swap the various currencies into USD. For further information see note 26 Financial instruments: fair value measurement and sensitivity analysis of market risk.
Substantially all unsecured bond and unsecured bank loan agreements contain provisions restricting future pledging of assets to secure borrowings without granting a similar secured status to the existing bondholders and lenders.
In 2018 Equinor issued the following bond: |
Issuance date | Amount in USD million | Interest rate in % | Maturity date |
| | | |
5 September 2018 | USD 1,000 | 3.625 | September 2028 |
| | | |
Out of Equinor's total outstanding unsecured bond portfolio, 38 bond agreements contain provisions allowing Equinor to call the debt prior to its final redemption at par or at certain specified premiums if there are changes to the Norwegian tax laws. The carrying amount of these agreements is USD 23,776 million at the 31 December 2018 closing exchange rate.
For more information about the revolving credit facility, maturity profile for undiscounted cash flows and interest rate risk management, see note 5 Financial risk management.
204 Equinor, Annual Report on Form 20-F 2018
Non-current finance debt maturity profile |
| At 31 December |
(in USD million) | 2018 | 2017 |
| | |
Year 2 and 3 | 4,003 | 3,521 |
Year 4 and 5 | 3,736 | 3,041 |
After 5 years | 15,525 | 17,620 |
| | |
Total repayment of non-current finance debt | 23,264 | 24,183 |
| | |
Weighted average maturity (years) | 9 | 9 |
Weighted average annual interest rate (%) | 3.67 | 3.50 |
More information regarding finance lease liabilities is provided in note 22 Leases.
Current finance debt |
| At 31 December |
(in USD million) | 2018 | 2017 |
| | |
Collateral liabilities | 213 | 704 |
Non-current finance debt due within one year | 1,380 | 2,908 |
Other including US Commercial paper programme and bank overdraft | 870 | 479 |
| | |
Total current finance debt | 2,463 | 4,091 |
| | |
Weighted average interest rate (%) | 1.62 | 1.65 |
Collateral liabilities and other current liabilities relate mainly to cash received as security for a portion of Equinor's credit exposure and outstanding amounts on US Commercial paper (CP) programme. Issuance on the CP programme amounted to USD 842 million as of 31 December 2018 and USD 449 million as of 31 December 2017.
Reconciliation of cash flow from financing activities to finance line items in balance sheet |
| | | | | | | |
(in USD million) | Non current finance debt | Current finance debt | Financial receivable Collaterals 1) | Additional paid in capital Share based payment/Treasury shares | Non controlling interest | Dividend payable | Total |
| | | | | | | |
At 31 December 2017 | 24,183 | 4,091 | (272) | (191) | 24 | 729 | 28,564 |
Transfer to current portion | (1,380) | 1,380 | - | - | - | - | - |
Effect of exchange rate changes | (556) | 2 | - | - | - | (1) | (555) |
Dividend decleared | - | - | - | - | - | 3,064 | 3,064 |
Scrip dividend | - | - | - | - | - | (338) | (338) |
Cash flows provided by (used in) financing activities | 998 | (2,949) | (331) | (64) | (7) | (2,672) | (5,025) |
Other changes | 20 | (61) | 11 | 59 | 2 | (16) | 15 |
| | | | | | | |
At 31 December 2018 | 23,264 | 2,463 | (591) | (196) | 19 | 766 | 25,725 |
| | | | | | | |
| | | | | | | |
| | | | | | | |
| | | | | | | |
| | | | | | | |
| | | | | | | |
| | | | | | | |
| | | | | | | |
| | | | | | | |
| | | | | | | |
(in USD million) | Non current finance debt | Current finance debt | Financial receivable Collaterals 1) | Additional paid in capital Share based payment/Treasury shares | Non controlling interest | Dividend payable | Total |
| | | | | | | |
At 31 December 2016 | 27,999 | 3,674 | (735) | (212) | 27 | 712 | 31,465 |
Transfer to current portion | (2,908) | 2,908 | - | - | - | - | - |
Effect of exchange rate changes | 1,302 | (13) | - | - | - | (11) | 1,278 |
Dividend decleared | - | - | - | - | - | 2,891 | 2,891 |
Scrip dividend | - | - | - | - | - | (1,357) | (1,357) |
Cash flows provided by (used in) financing activities | (2,250) | (2,472) | 464 | (62) | (12) | (1,491) | (5,823) |
Other changes | 40 | (5) | (1) | 83 | 9 | (15) | 110 |
| | | | | | | |
At 31 December 2017 | 24,183 | 4,091 | (272) | (191) | 24 | 729 | 28,564 |
| | | | | | | |
1) Financial receivables collaterals are in included in trade and other receivables in the balance sheet. See note 15 Trade and other receivables for more information. |
Equinor, Annual Report on Form 20-F 2018 205
19 Pensions
The main pension plans for Equinor ASA and its most significant subsidiaries are defined contribution plans, in which the pension costs are recognised in the Consolidated statement of income in line with payments of annual pension premiums. The pension contribution plans in Equinor ASA also includes certain unfunded elements (notional contribution plans), for which the annual notional contributions are recognised as pension liabilities. These notional pension liabilities are regulated equal to the return on asset within the main contribution plan. See note 2 Significant accounting policies for more information about the accounting treatment of the notional contribution plans reported in Equinor ASA.
In addition, Equinor ASA has a closed defined benefit plan for employees with less than 12 years of future service before their regular retirement age, and for employees in certain subsidiaries. Equinor's defined benefit plans are generally based on a minimum of 30 years of service and 66% of the final salary level, including an assumed benefit from the Norwegian National Insurance Scheme. The Norwegian companies in the group are subject to, and complies with, the requirements of the Norwegian Mandatory Company Pensions Act.
The defined benefit plans in Norway are managed and financed through Equinor Pensjon (Equinor's pension fund - hereafter "Equinor Pension"). Equinor Pension is an independent pension fund that covers the employees in Equinor's Norwegian companies. The pension fund's assets are kept separate from the company's and group companies' assets. Equinor Pension is supervised by the Financial Supervisory Authority of Norway ("Finanstilsynet") and is licenced to operate as a pension fund.
Equinor is a member of a Norwegian national agreement-based early retirement plan (“AFP”), and the premium is calculated based on the employees' income, but limited to 7.1 times the basic amount in the National Insurance scheme (7.1 G). The premium is payable for all employees until age 62. Pension from the AFP scheme will be paid from the AFP plan administrator to employees for their full lifetime. Equinor has determined that its obligations under this multi-employer defined benefit plan can be estimated with sufficient reliability for recognition purposes. Accordingly, the estimated proportionate share of the AFP plan is recognised as a defined benefit obligation.
The present values of the defined benefit obligation, except for the notional contribution plan, and the related current service cost and past service cost are measured using the projected unit credit method. The assumptions for salary increases, increases in pension payments and social security base amount are based on agreed regulation in the plans, historical observations, future expectations of the assumptions and the relationship between these assumptions. At 31 December 2018 the discount rate for the defined benefit plans in Norway was established on the basis of seven years' mortgage covered bonds interest rate extrapolated on a yield curve which matches the duration of Equinor's payment portfolio for earned benefits, which was calculated to be 15.9 years at the end of 2018. Social security tax is calculated based on a pension plan's net funded status and is included in the defined benefit obligation.
Equinor has more than one defined benefit plan, but the disclosure is made in total since the plans are not subject to materially different risks. Pension plans outside Norway are not material and as such not disclosed separately. The pension costs in Equinor ASA are partly re-charged to licence partners.
206 Equinor, Annual Report on Form 20-F 2018
Net pension cost |
| |
(in USD million) | 2018 | 2017 | 2016 |
| | | |
Current service cost | 214 | 242 | 238 |
Interest cost | - | - | 192 |
Interest (income) on plan asset | - | - | (148) |
Past service cost | 0 | (0) | 2 |
Losses (gains) from curtailment, settlement or plan amendment | 20 | 15 | 109 |
Actuarial (gains) losses related to termination benefits | 0 | (1) | 59 |
Notional contribution plans | 55 | 51 | 50 |
| | | |
Defined benefit plans | 289 | 308 | 503 |
| | | |
| | | |
Defined contribution plans | 173 | 162 | 148 |
| | | |
Total net pension cost | 462 | 469 | 650 |
In addition to the pension cost presented in the table above, financial items related to defined benefit plans are included in the statement of income within Net financial items. Interest cost and changes in fair value of notional assets of USD 167 million, and interest income of USD 127 million has been recognised in 2018.
Equinor, Annual Report on Form 20-F 2018 207
(in USD million) | 2018 | 2017 |
| | |
Defined benefit obligations (DBO) | | |
Defined benefit obligations at 1 January | 8,286 | 7,791 |
Current service cost | 214 | 243 |
Interest cost | 182 | 219 |
Actuarial (gains) losses - Financial assumptions | 174 | (26) |
Actuarial (gains) losses - Experience | (27) | (21) |
Benefits paid | (219) | (311) |
Losses (gains) from curtailment, settlement or plan amendment | (1) | 13 |
Paid-up policies | (18) | (84) |
Foreign currency translation | (469) | 411 |
Changes in notional contribution liability | 55 | 52 |
| | |
Defined benefit obligations at 31 December | 8,176 | 8,286 |
| | |
Fair value of plan assets | | |
Fair value of plan assets at 1 January | 5,687 | 5,250 |
Interest income | 136 | 148 |
Return on plan assets (excluding interest income) | (135) | 283 |
Company contributions | 49 | 39 |
Benefits paid | (217) | (196) |
Paid-up policies and personal insurance | (18) | (121) |
Foreign currency translation | (315) | 283 |
| | |
Fair value of plan assets at 31 December | 5,187 | 5,687 |
| | |
Net pension liability at 31 December | (2,990) | (2,599) |
| | |
Represented by: | | |
Asset recognised as non-current pension assets (funded plan) | 831 | 1,306 |
Liability recognised as non-current pension liabilities (unfunded plans) | (3,821) | (3,905) |
| | |
DBO specified by funded and unfunded pension plans | 8,176 | 8,286 |
| | |
Funded | 4,359 | 4,392 |
Unfunded | 3,817 | 3,894 |
| | |
Actual return on assets | 1 | 431 |
The actuarial loss in 2018 is mainly due to a higher expected rate of pension increase and higher expected compensation increase. Equinor recognised an actuarial gain from changes in financial assumptions in 2017.
Actuarial losses and gains recognised directly in Other comprehensive income (OCI) | | | |
| |
(in USD million) | 2018 | 2017 | 2016 |
| | | |
Net actuarial (losses) gains recognised in OCI during the year | (282) | 331 | (482) |
Actuarial (losses) gains related to currency effects on net obligation and foreign exchange translation | 172 | (158) | (21) |
Tax effects of actuarial (losses) gains recognised in OCI | 22 | (38) | 129 |
| | | |
Recognised directly in OCI during the year net of tax | (88) | 135 | (374) |
| | | |
Cumulative actuarial (losses) gains recognised directly in OCI net of tax | (1,141) | (1,053) | (1,188) |
208 Equinor, Annual Report on Form 20-F 2018
Actuarial assumptions |
| Assumptions used to determine benefit costs in % | Assumptions used to determine benefit obligations in % |
| | |
| 2018 | 2017 | 2018 | 2017 |
| | | | |
Discount rate | 2.50 | 2.50 | 2.75 | 2.50 |
Rate of compensation increase | 2.25 | 2.25 | 2.75 | 2.25 |
Expected rate of pension increase | 1.75 | 1.75 | 2.00 | 1.75 |
Expected increase of social security base amount (G-amount) | 2.25 | 2.25 | 2.75 | 2.25 |
| | | | |
Weighted-average duration of the defined benefit obligation | | | 15.9 | 17.2 |
The assumptions presented are for the Norwegian companies in Equinor which are members of Equinor's pension fund. The defined benefit plans of other subsidiaries are immaterial to the consolidated pension assets and liabilities.
Expected attrition at 31 December 2018 was 0.2% and 0% for employees between 50-59 years and 60-67 years, and 0.2% and 2.2% in 2017. In 2018 a separate attrition rate of 3.2% was calculated for employees between 60-67 with immediate withdrawal of vested pension, thus remaining in the scheme. For population in Norway, the mortality table K2013, issued by The Financial Supervisory Authority of Norway, is used as the best mortality estimate.
Disability tables for plans in Norway developed by the actuary were implemented in 2013 and represent the best estimate to use for plans in Norway.
Sensitivity analysis
The table below presents an estimate of the potential effects of changes in the key assumptions for the defined benefit plans. The following estimates are based on facts and circumstances as of 31 December 2018.
| Discount rate | Expected rate of compensation increase | Expected rate of pension increase | Mortality assumption |
(in USD million) | 0.50% | -0.50% | 0.50% | -0.50% | 0.50% | -0.50% | + 1 year | - 1 year |
| | | | | | | | |
Changes in: | | | | | | | | |
Defined benefit obligation at 31 December 2018 | (611) | 695 | 169 | (167) | 520 | (473) | 296 | (324) |
Service cost 2019 | (21) | 25 | 7 | (7) | 16 | (14) | 8 | (9) |
The sensitivity of the financial results to each of the key assumptions has been estimated based on the assumption that all other factors would remain unchanged. The estimated effects on the financial result would differ from those that would actually appear in the Consolidated financial statements because the Consolidated financial statements would also reflect the relationship between these assumptions.
Equinor, Annual Report on Form 20-F 2018 209
Pension assets
The plan assets related to the defined benefit plans were measured at fair value. Equinor Pension invests in both financial assets and real estate.
Real estate properties owned by Equinor Pension amounted to USD 417 million and USD 447 million of total pension assets at 31 December 2018 and 2017, respectively, and are rented to Equinor companies.
The table below presents the portfolio weighting as approved by the board of Equinor Pension for 2018. The portfolio weight during a year will depend on the risk capacity.
Pension assets on investments classes | Target portfolio weight |
(in %) | 2018 | 2017 |
| | | |
Equity securities | 36.5 | 37.5 | 31 - 43 |
Bonds | 44.9 | 41.7 | 36 - 48 |
Money market instruments | 12.3 | 14.3 | 0 - 29 |
Real estate | 6.3 | 6.1 | 5 - 10 |
Other assets | 0.0 | 0.4 | |
| | | |
Total | 100.0 | 100.0 | |
In 2018 92% of the equity securities, 31% of bonds and 55% of money market instruments had quoted market prices in an active market (level 1). 8% of the equity securities, 69% of bonds and 45% of money market instruments had market prices based on inputs other than quoted prices. If quoted market prices are not available, fair values are determined from external calculation models based on market observations from various sources, classified at level 2 in the fair value hierarchy.
In 2017 92% of the equity securities, 32% of bonds and 67% of money market instruments had quoted market prices in an active market. 8% of the equity securities, 68% of bonds and 32% of money market instruments had market prices based on inputs other than quoted prices (level 2).
For definition of the various levels, see note 26 Financial instruments: fair value measurement and sensitivity analysis of market risk.
Company contributions to be made to Equinor Pension in 2019 are expected to be less than USD 100 million.
20 Provisions
(in USD million) | Asset retirement obligations | Claims and litigations | Other provisions | Total |
| | | | |
Non-current portion at 31 December 2017 | 12,383 | 1,271 | 1,904 | 15,557 |
Current portion at 31 December 2017 reported as trade and other payables | 69 | 68 | 547 | 684 |
| | | | |
Provisions at 31 December 2017 | 12,451 | 1,339 | 2,451 | 16,241 |
| | | | |
New or increased provisions | 1,609 | 6 | 858 | 2,473 |
Decrease in the estimates | (382) | (386) | (121) | (889) |
Amounts charged against provisions | (157) | (4) | (588) | (749) |
Effects of change in the discount rate | (838) | - | 24 | (814) |
Accretion expenses | 461 | - | - | 461 |
Reclassification and transfer | - | 6 | 15 | 21 |
Currency translation | (536) | (0) | (32) | (568) |
| | | | |
Provisions at 31 December 2018 | 12,609 | 961 | 2,606 | 16,175 |
| | | | |
Current portion at 31 December 2018 reported as trade and other payables | 65 | 56 | 103 | 224 |
Non-current portion at 31 December 2018 | 12,544 | 905 | 2,503 | 15,952 |
The line item New or increased provisions includes additional provisions made in the period, including increase in estimates, and liabilities assumed in business combinations.
210 Equinor, Annual Report on Form 20-F 2018
The claims and litigations category mainly relates to expected payments on unresolved claims. The timing and amounts of potential settlements in respect of these are uncertain and dependent on various factors that are outside management's control. The main change in the caption claims and litigations concerns a development in the Agbami redetermination process in Nigeria. For further information on the development and the other contingent liabilities, see note 24 Other commitments, contingent liabilities and contingent assets.
The other provisions category relates to liabilities for contingent consideration in the acquisitions, expected payments on onerous contracts, cancellation fees and other. In 2018, Equinor recognised liability for contingent consideration and asset retirement obligations related to the acquisition of the interest in the Roncador field in Brazil. In the first quarter of 2018, Equinor paid the current portion of a contingent consideration related to the acquisition of operated interest in BM-S-8 licence in Brazil in 2016. The current portion amounted to USD 0.3 billion and the remaining provision amounts to USD 0.9 billion. For further information, see note 4 Acquisitions and disposals.
For further information of methods applied and estimates required, see note 2 Significant accounting policies.
Expected timing of cash outflows |
(in USD million) | Asset retirement obligations | Other provisions, including claims and litigations | Total |
| | | |
2019 - 2023 | 1,307 | 2,447 | 3,754 |
2024 - 2028 | 1,891 | 682 | 2,574 |
2029 - 2033 | 3,530 | 36 | 3,566 |
2034 - 2038 | 2,534 | 13 | 2,546 |
Thereafter | 3,348 | 388 | 3,736 |
| | | |
At 31 December 2018 | 12,609 | 3,567 | 16,175 |
21 Trade, other payables and provisions
| At 31 December |
(in USD million) | 2018 | 2017 |
| | |
Trade payables | 2,532 | 3,181 |
Non-trade payables and accrued expenses | 2,604 | 2,345 |
Joint venture payables | 2,254 | 2,464 |
Payables to equity accounted associated companies and other related parties | 725 | 858 |
| | |
Total financial trade and other payables | 8,115 | 8,849 |
Current portion of provisions and other non-financial payables | 255 | 888 |
| | |
Trade, other payables and provisions | 8,369 | 9,737 |
Included in current portion of provisions and other non-financial payables are certain provisions that are further described in note 20 Provisions and in note 24 Other commitments, contingent liabilities and contingent assets. For information regarding currency sensitivities, see note 26 Financial instruments: fair value measurement and sensitivity analysis of market risk. For further information on payables to equity accounted associated companies and other related parties, see note 25 Related parties.
Equinor, Annual Report on Form 20-F 2018 211
22 Leases
Equinor leases certain assets, notably drilling rigs, vessels and office buildings. Lease contracts committed by a licence are presented net, based on Equinor’s participation interest in the respective licences. Lease contracts for helicopters, supply vessels and other assets used to serve a group of licences are presented net based on Equinor’s average participation interests in these licences.
In 2018, net rental expenditures were USD 2,080 million (USD 2,075 million in 2017 and USD 2,569 million in 2016). No material contingent rent payments have been expensed in 2018, 2017 or 2016.
The information in the table below shows future minimum lease payments due under non-cancellable operating leases at 31 December 2018:
| Operating leases |
(in USD million) | Rigs | Vessels | Land and buildings | Storage | Other | Total |
| | | | | | |
2019 | 998 | 662 | 143 | 83 | 113 | 2,001 |
2020 | 523 | 599 | 141 | 60 | 84 | 1,406 |
2021 | 349 | 534 | 140 | 41 | 50 | 1,114 |
2022 | 372 | 384 | 136 | 40 | 28 | 960 |
2023 | 280 | 316 | 198 | 25 | 13 | 832 |
2024-2028 | 75 | 789 | 544 | 68 | 50 | 1,527 |
2029-2033 | - | 131 | 223 | 6 | 17 | 376 |
Thereafter | - | - | 32 | - | 7 | 39 |
| | | | | | |
Total future minimum lease payments | 2,597 | 3,414 | 1,558 | 322 | 363 | 8,253 |
Equinor had certain operating lease contracts for drilling rigs at 31 December 2018. The remaining significant contracts' terms range from one month to six years. Rig lease agreements are for the most part based on fixed day rates. Certain rigs have been leased by Equinor and assigned in whole or for part of the lease term mainly to Equinor operated licences on the Norwegian continental shelf. These leases are included net (Equinor share) as operating leases in the table above.
Certain contracts include both lease- and non-lease components. These non-lease components, mainly relating to operations of drilling rigs and vessels, are estimated to approximately USD 1.5 billion and are included in the figures above.
Equinor has a long-term time charter agreement with Teekay for offshore loading and transportation in the North Sea. The contract covers the lifetime of applicable producing fields and at year end 2018 includes three crude tankers. The contract's estimated nominal amount was approximately USD 529 million at year end 2018, and it is included in the category Vessels in the table above.
The category Land and buildings include future minimum lease payments from Equinor ASA to related parties of USD 474 million regarding the lease of one office building located in Bergen and one in Harstad, both owned by Equinor`s pension fund (“Equinor Pension”). These operating lease commitments extend to the year 2037. USD 356 million of the total is payable after 2022.
Equinor had finance lease liabilities of USD 432 million at 31 December 2018. The nominal minimum lease payments related to these finance leases amount to USD 555 million. Property, plant and equipment includes USD 380 million for finance leases that have been capitalised at year end (USD 439 million in 2017), mainly presented in the category Machinery, equipment and transportation equipment, including vessels in note 10 Property, plant and equipment.
Certain contracts contain renewal options. The execution of such options will depend on future market development and business needs at the time when such options are to be exercised.
212 Equinor, Annual Report on Form 20-F 2018
23 Implementation of IFRS 16 Leases
IFRS 16 Leases, which will be implemented by Equinor on 1 January 2019, covers the recognition of leases and related disclosure in the financial statements, and will replace IAS 17 Leases. The new standard defines a lease as a contract that conveys the right to control the use of an identified asset for a period of time in exchange for consideration. In the financial statement of lessees, IFRS 16 requires recognition in the balance sheet for each contract that meets its definition of a lease as right-of-use asset and a lease liability, while lease payments are to be reflected as interest expense and a reduction of lease liabilities. The right-of-use assets are to be depreciated over the shorter of each contract’s term and the assets’ useful life. IFRS 16 will also lead to changes in the classification of lease-related payments in the statement of cash flows, where the portion of lease payments representing down-payments of lease liabilities will be classified as cash flows used in financing activities.
The standard implies a significant change in lessees’ accounting for leases currently defined as operating leases under IAS 17.
Equinor is for the most part a lessee in applying lease accounting, and the descriptions below consequently reflect lessee accounting. However, in certain instances, particularly as relates to Equinor’s role as operator in unincorporated joint operations (licences), lessor accounting is applied.
Upon implementation of IFRS 16, the following main implementation and application policy choices have been made by Equinor:
IFRS 16 transition choices
· IFRS 16 will be implemented retrospectively with the cumulative effect of initially recognising the standard as an adjustment to retained earnings at the date of initial application, and without restatement of prior periods’ reported figures (“the modified retrospective method”)
· Contracts already classified either as leases under IAS 17 or as non-lease service arrangements will maintain their respective classifications upon the implementation of IFRS 16 (“grandfathering of contracts”)
· Leases for which the lease term ends within 12 months of 1 January 2019 will not be reflected as leases under IFRS 16
· Right-of-use assets will for most contracts initially be reflected at an amount equal to the corresponding lease liability. Any existing onerous contract provisions related to leases will reduce the value of the corresponding RoU asset to be recognised
IFRS 16 policy application choices
· Short term leases (12 months or less) and leases of low value assets will not be reflected in the balance sheet but will be expensed or (if appropriate) capitalised as incurred, depending on the activity in which the leased asset is used
· Non-lease components within lease contracts will be accounted for separately for all underlying classes of assets and reflected in the relevant expense category or (if appropriate) capitalised as incurred, depending on the activity involved
Significant accounting interpretations and judgments related to the IFRS 16 application
IFRS 16 in general, as well as the policy application choices made, involve several accounting interpretations and application of judgement which will impact Equinor’s Consolidated financial statements. The accounting issues and interpretations which will most significantly affect the implementation of IFRS 16 in Equinor are summarised below.
Distinguishing operators and joint operations as lessees, including sublease considerations
The most significant accounting judgment in Equinor’s application of IFRS 16 has been and remains distinguishing between the joint operation (licences) or the operator as the relevant lessee in upstream activity lease contracts, and consequently whether such contracts are to be reflected gross (100%) in the operator’s financial statements, or according to each joint operation partner’s proportionate share of the lease.
In the oil and gas industry, where activity frequently is carried out through joint arrangements or similar arrangements, the application of IFRS 16 requires evaluations of whether the joint arrangement or its operator is the lessee in each lease agreement.
In many cases where an operator is the sole signatory to a lease contract of an asset to be used in the activities of a specific joint operation, the operator does so implicitly or explicitly on behalf of the joint arrangement. In certain jurisdictions, and importantly for Equinor this includes the Norwegian continental shelf (NCS), the concessions granted by the authorities establish both a right and an obligation for the operator to enter into necessary agreements in the name of the joint operations (licences). As is the customary norm in upstream activities operated through joint arrangements, the operator will manage the lease, pay the lessor, and subsequently re-bill the partners for their share of the lease costs. In each such instance, it is necessary to determine:
- Whether the operator is the sole lessee in the external lease arrangement, and if so, whether the billings to partners may represent sub-leases, or;
- Whether it is in fact the joint arrangement which is the lessee, with each participant accounting for its proportionate share of the lease.
Depending on facts and circumstances in each case, the conclusions reached may vary between contracts and legal jurisdictions.
In summary, Equinor expects to recognise lease liabilities based on the principles described below. In the following, the term “licence” references non-incorporated joint operations and similar arrangements;
Equinor, Annual Report on Form 20-F 2018 213
Leases to be recognised by Equinor as the operator of a licence
Where all partners in a licence are considered to share the primary responsibility for lease payments under a contract, the related lease liability and RoU asset will be recognised net by Equinor, on the basis of Equinor’s participation interest in the licence. Such instances include contracts where all licence partners have co-signed a lease contract and situations where Equinor as the operator of the licence has been given a legally binding mandate to sign the external lease contract on behalf of the licence partners, provided that this mandate makes all licence participants primary liable for the external lease liability.
Equinor will recognise a lease liability on a gross (100%) basis when it is considered to have the primary responsibility for the full external lease payments. When a financial sublease is considered to exist between Equinor and a licence, Equinor will derecognise a portion of the RoU asset equal to the non-operators’ interests in the lease, and instead recognise a corresponding financial lease receivable. A financial sublease will typically exist where Equinor enters into a contract in its own name, where it has the primary responsibility for the external lease payments, where the leased asset is to be used on one specific licence, and where the costs and risks related to the use of this asset are carried by that specific licence.
Where Equinor reports its lease liabilities on a gross basis, due to being considered the primary responsible for the external lease payment, and where the use of the leased asset on a licence is not considered a financial sublease, Equinor will recognise the related RoU asset on a gross basis. Lease payments recovered by Equinor from its licence partners based on their proportionate shares of the lease will be recognised as other revenues. Such expenses have under the previous lease accounting rules been reflected net by Equinor, on the basis of Equinor’s net participation interest in the licence. Expenses which are not included in a recognised lease obligation, such as payments for short term leases, non-lease components and variable lease payments, will continue to be reported net in Equinor’s statement of income, on the basis of Equinor’s net participation interest.
Leases to be recognised by Equinor as a non-operator of a licence
As a licence participant, but non-operator, of an oil and gas licence, Equinor will recognise its proportionate share of a lease when Equinor is considered to share the primary responsibility for a licence committed lease liability. This includes contracts where Equinor has co-signed a lease contract and contracts for which the operator has been given a legally binding mandate to sign the external lease contract on behalf of the licence partners.
Equinor will also recognise its proportionate share when a lease contract is entered by the operator of a licence, and where the operator’s use of the leased asset represents a sublease from the operator to the licence. A sublease is considered to take place in situations where the operator agrees with its licence partners that an identified asset is committed to be used solely in the operations of the specific licence for a specified period of time, and where the use of the asset is deemed to be controlled jointly by the licence partnership.
Reporting of rig sharing arrangements
As a significant operator on the NCS, Equinor might sign lease contracts on behalf of one or more individual licences which have committed to use the leased rig for specific periods of time. A rig sharing arrangement will determine where and when the rig will be used throughout the contract period. When a licence is considered a lessee in a rig sharing arrangement, the licence is considered a lessee for its respective portion of the full lease period. Accordingly, Equinor will account for these lease contracts from a licence perspective, both with regards to considering when to use the short-term exemption from IFRS 16’s requirements, and when determining the commencement of the lease.
When a rig lease is entered in Equinor’s own name, the lease liability will be recognised in Equinor’s Consolidated balance sheet on a gross (100%) basis. However, Equinor will not recognise any lease liability for periods where the rig is formally assigned to another party, effectively transferring both the right to use the leased asset and the primary responsibility for lease payments under the contract to this other party.
When a leased asset is assigned to a licence for two or more non-consecutive periods within the same contract, Equinor will account for these non-consecutive periods in combination, both when considering whether to use the short-term exemption, and when determining the commencement of the lease.
Separation of lease and non-lease components
Many of Equinor’s lease contracts, such as rig and vessel leases, involve a number of additional services and components, including personnel cost, maintenance, drilling related activities, and other items. For a number of these contracts, the additional services represent a not inconsiderable portion of the total contract value. Where the additional services are not separately priced, the consideration paid has been allocated based on the relative stand-alone prices of the lease and non-lease components. Equinor’s previous practice for lease commitments reporting was to not distinguish fixed non-lease components within a lease contract from the actual lease components. The choice made under IFRS 16 to account for non-lease components separately for all classes of assets consequently represents a change in Equinor’s reporting of leases
Evaluating the impact of option periods for the lease terms
Many of Equinor’s major leases, such as leases of vessels, rigs and buildings, include options to extend the lease term. Under IFRS 16, the evaluation of whether each lease contract’s extension options are considered reasonably certain to be exercised, are made at commencement of the leases and subsequently when facts and circumstances which are under the control of Equinor require it. In Equinor’s view, the term ‘reasonably certain’ implies a probability level significantly higher than ‘probable’, and this has been reflected in Equinor’s evaluations.
214 Equinor, Annual Report on Form 20-F 2018
Distinguishing fixed and variable lease payment elements
Under IFRS 16, fixed and in-substance fixed lease payments are to be included in the commencement date computation of a lease liability, while variable payments dependent on use of the asset are not. Particularly as regards drilling rig leases, Equinor’s lease contracts include fixed rates for when the asset in question is in operation, and various alternative, lower rates (“stand-by rates”) for periods where the asset is engaged in specified activities or idle, but still under contract. In general, variability in lease payments under the contract has its basis of different uses and activity levels, and the variable elements have been determined to relate to non-lease components only. Consequently, the lease components of these contractual payments are considered fixed for the purposes of IFRS 16.
Determining the incremental borrowing rate to be used as discount factor
In measuring the present value of the lease liability under IFRS 16, the standard requires that the lessee’s incremental borrowing rate be used as discount factor if the rate implicit in the lease cannot be readily determined. In establishing Equinor’s lease liabilities, the incremental borrowing rates used as discount factors in discounting payments are established based on a consistent approach reflecting the Group’s borrowing rate, the currency of the obligation, the duration of the lease term, and the credit spread for the legal entity entering the lease contract.
Expected impact from implementation of IFRS 16 on Equinor’s financial statements
Balance sheet
Equinor currently expects that the implementation of IFRS 16 on 1 January 2019 will increase the Consolidated balance sheet by adding lease liabilities of approximately USD 4.2 billion and a corresponding right of use assets on the asset side. Consequently. Equity is not expected to be impacted from the implementation of IFRS 16. The figure is a preliminary estimate, on basis of Equinor’s current policy interpretations.
The table below presents a reconciliation of Equinor’s operating lease liabilities as reported under IAS 17 Leases per 31 December 2018, and the IFRS 16-based lease liability expected to be recognised in the Consolidated balance sheet on 1 January 2019.
(in USD million) | |
| |
Operating lease commitments (IAS 17) at 31 December 2018 | 8,253 |
Short term leases and leases expiring during 2019 | (666) |
Non-lease components | (1,469) |
Commitments related to leases not yet commenced | (2,116) |
Leases reported gross vs net | 711 |
Effect of discounting | (485) |
Finance leases (IAS 17) included in the balance sheet at 31 December 2018 | 432 |
| |
Lease liability to be reported under IFRS 16 at 1 January 2019 | 4,660 |
Reference is made to the policy descriptions above for explanations of the reconciling items. Leases not yet commenced relates to situations where a contract is signed, but where Equinor has not yet obtained the right to control an underlying asset, either on its own or through a joint operation.
Extension and termination options within the lease contracts are in all material respect reported on the same basis as under IAS 17 Leases. Most leases are used in operational activities. The extension options which are considered reasonably certain to be exercised are mainly those for which operational decisions have been made which make the leased assets vital to the continued relevant business activities.
Statement of income
In the Consolidated statement of income, operating lease costs will be replaced by depreciation and interest expenses. For leases allocated to activities which are capitalised, the costs will continue to be expensed as before, through depreciation of the asset involved or through the subsequent expensing of capitalised exploration.
Equinor expects more currency volatility within financial items due to recognition of lease liabilities in foreign currencies. In particular, this relates to USD-denominated lease contracts for assets such as drilling rigs and supply vessels used on the NCS, where the contract is entered into by an Equinor entity with NOK as its functional currency, and NOK-based office leases entered into by Equinor ASA, which has USD as its functional currency.
Cash flow statement
In the cash flow statement, lease down-payments will be presented as a cash flow used in financing activities under IFRS 16. Previously, operating lease costs were presented within cash flows from operations or investing cash flows respectively, depending on whether the leased asset is used in operating activity or activities that are capitalised.
Equinor, Annual Report on Form 20-F 2018 215
In situations where Equinor is considered to have the primary responsibility for a lease liability, and consequently reports the lease liability on a gross basis, any corresponding payments from partner recharges recognised as other revenue in the income statement will also be reported on a gross basis in the cash flow statement, with the gross lease payments being recognised as a financing cash flow and the recharge from partners recognised as an operating cash flow.
Consequently, cash flows from operating activities will increase and cash flow used in investing activities will be reduced due to the implementation of IFRS 16.
Segment reporting
Equinor does not plan changes to how management will monitor and follow up lease contracts used in its business operations. All lease contracts will therefore be presented within Equinor’s “Other”-segment, and the E&P segments as well as the MMP segment will continue to be presented without reflecting IFRS 16 lease accounting. In these segments, the costs of operating leases will be presented as operating costs rather than depreciation and interests. A corresponding credit will be recognised in the “Other”-segment to offset the lease costs recognised in the E&P and MMP segments.
24 Other commitments, contingent liabilities and contingent assets
Contractual commitments
Equinor had contractual commitments of USD 6,269 million at 31 December 2018. The contractual commitments reflect Equinor's share and mainly comprise construction and acquisition of property, plant and equipment as well as committed investments in equity accounted entities.
As a condition for being awarded oil and gas exploration and production licences, participants may be committed to drill a certain number of wells. At the end of 2018, Equinor was committed to participate in 43 wells, with an average ownership interest of approximately 39%. Equinor's share of estimated expenditures to drill these wells amounts to USD 578 million. Additional wells that Equinor may become committed to participating in depending on future discoveries in certain licences are not included in these numbers.
Other long-term commitments
Equinor has entered into various long-term agreements for pipeline transportation as well as terminal use, processing, storage and entry/exit capacity commitments and commitments related to specific purchase agreements. The agreements ensure the rights to the capacity or volumes in question, but also impose on Equinor the obligation to pay for the agreed-upon service or commodity, irrespective of actual use. The contracts' terms vary, with durations of up to 2044.
Take-or-pay contracts for the purchase of commodity quantities are only included in the table below if their contractually agreed pricing is of a nature that will or may deviate from the obtainable market prices for the commodity at the time of delivery.
Obligations payable by Equinor to entities accounted for using the equity method are included gross in the table below. For assets (for example pipelines) that Equinor accounts for by recognising its share of assets, liabilities, income and expenses (capacity costs) on a line-by-line basis in the Consolidated financial statements, the amounts in the table include the net commitment payable by Equinor (i.e. gross commitment less Equinor's ownership share).
Nominal minimum other long-term commitments at 31 December 2018:
(in USD million) | |
| |
2019 | 1,584 |
2020 | 1,463 |
2021 | 1,303 |
2022 | 1,134 |
2023 | 1,050 |
Thereafter | 4,947 |
| |
Total | 11,479 |
216 Equinor, Annual Report on Form 20-F 2018
Guarantees
Equinor has guaranteed for its proportionate share of an associate’s long term bank debt, payment obligations under contracts and some third party obligations amounting to USD 741 million. The book value of the guarantees are immaterial.
Contingent liabilities and contingent assets
Redetermination process for Agbami field
Through its ownership in OML 128 in Nigeria, Equinor is a party to an ownership interest redetermination process for the Agbami field. In October 2015, Equinor received the Expert’s final ruling which implied a reduction of 5.17 percentage points in Equinor’s equity interest in the field. Equinor had previously initiated arbitration proceedings to set aside interim decisions made by the Expert, but this was declined by the arbitration tribunal in its November 2015 judgment. Equinor proceeded to the Court of Appeal to have the arbitration award set aside, but the appeal was dismissed in the fourth quarter of 2018. In 2016 Equinor also initiated arbitration to set aside the Expert’s final ruling. The award in this arbitration was delivered in the second quarter of 2018, dismissing Equinor’s claim. At the time of the arbitration award, there was no impact on Equinor’s accounting for the Agbami redetermination, as the outcome had been provided for in line with the Expert’s ruling.
In 2018, Equinor also explored the possibility of an out-of-court settlement of the redetermination dispute. A non-binding agreement has been reached during the fourth quarter of 2018. Equinor’s best estimate related to the redetermination has changed, and the provision net of tax has been reduced by USD 349 million in the fourth quarter. The reversal of the provision has been recognised in the Consolidated statement of income, combined with the effect of volumes lifted as of 31 December 2018, mainly through an increase in other revenue of USD 774 million, increase in depreciation, amortisation and net impairment losses of USD 143 million, and increased tax cost of USD 297 million.
As of 31 December 2018, Equinor’s remaining provision net of tax related to the Agbami redetermination amounts to USD 854 million. The provision is reflected within Non-current provisions in the Consolidated balance sheet.
Price review arbitration
Some long-term gas sales agreements contain price review clauses, which in certain cases lead to claims subject to arbitration. The range of exposure related to ongoing arbitration broadened in the second quarter of 2018, and the exposure for Equinor has been estimated to approximately USD 1.2 billion for gas delivered prior to year-end 2018. Based on Equinor’s assessment, no provision is included in the Consolidated financial statements at year-end 2018. The timing of the resolution is uncertain but is estimated to 2019-2020. Price review arbitration related changes in provisions throughout 2018 are immaterial and have been reflected in the Consolidated statement of income as adjustments to revenue from contracts with customers.
Dispute with Brazilian tax authorities
Brazilian tax authorities have issued an updated tax assessment for 2011 for Equinor’s Brazilian subsidiary which was party to Equinor’s divestment of 40% of the Peregrino field to Sinochem at that time. The assessment disputes Equinor’s allocation of the sale proceeds between entities and assets involved, resulting in a significantly higher assessed taxable gain and related taxes payable in Brazil. Equinor disagrees with the assessment and has provided responses to this effect. The ongoing process of formal communication with the Brazilian tax authorities, as well as any subsequent litigation that may become necessary, may take several years. No taxes will become payable until the matter has been finally settled. Equinor is of the view that all applicable tax regulations have been applied in the case and that the group has a strong position. No amounts have consequently been provided for in the accounts.
Suit for an annulment of Petrobras’ sale of the interest in BM-S-8 to Equinor
In March 2017, the Union of Workers of Oil Tankers of Sergipe (Sindipetro) filed a class action suit against Petrobras, Equinor, and ANP - the Brazilian Regulatory Agency - to seek annulment of Petrobras’ sale of the interest and operatorship in BM-S-8 to Equinor, which was closed in November 2016 after approval by the partners and authorities. There was also an injunction request to suspend the assignment which was granted in April 2017 by a federal judge and was subsequently lifted by the Federal Regional Court. The cases are progressing through the court system. At the end of 2018 the acquired interest remains in Equinor’s balance sheet as intangible assets of the Exploration & Production International (E&P International) segment. For further information about Equinor’s acquisitions and divestments in BM-S-8, reference is made to note 4 Acquisitions and disposals.
A deviation notices from Norwegian tax authorities
On 6 July 2016, the Norwegian tax authorities issued a deviation notice for the years 2012 to 2014 related to the internal pricing on certain transactions between Equinor Coordination Centre (ECC) in Belgium and Norwegian entities in the Equinor group. The main issue in this matter relates to ECC`s capital structure and its compliance with the arm’s length principle. Equinor is of the view that arm’s length pricing has been applied and that the group has a strong position, and no amounts have consequently been provided for this issue in the accounts.
On 28 February 2018, Equinor received a notice of deviation from Norwegian tax authorities related to an ongoing dispute regarding the level of Research & Development cost to be allocated to the offshore tax regime, increasing the maximum exposure in this matter to approximately USD 500 million. Equinor provided for its best estimate in the matter.
Dispute concerning termination of a long-term contract for the drilling rig COSL Innovator.
In March 2016 Equinor Energy AS, acting on behalf of the Troll field partners, terminated a long-term contract for the drilling rig COSL Innovator. The termination was disputed in court by the rig owner COSL Offshore Management AS (COSL). Equinor’s share of the total exposure, based on COSL’s original claim, has been estimated to be approximately USD 200 million excluding penalty interest. In May 2018, the court of first instance
Equinor, Annual Report on Form 20-F 2018 217
(Oslo District Court) ruled that while the contract could be cancelled according to the applicable clauses of the contract and with payment of the appropriate cancellation charge, the contract had not been validly terminated. In June 2018 both parties appealed the verdict to the court of appeal. Oslo District Court’s ruling is consequently not final. Equinor intends to defend its own and the Troll partners’ position and considers it to be more likely than not that the final verdict will conclude that the termination of the rig contract was valid under its terms. No provision related to the dispute is included in Equinor’s accounts as of 31 December 2018.
A dispute between the Federal Government of Nigeria and the Governments of Rivers, Bayelsa and Akwa Ibom States in Nigeria
In October 2018, Supreme Court of Nigeria rendered a judgement in a dispute between the Federal Government of Nigeria and the Governments of Rivers, Bayelsa and Akwa Ibom States in favour of the latter. The Supreme Court judgement provides for potential retroactive adjustment of certain production sharing contracts in favour of the Federal Government, including OML 128 (Agbami) where Equinor has 53.85% equity interest. Equinor sees no merit to the case. No provision has been made for this matter.
Other claims
During the normal course of its business, Equinor is involved in legal proceedings, and several other unresolved claims are currently outstanding. The ultimate liability or asset, in respect of such litigation and claims cannot be determined at this time. Equinor has provided in its Consolidated financial statements for probable liabilities related to litigation and claims based on its best estimate. Equinor does not expect that its financial position, results of operations or cash flows will be materially affected by the resolution of these legal proceedings. Equinor is actively pursuing the above disputes through the contractual and legal means available in each case, but the timing of the ultimate resolutions and related cash flows, if any, cannot at present be determined with sufficient reliability.
Provisions related to claims are reflected within note 20 Provisions.
25 Related parties
Transactions with the Norwegian State
The Norwegian State is the majority shareholder of Equinor and also holds major investments in other Norwegian companies. As of 31 December 2018, the Norwegian State had an ownership interest in Equinor of 67.0% (excluding Folketrygdfondet, the Norwegian national insurance fund, of 3.3%). This ownership structure means that Equinor participates in transactions with many parties that are under a common ownership structure and therefore meet the definition of a related party. All transactions are considered to be on an arm's length basis.
Total purchases of oil and natural gas liquids from the Norwegian State amounted to USD 8,604 million, USD 7,352 million and USD 5,848 million in 2018, 2017 and 2016, respectively. Total purchases of natural gas regarding the Tjeldbergodden methanol plant from the Norwegian State amounted to USD 49 million, USD 39 million and USD 44 million in 2018, 2017 and 2016, respectively. These purchases of oil and natural gas are recorded in Equinor ASA. In addition, Equinor ASA sells in its own name, but for the Norwegian State’s account and risk, the Norwegian State’s gas production. These transactions are presented net. For further information please see note 2 Significant accounting policies. The most significant items included in the line item Equity accounted investments and other related party payables in note 21 Trade and other payables, are amounts payable to the Norwegian State for these purchases.
Other transactions
In relation to its ordinary business operations Equinor enters into contracts such as pipeline transport, gas storage and processing of petroleum products, with companies in which Equinor has ownership interests. Such transactions are carried out on an arm's length basis and are included within the applicable captions in the Consolidated statement of income. Gassled and certain other infrastructure assets are operated by Gassco AS, which is an entity under common control by the Norwegian Ministry of Petroleum and Energy. Gassco’s activities are performed on behalf of and for the risk and reward of pipeline and terminal owners, and capacity payments flow through Gassco to the respective owners. Equinor payments that flowed through Gassco in this respect amounted to USD 1,351 million, USD 1,155 million and USD 1,167 million in 2018, 2017 and 2016, respectively. These payments are recorded in Equinor ASA. In addition, Equinor ASA process in its own name, but for the Norwegian State’s account and risk, the Norwegian State’s share of the Gassco costs. These transactions are presented net.
As of 31 December 2018, Equinor had an ownership interest in Lundin Petroleum AB (Lundin) of 20.1% of the outstanding shares and votes. Total purchase of oil and related products from Lundin amounted to USD 879 million, USD 176 million and USD 155 million in 2018, 2017 and 2016, respectively. Total sale of oil and related products to Lundin amounted to USD 296 million in 2018, USD 0 million in 2017 and 2016, respectively. The sale and purchase of oil and related products are recorded in Equinor ASA.
For information concerning certain lease arrangements with Equinor Pension, see note 22 Leases.
Related party transactions with management are presented in note 6 Remuneration. Management remuneration for 2018 is presented in note 4 Remuneration in the financial statements of the parent company, Equinor ASA.
218 Equinor, Annual Report on Form 20-F 2018
26 Financial instruments: fair value measurement and sensitivity analysis of market risk
Financial instruments by category
The following tables present Equinor's classes of financial instruments and their carrying amounts by the categories as they are defined in IFRS 9 Financial Instruments: Classification and Measurement. See note 27 Changes in accounting policies for information on how Equinor’s classes of financial instruments were measured at IAS 39 categories. For financial investments the difference between measurement as defined by IFRS 9 categories and measurement at fair value is immaterial. See note 18 Finance debt for fair value information of non-current bonds, bank loans and finance lease liabilities.
See note 2 Significant accounting policies for further information regarding measurement of fair values.
(in USD million) | Note | Amortised cost | Fair value through profit or loss | Non-financial assets | Total carrying amount |
| | | | | |
At 31 December 2018 | | | | | |
Assets | | | | | |
Non-current derivative financial instruments | | - | 1,032 | - | 1,032 |
Non-current financial investments | 13 | 90 | 2,365 | - | 2,455 |
Prepayments and financial receivables | 13 | 854 | - | 179 | 1,033 |
| | | | | |
Trade and other receivables | 15 | 8,488 | - | 510 | 8,998 |
Current derivative financial instruments | | - | 318 | - | 318 |
Current financial investments | 13 | 6,145 | 896 | - | 7,041 |
Cash and cash equivalents | 16 | 5,301 | 2,255 | - | 7,556 |
| | | | | |
Total | | 20,878 | 6,866 | 689 | 28,433 |
| | | | | |
| | | | | |
(in USD million) | Note | Amortised cost | Fair value through profit or loss | Non-financial assets | Total carrying amount |
| | | | | |
At 31 December 2017 | | | | | |
Assets | | | | | |
Non-current derivative financial instruments | | - | 1,603 | - | 1,603 |
Non-current financial investments | 13 | 47 | 2,794 | - | 2,841 |
Prepayments and financial receivables | 13 | 723 | - | 188 | 912 |
| | | �� | | |
Trade and other receivables | 15 | 8,560 | - | 865 | 9,425 |
Current derivative financial instruments | | - | 159 | - | 159 |
Current financial investments | 13 | 4,085 | 4,363 | - | 8,448 |
Cash and cash equivalents | 16 | 2,917 | 1,473 | - | 4,390 |
| | | | | |
Total | | 16,332 | 10,393 | 1,053 | 27,778 |
Equinor, Annual Report on Form 20-F 2018 219
(in USD million) | Note | Amortised cost | Fair value through profit or loss | Non-financial liabilities | Total carrying amount |
| | | | | |
At 31 December 2018 | | | | | |
Liabilities | | | | | |
Non-current finance debt | 18 | 23,264 | - | - | 23,264 |
Non-current derivative financial instruments | | - | 1,207 | - | 1,207 |
| | | | | |
Trade and other payables | 21 | 8,115 | - | 255 | 8,369 |
Current finance debt | 18 | 2,463 | - | - | 2,463 |
Dividend payable | | 766 | - | - | 766 |
Current derivative financial instruments | | - | 352 | - | 352 |
| | | | | |
Total | | 34,608 | 1,559 | 255 | 36,422 |
| | | | | |
| | | | | |
(in USD million) | Note | Amortised cost | Fair value through profit or loss | Non-financial liabilities | Total carrying amount |
| | | | | |
At 31 December 2017 | | | | | |
Liabilities | | | | | |
Non-current finance debt | 18 | 24,183 | - | - | 24,183 |
Non-current derivative financial instruments | | - | 900 | - | 900 |
| | | | | |
Trade and other payables | 21 | 8,849 | - | 888 | 9,737 |
Current finance debt | 18 | 4,091 | - | - | 4,091 |
Dividend payable | | 729 | - | - | 729 |
Current derivative financial instruments | | - | 403 | - | 403 |
| | | | | |
Total | | 37,852 | 1,302 | 888 | 40,042 |
Fair value hierarchy
The following table summarises each class of financial instruments which are recognised in the Consolidated balance sheet at fair value, split by Equinor's basis for fair value measurement.
(in USD million) | Non-current financial investments | Non-current derivative financial instruments - assets | Current financial investments | Current derivative financial instruments - assets | Cash equivalents | Non-current derivative financial instruments - liabilities | Current derivative financial instruments - liabilities | Net fair value |
| | | | | | | | |
At 31 December 2018 | | | | | | | | |
Level 1 | 1,088 | - | 365 | - | - | - | - | 1,453 |
Level 2 | 1,027 | 806 | 531 | 274 | 2,255 | (1,172) | (351) | 3,370 |
Level 3 | 250 | 227 | - | 44 | - | (35) | (1) | 485 |
| | | | | | | | |
Total fair value | 2,365 | 1,032 | 896 | 318 | 2,255 | (1,207) | (352) | 5,307 |
| | | | | | | | |
At 31 December 2017 | | | | | | | | |
Level 1 | 1,126 | - | 355 | - | - | - | - | 1,481 |
Level 2 | 1,271 | 1,320 | 4,008 | 122 | 1,473 | (900) | (399) | 6,896 |
Level 3 | 397 | 283 | - | 37 | - | - | (4) | 713 |
| | | | | | | | |
Total fair value | 2,794 | 1,603 | 4,363 | 159 | 1,473 | (900) | (403) | 9,090 |
Level 1, fair value based on prices quoted in an active market for identical assets or liabilities, includes financial instruments actively traded and for which the values recognised in the Consolidated balance sheet are determined based on observable prices on identical instruments. For Equinor this category will, in most cases, only be relevant for investments in listed equity securities and government bonds.
220 Equinor, Annual Report on Form 20-F 2018
Level 2, fair value based on inputs other than quoted prices included within level 1, which are derived from observable market transactions, includes Equinor's non-standardised contracts for which fair values are determined on the basis of price inputs from observable market transactions. This will typically be when Equinor uses forward prices on crude oil, natural gas, interest rates and foreign exchange rates as inputs to the valuation models to determining the fair value of its derivative financial instruments.
Level 3, fair value based on unobservable inputs, includes financial instruments for which fair values are determined on the basis of input and assumptions that are not from observable market transactions. The fair values presented in this category are mainly based on internal assumptions. The internal assumptions are only used in the absence of quoted prices from an active market or other observable price inputs for the financial instruments subject to the valuation.
The fair value of certain earn-out agreements and embedded derivative contracts are determined by the use of valuation techniques with price inputs from observable market transactions as well as internally generated price assumptions and volume profiles. The discount rate used in the valuation is a risk-free rate based on the applicable currency and time horizon of the underlying cash flows adjusted for a credit premium to reflect either Equinor's credit premium, if the value is a liability, or an estimated counterparty credit premium if the value is an asset. In addition a risk premium for risk elements not adjusted for in the cash flow may be included when applicable. The fair values of these derivative financial instruments have been classified in their entirety in the third category within current derivative financial instruments and non-current derivative financial instruments. Another reasonable assumption, that could have been applied when determining the fair value of these contracts, would be to extrapolate the last observed forward prices with inflation. Applying this assumption would have an insignificant impact on the fair value for these contracts.
The reconciliation of the changes in fair value during 2018 and 2017 for financial instruments classified as level 3 in the hierarchy are presented in the following table.
(in USD million) | Non-current financial investments | Non-current derivative financial instruments - assets | Current derivative financial instruments - assets | Non-current derivative financial instruments liabilities | Current derivative financial instruments - liabilities | Total amount |
| | | | | | |
Opening as at 1 January 2018 | 397 | 283 | 37 | - | (4) | 713 |
Total gains and losses recognised in statement of income | (91) | (44) | 46 | (35) | 3 | (122) |
Purchases | 35 | - | - | - | - | 35 |
Settlement | - | - | (36) | - | - | (36) |
Transfer to level 1 | (88) | - | - | - | - | (88) |
Foreign currency translation differences | (3) | (13) | (3) | - | - | (18) |
| | | | | | |
Closing as at 31 December 2018 | 250 | 227 | 44 | (35) | (1) | 485 |
| | | | | | |
Opening as at 1 January 2017 | 207 | 848 | 66 | (6) | (4) | 1,110 |
Total gains and losses recognised in statement of income | - | (69) | 36 | 6 | - | (27) |
Purchases | 90 | - | - | - | - | 90 |
Settlement | - | (533) | (67) | - | - | (600) |
Transfer into level 3 | 94 | - | - | - | - | 94 |
Foreign currency translation differences | 5 | 37 | 3 | - | - | 45 |
| | | | | | |
Closing as at 31 December 2017 | 397 | 283 | 37 | - | (4) | 713 |
During 2018 the financial instruments within level 3 have had a net decrease in the fair value of USD 228 million. The USD 122 million recognised in the Consolidated statement of income during 2018 are impacted by an increase of USD 54 million related to changes in fair value of certain earn-out agreements. Related to the same earn-out agreements, USD 36 million included in the opening balance for 2018 has been fully realised as the underlying volumes have been delivered during 2018.
Sensitivity analysis of market risk
Commodity price risk
The table below contains the commodity price risk sensitivities of Equinor's commodity based derivatives contracts. For further information related to the type of commodity risks and how Equinor manages these risks, see note 5 Financial risk management.
Equinor's assets and liabilities resulting from commodity based derivatives contracts consist of both exchange traded and non-exchange traded instruments, including embedded derivatives that have been bifurcated and recognised at fair value in the Consolidated balance sheet.
Price risk sensitivities at the end of 2018 at 30%, and at the end of 2017 at 20%, are assumed to represent a reasonably possible change based on the duration of the derivatives.
Equinor, Annual Report on Form 20-F 2018 221
Since none of the derivative financial instruments included in the table below are part of hedging relationships, any changes in the fair value would be recognised in the Consolidated statement of income.
Commodity price sensitivity | 2018 | 2017 |
(in USD million) | - 30% | + 30% | - 20% | + 20% |
| | | | |
At 31 December | | | | |
Crude oil and refined products net gains (losses) | 275 | (230) | 687 | (606) |
Natural gas and electricity net gains (losses) | 1,157 | (1,156) | 613 | (613) |
| | | | |
Currency risk
The following currency risk sensitivity has been calculated, by assuming an 9% reasonable change in the main exchange rates that impact Equinor’s financial accounts, based on balances at 31 December 2018. At 31 December 2017 a change of 8% in the main exchange rates were viewed as a reasonable change. With reference to table below, an increase in the exchange rates means that the disclosed currency has strengthened in value against all other currencies. The estimated gains and the estimated losses following from a change in the exchange rates would impact the Consolidated statement of income. For further information related to the currency risk and how Equinor manages these risks, see note 5 Financial risk management.
Currency risk sensitivity | 2018 | 2017 |
(in USD million) | - 9% | + 9% | - 8% | + 8% |
| | | | |
At 31 December | | | | |
USD net gains (losses) | (230) | 230 | 119 | (119) |
NOK net gains (losses) | 311 | (311) | (94) | 94 |
| | | | |
Interest rate risk
The following interest rate risk sensitivity has been calculated by assuming a change of 0.6 percentage points as reasonably possible changes in the interest rates at the end of 2018. A change of 0.6 percentage points in the interest rates was also in 2017 viewed as reasonably possible changes. The estimated gains following from a decrease in the interest rates and the estimated losses following from an interest rate increase would impact the Consolidated statement of income. For further information related to the interest risks and how Equinor manages these risks, see note 5 Financial risk management.
Interest risk sensitivity | 2018 | 2017 |
(in USD million) | - 0.6 percentage points | + 0.6 percentage points | - 0.6 percentage points | + 0.6 percentage points |
| | | | |
At 31 December | | | | |
Interest rate net gains (losses) | 575 | (575) | 664 | (664) |
222 Equinor, Annual Report on Form 20-F 2018
27 Changes in accounting policies
With effect from 1 January 2018, Equinor has implemented IFRS 9 Financial Instruments and IFRS 15 Revenue from Contracts with Customers. As of the same date, Equinor has voluntarily changed its policy for presentation of certain elements related to derivatives, non-cash currency effects and working capital items in the statement of cash flows, and its policy in accounting for lifting imbalances.
IFRS 9 Financial Instruments
IFRS 9 replaced IAS 39 Financial Instruments: Recognition and Measurement. IFRS 9 has been implemented retrospectively with the cumulative effect of initially applying the standard recognised at the date of initial application. The implementation impact of IFRS 9 is immaterial, and Equinor’s equity as at January 2018 have consequently not been adjusted upon adoption of the standard. In accordance with the IFRS 9’s transitional provisions, comparative figures have not been restated.
On the date of initial application of IFRS 9, Equinor’s financial instrument assets were classified into measurement categories as follows. The table shows the assets by category according to previous requirements and according to IFRS 9, with differences in carrying amounts noted where applicable:
| Measurement Category | Carrying Amount | |
| Original | New | Original | New | Difference |
(in USD million) | (IAS 39) | (IFRS 9) | (IAS 39) | (IFRS 9) |
Assets at 1 January 2018 | | | | | |
Non-current derivative financial instruments | Held for trading | Fair value through profit or loss | 1,603 | 1,603 | - |
Non-current financial investments | Loans and receivables | Amortised cost | 47 | 47 | - |
| Available for sale | Fair value through profit or loss | 397 | 397 | - |
| Fair value option | Fair value through profit or loss | 2,397 | 2,397 | - |
Prepayments and other financial receivables | Loans and receivables | Amortised cost | 723 | 723 | - |
| Non-financial assets | Non-financial assets | 188 | 188 | - |
Trade and other receivables | Loans and receivables | Amortised cost | 8,560 | 8,571 | 11 |
| Non-financial assets | Non-financial assets | 865 | 865 | - |
Current derivative financial instruments | Held for trading | Fair value through profit or loss | 159 | 159 | - |
Current financial investments | Loans and receivables | Amortised cost | 4,085 | 4,085 | - |
| Held for trading | Amortised cost | 3,649 | 3,639 | (10) |
| Fair value option | Fair value through profit or loss | 714 | 714 | - |
Cash and cash equivalents | Loans and receivables | Amortised cost | 2,917 | 2,917 | - |
| Held for trading | Fair value through profit or loss | 381 | 381 | - |
| Held for trading | Amortised cost | 1,092 | 1,091 | (1) |
Total | | | 27,778 | 27,778 | - |
There are no changes related to classification of Equinor’s liabilities following the implementation of IFRS 9.
Portions of Equinor’s cash equivalents and current financial investments tied to liquidity management, which under IAS 39 are classified as held for trading and reflected at fair value through profit and loss, will under IFRS 9 be measured at amortised cost, based on an evaluation of the contractual terms and the business model applied. The impact of the change is immaterial.
For certain financial assets currently classified as Available for sale (AFS), changes in fair value which under IAS 39 are reflected in OCI, will be reflected in profit and loss under IFRS 9. As a result, fair value loss of USD 64 million that had been accumulated in the available-for-sale financial assets reserve were expensed in the statement of income as an implementation effect.
Equinor, Annual Report on Form 20-F 2018 223
No significant changes were made for Equinor’s expected loss recognition process to satisfy IFRS 9’s financial asset impairment requirements. Credit risk related to financial assets measured at amortised cost is immaterial.
IFRS 15 Revenue from Contracts with Customers
IFRS 15 covers the recognition of revenue in the financial statements and related disclosure, and has replaced existing revenue recognition guidance, including IAS 18 Revenue. Equinor has implemented IFRS 15 retrospectively, with the cumulative effect recognised at the date of initial application. The impact on Equinor’s equity is immaterial. As allowed by the standard, prior periods have not been restated. Consequently, comparative figures for the years 2017 and 2016 included in notes to these Consolidated financial statements and affected by the IFRS 15 implementation have also not been restated. Total revenues and other income in the Consolidated statement of income has not been impacted materially by the implementation of IFRS 15.
IFRS 15 requires identification of the performance obligations for the transfer of goods and services in each contract with customers. Revenue is recognised upon satisfaction of the performance obligations for the amounts that reflect the consideration to which Equinor expects to be entitled in exchange for those goods and services. Reference is made to note 2 Significant accounting policies for a further description of Equinor’s policies for revenue accounting, including elements categorised as other revenue, and for the considerations made under IFRS 15 concerning the accounting for Equinor’s sale of the SDFI’s natural gas and crude oil.
With effect from 1 January 2018, Equinor has presented ‘Revenue from contracts with customers’ and ‘Other revenue’ as a single caption, Revenues, in the Consolidated statement of income. Reference is made to note 3 Segments for details concerning elements and amounts included under revenue from contracts with customers and other revenue, respectively. In addition, the impact of certain commodity-based earn-out and contingent consideration agreements are now presented under 'Other income'. These elements were previously presented within Revenues.
Change in Cash flow presentation – restatement of comparative periods
Equinor has changed its presentation of certain elements related to derivatives, non-cash currency effects and working capital items in the Consolidated statement of cash flows. The presentation was changed to better reflect the cash impact of the different items within operating, investing and financing activities. The changes impacts the classification of cash flow items within cash flows provided by operating activities and reclassification of cash flow elements relating to foreign exchange derivatives from operating activities to investing and financing activities.
Changes to classification of foreign currency derivatives
Equinor applies foreign currency derivatives to hedge currency exposure related financial investments and long-term debt in foreign currencies. Cash receipts and payments related to these derivatives has previously been classified as an operating cash flow together with cash flows from other derivative positions. To better align the cash receipt and payments from foreign currency derivatives with the cash flows related to the underlying hedged items, the cash receipts and payments from these derivatives have been reclassified from an operating cash flow to an investing or financing cash flow depending on the nature of the hedged item.
Changes to classification of non-cash currency effects
Non-cash currency exchange gains and losses and currency translation effects previously presented as part of the individual line items within Cash flows provided by operating activities have been reclassified into the line item Gain/loss on foreign currency transactions and balances. This to better distinguish changes in items relating to operating activities, i.e. decrease/increase in working capital, from the balance sheet impact of non-cash currency effects.
Changes to classification related to working capital items
Certain items that previously has been presented as part of change in working capital has been reclassified to other items related to operating activities if the nature of the item is non-cash provisions.
224 Equinor, Annual Report on Form 20-F 2018
CONSOLIDATED STATEMENT OF CASH FLOWS | | | | |
| | | |
| | 2017 | 2017 | 2017 |
(in USD million) | Note | as reported | changes in presentation | as restated |
| | | | |
Income/(loss) before tax | | 13,420 | | 13,420 |
| | | | |
Depreciation, amortisation and net impairment losses | 10 | 8,644 | | 8,644 |
Exploration expenditures written off | 11 | (8) | | (8) |
(Gains) losses on foreign currency transactions and balances | | (453) | 326 | (127) |
(Gains) losses on sales of assets and businesses | 4 | 395 | | 395 |
(Increase) decrease in other items related to operating activities | | (391) | (493) | (884) |
(Increase) decrease in net derivative financial instruments | 26 | (596) | 615 | 19 |
Interest received | | 282 | (134) | 148 |
Interest paid | | (622) | | (622) |
| | | | |
Cash flows provided by operating activities before taxes paid and working capital items | | 20,671 | 314 | 20,985 |
| | | | |
Taxes paid | | (5,766) | | (5,766) |
| | | | |
(Increase) decrease in working capital | | (542) | 125 | (417) |
| | | | |
Cash flows provided by operating activities | | 14,363 | 439 | 14,802 |
| | | | |
Cash used in business combinations | 4 | 0 | | 0 |
Capital expenditures and investments | | (10,755) | | (10,755) |
(Increase) decrease in financial investments | | 592 | | 592 |
(Increase) decrease in derivative financial instruments | | | (439) | (439) |
(Increase) decrease in other items interest bearing | | 79 | | 79 |
Proceeds from sale of assets and businesses | 4 | 406 | | 406 |
| | | | |
Cash flows used in investing activities | | (9,678) | (439) | (10,117) |
| | | | |
New finance debt | 18 | 0 | | 0 |
Repayment of finance debt | | (4,775) | | (4,775) |
Dividend paid | 17 | (1,491) | | (1,491) |
Net current finance debt and other | | 444 | | 444 |
| | | | |
Cash flows provided by (used in) financing activities | 18 | (5,822) | | (5,822) |
| | | | |
Net increase (decrease) in cash and cash equivalents | | (1,137) | | (1,137) |
| | | | |
Effect of exchange rate changes on cash and cash equivalents | | 436 | | 436 |
Cash and cash equivalents at the beginning of the period (net of overdraft) | 16 | 5,090 | | 5,090 |
| | | | |
Cash and cash equivalents at the end of the period (net of overdraft) | 16 | 4,390 | | 4,390 |
| | | | |
Equinor, Annual Report on Form 20-F 2018 225
CONSOLIDATED STATEMENT OF CASH FLOWS | | | | |
| | | | |
| | 2016 | 2016 | 2016 |
(in USD million) | Note | as reported | changes in presentation | as restated |
| | | | |
Income/(loss) before tax | | (178) | | (178) |
| | | | |
Depreciation, amortisation and net impairment losses | 10 | 11,550 | | 11,550 |
Exploration expenditures written off | 11 | 1,800 | | 1,800 |
(Gains) losses on foreign currency transactions and balances | | (137) | 257 | 120 |
(Gains) losses on sales of assets and businesses | 4 | (110) | | (110) |
(Increase) decrease in other items related to operating activities | | 1,076 | (199) | 877 |
(Increase) decrease in net derivative financial instruments | 26 | 1,307 | (109) | 1,198 |
Interest received | | 280 | (146) | 134 |
Interest paid | | (548) | | (548) |
| | | | |
Cash flows provided by operating activities before taxes paid and working capital items | | 15,040 | (197) | 14,843 |
| | | | |
Taxes paid | | (4,386) | | (4,386) |
| | | | |
(Increase) decrease in working capital | | (1,620) | (19) | (1,639) |
| | | | |
Cash flows provided by operating activities | | 9,034 | (216) | 8,818 |
| | | | |
Capital expenditures and investments | | (12,191) | | (12,191) |
(Increase) decrease in financial investments | | 877 | | 877 |
(Increase) decrease in derivative financial instruments | | | 216 | 216 |
(Increase) decrease in other items interest bearing | | 107 | | 107 |
Proceeds from sale of assets and businesses | 4 | 761 | | 761 |
| | | | |
Cash flows used in investing activities | | (10,446) | 216 | (10,230) |
| | | | |
New finance debt | 18 | 1,322 | | 1,322 |
Repayment of finance debt | | (1,072) | | (1,072) |
Dividend paid | 17 | (1,876) | | (1,876) |
Net current finance debt and other | | (333) | | (333) |
| | | | |
Cash flows provided by (used in) financing activities | 18 | (1,959) | | (1,959) |
| | | | |
Net increase (decrease) in cash and cash equivalents | | (3,371) | | (3,371) |
| | | | |
Effect of exchange rate changes on cash and cash equivalents | | (152) | | (152) |
Cash and cash equivalents at the beginning of the period (net of overdraft) | 16 | 8,613 | | 8,613 |
| | | | |
Cash and cash equivalents at the end of the period (net of overdraft) | 16 | 5,090 | | 5,090 |
| | | | |
226 Equinor, Annual Report on Form 20-F 2018
Change in accounting for lifting imbalances
Equinor voluntarily changed its policy for recognition of revenue from the production of oil and gas properties in which Equinor shares an interest with other companies. Prior to 2018, Equinor recognised revenue on the basis of volumes lifted and sold to customers during the period (the sales method). Under the new method, during 2018 Equinor has recognised revenues according to Equinor’s ownership in producing fields, where the accounting for the imbalances is presented as Other revenue. This voluntary change in policy has been made because it better reflects Equinor’s operational performance, and at the time of the decision also increased comparability with the financial reporting of Equinor’s peers. The change in policy affects the timing of revenue recognition from oil and gas production; however, the implementation impact recognised in the first quarter of 2018 was immaterial. Equinor’s equity as at 1 January 2018 has consequently not been adjusted upon the change in policy, and comparative figures have not been restated. For information on the method to be applied by Equinor in accounting for lifting imbalances as of 1 January 2019, reference is made to note 2 Significant accounting policies.
28 Condensed consolidated financial information related to guaranteed debt securities
Equinor Energy AS, a 100% owned subsidiary of Equinor ASA, is the co-obligor of certain existing debt securities of Equinor ASA that are registered under the US Securities Act of 1933 ("US registered debt securities"). As co-obligor, Equinor Energy AS fully, unconditionally and irrevocably assumes and agrees to perform, jointly and severally with Equinor ASA, the payment and covenant obligations for these US registered debt securities. In the future, Equinor ASA may from time to time issue future US registered debt securities for which Equinor Energy AS will be the co-obligor or guarantor.
The following financial information on a condensed consolidated basis provides financial information about Equinor ASA, as issuer, and Equinor Energy AS, as co-obligor and guarantor, and all other subsidiaries as required by SEC Rule 3-10 of Regulation S-X. The condensed consolidated information is prepared in accordance with Equinor's IFRS accounting policies as described in note 2 Significant accounting policies, except that investments in subsidiaries and jointly controlled entities are accounted for using the equity method as required by Rule 3-10.
The following is condensed consolidated financial information for the full year 2018, 2017 and 2016, and as of 31 December 2018 and 2017.
CONDENSED CONSOLIDATED STATEMENT OF INCOME AND OTHER COMPREHENSIVE INCOME |
| Equinor ASA | Equinor Energy AS | Non-guarantor subsidiaries | Consolidation adjustments | The Equinor group |
Full year 2018 (in USD million) |
| | | | | |
Revenues and other income | 51,567 | 25,365 | 29,374 | (27,004) | 79,301 |
Net income/(loss) from equity accounted companies | 7,832 | 1,065 | 262 | (8,868) | 291 |
| | | | | |
Total revenues and other income | 59,399 | 26,430 | 29,636 | (35,872) | 79,593 |
| | | | | |
Total operating expenses | (51,596) | (10,138) | (24,862) | 27,140 | (59,456) |
| | | | | |
Net operating income/(loss) | 7,803 | 16,292 | 4,774 | (8,732) | 20,137 |
| | | | | |
Net financial items | (1,300) | (274) | (505) | 817 | (1,263) |
| | | | | |
Income/(loss) before tax | 6,503 | 16,018 | 4,269 | (7,916) | 18,874 |
| | | | | |
Income tax | 219 | (10,719) | (786) | (49) | (11,335) |
| | | | | |
Net income/(loss) | 6,722 | 5,299 | 3,483 | (7,965) | 7,538 |
| | | | | |
Other comprehensive income/(loss) | (867) | (334) | (620) | 140 | (1,681) |
| | | | | |
Total comprehensive income/(loss) | 5,855 | 4,965 | 2,863 | (7,825) | 5,857 |
Equinor, Annual Report on Form 20-F 2018 227
CONDENSED CONSOLIDATED STATEMENT OF INCOME AND OTHER COMPREHENSIVE INCOME |
| Equinor ASA | Equinor Energy AS | Non-guarantor subsidiaries | Consolidation adjustments | The Equinor group |
Full year 2017 (in USD million) |
| | | | | |
Revenues and other income | 39,750 | 20,579 | 22,204 | (21,535) | 60,999 |
Net income/(loss) from equity accounted companies | 5,051 | (401) | 33 | (4,495) | 188 |
| | | | | |
Total revenues and other income | 44,801 | 20,178 | 22,237 | (26,029) | 61,187 |
| | | | | |
Total operating expenses | (39,570) | (9,217) | (20,022) | 21,392 | (47,416) |
| | | | | |
Net operating income/(loss) | 5,232 | 10,961 | 2,216 | (4,637) | 13,771 |
| | | | | |
Net financial items | 311 | (378) | 439 | (724) | (351) |
| | | | | |
Income/(loss) before tax | 5,543 | 10,583 | 2,655 | (5,361) | 13,420 |
| | | | | |
Income tax | (230) | (8,094) | (539) | 40 | (8,822) |
| | | | | |
Net income/(loss) | 5,314 | 2,489 | 2,116 | (5,321) | 4,598 |
| | | | | |
Other comprehensive income/(loss) | 1,017 | 355 | 878 | (509) | 1,741 |
| | | | | |
Total comprehensive income/(loss) | 6,330 | 2,843 | 2,995 | (5,830) | 6,339 |
CONDENSED CONSOLIDATED STATEMENT OF INCOME AND OTHER COMPREHENSIVE INCOME |
| Equinor ASA | Equinor Energy AS | Non-guarantor subsidiaries | Consolidation adjustments | The Equinor group |
Full year 2016 (in USD million) |
| | | | | |
Revenues and other income | 31,580 | 15,405 | 15,472 | (16,464) | 45,993 |
Net income/(loss) from equity accounted companies | (2,726) | (3,987) | 26 | 6,567 | (119) |
| | | | | |
Total revenues and other income | 28,854 | 11,418 | 15,498 | (9,898) | 45,873 |
| | | | | |
Total operating expenses | (31,784) | (10,989) | (19,364) | 16,344 | (45,793) |
| | | | | |
Net operating income/(loss) | (2,930) | 429 | (3,865) | 6,446 | 80 |
| | | | | |
Net financial items | 728 | (560) | (115) | (311) | (258) |
| | | | | |
Income/(loss) before tax | (2,202) | (131) | (3,980) | 6,135 | (178) |
| | | | | |
Income tax | (407) | (2,392) | 97 | (23) | (2,724) |
| | | | | |
Net income/(loss) | (2,608) | (2,523) | (3,884) | 6,113 | (2,902) |
| | | | | |
Other comprehensive income/(loss) | (671) | 153 | (280) | 441 | (357) |
| | | | | |
Total comprehensive income/(loss) | (3,279) | (2,370) | (4,163) | 6,553 | (3,259) |
228 Equinor, Annual Report on Form 20-F 2018
CONDENSED CONSOLIDATED BALANCE SHEET |
| Equinor ASA | Equinor Energy AS | Non-guarantor subsidiaries | Consolidation adjustments | The Equinor group |
At 31 December 2018 (in USD million) |
| | | | | |
ASSETS | | | | | |
Property, plant, equipment and intangible assets | 502 | 33,309 | 41,140 | (17) | 74,934 |
Equity accounted companies | 46,828 | 23,668 | 1,697 | (69,330) | 2,863 |
Other non-current assets | 2,741 | 381 | 5,572 | (39) | 8,655 |
Non-current receivables from subsidiaries | 25,524 | (0) | 22 | (25,547) | 0 |
| | | | | |
Total non-current assets | 75,595 | 57,358 | 48,432 | (94,933) | 86,452 |
| | | | | |
Current receivables from subsidiaries | 2,379 | 6,529 | 13,215 | (22,123) | 0 |
Other current assets | 13,082 | 927 | 4,780 | (288) | 18,501 |
Cash and cash equivalents | 6,287 | 27 | 1,242 | 0 | 7,556 |
| | | | | |
Total current assets | 21,747 | 7,483 | 19,237 | (22,411) | 26,056 |
| | | | | |
| | | | | |
Total assets | 97,342 | 64,841 | 67,668 | (117,343) | 112,508 |
| | | | | |
EQUITY AND LIABILITIES | | | | | |
Total equity | 42,970 | 26,706 | 42,838 | (69,524) | 42,990 |
| | | | | |
Non-current liabilities to subsidiaries | 20 | 13,847 | 11,679 | (25,547) | (0) |
Other non-current liabilities | 28,416 | 17,033 | 7,536 | (71) | 52,914 |
| | | | | |
Total non-current liabilities | 28,436 | 30,880 | 19,216 | (25,618) | 52,914 |
| | | | | |
Other current liabilities | 6,955 | 6,511 | 3,216 | (78) | 16,605 |
Current liabilities to subsidiaries | 18,981 | 744 | 2,398 | (22,123) | (0) |
| | | | | |
Total current liabilities | 25,936 | 7,256 | 5,614 | (22,201) | 16,605 |
| | | | | |
| | | | | |
Total liabilities | 54,372 | 38,135 | 24,830 | (47,819) | 69,519 |
| | | | | |
Total equity and liabilities | 97,342 | 64,841 | 67,668 | (117,343) | 112,508 |
Equinor, Annual Report on Form 20-F 2018 229
CONDENSED CONSOLIDATED BALANCE SHEET |
| Equinor ASA | Equinor Energy AS | Non-guarantor subsidiaries | Consolidation adjustments | The Equinor group |
At 31 December 2017 (in USD million) |
| | | | | |
ASSETS | | | | | |
Property, plant, equipment and intangible assets | 541 | 32,956 | 38,786 | (25) | 72,258 |
Equity accounted companies | 42,625 | 21,593 | 1,311 | (62,978) | 2,551 |
Other non-current assets | 3,851 | 346 | 4,989 | (84) | 9,102 |
Non-current receivables from subsidiaries | 25,896 | (0) | 22 | (25,918) | 0 |
| | | | | |
Total non-current assets | 72,914 | 54,895 | 45,107 | (89,005) | 83,911 |
| | | | | |
Current receivables from subsidiaries | 2,448 | 2,615 | 14,215 | (19,278) | 0 |
Other current assets | 16,165 | 923 | 5,582 | (1,240) | 21,430 |
Cash and cash equivalents | 3,759 | 27 | 603 | 0 | 4,390 |
| | | | | |
Total current assets | 22,372 | 3,566 | 20,400 | (20,517) | 25,820 |
| | | | | |
Assets classified as held for sale | 0 | 0 | 1,369 | 0 | 1,369 |
| | | | | |
Total assets | 95,286 | 58,460 | 66,876 | (109,523) | 111,100 |
| | | | | |
EQUITY AND LIABILITIES | | | | | |
Total equity | 39,861 | 20,813 | 42,634 | (63,422) | 39,885 |
| | | | | |
Non-current liabilities to subsidiaries | 19 | 14,682 | 11,263 | (25,964) | 0 |
Other non-current liabilities | 29,070 | 16,145 | 7,104 | (122) | 52,197 |
| | | | | |
Total non-current liabilities | 29,090 | 30,827 | 18,367 | (26,086) | 52,198 |
| | | | | |
Other current liabilities | 9,242 | 5,879 | 4,632 | (736) | 19,017 |
Current liabilities to subsidiaries | 17,094 | 941 | 1,243 | (19,278) | 0 |
| | | | | |
Total current liabilities | 26,335 | 6,821 | 5,874 | (20,014) | 19,017 |
| | | | | |
| | | | | |
Total liabilities | 55,425 | 37,648 | 24,242 | (46,100) | 71,214 |
| | | | | |
Total equity and liabilities | 95,286 | 58,460 | 66,876 | (109,523) | 111,100 |
230 Equinor, Annual Report on Form 20-F 2018
CONDENSED CONSOLIDATED CASH FLOW STATEMENT |
| Equinor ASA | Equinor Energy AS | Non-guarantor subsidiaries | Consolidation adjustments | The Equinor group |
Full year 2018 (in USD million) |
| | | | | |
Cash flows provided by (used in) operating activities | 4,565 | 12,421 | 7,224 | (4,516) | 19,694 |
Cash flows provided by (used in) investing activities | 1,046 | (8,281) | (6,649) | 2,672 | (11,212) |
Cash flows provided by (used in) financing activities | (2,840) | (4,140) | 112 | 1,844 | (5,024) |
| | | | | |
Net increase (decrease) in cash and cash equivalents | 2,771 | 0 | 687 | 0 | 3,458 |
| | | | | |
Effect of exchange rate changes on cash and cash equivalents | (243) | 0 | (49) | 0 | (292) |
Cash and cash equivalents at the beginning of the period (net of overdraft) | 3,759 | 27 | 603 | 0 | 4,390 |
| | | | | |
Cash and cash equivalents at the end of the period (net of overdraft) | 6,287 | 27 | 1,242 | 0 | 7,556 |
| | | | | |
| | | | | |
| Equinor ASA | Equinor Energy AS | Non-guarantor subsidiaries | Consolidation adjustments | The Equinor group |
Full year 2017 (in USD million) (restated*) |
| | | | | |
Cash flows provided by (used in) operating activities | 339 | 9,506 | 5,242 | (286) | 14,802 |
Cash flows provided by (used in) investing activities | 3,227 | (9,070) | (4,718) | 444 | (10,117) |
Cash flows provided by (used in) financing activities | (4,459) | (478) | (727) | (158) | (5,822) |
| | | | | |
Net increase (decrease) in cash and cash equivalents | (892) | (42) | (203) | 0 | (1,137) |
| | | | | |
Effect of exchange rate changes on cash and cash equivalents | 377 | 23 | 36 | 0 | 436 |
Cash and cash equivalents at the beginning of the period (net of overdraft) | 4,274 | 46 | 770 | 0 | 5,090 |
| | | | | |
Cash and cash equivalents at the end of the period (net of overdraft) | 3,759 | 27 | 603 | 0 | 4,390 |
| | | | | |
| | | | | |
| Equinor ASA | Equinor Energy AS | Non-guarantor subsidiaries | Consolidation adjustments | The Equinor group |
Full year 2016 (in USD million) (restated*) |
| | | | | |
Cash flows provided by (used in) operating activities | 3,158 | 7,262 | 1,517 | (3,119) | 8,818 |
Cash flows provided by (used in) investing activities | (2,966) | (6,785) | (5,349) | 4,869 | (10,230) |
Cash flows provided by (used in) financing activities | (3,308) | (516) | 3,616 | (1,750) | (1,959) |
| | | | | |
Net increase (decrease) in cash and cash equivalents | (3,116) | (39) | (216) | 0 | (3,371) |
| | | | | |
Effect of exchange rate changes on cash and cash equivalents | (81) | (2) | (69) | 0 | (152) |
Cash and cash equivalents at the beginning of the period (net of overdraft) | 7,471 | 87 | 1,056 | 0 | 8,613 |
| | | | | |
Cash and cash equivalents at the end of the period (net of overdraft) | 4,274 | 46 | 770 | 0 | 5,090 |
| | | | | |
* Related to a change in accounting policies, see note 27 Changes in accounting policies for more information |
Equinor, Annual Report on Form 20-F 2018 231
4.2 Supplementary oil and gas information (unaudited)
In accordance with the US Financial Accounting Standards Board Accounting Standards Codification "Extractive Activities - Oil and Gas" (Topic 932), Equinor is reporting certain supplemental disclosures about oil and gas exploration and production operations. While this information is developed with reasonable care and disclosed in good faith, it is emphasised that some of the data is necessarily imprecise and represents only approximate amounts because of the subjective judgement involved in developing such information. Accordingly, this information may not necessarily represent the present financial condition of Equinor or its expected future results.
For further information regarding the reserves estimation requirement, see note 2 Significant accounting policies - Critical accounting judgements and key sources of estimation uncertainty - Proved oil and gas reserves within the Consolidated financial statements.
No new events have occurred since 31 December 2018 that would result in a significant change in the estimated proved reserves or other figures reported as of that date.
For information related to the Agbami redetermination process and the dispute between the Nigerian National Petroleum Corporation and the partners in Oil Mining Lease (OML) 128 concerning certain terms of the OML 128 Production Sharing Contract (PSC), see note 24 Other commitments, contingent liabilities and contingent assets to the Consolidated financial statements. The effect of this redetermination on the proved reserves, which is estimated to be less than 10 million boe, is not yet included.
In Algeria, an amendment to the In Amenas production sharing contract has been approved, extending the contract by five years from 2022 to 2027, and adding new proved reserves included as a revision.
Oil and gas reserve quantities
Equinor's proved oil and gas reserves have been estimated by its qualified professionals in accordance with industry standards under the requirements of the US Securities and Exchange Commission (SEC), Rule 4-10 of Regulation S-X. Statements of reserves are forward-looking statements. Proved oil and gas reserves are those quantities of oil and gas, which, by analysis of geoscience and engineering data, can be estimated with reasonable certainty to be economically producible—from a given date forward, from known reservoirs, and under existing economic conditions, operating methods, and government regulations—prior to the time at which contracts providing the right to operate expire, unless evidence indicates that renewal is reasonably certain, regardless of whether deterministic or probabilistic methods are used for the estimation. The project to extract the hydrocarbons must have commenced or the operator must be reasonably certain that it will commence the project within a reasonable time.
The determination of these reserves is part of an ongoing process subject to continual revision as additional information becomes available. Estimates of proved reserve quantities are imprecise and change over time as new information becomes available. Moreover, identified reserves and contingent resources that may become proved in the future are excluded from the calculations.
Equinor's proved reserves are recognised under various forms of contractual agreements, including production sharing agreements (PSAs) where Equinor's share of reserves can vary due to commodity prices or other factors. Reserves from agreements such as PSAs and buy back agreements are based on the volumes to which Equinor has access (cost oil and profit oil), limited to available market access. At 31 December 2018, 5% of total proved reserves were related to such agreements (9% of total oil, condensate and natural gas liquids (NGL) reserves and 1% of total gas reserves). This compares with 6% and 7% of total proved reserves for 2017 and 2016, respectively. Net entitlement oil and gas production from fields with such agreements was 83 million boe during 2018 (94 million boe for 2017 and 96 million boe for 2016). Equinor participates in such agreements in Algeria, Angola, Azerbaijan, Libya, Nigeria and Russia.
Equinor is recording, as proved reserves, volumes equivalent to our tax liabilities under negotiated fiscal arrangements (PSAs) where the tax is paid on behalf of Equinor. Reserves are net of royalty oil paid in-kind and quantities consumed during production.
Rule 4-10 of Regulation S-X requires that the estimation of reserves is based on existing economic conditions, including a 12-month average price determined as an unweighted arithmetic average of the first-of-the month price for each month within the reporting period, unless prices are defined by contractual arrangements. The proved reserves at year end 2018 have been determined based on a Brent blend price equivalent of USD 71.59/bbl, compared to USD 54.32 and USD 42.82/bbl for 2017 and 2016 respectively. The volume weighted average gas price for proved reserves at year end 2018 was USD 6.19/mmBtu. The comparable gas price used to determine gas reserves at year end 2017 and 2016 was USD 4.65/mmBtu and USD 4.50/mmBtu, respectively. The volume weighted average NGL price for proved reserves at year end 2018 was USD 39.81/boe. The corresponding NGL price used to determine NGL reserves at year end 2017 and 2016 was USD 32.02/boe and USD 24.85/boe, respectively. The increase in commodity prices affects the profitable reserves to be recovered from accumulations, resulting in increased reserves. The positive revisions due to price are in general a result of extended economic cut-off. For fields with a production-sharing type of agreement this is to some degree offset by lower entitlement to the reserves. These changes are all included in the revision category in the tables below, giving a net increase of Equinor’s proved reserves at year end.
From the Norwegian continental shelf (NCS), Equinor is responsible for managing, transporting and selling the Norwegian State's oil and gas on behalf of the Norwegian State's direct financial interest (SDFI). These reserves are sold in conjunction with the Equinor reserves. As part of this
232 Equinor, Annual Report on Form 20-F 2018
arrangement, Equinor delivers and sells gas to customers in accordance with various types of sales contracts on behalf of the SDFI. In order to fulfil the commitments, Equinor utilises a field supply schedule which provides the highest possible total value for the joint portfolio of oil and gas between Equinor and the SDFI.
Equinor and the SDFI receive income from the joint natural gas sales portfolio based upon their respective share in the supplied volumes. For sales of the SDFI natural gas, to Equinor and to third parties, the payment to the Norwegian State is based on achieved prices, a net back formula calculated price or market value. All of the Norwegian State's oil and NGL is acquired by Equinor. The price Equinor pays to the SDFI for the crude oil is based on market reflective prices. The prices for NGL are either based on achieved prices, market value or market reflective prices.
The regulations of the owner's instruction, as described above, may be changed or withdrawn by the Equinor ASA's general meeting. Due to this uncertainty and the Norwegian State's estimate of proved reserves not being available to Equinor, it is not possible to determine the total quantities to be purchased by Equinor under the owner's instruction.
Topic 932 requires the presentation of reserves and certain other supplemental oil and gas disclosures by geographic area, defined as country or continent containing 15% or more of total proved reserves. At 31 December 2018 Norway is the only country in this category, with 73% of the total proved reserves. Since the US contained 16% of the Proved reserves in 2017, management has determined that the most meaningful presentation of geographic areas also in 2018 would be Norway, US, and the continents of Eurasia (excluding Norway), Africa, and Americas (excluding US).
The following tables reflect the estimated proved reserves of oil and gas at 31 December 2015 through 2018, and the changes therein.
The reason for the most significant changes to our proved reserves at year end 2018 were:
· Revisions of previously booked reserves, including the effect of improved recovery, increased the proved reserves by 479 million boe in 2018. This includes the effect of the increased commodity prices, increasing the proved reserves by approximately 275 million boe through extended economic life time on several fields. Many producing fields also have positive revisions due to better performance, maturing of new wells and improved recovery projects, as well as reduced uncertainty due to further drilling and production experience. About two thirds of the total revisions come from fields in Norway, where many of the larger offshore fields continue to decline less than previously assumed for the proved reserves. This category also includes additional volumes at In Amenas in Algeria, where the production sharing agreement has been extended by 5 years
· A total of 848 million boe of new proved reserves are added through extensions and new discoveries booking proved reserves for the first time. The largest addition comes from the Troll field in Norway, where the Troll Phase 3 development project was sanctioned in 2018. Through this project, production from the Troll West reservoir which has previously focused on optimising recovery of the oil in this part of the reservoir, will now be extended vertically to also include recovery from the overlying gas cap. Sanctioning of the Johan Sverdrup phase 2 development in Norway and the Vito field development in the US Gulf of Mexico, also add significant volumes. In addition, this category includes extensions of the proved areas through drilling of new wells in previously undrilled areas in the US onshore plays and at some producing fields offshore Norway. New discoveries with proved reserves booked in 2018 are all expected to start production within a period of five years
· A total of 196 million boe of new proved reserves were purchased in 2018. This primarily includes the purchase of a 25% interest in the Roncador field offshore Brazil and an additional 51% interest in the Martin Linge field offshore Norway. In addition, this category includes minor volumes related to ownership changes in some US onshore assets (<1 million boe).
· Sale of 2 million boe of proved reserves from the Alba field in the UK and Flyndre in Norway
· The 2018 entitlement production was 713 million boe, an increase of 1.3% compared to 2017
Changes to the proved reserves in 2018 are also described in some detail by each geographic area in section 2.8 Operational performance, Proved oil and gas reserves. Development of the proved reserves are described in section 2.8 Operational performance, Development of reserves.
Equinor, Annual Report on Form 20-F 2018 233
| Consolidated companies | Equity accounted | Total |
| Norway | Eurasia excluding Norway | Africa | US | Americas excluding US | Subtotal | Norway | Eurasia excluding Norway | Americas excluding US | Subtotal | Total |
Net proved oil and condensate reserves in million barrels oil equivalent | | | | | | | | | | | |
At 31 December 2015 | 1,216 | 76 | 278 | 285 | 189 | 2,045 | - | - | 46 | 46 | 2,091 |
| | | | | | | | | | | |
Revisions and improved recovery | 111 | 6 | 16 | 7 | 10 | 149 | - | - | (12) | (12) | 137 |
Extensions and discoveries | 29 | - | - | 45 | 4 | 78 | - | - | - | - | 78 |
Purchase of reserves-in-place | - | - | - | - | - | - | 60 | 0 | - | 60 | 60 |
Sales of reserves-in-place | (14) | - | - | - | - | (14) | - | - | - | - | (14) |
Production | (169) | (12) | (72) | (34) | (26) | (313) | (2) | (0) | (4) | (6) | (320) |
| | | | | | | | | | | |
At 31 December 2016 | 1,174 | 71 | 221 | 303 | 177 | 1,945 | 58 | - | 30 | 88 | 2,033 |
| | | | | | | | | | | |
Revisions and improved recovery | 212 | 2 | 32 | 55 | 54 | 354 | 1 | 0 | (28) | (27) | 327 |
Extensions and discoveries | 159 | - | - | 31 | 65 | 256 | - | - | - | - | 256 |
Purchase of reserves-in-place | - | 34 | - | - | - | 34 | - | - | - | - | 34 |
Sales of reserves-in-place | - | - | - | - | (38) | (38) | - | - | - | - | (38) |
Production | (165) | (10) | (68) | (38) | (21) | (302) | (6) | (0) | (2) | (8) | (310) |
| | | | | | | | | | | |
At 31 December 2017 | 1,380 | 97 | 185 | 351 | 237 | 2,249 | 53 | - | - | 53 | 2,302 |
| | | | | | | | | | | |
Revisions and improved recovery | 114 | 36 | 35 | 7 | 60 | 251 | 4 | - | - | 4 | 256 |
Extensions and discoveries | 99 | - | 3 | 59 | - | 161 | 10 | - | - | 10 | 171 |
Purchase of reserves-in-place | 21 | - | - | 2 | 111 | 133 | - | - | - | - | 133 |
Sales of reserves-in-place | (0) | (2) | - | (0) | - | (2) | - | - | - | - | (2) |
Production | (155) | (8) | (57) | (48) | (29) | (298) | (5) | - | - | (5) | (303) |
| | | | | | | | | | | |
At 31 December 2018 | 1,458 | 124 | 165 | 371 | 378 | 2,496 | 62 | - | - | 62 | 2,558 |
234 Equinor, Annual Report on Form 20-F 2018
| Consolidated companies | Equity accounted | Total |
| Norway | Eurasia excluding Norway | Africa | US | Americas excluding US | Subtotal | Norway | Eurasia excluding Norway | Americas excluding US | Subtotal | Total |
Net proved NGL reserves in million barrels oil equivalent | | | | | | | | | | | |
At 31 December 2015 | 291 | - | 15 | 57 | - | 364 | - | - | - | - | 364 |
| | | | | | | | | | | |
Revisions and improved recovery | 37 | - | 3 | 6 | - | 46 | - | - | - | - | 46 |
Extensions and discoveries | 5 | - | - | 13 | - | 18 | - | - | - | - | 18 |
Purchase of reserves-in-place | - | - | - | - | - | - | 2 | - | - | 2 | 2 |
Sales of reserves-in-place | (0) | - | - | - | - | (0) | - | - | - | - | (0) |
Production | (46) | - | (2) | (9) | - | (58) | (0) | - | - | (0) | (58) |
| | | | | | | | | | | |
At 31 December 2016 | 287 | - | 16 | 67 | - | 370 | 2 | - | - | 2 | 372 |
| | | | | | | | | | | |
Revisions and improved recovery | 31 | - | (2) | 6 | 0 | 36 | (1) | - | - | (1) | 35 |
Extensions and discoveries | 8 | - | - | 25 | - | 33 | - | - | - | - | 33 |
Purchase of reserves-in-place | - | - | - | - | - | - | - | - | - | - | - |
Sales of reserves-in-place | - | - | - | - | - | - | - | - | - | - | - |
Production | (48) | - | (4) | (9) | (0) | (61) | - | - | - | - | (61) |
| | | | | | | | | | | |
At 31 December 2017 | 278 | - | 10 | 90 | - | 378 | 1 | - | - | 1 | 379 |
| | | | | | | | | | | |
Revisions and improved recovery | 25 | - | 15 | (9) | - | 30 | (0) | - | - | (0) | 30 |
Extensions and discoveries | 21 | - | - | 16 | - | 37 | 0 | - | - | 0 | 37 |
Purchase of reserves-in-place | 8 | - | - | 0 | - | 8 | - | - | - | - | 8 |
Sales of reserves-in-place | - | - | - | (0) | - | (0) | - | - | - | - | (0) |
Production | (46) | - | (4) | (12) | - | (62) | (0) | - | - | (0) | (62) |
| | | | | | | | | | | |
At 31 December 2018 | 286 | - | 21 | 85 | - | 392 | 1 | - | - | 1 | 393 |
Equinor, Annual Report on Form 20-F 2018 235
| Consolidated companies | Equity accounted | Total |
| Norway | Eurasia excluding Norway | Africa | US | Americas excluding US | Subtotal | Norway | Eurasia excluding Norway | Americas excluding US | Subtotal | Total |
Net proved gas reserves in billion standard cubic feet | | | | | | | | | | | |
At 31 December 2015 | 12,942 | 193 | 366 | 1,123 | - | 14,624 | - | - | - | - | 14,624 |
| | | | | | | | | | | |
Revisions and improved recovery | 1,160 | 29 | (25) | 101 | 0 | 1,265 | - | - | - | - | 1,265 |
Extensions and discoveries | 78 | - | - | 384 | - | 462 | - | - | - | - | 462 |
Purchase of reserves-in-place | - | - | - | - | - | - | 16 | 0 | - | 16 | 16 |
Sales of reserves-in-place | (5) | - | - | (65) | - | (70) | - | - | - | - | (70) |
Production | (1,338) | (34) | (60) | (226) | (0) | (1,659) | (1) | (0) | - | (2) | (1,661) |
| | | | | | | | | | | |
At 31 December 2016 | 12,836 | 188 | 280 | 1,318 | - | 14,623 | 15 | - | - | 15 | 14,637 |
| | | | | | | | | | | |
Revisions and improved recovery | 824 | 13 | 102 | 425 | 0 | 1,363 | (1) | 0 | - | (1) | 1,363 |
Extensions and discoveries | 198 | - | - | 659 | - | 857 | - | - | - | - | 857 |
Purchase of reserves-in-place | - | - | - | 90 | - | 90 | - | - | - | - | 90 |
Sales of reserves-in-place | - | - | - | - | - | - | - | - | - | - | - |
Production | (1,515) | (41) | (72) | (240) | (0) | (1,868) | (4) | (0) | - | (5) | (1,873) |
| | | | | | | | | | | |
At 31 December 2017 | 12,343 | 159 | 310 | 2,252 | - | 15,064 | 9 | - | - | 9 | 15,073 |
| | | | | | | | | | | |
Revisions and improved recovery | 1,033 | 15 | 40 | (9) | 0 | 1,079 | 3 | - | - | 3 | 1,082 |
Extensions and discoveries | 3,141 | - | - | 446 | - | 3,587 | 2 | - | - | 2 | 3,588 |
Purchase of reserves-in-place | 274 | - | - | 3 | 26 | 303 | - | - | - | - | 303 |
Sales of reserves-in-place | (0) | - | - | (0) | - | (0) | - | - | - | - | (0) |
Production | (1,502) | (39) | (84) | (318) | (5) | (1,949) | (4) | - | - | (4) | (1,953) |
| | | | | | | | | | | |
At 31 December 2018 | 15,290 | 134 | 266 | 2,373 | 20 | 18,084 | 10 | - | - | 10 | 18,094 |
236 Equinor, Annual Report on Form 20-F 2018
| Consolidated companies | Equity accounted | Total |
| Norway | Eurasia excluding Norway | Africa | US | Americas excluding US | Subtotal | Norway | Eurasia excluding Norway | Americas excluding US | Subtotal | Total |
Net proved reserves in million barrels oil equivalent | | | | | | | | | | | |
At 31 December 2015 | 3,814 | 111 | 358 | 542 | 189 | 5,014 | - | - | 46 | 46 | 5,060 |
| | | | | | | | | | | |
Revisions and improved recovery | 355 | 11 | 14 | 31 | 10 | 421 | - | - | (12) | (12) | 409 |
Extensions and discoveries | 48 | - | - | 127 | 4 | 179 | - | - | - | - | 179 |
Purchase of reserves-in-place | - | - | - | - | - | - | 65 | 0 | - | 65 | 65 |
Sales of reserves-in-place | (15) | - | - | (11) | - | (27) | - | - | - | - | (27) |
Production | (454) | (18) | (85) | (83) | (26) | (666) | (3) | (0) | (4) | (7) | (673) |
| | | | | | | | | | | |
At 31 December 2016 | 3,748 | 104 | 287 | 605 | 177 | 4,921 | 62 | - | 30 | 92 | 5,013 |
| | | | | | | | | | | |
Revisions and improved recovery | 390 | 4 | 48 | 137 | 54 | 633 | 0 | 0 | (28) | (28) | 605 |
Extensions and discoveries | 202 | - | - | 174 | 65 | 441 | - | - | - | - | 441 |
Purchase of reserves-in-place | - | 34 | - | 16 | - | 50 | - | - | - | - | 50 |
Sales of reserves-in-place | - | - | - | - | (38) | (38) | - | - | - | - | (38) |
Production | (483) | (17) | (85) | (90) | (21) | (696) | (6) | (0) | (2) | (9) | (705) |
| | | | | | | | | | | |
At 31 December 2017 | 3,857 | 125 | 250 | 842 | 237 | 5,311 | 56 | - | (0) | 56 | 5,367 |
| | | | | | | | | | | |
Revisions and improved recovery | 323 | 39 | 57 | (4) | 60 | 474 | 5 | - | - | 5 | 479 |
Extensions and discoveries | 680 | - | 3 | 154 | - | 837 | 11 | - | - | 11 | 848 |
Purchase of reserves-in-place | 78 | - | - | 3 | 115 | 196 | - | - | - | - | 196 |
Sales of reserves-in-place | (0) | (2) | - | (0) | - | (2) | - | - | - | - | (2) |
Production | (469) | (15) | (76) | (116) | (30) | (707) | (6) | - | - | (6) | (713) |
| | | | | | | | | | | |
At 31 December 2018 | 4,468 | 148 | 233 | 879 | 382 | 6,110 | 66 | - | (0) | 66 | 6,175 |
Equinor, Annual Report on Form 20-F 2018 237
| Consolidated companies | Equity accounted | Total |
| Norway | Eurasia excluding Norway | Africa | US | Americas excluding US | Subtotal | Norway | Eurasia excluding Norway | Americas excluding US | Subtotal | Total |
Net proved oil and condensate reserves in million barrels oil equivalent | | | | | | | | | | | |
At 31 December 2015 | | | | | | | | | | | |
Developed | 505 | 48 | 248 | 163 | 119 | 1,083 | - | - | 21 | 21 | 1,104 |
Undeveloped | 711 | 29 | 30 | 122 | 70 | 962 | - | - | 25 | 25 | 987 |
At 31 December 2016 | | | | | | | | | | | |
Developed | 536 | 43 | 200 | 182 | 121 | 1,082 | 7 | - | 16 | 23 | 1,105 |
Undeveloped | 638 | 28 | 22 | 121 | 55 | 863 | 51 | - | 13 | 65 | 928 |
At 31 December 2017 | | | | | | | | | | | |
Developed | 514 | 55 | 173 | 252 | 118 | 1,112 | - | - | - | - | 1,112 |
Undeveloped | 866 | 42 | 12 | 99 | 119 | 1,138 | 53 | - | - | 53 | 1,191 |
At 31 December 2018 | | | | | | | | | | | |
Developed | 493 | 46 | 152 | 279 | 247 | 1,216 | 0 | - | - | 0 | 1,216 |
Undeveloped | 966 | 78 | 13 | 91 | 131 | 1,279 | 62 | - | - | 62 | 1,342 |
Net proved NGL reserves in million barrels oil equivalent | | | | | | | | | | | |
At 31 December 2015 | | | | | | | | | | | |
Developed | 235 | - | 9 | 45 | - | 290 | - | - | - | - | 290 |
Undeveloped | 56 | - | 6 | 12 | - | 74 | - | - | - | - | 74 |
At 31 December 2016 | | | | | | | | | | | |
Developed | 213 | - | 10 | 53 | - | 276 | 1 | - | - | 1 | 277 |
Undeveloped | 74 | - | 6 | 14 | - | 94 | 1 | - | - | 1 | 95 |
At 31 December 2017 | | | | | | | | | | | |
Developed | 199 | - | 10 | 68 | - | 278 | - | - | - | - | 278 |
Undeveloped | 78 | - | - | 21 | - | 100 | 1 | - | - | 1 | 101 |
At 31 December 2018 | | | | | | | | | | | |
Developed | 192 | - | 18 | 68 | - | 277 | 0 | - | - | 0 | 277 |
Undeveloped | 94 | - | 3 | 18 | - | 115 | 1 | - | - | 1 | 116 |
Net proved gas reserves in billion standard cubic feet | | | | | | | | | | | |
At 31 December 2015 | | | | | | | | | | | |
Developed | 10,664 | 32 | 206 | 999 | - | 11,901 | - | - | - | - | 11,901 |
Undeveloped | 2,278 | 161 | 160 | 124 | - | 2,723 | - | - | - | - | 2,723 |
At 31 December 2016 | | | | | | | | | | | |
Developed | 9,219 | 188 | 171 | 1,002 | - | 10,580 | 4 | - | - | 4 | 10,584 |
Undeveloped | 3,617 | - | 110 | 316 | - | 4,043 | 11 | - | - | 11 | 4,054 |
At 31 December 2017 | | | | | | | | | | | |
Developed | 8,852 | 159 | 273 | 1,675 | - | 10,958 | - | - | - | - | 10,958 |
Undeveloped | 3,492 | - | 37 | 577 | - | 4,106 | 9 | - | - | 9 | 4,115 |
At 31 December 2018 | | | | | | | | | | | |
Developed | 10,459 | 111 | 240 | 1,740 | 20 | 12,569 | 0 | - | - | 0 | 12,570 |
Undeveloped | 4,831 | 24 | 26 | 634 | - | 5,514 | 10 | - | - | 10 | 5,524 |
Net proved oil, condensate, NGL and gas reserves in million barrels oil equivalent | | | | | | | | | | | |
At 31 December 2015 | | | | | | | | | | | |
Developed | 2,641 | 53 | 294 | 386 | 119 | 3,494 | - | - | 21 | 21 | 3,515 |
Undeveloped | 1,173 | 57 | 64 | 156 | 70 | 1,521 | - | - | 25 | 25 | 1,546 |
At 31 December 2016 | | | | | | | | | | | |
Developed | 2,392 | 76 | 240 | 414 | 121 | 3,244 | 8 | - | 16 | 24 | 3,268 |
Undeveloped | 1,357 | 28 | 47 | 191 | 55 | 1,678 | 54 | - | 13 | 68 | 1,746 |
At 31 December 2017 | | | | | | | | | | | |
Developed | 2,290 | 83 | 231 | 619 | 118 | 3,342 | - | - | - | - | 3,342 |
Undeveloped | 1,567 | 42 | 19 | 223 | 119 | 1,969 | 56 | - | - | 56 | 2,025 |
At 31 December 2018 | | | | | | | | | | | |
Developed | 2,548 | 66 | 212 | 657 | 250 | 3,733 | 0 | - | - | 0 | 3,733 |
Undeveloped | 1,920 | 82 | 21 | 222 | 131 | 2,377 | 65 | - | - | 65 | 2,442 |
238 Equinor, Annual Report on Form 20-F 2018
The conversion rates used are 1 standard cubic meter = 35.3 standard cubic feet, 1 standard cubic meter oil equivalent = 6.29 barrels of oil equivalent (boe) and 1,000 standard cubic meter gas = 1 standard cubic meter oil equivalent.
Capitalised cost related to oil and gas producing activities |
Consolidated companies |
| At 31 December |
(in USD million) | 2018 | 2017 | 2016 |
| | | |
Unproved properties | 11,227 | 12,627 | 13,563 |
Proved properties, wells, plants and other equipment | 180,463 | 173,954 | 159,284 |
| | | |
Total capitalised cost | 191,690 | 186,581 | 172,847 |
Accumulated depreciation, impairment and amortisation | (122,803) | (120,170) | (109,160) |
| | | |
Net capitalised cost | 68,887 | 66,411 | 63,687 |
Net capitalised cost related to equity accounted investments as of 31 December 2018 was USD 1,446 million, USD 1,351 million in 2017 and USD 2,000 million in 2016. The reported figures are based on capitalised costs within the upstream segments in Equinor, in line with the description below for result of operations for oil and gas producing activities.
Expenditures incurred in oil and gas property acquisition, exploration and development activities |
These expenditures include both amounts capitalised and expensed. |
| | | | | | |
Consolidated companies |
(in USD million) | Norway | Eurasia excluding Norway | Africa | US | Americas excluding US | Total |
| | | | | | |
Full year 2018 | | | | | | |
Exploration expenditures | 573 | 190 | 48 | 138 | 489 | 1,438 |
Development costs | 4,717 | 704 | 192 | 2,078 | 471 | 8,162 |
Acquired proved properties | 1,333 | 0 | 0 | 21 | 2,133 | 3,487 |
Acquired unproved properties | 108 | 10 | 10 | 411 | 886 | 1,425 |
| | | | | | |
Total | 6,731 | 904 | 250 | 2,648 | 3,979 | 14,512 |
| | | | | | |
Full year 2017 | | | | | | |
Exploration expenditures | 472 | 223 | 77 | 199 | 264 | 1,235 |
Development costs | 4,565 | 599 | 417 | 2,146 | 376 | 8,102 |
Acquired proved properties | 0 | 333 | 0 | 32 | 0 | 365 |
Acquired unproved properties | 1 | 13 | 0 | 122 | 726 | 862 |
| | | | | | |
Total | 5,038 | 1,168 | 494 | 2,499 | 1,366 | 10,564 |
| | | | | | |
Full year 2016 | | | | | | |
Exploration expenditures | 495 | 155 | 197 | 202 | 388 | 1,437 |
Development costs | 5,245 | 661 | 780 | 1,705 | 413 | 8,804 |
Acquired proved properties | 6 | 0 | 0 | 3 | 0 | 9 |
Acquired unproved properties | 57 | 58 | 0 | 9 | 2,353 | 2,477 |
| | | | | | |
Total | 5,803 | 874 | 977 | 1,919 | 3,154 | 12,727 |
Expenditures incurred in exploration and development activities related to equity accounted investments was USD 249 million in 2018, USD 284 million in 2017 and USD 1,498 million in 2016. These figures include Lundin with USD 241 million, USD 265 million and USD 1,327 million respectively.
Equinor, Annual Report on Form 20-F 2018 239
Results of operation for oil and gas producing activities
As required by Topic 932, the revenues and expenses included in the following table reflect only those relating to the oil and gas producing operations of Equinor.
The result of operations for oil and gas producing activities contains the two upstream reporting segments Exploration & Production Norway (E&P Norway) and Exploration & Production International (E&P International) as presented in note 3 Segments within the Consolidated financial statements. Production cost is based on operating expenses related to production of oil and gas. From the operating expenses certain expenses such as; transportation costs, accruals for over/underlift position, royalty payments and diluent costs are excluded. These expenses and mainly upstream business administration are included as other expenses in the tables below. Other revenues mainly consist of gains and losses from sales of oil and gas interests and gains and losses from commodity based derivatives within the upstream segments.
Income tax expense is calculated on the basis of statutory tax rates adjusted for uplift and tax credits. No deductions are made for interest or other elements not included in the table below.
Consolidated companies |
(in USD million) | Norway | Eurasia excluding Norway | Africa | US | Americas excluding US | Total |
| | | | | | |
Full year 2018 | | | | | | |
Sales | 45 | 360 | 1,693 | 305 | 540 | 2,943 |
Transfers | 21,814 | 558 | 3,474 | 3,934 | 1,142 | 30,922 |
Other revenues | 606 | 97 | 59 | 175 | 32 | 968 |
| | | | | | |
Total revenues | 22,465 | 1,015 | 5,226 | 4,413 | 1,714 | 34,833 |
| | | | | | |
Exploration expenses | (431) | (195) | (40) | (407) | (349) | (1,422) |
Production costs | (2,416) | (162) | (526) | (586) | (349) | (4,039) |
Depreciation, amortisation and net impairment losses | (4,370) | (354) | (1,458) | (2,197) | (584) | (8,962) |
Other expenses | (852) | (196) | (56) | (852) | (287) | (2,243) |
| | | | | | |
Total costs | (8,069) | (907) | (2,079) | (4,042) | (1,569) | (16,665) |
| | | | | | |
Results of operations before tax | 14,396 | 108 | 3,147 | 372 | 145 | 18,167 |
Tax expense | (10,185) | 282 | (1,460) | (1) | 277 | (11,088) |
| | | | | | |
Results of operations | 4,211 | 390 | 1,687 | 371 | 421 | 7,079 |
| | | | | | |
Net income/(loss) from equity accounted investments | 10 | 23 | 0 | 8 | 0 | 41 |
240 Equinor, Annual Report on Form 20-F 2018
Consolidated companies |
(in USD million) | Norway | Eurasia excluding Norway | Africa | US | Americas excluding US | Total |
| | | | | | |
Full year 2017 | | | | | | |
Sales | 47 | 236 | 1,373 | 217 | 0 | 1,873 |
Transfers | 17,578 | 518 | 3,345 | 2,375 | 944 | 24,759 |
Other revenues | (62) | 53 | 3 | 186 | (15) | 164 |
| | | | | | |
Total revenues | 17,563 | 806 | 4,721 | 2,778 | 928 | 26,796 |
| | | | | | |
Exploration expenses | (379) | (236) | (143) | 25 | (327) | (1,059) |
Production costs | (2,213) | (157) | (523) | (457) | (259) | (3,610) |
Depreciation, amortisation and net impairment losses | (3,874) | (426) | (1,910) | (1,664) | (423) | (8,297) |
Other expenses | (742) | (123) | (18) | (680) | (594) | (2,156) |
| | | | | | |
Total costs | (7,207) | (941) | (2,595) | (2,776) | (1,603) | (15,122) |
| | | | | | |
Results of operations before tax | 10,356 | (135) | 2,126 | 3 | (675) | 11,674 |
Tax expense | (7,479) | 179 | (741) | 1 | (15) | (8,056) |
| | | | | | |
Results of operations | 2,877 | 44 | 1,385 | 3 | (690) | 3,619 |
| | | | | | |
Net income/(loss) from equity accounted investments | 129 | 13 | 0 | 10 | 0 | 151 |
Equinor, Annual Report on Form 20-F 2018 241
Consolidated companies |
(in USD million) | Norway | Eurasia excluding Norway | Africa | US | Americas excluding US | Total |
| | | | | | |
Full year 2016 | | | | | | |
Sales | 57 | 161 | 305 | 241 | (15) | 749 |
Transfers | 12,962 | 494 | 2,803 | 1,580 | 886 | 18,725 |
Other revenues | 136 | 30 | 6 | 259 | 7 | 438 |
| | | | | | |
Total revenues | 13,155 | 685 | 3,114 | 2,080 | 878 | 19,912 |
| | | | | | |
Exploration expenses | (383) | (274) | (284) | (1,209) | (803) | (2,952) |
Production costs | (2,129) | (148) | (629) | (330) | (333) | (3,569) |
Depreciation, amortisation and net impairment losses | (5,698) | (130) | (2,181) | (2,354) | (845) | (11,208) |
Other expenses | (417) | (81) | (89) | (906) | (415) | (1,908) |
| | | | | | |
Total costs | (8,627) | (633) | (3,183) | (4,799) | (2,395) | (19,637) |
| | | | | | |
Results of operations before tax | 4,528 | 52 | (69) | (2,719) | (1,517) | 275 |
Tax expense | (2,760) | 272 | (123) | 0 | (26) | (2,636) |
| | | | | | |
Results of operations | 1,768 | 324 | (192) | (2,719) | (1,543) | (2,361) |
| | | | | | |
Net income/(loss) from equity accounted investments | (78) | (86) | 0 | 11 | (25) | (178) |
Average production cost in USD per boe based on entitlement volumes (consolidated) | Norway | Eurasia excluding Norway | Africa | US | Americas excluding US | Total |
| | | | | | |
2018 | 5 | 11 | 7 | 5 | 11 | 6 |
2017 | 5 | 9 | 6 | 5 | 12 | 5 |
2016 | 5 | 8 | 7 | 4 | 13 | 5 |
Production cost per boe is calculated as the production costs in the result of operations table, divided by the produced entitlement volumes (mboe) for the corresponding period.
Standardised measure of discounted future net cash flows relating to proved oil and gas reserves
The table below shows the standardised measure of future net cash flows relating to proved reserves. The analysis is computed in accordance with Topic 932, by applying average market prices as defined by the SEC, year end costs, year end statutory tax rates and a discount factor of 10% to year end quantities of net proved reserves. The standardised measure of discounted future net cash flows is a forward-looking statement.
Future price changes are limited to those provided by existing contractual arrangements at the end of each reporting year. Future development and production costs are those estimated future expenditures necessary to develop and produce year-end estimated proved reserves based on year-end cost indices, assuming continuation of year-end economic conditions. Pre-tax future net cash flow is net of decommissioning and removal costs. Estimated future income taxes are calculated by applying the appropriate year-end statutory tax rates. These rates reflect allowable deductions and tax credits and are applied to estimated future pretax net cash flows, less the tax basis of related assets. Discounted future net cash flows are calculated using a discount rate of 10% per year. Discounting requires a year-by-year estimate of when future expenditures will be incurred and when reserves will be produced. The standardised measure of discounted future net cash flows prescribed under Topic 932 requires assumptions as to the timing and amount of future development and production costs and income from the production of proved reserves. The information does not represent management's estimate or Equinor's expected future cash flows or the value of its proved reserves and therefore should not be relied upon as an indication of Equinor’s future cash flow or value of its proved reserves.
242 Equinor, Annual Report on Form 20-F 2018
(in USD million) | Norway | Eurasia excluding Norway | Africa | US | Americas excluding US | Total |
At 31 December 2018 | | | | | | |
Consolidated companies | | | | | | |
Future net cash inflows | 225,928 | 9,585 | 14,050 | 32,306 | 23,651 | 305,520 |
Future development costs | (16,403) | (3,029) | (614) | (2,548) | (3,184) | (25,777) |
Future production costs | (55,332) | (4,074) | (4,947) | (12,445) | (12,237) | (89,035) |
Future income tax expenses | (113,522) | (416) | (2,968) | (3,530) | (1,036) | (121,471) |
Future net cash flows | 40,671 | 2,067 | 5,522 | 13,783 | 7,194 | 69,237 |
10% annual discount for estimated timing of cash flows | (16,303) | (789) | (1,372) | (5,014) | (2,460) | (25,937) |
Standardised measure of discounted future net cash flows | 24,368 | 1,278 | 4,150 | 8,769 | 4,734 | 43,299 |
| | | | | | |
Equity accounted investments | | | | | | |
Standardised measure of discounted future net cash flows | 607 | - | - | - | - | 607 |
| | | | | | |
Total standardised measure of discounted future net cash flows including equity accounted investments | 24,975 | 1,278 | 4,150 | 8,769 | 4,734 | 43,907 |
| | | | | | + |
| | | | | | |
(in USD million) | Norway | Eurasia excluding Norway | Africa | US | Americas excluding US | Total |
At 31 December 2017 | | | | | | |
Consolidated companies | | | | | | |
Future net cash inflows | 150,953 | 6,144 | 11,504 | 24,085 | 10,301 | 202,987 |
Future development costs | (15,642) | (1,992) | (594) | (2,020) | (2,499) | (22,747) |
Future production costs | (49,229) | (2,792) | (5,240) | (10,342) | (6,564) | (74,167) |
Future income tax expenses | (58,774) | (288) | (1,456) | (3,962) | (333) | (64,813) |
Future net cash flows | 27,307 | 1,072 | 4,215 | 7,761 | 904 | 41,259 |
10% annual discount for estimated timing of cash flows | (10,152) | (315) | (874) | (2,925) | (331) | (14,596) |
Standardised measure of discounted future net cash flows | 17,155 | 757 | 3,341 | 4,836 | 573 | 26,663 |
| | | | | | |
Equity accounted investments | | | | | | |
Standardised measure of discounted future net cash flows | 333 | - | - | - | - | 333 |
| | | | | | |
Total standardised measure of discounted future net cash flows including equity accounted investments | 17,488 | 757 | 3,341 | 4,836 | 573 | 26,995 |
| | | | | | + |
| | | | | | |
(in USD million) | Norway | Eurasia excluding Norway | Africa | US | Americas excluding US | Total |
At 31 December 2016 | | | | | | |
Consolidated companies | | | | | | |
Future net cash inflows | 120,355 | 4,032 | 10,644 | 14,452 | 5,582 | 155,065 |
Future development costs | (14,572) | (927) | (733) | (2,574) | (985) | (19,791) |
Future production costs | (45,357) | (2,101) | (4,909) | (7,837) | (3,864) | (64,069) |
Future income tax expenses | (36,268) | (127) | (1,492) | (1,287) | (68) | (39,243) |
Future net cash flows | 24,158 | 876 | 3,510 | 2,754 | 664 | 31,962 |
10% annual discount for estimated timing of cash flows | (8,729) | (241) | (646) | (1,019) | (236) | (10,870) |
Standardised measure of discounted future net cash flows | 15,429 | 635 | 2,864 | 1,735 | 429 | 21,092 |
| | | | | | |
Equity accounted investments | | | | | | |
Standardised measure of discounted future net cash flows | 279 | - | - | - | 127 | 406 |
| | | | | | |
Total standardised measure of discounted future net cash flows including equity accounted investments | 15,708 | 635 | 2,864 | 1,735 | 555 | 21,498 |
Equinor, Annual Report on Form 20-F 2018 243
Changes in the standardised measure of discounted future net cash flows from proved reserves |
(in USD million) | 2018 | 2017 | 2016 |
| | | |
Consolidated companies | | | |
Standardised measure at beginning of year | 26,663 | 21,092 | 25,366 |
Net change in sales and transfer prices and in production (lifting) costs related to future production | 39,645 | 22,640 | (21,148) |
Changes in estimated future development costs | (7,751) | (5,572) | (16) |
Sales and transfers of oil and gas produced during the period, net of production cost | (29,556) | (22,446) | (16,824) |
Net change due to extensions, discoveries, and improved recovery | 12,046 | 3,836 | 1,099 |
Net change due to purchases and sales of minerals in place | 4,815 | (167) | (566) |
Net change due to revisions in quantity estimates | 11,622 | 10,798 | 8,163 |
Previously estimated development costs incurred during the period | 8,066 | 7,597 | 7,998 |
Accretion of discount | 6,525 | 4,415 | 5,949 |
Net change in income taxes | (28,775) | (15,530) | 11,070 |
| | | |
Total change in the standardised measure during the year | 16,637 | 5,571 | (4,274) |
| | | |
Standardised measure at end of year | 43,299 | 26,663 | 21,092 |
| | | |
Equity accounted investments | | | |
Standardised measure at end of year | 607 | 333 | 406 |
| | | |
Standardised measure at end of year including equity accounted investments | 43,907 | 26,995 | 21,498 |
In the table above, each line item presents the sources of changes in the standardised measure value on a discounted basis, with the accretion of discount line item reflecting the increase in the net discounted value of the proved oil and gas reserves due to the fact that the future cash flows are now one year closer in time.
The standardised measure at the beginning of the year represents the discounted net present value after deductions of both future development costs, production costs and taxes. The ‘Net change in sales and transfer prices and in production (lifting) costs related to future production’ is, on the other hand, related to the future net cash flows at 31 December 2017. The proved reserves at 31 December 2017 were multiplied by the actual change in price, and change in unit of production costs, to arrive at the net effect of changes in price and production costs. Development costs and taxes are reflected in the line items ‘Change in estimated future development costs’ and ‘Net change in income taxes’ and are not included in the ‘Net change in sales and transfer prices and in production (lifting) costs related to future production’.
| Measurement Category | Carrying Amount | |
| Original | New | Original | New | Difference |
(in USD million) | (IAS 39) | (IFRS 9) | (IAS 39) | (IFRS 9) |
Assets at 01.01.2018 | | | | | |
Non-current derivative financial instruments | Held for trading | Fair value through profit or loss | 1,387 | 1,387 | - |
Prepayments and other financial receivables | Loans and receivables | Amortised cost | 457 | 457 | - |
| Non-financial assets | Non-financial assets | 60 | 60 | - |
Receivables from subsidiaries and other equity accounted companies | Loans and receivables | Amortised cost | 25,725 | 25,725 | |
| Non-financial assets | Non-financial assets | 171 | 171 | |
Trade and other receivables | Loans and receivables | Amortised cost | 5,813 | 5,824 | 11 |
| Non-financial assets | Non-financial assets | 126 | 126 | - |
Receivables from subsidiaries and other equity accounted companies | Loans and receivables | Amortised cost | 2,448 | 2,448 | - |
Current derivative financial instruments | Held for trading | Fair value through profit or loss | 115 | 115 | - |
Current financial investments | Loans and receivables | Amortised cost | 4,045 | 4,045 | - |
| Held for trading | Amortised cost | 3,649 | 3,639 | (10) |
Cash and cash equivalents | Loans and receivables | Amortised cost | 2,301 | 2,301 | - |
| Held for trading | Fair value through profit or loss | 381 | 381 | - |
| Held for trading | Amortised cost | 1,077 | 1,076 | (1) |
Total | | | 47,754 | 47,754 | 0 |
244 Equinor, Annual Report on Form 20-F 2018
Equinor, Annual Report on Form 20-F 2018 245
5.1 Shareholder information
Equinor is the largest company listed on the Oslo Børs where it trades under the ticker code EQNR. Equinor is also listed on the New York Stock Exchange under the ticker code EQNR, trading in the form of American Depositary Shares (ADS).
Equinor's shares have been listed on the Oslo Børs and the New York Stock Exchange since our initial public offering on 18 June 2001. The ADSs traded on the New York Stock Exchange are evidenced by American Depositary Receipts (ADR), and each ADS represents one ordinary share.
Dividend policy and dividends
It is Equinor's ambition to grow the annual cash dividend measured in USD per share in line with long-term underlying earnings.
Equinor’s board approves first, second and third quarter interim dividends, based on an authorisation from the annual general meeting (AGM), while the AGM approves the fourth quarter dividend and implicitly the total annual dividend based on a proposal from the board. It is Equinor’s intention to pay quarterly dividends, although when deciding the interim dividends and recommending the total annual dividend level, the board will take into consideration expected cash flow, capital expenditure plans, financing requirements and appropriate financial flexibility.
In addition to cash dividend, Equinor might buy back shares as part of total distribution of capital to the shareholders. The shareholders at the AGM may vote to reduce, but may not increase, the fourth quarter dividend proposed by the board of directors. Equinor announces dividend payments in connection with quarterly results. Payment of quarterly dividends is expected to take place within six months after the announcement of each quarterly dividend.
The board of directors has proposed to the AGM a dividend of USD 0.26 per share for the fourth quarter 2018 which is an increase from the previous quarter.
The following table shows the cash dividend amounts to all shareholders since 2014 on a per share basis and in aggregate.
| | Ordinary dividend per share | | | Ordinary dividend per share |
Fiscal year | Curr. | Q1 | | Curr. | Q2 | | Curr. | Q3 | | Curr. | Q4 | | Curr. |
| | | | | | | | | | | | | | |
| | | | | | | | | | | | | | |
2014 | NOK | 1.8000 | | NOK | 1.8000 | | NOK | 1.8000 | | NOK | 1.8000 | | NOK | 7.2000 |
2015 | NOK | 1.8000 | | NOK | - | | NOK | - | | NOK | - | | NOK | 1.8000 |
2015 | USD | - | | USD | 0.2201 | | USD | 0.2201 | | USD | 0.2201 | | USD | 0.6603 |
2016 | USD | 0.2201 | | USD | 0.2201 | | USD | 0.2201 | | USD | 0.2201 | | USD | 0.8804 |
2017 | USD | 0.2201 | | USD | 0.2201 | | USD | 0.2201 | | USD | 0.2300 | | USD | 0.8903 |
2018 | USD | 0.2300 | | USD | 0.2300 | | USD | 0.2300 | | USD | 0.2600 | | USD | 0.9500 |
| | | | | | | | | | | | | | |
The proposed fourth quarter 2018 dividend will be considered at the annual general meeting 15 May 2019. The Equinor share will be traded ex dividend 16 May 2019 and the dividend will be disbursed around 30 May 2019. For US ADR holders, the ex-dividend date will be 16 May 2019 and expected payment will be 31 May 2019.
Dividends in NOK per share will be calculated and communicated four business days after record date for shareholders at Oslo Børs. The NOK dividend will be based on average USD/NOK exchange rates from Norges Bank in the period plus/minus three business days from record date, in total seven business dates.
Share repurchase
For the period 2013-2018, the board of directors was authorised by the annual general meeting of Equinor to repurchase Equinor shares in the market for subsequent annulment. Equinor has not undertaken any share repurchase based on this authorisation.
It is Equinor’s intention to renew this authorisation at the annual general meeting in May 2019.
246 Equinor, Annual Report on Form 20-F 2018
Shares purchased by issuer
Shares are acquired in the market for transfer to employees under the share savings scheme in accordance with the limits set by the board of directors. No shares were repurchased in the market for the purpose of subsequent annulment in 2018.
Equinor's share savings plan
Since 2004, Equinor has had a share savings plan for employees of the company. The purpose of this plan is to strengthen the business culture and encourage loyalty through employees becoming part-owners of the company.
Through regular salary deductions, employees can invest up to 5% of their base salary in Equinor shares. In addition, the company contributes 20% of the total share investment made by employees in Norway, up to a maximum of NOK 1,500 per year (approximately USD 180). This company contribution is a tax-free employee benefit under current Norwegian tax legislation. After a lock-in period of two calendar years, one extra share will be awarded for each share purchased. Under current Norwegian tax legislation, the share award is a taxable employee benefit, with a value equal to the value of the shares and taxed at the time of the award.
The board of directors is authorised to acquire Equinor shares in the market on behalf of the company. The authorisation is valid until the next annual general meeting, but not beyond 30 June 2019. This authorisation replaces the previous authorisation to acquire Equinor’s own shares for implementation of the share savings plan granted by the annual general meeting 11 May 2017. It is Equinor’s intention to renew this authorisation at the annual general meeting on 15 May 2019.
Period in which shares were repurchased | Number of shares repurchased | Average price per share in NOK | Total number of shares purchased as part of programme | Maximum number of shares that may yet be purchased under the programme authorisation |
| | | | | |
Jan-18 | 493,678 | 185.7484 | 4,400,433 | 9,599,567 |
Feb-18 | 530,143 | 174.6695 | 4,930,576 | 9,069,424 |
Mar-18 | 521,195 | 177.6686 | 5,451,771 | 8,548,229 |
Apr-18 | 467,241 | 198.8265 | 5,919,012 | 8,080,988 |
May-18 | 424,908 | 220.1653 | 6,343,920 | 7,656,080 |
Jun-18 | 431,985 | 216.2919 | 431,985 | 13,568,015 |
Jul-18 | 428,358 | 218.1000 | 860,343 | 13,139,657 |
Aug-18 | 441,113 | 211.8730 | 1,301,456 | 12,698,544 |
Sep-18 | 431,424 | 216.7239 | 1,732,880 | 12,267,120 |
Oct-18 | 422,751 | 221.9863 | 2,155,631 | 11,844,369 |
Nov-18 | 459,974 | 205.5547 | 2,615,605 | 11,384,395 |
Dec-18 | 482,585 | 196.5125 | 3,098,190 | 10,901,810 |
Jan-19 | 515,550 | 191.2129 | 3,613,740 | 10,386,260 |
Feb-19 | 498,958 | 200.0165 | 4,112,698 | 9,887,302 |
| | | | | |
TOTAL | 6,549,863 1) | 202.5250 2) | | |
| | | | | |
1) | All shares repurchased have been purchased in the open market and pursuant to the authorisation mentioned above. |
2) | Weighted average price per share. |
Equinor, Annual Report on Form 20-F 2018 247
Equinor ADR programme fees
Fees and charges payable by a holder of ADSs.
JPMorgan Chase Bank N.A. (JPMorgan), serves as the depositary for Equinor’s ADR programme having replaced the Deutsche Bank Trust Company Americas (Deutsche Bank) pursuant to the Further Amended and Restated Deposit Agreement dated February 4, 2019. JPMorgan collects its fees for the delivery and surrender of ADSs directly from investors depositing shares or surrendering ADSs for the purpose of withdrawal, or from intermediaries acting for them. The depositary collects other fees from investors by billing ADR holders, by deducting such fees and charges from the amounts distributed or by deducting such fees from cash dividends or other cash distributions. The depositary may refuse to provide fee-attracting services until its fees for those services are paid.
The charges of the depositary payable by investors are as follows:
ADR holders, persons depositing or withdrawing shares, and/or persons whom ADSs are issued, must pay: | For: |
| |
USD 5.00 (or less) per 100 ADSs (or portion of 100 ADSs) | Issuance of ADSs, including issuances resulting from a deposit of shares, a distribution of shares or rights or other property, and issuances pursuant to stock dividends, stock splits, mergers, exchanges of securities or any other transactions or events affecting the ADSs or the deposited securities. |
| Cancellation of ADSs for the purpose of withdrawal of deposited securities, including if the deposit agreement terminates, or a cancellation or reduction of ADSs for any other reason |
| |
USD 0.05 (or less) per ADS | Any cash distribution made or elective cash/stock dividend offered pursuant to the Deposit Agreement |
| |
USD 0.05 (or less) per ADS, per calendar year (or portion thereof) | For the operation and maintenance costs in administering the ADR programme |
| |
A fee equivalent to the fee that would be payable if securities distributed to you had been shares and the shares had been deposited for issuance of ADSs | Distribution to registered ADR holders of (i) securities distributed by the company to holders of deposited securities or (ii) cash proceeds from the sale of such securities |
| |
Registration or transfer fees | Transfer and registration of shares on our share register to or from the name of the Depositary or its agent when you deposit or withdraw shares |
| |
Expenses of the Depositary | SWIFT, cable, telex, facsimile transmission and delivery charges (as provided in the deposit agreement). |
| Fees, expenses and other charges of JPMorgan or its agent (which may be a division, branch or affiliate) for converting foreign currency to USD, which shall be deducted out of such foreign currency. |
| |
Taxes and other governmental charges the Depositary or the custodian have to pay, for example, stock transfer taxes, stamp duty or withholding taxes | As necessary |
| |
Any fees, charges and expenses incurred by the Depositary or its agents for the servicing of the deposited securities, the sale of securities, the delivery of deposited securities or in connection with the depositary's or its custodian's compliance with applicable law, rule or regulation, including without limitation expenses incurred on behalf of ADR holders in connection with compliance with foreign exchange control regulations or any law or regulation relating to foreign investment | As necessary |
| |
Direct and indirect payments by the depositary
Under our arrangements with Deutsche Bank, our previous depositary, we were entitled to reimbursement of certain company expenses related to the company's ADR programme and incurred by the company in connection with the programme. In the year ended 31 December 2018, the depositary made no reimbursement to the company in relation to certain expenses including investor relations expenses, expenses related to the maintenance of the ADR programme, legal counsel fees, printing and ADR certificates.
248 Equinor, Annual Report on Form 20-F 2018
Deutsche Bank had also agreed to waive fees for costs associated with the administration of the ADR programme, and it had paid certain expenses directly to third parties on behalf of the company. The expenses paid to third parties include expenses relating to reporting services, access charges to its online platform, reregistration costs borne by the custodian and costs in relation to printing and mailing AGM materials. For the year ended 31 December 2018, Deutsche Bank paid expenses of approximately USD 201,899 directly to third parties.
Under our arrangements with JPMorgan, as our current depositary, the company will receive from JPMorgan the lesser of (a) USD 2,000,000 and (b) the difference between revenues and expenses of the ADR programme. JPMorgan has also agreed to reimburse the company for up to USD 25,000 in legal fees incurred in connection with the transfer of the ADR programme. Other reasonable costs associated with the administration of the ADR programme are borne by the company. Under certain circumstances, including the removal of JPMorgan as depositary, the company is required to repay to JPMorgan certain amounts paid to the company in prior periods.
Taxation
Norwegian tax consequences
This section describes material Norwegian tax consequences for shareholders in connection with the acquisition, ownership and disposal of shares and American Depositary Shares (“ADS”). The term “shareholders” refers to both holders of shares and holders of ADSs, unless otherwise explicitly stated.
The outline does not provide a complete description of all Norwegian tax regulations that might be relevant (i.e. for investors to whom special regulations may apply), and is based on current law and practice. Shareholders should consult their professional tax advisers for advice about individual tax consequences.
Taxation of dividends received by Norwegian shareholders
Corporate shareholders (i.e. limited liability companies and similar entities) residing in Norway for tax purposes are generally subject to tax in Norway on dividends received from Norwegian companies. The basis for taxation is 3% of the dividends received, which is subject to the standard income tax rate of 22% (reduced from 23% with effect from and including 2019).
Individual shareholders residing in Norway for tax purposes are subject to the standard income tax rate of 22% (reduced from 23% with effect from and including 2019) for dividend income exceeding a basic tax free allowance. However, in 2019 dividend income exceeding the basic tax free allowance is grossed up with a factor of 1.44 before being included in the ordinary taxable income, resulting in an effective tax rate of 31.68% (22% x 1.44). The tax free allowance is computed for each individual share or ADS and corresponds as a rule to the cost price of that share or ADS multiplied by an annual risk-free interest rate. Any part of the calculated allowance for one year that exceeds the dividend distributed for the share or ADS (“unused allowance”) may be carried forward and set off against future dividends received on (or gains upon the realisation of, see below) the same share or ADS. Any unused allowance will also be added to the basis for computation of the allowance for the same share or ADS the following year.
Individual shareholders may hold listed shares in companies resident within the EEA through a stock savings account. Dividend on shares owned through the stock savings account is only taxable when the dividend is withdrawn from the account.
Taxation of dividends received by foreign shareholders
Non-resident shareholders are as a starting point subject to Norwegian withholding tax at a rate of 25% on dividends from Norwegian companies. The distributing company is responsible for deducting the withholding tax upon distribution to non-resident shareholders.
Corporate shareholders that carry on business activities in Norway, and whose shares or ADSs are effectively connected with such activities are not subject to withholding tax. For such shareholders, 3% of the received dividends are subject to the standard income tax of 22% (reduced from 23% with effect from and including 2019).
Certain other important exceptions and modifications are outlined below.
This withholding tax does not apply to corporate shareholders in the EEA that are comparable to Norwegian limited liability companies or certain other types of Norwegian entities, and are further able to demonstrate that they are genuinely established and carry on genuine economic business activity within the EEA, provided that Norway is entitled to receive information from the country of residence pursuant to a tax treaty or other international treaty. If no such treaty exists with the country of residence, the shareholder may instead present confirmation issued by the tax authorities of the country of residence verifying the documentation.
The withholding rate of 25% is often reduced in tax treaties between Norway and other countries. The reduced withholding tax rate will generally only apply to dividends paid on shares held by shareholders who are able to properly demonstrate that they are the beneficial owner and entitled to the benefits of the tax treaty.
Equinor, Annual Report on Form 20-F 2018 249
Individual shareholders residing for tax purposes in the EEA may apply to the Norwegian tax authorities for a refund if the tax withheld by the distributing company exceeds the tax that would have been levied on individual shareholders resident in Norway.
Individual shareholders residing for tax purposes in the EEA may hold listed shares in companies resident within the EEA through a stock savings account. Dividend on shares owned through the stock savings account will only be subject to withholding tax when withdrawn from the account.
Procedure for claiming a reduced withholding tax rate on dividends
A foreign shareholder that is entitled to an exemption from or reduction of withholding tax on dividends, may request that the exemption or reduction is applied at source by the distributor. Such request must be accompanied by satisfactory documentation which supports that the foreign shareholder is entitled to a reduced withholding tax rate. Specific documentation requirements will apply from 1 January 2019. Please refer to the tax authorities’ web page for more information about the requirements: www.skatteetaten.no/en/business-and-organisation.
For holders of shares and ADSs deposited with Deutsche Bank Trust Company Americas (Deutsche Bank), documentation establishing that the holder is eligible for the benefits under a tax treaty with Norway, may be provided to Deutsche Bank. Deutsche Bank has been granted permission by the Norwegian tax authorities to receive dividends from us for redistribution to a beneficial owner of shares and ADSs at the applicable treaty withholding rate.
The statutory 25% withholding tax rate will be levied on dividends paid to shareholders (either directly or through a depositary) who have not provided the relevant documentation to the relevant party that they are eligible for a reduced rate. The beneficial owners will in this case have to apply to the Central Office - Foreign Tax Affairs for a refund of the excess amount of tax withheld. Please refer to the tax authorities’ web page for more information and the requirements of such application: www.skatteetaten.no/en/person.
Taxation on realisation of shares and ADSs
Corporate shareholders resident in Norway for tax purposes are not subject to tax in Norway on gains derived from the sale, redemption or other disposal of shares or ADSs in Norwegian companies. Capital losses are not deductible.
Individual shareholders residing in Norway for tax purposes are subject to tax in Norway on the sale, redemption or other disposal of shares or ADSs. Gains or losses in connection with such realisation are included in the individual's ordinary taxable income in the year of disposal, which is subject to the standard income tax rate of 22% (reduced from 23% with effect from and including 2019). However, in 2019 the taxable gain or deductible loss is grossed up with a factor of 1.44 before included in the ordinary taxable income, resulting in an effective tax rate of 31.68% (22% x 1.44).
The taxable gain or deductible loss (before gross up) is calculated as the sales price adjusted for transaction expenses minus the taxable basis. A shareholder's tax basis is normally equal to the acquisition cost of the shares or ADSs. Any unused allowance pertaining to a share may be deducted from a taxable gain on the same share or ADS, but may not lead to or increase a deductible loss. Furthermore, any unused allowance may not be set off against gains from the realisation of the other shares or ADSs.
If a shareholder disposes of shares or ADSs acquired at different times, the shares or ADSs that were first acquired will be deemed to be first sold (the “FIFO” principle) when calculating gain or loss for tax purposes.
Individual shareholders may hold listed shares in companies resident within the EEA through a stock savings account. Gain on shares owned through the stock savings account will only be taxable when withdrawn from the account whereas loss on shares will be deductible when the account is terminated.
A corporate shareholder or an individual shareholder who ceases to be tax resident in Norway due to Norwegian law or tax treaty provisions may, in certain circumstances, become subject to Norwegian exit taxation on unrealised capital gains related to shares or ADSs.
Shareholders not residing in Norway are generally not subject to tax in Norway on capital gains, and losses are not deductible on the sale, redemption or other disposal of shares or ADSs in Norwegian companies, unless the shareholder carries on business activities in Norway and such shares or ADSs are or have been effectively connected with such activities.
Wealth tax
The shares or ADSs are included in the basis for the computation of wealth tax imposed on individuals residing in Norway for tax purposes. Norwegian limited liability companies and certain similar entities are not subject to wealth tax. The current marginal wealth tax rate is 0.85% of the value assessed. The assessment value of listed shares (including ADSs) is 75% (reduced from 80% with effect from and including the income year 2019) of the listed value of such shares or ADSs on 1 January in the assessment year.
Non-resident shareholders are not subject to wealth tax in Norway for shares and ADSs in Norwegian limited liability companies unless the shareholder is an individual and the shareholding is effectively connected with the individual's business activities in Norway.
Inheritance tax and gift tax
250 Equinor, Annual Report on Form 20-F 2018
No inheritance or gift tax is imposed in Norway.
Transfer tax
No transfer tax is imposed in Norway in connection with the sale or purchase of shares or ADSs.
United States tax matters
This section describes the material United States federal income tax consequences for US holders (as defined below) of the ownership and disposition of shares or ADSs. It only applies to you if you hold your shares or ADSs as capital assets for United States federal income tax purposes. This discussion addresses only United States federal income taxation and does not discuss all of the tax consequences that may be relevant to you in light of your individual circumstances, including foreign, state or local tax consequences, estate and gift tax consequences, and tax consequences arising under the Medicare contribution tax on net investment income or the alternative minimum tax. This section does not apply to you if you are a member of a special class of holders subject to special rules, including dealers in securities, traders in securities that elect to use a mark-to-market method of accounting for securities holdings, tax-exempt organisations, insurance companies, partnerships or entities or arrangements that are treated as partnerships for United States federal income tax purposes, persons that actually or constructively own 10% of the combined voting power of voting stock of Equinor or of the total value of stock of Equinor, persons that hold shares or ADSs as part of a straddle or a hedging or conversion transaction, persons that purchase or sell shares or ADSs as a part of a wash sale for tax purposes, or persons whose functional currency is not USD.
This section is based on the Internal Revenue Code of 1986, as amended, its legislative history, existing and proposed regulations, published rulings and court decisions, all as currently in effect, and the Convention between the United States of America and the Kingdom of Norway for the Avoidance of Double Taxation and the Prevention of Fiscal Evasion with Respect to Taxes on Income and Property (the ”Treaty”). These laws are subject to change, possibly on a retroactive basis. In addition, this section is based in part upon the representations of the depositary and the assumption that each obligation in the deposit agreement and any related agreement will be performed in accordance with its terms. For United States federal income tax purposes, if you hold ADRs evidencing ADSs, you will generally be treated as the owner of the ordinary shares represented by those ADRs. Exchanges of shares for ADRs and ADRs for shares will not generally be subject to United States federal income tax.
A “US holder” is a beneficial owner of shares or ADSs that is, for United States federal income tax purposes: (i) a citizen or resident of the United States; (ii) a United States domestic corporation; (iii) an estate whose income is subject to United States federal income tax regardless of its source; or (iv) a trust if a United States court can exercise primary supervision over the trust's administration and one or more United States persons are authorised to control all substantial decisions of the trust.
You should consult your own tax adviser regarding the United States federal, state and local and Norwegian and other tax consequences of owning and disposing of shares and ADSs in your particular circumstances.
The tax treatment of the shares or ADSs will depend in part on whether or not we are classified as a passive foreign investment company, or PFIC, for United States federal income tax purposes. Except as discussed below, under “—PFIC rules”, this discussion assumes that we are not classified as a PFIC for United States federal income tax purposes.
Taxation of distributions
Under the United States federal income tax laws, the gross amount of any distribution (including any Norwegian tax withheld from the distribution payment) paid by Equinor out of its current or accumulated earnings and profits (as determined for United States federal income tax purposes), other than certain pro-rata distributions of its shares, will be treated as a dividend that is taxable for you when you, in the case of shares, or the depositary, in the case of ADSs, receive the dividend, actually or constructively. If you are a non-corporate US holder, dividends that constitute qualified dividend income will be eligible to be taxed at the preferential rates applicable to long-term capital gains as long as, in the year that you receive the dividend, the shares or ADSs are readily tradable on an established securities market in the United States or Equinor is eligible for benefits under the Treaty. We believe that Equinor is currently eligible for the benefits of the Treaty and we therefore expect that dividends on the ordinary shares or ADSs will be qualified dividend income. To qualify for the preferential rates, you must hold the shares or ADSs for more than 60 days during the 121-day period beginning 60 days before the ex-dividend date and meet certain other requirements. The dividend will not be eligible for the dividends-received deduction generally allowed to United States corporations in respect of dividends received from other United States corporations.
The amount of the dividend distribution that you must include in your income will be the value in USD of the payments made in NOK determined at the spot NOK/USD rate on the date the dividend distribution is includible in your income, regardless of whether or not the payment is in fact converted into USD. Distributions in excess of current and accumulated earnings and profits, as determined for United States federal income tax purposes, will be treated as a non-taxable return of capital to the extent of your tax basis in the shares or ADSs and, to the extent in excess of your tax basis, will be treated as capital gain. However, Equinor does not expect to calculate earnings and profits in accordance with United States federal income tax principles. Accordingly, you should expect to generally treat distributions we make as dividends.
Subject to certain limitations, the 15% Norwegian tax withheld in accordance with the Treaty and paid to Norway will be creditable or deductible against your United States federal income tax liability, unless a reduction or refund of the tax withheld is available to you under Norwegian law. Special rules apply in determining the foreign tax credit limitation with respect to dividends that are subject to the
Equinor, Annual Report on Form 20-F 2018 251
preferential tax rates. Dividends will generally be income from sources outside the United States and will generally be “passive” income for purposes of computing the foreign tax credit allowable to you. Any gain or loss resulting from currency exchange rate fluctuations during the period from the date you include the dividend payment in income until the date you convert the payment into USD will generally be treated as US-source ordinary income or loss and will not be eligible for the special tax rate.
Taxation of capital gains
If you sell or otherwise dispose of your shares or ADSs, you will generally recognise a capital gain or loss for United States federal income tax purposes equal to the difference between the value in USD of the amount that you realise and your tax basis, determined in USD, in your shares or ADSs. Capital gain of a non-corporate US holder is generally taxed at preferential rates if the property is held for more than one year. The gain or loss will generally be income or loss from sources within the United States for foreign tax credit limitation purposes. If you receive any foreign currency on the sale of shares or ADSs, you may recognise ordinary income or loss from sources within the United States as a result of currency fluctuations between the date of the sale of the shares or ADSs and the date the sales proceeds are converted into USD. You should consult your own tax adviser regarding how to account for payments made or received in a currency other than USD.
PFIC rules
We believe that the shares and ADSs should not currently be treated as stock of a PFIC for United States federal income tax purposes and we do not expect to become a PFIC in the foreseeable future. However, this conclusion is a factual determination that is made annually and thus may be subject to change. It is therefore possible that we could become a PFIC in a future taxable year. If we were to be treated as a PFIC, a gain realised on the sale or other disposition of the shares or ADSs would in general not be treated as a capital gain. Instead, unless you elect to be taxed annually on a mark-to-market basis with respect to the shares or ADSs, you would generally be treated as if you had realised such gain and certain “excess distributions” ratably over your holding period for the shares or ADSs. Amounts allocated to the year in which the gain is realised or the “excess distribution” is received or to a taxable year before we were classified as a PFIC would be subject to tax at ordinary income tax rates, and amounts allocated to all other years would be taxed at the highest tax rate in effect for each such year to which the gain or distribution was allocated, together with an interest charge in respect of the tax attributable to each such year. With certain exceptions, your shares or ADSs will be treated as stock in a PFIC if we were a PFIC at any time during the period you held the shares or ADSs. Dividends that you receive from us will not be eligible for the preferential tax rates if we are treated as a PFIC with respect to you, either in the taxable year of the distribution or the preceding taxable year, but will instead be taxable at rates applicable to ordinary income.
Foreign Account Tax Compliance Withholding
A 30% withholding tax will be imposed on certain payments to certain non-US financial institutions that fail to comply with information reporting requirements or certification requirements in respect of their direct and indirect United States shareholders and/or United States accountholders. To avoid becoming subject to the 30% withholding tax on payments to them, we and other non-US financial institutions may be required to report information to the IRS regarding the holders of shares or ADSs and to withhold on a portion of payments under the shares or ADSs to certain holders that fail to comply with the relevant information reporting requirements (or hold shares or ADSs directly or indirectly through certain non-compliant intermediaries). However, under proposed Treasury regulations, such withholding will not apply to payments made before the date that is two years after the date on which final regulations defining the term “foreign passthru payment” are enacted. The rules for the implementation of this legislation have not yet been fully finalised, so it is impossible to determine at this time what impact, if any, this legislation will have on holders of the shares and ADSs.
Major shareholders
The Norwegian State is the largest shareholder in Equinor, with a direct ownership interest of 67%. Its ownership interest is managed by the Norwegian Ministry of Petroleum and Energy.

252 Equinor, Annual Report on Form 20-F 2018
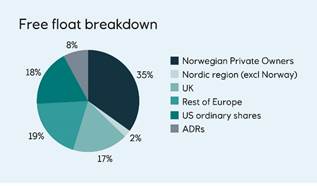
As of 31 December 2018, the Norwegian State had a 67% direct ownership interest in Equinor and a 3.30% indirect interest through the National Insurance Fund (Folketrygdfondet), totaling 70.30%.
Equinor has one class of shares, and each share confers one vote at the general meeting. The Norwegian State does not have any voting rights that differ from the rights of other ordinary shareholders. Pursuant to the Norwegian Public Limited Liability Companies Act, a majority of at least two-thirds of the votes cast as well as of the votes represented at a general meeting is required to amend our articles of association. As long as the Norwegian State owns more than one-third of our shares, it will be able to prevent any amendments to our articles of association. Since the Norwegian State, acting through the Norwegian Minister of Petroleum and Energy, has in excess of two-thirds of the shares in the company, it has sole power to amend our articles of association. In addition, as majority shareholder, the Norwegian State has the power to control any decision at general meetings of our shareholders that requires a majority vote, including the election of the majority of the corporate assembly, which has the power to elect our board of directors and approve the dividend proposed by the board of directors.
The Norwegian State endorses the principles set out in "The Norwegian Code of Practice for Corporate Governance", and it has stated that it expects companies in which the State has ownership interests to adhere to the code. The principle of ensuring equal treatment of different groups of shareholders is a key element in the State's own guidelines. In companies in which the State is a shareholder together with others, the State wishes to exercise the same rights and obligations as any other shareholder and not act in a manner that has a detrimental effect on the rights or financial interests of other shareholders. In addition to the principle of equal treatment of shareholders, emphasis is also placed on transparency in relation to the State's ownership and on the general meeting being the correct arena for owner decisions and formal resolutions.
Equinor, Annual Report on Form 20-F 2018 253
Shareholders at December 2018 | Number of Shares | Ownership in % |
| | | |
1 | Government of Norway | 2,236,903,016 | 67.00% |
2 | Folketrygdfondet | 109,118,388 | 3.27% |
3 | BlackRock Institutional Trust Company, N.A. | 35,789,269 | 1.07% |
4 | Fidelity Management & Research Company | 32,266,106 | 0.97% |
5 | SAFE Investment Company Limited | 27,970,507 | 0.84% |
6 | The Vanguard Group, Inc. | 27,617,338 | 0.83% |
7 | Lazard Asset Management, L.L.C. | 22,721,730 | 0.68% |
8 | Dodge & Cox | 18,402,983 | 0.55% |
9 | Storebrand Kapitalforvaltning AS | 18,151,804 | 0.54% |
10 | KLP Forsikring | 17,264,191 | 0.52% |
11 | DNB Asset Management AS | 17,114,032 | 0.51% |
12 | INVESCO Asset Management Limited | 16,294,917 | 0.49% |
13 | State Street Global Advisors (US) | 14,808,240 | 0.44% |
14 | FMR Investment Management (U.K.) Limited | 11,163,393 | 0.33% |
15 | APG Asset Management | 10,914,444 | 0.33% |
16 | Acadian Asset Management LLC | 10,250,831 | 0.31% |
17 | Arrowstreet Capital, Limited Partnership | 9,491,595 | 0.28% |
18 | Legal & General Investment Management Ltd. | 9,132,983 | 0.27% |
19 | Schroder Investment Management Ltd. (SIM) | 8,968,568 | 0.27% |
20 | Renaissance Technologies LLC | 8,788,504 | 0.26% |
| | | |
Source: Data collected by third party, authorised by Equinor, December 2018. | | |
| | | |
| | | |
Exchange controls and limitations
Under Norwegian foreign exchange controls currently in effect, transfers of capital to and from Norway are not subject to prior government approval. An exception applies to the physical transfer of payments in currency exceeding certain thresholds, which must be declared to the Norwegian custom authorities. This means that non-Norwegian resident shareholders may receive dividend payments without Norwegian exchange control consent as long as the payment is made through a licensed bank or other licensed payment institution.
There are no restrictions affecting the rights of non-Norwegian residents or foreign owners to hold or vote for our shares.
5.2 Use and reconciliation of non-GAAP financial measures
Since 2007, Equinor has been preparing the Consolidated financial statements in accordance with International Financial Reporting Standards (IFRS) as adopted by the European union (EU) and as issued by the International Accounting Standards Board. The IFRS standards have been applied consistently to all periods presented in the 2018 Consolidated financial statements.
Equinor is subject to SEC regulations regarding the use of non-GAAP financial measures in public disclosures. Non-GAAP financial measures are defined as numerical measures that either exclude or include amounts that are not excluded or included in the comparable measures calculated and presented in accordance with generally accepted accounting principles. The following financial measures may be considered non-GAAP financial measures:
a) Net debt to capital employed ratio before adjustments and Net debt to capital employed ratio adjusted
b) Return on average capital employed (ROACE)
c) Organic capital expenditures
d) Free cash flow and organic free cash flow
e) Adjusted earnings after tax
254 Equinor, Annual Report on Form 20-F 2018
a) Net debt to capital employed ratio
In Equinor’s view, the calculated net debt to capital employed ratio before adjustments and net debt to capital employed ratio adjusted gives an alternative picture of the current debt situation than gross interest-bearing financial debt.
The calculation is based on gross interest bearing financial debt in the balance sheet and adjusted for cash, cash equivalents and current financial investments. Certain adjustments are made, e.g. collateral deposits classified as cash and cash equivalents in the Consolidated balance sheet are considered non-cash in the non-GAAP calculations. The financial investments held in Equinor Insurance AS are excluded in the non-GAAP calculations as they are deemed restricted. These two adjustments increase net debt and give a more prudent definition of the net debt to capital employed ratio than if the IFRS based definition was to be used. Similarly, certain net interest-bearing debts incurred from activities pursuant to the Owners Instruction from the Norwegian State are set off against receivables on the Norwegian State's direct financial interest (SDFI). Net interest-bearing debt adjusted for these items is included in the average capital employed. The table below reconciles the net interest-bearing debt adjusted, the capital employed and the net debt to capital employed adjusted ratio with the most directly comparable financial measure or measures calculated in accordance with IFRS.
| | For the year ended 31 December |
Calculation of capital employed and net debt to capital employed ratio | 2018 | 2017 | 2016 |
(in USD million, except percentages) | | | |
| | | | |
Shareholders' equity | 42,970 | 39,861 | 35,072 |
Non-controlling interests | 19 | 24 | 27 |
| | | | |
Total equity (A) | 42,990 | 39,885 | 35,099 |
| | | | |
Current finance debt | 2,463 | 4,091 | 3,674 |
Non-current finance debt | 23,264 | 24,183 | 27,999 |
| | | | |
Gross interest-bearing debt (B) | 25,727 | 28,274 | 31,673 |
| | | | |
Cash and cash equivalents | 7,556 | 4,390 | 5,090 |
Current financial investments | 7,041 | 8,448 | 8,211 |
| | | | |
Cash and cash equivalents and current financial investment (C) | 14,597 | 12,837 | 13,301 |
| | | | |
Net interest-bearing debt before adjustments (B1) (B-C) | 11,130 | 15,437 | 18,372 |
| | | | |
Other interest-bearing elements 1) | 1,261 | 1,014 | 1,216 |
Marketing instruction adjustment 2) | (146) | (164) | (199) |
| | | | |
Net interest-bearing debt adjusted (B2) | 12,246 | 16,287 | 19,389 |
| | | | |
Calculation of capital employed: | | | |
Capital employed before adjustments to net interest-bearing debt (A+B1) | 54,120 | 55,322 | 53,471 |
Capital employed adjusted (A+B2) | 55,235 | 56,172 | 54,488 |
| | | | |
Calculated net debt to capital employed: | | | |
Net debt to capital employed before adjustments (B1/(A+B1) | 20.6% | 27.9% | 34.4% |
Net debt to capital employed adjusted (B2/(A+B2) | 22.2% | 29.0% | 35.6% |
| | | | |
1) | Other interest-bearing elements are cash and cash equivalents adjustments regarding collateral deposits classified as cash and cash equivalents in the Consolidated balance sheet but considered as non-cash in the non-GAAP calculations as well as financial investments in Equinor Insurance AS classified as current financial investments. |
2) | Marketing instruction adjustment is an adjustment to gross interest-bearing financial debt due to the SDFI part of the financial lease in the Snøhvit vessels that are included in Equinor's Consolidated balance sheet. |
Equinor, Annual Report on Form 20-F 2018 255
b) Return on average capital employed (ROACE)
This measure provides useful information for both the group and investors about performance during the period under evaluation. Equinor uses ROACE to measure the return on capital employed adjusted, regardless of whether the financing is through equity or debt. The use of ROACE should not be viewed as an alternative to income before financial items, income taxes and minority interest, or to net income, which are measures calculated in accordance with GAAP or ratios based on these figures. For a reconciliation for adjusted earnings after tax, see e) later in this section.
ROACE was 12.0% in 2018, compared to 8.2% in 2017 and negative 0.4% in 2016. The change from 2017 is due to an increase in adjusted earnings after tax.
Calculated ROACE based on Adjusted earnings after tax and capital employed adjusted | For the year ended 31 December |
(in USD million, except percentages) | 2018 | 2017 | 2016 |
| | | | |
Adjusted earnings after tax (A) | 6,693 | 4,528 | (208) |
| | | |
Average capital employed adjusted (B) | 55,704 | 55,330 | 54,772 |
| | | |
Calculated ROACE based on Adjusted earnings after tax and capital employed adjusted (A/B) | 12.0% | 8.2% | -0.4 % |
| | | |
| |
| | | | | |
c) Organic capital expenditures
Capital expenditures, defined as Additions to PP&E, intangibles and equity accounted investments in note 3 Segments to the Consolidated financial statements, amounted to USD 15.2 billion in 2018.
Organic capital expenditures are capital expenditures excluding acquisitions, capital leases and other investments with significant different cash flow pattern. In 2018, a total of USD 5.3 billion were excluded from the organic capital expenditures. Among items excluded from the organic capital expenditure in 2018 were acquisition of a 51% operated interest in the Martin Linge field, acquisition of a 25% interest in the Roncador field in Brazil, signature bonus for the Dois Irmãos and Uirapuru exploration blocks in Brazil and acquisition of 40% interest of the North Platte oil discovery in the US Gulf of Mexico resulting in organic capital expenditure of USD 9.9 billion.
In 2017, capital expenditures were USD 10.8 billion as per note 3 Segments to the Consolidated financial statements. A total of USD 1.4 billion were excluded from the organic capital expenditures. Among items excluded were signature bonus for the Carcara North production sharing contract in Brazil, acquisition cost for a 10% stake in the BM-S-8 licence in Brazil and bonus for the extension of the Azeri-Chirag-Deepwater Gunashli (ACG) production sharing agreement in Azerbaijan, resulting in organic capital expenditures of USD 9.4 billion.
d) Free cash flow and organic free cash flow
Free cash flow includes the following line items in the Consolidated statement of cash flows: Cash flows provided by operating activities before taxes paid and working capital items (USD 27.6 billion), taxes paid (negative USD 9.0 billion), cash used in business combinations (negative USD 3.5 billion), capital expenditures and investments (negative USD 11.4 billion), (increase) decrease in other items interest bearing (USD 0.3 billion), proceeds from sale of assets and businesses (USD 1.8 billion) and dividend paid (negative USD 2.7 billion), resulting in a free cash flow of USD 3.1 billion in 2018.
Organic free cash flow is Free cash flow excluding proceeds from sale of assets and businesses and cash flow to acquisitions (additions through business combinations and the inorganic investments included in capital expenditures and investments), of total USD 3.2 billion, resulting in an organic free cash flow of USD 6.3 billion in 2018.
e) Adjusted earnings after tax
Adjusted earnings are based on net operating income and adjusts for certain items affecting the income for the period in order to separate out effects that management considers may not be well correlated to Equinor's underlying operational performance in the individual reporting period. Management considers adjusted earnings to be a supplemental measure to Equinor's IFRS measures that provides an indication of Equinor's underlying operational performance in the period and facilitates an alternative understanding of operational trends between the periods, and uses this metric in determining variable remuneration and awards of LTI grants to members of the corporate executive committee. Adjusted earnings adjusts for the following items:
· Changes in fair value of derivatives: Certain gas contracts are, due to pricing or delivery conditions, deemed to contain embedded derivatives, required to be carried at fair value. Certain transactions related to historical divestments including contingent consideration, are carried at fair value. The accounting impacts of changes in fair value of the aforementioned are excluded from adjusted earnings. In addition, adjustments are also made for changes in the unrealised fair value of derivatives
256 Equinor, Annual Report on Form 20-F 2018
related to some natural gas trading contracts. Due to the nature of these gas sales contracts, these are classified as financial derivatives to be measured at fair value at the balance sheet date. Unrealised gains and losses on these contracts reflect the value of the difference between current market gas prices and the actual prices to be realised under the gas sales contracts. Only realised gains and losses on these contracts are reflected in adjusted earnings. This presentation best reflects the underlying performance of the business as it replaces the effect of temporary timing differences associated with the re-measurements of the derivatives to fair value at the balance sheet date with actual realised gains and losses for the period
· Periodisation of inventory hedging effect: Commercial storage is hedged in the paper market and is accounted for using the lower of cost or market price. If market prices increase above cost price, the inventory will not reflect this increase in value. There will be a loss on the derivative hedging the inventory since the derivatives always reflect changes in the market price. An adjustment is made to reflect the unrealised market increase of the commercial storage. As a result, loss on derivatives is matched by a similar adjustment for the exposure being managed. If market prices decrease below cost price, the write-down of the inventory and the derivative effect in the IFRS income statement will offset each other and no adjustment is made
· Over/underlift In the first quarter of 2018, Equinor changed the accounting policy for lifting imbalances, see note 9 Changes in accounting policies to the Condensed interim financial statements for further information. For historical periods over/underlift was accounted for using the sales method and therefore revenues were reflected in the period the product was sold rather than in the period it was produced. The over/underlift position depended on a number of factors related to our lifting programme and the way it corresponded to our entitlement share of production. The effect on income for the period was therefore adjusted, to show estimated revenues and associated costs based upon the production for the period to reflect operational performance and comparability with peers. In light of the change in accounting policy, following first quarter 2018, adjusted earnings will not include the over/underlift adjustment made in arriving at this figure in previous periods
· The operational storage is not hedged and is not part of the trading portfolio. Cost of goods sold is measured based on the FIFO (first-in, first-out) method, and includes realised gains or losses that arise due to changes in market prices. These gains or losses will fluctuate from one period to another and are not considered part of the underlying operations for the period
· Impairment and reversal of impairment are excluded from adjusted earnings since they affect the economics of an asset for the lifetime of that asset; not only the period in which it is impaired or the impairment is reversed. Impairment and reversal of impairment can impact both the exploration expenses and the depreciation, amortisation and impairment line items
· Gain or loss from sales of assets is eliminated from the measure since the gain or loss does not give an indication of future performance or periodic performance; such a gain or loss is related to the cumulative value creation from the time the asset is acquired until it is sold
· Internal unrealised profit on inventories: Volumes derived from equity oil inventory will vary depending on several factors and inventory strategies, i.e. level of crude oil in inventory, equity oil used in the refining process and level of in-transit cargoes. Internal profit related to volumes sold between entities within the group, and still in inventory at period end, is eliminated according to IFRS (write down to production cost). The proportion of realised versus unrealised gain will fluctuate from one period to another due to inventory strategies and consequently impact net operating income. Write-down to production cost is not assessed to be a part of the underlying operational performance, and elimination of internal profit related to equity volumes is excluded in adjusted earnings
· Other items of income and expense are adjusted when the impacts on income in the period are not reflective of Equinor's underlying operational performance in the reporting period. Such items may be unusual or infrequent transactions but they may also include transactions that are significant which would not necessarily qualify as either unusual or infrequent. Other items can include transactions such as provisions related to reorganisation, early retirement, etc
· Change in accounting policy are adjusted when the impacts on income in the period are unusual or infrequent, and not reflective of Equinor’s underlying operational performance in the reporting period
The measure adjusted earnings after tax excludes net financial items and the associated tax effects on net financial items. It is based on adjusted earnings less the tax effects on all elements included in adjusted earnings (or calculated tax on operating income and on each of the adjusting items using an estimated marginal tax rate). In addition, tax effect related to tax exposure items not related to the individual reporting period is excluded from adjusted earnings after tax. Management considers adjusted earnings after tax, which reflects a normalised tax charge associated with its operational performance excluding the impact of financing, to be a supplemental measure to Equinor's net income. Certain net USD denominated financial positions are held by group companies that have a USD functional currency that is different from the currency in which the taxable income is measured. As currency exchange rates change between periods, the basis for measuring net financial items for IFRS will change disproportionally with taxable income which includes exchange gains and losses from translating the net USD denominated financial positions into the currency of the applicable tax return. Therefore, the effective tax rate may be significantly higher or lower than the statutory tax rate for any given period.
Management considers that adjusted earnings after tax provides an alternative indication of the taxes associated with underlying operational performance in the period (excluding financing), and therefore facilitates an alternative comparison between periods. However, the adjusted taxes included in adjusted earnings after tax should not be considered indicative of the amount of current or total tax expense (or taxes payable) for the period.
Adjusted earnings and adjusted earnings after tax should be considered additional measures rather than substitutes for net operating income and net income, which are the most directly comparable IFRS measures. There are material limitations associated with the use of adjusted earnings and adjusted earnings after tax compared with the IFRS measures since they do not include all the items of revenues/gains or expenses/losses of Equinor which are needed to evaluate its profitability on an overall basis. Adjusted earnings and adjusted earnings after tax are only intended to be indicative of the underlying developments in trends of Equinor’s on-going operations for the production, manufacturing and marketing of its products and exclude pre- and post-tax impacts of net financial items. Equinor
Equinor, Annual Report on Form 20-F 2018 257
reflect such underlying development in its operations by eliminating the effects of certain items that may not be directly associated with the period's operations or financing. However, for that reason, adjusted earnings and adjusted earnings after tax are not complete measures of profitability. The measures should therefore not be used in isolation.
Adjusted earnings equal the sum of net operating income less all applicable adjustments. Adjusted earnings after tax equals the sum of net operating income less income tax in business areas and adjustments to operating income taking the applicable marginal tax into consideration. See the table below for details.
Calculation of adjusted earnings after tax | For the year ended 31 December |
(in USD million) | 2018 | 2017 | 2016 |
| | | |
Net operating income | 20,137 | 13,771 | 80 |
| | | |
Total revenues and other income | (2,141) | (405) | 1,020 |
Changes in fair value of derivatives | (95) | (197) | 738 |
Periodisation of inventory hedging effect | (280) | (43) | 360 |
Impairment | - | - | 25 |
Change in accounting policy1) | (287) | - | - |
Over-/underlift | - | (155) | 232 |
Gain/loss on sale of assets | (656) | (10) | (333) |
Provisions | (823) | | - |
| | | |
Purchases [net of inventory variation] | 29 | (35) | (9) |
Operational storage effects | 132 | (94) | (228) |
Eliminations | (103) | 59 | 219 |
| | | |
Operating and administrative expenses | 114 | 418 | 617 |
Over-/underlift | - | 11 | (59) |
Other adjustments | 1 | 9 | 168 |
Gain/loss on sale of assets | 2 | 382 | 86 |
Provisions | 111 | 12 | 422 |
Cost accrual changes | - | 4 | - |
| | | |
Depreciation, amortisation and impairment | (457) | (1,055) | 1,300 |
Impairment | 794 | 917 | 2,946 |
Reversal of impairment | (1,399) | (1,972) | (1,646) |
Provisions | 148 | - | |
| | | |
Exploration expenses | 276 | (56) | 1,061 |
Impairment | 287 | 435 | 1,141 |
Reversal of impairment | - | (517) | (149) |
Other adjustments | - | - | 41 |
Provisions | - | - | 28 |
Cost accrual changes | (11) | 25 | - |
| | | |
Sum of adjustments to net operating income | (2,178) | (1,132) | 3,990 |
| | | |
Adjusted earnings | 17,959 | 12,639 | 4,070 |
| | | |
Tax on adjusted earnings | (11,265) | (8,110) | (4,277) |
| | | |
Adjusted earnings after tax | 6,693 | 4,529 | (208) |
| | | |
1) Change in accounting policy for lifting imbalances. | | | |
258 Equinor, Annual Report on Form 20-F 2018
5.3 Legal proceedings
Equinor is involved in a number of proceedings globally concerning matters arising in connection with the conduct of its business. No further update is provided on previously reported legal or arbitration proceedings which Equinor does not believe will, individually or in the aggregate, have a significant effect on Equinor’s financial position, profitability, results of operations or liquidity. See also note 9 Income taxes and note 24 Other commitments, contingent liabilities and contingent assets to the Consolidated financial statements.
Equinor, Annual Report on Form 20-F 2018 259
5.6 Terms and abbreviations
Organisational abbreviations
· ADS – American Depositary Share
· ADR – American Depositary Receipt
· ACG - Azeri-Chirag-Gunashli
· ACQ - Annual contract quantity
· AFP - Agreement-based early retirement plan
· AGM - Annual general meeting
· ÅTS - Åsgard transport system
· APA - Awards in pre-defined areas
· ARO - Asset retirement obligation
· BASEC - Barents Sea Exploration Collaboration
· BTC - Baku-Tbilisi-Ceyhan pipeline
· CCS - Carbon capture and storage
· CH4 – Methane
· CLOV - Cravo, Lirio, Orquidea and Violeta
· CO2 - Carbon dioxide
· CO2eq - Carbon dioxide equivalent
· DKK - Danish Krone
· DPB – Development & Production Brazil
· DPI - Development & Production International
· DPN - Development & Production Norway
· DPUSA - Development & Production USA
· D&W - Drilling and Well
· EEA - European Economic Area
· EFTA - European Free Trade Association
· EMTN - Euro medium-term note
· EU - European Union
· EU ETS - EU Emissions Trading System
· EUR - Euro
· EXP - Exploration
· FPSO - Floating production, storage and offload vessel
· GAAP - Generally Accepted Accounting Principals
· GBP - British Pound
· GDP - Gross domestic product
· GHG - Greenhouse gas
· GSB - Global Strategy & Business Development
· HSE - Health, safety and environment
· IASB - International Accounting Standards Board
· ICE - Intercontinental Exchange
· IFRS - International Financial Reporting Standards
· IOGP - The International Association of Oil & Gas Producers
· IOR - Improved oil recovery
· LNG - Liquefied natural gas
· LPG - Liquefied petroleum gas
· MMP - Marketing, Midstream & Processing
· MPE - Norwegian Ministry of Petroleum and Energy
· NCS - Norwegian continental shelf
· NES – New Energy Solutions
· NIOC - National Iranian Oil Company
· NOK - Norwegian kroner
· NOx- Nitrogen oxide
· NYSE – New York stock exchange
· OECD - Organisation of Economic Co-Operation and Development
· OML - Oil mining lease
· OPEC - Organization of the Petroleum Exporting Countries
· OPEX – Operating expense
· OSE – Oslo stock exchange
· OTC - Over-the-counter
· OTS - Oil trading and supply department
· PDO - Plan for development and operation
· PIO - Plan for installation and operation
· PRD - Project Development organisation
· PSA - Production sharing agreement
260 Equinor, Annual Report on Form 20-F 2018
· PSC – Production sharing contract
· PSR - Procurement and Supplier Relations
· PSVM - Plutão, Saturno, Vênus and Marte
· R&D - Research and development
· ROACE - Return on average capital employed
· RRR - Reserve replacement ratio
· SDFI - Norwegian State's Direct Financial Interest
· SEC - Securities and Exchange Commission
· SEK - Swedish Krona
· SG&A - Selling, general & administrative
· SIF - Serious Incident Frequency
· TPD - Technology, projects and drilling
· TRIF - Total recordable injuries per million hours worked
· TSP - Technical service provider
· UKCS - UK continental shelf
· US - United States of America
· USD - United States dollar
Metric abbreviations etc.
· bbl - barrel
· mbbl - thousand barrels
· mmbbl - million barrels
· boe - barrels of oil equivalent
· mboe - thousand barrels of oil equivalent
· mmboe - million barrels of oil equivalent
· mmcf - million cubic feet
· mmBtu - million british thermal units
· bcf - billion cubic feet
· tcf - trillion cubic feet
· scm - standard cubic metre
· mcm - thousand cubic metres
· mmcm - million cubic metres
· bcm - billion cubic metres
· mmtpa - million tonnes per annum
· km - kilometre
· ppm - part per million
· one billion - one thousand million
· MW - Mega watt
· GW – Giga watt
· TW – Terra watt
Equivalent measurements are based upon
· 1 barrel equals 0.134 tonnes of oil (33 degrees API)
· 1 barrel equals 42 US gallons
· 1 barrel equals 0.159 standard cubic metres
· 1 barrel of oil equivalent equals 1 barrel of crude oil
· 1 barrel of oil equivalent equals 159 standard cubic metres of natural gas
· 1 barrel of oil equivalent equals 5,612 cubic feet of natural gas
· 1 barrel of oil equivalent equals 0.0837 tonnes of NGLs
· 1 billion standard cubic metres of natural gas equals 1 million standard cubic metres of oil equivalent
· 1 cubic metre equals 35.3 cubic feet
· 1 kilometre equals 0.62 miles
· 1 square kilometre equals 0.39 square miles
· 1 square kilometre equals 247.105 acres
· 1 cubic metre of natural gas equals 1 standard cubic metre of natural gas
· 1,000 standard cubic meter gas equals 1 standard cubic meter oil equivalent
· 1,000 standard cubic metres of natural gas equals 6.29 boe
· 1 standard cubic foot equals 0.0283 standard cubic metres
· 1 standard cubic foot equals 1000 British thermal units (btu)
· 1 tonne of NGLs equals 1.9 standard cubic metres of oil equivalent
· 1 degree Celsius equals minus 32 plus five-ninths of the number of degrees Fahrenheit
Miscellaneous terms
· Appraisal well: A well drilled to establish the extent and the size of a discovery
· Biofuel: A solid, liquid or gaseous fuel derived from relatively recently dead biological material and is distinguished from fossil fuels, which are derived from long dead biological material
Equinor, Annual Report on Form 20-F 2018 261
· BOE (barrels of oil equivalent): A measure to quantify crude oil, natural gas liquids and natural gas amounts using the same basis. Natural gas volumes are converted to barrels on the basis of energy content
· Condensates: The heavier natural gas components, such as pentane, hexane, iceptane and so forth, which are liquid under atmospheric pressure – also called natural gasoline or naphtha
· Crude oil, or oil: Includes condensate and natural gas liquids
· Development: The drilling, construction, and related activities following discovery that are necessary to begin production of crude oil and natural gas fields
· Downstream: The selling and distribution of products derived from upstream activities
· Equity and entitlement volumes of oil and gas: Equity volumes represent volumes produced under a production sharing agreement (PSA) that correspond to Equinor's percentage ownership in a particular field. Entitlement volumes, on the other hand, represent Equinor's share of the volumes distributed to the partners in the field, which are subject to deductions for, among other things, royalties and the host government's share of profit oil. Under the terms of a PSA, the amount of profit oil deducted from equity volumes will normally increase with the cumulative return on investment to the partners and/or production from the licence. The distinction between equity and entitlement is relevant to most PSA regimes, whereas it is not applicable in most concessionary regimes such as those in Norway, the UK, Canada and Brazil. The overview of equity production provides additional information for readers, as certain costs described in the profit and loss analysis were directly associated with equity volumes produced during the reported years
· Heavy oil: Crude oil with high viscosity (typically above 10 cp), and high specific gravity. The API classifies heavy oil as crudes with a gravity below 22.3° API. In addition to high viscosity and high specific gravity, heavy oils typically have low hydrogen-to-carbon ratios, high asphaltene, sulphur, nitrogen, and heavy-metal content, as well as higher acid numbers
· High grade: Relates to selectively harvesting goods, to cut the best and leave the rest. In reference to exploration and production this entails strict prioritisation and sequencing of drilling targets
· Hydro: A reference to the oil and energy activities of Norsk Hydro ASA, which merged with Equinor ASA
· IOR (improved oil recovery): Actual measures resulting in an increased oil recovery factor from a reservoir as compared with the expected value at a certain reference point in time. IOR comprises both of conventional and emerging technologies
· Liquids: Refers to oil, condensates and NGL
· LNG (liquefied natural gas): Lean gas - primarily methane - converted to liquid form through refrigeration to minus 163 degrees Celsius under atmospheric pressures
· LPG (liquefied petroleum gas): Consists primarily of propane and butane, which turn liquid under a pressure of six to seven atmospheres. LPG is shipped in special vessels
· Midstream: Processing, storage, and transport of crude oil, natural gas, natural gas liquids and sulphur
· Naphtha: inflammable oil obtained by the dry distillation of petroleum
· Natural gas: Petroleum that consists principally of light hydrocarbons. It can be divided into 1) lean gas, primarily methane but often containing some ethane and smaller quantities of heavier hydrocarbons (also called sales gas) and 2) wet gas, primarily ethane, propane and butane as well as smaller amounts of heavier hydrocarbons; partially liquid under atmospheric pressure
· NGL (natural gas liquids): Light hydrocarbons mainly consisting of ethane, propane and butane which are liquid under pressure at normal temperature
· Oil sands: A naturally occurring mixture of bitumen, water, sand, and clay. A heavy viscous form of crude oil
· Oil and gas value chains: Describes the value that is being added at each step from 1) exploring; 2) developing; 3) producing; 4) transportation and refining; and 5) marketing and distribution
· Oslo Børs: Oslo stock exchange (OSE)
· Peer group: Equinor’s peer group consists of Equinor, Shell, ExxonMobil, OMV, ConocoPhillips, BP, Marathon, Chevron, Total, Repsol, Anadarko and Eni
· Petroleum: A collective term for hydrocarbons, whether solid, liquid or gaseous. Hydrocarbons are compounds formed from the elements hydrogen (H) and carbon (C). The proportion of different compounds, from methane and ethane up to the heaviest components, in a petroleum find varies from discovery to discovery. If a reservoir primarily contains light hydrocarbons, it is described as a gas field. If heavier hydrocarbons predominate, it is described as an oil field. An oil field may feature free gas above the oil and contain a quantity of light hydrocarbons, also called associated gas
· Proved reserves: Reserves claimed to have a reasonable certainty (normally at least 90% confidence) of being recoverable under existing economic and political conditions, and using existing technology. They are the only type the US Securities and Exchange Commission allows oil companies to report
· Refining reference margin: Is a typical average gross margin of our two refineries, Mongstad and Kalundborg. The reference margin will differ from the actual margin, due to variations in type of crude and other feedstock, throughput, product yields, freight cost, inventory etc
· Rig year: A measure of the number of equivalent rigs operating during a given period. It is calculated as the number of days rigs are operating divided by the number of days in the period
· Storting: the Norwegian Parliament
· Upstream: Includes the searching for potential underground or underwater oil and gas fields, drilling of exploratory wells, subsequent operating wells which bring the liquids and or natural gas to the surface
· VOC (volatile organic compounds): Organic chemical compounds that have high enough vapour pressures under normal conditions to significantly vaporise and enter the earth's atmosphere (e.g. gasses formed under loading and offloading of crude oil)
262 Equinor, Annual Report on Form 20-F 2018
5.7 Forward-looking statements
This Annual Report on Form 20-F contains certain forward-looking statements that involve risks and uncertainties, in particular in the sections "Business overview" and "Strategy and market overview". In some cases, we use words such as "aim", "ambition", "anticipate", "believe", "continue", "could", "estimate", "expect", "intend", "likely", "objective", "outlook", "may", "plan", "schedule", "seek", "should", "strategy", "target", "will", "goal" and similar expressions to identify forward-looking statements. All statements other than statements of historical fact, including, among others, statements regarding future financial position, results of operations and cash flows, including plans to grow ROACE to 12% in 2020; future financial ratios and information; future financial or operational performance; future market position and conditions; future credit rating; future worldwide economic trends and market conditions, including the importance of trade tensions and emerging economies; future investment in new energy solutions; our intention to become a broad energy company, including to be at the forefront of the energy transition; future development and maturity of the portfolio; business strategy and competitive position; sales, trading and market strategies; research and development initiatives and strategy, expectations related to production levels, unit production cost, investment, exploration and development in connection with our transactions and projects, in Brazil, Canada, Germany, the Gulf of Mexico, the NCS, Russia, Turkey, the United Kingdom and the United States; the agreement with SOCAR related to the Karabagh oilfield; the redesign of the MHPP; employee training and KPIs; discoveries on the NCS and internationally; our strategic cooperation with Rosneft; completion and results of acquisitions, disposals and other contractual arrangements and delivery commitments; reserve information; recovery factors and levels; future margins; future levels or development of capacity, reserves or resources; planned turnarounds and other maintenance activity; plans for cessation and decommissioning; oil and gas production forecasts and reporting; oil and gas volume growth, including for volumes lifted and sold to equal entitlement production; growth, expectations and development of production, projects, pipelines or resources; estimates related to production and development levels and dates; operational expectations, estimates, schedules and costs; exploration and development activities, plans and expectations; expectations relating to licences; expectations relating to leases; oil, gas, alternative fuel and energy prices, volatility, supply and demand; renewable energy production, projects, our carbon footprint and carbon dioxide emissions, industry outlook and carbon capture and storage, including plans to reduce emissions, increase energy efficiency and grow new energy solutions; processes related to human rights laws; organisational structure and policies; technological innovation, implementation, position and expectations; projected operational costs or savings; our ability to create or improve value; future sources of financing; expectations regarding board composition, remuneration and application of the company performance modifier future levels of diversity; exploration and project development expenditure; our goal of safe and efficient operations; effectiveness of our internal policies and plans; our ability to manage our risk exposure; our liquidity levels and management of liquidity reserves; estimated or future liabilities, obligations or expenses; expected impact of currency and interest rate fluctuations; expectations related to contractual or financial counterparties; capital expenditure estimates and expectations; projected outcome, impact or timing of HSE regulations; HSE goals and objectives of management for future operations; expectations related to regulatory trends; impact of PSA effects; projected impact or timing of administrative or governmental rules, standards, decisions, standards or laws (including taxation laws); projected impact of legal claims against us; plans for capital distribution, share buy-backs and amounts and timing of dividends are forward-looking statements. You should not place undue reliance on these forward-looking statements. Our actual results could differ materially from those anticipated in the forward-looking statements for many reasons, including the risks described above in "Risk review", and in "Operational review", and elsewhere in this Annual Report on Form 20-F.
These forward-looking statements reflect current views about future events and are, by their nature, subject to significant risks and uncertainties because they relate to events and depend on circumstances that will occur in the future. There are a number of factors that could cause actual results and developments to differ materially from those expressed or implied by these forward-looking statements, including levels of industry product supply, demand and pricing; exchange rate and interest rate fluctuations; the political and economic policies of Norway and other oil-producing countries; EU directives; general economic conditions; political and social stability and economic growth in relevant areas of the world; Euro-zone uncertainty; global political events and actions, including war, terrorism and sanctions; security breaches, including breaches of our digital infrastructure (cybersecurity); changes or uncertainty in or non-compliance with laws and governmental regulations; the timing of bringing new fields on stream; an inability to exploit growth opportunities; material differences from reserves estimates; unsuccessful drilling; an inability to find and develop reserves; ineffectiveness of crisis management systems; adverse changes in tax regimes; the development and use of new technology, particularly in the renewable energy sector; geological or technical difficulties; operational problems; operator error; inadequate insurance coverage; the lack of necessary transportation infrastructure when a field is in a remote location and other transportation problems; the actions of competitors; the actions of field partners; the actions of the Norwegian state as majority shareholder; counterparty defaults; natural disasters, adverse weather conditions, climate change, and other changes to business conditions; failure to meet our ethical and social standards; an inability to attract and retain personnel and other factors discussed elsewhere in this report.
We use certain terms in this document, such as “resource” and “resources” that the SEC’s rules prohibit us from including in our filings with the SEC. U.S. investors are urged to closely consider the disclosures in our Form 20-F, SEC File No. 1-15200. This form is available on our website or by calling 1-800-SEC-0330 or logging on to www.sec.gov.
Although we believe that the expectations reflected in the forward-looking statements are reasonable, we cannot assure you that our future results, level of activity, performance or achievements will meet these expectations. Moreover, neither we nor any other person assumes responsibility for the accuracy and completeness of the forward-looking statements. Unless we are required by law to update these statements, we will not necessarily update any of these statements after the date of this Annual Report, either to make them conform to actual results or changes in our expectations.
Equinor, Annual Report on Form 20-F 2018 263
5.8 Signature page
The registrant hereby certifies that it meets all of the requirements for filing on Form 20-F and that it has duly caused and authorised the undersigned to sign this annual report on its behalf.
EQUINOR ASA
(Registrant)
By: /s/ LARS CHRISTIAN BACHER
Name: Lars Christian Bacher
Title: Executive Vice President and Chief Financial Officer
Dated: 15 March 2019
264 Equinor, Annual Report on Form 20-F 2018
5.9 Exhibits
The following exhibits are filed as part of this annual report:
Exhibit no | Description |
| | |
Exhibit 1 | Articles of Association of Equinor ASA, as amended, effective from 15 May 2018 (English translation). |
Exhibit 2.1 | Form of Indenture among Equinor ASA (formerly known as Statoil ASA and StatoilHydro ASA), Equinor Energy AS (formerly known as Statoil Petroleum AS and StatoilHydro Petroleum AS) and Deutsche Bank Trust Company Americas (incorporated by reference to Exhibit 4.1 of Statoil ASA’s and Statoil Petroleum AS’s Post - Effective Amendment No.1 to their Registration Statement on Form F-3 (File No. 333-143339) filed with the Commission on 2 April 2009). |
Exhibit 2.2 | Amended and Restated Agency Agreement, dated as of 5 May 2017, by and among Equinor ASA, as Issuer, Equinor Energy AS as Guarantor, the Bank of New York Mellon, as Agent and the Bank of New York Mellon SA/NV, Luxembourg Branch as Paying Agent in respect of a €20,000,000 Euro Medium Term Note Programme. |
Exhibit 2.3 | Deed of Covenant, dated as of 5 February 2016, of Equinor ASA (formerly known as Statoil ASA) in respect of a €20,000,000 Euro Medium Term Notes Programme (incorporated by reference to Exhibit 2.2 of Statoil’s annual report on Form 20-F for the fiscal year ended December 31, 2016 (File no. 001-15200) (the “2016 20-F”) filed with the Commission on March 17, 2017). |
Exhibit 2.4 | Deed of Guarantee, dated as of 5 February 2016, of Equinor Energy AS (formerly known as Statoil Petroleum AS) in respect of a €20,000,000 Euro Medium Term Notes Programme (incorporated by reference to Exhibit 2.4 of Equinor's (formerly known as Statoil) 2016 20-F filed with the Commission on March 17, 2017). |
Exhibit 4(a)(i) | Technical Services Agreement between Gassco AS and Equinor Energy AS (formerly known as Statoil Petroleum AS), dated November 24, 2010 (incorporated by reference to Exhibit 4(a)(i) of Equinor's (formerly known as Statoil) 2016 Form 20-F (File no. 001-15200) filed with the Commission on March 17, 2017). |
Exhibit 4(a)(ii) | Amendment no. 1, 2, 3, 4, 5 and 6, dated 17 October 2010, 19 February 2013, 15 December 2012, 17 September 2014, 15 December 2017 and 22 December 2017, respectively, to Technical Services Agreement between Gassco AS and Equinor Petroleum AS (formerly known as Statoil Petroleum AS), dated November 24, 2010 (incorporated by reference to Exhibit 4(a)(ii) of Equinor's (formerly known as Statoil) 2017 Form 20-F (File no. 001-15200) filed with the Commission on March 23, 2018) |
Exhibit 4(c) | Employment agreement with Eldar Sætre as of 4 February 2015 (incorporated by reference to Exhibit 4(c) of Equinor's (formerly known as Statoil) 2016 20-F (File no. 001-15200) filed with the Commission on March 17, 2017). |
Exhibit 8 | Subsidiaries (see Significant subsidiaries included in section 2.7 Corporate in this annual report). |
Exhibit 11 | Code of Conduct. |
Exhibit 12.1 | Rule 13a-14(a) Certification of Chief Executive Officer. |
Exhibit 12.2 | Rule 13a-14(a) Certification of Chief Financial Officer. |
Exhibit 13.1 | Rule 13a-14(b) Certification of Chief Executive Officer.1) |
Exhibit 13.2 | Rule 13a-14(b) Certification of Chief Financial Officer.1) |
Exhibit 15(a)(i) | Consent of KPMG AS. |
Exhibit 15(a)(ii) | Consent of DeGolyer and MacNaughton |
Exhibit 15(a)(iii) | Report of DeGolyer and MacNaughton |
Exhibit 15(a)(iv) | Acknowledgement letter from KPMG AS |
Exhibit 101 | Interactive Data Files (formatted in XBRL (Extensible Business Reporting Language)). Submitted electronically with the annual report on Form 20-F. |
| | |
1) | Furnished only. |
| | |
The total amount of long term debt securities of Equinor ASA and its subsidiaries authorised under instruments other than those listed above does not exceed 10% of the total assets of Equinor ASA and its subsidiaries on a consolidated basis. The company agrees to furnish copies of any such instruments to the Commission upon request. |
Equinor, Annual Report on Form 20-F 2018 265
5.10 Cross reference to Form 20-F
| | Sections |
Item 1. | Identity of Directors, Senior Management and Advisers | N/A |
Item 2. | Offer Statistics and Expected Timetable | N/A |
Item 3. | Key Information | |
| A. Selected Financial Data | Key Figures; 2.10 (Financial review); 4.1 (Consolidated financial statements of the Equinor Group); 5.1 (Shareholder information - Exchange rates) |
| B. Capitalisation and Indebtedness | N/A |
| C. Reasons for the Offer and Use of Proceeds | N/A |
| D. Risk Factors | 2.11 (Risk review—Risk factors) |
Item 4. | Information on the Company | |
| A. History and Development of the Company | Equinor at a Glance; 2.2 (Business Overview); 2.3 (E&P Norway – Exploration & Production Norway); 2.4 (E&P International – Exploration & Production international); 2.5 (MMP – Marketing, Midstream & Processing); 2.6 (Other group); 2.10 (Liquidity and capital resources—Reviews of cash flows); 2.10 (Liquidity and Capital Resources—Investments); note 4 (Acquisitions and disposals) to 4.1 (Consolidated financial statements of the Equinor Group) |
| B. Business Overview | 2.1 (Strategy and market overview); 2.2 (Business overview); 2.3 (E&P Norway – Exploration & Production Norway); 2.4 (E&P International – Exploration & Production international); 2.5 (MMP – Marketing, Midstream & Processing); 2.6 (Other group); 2.7 (Corporate) |
| C. Organisational Structure | 2.2 (Business overview—Corporate structure); 2.2 (Business Overview—Segment reporting); 2.7 (Corporate—Subsidiaries and properties) |
| D. Property, Plants and Equipment | 2.3 (E&P Norway – Exploration & Production Norway); 2.4 (E&P International – Exploration & Production international); 2.5 (MMP – Marketing, Midstream & Processing); 2.7 (Corporate—Property, plant and equipment); 2.10 (Liquidity and Capital Resources—Investments); notes 10 (Property, plant and equipment) and 22 (Leases) to 4.1 (Consolidated financial statements of the Equinor Group) |
| Oil and Gas Disclosures | 2.8 (Operational performance—Proved oil and gas reserves); 2.8 (Operational performance—Production volumes and prices); Exhibit 15(a)(iii) |
Item 4A. | Unresolved Staff Comments | None |
Item 5. | Operating and Financial Review and Prospects | |
| A. Operating Results | 2.7 (Corporate—Applicable laws and regulations); 2.9 (Financial review); 2.10 (Liquidity and capital resources—Impact of reduced prices); 2.11 (Risk review—Risk management—Managing operational risks); 2.11 (Risk review—Risk management—Financial risk) |
| B. Liquidity and Capital Resources | 2.10 (Liquidity and capital resources); 2.11 (Risk review—Risk management); notes 5 (Financial risk management), 15 (Trades and other receivables); 16 (Cash and cash equivalents); 18 (Finance debt) and 24 (Other commitments, contingent liabilities and contingent assets) to 4.1 (Consolidated financial statements of the Equinor Group) |
| C. Research and development, Patents and Licences, etc. | 2.2 (Business overview—Research and development); note 7 (Other expenses) to 4.1 (Consolidated financial statements of the Equinor Group) |
| D. Trend Information | passim |
| E. Off-Balance Sheet Arrangements | 2.10 (Liquidity and capital resources—Principal Contractual obligations); 2.10 (Liquidity and capital resources—Off balance sheet arrangements); notes 22 (Leases) and 24 (Other commitments, contingent liabilities and contingent assets) to 4.1 (Consolidated financial statements of the Equinor Group) |
| F. Tabular Disclosure of Contractual Obligations | 2.10 (Liquidity and capital resources—Principal contractual obligations) |
| G. Safe Harbor | 5.7 (Forward-Looking Statements) |
Item 6. | Directors, Senior Management and Employees | |
| A. Directors and Senior Management | 3.5 (Board of directors); 3.6 (Management) |
| B. Compensation | 3.7 (Compensation to governing bodies); 3.8 (Share ownership); note 6 (Remuneration) to 4.1 (Consolidated financial statements of the Equinor Group) |
| C. Board Practices | 3.5 (Board of directors—Audit committee; Compensation and executive development committee); 3.6 (Management) |
| D. Employees | 2.13 (Our people—Employees in Equinor); 2.13 (Our people—Unions and representatives) |
| E. Share Ownership | 3.7 (Compensation to governing bodies); 5.1 (Shareholder information—Shares purchased by the issuer—Equinor’s share savings plan) |
Item 7. | Major Shareholders and Related Party Transactions | |
| A. Major Shareholders | 5.1 (Shareholder information—Major shareholders) |
| B. Related Party Transactions | 2.7 (Corporate—Related party transactions); note 25 (Related parties) to 4.1 (Consolidated financial statements of the Equinor Group) |
| C. Interests of Experts and Counsel | N/A |
Item 8. | Financial Information | |
| A. Consolidated Statements and Other Financial Information | 4.1 (Consolidated financial statements of the Equinor Group); 5.1 (Shareholder information—Dividend policy and dividends); 5.3 (Legal proceedings) |
| B. Significant Changes | None |
Item 9. | The Offer and Listing | |
| A. Offer and Listing Details | 5.1 (Shareholder information) |
| B. Plan of Distribution | N/A |
| C. Markets | 5.1 (Shareholder Information) |
| D. Selling Shareholders | N/A |
| E. Dilution | N/A |
| F. Expenses of the Issue | N/A |
Item 10. | Additional Information | |
| A. Share Capital | N/A |
| B. Memorandum and Articles of Association | 2.11 (Risk review—Risks related to state ownership); 3.1 (Introduction—Articles of association); 3.2 (General meeting of shareholders); 5.1 (Shareholder information); 5.1 (Shareholder Information—Major Shareholders) and note 17 (Shareholders’ Equity and dividends) to 4.1 (Consolidated financial statements of the Equinor Group) |
| C. Material Contracts | N/A |
| D. Exchange Controls | 5.1 (Shareholder information—Exchange controls and limitations) |
| E. Taxation | 5.1 (Shareholder information—Taxation) |
| F. Dividends and Paying Agents | N/A |
| G. Statements by Experts | N/A |
| H. Documents On Display | About the Report |
| I. Subsidiary Information | N/A |
Item 11. | Quantitative and Qualitative Disclosures About Market Risk | 2.11 (Risk review—Risk management); notes 5 (Financial risk management) and 25 (Financial instruments: fair value measurement and sensitivity analysis of market risk) to 4.1 (Consolidated financial statements of the Equinor Group) |
Item 12. | Description of Securities Other than Equity Securities | |
| A. Debt Securities | N/A |
| B. Warrants and Rights | N/A |
| C. Other Securities | N/A |
| D. American Depositary Shares | 5.1 (Shareholder information—Equinor ADR programme fees) |
Item 13. | Defaults, Dividend Arrearages and Delinquencies | None |
Item 14. | Material Modifications to the Rights of Security Holders and Use of | None |
| Proceeds | |
Item 15. | Controls and Procedures | 3.10 (Risk management and internal control); note 28 Condensed consolidated financial information related to guaranteed debt securities to 4.1 (Consolidated financial statements of the Equinor Group) |
Item 16A. | Audit Committee Financial Expert | 3.5 (The work of the board of directors—Audit Committee) |
Item 16B. | Code of Ethics | 3.1 (Introduction—Code of Conduct) |
Item 16C. | Principal Accountant Fees and Services | 3.9 (External Auditor) |
Item 16D. | Exemptions from the Listing Standards for Audit Committees | 3.1 (Introduction—Compliance with NYSE listing rules) |
Item 16E. | Purchases of Equity Securities by the Issuer and Affiliated Purchases | 5.1 (Shareholder Information—Share repurchase, shares purchased by the Issuer) |
Item 16F. | Changes in Registrant’s Certifying Accountant | 3.9 (External Auditor—Item 16 F: Change in Registrant's Certifying Accountant) |
Item 16G. | Corporate Governance | 3.1 (Introduction—Compliance with NYSE listing rules) |
Item 16H | Mine Safety Disclosure | None |
Item 17. | Financial Statements | N/A |
Item 18. | Financial Statements | 4.1 (Consolidated financial statements of the Equinor Group) |
266 Equinor, Annual Report on Form 20-F 2018
Equinor, Annual Report on Form 20-F 2018 267