1
Equinor remuneration report for 2023
Corporate executive committee, board of directors and corporate assembly
Contents
1 Preamble ................................ ................................ ................................ ........................ 2
1.1 Introduction ................................ ................................ ................................ ............. 2
1.2 Letter from the chair of the board of directors ................................ .......................... 3
Equinor in 2023
Equinor executive performance and remuneration in 2023
A revised executive remuneration policy
1 January 2024 base salary adjustment
Changes in the CEC in 2023
2 Key developments in remuneration – 2023 ................................ ................................ ..... 7
2.1 Overall company performance in 2023 ................................ ................................ .... 7
Safety, security and sustainability
People and organisation
Operations
Market
Finance
2.2 Performance-based modifiers used in calculating variable pay ................................ 8
Threshold for payments under variable pay plans
................................ ................................ ............ 9
Company performance modifier
2.3 The board of directors’ assessment of the chief executive officer’s performance ... 10
2.4 Summary of targets and achievement of corporate performance indicators and goals forming
the basis for annual variable pay ................................ ................................ ......................
11
From performance to AVP award ................................ ................................ ................................ .. 12
2.5 Key developments in corporate executive remuneration in 2023 ........................... 13
Execution of policy on executive remuneration in 2023
Remuneration policy changes - 2024
................................ ................................ ............................. 14
General notes on remuneration elements - 2023
Notes on roles and remuneration of CEC members in 2023
2.6 Derogations and deviations from remuneration policy ................................ ........... 16
2.7 Right to reclaim (‘malus and clawback’) ................................ ................................ . 17
2.8 Shareholder feedback on the remuneration report for 2022 ................................ ... 17
2.9 Activities of the compensation and executive development committee in 2023...... 17
3 Remuneration and share ownership of the board of directors and corporate assembly 17
2
3.1 Remuneration of the board of directors................................ ................................ .. 17
3.2 Total number and value of shares held by the members of the board of directors . 18
3.3 Remuneration of the corporate assembly ................................ .............................. 19
3.4 Shares held by the members of the corporate assembly ................................ ....... 20
4 Remuneration and share ownership of the CEC ................................ ........................... 20
4.1 Remuneration of the CEC................................ ................................ ...................... 20
4.2 Shares awarded or due to the CEC in the reported financial year ......................... 22
4.3 Total number and value of shares held by the CEC ................................ ............... 26
4.4 Performance and AVP awarded to the CEC members in the reported financial year27
4.5 Key performance indicators and behaviour goals forming the basis for AVP for the CEC in
2024 36
5 Remuneration and company performance for 2019-2023 ................................ ............. 38
5.1 Comparative tables over the remuneration and company performance compared to the last
five reported financial years ................................................................ ............................. 38
6 Statement by the board of directors on the remuneration report ................................ ... 41
7 Independent auditor’s statement on the remuneration report ................................ ........ 43
8 Appendix: Executive remuneration policy 2021 ................................ ............................ 44
8.1 Remuneration to the board of directors................................ ................................ .. 44
8.2 Remuneration to the corporate assembly ................................ .............................. 44
8.3 Remuneration to the CEC................................ ................................ ...................... 44
1 Preamble
1.1 Introduction
The remuneration report contains information on the remuneration for:
-
and the executive vice presidents (EVPs)
-
-
The remuneration report is proposed by the BoD, where an advisory vote shall be held by the 2024
annual general meeting (AGM), pursuant to the Norwegian Public Limited Liability Companies Act,
section 6-16b and regulation 2020-12-
11
-2730 and the Norwegian Accounting Act section 7-31b.
The remuneration report should be read in conjunction with the 2021 remuneration policy, which is
included in the Appendix.
3
1.2 Letter from the chair of the board of directors
On behalf of the BoD, I present to you Equinor’s remuneration report for 2023. Our objective is to
provide a comprehensive and transparent overview of the remuneration of the BoD, the corporate
assembly and the CEC in 2023.
Equinor in 2023
In 2023, we continued our focus on developing the energy solutions for tomorrow, while securing the
energy needed today.
The geopolitical situation in the world remains tense. Uncertainty and volatility have continued to impact
economic growth and energy markets. Equinor’s role as a reliable energy provider has never been
more important, particularly with respect to securing a stable supply of gas to Europe.
Equinor’s strategy has been resilient, ensuring energy security, transition, and growth. In 2023, we
delivered our second-best result ever on adjusted earnings. More details on Equinor’s performance
results within the different perspectives of our performance assessment are presented further in this
report and in Equinor’s annual report.
Equinor executive performance and remuneration in 2023
The base salary increases for the members of the CEC in 2023 were at, below and above the general
salary increase frame for Equinor ASA employees.
Equinor’s overall strong financial and operational results in 2023 as described in section 2, was
confirmed through the CEC members’ individual performance results and reflected in their annual
variable pay awards.
An important focus area in 2023 was work on developing and deciding changes to the remuneration of
the CEC members, to meet the requirements of the revised State's Guidelines for the Remuneration of
Senior Executives in Companies with Direct State Ownership (state guidelines) of 12 December 2022.
A revised executive remuneration policy
In May 2023, the AGM approved a revised remuneration policy for Equinor senior executives effective
from 1 January 2024. The policy contains the principles and approach for setting remuneration for the
CEC.
Shareholder expectations, including those of the Norwegian state as set out in the state guidelines, are
important inputs considered in the new policy.
The policy states that reward in Equinor shall be competitive, but not market leading. It should support
the fulfillment of the company's strategy and be acknowledged as moderate, fair, transparent,
consistent, and non-discriminatory.
In response to the state guidelines and the introduction of the new remuneration policy, market
benchmarks have been conducted by two independent survey providers to establish Equinor’s position
towards relevant peers in Norway. The peer group encompasses the largest companies in Norway,
including peers where the Norwegian state has ownership interests. Based on Equinor’s financial value,
business complexity and impact, the executive roles are generally being weighted higher than similar
roles amongst peers in Norway. The benchmarks have therefore been supplemented with an extensive
4
market data report allowing for comparison of remuneration data for similarly weighted executive roles
across all market segments in Norway. This combined approach has enabled the establishment of
broadly substantiated base salary market medians for all the Equinor CEC roles in a Norwegian market
context.
Equinor senior executives have proved to be attractive outside Norway. To fully understand and monitor
retention risk for this group, benchmarking towards the Nordic and European markets and towards the
companies in Equinor’s corporate industry peer group has also been conducted. Equinor’s CEC roles
are significantly below median compared to these markets. This is also confirmed by comparison of
salary levels between industry peers’ corporate groups, see figure below.
Equinor’s positioning vs. corporate industry peer group. Numbers are total remuneration in MNOK. Source: 2022 annual
reports/remuneration reports
In this context the BoD considers the established market medians for the Norwegian market to
represent the minimum competitive remuneration level for the CEC roles. Overall, Equinor’s CEC roles
are positioned at or below the Norwegian market medians.
Equinor seeks to build and retain a diverse executive team that reflects the company’s global footprint
and strategy of becoming a broad energy company. The market positioning of individual roles was the
main objective when deciding the annual base salary adjustments for the CEO and other members of
the CEC in 2023. The aim for the adjustments has been to maintain, or progress over time, towards a
position at the market medians in Norway. Individual performance has been utilized to tune the final
adjustments. The annual salary review for all employees in Equinor ASA has also been considered.
Equinor has historically applied a consistent and moderate approach to salary placement and growth
for senior executives and other employees. This has resulted in CEO remuneration levels relative to all
employee's remuneration levels in Norway being substantially reduced over the last decade. The
average CEO-to-employee remuneration ratio for 2012-2013 was 18.13 compared to 14.38 for 2022-
2023 ref figure below. This exemplifies how the principle of moderation has been applied for
remuneration on executive level in Equinor over time.
5
0,00
5,00
10,00
15,00
20,00
2012-2013
(18.13)
2022-2023
(14.38)
CEO vs ASA employees in Norway
Total remuneration ratio
CEO vs. Equinor ASA employees in Norway, total remuneration ratio
Source: annual reports/remuneration reports
1 January 2024 base salary adjustment
The revised remuneration policy includes a reduction in the annual bonus from the previous max 45%
to max 25% of base salary and a reduction of maximum combined bonus and share programs from
80% to max 55% of base salary. The revised policy was effective from 1 January 2024.
This reduction in variable pay would weaken remuneration competitiveness for all CEC members.
Correspondingly, the financial impact of such a sudden and significant year-on-year reduction in
compensation entails increased retention risk. The reduction is also a departure from market practice
and represents as such a significant challenge in terms of recruiting to CEC positions.
To secure competitiveness the BoD decided to maintain total remuneration levels after the reduction in
variable pay levels. This is done through providing an extraordinary base salary adjustment, effective 1
January 2024. Although not effective in the 2023 reporting year, the BoD deems it pertinent to disclose
this adjustment now, as this was decided in 2023 and is effective at the time of the executive
remuneration report being published.
When deciding this adjustment, emphasis has been placed on predictability and fairness through
retaining a simple, stable, and transparent reward framework also for the CEC group of employees. The
adjustment further strengthens the weight placed on fixed pay as a percentage of total remuneration.
6
Alignment with Equinor’s long-term approach of offering competitive remuneration within a moderate
framework for senior executives was also considered.
Changes in the CEC in 2023
Philippe François Mathieu joined the CEC on 1 January taking over as
EVP Exploration & Production
International (EPI) from
Alasdair Cook who resigned from the company.
There were no other changes and all members served on the CEC the full calendar year.
Jon Erik Reinhardsen
2 Key developments in remuneration – 2023
2.1 Overall company performance in 2023
The below summarises Equinor’s results for 2023 within the five perspectives of our performance
assessment, as described in the annual report.
7
Safety, security and sustainability
Strategic objective: An industry leader in safety and security with a clear energy transition plan
Equinor’s key safety indicators have improved over several years, and this level has been maintained
for 2023. The serious incident frequency indicator (SIF) for 2023 is at a historical low level, and only
marginally above the target. This was, however, overshadowed by one tragic fatality incident from a
contracted LPG tanker in Malaysia. The total recordable incident frequency was at 2.4, which is above
the target, but improved compared to 2022. There were 10 oil and gas leakages compared to eight in
2022. The improvement in safety critical maintenance continued in 2023 to the lowest levels ever
recorded. The CO
2
than half of the industry average.
People and organisation
Strategic objective: A values-based and purpose driven company that attracts and develops people
The company continues to strengthen the capacity and capability through new recruitment. In 2023
Equinor welcomed around 2,000 new colleagues. The effort to reach the ambition set for diversity and
inclusion parameters continues. The 2023 global people survey (GPS) results show significant
improvement in the scores indicating that employees are feeling safe addressing concerns without fear
of negative consequences. Scores for engagement and commitment are the highest in five years.
Scores related to delivering on ambitions and contributing to sustainability are slightly reduced
compared to last year.
Operations
Strategic objective: A top performing energy company
The total equity production of gas and liquids increased by around 2% from 2,039 kboe/d in 2022 to
2,082 kboe/d in 2023. International production was strong in 2023. The increased capacity at Johan
Sverdrup contributed well to the growth. Turnarounds on the Norwegian continental shelf (NCS)
impacted production in the second and third quarter. The total gas production decreased by 5%, whilst
liquid production increased by 10%.
The total power generation increased by 59% from 2022 to 2023 driven by Triton Power and Rio
Energy, up from 2,661 GWh to 4,235 GWh. The annual production was impacted by delays on the
Doggerbank A development.
Market
Strategic objective: A flexible and sustainable energy portfolio
8
Business development and sanctioning of new projects improved the oil and gas portfolio during 2023.
Sanctioning of key projects Raia, Rosebank, Sparta, the acquisition of Suncor UK and announced
divestments from Nigeria and Azerbaijan contributed to this. Equinor’s profitable project portfolio has an
average break-even price of around 35 USD per barrel. Maintaining this level, with the recent cost
inflation, demonstrates strong capital discipline and improvements.
Equinor’s performance is in line with the ambitions in the energy transition plan to reach net zero in
2050. In 2023, 8 GW of renewable capacity was added to the project portfolio through the acquisitions
of Rio Energy and BeGreen. Gross capex share to renewables and low carbon was 20 %, on track to
above 30% by 2025, and above 50% by 2030.
Finance
Strategic objective: A cash generating, profitable and competitive company delivering value to our
stakeholders
Equinor delivered its second-best adjusted earnings result ever in 2023. The guiding for the midstream
segment was increased in 2023 and deliveries were in, or above the range for all quarters. Equinor
was ranked number one among peer group companies
1
(RoACE) and in 3rd quartile on total shareholder return (TSR) in 2023. Despite reduced gas prices and
continued cost pressure, Equinor maintained financial robustness and solid cash flow from operations
after tax in 2023 of around 20 USD bn, in line with the guiding for the year. Operating and
administrative expenses have increased by 10% from 2022, driven by inflation, increased production
and exchange rate movements. Organic, net capex was USD 10.2 billion for the full year, in line with
the guiding.
2.2 Performance-based modifiers used in calculating variable pay
As described in the remuneration policy, a threshold and a company performance modifier (CPM) are
applied as a means of strengthening the link between the company’s overall financial results and the
individual’s variable pay. The results of these modifiers for 2023 are presented below.
Threshold for payments under variable pay plans
With reference to the definitions and parameters described in the remuneration policy, the company
performance for 2023 is assessed as being in the green zone.
1
The composition of Equinor’s defined peer group can be found on equinor.com
– link


9
(1) Cash flow provided by
operating activities after tax and
before working capital items was
USD 19.7 billion
(2) Net debt ratio and
development was -21.6%
(3) Company’s overall
operational and financial
performance: ref. section 2.1.
Combined result in
green zone
No
reduction
in
payout
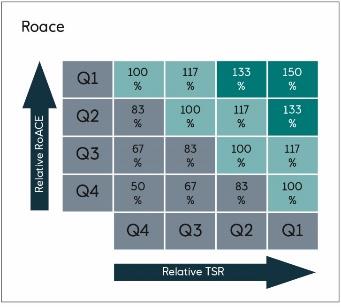
Company performance modifier
With reference to the definitions and parameters described in the remuneration policy, the CPM for
2023 is set at 117%.
-
Equinor.
-
-
2.3 The board of directors’ assessment of the chief executive officer’s
performance
2023 proved to be yet another special year for Equinor. The challenging global security
situation deteriorated throughout the year and the uncertainty in the macroeconomic outlooks
observed in 2022 manifested itself through supply chain disruption, inflation, significant rise in
interest rates and energy market volatility. This impacted the company`s performance both
positively and negatively throughout the different areas of the business.
10
Equinor’s position as a key enabler for Europe’s energy security and supply was further
consolidated throughout the year with the initiation of new partner relations and stable
deliveries with long-term prospects.
The year saw the transitional strategy continued to be brought into practice. There was a
significant increase in land- and offshore based power generation. Further commitment to the
strategy was proven through acquisitions and restructuring within renewable-, low carbon
solutions- and the oil and gas portfolios.
The BoD would like to express that it recognizes that 2023 saw the best SSU results ever
measured. However, the result sadly enough includes a fatality accident on board an Equinor
chartered vessel, and this does overcast this achievement. The BoD appreciates the CEO’s
long term and continuous commitment to improving results within the wider SSU perspective
and is confident this systemic effort will continue to show results both short and long term.
The year was influenced by operational challenges. Still the financial result for Equinor came
out second best in the history of the company. This demonstrates and reinforces the company’s
proven ability to maintain high earnings, deliver on its ambitions and with very good relative
RoACE, even under demanding frame conditions.
In its total assessment of the CEO’s performance for 2023, the BoD has considered that the
deliveries in the key areas have been above, at or below targets.
The
business delivery
remuneration (performance year 2023) was based on the following performance indicators
(KPIs): SIF, upstream CO
₂
RoACE, unit
production cost (UPC). Ref. also Table 4 for details.
The 12 months
SIF
indicator had a target of 0.3. Although the result was at 0.4 (0.37), it was
historically low. Over the last 12 months 50 serious incidents have occurred. This is
approximately 10% less than the 2022 number. The activity level was higher than 2022
(approximately 1% more hours).
The
CO
2
2
/boe in 2023. This is a
significant reduction from 2022 by more than 3%, and well below the target of 8.0 kg CO
2
/per
boe. The upstream production levels increased by around 1.4% and CO
2
by 0.7% compared to 2022.
increased capacity at Johan Sverdrup.
Unit production cost
affected by inflation. The NOK/USD currency effect has been favourable for UPC whilst lower
production has had a negative effect.
REN power production
still a substantial increase (288 GWh) from 2022. The main contributors were the new fields in
operation and acquired assets.
11
With regards to the financial results, 2023 has shown very strong earnings. Equinor ended on
top in the peer group ranking on
and number 8 out of 12 on the
TSR
financial robustness remains strong.
The
business behaviour
(HOW)
remuneration was based on the following set of goals: Demonstrate accountability, visibility,
and engagement for safety, security, and compliance, Build trust in Equinor, Transform the
organization to deliver on our common purpose and become a leading company in the energy
transition, Develop strong and diverse succession pipeline, ref Table 4.
The BoD's total assessment of these goals showed a robust result and an overall improvement
from 2022.
Competence building to support the company’s transition strategy improved during the year
and ended above set target.
Equinor's recruitment level during 2023 was high. Increased attractiveness led to both renewal
and to closing the overall staffing gap. Although improved in some areas, the diversity and
inclusion result requires continued focus going forward.
The Equinor GPS shows general strong results and significant improvements from 2022. The
BoD’s impression of further progress and status on overall employee satisfaction remains
positive.
Overall, the BoD is very satisfied with the CEO’s performance and will in particular highlight his strong
and consistent leadership whilst transitioning the company in a challenging external environment.
2.4 Summary of targets and achievement of corporate performance indicators
and goals forming the basis for annual variable pay
The BoD decides on a comprehensive set of KPIs and behaviour goals to facilitate direction and areas
of focus prior to each calendar year. The KPIs and behaviour goals to be used by the BoD to assess
the CEO’s performance in relation to the AVP for the upcoming calendar year are selected from this set
and included in an annual performance contract with the CEO. The selected performance indicators
and goals are those assessed to be most critical in achieving the core strategic objectives for the
company in the coming year.
The corporate delivery KPIs and behaviour goals selected for the CEO are similarly set forth in a
performance contract between the CEO and EVPs, to the extent these are deemed relevant. For the
EVPs of business areas, a selection of additional business area KPIs supporting the company’s
strategic ambitions from the specific business area is included in their performance contracts.
From performance to AVP award
12
As described in the remuneration policy, performance forms the basis for the decision on annual
variable pay (“AVP”) percentages for the members of the CEC.
Common corporate delivery KPIs, business area specific delivery KPIs and behaviour goals are
measured separately and assessed holistically, as described below.
These together form the basis for payment of annual variable pay, where delivery KPIs and behaviour
goals each have a weight of 50%. For EVPs in business areas delivery KPIs are weighted to comprise
50% corporate KPIs and 50% business area specific KPIs.
The individual KPIs and goals within a category are equally weighted initially and can be adjusted to
reflect prevailing business context and strategic priorities.
Group of CEC member
Weighting of KPIs in “what”
dimension – 50%
Weighting of goals
in “how”
dimension – 50%
Corporate
delivery KPIs
Business area
delivery KPIs
Corporate
behaviour goals
CEO and staffs EVPs (EVPs without BA responsibility)
50%
-
50%
EVPs with BA responsibility
25%
25%
50%
Delivery in 2023 against the selected corporate delivery goals (“what” dimension) which are applied to
the CEO, as well as the individual EVPs, is summarized as follows:
KPI
Target
Performance
• Serious Incident Frequency
0.3 or better
0.4
• CO
2
8 kg CO
2
6.7 kg/boe
• Relative TSR
Above average in the peer ranking list
'ge
Third quartile
• Relative RoACE
Ranked in first quartile among peers
First quartile
• Unit production cost (UPC)
2
<6.0 USD/boe
6.2 USD/boe
• Renewable (REN) power production
3
2 TWh
1.9 TWh
For EVPs with business area responsibilities, the assessment of the business delivery dimension has in
addition been made against the following KPIs:
Business area
KPI
Unit
Target
EPN
Production
kboe/d
1,446
UPC
nominal USD/boe
5.8
Break-even price (CMU portfolio)
USD/bbl
<35
EPI
Production
kboe/d
677
UPC
nominal USD/boe
6.5
Break-even price (CMU portfolio)
USD/bbl
<35
2
O
nly apply to the CEO and staffs EVPs
13
MMP
Production efficiency
%
Net operating income (ex derivatives)
bn USD
Fixed opex & SG&A
mill USD
1,285
REN
REN power generation
TWh
2
Net operating income adjusted
mill USD
> -200
PDP
Number of wells
number
104
Break-even price (CMU portfolio)
USD/bbl
<35
Estimate development DG3-DG4
%
100
TDI
Low carbon R&D
>30
Software consolidation progress
50
TDI task responsibility cost savings
NOK mill, 100%
500
In terms of the “how” dimension, common behaviour goals are defined for the CEO and the EVPs with
reference to Equinor’s core values and leadership principles, as follows:
-
-
-
the energy transition
-
Performance against these behaviour goals is measured on an individual basis for the CEC members.
The KPI targets and results of the business deliveries (“what”), and the behaviour goals and results
(“how”) and how these translate into the AVP award are presented for the individual CEC members in
the Table 4 section further below.
The KPI targets and behaviour goals applicable for the performance measurement for
AV
P in 2024 are
presented in section 4.5.
2.5 Key developments in corporate executive remuneration in 2023
Execution of policy on executive remuneration in 2023
The remuneration of the CEC members for 2023 was determined in accordance with the remuneration
policy and principles approved by the AGM on 11 May 2021. These principles, as well as details on the
elements constituting executive remuneration are outlined in Equinor’s remuneration policy, see
Appendix.
The values-based performance framework and the main elements of remuneration applies to the CEC
members employed by Equinor ASA and subsidiaries, in accordance with Equinor’s remuneration
policy.
No changes were introduced to the executive remuneration policy in relation to the 2023 reporting year.
14
Remuneration policy changes - 2024
Although not effective in the 2023 reporting year, the BoD finds it appropriate to inform of the revised
remuneration policy approved by the AGM on 10 May 2023, adopting the expectations set out in the
revised state guidelines from December 2022, effective from 1 January 2024.
The policy introduces the following changes:
●
from 25% to 12.5% of base salary, with a maximum pay-out of 25% including the effect of the
CPM.
●
The 25% LTI grant for EVPs, the 5% share saving plan (SSP) contribution and 18% fixed allowance
paid in lieu of pension contributions above 12G
3
The above ensures that no CEC member exceeds the maximum of 55% variable remuneration as set
out in Equinor's remuneration policy.
To mitigate the changes in AVP and LTI, an adjustment has been calculated and applied to the base
salary from 1 January 2024 to ensure that total remuneration is maintained at the current level.
Although the base salary is increased, the AVP payment will be reduced due to the lower percentage
applied in the calculations. SSP amounts will be higher as the maximum percentage for savings
remains unchanged. The same applies for LTI except for the CEO whose LTI is reduced.
In total, the adjustment ensures that the increase in base salary balances the changes to levels of AVP,
LTI and SSP, having a zero effect on total remuneration.
As payments of AVP vary year-on-year by both the individuals’ performance and the company
performance modifier, calculations on AVP are based on the results of these parameters for the
preceding 5-year period. This is to ensure that calculations under the new policy are based on historical
remuneration levels.
General notes on remuneration elements - 2023
Fixed pay
The objective of the annual base salary review has been to maintain or progress towards market
median for similar positions in Norway.
Individual performance and the average salary growth for all employees in Equinor ASA has also been
considered.
Market median in Norway and Equinor’s executive roles relative to this has been established through
extensive benchmarking conducted by two independent survey providers. Equinor’s CEC roles are
positioned at or below market median for similar roles in the Norwegian market, and significantly below
median in the Nordic and European markets.
3
G represents the basic amount of the Norwegian social security system. 1G per 31 December 2023 equals NOK 118,620
15
The salary negotiations for Equinor ASA were settled at 5.6% in 2023. For the CEO and half of the
CEC, the base salary adjustment as measured in percentage was at or below the salary settlement in
Equinor ASA.
Strengthening competitiveness and the need for calibrating towards median in the market has been the
main driver when providing the remaining CEC members with a salary adjustment above average in
Equinor ASA. The adjustment will move these CEC roles from a significant gap to market median closer
to market median. Most of the roles will however remain below median compared to similar positions in
Norway, and significantly below median in other relevant markets. Equinor’s objective is to progress
these roles towards market median in Norway over time.
Limiting the CEC base salary adjustment to the average salary adjustment for all employees in Equinor
ASA as measured in NOK has been considered. The BoD has, however, given the salary levels relative
to benchmarks, seen such salary adjustment of executive pay as a significant increase in risk when it
comes to recruitment and retention of key competencies and capabilities and the need for maintaining
attractive terms that support motivation and secure the leadership qualities amongst Equinor’s senior
executives required to safeguard secure and profitable operations and the continuing development of
the company in line with its established strategy.
Variable remuneration
Based on the overall company performance in 2023 and in accordance with the threshold criteria
described in the remuneration policy the AVP payments were not reduced.
The target for annual variable pay for the CEC members, all of whom were employees of Equinor ASA
in 2023 was 25% of base salary, and the maximum annual variable pay for 2023 was 45% of base
salary.
The company performance modifier and the threshold affect the final annual variable pay award. As
described above, the CPM was set at 117% for 2023. There was no threshold effect applied for 2023.
The LTI grants in 2023 were not reduced, as the threshold for the previous year – 2022 – was in the
green zone.
Benefits
As described in the remuneration policy, members of the CEC employed in Equinor ASA are covered
by the company’s general occupational defined contribution pension scheme. A defined benefit scheme
is retained for a grandfathered group of employees. In 2023, this applies to Geir Tungesvik.
A fixed salary addition calculated as 18% of base salary is provided in lieu of pension accrual above 12
G to members of the CEC covered by the general defined contribution pension scheme and
who were
employed by Equinor ASA before 1 September 2017. This addition does not form part either of the
pensionable salary or of the basis for variable pay.
Notes on roles and remuneration of CEC members in 2023
16
CEC member
Position
Period on CEC in 2023 and
notes on remuneration
Anders Opedal
President and chief executive officer
(CEO)
Full year
Irene Rummelhoff
EVP Marketing, Midstream &
Processing (MMP)
Full year
Geir Tungesvik
EVP Projects, Drilling & Procurement
(PDP)
Full year
Geir Tungesvik maintained in
the closed defined benefit
scheme.
Jannicke Nilsson
EVP Safety, Security & Sustainability
(SSU)
Full year
Pål Eitrheim
EVP Renewables (REN)
Full year
Philippe François
Mathieu
EVP Exploration & Production
International (EPI)
Full year
Kjetil Hove
EVP Exploration & Production Norway
(EPN)
Full year
Hege Skryseth
EVP Technology, Digital & Innovation
(TDI)
Full year
Torgrim Reitan
EVP and Chief financial officer (CFO)
Full year
Torgrim Reitan is entitled to
early retirement from age 65
with a pension level amounting
to 66% of pensionable salary.
Siv Helen Rygh
Torstensen
EVP Legal & Compliance (LEG)
Full year
Aksel Stenerud
EVP People & Organisation (PO)
Full year
Jannik Lindbæk
EVP Communication (COM)
Full year
2.6 Derogations and deviations from remuneration policy
There were no derogations or deviations from the remuneration policy in 2023.
2.7 Right to reclaim (‘malus and clawback’)
There were no cases where the right to reclaim was exercised in 2023.
17
2.8 Shareholder feedback on the remuneration report for 202 2
The remuneration report for 2022 was presented for approval (advisory vote) at the annual general
meeting on 10 May 2023 and was endorsed by a significant majority. The portion of the votes in favour
of the remuneration report for 2022 constituted 99.15% of the total votes cast. There were no additional
statements from shareholders regarding the 2022 remuneration report to the 2023 AGM.
2.9 Activities of the compensation and executive development committee in 2023
The activities of the board compensation and executive development committee (BCC) in 2023 were in
line with the instructions from the BoD which are available on
equinor.com
.
The BCC had a high focus in 2023 on ensuring compliance with the revised state guidelines. This
included discussing and reviewing the proposal for revising the balance and level of the CEC members’
remuneration elements effective 1 January 2024, as described in section 1.2.
Other activities included:
-
-
-
relevant company performance results
-
-
CEO
-
-
the EVPs
-
-
3 Remuneration and share ownership of the board of directors and
corporate assembly
3.1 Remuneration of the board of directors
In 2023, the total remuneration to the BoD, including fees for the BoD's three committees, was USD
746 thousand (NOK 7,885 thousand).
Detailed information about the individual remuneration to the members of the BoD in 2023 is provided
in the table below.
18
Total remuneration
Members of the BoD (figures in USD thousand)
2019
2020
2021
2022
2023
Jon Erik Reinhardsen (chair of the BoD)
110
108
119
110
103
Anne Drinkwater (deputy chair of the BoD)
100
88
82
96
101
Rebekka Glasser Herlofsen
62
59
66
66
67
Jonathan Lewis
93
76
70
80
82
Finn Bjørn Ruyter
37
69
77
71
67
Tove Andersen
-
27
59
55
52
Michael Lewis
1
28
37
Haakon Bruun-Hanssen
-
-
-
-
66
Per Martin Labråten
2
56
54
66
65
62
Stig Lægreid
2
56
54
59
55
53
Hilde Møllerstad
2
32
59
66
61
57
Employee representative deputy members of the BoD
Hans Einar Haldorsen
3
Bjørn Palerud
-
-
-
-
Anita Skaga Myking
-
-
-
-
Harald Wesenberg
4
1) Member of the BoD until 16 March 2023
2) Employee-representative members of the BoD
3) Deputy member until 30 June 2023
4) Deputy member from 1 July 2023
Total remuneration of members of the BoD (figures in USD thousand)
2019
2020
2021
2022
2023
714
754
832
801
746
3.2 Total number and value of shares held by the members of the board of
directors
The number of Equinor shares owned by members of the BoD of and/or owned by their close
associates is shown below. Individually, each member of the BoD owned less than 1% of the
outstanding Equinor shares.
The voting rights of members of the BoD, the CEC and the corporate assembly as a shareholder do not
differ from those of ordinary shareholders.
Ownership of Equinor
shares (incl. shares
owned by close
associates)
As of 1 Jan.
2023
As of
31
Dec.
2023
Market value as of 31
Dec. 2023, USD
thousand
As of 12
March 2024
Jon Erik Reinhardsen
4,584
4,584
140
4,584
Anne Drinkwater
1,100
1,100
34
1,100
Rebekka Glasser
Herlofsen
220
220
7
220
Jonathan Lewis
-
-
-
-
Finn Bjørn Ruyter
620
620
19
620
19
Tove Andersen
4,700
4,700
143
4,700
Michael Lewis
-
-
-
-
Haakon Bruun-Hanssen
-
-
-
-
Per Martin Labråten
587
894
27
1,052
Stig Lægreid
5
147
4
147
Hilde Møllerstad
6,290
3,005
92
3,676
Deputy members
Hans Einar Haldorsen
1,875
-
-
Bjørn Palerud
974
1,305
40
1,497
Anita Skaga Myking
6,240
6,654
203
6,891
Harald Wesenberg
-
936
29
1,137
3.3 Remuneration of the corporate assembly
In 2023, the total remuneration to the shareholder and employee-elected members of the corporate
assembly was USD 117 thousand (NOK 1,240 thousand).
Total
remuneratio
n
Corporate assembly employee elected members (figures in USD
thousand)
2022
2023
Peter Bernhard Sabel
5
5
Trine Hansen Stavland
1
-
3
Ingvild Berg Martiniussen
2
5
5
Berit Søgnen Sandven
5
5
Frank Indreland Gundersen
3
1
3
Per Helge Ødegård
2
5
5
3
Raymond Midtgård (observer)
4
-
3
Vidar Frøseth (observer)
5
1
3
Kjetil Gjerstad (observer)
5
2
4
Oddvar Karlsen
6
5
2
Lars Olav Grøvik
6
5
2
Terje S. Enes
6
5
2
Frode Mikkelsen
6
5
-
Anne Kristi Horneland (observer)
6
5
2
Employee elected deputy members who received member fees
Terje Herland
1
1
Porfirio Esquivel
7
-
1
Steinar Kåre Dale
6
2
-
Katrine Knarvik-Skogstø
6
2
-
Total remuneration
54
45
20
1) New member from 11 May 2023
2) New member from 11 May 2023, previous observer
3) New member from 11 May 2023, previous deputy
4) New observer from 11 May 2023
5) New observer from 11 May 2023, previous deputy
6) Left the corporate assembly as of 10 May 2023
7) New deputy from 11 May 2023
3.4 Shares held by the members of the corporate assembly
Individually, each member of the corporate assembly owned less than 1% of the outstanding Equinor
shares as of 31 December 2023 and as of 12 March 2024. In aggregate, members of the corporate
assembly owned a total of 18,794 shares as of 31 December 2023 and a total of 21,035 shares as of
12 March 2024. Information about the individual share ownership of the members of the corporate
assembly is presented in section 8 of the annual report «Board statement on corporate governance”.
4 Remuneration and share ownership of the CEC
4.1 Remuneration of the CEC
In 2023, the aggregate remuneration to the CEC was USD 10,689 thousand (2022: USD 12,647
thousand).
No loans have been granted by the company to members of the CEC.
Below is an overview of the total remuneration of the CEC members in 2023.
21
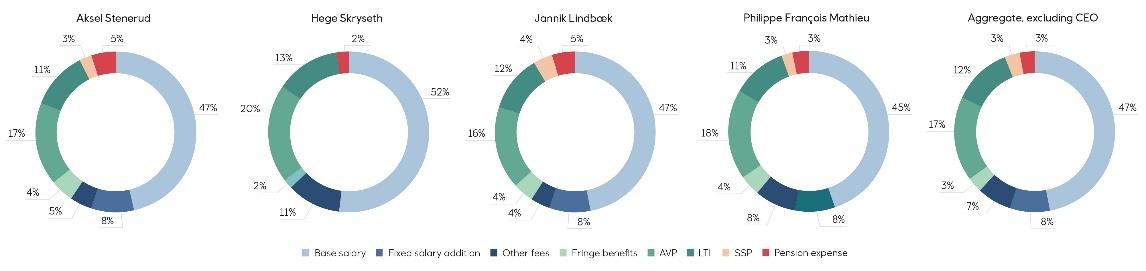
Table 1 – Remuneration of the corporate executive committee for the reported financial year
2023
All remuneration elements are provided in the currency of the employing entity and converted to USD at
the average exchange rate for the year. As of 2023, the exchange rate used in quarterly reporting is
consistently applied to remuneration reporting, i.e. USD/NOK. For 2023 the exchange rate is USD/NOK
= 10.5647.
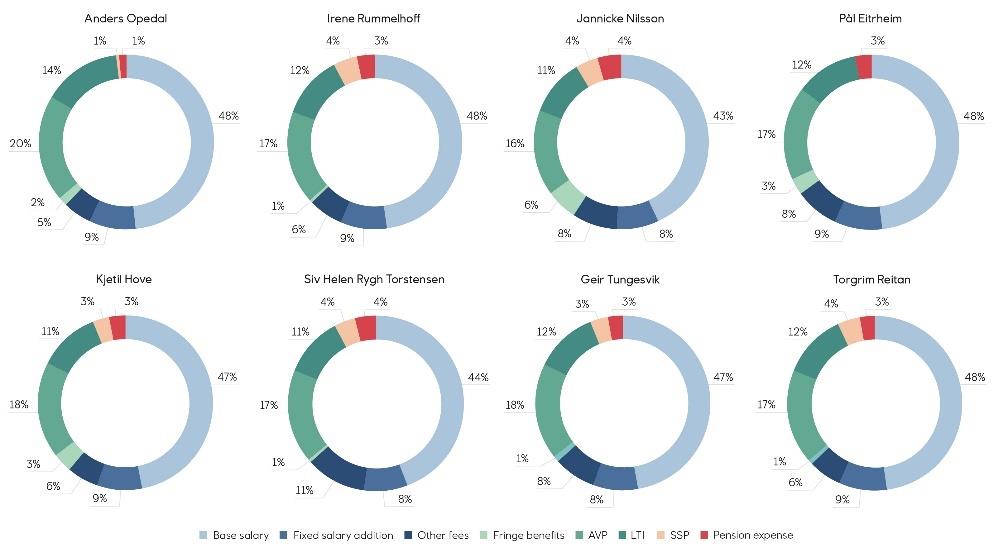
Fixed remuneration
Variable remuneration
Fees
One-
year
variable
Multi-year
variable
Members of the corporate
executive committee
(figures in USD thousand)
Base
salary
Fixed
salary
addition
Other
fees
Fringe
benefits
AVP
LTI
SSP
Extra-
ordinary
items
Pension
expenses
Total
remune-
ration
Proportion of
fixed and
variable
remuneration
Anders Opedal
951
171
105
29
391
281
9
0
27
1,963
65%/35%
Irene Rummelhoff
419
75
55
5
149
102
39
0
28
873
67%/33%
Jannicke Nilsson
342
61
65
47
124
84
32
0
35
790
70%/30%
Pål Eitrheim
378
68
63
25
135
92
0
0
22
783
71%/29%
Kjetil Hove
472
85
59
34
180
115
30
0
29
1,005
68%/32%
Siv Helen Rygh Torstensen
297
53
74
5
115
73
26
0
26
670
68%/32%
Geir Tungesvik
375
68
60
10
141
92
27
0
21
794
67%/33%
Philippe François Mathieu
396
71
72
37
160
97
22
0
27
883
68%/32%
Torgrim Reitan
450
81
59
7
165
110
40
0
25
936
66%/34%
Aksel Stenerud
298
54
30
29
108
73
17
0
31
639
69%/31%
Hege Skryseth
381
0
78
14
145
95
0
0
17
731
67%/33%
Jannik Lindbæk
292
53
24
26
103
72
23
0
29
623
68%/32%
Remuneration of the corporate executive committee for the financial year 2022
All remuneration elements are provided in the currency of the employing entity and converted to USD at
the average exchange rate for the year. The exchange rate used for 2022 was: NOK/USD =0.1043
(corresponding to USD/NOK 9.5877).
22
Fixed remuneration
Variable remuneration
Fees
One-
year
variable
Multi-year
variable
Members of the corporate
executive committee
(figures in USD thousand)
Base
salary
Fixed
salary
addition
Other
fees
Fringe
benefits
AVP
LTI
SSP
Extra-
ordinary
items
Pension
expenses
Total
remune-
ration
Proportion of
fixed and
variable
remuneration
Anders Opedal
999
180
97
28
411
295
6
0
28
2,042
65 %/ 35 %
Irene Rummelhoff
436
78
74
10
198
107
28
0
29
961
65 %/ 35 %
Jannicke Nilsson
360
65
87
47
138
89
23
0
37
844
70 % / 30
%
Pål Eitrheim
393
71
31
23
146
97
0
0
23
783
69 % / 31
%
Kjetil Hove
490
88
72
31
202
120
21
0
30
1,055
67 % / 33%
Siv Helen Rygh Torstensen
311
56
68
20
120
77
14
0
27
691
70 % / 30
%
Geir Tungesvik
264
48
37
1
98
65
12
0
17
541
68 % / 32
%
Torgrim Reitan
116
20
21
1
46
29
7
0
6
245
67 % / 33%
Aksel Stenerud
260
47
49
17
101
64
10
0
28
575
70 % / 30
%
Hege Skryseth
139
0
33
1
52
35
0
156
6
422
42 %/ 58 %
Jannik Lindbæk
257
46
24
17
99
63
14
0
26
546
68 % / 32
%
Notes to the table “Remuneration of the corporate executive committee for the reported financial year”:
●
●
2023 and 2022.
●
●
Average rates 2023: USD
/
NOK = 10.5647, (2022: NOK/USD = 0.1043, corresponding to USD/NOK
9.5877).
●
Other fees
23
●
Fringe benefits
program.
●
AVP
(annual variable pay) is earned in the reporting year and paid out in the following year.
●
LTI
(long-term incentive)
:
The value included in Table 1 represents the grant, i.e. gross amount,
which, after deduction of tax is invested in shares in the reporting year and subject to a lock-in
period.
●
SSP
(share savings plan):
the amounts represent the value of the bonus shares received in the
reporting year after the applicable holding period. Refer to the remuneration policy in the Appendix,
section 8.3, for details of this plan.
●
Pension expenses:
Estimated pension cost for the defined benefit scheme is calculated based on
actuarial assumptions and pensionable salary (mainly base salary) at 31 December 2022 and is
recognised as pension cost in the statement of income for 2023. Geir Tungesvik is maintained in
the closed defined benefit scheme. The pension cost for the defined contribution scheme is
represented by the respective contributions. For the notional contribution scheme, the pension cost
is represented by the contributions and the fair value changes of the employees’ notional assets.
The remaining members of the CEC employed are covered by the defined contribution pension
scheme.
4.2 Shares awarded or due to the CEC in the reported financial year
Table 3
Refer to the remuneration policy for details of the share-based plans.
-
shown in column 5 “End of holding period”.
-
are no performance conditions in relation to shares.
-
represents the same date as shown in column 11 “Shares subject to a holding period“
-
shares are “locked-in” and cannot be disposed of according to plan rules
Name,
Position
The main conditions of share award plans
Information regarding the reported financial year
During the year
Closing
balance
1
Specifi-
cation
of plan
2
Perfor-
mance
period
3
Award date
5
End of
holding
period
6
Shares
awarded at
the
beginning
of the year
7
Shares
awarded
8
Shares vested
11
Shares
subject to a
holding
period
LTI
2020 - 2022
29/05/2020
28/05/2023
3,830
3,830
USD 106,910
2021 - 2023
17/06/2021
16/06/2024
3,614
3,614
Anders Opedal
2022 - 2024
20/05/2022
19/05/2025
4,002
4,002
CEO
2023 - 2025
19/05/2023
18/05/2026
4,530
4,530
USD 129,039
SSP
2023
10/02/2023
319
24
USD 9,042
SUM
11,446
4,849
3,830
12,146
USD 138,081
USD 106,910
The main conditions of share award plans
Information regarding the reported financial year
Opening
balance
During the year
Closing
balance
Name,
Position
1
Specifi-
cation of
plan
2
Perfor-
mance
period
3
Award date
5
End of
holding
period
6
Shares
awarded at
the
beginning of
the year
7
Shares
awarded
8
Shares vested
11
Shares
subject to a
holding
period
LTI
2020 - 2022
29/05/2020
28/05/2023
3,802
3,802
USD 106,128
2021 - 2023
17/06/2021
16/06/2024
1,267
1,267
2022 - 2024
20/05/2022
19/05/2025
1,487
1,487
2023 - 2025
19/05/2023
18/05/2026
1,684
1,684
Irene Rummelhoff
USD 47,970
EVP MMP
SSP
2023
10/02/2023
1,371
USD 38,860
SUM
6,556
3,055
3,802
4,438
USD 86,830
USD 106,128
Name,
Position
The main conditions of share award plans
Information regarding the reported financial year
Opening
balance
During the year
Closing balance
1
Specifi-
cation
of plan
2
Perfor-
mance
period
3
Award date
5
End of
holding
period
6
Shares
awarded at
the
beginning
of the year
7
Shares
awarded
8
Shares vested
11
Shares
subject to a
holding
period
LTI
2022 - 2024
20/05/2022
19/05/2025
863
863
19/05/2023
18/05/2026
1,551
1,551
USD 44,181
Geir Tungesvik
SSP
2023
10.02.2023
939
EVP PDP
USD 26,615
SUM
863
2,490
2,414
USD 70,796
Name,
Position
The main conditions of share award plans
Information regarding the reported financial year
Opening
balance
During the year
Closing balance
1
Specifi-
cation
of plan
2
Perfor-
mance
period
3
Award date
5
End of
holding
period
6
Shares
awarded at
the
beginning
of the year
7
Shares
awarded
8
Shares vested
11
Shares
subject to a
holding
period
LTI
2020 - 2022
29/05/2020
28/05/2023
3,205
3,205
USD 89,464
2021 - 2023
17/06/2021
16/06/2024
1,091
1,091
2022 - 2024
20/05/2022
19/05/2025
1,254
1,254
2023 - 2025
19/05/2023
18/05/2026
1,415
1,415
Jannicke Nilsson
USD 40,307
EVP SSU
SSP
2023
10/02/2023
1,134
USD 32,143
SUM
5,550
2,549
3,205
3,760
USD 72,450
USD 89,464
The main conditions of share award plans
Information regarding the reported financial year
25
Name,
Position
Opening
balance
During the year
Closing
balance
1
Specifi
-cation
of plan
2
Perfor-
mance
period
3
Award date
5
End of
holding
period
6
Shares
awarded at
the
beginning
of the year
7
Shares
awarded
8
Shares vested
11
Shares
subject to a
holding
period
LTI
2020 - 2022
29/05/2020
28/05/2023
3,385
3,385
USD 94,488
2021 - 2023
17/06/2021
16/06/2024
1,153
1,153
2022 - 2024
20/05/2022
19/05/2025
1,478
1,478
2023 - 2025
19/05/2023
18/05/2026
1,549
1,549
Pål Eitrheim
USD 44,124
EVP REN
SUM
6,016
1,549
3,385
4,180
USD 44,124
USD 94,488
Name,
Position
The main conditions of share award plans
Information regarding the reported financial year
Opening
balance
During the year
Closing
balance
1
Specifi
-cation
of plan
2
Perfor-
mance
period
3
Award date
5
End of
holding
period
6
Shares
awarded at
the
beginning
of the year
7
Shares
awarded
8
Shares vested
11
Shares
subject to a
holding
period
LTI
2021 - 2023
17/06/2021
16/06/2024
997
997
2022 - 2024
20/05/2022
19/05/2025
1,670
1,670
Kjetil Hove
2023 - 2025
19/05/2023
18/05/2026
1,894
1,894
USD 53,952
EVP DPN/EPN
SSP
2023
10/02/2023
1,071
USD 30,357
SUM
2,667
2,965
4,561
USD 84,308
Name,
Position
The main conditions of share award plans
Information regarding the reported financial year
Opening
balance
During the year
Closing
balance
1
Specifi
-cation
of plan
2
Perfor-
mance
period
3
Award date
5
End of
holding
period
6
Shares
awarded at
the
beginning
of the year
7
Shares
awarded
8
Shares vested
11
Shares
subject to a
holding
period
LTI
2022 - 2024
18/11/2022
17/11/2025
461
461
2023 - 2025
19/05/2023
18/05/2026
1,595
1,595
Hege Skryseth
USD 45,434
EVP TDI
SUM
461
1,595
USD 45,434
2,056
Name,
Position
The main conditions of share award plans
Information regarding the reported financial year
Opening
balance
During the year
Closing balance
1
Specifi-
cation
of plan
2
Perfor-
mance
period
3
Award date
5
End of
holding
period
6
Shares
awarded at
the
beginning
of the year
7
Shares
awarded
8
Shares vested
11
Shares
subject to a
holding
period
26
LTI
2020 - 2022
29/05/2020
28/05/2023
3,376
3,376
USD 94,237
2022 - 2024
20/05/2022
19/05/2025
283
283
2022 - 2024
18/11/2022
17/11/2025
117
117
Torgrim Reitan
2023 - 2025
19/05/2023
18/05/2026
1,892
1,892
USD 53,895
SSP
2023
10/02/2023
1,406
USD 39,852
SUM
3,776
3,298
3,376
2,292
USD 93,747
USD 94,237
Name,
Position
The main conditions of share award plans
Information regarding the reported financial year
Opening
balance
During the year
Closing
balance
1
Specifi
-cation
of plan
2
Perfor-
mance
period
3
Award date
5
End of
holding
period
6
Shares
awarded at
the
beginning
of the year
7
Shares
awarded
8
Shares vested
11
Shares
subject to a
holding
period
LTI
2021 - 2023
17/06/2021
16/06/2024
545
545
2022 - 2024
20/05/2022
19/05/2025
1,172
1,172
2023 - 2025
19/05/2023
18/05/2026
1,355
1,355
Siv H Rygh Torstensen
USD 38,598
EVP LEG
SSP
2023
10/02/2023
926
USD 26,247
SUM
1,717
2,281
3,072
USD 64,845
Name,
Position
The main conditions of share award plans
Information regarding the reported financial year
Opening
balance
During the year
Closing
balance
1
Specifi-
cation
of plan
2
Perfor-
mance
period
3
Award date
5
End of
holding
period
6
Shares
awarded at
the
beginning
of the year
7
Shares
awarded
8
Shares vested
11
Shares
subject to a
holding
period
LTI
2022 - 2024
20/05/2022
19/05/2025
922
922
2023 - 2025
19/05/2023
18/05/2026
1,256
1,256
USD 35,778
Aksel Stenerud
SSP
2023
10/02/2023
594
EVP PO
USD 16,837
SUM
922
1,850
2,178
USD 52,614
Name,
Position
The main conditions of share award plans
Information regarding the reported financial year
Opening
balance
During the year
Closing
balance
1
Specifi-
cation
of plan
2
Perfor-
mance
period
3
Award date
5
End of
holding
period
6
Shares
awarded at
the
beginning
of the year
7
Shares
awarded
8
Shares vested
11
Shares
subject to a
holding
period
LTI
2022 - 2024
20/05/2022
19/05/2025
952
952
2023 - 2025
19/05/2023
18/05/2026
1,261
1,261
USD 35,920
27
Jannik Lindbæk
SSP
2023
10/02/2023
825
EVP COM
USD 23,384
SUM
952
2,086
2,213
USD 59,304
Name,
Position
The main conditions of share award plans
Information regarding the reported financial year
Opening
balance
During the year
Closing
balance
1
Specifi-
cation
of plan
2
Perfor-
mance
period
3
Award date
5
End of
holding
period
6
Shares
awarded at
the
beginning
of the year
7
Shares
awarded
8
Shares vested
11
Shares
subject to a
holding
period
LTI
2023 - 2025
19/05/2023
18/05/2026
1,771
1,771
USD 50,448
Philippe François Mathieu
SSP
2023
10/02/2023
775
EVP EPI
USD 21,967
SUM
2,546
1,771
USD 72,415
4.3 Total number and value of shares held by the CEC
The number of Equinor shares owned by members of the CEC and/or their close associates is shown
below. Individually, each member of the CEC owned less than 1% of the outstanding Equinor shares.
The voting rights of members of the CEC members as shareholders do not differ from those of ordinary
shareholders.
Ownership of
Equinor shares
(incl. shares owned
by close
associates)
As of 1 Jan.
2023
As of 31 Dec.
2023
Market value as of
31 Dec. 2023, USD
thousand
As of 12 March
2024
Anders Opedal
46,996
56,649
1,727
58,602
Torgrim Reitan
11,473
15,482
472
16,530
Geir Tungesvik
17,624
20,702
631
21,401
Irene Rummelhoff
28,152
31,872
972
32,893
Jannicke Nilsson
59,380
63,106
1,924
67,271
Pål Eitrheim
19,644
21,737
663
21,737
Philippe F. Mathieu
4,645
7,529
230
8,105
Kjetil Hove
20,149
23,861
728
24,658
Hege Skryseth
2,633
5,364
164
5,364
Siv Helen Rygh
Torstensen
15,832
19,136
584
20,105
Aksel Stenerud
9,372
11,642
355
12,084
Jannik Lindbæk
12,542
11,592
353
12,206
4.4 Performance and AVP awarded to the CEC members in the reported
financial year
28
In accordance with Equinor’s performance framework and remuneration policy, performance in relation
to behaviour goals has formed an equal part to the business performance in the holistic performance
assessment.
The assessment of the performance results for 2023 is presented below, including a score
measurement against the set KPI targets and behaviour goals.
Each delivery KPI is given a score within a range of 1-5, where 5 is the highest result. Each score
reflects a holistic assessment, where applicable. The holistic assessment may reflect events outside the
control of the CEO or EVPs, such as exceptional fluctuations in commodity prices, changes in global
conditions, the industry operating environment or other relevant context.
The overall performance on the behaviour goals is also given a score within the range of 1-5.
Performance on behaviour goals is a qualitative assessment by the BoD and the CEO, as applicable,
and is supported by the results of employee feedback surveys.
The scores are converted into the AVP award percentage, as shown in the below conversion table.
As mentioned above, two factors – the threshold and the company performance modifier (CPM) - are
applied to the percentage to arrive at the final AVP award pay-out levels, as described above.
Select business delivery KPIs (“what” dimension) set at the corporate level are applicable to both CEO
and the EVPs.
Table 4 - Performance of CEC members in the reported financial year
29
Corporate delivery KPIs
“WHAT”-dimension – corporate delivery KPIs for CEO and staffs EVPs - total
assessment
3.5
“WHAT”-dimension – corporate delivery for EVPs with business area
responsibilities - total assessment
3.8
Target
Achievements
Assessment
Serious incident frequency
≤ 0.3
0.4
2.9
Upstream CO
2
≤ 8 kg/boe
6.7 kg/boe
4.8
Relative TSR
Above average in
peer ranking list
3
rd
2.4
Relative RoACE
Ranked in first
quartile among peers
1
st
5.0
Unit production cost (UPC)
4
< 6.0 USD/boe
6.2 USD/boe
3.0
REN power production
4
2 TWh
1.9 TWh
3.0
Holistic assessment of corporate delivery KPIs:
The final scores for the following KPIs have been adjusted from actual score through the
BoD' holistic assessment:
1)
cost pressure
2)
and substantial improvement from 2022
Additional BA-specific delivery KPIs (“what” dimension) apply to EVPs with business areas
responsibilities, as shown in the respective tables further below.
Select behaviour goals (“how” dimension) are set in relation to both CEO and the EVPs and assessed
on an individual basis. The total score representing the assessment of the results is shown below for
the respective CEC member. The assessment of individual behaviour goals is not disclosed.
“HOW”-dimension – behaviour goals
Demonstrate accountability, visibility, and engagement for safety, security and
compliance
Build trust in Equinor
Transform the organization to deliver on our common purpose and become a
leading company in the energy transition
Develop strong and diverse succession pipeline
The performance results of each member of the CEC with respect to the delivery KPIs and behaviour
goals set for such member are set forth further, together with the resulting AVP award level.
Anders Opedal (CEO)
«WHAT»-dimension – corporate delivery KPIs for CEO
3.5
“HOW”-dimension – behaviour goals
3.8
4
O
nly apply to the CEO and staffs EVPs
30
Demonstrate accountability, visibility, and engagement for safety, security and
compliance
Build trust in Equinor
Transform the organization to deliver on our common purpose and become a
leading company in the energy transition
Develop strong and diverse succession pipeline
Total performance assessment for AVP
3.7
AVP award pre company performance modifier
34 %
AVP award
Award
outcome AVP
%
Reduction
for threshold
USD (1,000)
AVP target
25%
Annual base salary, USD (1,000)
982
Award based on performance
evaluation
34%
n/a
334
Adjustment for company modifier
117%
0.17
57
Annual AVP award
391
The performance assessment included the following holistic considerations, which have
influenced the overall score:
Corporate delivery KPIs:
Ref comments to separate table above on corporate delivery
KPIs
Irene Rummelhoff (EVP MMP)
«WHAT»-dimension – corporate delivery KPIs for EVPs with business area
responsibilities
3.8
“WHAT”-dimension – business area delivery KPIs
3.0
Target
Achievements
Assessment
Production efficiency
93.30%
90.90%
2.7
Net operating income (ex derivatives)
(bn USD)
3.3
3.24
3.6
Fixed opex and SG&A (mill USD)
1,285
1,346
2.8
“HOW”-dimension – behaviour goals
3.1
Demonstrate accountability, visibility, and engagement for safety, security and
compliance
Build trust in Equinor
Transform the organization to deliver on our common purpose and become a
leading company in the energy transition
Develop strong and diverse succession pipeline
Total performance assessment for AVP
3.3
AVP award pre company performance modifier
29%
AVP award
Award
outcome AVP
%
Reduction
for threshold
USD (1,000)
AVP target
25%
Annual base salary, USD (1,000)
440
Award based on performance
evaluation
29%
n/a
128
Adjustment for company modifier
117%
0.17
22
Annual AVP award
149
The performance assessment included the following holistic considerations, which have
influenced the overall score:
31
Corporate delivery KPIs:
Ref comments to separate table above on corporate delivery
KPIs
BA-specific KPIs
: The final scores for the following KPIs have been adjusted from actual
score through the CEO’s holistic assessment of the performance:
Net operating income (ex derivatives) bn USD: Adjusted score for the 2023 market context
and impact of actual delivery
Jannicke Nilsson (EVP SSU)
«WHAT»-dimension – corporate delivery KPIs for staffs EVPs
3.5
“HOW”-dimension – behaviour goals
3.1
Demonstrate accountability, visibility, and engagement for safety, security and
compliance
Build trust in Equinor
Transform the organization to deliver on our common purpose and become a
leading company in the energy transition
Develop strong and diverse succession pipeline
Total performance assessment for AVP
3.3
AVP award pre company performance modifier
30 %
AVP award
Award
outcome AVP
%
Reduction
for threshold
USD (1,000)
AVP target
25%
Annual base salary, USD (1,000)
353
Award based on performance
evaluation
30%
n/a
106
Adjustment for company modifier
117%
0.17
18
Annual AVP award
124
The performance assessment included the following holistic considerations, which have
influenced the overall score:
Corporate delivery KPIs:
Ref comments to separate table above on corporate delivery
KPIs
Pål Eitrheim (EVP REN)
«WHAT»-dimension – corporate delivery KPIs for EVPs with business area
responsibilities
3.8
“WHAT”-dimension – business area delivery KPIs
2.4
Target
Achievements
Assessment
REN power generation (TWh)
2
1.9
2.5
Net operating income adjusted (mill
USD)
> -200
- 454
2.3
“HOW”-dimension – behaviour goals
3.5
Demonstrate accountability, visibility, and engagement for safety, security and
compliance
Build trust in Equinor
Transform the organization to deliver on our common purpose and become a
leading company in the energy transition
Develop strong and diverse succession pipeline
Total performance assessment for AVP
3.3
AVP award pre company performance modifier
29 %
32
AVP award
Award
outcome AVP
%
Reduction
for threshold
USD (1,000)
AVP target
25%
Annual base salary, USD (1000)
398
Award based on performance
evaluation
29%
n/a
115
Adjustment for company modifier
117%
0.17
20
Annual AVP award
135
The performance assessment included the following holistic considerations, which have
influenced the overall score:
Corporate delivery KPIs:
Ref comments to separate table above on corporate delivery
KPIs
BA-specific KPIs:
score through the CEO’s holistic assessment of the performance:
REN power generation: Adjusted score for impact of delayed startup for Doggerbank unit.
Net operating income adjusted (mill USD): Adjusted for impact from high pre-production
and early phase activity
Kjetil Hove (EVP EPN)
«WHAT»-dimension – corporate delivery KPIs for EVPs with business area
responsibilities
3.8
“WHAT”-dimension – business area delivery KPIs
3.0
Target
Achievements
Assessment
Production (kboe/d)
1,446
1,374
2.5
UPC (nominal USD/boe)
5.8
5.8
3.1
Break-even price (CMU portfolio)
(USD/bbl)
<35
37
3.3
“HOW”-dimension – behaviour goals
3.5
Demonstrate accountability, visibility, and engagement for safety, security and
compliance
Build trust in Equinor
Transform the organization to deliver on our common purpose and become a
leading company in the energy transition
Develop strong and diverse succession pipeline
Total performance assessment for AVP
3.4
AVP award pre company performance modifier
31 %
AVP award
Award
outcome AVP
%
Reduction
for threshold
USD (1,000)
AVP target
25%
Annual base salary, USD (1,000)
498
Award based on performance
evaluation
31%
n/a
154
Adjustment for company modifier
117%
0.17
26
Annual AVP award
180
The performance assessment included the following holistic considerations, which have
influenced the overall score:
Corporate delivery KPIs:
Ref comments to separate table above on corporate delivery
KPIs
33
BA-specific KPIs
: The final scores for the following KPIs have been adjusted from actual
score through the CEO’s holistic assessment of the performance:
Break-even price (CMU portfolio), USD/bbl: Adjusted score for impact on result from high
inflation.
Siv Helen Rygh Torstensen (EVP LEG)
«WHAT»-dimension – corporate delivery KPIs for staffs EVPs
3.5
“HOW”-dimension – behaviour goals
3.5
Demonstrate accountability, visibility, and engagement for safety, security and
compliance
Build trust in Equinor
Transform the organization to deliver on our common purpose and become a
leading company in the energy transition
Develop strong and diverse succession pipeline
Total performance assessment for AVP
3.5
AVP award pre company performance modifier
32 %
AVP award
Award
outcome AVP
%
Reduction
for threshold
USD (1,000)
AVP target
25%
Annual base salary, USD (1,000)
307
Award based on performance
evaluation
32%
n/a
98
Adjustment for company modifier
117%
0.17
17
Annual AVP award
115
The performance assessment included the following holistic considerations, which have
influenced the overall score:
Corporate delivery KPIs:
Ref comments to separate table above on corporate delivery
KPIs
Geir Tungesvik (EVP PDP)
«WHAT»-dimension – corporate delivery KPIs for EVPs with business area
responsibilities
3.8
“WHAT”-dimension – business area delivery KPIs
3.2
Target
Achievements
Assessment
Number of wells
104
105
3.5
Break-even price (CMU portfolio)
(USD/bbl)
<35
37
3.3
Estimate development DG3-DG4
100 %
101 %
2.8
“HOW”-dimension – behaviour goals
3.3
Demonstrate accountability, visibility, and engagement for safety, security and
compliance
Build trust in Equinor
Transform the organization to deliver on our common purpose and become a
leading company in the energy transition
Develop strong and diverse succession pipeline
Total performance assessment for AVP
3.4
AVP award pre company performance modifier
31 %
AVP award
Award
outcome AVP
%
Reduction
for threshold
USD (1,000)
34
AVP target
25%
Annual base salary, USD (1,000)
389
Award based on performance
evaluation
31%
n/a
121
Adjustment for company modifier
117%
0.17
20
Annual AVP award
141
The performance assessment included the following holistic considerations, which have
influenced the overall score:
Corporate delivery KPIs:
Ref comments to separate table above on corporate delivery
KPIs
BA-specific KPIs
: The final scores for the following KPIs have been adjusted from actual
score through the CEO's holistic assessment of the performance:
Break-even price (CMU portfolio), USD/bbl: Adjusted score for impact on result from high
inflation
Torgrim Reitan (CFO)
«WHAT»-dimension – corporate delivery KPIs for staffs EVPs
3.5
“HOW”-dimension – behaviour goals
3.1
Demonstrate accountability, visibility, and engagement for safety, security and
compliance
Build trust in Equinor
Transform the organization to deliver on our common purpose and become a
leading company in the energy transition
Develop strong and diverse succession pipeline
Total performance assessment for AVP
3.3
AVP award pre company performance modifier
30 %
AVP award
Award
outcome AVP
%
Reduction
for threshold
USD (1,000)
AVP target
25%
Annual base salary, USD (1,000)
469
Award based on performance
evaluation
30%
n/a
141
Adjustment for company modifier
117%
0.17
24
Annual AVP award
165
The performance assessment included the following holistic considerations, which have
influenced the overall score:
Corporate delivery KPIs:
Ref comments to separate table above on corporate delivery
KPIs
Aksel Stenerud (EVP PO)
«WHAT»-dimension – corporate delivery KPIs for staffs EVPs
3.5
“HOW”-dimension – behaviour goals
3.1
Demonstrate accountability, visibility, and engagement for safety, security and
compliance
Build trust in Equinor
Transform the organization to deliver on our common purpose and become a
leading company in the energy transition
Develop strong and diverse succession pipeline
Total performance assessment for AVP
3.3
35
AVP award pre company performance modifier
30 %
AVP award
Award
outcome AVP
%
Reduction
for threshold
USD (1,000)
AVP target
25%
Annual base salary, USD (1,000)
308
Award based on performance
evaluation
30%
n/a
93
Adjustment for company modifier
117%
0.17
16
Annual AVP award
108
The performance assessment included the following holistic considerations, which have
influenced the overall score:
Corporate delivery KPIs:
Ref comments to separate table above on corporate delivery
KPIs
Hege Skryseth (EVP TDI)
«WHAT»-dimension – corporate delivery KPIs for EVPs with business area
responsibilities
3.8
“WHAT”-dimension – business area delivery KPIs
3.1
Target
Achievements
Assessment
Low Carbon R&D
> 30%
40%
3.0
Software consolidation progress
50%
100%
5.0
TDI task responsibility cost savings,
mill NOK, 100%
500
1,000
1.3
“HOW”-dimension – behaviour goals
3.4
Demonstrate accountability, visibility, and engagement for safety, security and
compliance
Build trust in Equinor
Transform the organization to deliver on our common purpose and become a
leading company in the energy transition
Develop strong and diverse succession pipeline
Total performance assessment for AVP
3.4
AVP award pre company performance modifier
31 %
AVP award
Award
outcome AVP
%
Reduction
for threshold
USD (1,000)
AVP target
25%
Annual base salary, USD (1,000)
400
Award based on performance
evaluation
31%
n/a
124
Adjustment for company modifier
117%
0.17
21
Annual AVP award
145
The performance assessment included the following holistic considerations, which have
influenced the overall score:
Corporate delivery KPIs:
Ref comments to separate table above on corporate delivery
KPIs
BA-specific KPIs
: The final scores for the following KPIs have been adjusted from actual
score through the CEO’s holistic assessment of the performance:
Low carbon R&D: Adjusted for impact on target from re-prioritization of R&D portfolio on
low carbon
36
Jannik Lindbæk (EVP COM)
«WHAT»-dimension – corporate delivery KPIs for staffs EVPs
3.5
“HOW”-dimension – behaviour goals
3.0
Demonstrate accountability, visibility, and engagement for safety, security and
compliance
Build trust in Equinor
Transform the organization to deliver on our common purpose and become a
leading company in the energy transition
Develop strong and diverse succession pipeline
Total performance assessment for AVP
3.3
AVP award pre company performance modifier
29 %
AVP award
Award
outcome AVP
%
Reduction
for threshold
USD (1,000)
AVP target
25%
Annual base salary, USD (1,000)
303
Award based on performance
evaluation
29%
n/a
88
Adjustment for company modifier
117%
0.17
15
Annual AVP award
103
The performance assessment included the following holistic considerations, which have
influenced the overall score:
Corporate delivery KPIs:
Ref comments to separate table above on corporate delivery
KPIs
Philippe François Mathieu (EVP EPI)
«WHAT»-dimension – corporate delivery KPIs for EVPs with business area
responsibilities
3.8
“WHAT”-dimension – business area delivery KPIs
3.4
Target
Achievements
Assessment
Production (kboe/d)
677
708
4.0
UPC, nominal USD/boe
6.5
7.1
2.8
Break-even price (CMU portfolio)
(USD/bbl)
<35
37
3.3
“HOW”-dimension – behaviour goals
3.5
Demonstrate accountability, visibility, and engagement for safety, security and
compliance
Build trust in Equinor
Transform the organization to deliver on our common purpose and become a
leading company in the energy transition
Develop strong and diverse succession pipeline
Total performance assessment for AVP
3.6
AVP award pre company performance modifier
33%
AVP award
Award
outcome AVP
%
Reduction
for threshold
USD (1,000)
AVP target
25%
Annual base salary, USD (1,000)
413
Award based on performance
evaluation
33%
n/a
136
37
Adjustment for company modifier
117%
0.17
23
Annual AVP award
160
The performance assessment included the following holistic considerations, which have
influenced the overall score:
Corporate delivery KPIs:
Ref comments to separate table above on corporate delivery
KPIs
BA-specific KPIs:
score through the CEO’s holistic assessment of the performance:
Break-even price (CMU portfolio), USD/bbl: Adjusted score for impact on result from high
inflation.
4.5 Key performance indicators and behaviour goals forming the basis for AVP
for the CEC in 2024
The business delivery dimension (“what”) for the variable remuneration (performance year 2024) for the
CEC members will be based on an assessment against the following common corporate KPIs:
●
●
₂
₂
/ boe or better
●
●
●
●
For EVPs with business area responsibilities, the assessment of the business delivery dimension will in
addition be made against the following KPIs:
Busines
s area
KPI
Unit
Target
EPN
Production
kboe/d
1,400
Unit Production Cost (UPC)
Nominal
USD/boe
< 6.0
Break-even project portfolio
USD/bbl
real 2023
~ 35
EPI
Production
kboe/d
672
Unit Production Cost (UPC)
Nominal
USD/boe
< 7.8
Break-even project portfolio
USD/bbl
real 2023
~ 35
MMP
Production efficiency
%
≥ 91.5
Accessed storage volume additions
Mton
not
disclosed
5
Adjusted earnings
USD bn
Above mid
range
(>2,4)
5
38
REN
REN power production
TWh
Doubling
from 2023
Adjusted earnings
USD bn
not
disclosed
6
Strategic progress in renewables - Projects progressed to Final
Investment Decision
GW
2.5
PDP
Number of new wells
number
107
Break-even project portfolio
USD/bbl
real 2023
~ 35
Estimate development DG3-DG4 (changes)
%
TDI
High Impact Technology Implementation (HITI) - Tier 1
Implementation (value and implementation %, EPN)
%
> 90
IT investment and R&D (cost development %)
%
< 0
IT Opex (cost development %)
%
< 0
The behaviour dimension (“how”) will be based on an individual assessment against the following goals:
-
-
-
the energy transition
-
5 Remuneration and company performance for 2019-2023
5.1 Comparative tables over the remuneration and company performance
compared to the last five reported financial years
Table 5 - Comparative table over the remuneration and company performance over the last five reported financial years
(RFY)
Executive remuneration for 2019-2023
All amounts in USD
Remuneration
2019
2020
2021
2022
2023
Anders Opedal, CEO
Total remuneration and %
change vs previous year
881,029
-24.79%
814,098
-7.60%
2,055,02
3
152.43%
2,042,382
-0.62%
1,963,097
-3.88%
Base salary % increase in annual
salary review and on other
adjustments
4.00%
-
0.00%
133.30
%
3.50%
-
4.90%
-
5.00%
0
AVP % pre and post threshold
and company performance
modifier
28.00%
23.24%
0,00%
0,00%
30.00%
45.00%
30.00%
39.90%
34.00%
39.78%
LTI % pre and post threshold
25.00%
25.00%
25.00%
25.00%
30.00%
15,00%
30.00%
30.00%
30.00%
30.00%
Remuneration
2019
2020
2021
2022
2023
39
Irene Rummelhoff, EVP MMP
Total remuneration and %
change vs previous year
826,342
-10.66%
681,363
-
17.54%
923,578
35.55%
960,784
4.03%
873,398
-9.10%
Base salary % increase in annual
salary review and on other
adjustments
3.80%
-
-
-
3.00%
5.40%
4.90%
-
7.70%
0
AVP % pre and post threshold
and company performance
modifier
26.00%
21.58%
-
-
28.00%
42.00%
33.00%
43.89%
29.00%
33.93%
LTI % pre and post threshold
25.00%
25.00%
25.00%
25.00%
25.00%
12.50%
25.00%
25.00%
25.00%
25.00%
Jannicke Nilsson, EVP SSU
Total remuneration and %
change vs previous year
757,055
-14.98%
623,702
-
17.61%
829,810
33.05%
844,012
1.71%
790,367
-6.36%
Base salary % increase in annual
salary review and on other
adjustments
3.60%
-
-
-
3.00%
5.40%
4.50%
-
5.00%
0
AVP % pre and post threshold
and company performance
modifier
23.00%
19.09%
-
-
27.00%
40.50%
28.00%
37.24%
30.00%
35.10%
LTI % pre and post threshold
25.00%
25.00%
25.00%
25.00%
25.00%
12.50%
25.00%
25.00%
25.00%
25.00%
Pål Eitrheim, EVP REN
Total remuneration and %
change vs previous year
669,000
-17.19%
524,113
-
21.66%
796,048
51.88%
782,549
-1.70%
782,576
0.00%
Base salary % increase in annual
salary review and on other
adjustments
3.40%
-
-
-
4.00%
17.20%
4.90%
-
8.30%
0
AVP % pre and post threshold
and company performance
modifier
26.00%
21.58%
-
-
31.00%
46.50%
27.00%
35.91%
29.00%
33.93%
LTI % pre and post threshold
25.00%
25.00%
25.00%
25.00%
25.00%
12.50%
25.00%
25.00%
25.00%
25.00%
All amounts in USD
Remuneration
2019
2020
2021
2022
2023
Kjetil Hove, EVP EPN
Total remuneration and %
change vs previous year
-
-
-
-
1,004,28
3
-
1,055,271
5.08%
1,004,604
-4.80%
Base salary % increase in annual
salary review and on other
adjustments
-
-
-
-
-
-
5.05%
-
8.30%
0
AVP % pre and post threshold
and company performance
modifier
-
-
-
-
32.00%
48.00%
30.00%
39.90%
31.00%
36.27%
LTI % pre and post threshold
-
-
-
-
25.00%
12.50%
25.00%
25.00%
25.00%
25.00%
All amounts in USD
Remuneration
2019
2020
2021
2022
2023
Torgrim Reitan, EVP CFO
Total remuneration and %
change vs previous year
904,980
-24.97%
766,448
-
15.31%
-
-
1,027,357
-
935,718
-8.92%
40
Base salary % increase in annual
salary review and on other
adjustments
3.73%
-
-
-
-
-
-
-
6.50%
0
AVP % pre and post threshold
and company performance
modifier
27.00%
22.41%
-
-
-
-
30.00%
39.90%
30.00%
35.10%
LTI % pre and post threshold
25.00%
25.00%
25.00%
25.00%
-
-
25.00%
25.00%
25.00%
25.00%
Siv Helen Rygh Torstensen, EVP LEG
Total remuneration and %
change vs previous year
-
-
-
-
645,511
-
691,436
7.11%
669,609
-3.16%
Base salary % increase in annual
salary review and on other
adjustments
-
-
-
-
-
-
4.90%
-
5.30%
0
AVP % pre and post threshold
and company performance
modifier
-
-
-
-
27.00%
40.50%
28.00%
37.24%
32.00%
37.44%
LTI % pre and post threshold
-
-
-
-
25.00%
12.50%
25.00%
25.00%
25.00%
25.00%
Geir Tungesvik, EVP PDP
Total remuneration and %
change vs previous year
-
-
-
-
-
-
806,131
-
794,266
-1.47%
Base salary % increase in annual
salary review and on other
adjustments
-
-
-
-
-
-
-
-
5.60%
0
AVP % pre and post threshold
and company performance
modifier
-
-
-
-
-
-
27.00%
35.91%
31.00%
36.27%
LTI % pre and post threshold
-
-
-
-
-
-
25.00%
25.00%
25.00%
25.00%
Hege Skryseth, EVP TDI
Total remuneration and %
change vs previous year
-
-
-
-
-
-
1,262,536
-
730,784
-42.12%
Base salary % increase in annual
salary review and on other
adjustments
-
-
-
-
-
-
-
-
5.60%
0
AVP % pre and post threshold
and company performance
modifier
-
-
-
-
-
-
28.00%
37.24%
31.00%
36.27%
LTI % pre and post threshold
-
-
-
-
-
-
25.00%
25.00%
25.00%
25.00%
Aksel Stenerud, EVP PO
Total remuneration and %
change vs previous year
-
-
-
-
-
-
686,387
-
639,089
-6.89%
Base salary % increase in annual
salary review and on other
adjustments
-
-
-
-
-
-
-
-
5.60%
0
AVP % pre and post threshold
and company performance
modifier
-
-
-
-
-
-
28.00%
37.24%
30.00%
35.10%
LTI % pre and post threshold
-
-
-
-
-
-
25.00%
25.00%
25.00%
25.00%
Jannik Lindbæk, EVP COM
41
Total remuneration and %
change vs previous year
-
-
-
-
-
-
650,737
-
622,577
-4.33%
Base salary % increase in annual
salary review and on other
adjustments
-
-
-
-
-
-
-
-
5.30%
0
AVP % pre and post threshold
and company performance
modifier
-
-
-
-
-
-
28.00%
37.24%
29.00%
33.93%
LTI % pre and post threshold
-
-
-
-
-
-
25.00%
25.00%
25.00%
25.00%
Philippe François Mathieu, EVP
EPI
-
-
-
-
-
-
-
-
-
-
Notes to the table “Executive remuneration for 2019-2023”:
-
pension cost for the years 2019-2020
Company performance - effect on
AVP and LTI
2019
2020
2021
2022
2023
AVP
LTI
AVP
LTI
AVP
LTI
AVP
LTI
AVP
LTI
Threshold
-
-
50 %
reduct.
-
-
50 %
reduct.
-
-
-
-
Company performance modifier
83%
-
133%
-
150%
-
133%
-
117%
-
All amounts in USD
Average remuneration on a full-time
equivalent basis of employees
2019
2020
2021
2022
2023
Equinor ASA
4)
Average base salary and %
change vs previous year, based
on USD amounts
90,260
-4.90%
86,229
-4.50%
95,893
11.20%
88,923
-7.27%
84,568
-4.90%
Change in average base salary
vs previous year, based on NOK
amounts
-
3.00%
-
1.60%
-
2.00%
-
3.40%
-
4.82%
Average total remuneration and
% change vs previous year,
based on USD amounts
123,626
-7.50%
115,137
-6.90%
135,597
17.80%
144,868
6.84%
135,611
-6.39%
Change in average total
remuneration vs previous year,
based on NOK amounts
-
0.20%
-
-0.90%
-
8.10%
-
19.2%
-
3.17%
General salary increase frame
-
3.50%
-
0.80%
-
3.50%
-
4.90%
-
5.60%
General bonus %
-
4.50%
-
3.50%
-
10.50%
-
9.30%
-
8.00%
AVP % range from manager to
SVP pre and post company
performance modifier and
threshold
11.25% -
17.5%
9.34% -
14.53%
11.25% -
17.5%
7.48% -
11.64%
11.25% -
17.5%
16.88% -
26.25%
11.25%-
17.50%
14.96%-
23.28%
11.25%-
17.50%
13.16%-
20.48%
Notes to the table “Average remuneration on a full-time equivalent basis of employees”:
●
42
●
●
●
LTI
●
●
participate in other short-term incentive plans, such as the AVP.
6 Statement by the board of directors on the remuneration report
The BoD has today considered and approved the remuneration report of Equinor for the financial year 1
January - 31 December 2023.
The remuneration report has been prepared in accordance with Norwegian Public Limited Liability
Companies Act, section 6-16b and regulation 2020-12-
11
-2730 and the Norwegian Accounting Act
section 7-31b.
In our opinion, the remuneration report is in accordance with the remuneration policy adopted at the
annual general meeting, and is free from material misstatement and omissions, whether due to fraud or
error.
The remuneration report will be presented for an advisory vote at the annual general meeting.
Oslo, 17
March 2024
The Board of directors of Equinor
Jon Erik Reinhardsen, Chair
Anne Drinkwater, Deputy-chair
Hilde Møllerstad
Per Martin Labråten
Tove Andersen
Rebekka Glasser Herlofsen
Finn Bjørn Ruyter
Haakon Bruun-Hanssen
Stig Lægreid
Jonathan Lewis
43
7 Independent auditor’s statement on the remuneration report
[Removed from Exhibit 15.6 as it does not form part of Equinor’s Annual Report on Form 20-F as filed
with the SEC.]
44
8 Appendix: Executive remuneration policy 2021
8.1 Remuneration to the board of directors
Approach to setting fees
Basis of fees
Other items
The remuneration to the board
and its committees is decided
by the corporate assembly,
based on a recommendation
from the nomination
committee.
The board members have an annual,
fixed remuneration, except for deputy
members (only elected for employee-
representative board members) who
receive remuneration per meeting
attended.
Separate rates are set for the board's
chair, deputy chair and other members.
Separate rates are also adopted for the
board's committees, with similar
differentiation between the chair and the
other members of each committee.
The employee-representative members of
the board receive the same remuneration
as the shareholder-representative
members. The board receives its
remuneration by cash payment.
The board members from outside Scandinavia and
outside Europe, respectively, receive separate
travel allowances for each meeting attended.
Remuneration for board membership is not linked to
performance and no share or option programmes or
similar structures are in place.
Employee-representative board members may
participate in variable pay, pension and benefit
programs according to their location and grade in
line with other employees.
None of the shareholder-representative board
members have a pension scheme or agreement
concerning pay after termination of their office with
the company.
If shareholder-representative members of the board
and/or companies they are associated with should
take on specific assignments for Equinor in addition
to their board membership, this will be disclosed to
the full board.
8.2 Remuneration to the corporate assembly
Approach to setting fees
Basis of fees
The remuneration to the corporate assembly is decided by the
general meeting, based on a recommendation from the
nomination committee
The members have an annual, fixed remuneration, except for
deputy members who receive remuneration per meeting
attended.
Separate rates are set for the corporate assembly’s chair,
deputy chair and other members. The employee-elected
members of the corporate assembly receive the same
remuneration as the shareholder-elected members.
8.3 Remuneration to the CEC
The board of directors’ complete remuneration policy and report for executive personnel follows.
Remuneration policy
The following guidelines for remuneration of Equinor’ corporate
executive committee proposed by the board of directors were
approved by the 2021 annual general meeting, pursuant to the
Norwegian Public Limited Liability Companies Act, section 6-16
a and supplementing regulations. The policy also includes
compensation to members of the board of directors and the
corporate assembly employed by the company, which is
explained in the above section “ Remuneration to the board of
directors and corporate assembly”. The policy is subject to
approval by the annual general meeting at every material
change and, in any case, at least every fourth year.
Equinor’s remuneration policy and terms are aligned with the
company’s overall strategy, values, people policy and
performance-oriented framework. Our rewards and recognition
for executives are designed to attract and retain the right
people; people who are committed to deliver on our business
strategy and able to adapt to a changing business
environment. Equinor’s remuneration framework contributes to
the business strategy, long-term interests and sustainability of
the company.
45
A key role for the board of directors is to ensure that executive
compensation is competitive, but not market leading, in the
markets where we operate. The board is committed to
ensuring that executive compensation is fair and aligned with
our overall remuneration philosophy and compensation levels
in the company, and in line with shareholders’ interests.
The remuneration policy is an integrated part of our values-
based performance framework. It has been designed to:
●
interests and sustainability of the company
●
Equinor group and its shareholders
●
financial results
●
●
“How” we deliver
●
performance
●
non-discriminatory
●
●
●
cost level
The decision-making process
The decision-making process for implementing or changing our
remuneration policy, and the determination of salaries and
other remuneration for the corporate executive committee, are
in accordance with the provisions of the Norwegian public
limited liability companies act sections 5-6 and 6-16 a and the
board’s rules of procedure. The board of director’s rules of
procedure are available at www.equinor.com/board.
The board of directors has appointed a designated
compensation and executive development committee. The
compensation and executive development committee is a
preparatory body for the board of directors. The committee’s
main objective is to assist the board of directors in its work
relating to the terms of employment for Equinor’s chief
executive officer and the main principles and strategy for the
remuneration and leadership development of our senior
executives. The board of directors determines the chief
executive officer’s salary and other terms of employment. The
committee shall prepare a proposal for new guidelines at every
material change and, in any case, every fourth year and submit
it to the general meeting for resolution. The guidelines shall be
in force until new guidelines have been adopted by the general
meeting.
The compensation and executive development committee
answers to the board of Equinor ASA for the performance of its
duties. The work of the committee in no way alters the
responsibilities of the board of directors or the individual board
members.
For further details about the roles and responsibilities of the
compensation and executive development committee, please
refer to the committee’s instructions available at
www.equinor.com/compensationcommittee.
Equinor purpose, vision and overall strategy
Equinor’s purpose is turning natural resources into energy for
people and progress for society, and our vision is to shape the
future of energy. We are strongly committed to creating
shareholder value and with a leading role in the energy
transition towards a low-carbon future.
While our strategic pillars of “always safe”, “high value” and
“low carbon” remain firm, we will further strengthen in the areas
of a) an optimised oil & gas portfolio, b) a faster growing
renewable business, c) expanding our low-carbon solutions
business.
Within all areas, technology and innovation will be key
accelerators to drive value and improved performance. We will
use our strengths and experience within the oil & gas portfolio
as a foundation for developing offshore wind at scale,
establishing new value chains, and for developing new low
carbon energy sources.
Equinor’s performance framework and the
link to business strategy, long-term interests
and sustainability of the company
Our performance framework translates the company vision,
values and strategy into actions and results for the company,
its units, teams and every leader and employee.
Performance is evaluated in two dimensions; “What” we deliver
and “How” we deliver. This is the core of our values-based
performance culture and means that delivery (“what”) and
behaviour (“how”) are equally weighted when recognising and
rewarding individual performance.
“What” we deliver (business delivery) is defined through the
company’s performance framework “Ambition to Action”, which
addresses strategic objectives, key performance Indicators
(performance indicators) and actions across the five
perspectives; Safety, Security and Sustainability, People and
Organisation, Operations, Market and Finance. Generally,
Equinor believes in setting ambitious targets to inspire and
drive strong performance. Each year individual performance
goals (“what”) based on the company’s “Ambition to Action” are
established for the CEO and the executive vice presidents.
The board decides annually a set of strategic objectives and
performance indicators that will form basis for the assessment
of the business delivery dimension (“What”). These
performance indicators and related targets for the upcoming
performance year shall be disclosed in the annual
remuneration report. Examples of such performance indicators
are Serious Incident Frequency (SIF), CO2 intensity for the
upstream portfolio, Levelised cost of energy (LCOE),
Production efficiency (PE), Production based availability (PBA),
Relative Total Shareholder Return (TSR), Relative ROACE,
Improvement impact etc.
Goals on “How” we deliver are based on Equinor’s core values
and leadership principles and address the behaviour required
and expected to achieve the delivery goals. We believe in
46
developing a strong leadership and culture recognised by our
values, driving the long-term and sustainable success of the
company. The CEO and the executive vice presidents have
individual behaviour goals within prioritised behaviour themes
such as safety and compliance, empowerment, diversity and
inclusion, collaboration and sustainability and climate.
Performance evaluation is holistic, involving both measurement
and assessment. Significant changes in assumptions are taken
into account, as well as target ambition levels, sustainability of
delivered results and strategic contribution.
The balanced approach, which involves a broad set of goals
defined in relation to both “What” and “How” dimensions and
an overall performance evaluation, significantly reduces the
likelihood that remuneration policies may incentivise excessive
risk-taking or have other material adverse effects.
The remuneration concept for the corporate executive
committee Equinor’s remuneration for the corporate executive
committee consists of the following core elements;
●
fixed salary addition
●
term incentive (LTI)
●
savings plan
The following table illustrate how the reward policy is translated
into our key remuneration elements.
47
Main elements - Equinor executive remuneration
Remuneration
element
Award level
Base
salary
Attract and retain the right
individuals by providing
competitive but not
market-leading terms.
We offer base salary levels which are aligned with and
differentiated according to the individual's
responsibility, performance and contribution to
company’s goals. The level is competitive in the
markets in which we operate.
The base salary is normally subject
to annual review based on an
evaluation of the individual’s
performance and contribution to
the company’s goals.
Fixed
salary
addition
The fixed salary addition is
paid in lieu of pension
accrual above 12G, applied
as a supplementing fixed
remuneration element to
be competitive in the
market.
Members of the corporate executive committee
employed by Equinor ASA prior to 1 September 2017,
that have taken up their first position in the CEC after
13 February 2015, receive a fixed salary addition in
lieu of pension accrual above 12G
6
the section on pension and insurance scheme.
No performance criteria are linked
to the fixed salary addition. The
fixed salary addition is not
pensionable and does not form
basis for variable pay.
Annual
variable
pay (AVP)
Encourage our pay for
performance culture and
individual’s contribution to
the company’s business
strategy. Rewarding
individuals for annual
achievement of business
objectives, both the
“What” and the “How”.
Members of the corporate executive committee
employed by Equinor ASA are from performance year
2022 entitled to annual variable pay ranging from 0 –
45% of their base salary. Target
7
members of the CEC employed outside the Norwegian
market, see section below on remuneration policy for
international executives.
The threshold principles and the company
performance modifier are applied (see explanations
below).
The company reserves the right to recover all or part
of the annual bonus, if performance data is
subsequently proven to be misstated.
Performance is measured over one
financial year and is based on the
achievement of annual
performance goals (“How” and
“What” to deliver), in order to
create long-term and sustainable
shareholder value. Assessment of
goals defined in the individual’s
performance contract including
objectives related to selected
performance indicator’s on the
balanced scorecard constitute the
basis for annual variable pay.
Long-term
incentive
(LTI)
Strengthen the alignment
of top management and
shareholders’ long-term
interests and sustainability
of the company. Retention
of key executives.
For members of the corporate executive committee
employed by Equinor ASA, the LTI is calculated as a
portion of the participant’s base salary. On behalf of
the participant, the company acquires shares
equivalent to the net annual grant amount. The shares
are subject to a three-year lock-in period and then
released for the participant’s disposal. If the lock-in
obligations are not fulfilled, the executive has to pay
back the gross value of the locked-in shares limited to
the gross value of the grant amount.
The level of the annual LTI reward for the CEC
members employed by Equinor ASA is in the range of
25-30% of the base salary. For members of the CEC
employed outside the Norwegian market, see section
below on remuneration policy for international
executives.
The threshold principles are applied to the annual
grant. The company performance modifier is not
applied to the LTI in Equinor ASA.
In Equinor ASA, LTI participation
and grant level are reflective of the
level and impact of the position
and company performance as
reflected by the threshold.
Pension &
insurance
schemes
Provide competitive
postemployment and other
benefits.
The company offers a general occupational pension
plan and insurance scheme aligned with local
markets. Reference is made to the section on pension
and insurance scheme.
N/A
Employee
share
savings
programme
(SSP)
Align and strengthen
employee and
shareholders’ interests
and remunerate for long
term commitment and
value creation.
Eligibility extends to all employees at Equinor and in
all markets, subject to local legislation. Participants
can purchase shares up to 5% of base salary.
With effect from 2022 share
savings, bonus shares from
the share saving programme will
be awarded to the CEO and EVPs
after a lock in
period of 3 calendar years after
the year of saving.
Other
taxable and
non-
taxable
benefits
Attract and retain the right
individuals by providing
competitive but not
market-leading terms.
The members of the corporate executive committee
have benefits in-kind such as company car and health
checks. They are also eligible for participation in the
share saving scheme as described above, and they
take part in the general benefit and welfare program of
the company.
N/A
6
7
48
Remuneration policy for international executives
Equinor is a broad global energy company, developing oil, gas, wind and solar energy in around 30 countries. The
company has high goals related to diversity and inclusion, and diversity at all levels including among top management is
crucial in ensuring the long-term sustainable success of the company. From time to time the company will appoint
executives employed in international markets with different framework for executive base pay, variable pay and benefits,
than what is the case in the Norwegian market. To be able to hire international executives, the company needs to offer
competitive compensation in the markets where it operates. The policy of being competitive but not market leading still
remains.
In order to ensure Equinor’s competitive position and attract talent in the international market, the board of directors has
the mandate to exceed the levels for variable pay and pension terms described in the table above, for remuneration of
executive vice presidents hired in the international market and the remuneration level will reflect the at any time
prevailing and documented market level for the EVP position. The annual variable pay shall not exceed 50% of base
salary at target (100% maximum) and the long-term incentive (LTI) annual grant shall be maximum 70% of base salary.
The threshold for variable pay and the company performance modifier as described below will apply. For the
international LTI a three years’ average company performance modifier will be applied. Pension contribution will be in
accordance with the local market, and the 12G cap on pension used in the Norwegian tax favored regime is not
applicable for the international executives. Any decision on terms and conditions as described above will be included in
the remuneration report subject to review and endorsement by the annual general meeting.
Duration of contracts with executive vice presidents
Duration of contracts with the executive vice presidents are not limited to a certain period and are valid until the
executive resigns from the position or enters into a new position in the company.
Mobility
To support the company’s need for a mobile workforce also at the senior executive level, the company’s standard
international assignment framework can be used for candidates employed in a different country than the location of the
CEC role. International assignment for a CEC position will normally be limited to a three-year period.
Localisation and relocation
If an executive is recruited to Equinor and employed on local terms and conditions different from the executive’s country
and market, the company may decide to cover reasonable relocation costs including housing and schooling within the
international assignment framework for these elements for a period up to two years.
Threshold for variable pay and company performance modifier
The threshold and company performance modifier are implemented to strengthen the link between the company’s
overall financial results and the individual variable pay.
Threshold
The threshold is implemented for affordability reasons to ensure that no or reduced variable pay would be granted if the
company’s financial performance and position is weak and in a critical situation. The financial threshold is applicable for
payment of annual variable pay and award of LTI grant.
The threshold has the following guiding parameters;
1) Cash flows provided by operating activities after tax and before working capital items
2) Net debt ratio and development
3) Company’s overall operational and financial performance.
“Green zone”
Cash flows provided by operating activities after tax and before working capital items higher than USD 12 billion and a
net debt ratio below 30% will normally guide for no reduction of bonus.
“Yellow zone”
higher than USD 8 billion and a net debt ratio between 30% and 45% will normally guide a reduction of bonus but not
annulment.
“Red zone”
debt ratio above 45% will normally guide no bonus.
Application of the threshold is subject to a discretionary assessment of the company’s overall performance by the board
of directors. These measures and targets are indicative and will form part of a broader assessment of bonus award. The

49
conclusion considers both achieved results and how these results are expected to impact the company’s medium and
long-term development and value creation.
Company performance modifier
Based on approval by the annual general meeting in 2016, a company performance modifier was introduced and has
been applied in the calculation of variable pay.
The company performance will be assessed against two equally weighted measures: relative total shareholder return
(TSR) and relative return on average capital employed (ROACE). TSR and ROACE are currently also applied as
performance indicators in the corporate performance management system.
The results of these two performance measures are compared to our peers and determine Equinor’s relative position. A
position of Quartile 1 means that Equinor is amongst the top scoring quartile of peer companies. A position of Quartile 4
means that Equinor is in the bottom performing quartile. In years with strong deliveries on relative TSR and ROACE, the
matrix will result in the variable pay being modified with a factor higher than one and, correspondingly, lower than one in
weak years. The combination of ratings for both measures, will act as a ‘multiplier’ according to the guideline in the
matrix displayed below.
By applying relative numbers, the effect of fluctuating oil price will be reduced.
Within the framework of 50 - 150%, the matrix is a guideline and the multiplier (percentages) may be adjusted if oil or
gas price effects or other occurrences outside the control of the company are deemed to cause disproportionate results
in a given year. Application of the modifier is subject to discretionary assessment based on the company’s overall
performance.
The company performance modifier will be used in calculations of annual variable pay for members of the corporate
executive committee. The modifier will also be applied in other variable pay schemes below the corporate executive
level. Further application of the company performance modifier will also be assessed and decided if deemed
appropriate.
The annual variable pay for members of the corporate executive committee employed by Equinor ASA will be within a
framework of 45% of base salary, irrespective of the result of the modifier.
Pension and insurance schemes
Members of the corporate executive committee in Equinor ASA are covered by the company’s general occupational
pension scheme which is a defined contribution scheme with a contribution level of 7% below 7,1 G and 22% above 7,1
G. A defined benefit scheme is retained by a grandfathered group of employees. For new members of the corporate
executive committee appointed after 13 February 2015, a cap on pension contribution at 12 G is applied. In lieu of
pension accrual above 12 G a fixed salary addition of 18% is provided. This element does not form basis of calculation
of AVP and LTI. The 12 G cap is based on the Norwegian tax favoured occupational pension schemes and will not be
applied to the pension schemes of executives employed outside Norway.
50
Members of the corporate executive committee employed in Equinor ASA and appointed before 13 February 2015,
maintain their pension contribution above 12 G based on obligations in previously established agreements.
Pension terms that historically have been individually agreed with elements outside the framework above will be
described in the annual remuneration report.
Equinor ASA has implemented a general cap on pensionable income at 12 G for all new hires into the company
employed as of 1 September 2017.
In addition to the pension benefits outlined above, the executive vice presidents in the parent company are offered
disability and dependents’ benefits in accordance with Equinor’s general pension plan/defined benefit plan. Members of
the corporate executive committee are covered by the general insurance schemes applicable within Equinor.
Severance pay arrangements
The chief executive officer and the executive vice presidents are entitled to a severance payment equivalent to six
months’ salary, commencing after the six months’ notice period, when the resignation is requested by the company. The
same amount of severance payment is also payable if the parties agree that the employment should be discontinued,
and the individual gives notice pursuant to a written agreement with the company. Any other payment earned by the
individual during the period of severance payment will be fully deducted. This relates to earnings from any employment
or business activity where the individual has active ownership.
The entitlement to severance payment is conditional on the chief executive officer or the executive vice president not
being guilty of gross misconduct, gross negligence, disloyalty or other material breach of his/her duties.
The chief executive officer’s/executive vice president’s own notice will not instigate any severance payment.
Release of earned LTI grants and bonus shares at end of employment
If termination of employment is based on a mutual agreement between the executive and Equinor, the company may
decide to release locked in LTI shares and award already earned bonus shares in the share savings scheme at the end
of employment.
Salary and employment conditions of other employees
Salary and employment conditions of employees of the company have been taken into account when establishing the
remuneration policy. The remuneration and employment framework for the members of the executive committee are
based on the same main principles as applicable for the remuneration frameworks for senior leaders in the company in
general.
Recruitment policy
From time to time, Equinor may recruit executives from outside of the organisation. Our principles are designed to
attract and retain the right individuals to ensure the successful implementation of our strategy and to safeguard our
long-term interests.
If an individual forfeits remuneration as a result of recruitment to Equinor, the company can compensate partly or fully
for the documented financial loss of unvested short and long-term incentive opportunity held by preferred external
candidates. Such decision will take into consideration the vehicle, expected value and timing of forfeited awards. Any
buy-out will be limited to one year’s base salary and normally paid over a period of 24 months.