 Welcome Investor Day December 13, 2006 Exhibit 99.2 |
 Dave Yost Chief Executive Officer |
 3 Comment Regarding Forward Looking Statements This presentation may contain certain "forward-looking statements" within the meaning of Section 27A of the Securities Act of 1933 and Section 21E of the Securities Exchange Act of 1934. These statements are based on management’s current expectations and are subject to uncertainty and changes in circumstances. Actual results may vary materially from the expectations contained in the forward-looking statements. The forward-looking statements herein include statements addressing management’s views with respect to future financial and operating results and the benefits, efficiencies and savings to be derived from the Company’s integration plan to consolidate its distribution network. The following factors, among others, could cause actual results to differ materially from those described in any forward-looking statements: competitive pressures; the loss of one or more key customer or supplier relationships; customer defaults or insolvencies; changes in customer mix; supplier defaults or insolvencies; changes in pharmaceutical manufacturers' pricing and distribution policies or practices; adverse resolution of any contract or other disputes with customers (including departments and agencies of the U.S. Government) or suppliers; regulatory changes (including increased government regulation of the pharmaceutical supply channel); changes in U.S. government policies (including reimbursement changes arising from federal legislation, including the Medicare Modernization Act and the Deficit Reduction Act of 2005); price inflation in branded pharmaceuticals and price deflation in generics; declines in the amounts of market share rebates offered by pharmaceutical manufacturers to the PharMerica Long-Term Care business, declines in the amounts of rebates that the PharMerica Long-Term Care business can retain, and/or the inability of the business to offset the rebate reductions that have already occurred or any rebate reductions that may occur in the future; any disruption to or other adverse effects upon the PharMerica Long-Term Care business caused by the announcement of the Company’s agreement to combine the PharMerica Long-Term Care business with the institutional pharmacy business of Kindred Healthcare, Inc. into a new public company that will be owned 50% by the Company’s shareholders (the “PharMerica LTC Transaction”); the inability of the Company to successfully complete the PharMerica LTC Transaction; fluctuations in market interest rates; operational or control issues arising from the Company’s outsourcing of information technology activities; the Pharmaceutical Distribution segment’s ability to continue to successfully transition its business model to fee-for-service; success of integration, restructuring or systems initiatives; fluctuations in the U.S. dollar - Canadian dollar exchange rate and other foreign exchange rates; economic, business, competitive and/or regulatory developments in Canada, the United Kingdom and elsewhere outside of the United States; acquisition of businesses that do not perform as we expect or that are difficult for us to integrate or control; changes in tax legislation or adverse resolution of challenges to our tax positions; and other economic, business, competitive, legal, regulatory and/or operational factors affecting the business of the Company generally. Certain additional factors that management believes could cause actual outcomes and results to differ materially from those described in forward-looking statements are set forth (i) in Item 1A (Risk Factors) in the Company’s Annual Report on Form 10-K for the fiscal year ended September 30, 2006 and elsewhere in that report and (ii) in other reports filed by the Company pursuant to the Securities Exchange Act of 1934. |
 4 Theme for Today … The Power of Smart Growth |
 5 Dave Yost Chief Executive Officer Speaking Today The Power of Smart Growth Kurt Hilzinger President and COO Terry Haas SVP & President ABDC Steve Collis SVP & President ABSG Mike DiCandilo EVP and CFO Questions & Answers |
 6 GAAP Diluted EPS from Continuing Operations Adjusted for December 2005 Stock Split The Power of Smart Growth $2.50 $2.00 $1.50 $1.00 $0.50 $0.00 FY01 FY02 FY03 FY04 FY05 FY06 $1.06 $1.57 $1.95 $2.06 $1.37 $2.26 CAGR 16% |
 7 The Power of Smart Growth The Power of Smart Growth Suppliers Dispensers Brand Name Rx Generic Rx OTC Biotech HBA HHC Regional Chains Independent Retailers Hospitals Alternate Site Physicians PRODUCTS (12 hours) SOLUTIONS (24/7) |
 8 AWP AMP $4.00 Generics at Retail Medicare Part D Industry Environment The Power of Smart Growth Industry Issues |
 9 What is it? Sticker price of branded drugs Retail payments are at a discount, ie. AWP- X% If court ruling lowers AWP; discount will adjust Market Impact Pricing adjustment over 90 days Makes payor part of channel more transparent Impact on ABC No Direct impact on ABC ABC buys and sells on WAC Indirect impact on ABC from retail customers The Power of Smart Growth AWP (Average Wholesale Price) |
 10 The Power of Smart Growth What is it? Proposed Average Price Available in market Generic payment under Medicaid CMS to provide Guidelines Effective date TBD Market Impact Increased Transparency on Payor Models Key: Definition of Class of Trade Impact on ABC No Direct impact on ABC Indirect impact on ABC from retail customers AMP (Average Manufacturing Price) |
 11 What is it? Limited number of generics sold at $4.00 Retail Appeals to uninsured Alternative to convenience and service Market Impact Minimal Impact to Date Impact on ABC No impact on ABC No material change in generic usage in Tampa or Florida by our customers The Power of Smart Growth $4.00 Generics at Retail |
 12 What is it? Rx coverage under Medicare 80% Satisfaction from Seniors More Choice Than Anticipated Market Impact Increased Utilization Increased Rx Healthcare Impact Impact on ABC Increased Revenue The Power of Smart Growth Medicare Part D |
 13 Suppliers (FFS) Customers (low concentration) Competitors (always a question) Government (reasons for optimism) The Power of Smart Growth Industry Environment: Stable |
 14 The Power of Smart Growth Smart Growth Right Markets Right Customers Right Suppliers/Manufacturers Right Products/Solutions Right Use of Cash Right People/Execution |
 15 The Power of Smart Growth Right Use of Cash Return to Shareholders Dividend Stock Repurchase Investment in the Business ABDC “green fields” ABSG DC’s Solutions Expansion Acquisitions/Divestitures |
 16 Scale $1.9 Billion #2 National Company with 330,000 beds Leverage New Technology & Packaging Solutions Growth Internal Growth Acquisitions Opportunity Tax Free Value Creation $ Distribution to parent ABC Shareholders Own 50% of New Company $30 Million in Synergy Cost Savings for the New Company ABC Focuses on Core Business, New Company on LTC Timing March 07 Quarter Divestiture: PharMerica LTC The Power of Smart Growth |
 17 ABC will be the leading distributor of branded pharmaceuticals and related services ABC will be the leading distributor of generic pharmaceuticals and related services ABC will be the packager of choice for pharmaceutical manufacturers ABC will be the leading distributor of specialty pharmaceutical products and related services Related Services = Key Differentiator Acquisition Strategy |
 18 Trent Asenda Rep-Pharm NMCR IgG America AMD Health Advocates FY 06 and FY 07 YTD Acquisitions Brecon Acquisition Strategy ABC will be the leading wholesale distributor of generic pharmaceuticals and related services ABC will be the leading wholesale distributor of branded pharmaceuticals and related services ABC will be the leading distributor of specialty pharmaceutical products and related services ABC will be the packager of choice for pharmaceutical manufacturers |
 19 The Power of Smart Growth … Right People/Execution Some of the People who make it happen |
 20 The Power of Smart Growth Kurt Hilzinger President and Chief Operating Officer AmerisourceBergen Corporation |
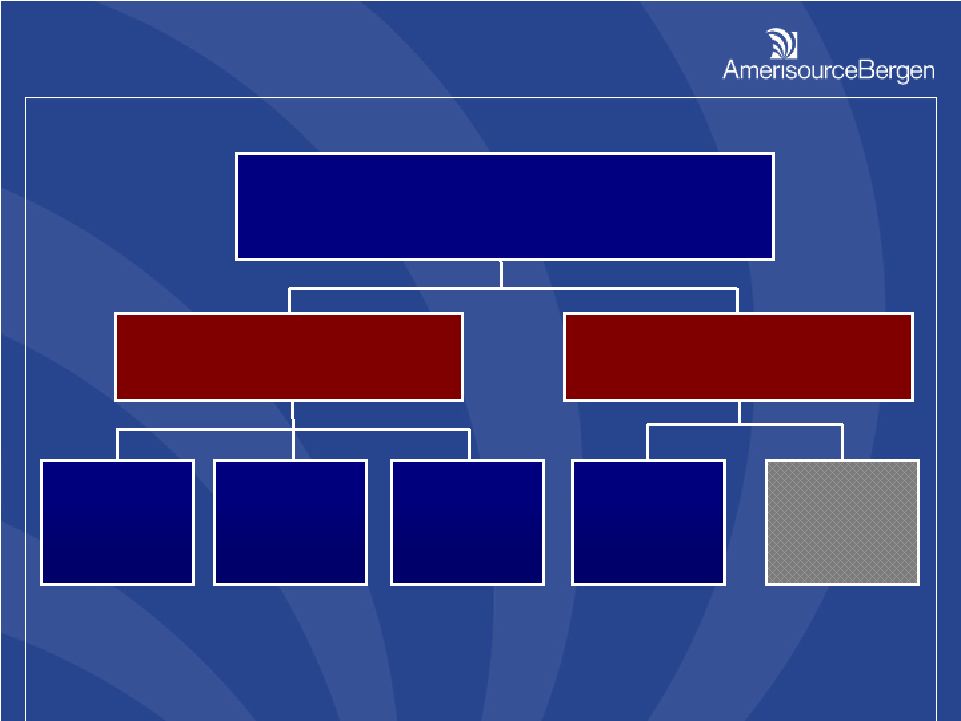 21 AmerisourceBergen Corporation Pharmaceutical Distribution Pharmerica Specialty Group (ABSG) Drug Company (ABDC) Packaging Group (ABPG) Long Term Care (LTC) Workers Comp (PMSI) AmerisourceBergen Business Units AmerisourceBergen Business Units |
 22 Right Suppliers Right Markets Right Customers Smart Growth Smart Growth Generics |
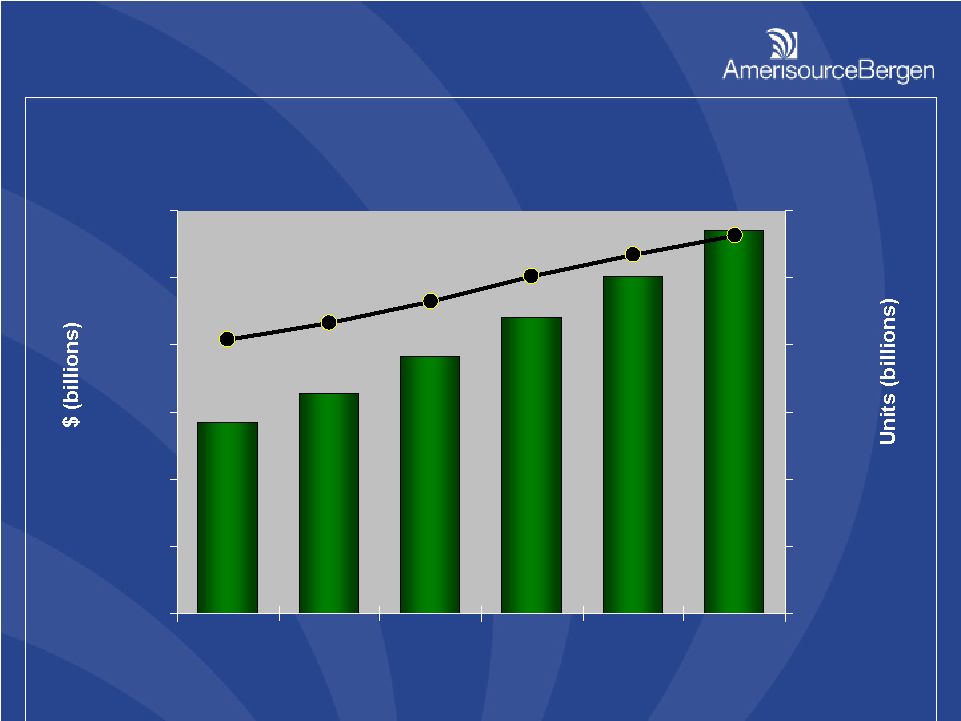 23 $0 $10 $20 $30 $40 $50 $60 2005 2006 2007 2008 2009 2010 0 30 60 90 120 150 180 $28.5 $28.5 $32.8 $32.8 $38.4 $38.4 $41.2 $41.2 $50.3 $50.3 $56.9 $56.9 U.S. Generic Market Opportunity U.S. Generic Market Opportunity Source: IMS HEALTH |
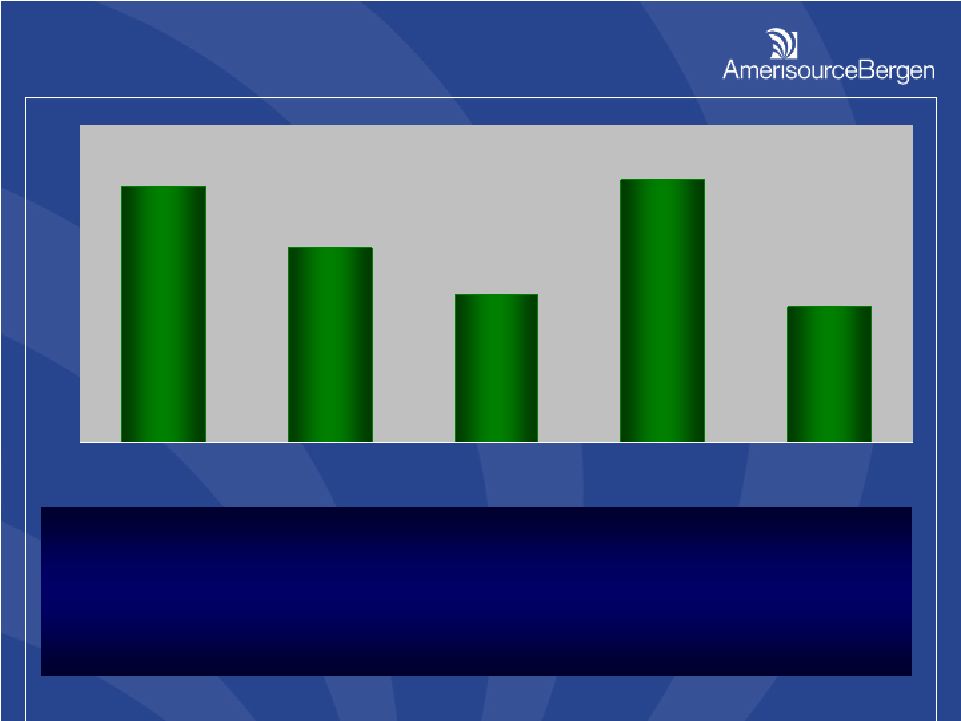 24 Branded Patent Expirations Branded Patent Expirations 2006 2007 2008 2009 2010 Top 3: $8.8 $6.8 $4.7 $7.4 $4.8 Zocor Norvasc Fosamax Prevacid Protonix Zoloft Risperdal Topamax Lexapro Levaquin Pravachol Ambien Lamictal Avandia Aricept Others: $3.3 $2.4 $2.3 $5.0 $1.6 Top 3: $8.8 $6.8 $4.7 $7.4 $4.8 Zocor Norvasc Fosamax Prevacid Protonix Zoloft Risperdal Topamax Lexapro Levaquin Pravachol Ambien Lamictal Avandia Aricept Others: $3.3 $2.4 $2.3 $5.0 $1.6 $ Billions $ Billions $12.1 $12.1 $9.2 $9.2 $7.0 $7.0 $12.4 $12.4 $6.4 $6.4 Source: IMS HEALTH |
 25 ABC Generic Program Overview ABC Generic Program Overview • $38B US market opportunity • ABC generic program growing faster than market • Market leading ability to aggregate demand – 3 to 5x margin vs. branded products • Large penetration in targeted segments • Leverage scale and supply chain integrity ABC Goal: most competitive generic offering with consistent supply and highest quality • $38B US market opportunity • ABC generic program growing faster than market • Market leading ability to aggregate demand – 3 to 5x margin vs. branded products • Large penetration in targeted segments • Leverage scale and supply chain integrity ABC Goal: most competitive generic offering with consistent supply and highest quality |
 26 • Product Selection – generic SKUs provide comprehensive formulary • Product Availability – 98% raw fill rate assures high service levels • Product Consistency – sole source awards minimize product changes • Competitive Pricing – market based pricing ensures dynamic response • Program Compliance – regional generics specialists provide local market expertise • Product Selection – generic SKUs provide comprehensive formulary • Product Availability – 98% raw fill rate assures high service levels • Product Consistency – sole source awards minimize product changes • Competitive Pricing – market based pricing ensures dynamic response • Program Compliance – regional generics specialists provide local market expertise |
 27 Generic Commercialization Generic Commercialization • Formulary compliance • New product launch processes • Innovative go-to-market approaches • Geographic expansion • Custom manufacturer services • Formulary compliance • New product launch processes • Innovative go-to-market approaches • Geographic expansion • Custom manufacturer services |
 28 Globalization Impact Globalization Impact $250 $175 $85 $95 2004 2005 2006 2007 • Leverage scale of ProGen offering • More partners emerging globally • Strategic relationships vs. transactional buying • Manage risk & capital investment • Optimize margin capture ABC Generic Sales from Emerging Market Suppliers ABC Generic Sales from Emerging Market Suppliers $ Millions (Projected) |
 29 AmerisourceBergen Packaging Group (ABPG) AmerisourceBergen Packaging Group (ABPG) |
 30 ABPG Capabilities ABPG Capabilities • Three operating companies on two continents • 12 facilities totaling 1,200,000 sq ft • 1,600 employees, all non-union • Over 100 packaging and manufacturing lines • All operations with strong regulatory compliance profiles • Established and growing channels and brand • Preferred supplier to 17 of top 17 brand manufacturers and preferred relationships with large segment of generics manufacturers • Three operating companies on two continents • 12 facilities totaling 1,200,000 sq ft • 1,600 employees, all non-union • Over 100 packaging and manufacturing lines • All operations with strong regulatory compliance profiles • Established and growing channels and brand • Preferred supplier to 17 of top 17 brand manufacturers and preferred relationships with large segment of generics manufacturers |
 31 Anderson Packaging Right Solutions / Right Customers Right Solutions / Right Customers American Health Packaging Brecon Pharmaceuticals Continue to grow traditional contract packaging Add proprietary package formats Add complementary packaging and manufacturing capabilities Key Customers: — Large Brand — Mid-size / Small / Virtual Brand — Specialty / Biotech Evolving to more specialized services Partner with manufacturers to market / differentiate products Coordinate with ABC distribution position and marketing programs Key Customers: — Large Generic — Mid-size / Small Generic One of the top pharmaceutical contract packagers in the UK, serving UK and Europe Clinical trial and commercial packaging Platform for European expansion Key Customers: — Large Brand — Mid-size / Small / Virtual Brand — Specialty / Biotech |
 32 AmerisourceBergen PMSI AmerisourceBergen PMSI |
 33 PMSI – The Trusted Source PMSI – The Trusted Source • Leading single source provider for of cost containment outsourcing solutions for the workers’ compensation and catastrophically injured populations across every aspect of care • 30 years of industry leadership, knowledge and experience • Nations largest network provider of medications, medical products and services devoted exclusively to workers’ compensation • Total solution for pharmacy services, clinical utilization and cost containment • Leading single source provider for of cost containment outsourcing solutions for the workers’ compensation and catastrophically injured populations across every aspect of care • 30 years of industry leadership, knowledge and experience • Nations largest network provider of medications, medical products and services devoted exclusively to workers’ compensation • Total solution for pharmacy services, clinical utilization and cost containment |
 34 PMSI – The Right Markets PMSI – The Right Markets Need access to the right medications and services at the right time – from injury right through settlement. They demand convenience, safety checks and responsive customer service. Need effective and efficient work processes for both adjudication and reimbursement. Need risk mitigation, clinical expertise, cost containment and enhanced operational efficiency to provide customer, worker and shareholder responsiveness. Workers Payors Retail Pharmacies |
 35 Workers’ Compensation Market Workers’ Compensation Market PMSI Target Market $12.4 Billion PMSI Target Market $12.4 Billion 0 0 0 0 0 0 0 0 0 0 0 0 0 0 0 0 0 0 0 0 0 0 0 0 0 0 0 0 0 0 0 0 0 0 0 0 0 0 0 0 0 0 0 0 0 0 0 0 0 0 1 1 1 1 1 1 1 1 1 1 1 1 1 1 1 1 1 1 1 1 1 1 1 1 1 1 1 1 1 1 1 1 1 1 1 1 1 1 1 1 1 1 1 1 1 1 1 1 1 1 1 6% Imaging 12% Pharmacy 14% DME / Supplies 14% Physical Medicine Total Market $142.2 Billion Total Market $142.2 Billion Wages & Lost Productivity 65% Medical Costs 19% Source: National Safety Council Injury Facts – 2004 & 2005 Edition |
 36 Patient Demographics Patient Demographics 21% 12% 67% Permanent Partial Temporary Permanent Total and Fatal 38% 62% DOI Greater than 5 Yrs DOI Less than 5 Yrs Percent of Benefits 2006 Bill Volume from Date of Injury (DOI) |
 37 PMSI – The Right Customers PMSI – The Right Customers • Services over 2.5 million active patients and 300 payors • Preferred vendor for 5 of the top 10 insurance carriers and 4 of the top 7 third-party administrators • Nations largest network provider including 54,000 pharmacies and 10,000 specialty service and DME suppliers • Processes over 4 million transactions annually • Services over 2.5 million active patients and 300 payors • Preferred vendor for 5 of the top 10 insurance carriers and 4 of the top 7 third-party administrators • Nations largest network provider including 54,000 pharmacies and 10,000 specialty service and DME suppliers • Processes over 4 million transactions annually |
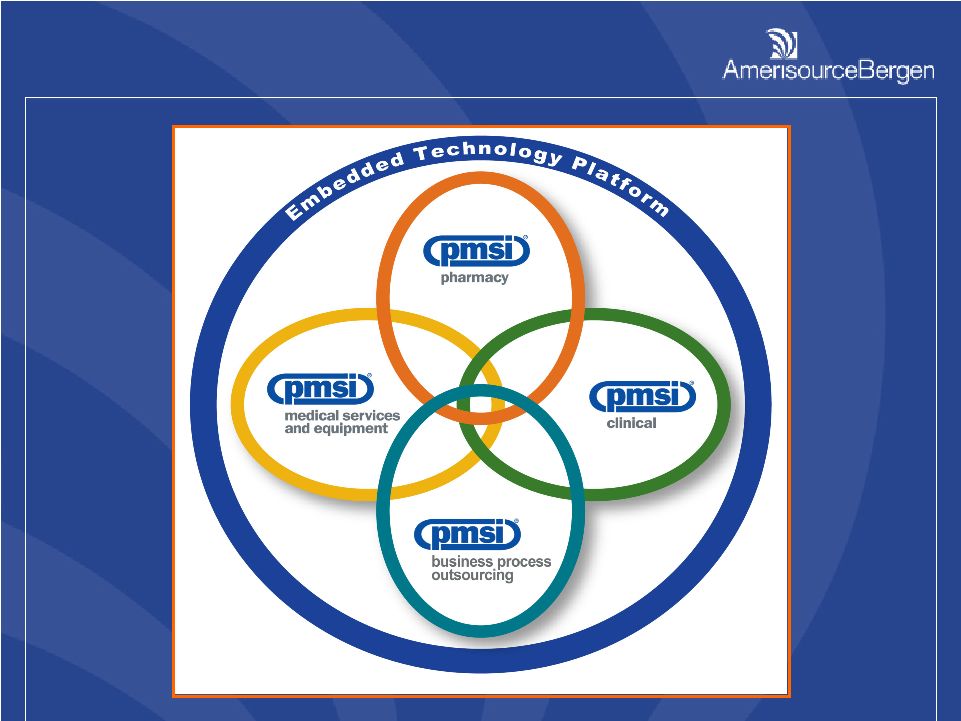 38 PMSI – Capabilities PMSI – Capabilities |
 39 • Acquisition for $85 MM in October 2006 • Provides Medicare set-aside (MSA) services to workers’ comp payors and workers • Medicare Part D creates new need for pharmacy set-aside services • Win – win – win for payor, worker, and CMS • Acquisition driven by common payor customer base and ability to extend duration for patient care • Acquisition for $85 MM in October 2006 • Provides Medicare set-aside (MSA) services to workers’ comp payors and workers • Medicare Part D creates new need for pharmacy set-aside services • Win – win – win for payor, worker, and CMS • Acquisition driven by common payor customer base and ability to extend duration for patient care Health Advocates Health Advocates |
 40 • Insurance premium increases • Broader definitions of work- related injuries and illnesses • Shifts in medical costs from group health plans to the workers’ compensation system • Increase in the severity of work related injuries • Aging work force • Medical and pharmacy cost inflation • Fully integrated suite of services • Clinical Risk Management capabilities • Comprehensive Medicare Set Asides • Long-standing client relationships • Deeply rooted catastrophic case management • Embedded technology platform Growth Drivers Why PMSI Market Leadership Market Leadership |
 41 Distribution & Services Terry Haas SVP and President AmerisourceBergen Drug Corporation (ABDC) |
 42 Right Infrastructure Right Market Segments Right Customers ABDC Strategic Foundation ABDC Strategic Foundation ABC Associates ABC Associates ABC Associates ABC Associates Infrastructure Infrastructure Infrastructure Infrastructure Customer Service Customer Service Customer Service Customer Service Strategic Management Strategic Management Operations Management Operations Management ABC Associates ABC Associates ABC Associates ABC Associates Infrastructure Infrastructure Infrastructure Infrastructure Customer Service Customer Service Customer Service Customer Service Strategic Management Strategic Management Operations Management Operations Management Optimiz An AmerisourceBergen Program Optimiz An AmerisourceBergen Program Optimiz An AmerisourceBergen Program Optimiz An AmerisourceBergen Program Optimiz An AmerisourceBergen Program Optimiz An AmerisourceBergen Program Optimiz An AmerisourceBergen Program Optimiz An AmerisourceBergen Program Optimiz An AmerisourceBergen Program Optimiz An AmerisourceBergen Program Optimiz An AmerisourceBergen Program Optimiz An AmerisourceBergen Program |
 43 Hawaii and Puerto Rico included in 51 Hawaii and Puerto Rico included in 51 As of August 29, 2001 As of August 29, 2001 Optimiz – Operations Optimiz – Operations 51 DCs 51 DCs |
 44 51 DCs Down to 26 51 DCs Down to 26 Optimiz – Operations Optimiz – Operations |
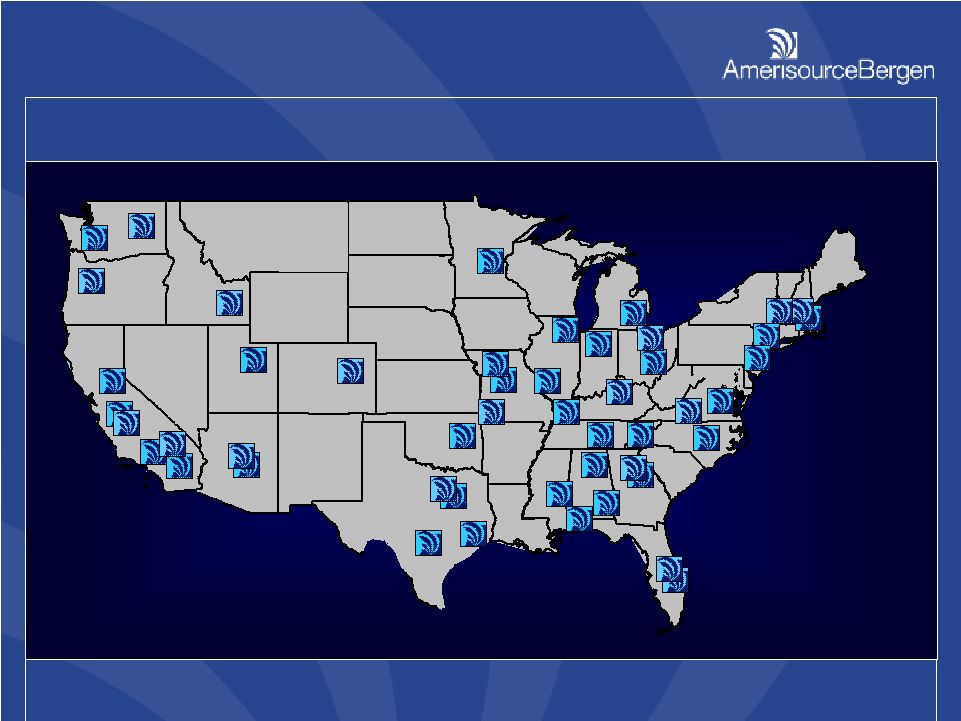
 45 ABDC Distribution Network ABDC Distribution Network Hawaii and Puerto Rico included in 26 Hawaii and Puerto Rico included in 26 As of December 13, 2006 As of December 13, 2006 26 DCs 26 DCs |
 46 ABDC Revenue Per Warehouse Associate ABDC Revenue Per Warehouse Associate $11,443 $10,046 $9,488 $7,671 $13,001 $0 $5,000 $10,000 $15,000 FY03 FY04 FY05 FY06 FY07 (Projected) Optimiz – Operations Impact Optimiz – Operations Impact |
 47 Percentage of Revenue on PkMS Percentage of Revenue on PkMS 24.5% 7.9% 96.6% 47.4% 89.4% 63.4% 0% 25% 50% 75% 100% FY03 FY04 FY05 FY06 FY07 FY08 (Projected) (Projected) Optimiz – Operations Impact Optimiz – Operations Impact |
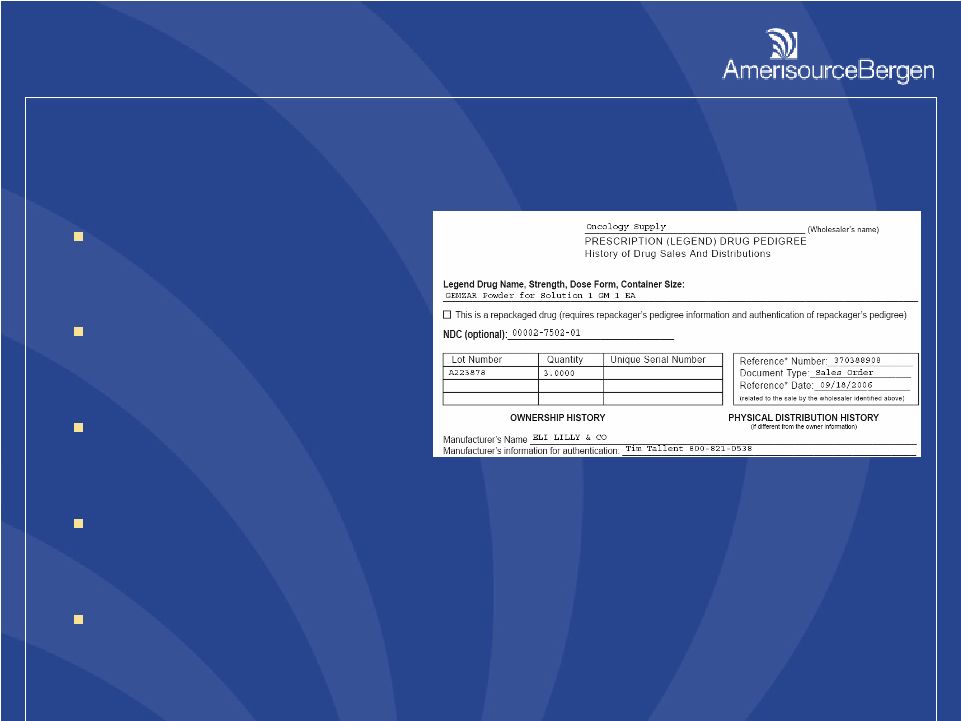
 48 • First wholesaler to establish Electronic Pedigree inter-operability with large retailer • ABC offering includes: – Fully operable electronic pedigree system in Florida – Pedigree for all returns – Pedigree services for fee to secondary distributors • First wholesaler to establish Electronic Pedigree inter-operability with large retailer • ABC offering includes: – Fully operable electronic pedigree system in Florida – Pedigree for all returns – Pedigree services for fee to secondary distributors Electronic Pedigree Leadership Electronic Pedigree Leadership |
 49 • Distributed electronic data system designed for scalability and speed • Unique electronic identification of unit and shipping container (RFID or 2D barcode) • Tracks chain of custody authentications • Pedigree created on demand • Distributed electronic data system designed for scalability and speed • Unique electronic identification of unit and shipping container (RFID or 2D barcode) • Tracks chain of custody authentications • Pedigree created on demand ABC’s Track and Trace Solution ABC’s Track and Trace Solution • Patient safety enhancement • Exceeds regulatory mandates • Business case and ROI possible through efficiency gains and inventory reductions • Patient safety enhancement • Exceeds regulatory mandates • Business case and ROI possible through efficiency gains and inventory reductions What is it? Benefits |
 50 Fee for Service Accomplishments Fee for Service Accomplishments • FFS complete • More than 75% of buyside margin not contingent on price increases • Service level increases • Improved relationships with manufacturers • Transparency in supply channel • FFS complete • More than 75% of buyside margin not contingent on price increases • Service level increases • Improved relationships with manufacturers • Transparency in supply channel |
 51 Optimiz An AmerisourceBergen Program Optimiz An AmerisourceBergen Program Optimiz An AmerisourceBergen Program Taking Optimiz to the Right Market Segments Taking Optimiz to the Right Market Segments |
 52 Operates four or more “for-profit” pharmacies open to the public; includes supermarket and mass merchant stores A combination of one to three stores that are open to the public and fill prescriptions, but not part of a chain Independent Independent Chain Chain Institutions providing medical / surgical care; includes on-site dispensaries, outpatient facilities, public health clinics, and/or pharmacies A residential care facility not located at a hospital; includes nursing and convalescent homes, assisted living, and institutional providers Hospital Hospital Alternate Care Alternate Care Market Segment Definitions Market Segment Definitions |
 53 Total U.S. Distribution Market Total U.S. Distribution Market ABDC FY07 Revenue Segmentation ABDC FY07 Revenue Segmentation U.S. Drug Distribution Market U.S. Drug Distribution Market 0 0 0 0 0 0 0 0 0 0 0 0 0 0 0 0 0 0 0 0 0 0 0 0 0 0 0 0 0 0 0 0 0 0 0 0 0 0 0 0 0 0 0 0 0 0 0 0 0 0 1 1 1 1 1 1 1 1 1 1 1 1 1 1 1 1 1 1 1 1 1 1 1 1 1 1 1 1 1 1 1 1 1 1 1 1 1 1 1 1 1 1 1 1 1 1 1 1 1 1 1 50% Hospital Alternate Care 50% Chain Independent |
 54 Optimiz An AmerisourceBergen Program Optimiz An AmerisourceBergen Program Optimiz An AmerisourceBergen Program Taking Optimiz to the Right Customers Taking Optimiz to the Right Customers |
 55 Independent Independent Chain Chain Hospital Hospital Alternate Care Alternate Care ABDC Customer Segments ABDC Customer Segments |
 56 ABDC Customer Focus Areas ABDC Customer Focus Areas Pharmaceutical Performance Optimization Revenue Enhancement Operating Efficiency Increased Market Share Margin Enhancement |
 57 Optimiz Rx – Expanded Service Offerings Optimiz Rx – Expanded Service Offerings • Initiative to accelerate development of new, innovative, and integrated solutions • Connected to segment go-to-market strategies • Commercialize proven ABC Optimiz leading practices, methods and tools • Migrate from transaction based to performance based account relationships • Initiative to accelerate development of new, innovative, and integrated solutions • Connected to segment go-to-market strategies • Commercialize proven ABC Optimiz leading practices, methods and tools • Migrate from transaction based to performance based account relationships |
 58 Optimiz Rx for Hospital and Alternate Care Supply Chain Solutions Clinical Solutions Community Care Solutions Optimiz Rx Optimiz Rx Pharmaceutical Performance Optimization Optimiz Rx for Independent & Chain Retail Retail Value Engineering Services Patient Health Data Tracking Business Coaching and Consulting |
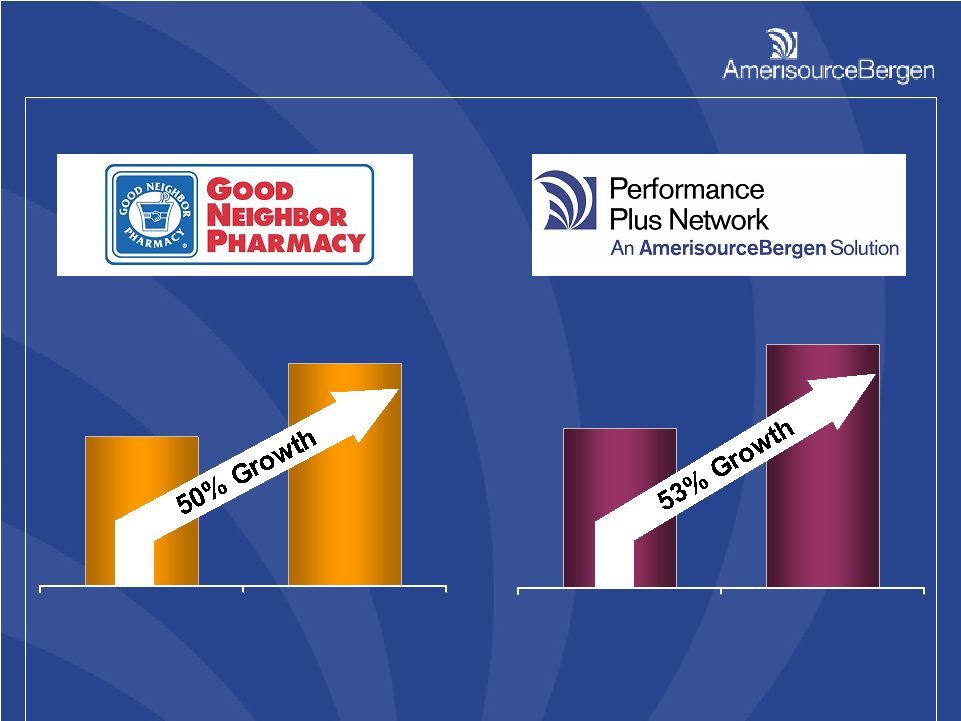 59 0 3,000 0 1,000 2,000 3,000 4,000 5,000 2005 2006 2005 2006 Smart Growth Smart Growth 1,800 3,200 2,700 4,900 |
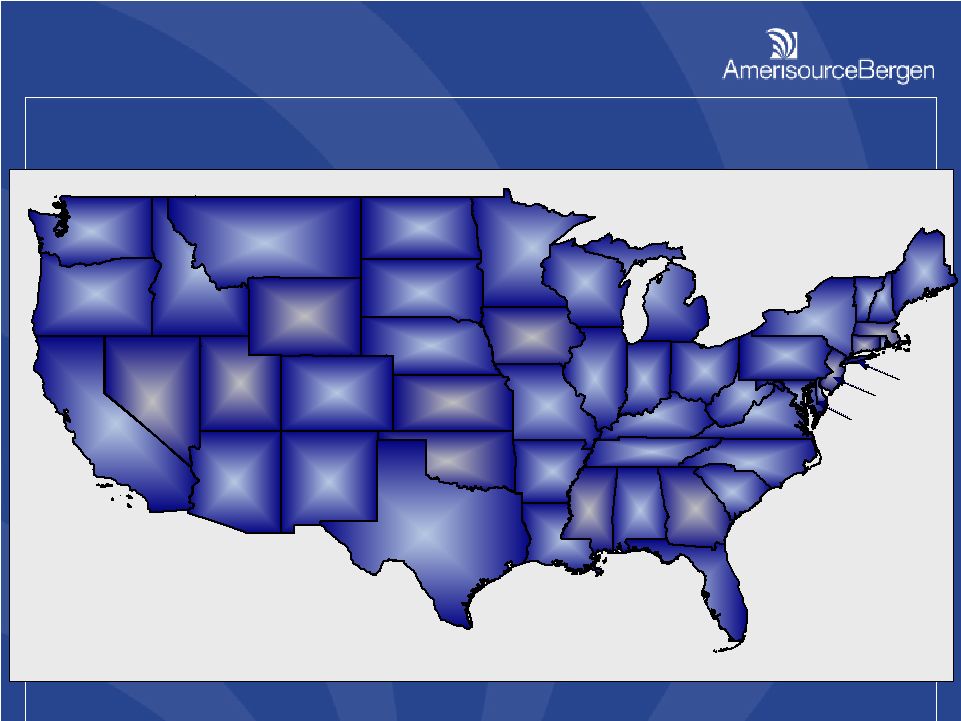 60 60 60 42 42 770 770 19 19 27 27 Guam: 22 Alaska: 4 Hawaii: 33 Virgin Islands: 1 19 19 29 29 84 84 14 14 25 25 5 5 23 23 40 40 266 266 70 70 45 45 53 53 71 71 70 70 64 64 65 65 216 216 145 145 107 107 132 132 21 21 174 174 198 198 98 98 39 39 337 337 223 223 76 76 83 83 43 43 176 176 216 216 386 386 35 35 5 5 15 15 33 33 10 10 174 174 5 5 32 32 Performance Plus Network (PPN) Performance Plus Network (PPN) Third Largest Managed Care Network Third Largest Managed Care Network |
 61 Optimiz An AmerisourceBergen Program Optimiz An AmerisourceBergen Program Optimiz An AmerisourceBergen Program Taking Optimiz to the Right Market - Canada Taking Optimiz to the Right Market - Canada |
 62 AmerisourceBergen - Canada AmerisourceBergen - Canada • Aggressive acquisition pace – Trent Drugs (October 2005) – Asenda (March 2006) – Rep-Pharm (September 2006) • Creates strong opportunities for growth – #2 in Canada ($1.5 billion revenue) • Quickly leverage and apply Optimiz program processes, methods and tools • Aggressive acquisition pace – Trent Drugs (October 2005) – Asenda (March 2006) – Rep-Pharm (September 2006) • Creates strong opportunities for growth – #2 in Canada ($1.5 billion revenue) • Quickly leverage and apply Optimiz program processes, methods and tools |
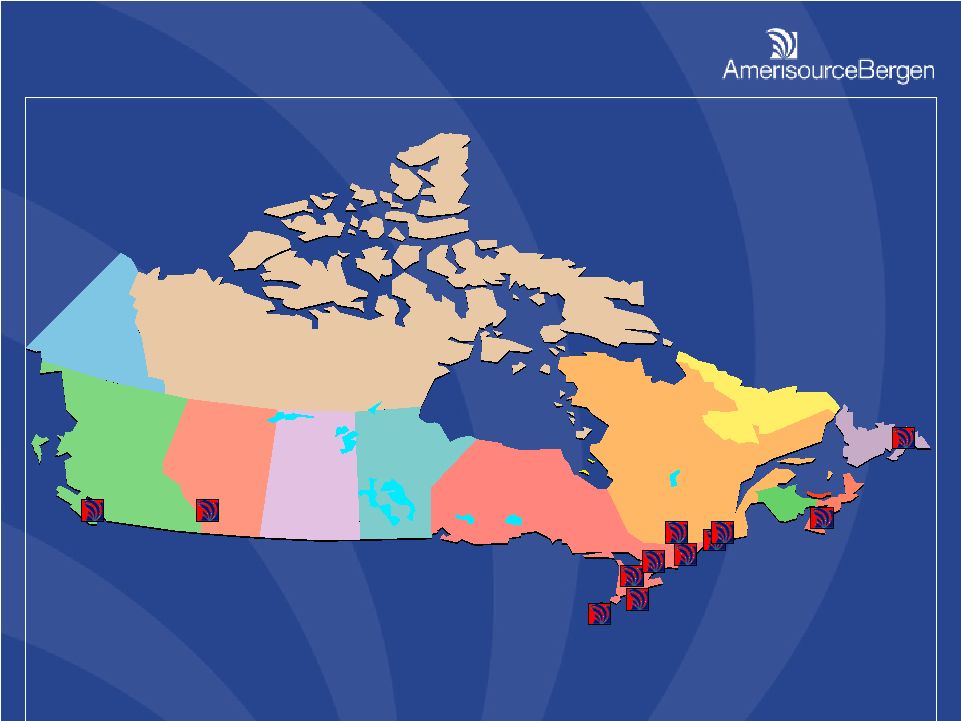 63 AmerisourceBergen Canada – Distribution Network AmerisourceBergen Canada – Distribution Network Richmond Richmond Mississauga Mississauga Calgary Calgary Dartmouth Dartmouth St. John’s St. John’s Chatam Chatam Hamilton Hamilton Scarborough Scarborough Kingston Kingston Montreal (2) Montreal (2) Hawksbury Hawksbury 12 Distribution Centers 12 Distribution Centers As of December 13, 2006 As of December 13, 2006 |
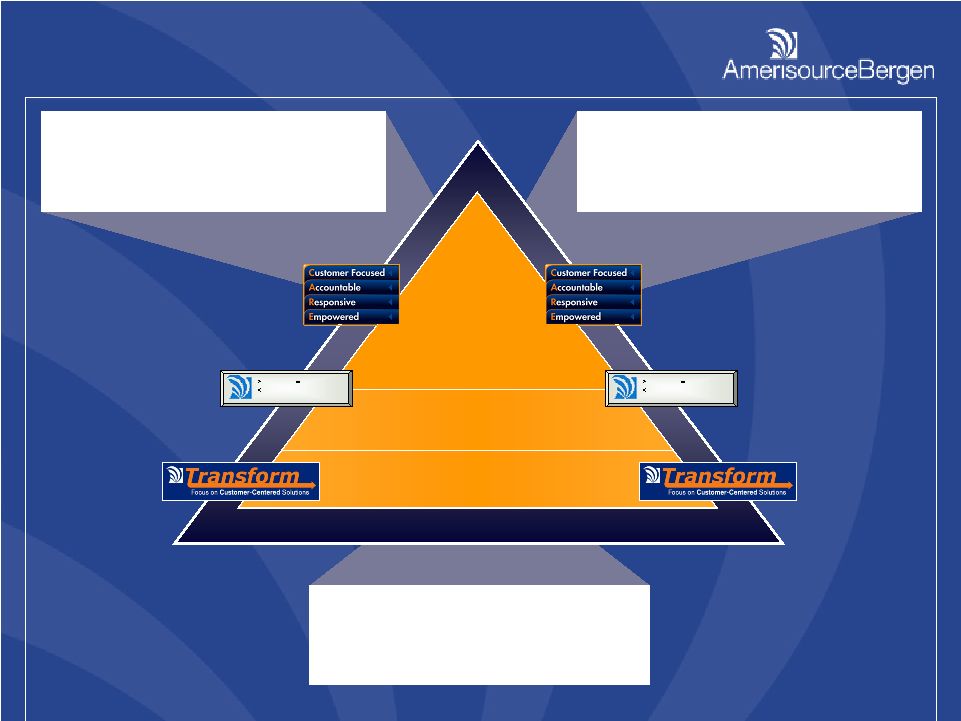
 64 • Unique Business Strategy: Transform • Operational Excellence: Optimiz • Operating Philosophy: CARE • Expanded Service Offering: Optimiz Rx • Unique Business Strategy: Transform • Operational Excellence: Optimiz • Operating Philosophy: CARE • Expanded Service Offering: Optimiz Rx Summary - Smart Growth Summary - Smart Growth |
 65 Specialty Distribution & Services Steven H. Collis SVP and President AmerisourceBergen Specialty Group (ABSG) |
 66 Specialty Market 4-year CAGR = 10%-15% Oncology Market = 15%-20% By 2010, half of FDA approvals specialty drugs Right Market |
 67 Specialty Market Specialty drug spend increasing at twice the rate of traditional drug spend Growing number of oral drugs; approx. 140 in pipeline Right Market |
 68 Specialty Market Growth of specialty pharmaceuticals is driving growth for specialized distribution and services Increased use of outsourced services Specialty pharmacy channel increasing in importance ABSG Market Share in Key Markets gives us unique value proposition to Manufacturers looking for visibility and real time; transparent data. IMS 2006 Data over 60 % in key Oncology Drugs in Physician settings Right Market |
 69 Specialty Group Services Right Solutions Our Services |
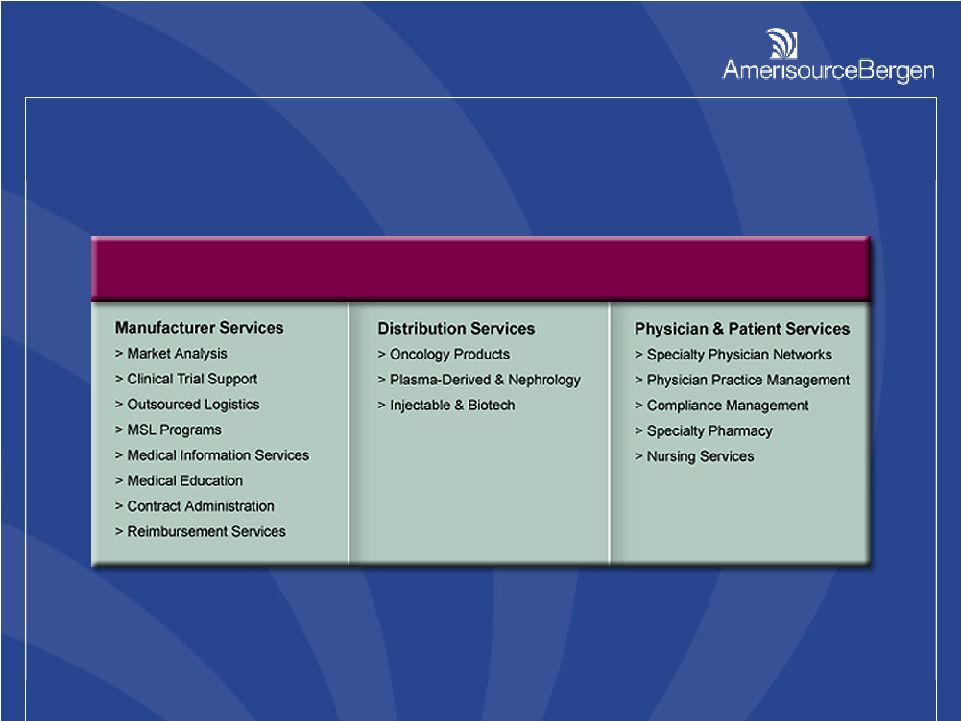
 70 Distribution Services Manufacturer Services Phys & Patient Services ABSG Companies Right Solutions |
 71 Oncology Revenue As a Share of $10 Billion Specialty Business Oncology Revenue Non-oncology Revenue Right Position |
 72 Oncology Platform Nation’s Largest Oncology Distributor Largest Oncology Physician Services Membership Organization Over 4100 community oncologists Over 2400 practices Manufacturer Support Services Accredited CME & market research Reimbursement consulting Right Position |
 73 Specialty Manufacturers More discerning about the channel used Pedigree/product integrity Manufacturers need solutions related to: Reimbursement Commercialization Product education Pricing integrity, real-time data Right Customers |
 74 Specialty Physicians Healthcare providers need solutions: Increasingly complex contract relationships with pharmaceutical manufacturers Practice management Patient access Medical education (CME) Clinical trials Product information Rapidly changing reimbursement landscape Right Customers |
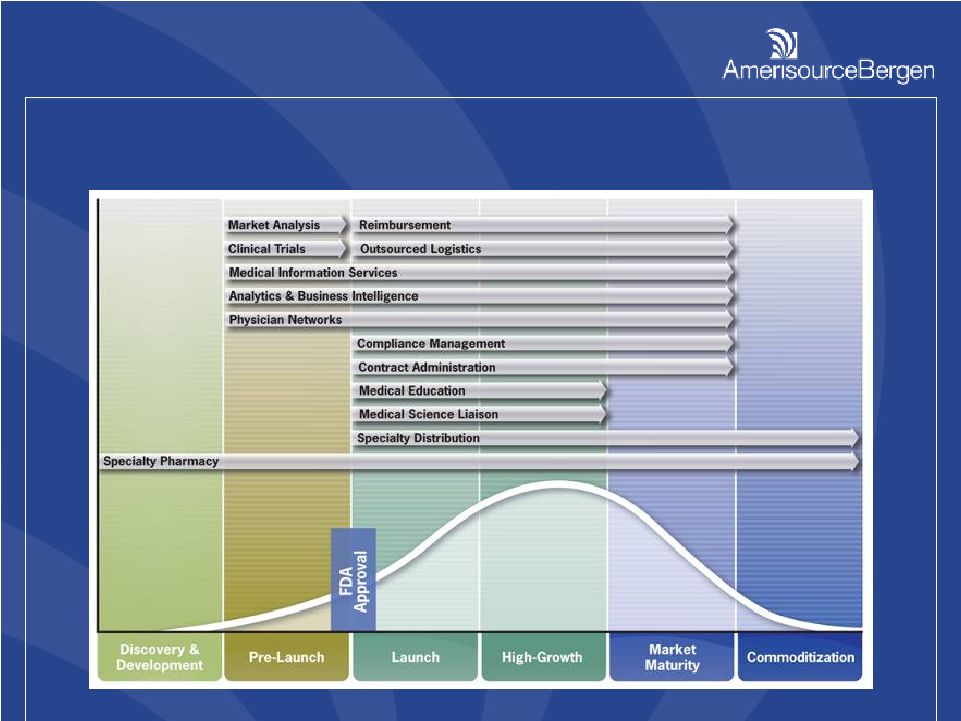 75 Specialty Product Life Cycle Right Solutions |
 76 Data Analytics & Business Intelligence Solutions Reimbursement Consulting Customer Care Centers (Single point of access programs) Market Access Education Patient Assistance Programs (Manufacturer, Foundations & Card Programs) IME & CME Clinical Practice Analytics Payer Advisory Boards & Payer Education Clinical Support Lines Patient Compliance & Adherence 3PL & Logistics Services Reimbursement Education Programs Patient Compliance & Adherence Manufacturer Services Right Products & Solutions |
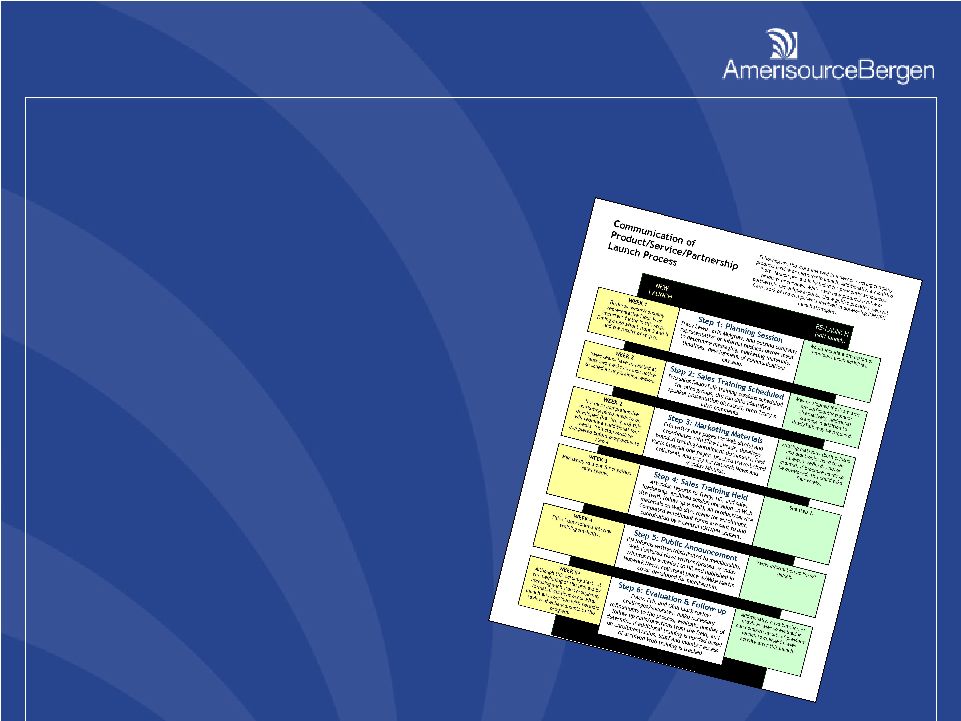 77 ABSG utilizes a product launch process map to drive and support product launches, including a modified “soft” launch process to invigorate and enhance existing products or services. While each new product/service or partnership has unique aspects, these guides provide a general framework of the components involved in developing launch strategies and are easily tailored to specific objectives. Product Launch Solutions Right Solutions |
 78 Three distribution centers CGMP and ISO certified Lot-Controlled Inventory 99.95% accuracy rate Pedigree capability Distribution Right Solutions |
 79 Inventory management Physician contract management Business continuity Data services Returns processing Supply chain safety Dashboards and web portals Distribution Right Solutions |
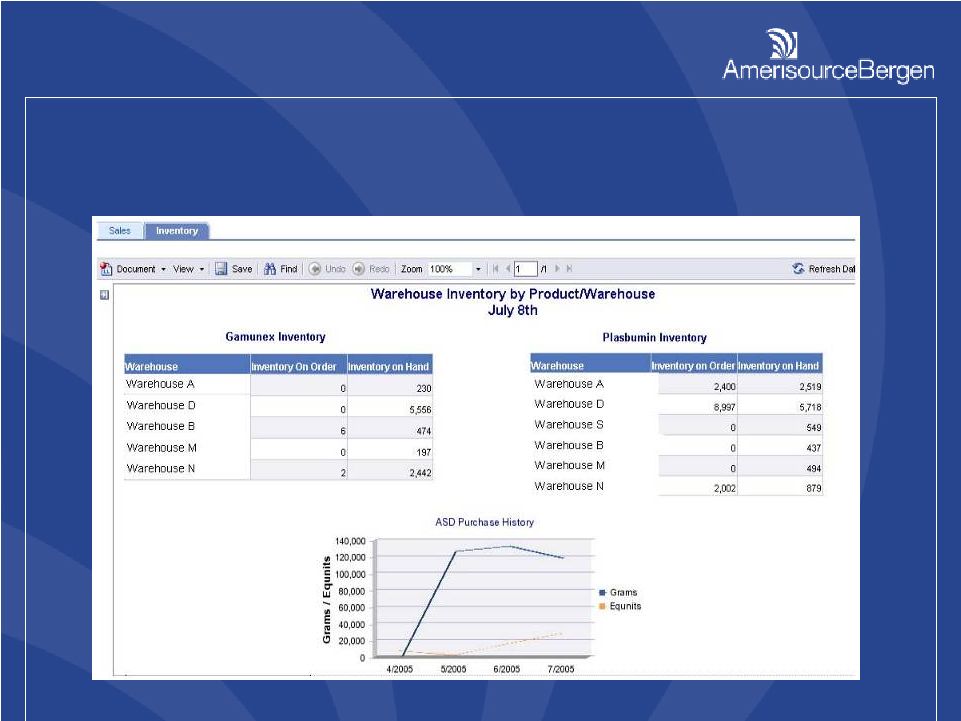 80 Inventory Management Right Solutions |
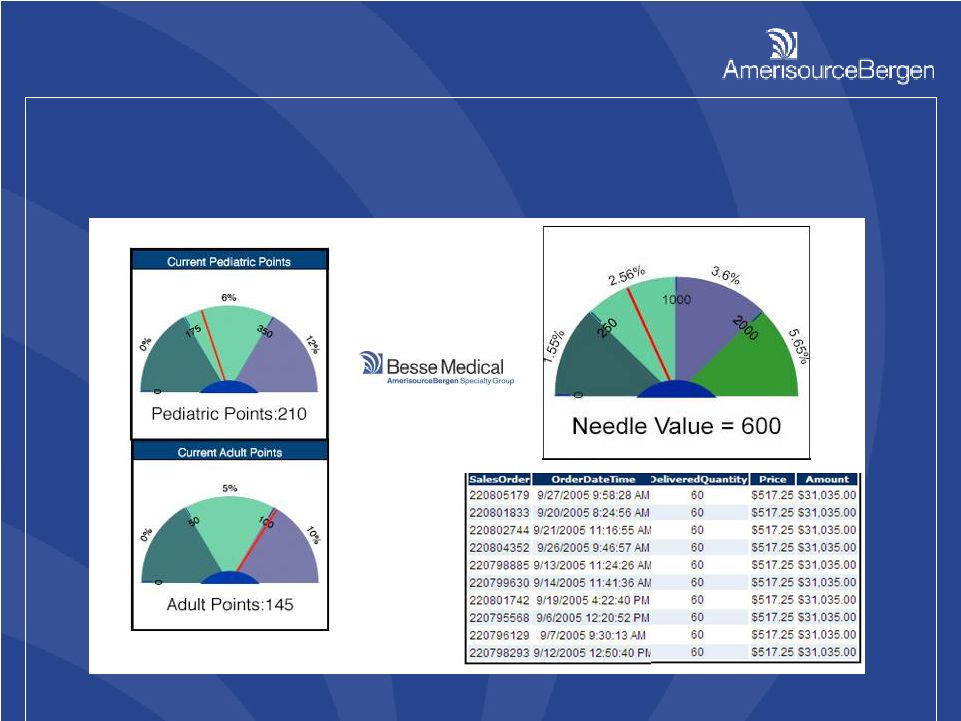 81 Physician Contract Management Right Solutions |
 82 Group Purchase Organization (GPO) Contract Pricing Publications Meetings, webinars, and webcasts Advisory panels Large Practice Program Market research and data capture projects Clinical trials and clinical guideline development Practice management consulting Physician & Patient Services Right Solutions |
 83 AMD Group acquisition Leader in its field Manufacturers Can Deliver: Cost reimbursement (incl. co-pay assistance) Maximum therapy benefit (compliance) Pharmacy services (home delivery) Homecare (injections, infusions, training) Taking Specialty to Canada Right Market |
 84 The Power of Smart Growth Michael D. DiCandilo Executive Vice President and Chief Financial Officer |
 85 Revenue growth with market Operating margin expansion ROIC > WACC EPS growth of 15% Free cash flow approximates net income Minimum 30% of free cash returned to shareholders The Power of Smart Growth Long Term Financial Goals |
 86 Record operating revenue of $56.7B, up 13% Pharmaceutical Distribution Operating Income grew 21% (Margin Expansion) ROIC > WACC Diluted EPS from continuing operations of $2.26, up 65% Excluding special items, $2.14 up 30% Free cash flow 148% of net income Returns to shareholders>100% of free cash flow Met or Exceeded Long-Term Goals The Power of Smart Growth Fiscal Year 2006 Results |
 87 The Power of Smart Growth Fiscal Year 2007 Targets Operating revenue growth of 7% to 9% Operating margin expansion – single digit basis points ROIC > WACC Diluted EPS of $2.40-$2.55, up 12-19% PharMerica LTC 9¢ to 11¢ for full year Free cash flow of $425 to $500 Million Includes CapEx of $100-$125 Million Repurchase $450 Million to $500 Million of shares Meets or Exceeds Long-Term Goals |
 88 Fiscal Year 2007 Targets Revenue Growth and Operating Margin by Business Unit Pharmaceutical Distribution % of Total Segment Revenue Growth Range ABDC ABSG ABPG 30% 70% 5-7% 15-20% 10-15% PharMerica 80% 18-20% <1/2% PMSI LTC 8-12% 6-9% Total Revenue Growth 7-9% Operating Margin Range 1% 2% 10% 10% 3% The Power of Smart Growth |
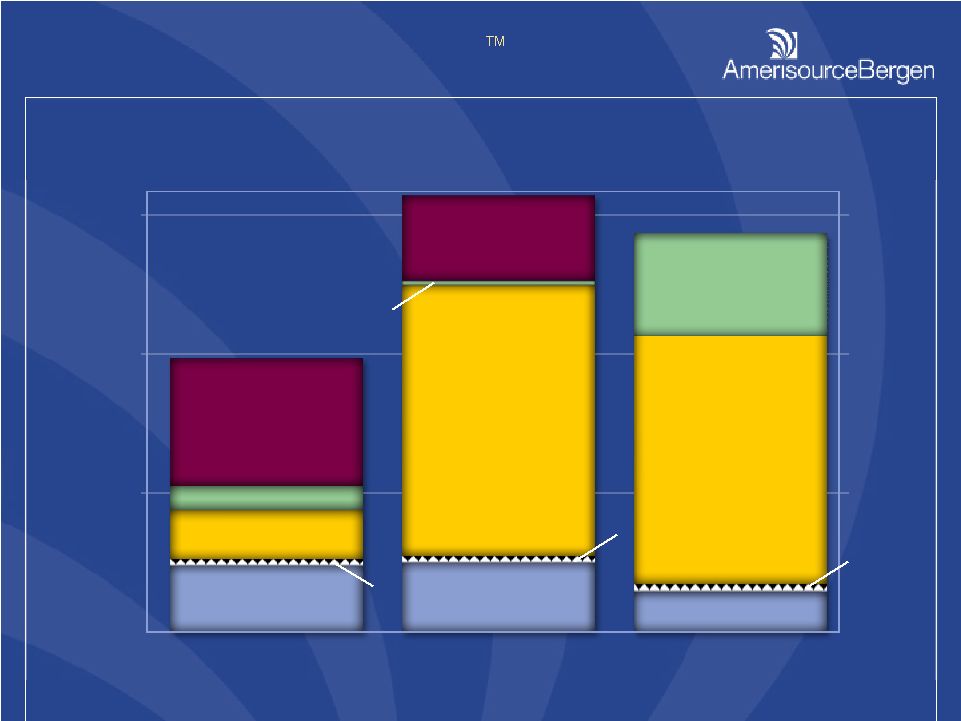 89 The Power of Smart Growth $1,200 FY04 FY05 FY06 (in millions) $800 $400 $0 CapX CapX CapX Dividends Dividends Dividends Dividends Dividends Dividends Share Repurchase Share Repurchase Share Repurchase Acquisitions Acquisitions Acquisitions Acquisitions Debt Repayment Debt Repayment Capital Deployment |
 90 What’s Available? $1.3 billion of cash and short-term investments @ 9/30/06 ($1.1B available) Free Cash Flow of $425-$500 million expected for FY07 Total available for investment $1.5-$1.6 billion, excluding additional borrowing capacity Where to deploy? $752 million available under share repurchase program • $450-$500 million expected to be repurchased in FY07 $138 million spent on acquisitions fiscal 2007 to date Dividend doubled to approximately $40 million $600-$700 million available for further investment Significant Financial Flexibility The Power of Smart Growth Fiscal 2007 Capital Deployment |
 91 The Power of Smart Growth The Power of Smart Growth Right Markets Pharmaceutical Supply Channel Generics Specialty Pharmaceuticals Right Customers Retail and Institutional Pharmacies Physicians Pharma Manufacturers Right Financial Position Well Positioned for Growth |
 92 Questions And Answers |