Exhibit 99.1

| 2010 Analyst & Investor Conference ARRIS HeadquartersSuwanee, GAMarch 17-18, 2010 |

| Safe Harbor This presentation contains forward-looking statements concerning prospects and trends for the cable industry, demand for the products produced by ARRIS and general prospects for ARRIS in 2010 and beyond. The statements in this presentation that use such words as "believe," "expect," "intend," "anticipate," "contemplate," "estimate," or "plan," or similar expressions also are forward- looking statements. Actual results may differ materially from those contained in, or suggested by, any forward-looking statement. Specific factors that could cause such material differences include: the effectiveness and timing of the integration of the operations of ARRIS and recent acquisitions and capital spending levels by our customers based in part on demand for broadband services. Other factors include the strength of the capital markets and the general economy, customer adoption of our technologies, development and marketing of technology by our competitors and risks associated with potential acquisitions. This list of factors is representative of the factors which could affect our forward-looking statements and is not intended as an all encompassing list of such factors. Additional information regarding these and other factors can be found in ARRIS' reports filed with the Securities and Exchange Commission, including its Form 10-K for the year ended December 31, 2009. We disclaim any obligation to update these statements, whether as a result of new information, future events or otherwise. March 18, 2010 2 2010 Analyst & Investor Conference |

| Market Dynamics The way people consume media is changing, worldwideThree ScreensTV EverywhereMedia Consumption drives more network bandwidth and capacityIP transport will become the optimal network technology choiceTransition to IP increases the ARRIS addressable marketAdditional opportunities from improved International market shareIncreased opportunities from economic recovery March 18, 2010 3 2010 Analyst & Investor Conference |

| Transition to IP Video Has Begun - - Driving Increases in IP Traffic March 18, 2010 4 2010 Analyst & Investor Conference Source: comScore Video Matrix, January 2010 (CHART) 2009 - An Inflection Year Jan. 2010: Average Hulu Viewer Watched 23.5 Videos (Comscore) |
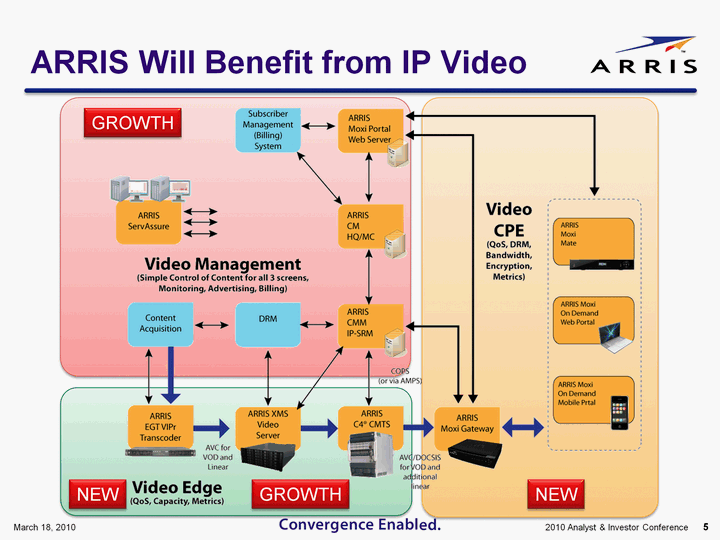
| ARRIS Will Benefit from IP Video March 18, 2010 5 2010 Analyst & Investor Conference NEW GROWTH GROWTH NEW |

| ARRIS 24% Share of Worldwide Total Addressable Market (TAM) Total Addressable Market (TAM) Total Addressable Market (TAM) March 18, 2010 6 2009 Total Cable CAPEX $26.1 B 2009 ARRIS Share of TAM 24% 2009 ARRIS TAM $4.5 B 2010 Analyst & Investor Conference |
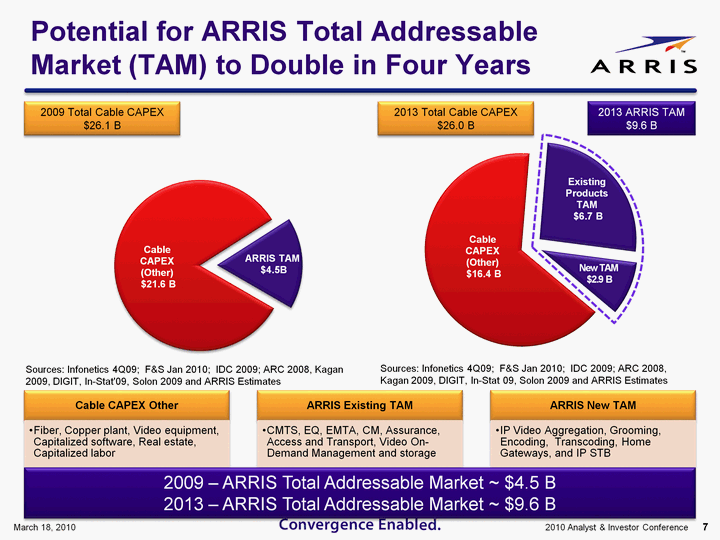
| Potential for ARRIS Total Addressable Market (TAM) to Double in Four Years Market (TAM) to Double in Four Years Market (TAM) to Double in Four Years Market (TAM) to Double in Four Years Market (TAM) to Double in Four Years March 18, 2010 7 2010 Analyst & Investor Conference 2009 Total Cable CAPEX$26.1 B 2013 Total Cable CAPEX$26.0 B 2013 ARRIS TAM$9.6 B 2009 - ARRIS Total Addressable Market ~ $4.5 B2013 - ARRIS Total Addressable Market ~ $9.6 B |

| Total Addressable Market (TAM) Growth Will Be Global Will Be Global Will Be Global Will Be Global Will Be Global March 18, 2010 8 2010 Analyst & Investor Conference 2009 ARRIS Share of TAM NA 30% ROW 14% |
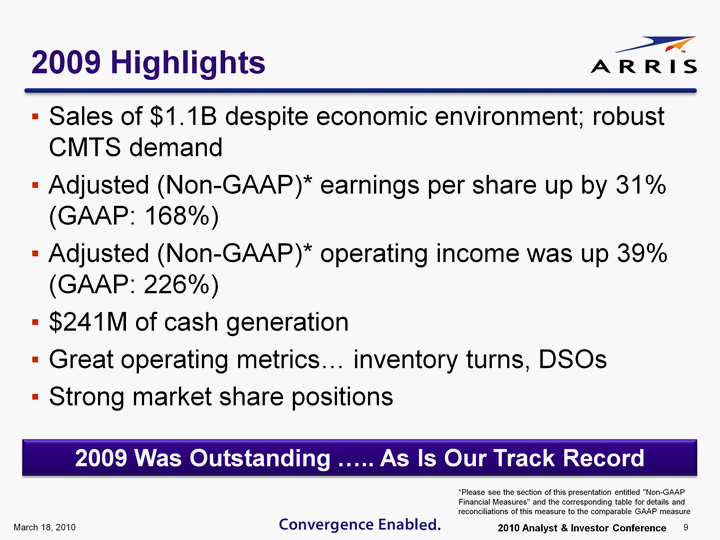
| 2009 Highlights Sales of $1.1B despite economic environment; robust CMTS demandAdjusted (Non-GAAP)* earnings per share up by 31% (GAAP: 168%)Adjusted (Non-GAAP)* operating income was up 39% (GAAP: 226%) $241M of cash generationGreat operating metrics... inventory turns, DSOsStrong market share positions March 18, 2010 9 2010 Analyst & Investor Conference 2009 Was Outstanding ..... As Is Our Track Record *Please see the section of this presentation entitled "Non-GAAP Financial Measures" and the corresponding table for details and reconciliations of this measure to the comparable GAAP measure |
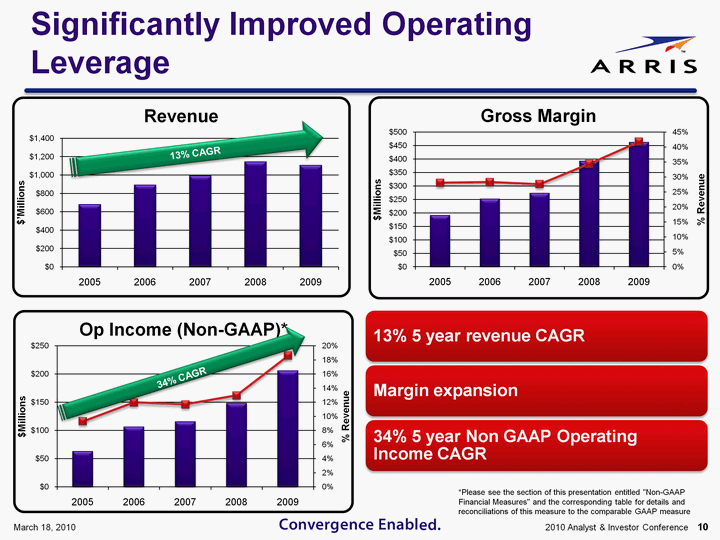
| Significantly Improved Operating Leverage March 18, 2010 10 2010 Analyst & Investor Conference (CHART) 13% CAGR (CHART) (CHART) *Please see the section of this presentation entitled "Non-GAAP Financial Measures" and the corresponding table for details and reconciliations of this measure to the comparable GAAP measure 34% CAGR |
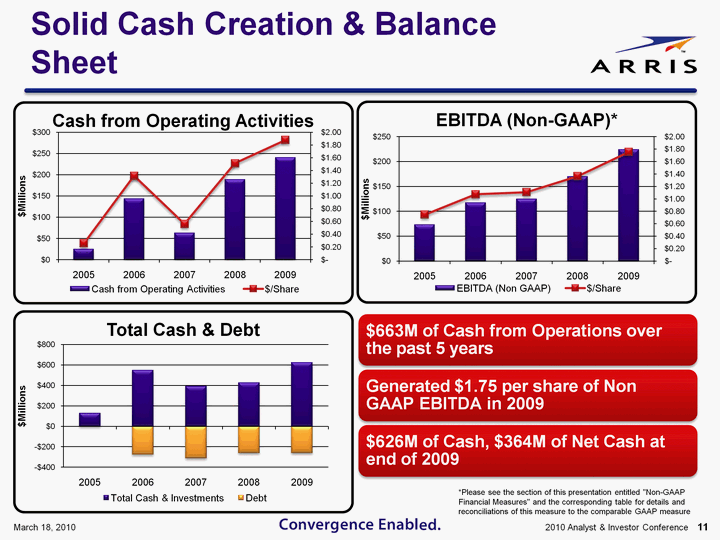
| Solid Cash Creation & Balance Sheet March 18, 2010 11 2010 Analyst & Investor Conference (CHART) (CHART) (CHART) *Please see the section of this presentation entitled "Non-GAAP Financial Measures" and the corresponding table for details and reconciliations of this measure to the comparable GAAP measure |
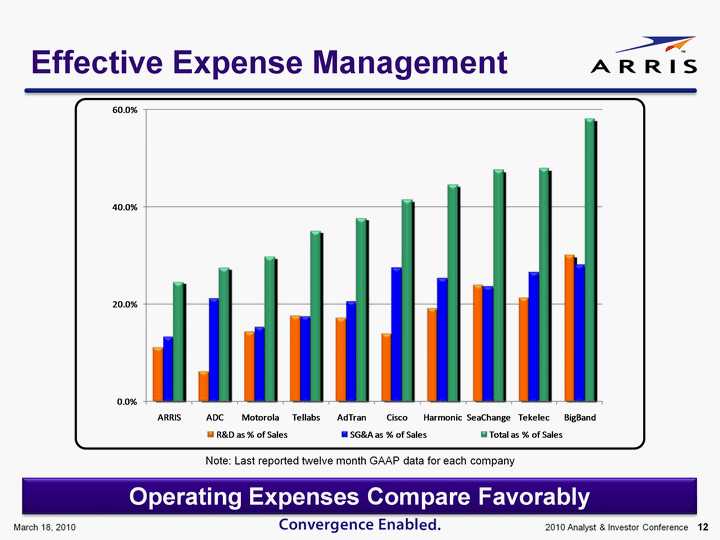
| Effective Expense Management March 18, 2010 12 2010 Analyst & Investor Conference Note: Last reported twelve month GAAP data for each company Operating Expenses Compare Favorably |
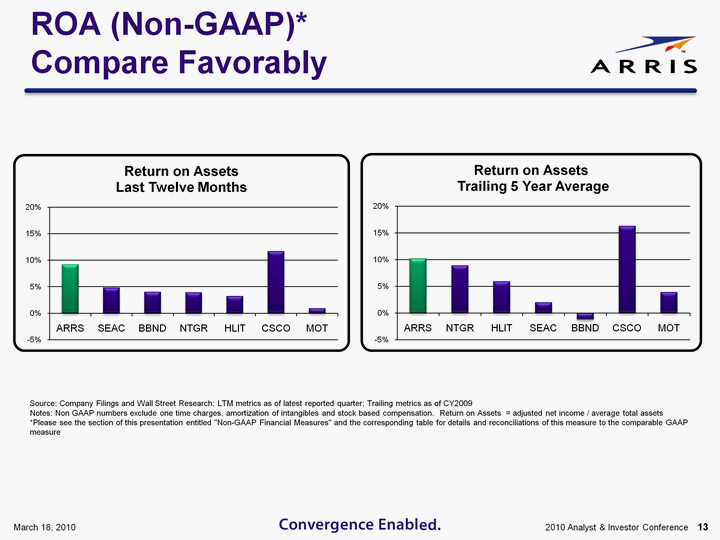
| ROA (Non-GAAP)* Compare Favorably March 18, 2010 13 2010 Analyst & Investor Conference (CHART) (CHART) Source: Company Filings and Wall Street Research; LTM metrics as of latest reported quarter; Trailing metrics as of CY2009Notes: Non GAAP numbers exclude one time charges, amortization of intangibles and stock based compensation. Return on Assets = adjusted net income / average total assets*Please see the section of this presentation entitled "Non-GAAP Financial Measures" and the corresponding table for details and reconciliations of this measure to the comparable GAAP measure |
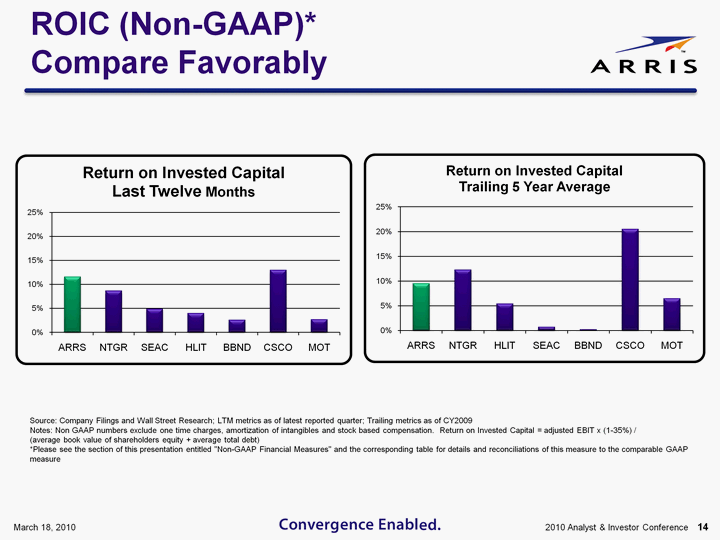
| ROIC (Non-GAAP)* Compare Favorably March 18, 2010 14 2010 Analyst & Investor Conference (CHART) (CHART) Source: Company Filings and Wall Street Research; LTM metrics as of latest reported quarter; Trailing metrics as of CY2009Notes: Non GAAP numbers exclude one time charges, amortization of intangibles and stock based compensation. Return on Invested Capital = adjusted EBIT x (1-35%) / (average book value of shareholders equity + average total debt)*Please see the section of this presentation entitled "Non-GAAP Financial Measures" and the corresponding table for details and reconciliations of this measure to the comparable GAAP measure |

| Have Done What We Said We Would Do Said We Would Do Said We Would Do Said We Would Do Said We Would Do March 18, 2010 15 2010 Analyst & Investor Conference |

| We Have Executed Expanded sales and margins through R&D and acquisitionsLeading market positionsEnhanced our capabilities to exploit emerging opportunities Robust cash generationStrong balance sheet March 18, 2010 16 2010 Analyst & Investor Conference Our Strategy Is Working and We Are Positioned for Profitable Growth |
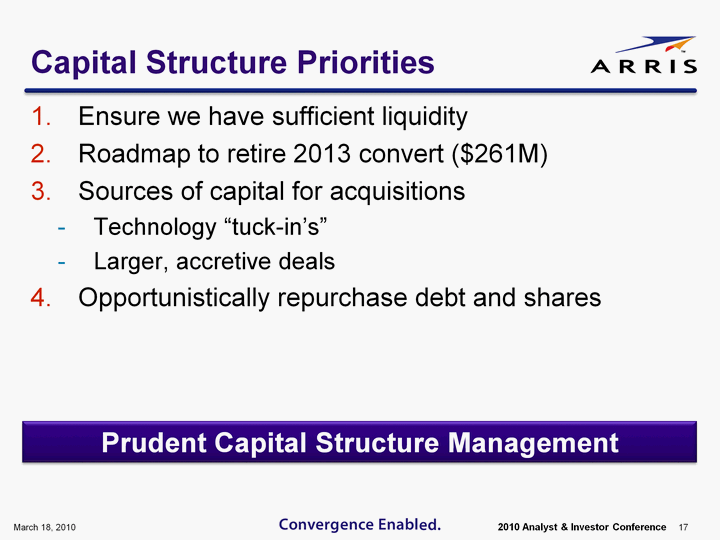
| Capital Structure Priorities Ensure we have sufficient liquidity Roadmap to retire 2013 convert ($261M) Sources of capital for acquisitionsTechnology "tuck-in's"Larger, accretive deals Opportunistically repurchase debt and shares March 18, 2010 17 2010 Analyst & Investor Conference Prudent Capital Structure Management |
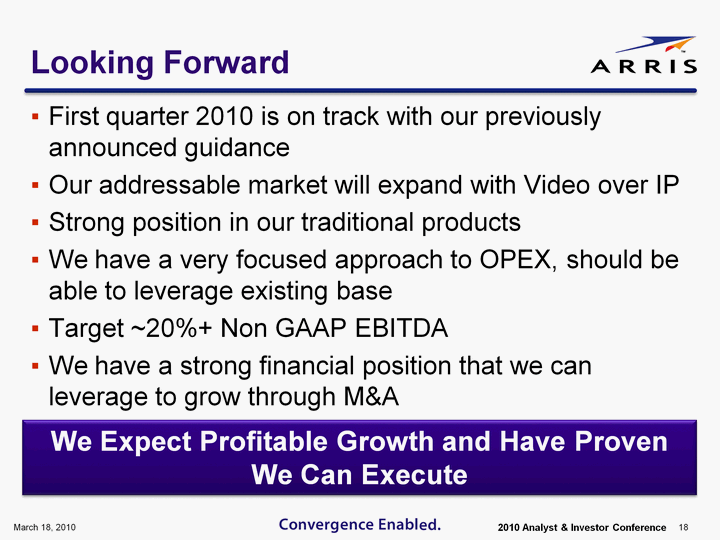
| Looking Forward First quarter 2010 is on track with our previously announced guidanceOur addressable market will expand with Video over IPStrong position in our traditional productsWe have a very focused approach to OPEX, should be able to leverage existing baseTarget ~20%+ Non GAAP EBITDAWe have a strong financial position that we can leverage to grow through M&A March 18, 2010 18 We Expect Profitable Growth and Have Proven We Can Execute 2010 Analyst & Investor Conference |
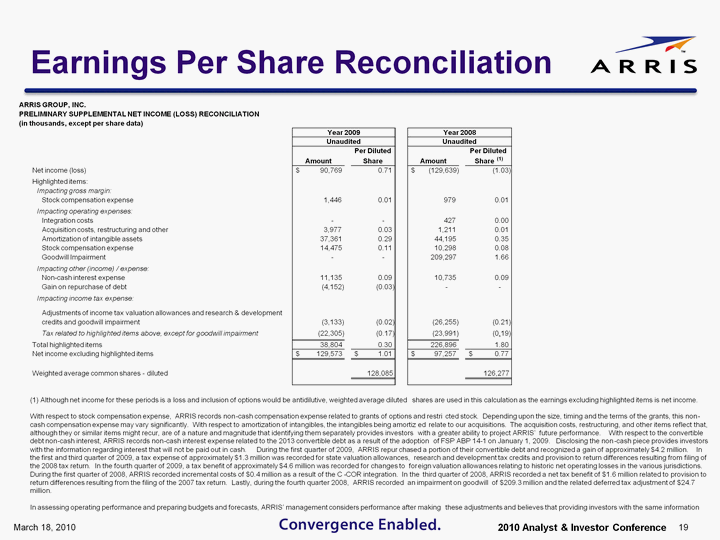
| Earnings Per Share Reconciliation March 18, 2010 19 ARRIS GROUP, INC. PRELIMINARY SUPPLEMENTAL NET INCOME (LOSS) RECONCILIATION (in thousands, except per share data) Per Diluted Per Diluted Amount Share Amount Share (1) Net income (loss) 90,769 $ 0.71 (129,639) $ (1.03) Highlighted items: Impacting gross margin: Stock compensation expense 1,446 0.01 979 0.01 Impacting operating expenses: Integration costs - - - - 427 0.00 Acquisition costs, restructuring and other 3,977 0.03 1,211 0.01 Amortization of intangible assets 37,361 0.29 44,195 0.35 Stock compensation expense 14,475 0.11 10,298 0.08 Goodwill Impairment - - - - 209,297 1.66 Impacting other (income) / expense: Non-cash interest expense 11,135 0.09 10,735 0.09 Gain on repurchase of debt (4,152) (0.03) - - - - Impacting income tax expense: Adjustments of income tax valuation allowances and research & development credits and goodwill impairment (3,133) (0.02) (26,255) (0.21) Tax related to highlighted items above, except for goodwill impairment (22,305) (0.17) (23,991) (0.19) - - Total highlighted items 38,804 0.30 226,896 1.80 Net income excluding highlighted items 129,573 $ 1.01 $ 97,257 $ 0.77 $ Weighted average common shares - diluted 128,085 126,277 Year 2008 Unaudited Unaudited Year 2009 (1) Although net income for these periods is a loss and inclusion of options would be antidilutive, weighted average diluted sha res are used in this calculation as the earnings excluding highlighted items is net income. With respect to stock compensation expense, ARRIS records non - - cash compensation expense related to grants of options and restri cted stock. Depending upon the size, timing and the terms of the grants, this non - - cash compensation expense may vary significantly. With respect to amortization of intangibles, the intangibles being amortiz ed relate to our acquisitions. The acquisition costs, restructuring, and other items reflect that, although they or similar items might recur, are of a nature and magnitude that identifying them separately provides investors wi th a greater ability to project ARRIS' future performance. With respect to the convertible debt non - - cash interest, ARRIS records non - - cash interest expense related to the 2013 convertible debt as a result of the adoption of FSP ABP 14 - - 1 on January 1, 2009. Disclosing the non - - cash piece provides investors with the information regarding interest that will not be paid out in cash. During the first quarter of 2009, ARRIS repur cha sed a portion of their convertible debt and recognized a gain of approximately $4.2 million. In the first and third quarter of 2009, a tax expense of approximately $1.3 million was recorded for state valuation allowances, re search and development tax credits and provision to return differences resulting from filing of the 2008 tax return. In the fourth quarter of 2009, a tax benefit of approximately $4.6 million was recorded for changes to for eign valuation allowances relating to historic net operating losses in the various jurisdictions. During the first quarter of 2008, ARRIS recorded incremental costs of $0.4 million as a result of the C - - COR integration. In the third quarter of 2008, ARRIS recorded a net tax benefit of $1.6 million related to provision to return differences resulting from the filing of the 2007 tax return. Lastly, during the fourth quarter 2008, ARRIS recorded an impairment on goodwill of $209.3 million and the related deferred tax adjustment of $24.7 million. In assessing operating performance and preparing budgets and forecasts, ARRIS' management considers performance after making the se adjustments and believes that providing investors with the same information 2010 Analyst & Investor Conference |

| Operating Income & Return on Invested Capital Reconciliation March 18, 2010 20 ARRIS GROUP, INC. SUPPLEMENTAL OPERATING INCOME AND RETURN ON INVESTED CAPITAL RECONCILIATIONS (Unaudited) (in thousands) 2004 2005 2006 (1) 2007 (1) 2008 (1) 2009 Operating Income (Loss) as reported 53,728 95,993 93,912 (118,113) 148,747 Highligted items: Write-off of discontinued inventory 1,046 - - - - Stock compensation expense 6,914 9,423 10,903 11,277 15,921 Gains related to previously written-off accts receivable (1,573) (377) - - - - Write-off of IPR&D 6,120 - - - - Acquisition costs, restructuring, and integration costs 1,040 2,210 1,836 1,638 3,977 Amortization of intangible assets 1,212 633 2,278 44,195 37,361 Goodwill Impairment 209,297 Impairment of long-lived assets 291 - - Total highligted items: 9,457 10,693 21,806 266,407 57,259 Operating Income excluding highlighted items 63,185 106,686 115,718 148,294 206,006 Effective Tax Rate 35% 35% 35% 35% 35% Operating Income as reported after tax 34,923 62,395 61,043 (76,773) 96,686 Operating Income excluding highlighted items after tax 41,070 69,346 75,217 96,391 133,904 Total Debt (long term & short term) 75,000 - - 276,000 311,305 261,196 261,174 Shareholder Equity 281,301 425,717 647,072 1,071,425 873,468 991,369 2005 2006 2007 2008 2009 5 year Trailing Return on invested capital (2) 8.9% 9.3% 5.3% - -6.1% 8.1% 5.1% Adjusted return on invested capital (3) 10.5% 10.3% 6.5% 7.7% 11.2% 9.2% (1) Restated for adoption of new accounting standards related to convertible debt instruments. (2) Defined as operating income after tax / (average total debt + average book value of shareholders equity) (3) Defined as adjusted operating income after tax / (average total debt + average book value of shareholders equity) 2010 Analyst & Investor Conference |

| Return on Assets Reconciliation March 18, 2010 21 ARRIS GROUP, INC. SUPPLEMENTAL RETURN ON ASSETS RECONCILIATIONS (Unaudited) (in thousands) 2004 2005 2006 (1) 2007 (1) 2008 (1) 2009 Net income (loss) as reported 51,483 140,839 92,347 (129,639) 90,769 Highligted items: Write-off of discontinued inventory 1,046 - - - - Stock compensation expense 6,914 9,423 10,903 11,277 15,921.00 receivable (1,573) (707) - - - - Write-off of IPR&D 6,120 - - - - Acquisition costs, restructuring, and integration costs 832 1,989 1,836 1,638 3,977 Amortization of intangible assets 1,212 633 2,278 44,195 37,361 Goodwill Impairment - - 209,297 - - Impairment of long-lived assets 291 - - - - - - - - Non-cash interest expense 2,362 9,925 10,735 11,136 expenses (22,835) - - - - Gain on investments 2,372 (4,864) - - - - Gain on repurchase of debt / debt retirement 71 - - - - (4,152) Tax related to items above 1,422 (24,078) (22,305) Adjustments of income tax valuation allowances, R&D credits, and other discrete tax items (38,791) (7,959) (26,255) (3,133) Total highligted items: 11,692 (25,957) (2,835) 226,809 38,805 Net income excluding highlighted items: 63,175 114,882 89,512 97,170 129,574 Total Assets 450,678 529,403 1,012,040 1,557,193 1,350,321 1,475,616 2005 2006 2007 2008 2009 5 year Trailing Return on assets (2) 10.5% 18.3% 7.2% - -8.9% 6.4% 6.7% Adjusted return on assets (3) 12.9% 14.9% 7.0% 6.7% 9.2% 10.1% (1) Restated for adoption of new accounting standards related to convertible debt instruments. (2) Defined as net income / average total assets (3) Defined as adjusted net income / average total assets 2010 Analyst & Investor Conference |

| EBITDA Reconciliation March 18, 2010 22 ARRIS GROUP, INC. SUPPLEMENTAL EBITDA RECONCILIATION (Unaudited) (in thousands, except per share data) 2005 2006 (1) 2007 (1) 2008 (1) 2009 Net income (loss) as reported 51,483 140,839 92,347 (129,639) 90,769 Income Tax Expense 513 (35,682) 37,370 2,375 43,849 Interest Income (3,100) (11,174) (24,776) (7,224) (1,409.00) Interest Expense 2,101 3,294 16,188 17,123 16,942 Amort of Def Finance Fees 305 95 764 761 728 Depreciation 10,529 9,787 10,852 20,915 20,862 Amort of Intangibles 1,212 633 2,278 44,195 37,361 EBITDA 63,043 107,792 135,023 (51,494) 209,102 EBITDA per share 0.64 0.98 1.19 - -0.41 1.63 Highligted items: Stock Comp 6,914 9,423 10,903 11,277 15,921.00 Restructuring 832 1,989 421 1,211 3,701.00 Goodwill Impairment - - - - - - 209,297 - - Gain/Loss on Debt Conversion - - - - - - - - (4,152.00) Gains related to previously written-off accts rec - - (1,573) (707) - - - - Write-off of IPR&D - - - - 6,120 - - - - Gain related to terminated acquisition, net of expenses - - - - (22,835) - - - - Gain /Loss on investments 2,372 - - (4,864) - - - - Impairment of long-lived assets 291 - - - - - - - - Gain/Loss on Debt Retirement 71 - - - - - - - - Write-off of discontinued inventory 1,046 Total highligted items: 10,480 9,839 (9,916) 221,785 15,470 EBITDA excluding highlighted items 73,523 117,631 125,107 170,291 224,572 Adjusted EBITDA per share 0.75 1.07 1.11 1.35 1.75 Average Share Count (diluted) 98,264 109,490 113,027 126,277 128,085 (1) Restated for adoption of new accounting standards related to convertible debt instruments 2010 Analyst & Investor Conference |