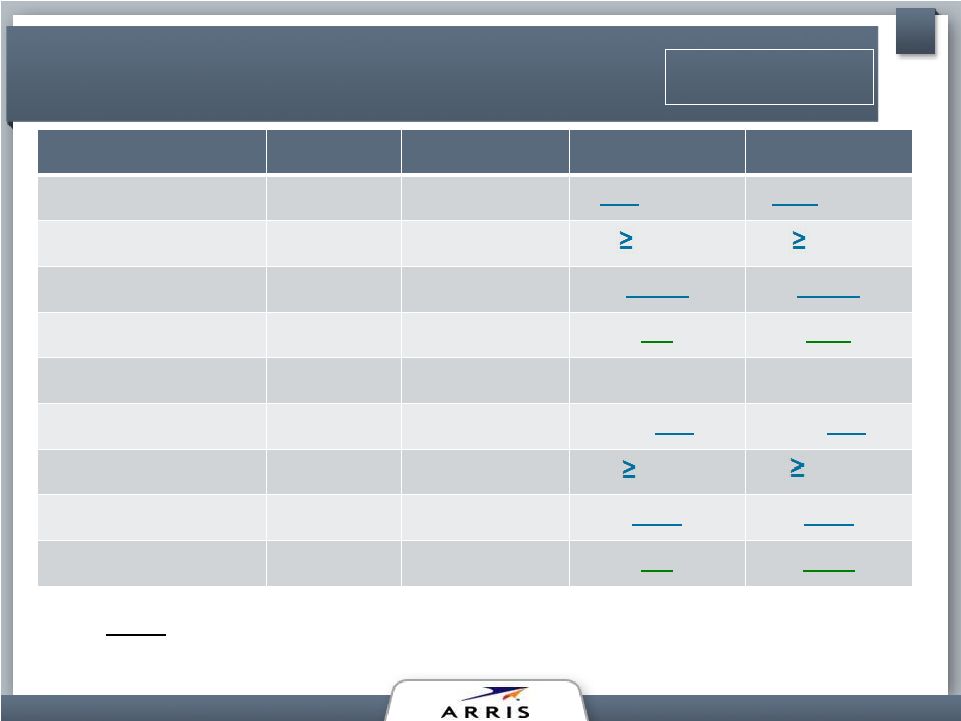
GAAP EPS / Adjusted EPS Reconciliation ARRIS Group Inc. Investor & Analyst Conference August 8, 2012 116 (in thousands, except per share data) Per Diluted Per Diluted Amount Share Amount Share Amount Sales 302,901 $ 349,327 $ 652,228 $ Highlighted items: Purchase accounting impacts of deferred revenue 1,258 0.01 663 0.01 1,921 Sales adjusting for highlighted items 304,159 $ 349,990 $ 654,149 $ Per Diluted Per Diluted Per Diluted Amount Share Amount Share Amount Share Net income 5,799 $ 0.05 $ 15,001 $ 0.13 $ 20,800 $ 0.18 $ Highlighted items: Impacting gross margin: Purchase accounting impacts of deferred revenue 1,258 0.01 663 0.01 1,921 0.02 Stock compensation expense 750 0.01 809 0.01 1,559 0.01 Impacting operating expenses: Acquisition costs 607 0.01 102 - 709 0.01 Restructuring 5,203 0.04 1,039 0.01 6,242 0.05 Amortization of intangible assets 7,379 0.06 7,444 0.06 14,823 0.13 Loss of sale of product line 337 - - - 337 - Stock compensation expense 5,899 0.05 7,058 0.06 12,957 0.11 Impacting other (income) / expense: Non-cash interest expense 2,999 0.03 3,058 0.03 6,057 0.05 Impairment of investment - - 466 - 466 - Impacting income tax expense: Adjustments of income tax valuation allowances and other - - - - Tax related to highlighted items above (8,121) (0.07) (6,749) (0.06) (14,870) (0.13) Total highlighted items 16,311 0.14 13,890 0.12 30,201 0.26 Net income adjusting for highlighted items 22,110 $ 0.19 $ 28,891 $ 0.25 $ 51,001 $ 0.44 $ Weighted average common shares - basic Weighted average common shares - diluted 117,597 115,111 116,352 (in thousands, except per share data) Per Diluted Per Diluted Per Diluted Amount Share Amount Share Amount Share Amount Amount Sales 267,436 $ 265,799 $ 274,374 $ 281,076 $ 1,088,685 $ Highlighted items: Purchase accounting impacts of deferred revenue - - - - - #DIV/0! 4,332 4,332 Sales adjusting for highlighted items 267,436 $ 265,799 $ 274,374 $ 285,408 $ 1,093,017 $ Per Diluted Per Diluted Per Diluted Per Diluted Per Diluted Amount Share Amount Share Amount Share Amount Share Amount Share Net income (loss) 11,564 $ 0.09 $ 16,690 $ 0.13 $ 13,713 $ 0.11 $ (59,629) $ (0.51) $ (17,662) $ (0.15) $ Highlighted items: Impacting gross margin: Purchase accounting impacts of deferred revenue - - - - - - 3,126 0.03 3,126 0.03 Stock compensation expense 437 - 557 - 525 - 521 - 2,040 0.02 Impacting operating expenses: Acquisition costs - - - - 475 - 2,730 0.02 3,205 0.03 Restructuring - - - 969 0.01 3,391 0.03 4,360 0.04 Amortization of intangible assets 8,944 0.07 8,944 0.07 8,944 0.07 6,817 0.06 33,649 0.27 Goodwill and intangibles impairment - - - - - - 88,633 0.74 88,633 0.72 Stock compensation expense 4,847 0.04 5,368 0.04 5,213 0.04 4,586 0.04 20,014 0.16 Impacting other (income) / expense: Non-cash interest expense 2,832 0.02 2,889 0.02 2,883 0.02 2,941 0.02 11,545 0.09 Impairment of investment - - - - - 3,000 0.03 3,000 0.02 Loss on retirement of debt - - - 19 - - - 19 - Impacting income tax expense: Adjustments of income tax valuation allowances and other (3,583) (0.03) - - (2,334) (0.02) 3,032 0.03 (2,885) (0.02) Tax impact related to goodwill and intangibles impairment - - - - - - (25,584) (0.21) (25,584) (0.21) Tax related to highlighted items above (5,024) (0.04) (4,915) (0.04) (5,265) (0.04) (8,553) (0.07) (23,757) (0.19) Total highlighted items 8,453 0.07 12,843 0.10 11,429 0.09 84,640 0.71 117,365 0.96 Net income adjusting for highlighted items 20,017 $ 0.16 $ 29,533 $ 0.24 $ 25,142 $ 0.21 $ 25,011 $ 0.21 $ 99,703 $ 0.81 $ Weighted average common shares - basic 117,316 120,157 Weighted average common shares - diluted 125,732 123,711 121,237 119,609 122,555 Q1 2011 Q2 2011 Q3 2011 Q4 2011 YTD 2011 Q1 2012 Q2 2012 YTD 2012 Q1 2011 Q2 2011 Q3 2011 Q4 2011 YTD 2011 Q1 2012 Q2 2012 YTD 2012 |

