Exhibit 99.1

Exhibit 99.1
ARRIS
Second Quarter 2013
Update Conference Call
May 15, 2013
Safe Harbor
Statements in this presentation or made in this meeting, including those related to the outlook for 2013 and beyond, the integration of Motorola Home and expected synergies, expected revenues and net income, gross margins, operating expenses, income taxes, acceptance of certain ARRIS products, the general market outlook, and industry trends, are forward-looking statements. These statements involve risks and uncertainties that may cause actual results to differ materially from those set forth in these statements. Among other things, projected results are based on preliminary estimates, assumptions and projections that management believes to be reasonable at this time, but are beyond management’s control; ARRIS is dependent upon customer decisions to purchase the Company’s products—these decisions can be deferred and customers also may select competitor products; and because the market in which ARRIS operates is volatile and actions taken and contemplated may not achieve the desired impact. Other factors that could cause results to differ from current expectations include: the uncertain current economic climate and financial markets, and their impact on our customers’ plans and access to capital; ARRIS’ ability to successfully integrate Motorola Home’s opportunities, technology, personnel, and operations, the impact of rapidly changing technologies; the impact of competition on product development and pricing; the ability of ARRIS to react to changes in general industry and market conditions; rights to intellectual property and the current trend toward increasing patent litigation, market trends and the adoption of industry standards; possible acquisitions and dispositions; and consolidations within the telecommunications industry of both the customer and supplier base. These factors are not intended to be an all-encompassing list of risks and uncertainties that may affect the Company’s business. Additional information regarding these and other factors can be found in ARRIS’ reports filed with the Securities and Exchange Commission, including its Form 10-Q for the quarter ended March 31, 2013. In providing forward-looking statements, the Company expressly disclaims any obligation to update publicly or otherwise these statements, whether as a result of new information, future events or otherwise.
ARRIS Q2 2013 Update
May 15, 2013
Second Quarter
2013
Update
Bob Stanzione
CEO & Chairman
ARRIS Q2 2013 Update 3 May 15, 2013
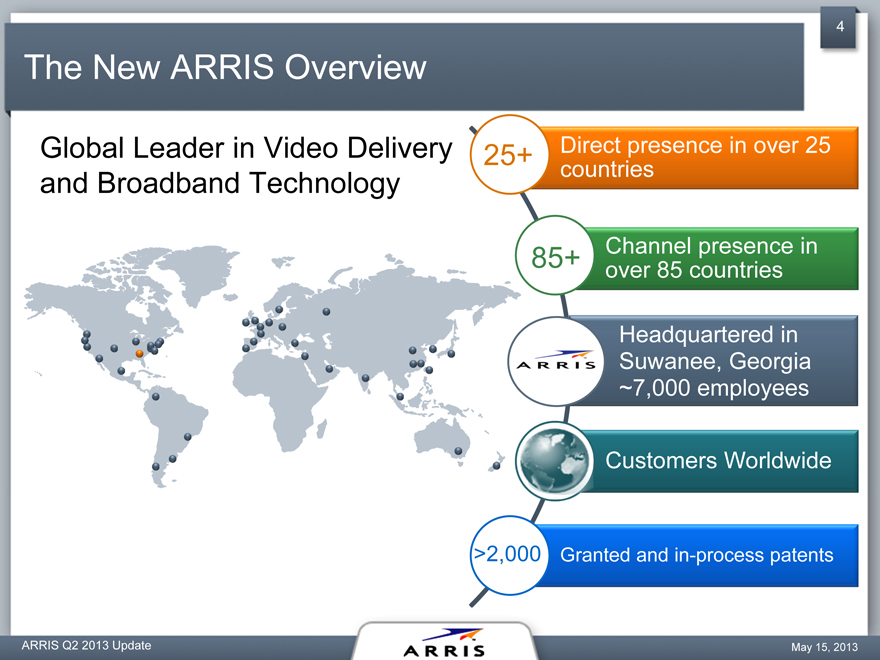
The New ARRIS Overview
Global Leader in Video Delivery
25+
Direct presence in over 25
and Broadband Technology
countries
85+
Channel presence in
over 85 countries
Headquartered in
Suwanee, Georgia
~7,000 employees
Customers Worldwide
>2,000 Granted and in-process patents
ARRIS Q2 2013 Update
May 15, 2013
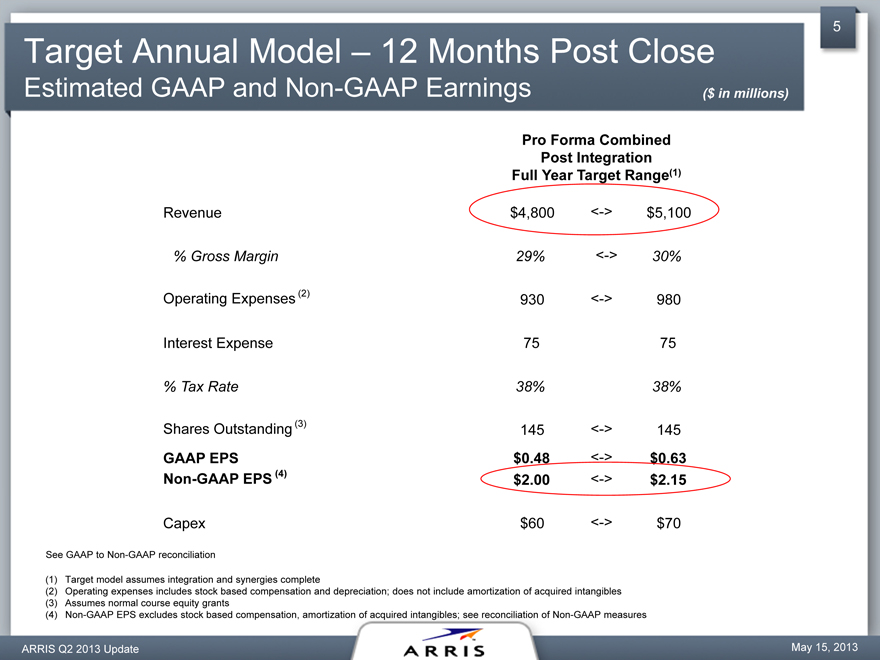
Target Annual Model – 12 Months Post Close
Estimated GAAP and Non-GAAP Earnings
($ in millions)
Pro Forma Combined
Post Integration
Full Year Target Range(1)
Revenue
$4,800
<->
$5,100
% Gross Margin
29%
<->
30%
Operating Expenses (2)
930
<->
980
Interest Expense
75
75
% Tax Rate
38%
38%
Shares Outstanding (3)
145
<->
145
GAAP EPS
$0.48
<->
$0.63
Non-GAAP EPS (4)
$2.00
<->
$2.15
Capex
$60
<->
$70
See GAAP to Non-GAAP reconciliation
Target model assumes integration and synergies complete
Operating expenses includes stock based compensation and depreciation; does not include amortization of acquired intangibles
Assumes normal course equity grants
Non-GAAP EPS excludes stock based compensation, amortization of acquired intangibles; see reconciliation of Non-GAAP measures
ARRIS Q2 2013 Update
May 15, 2013
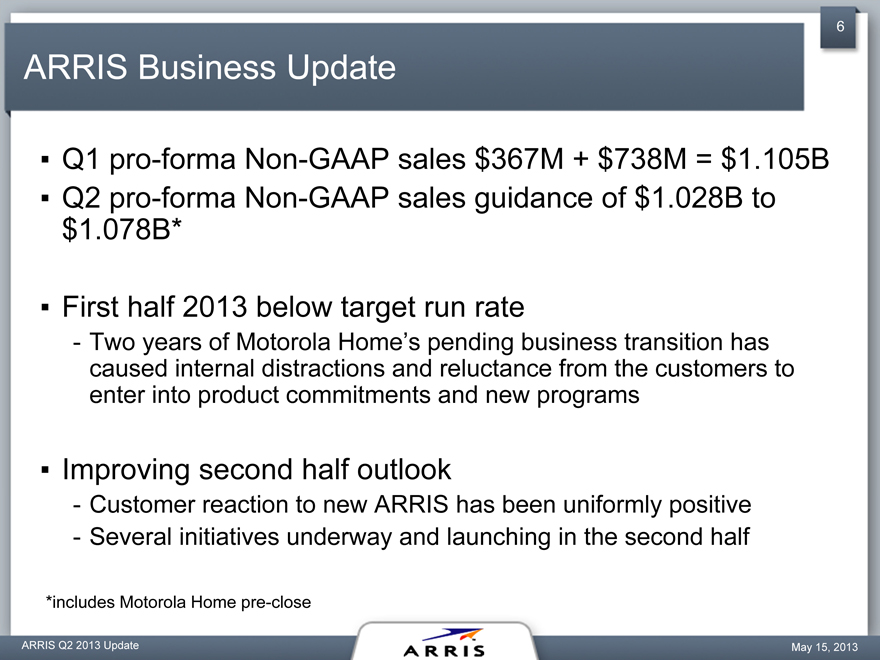
ARRIS Business Update
Q1 pro-forma Non-GAAP sales $367M + $738M = $1.105B
Q2 pro-forma Non-GAAP sales guidance of $1.028B to $1.078B*
First half 2013 below target run rate
Two years of Motorola Home’s pending business transition has caused internal distractions and reluctance from the customers to enter into product commitments and new programs
Improving second half outlook
Customer reaction to new ARRIS has been uniformly positive
Several initiatives underway and launching in the second half
*includes Motorola Home pre-close
ARRIS Q2 2013 Update
May 15, 2013
Second
Half
Outlook
An improving environment
Service provider capex increasing
Expanding market size
Healthy product pipeline
Whole Home Gateway projects
Wireless HSD devices
CCAP (E6000, APEX 3000 QAM)
Multi Screen software and service
Etc…
ARRIS Q2 2013 Update
May 15, 2013
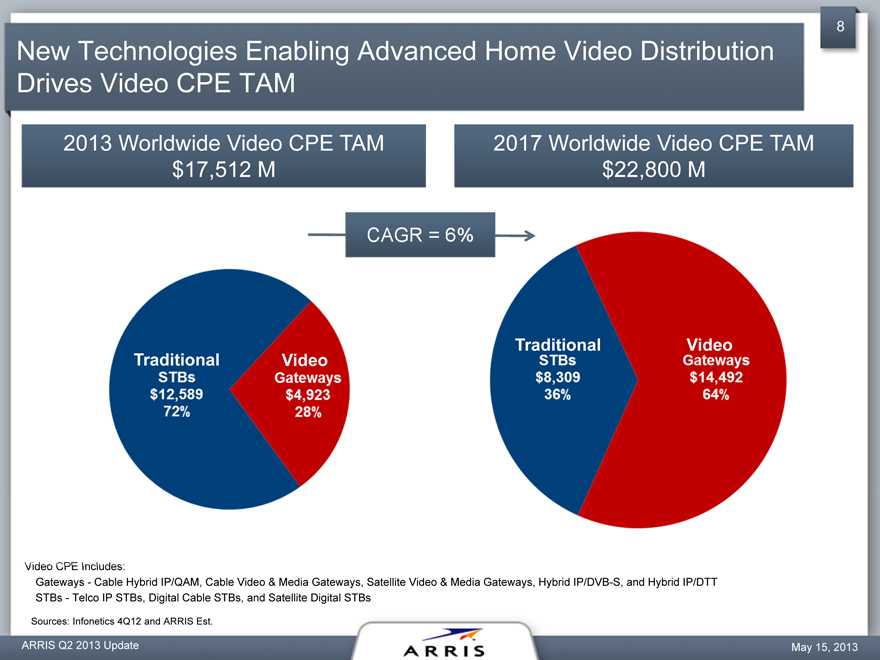
New Technologies Enabling Advanced
Home Video
Distribution
Drives Video CPE TAM
2013 Worldwide Video CPE TAM
2017 Worldwide Video CPE TAM
$17,512 M
$22,800 M
Traditional
Video
Traditional
Video
Gateways—Cable Hybrid IP/QAM, Cable Video & Media Gateways, Satellite Video & Media Gateways, Hybrid IP/DVB-S, and Hybrid IP/DTT STBs—Telco IP STBs, Digital Cable STBs, and Satellite Digital STBs
Sources: Infonetics 4Q12 and ARRIS Est.
ARRIS Q2 2013 Update
May 15, 2013
9
Q2 Status
Synergies…
On track to reaching annualized cost reductions of $100M to $125M
Sales and Marketing complete
Supply Chain in process
G&A and R&D planning in process
Business gaining momentum in second half
ARRIS Q2 2013 Update May 15, 2013
10
The New ARRIS
A stronger company with a broader portfolio
Serving a broader and more diversified customer base
Well positioned to capture significant share in a growing market
Materially enhanced shareholder value
ARRIS Q2 2013 Update May 15, 2013
11
Second Quarter 2013 Financial Update
David Potts
Chief Financial Officer
ARRIS Q2 2013 Update 11 May 15, 2013
12
Our New Segments and Reporting
Will report two product segments
Network & Cloud
Customer Premises Equipment
Will report sales and operating income by segment
Operating income for the product segments will reflect direct contribution
Gross Margin less direct OPEX
Corporate/Other will include: Global M&S, Corporate G&A, Advanced Technology, all equity compensation, and annual bonuses
ARRIS Q2 2013 Update
May 15, 2013
13
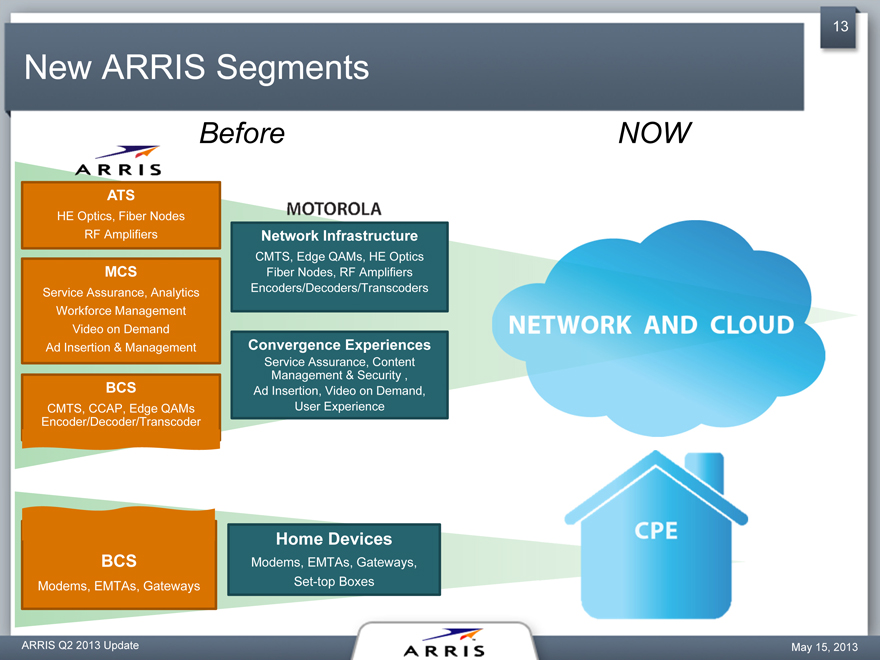
New ARRIS Segments
Before
NOW
ATS
HE Optics, Fiber Nodes
RF Amplifiers
Network Infrastructure
CMTS, Edge QAMs, HE Optics
MCS
Fiber Nodes, RF Amplifiers
Service Assurance, Analytics
Encoders/Decoders/Transcoders
Workforce Management
Video on Demand
Ad Insertion & Management
Convergence Experiences
Service Assurance, Content
Management & Security ,
BCS
Ad Insertion, Video on Demand,
CMTS, CCAP, Edge QAMs
User Experience
Encoder/Decoder/Transcoder
Home Devices
BCS
Modems, EMTAs, Gateways,
Modems, EMTAs, Gateways
Set-top Boxes
ARRIS Q2 2013 Update
May 15, 2013
14
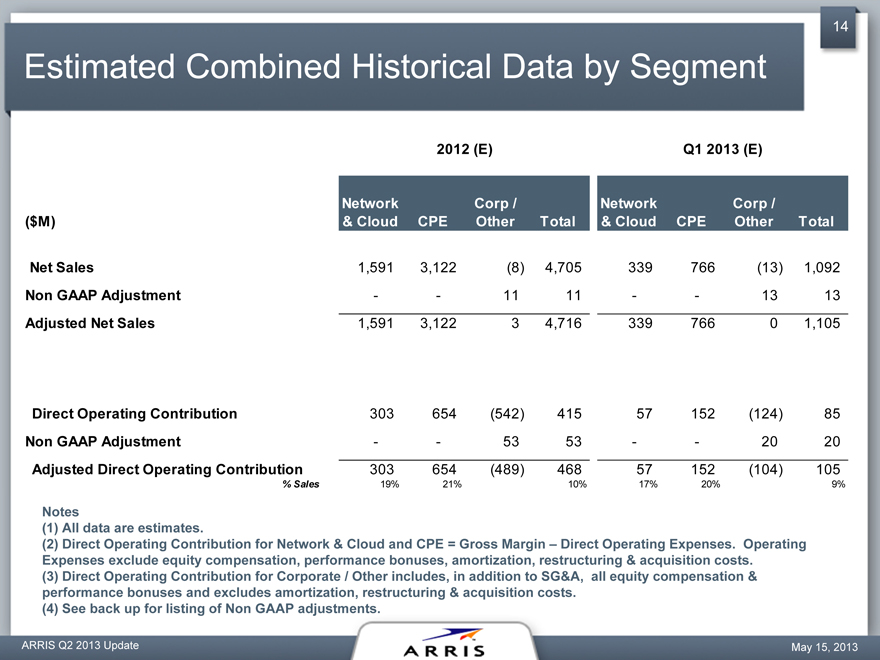
Estimated Combined Historical Data by Segment
2012 (E)
Q1 2013 (E)
Network
Corp /
Network
Corp /
($M)
& Cloud
CPE
Other
Total
& Cloud
CPE
Other
Total
Net Sales
1,591
3,122
4,705
339
766
1,092
Non GAAP Adjustment
-
-
11
11
-
-
13
13
Adjusted Net Sales
1,591
3,122
4,716
339
766
0
1,105
Direct Operating Contribution
303
654
(542)
415
57
152
(124)
85
Non GAAP Adjustment
-
-
53
53
-
-
20
20
Adjusted Direct Operating Contribution
303
654
(489)
468
57
152
(104)
105
% Sales
19%
21%
10%
17%
20%
9%
Notes
All data are estimates.
Direct Operating Contribution for Network & Cloud and CPE = Gross Margin – Direct Operating Expenses. Operating
Expenses exclude equity compensation, performance bonuses, amortization, restructuring & acquisition costs. (3) Direct Operating Contribution for Corporate / Other includes, in addition to SG&A, all equity compensation & performance bonuses and excludes amortization, restructuring & acquisition costs.
(4) | | See back up for listing of Non GAAP adjustments. |
ARRIS Q2 2013 Update
May 15, 2013
15
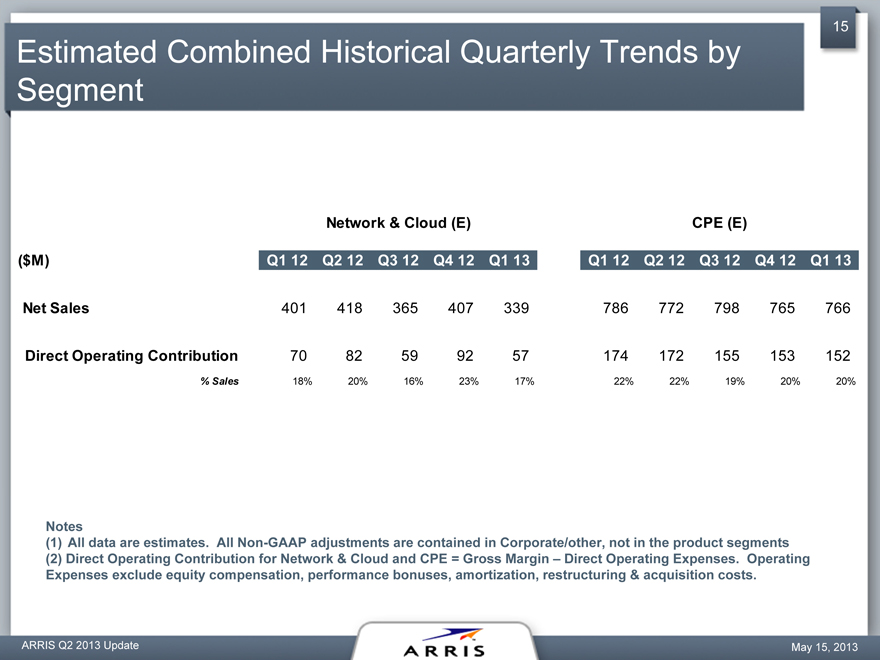
Estimated Combined Historical Quarterly Trends by Segment
Network & Cloud (E)
CPE (E)
($M)
Q1 12
Q2 12
Q3 12
Q4 12
Q1 13
Q1 12
Q2 12
Q3 12
Q4 12
Q1 13
Net Sales
401
418
365
407
339
786
772
798
765
766
Direct Operating Contribution
70
82
59
92
57
174
172
155
153
152
% Sales
18%
20%
16%
23%
17%
22%
22%
19%
20%
20%
Notes
All data are estimates. All Non-GAAP adjustments are contained in Corporate/other, not in the product segments
Direct Operating Contribution for Network & Cloud and CPE = Gross Margin – Direct Operating Expenses. Operating
Expenses exclude equity compensation, performance bonuses, amortization, restructuring & acquisition costs.
ARRIS Q2 2013 Update
May 15, 2013
16
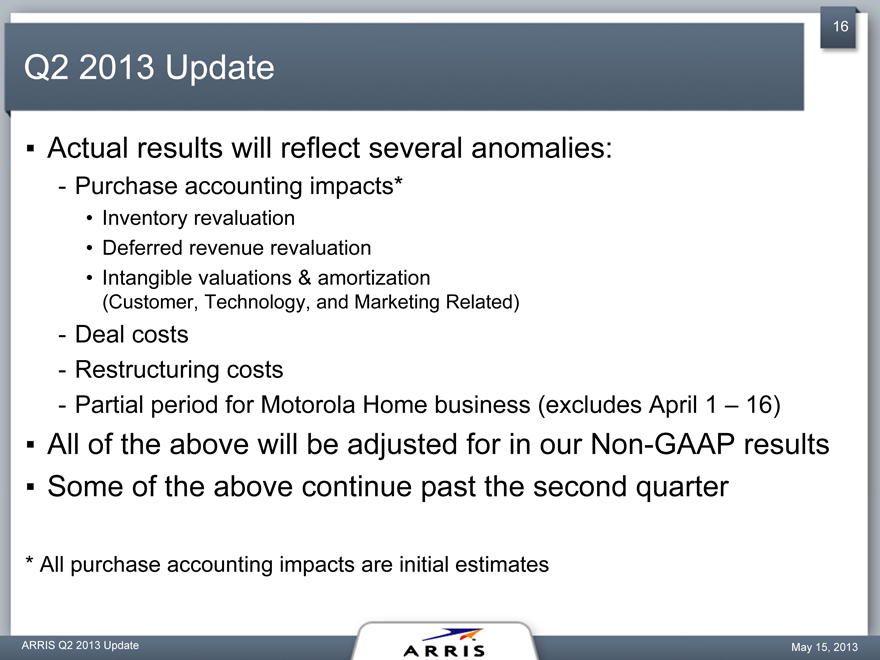
Q2 2013 Update
Actual results will reflect several anomalies:
Purchase accounting impacts*
Inventory revaluation
Deferred revenue revaluation
Intangible valuations & amortization
(Customer, Technology, and Marketing Related)
Deal costs
Restructuring costs
Partial period for Motorola Home business (excludes April 1 – 16)
All of the above will be adjusted for in our Non-GAAP results
Some of the above continue past the second quarter
* | | All purchase accounting impacts are initial estimates |
ARRIS Q2 2013 Update
May 15, 2013
17
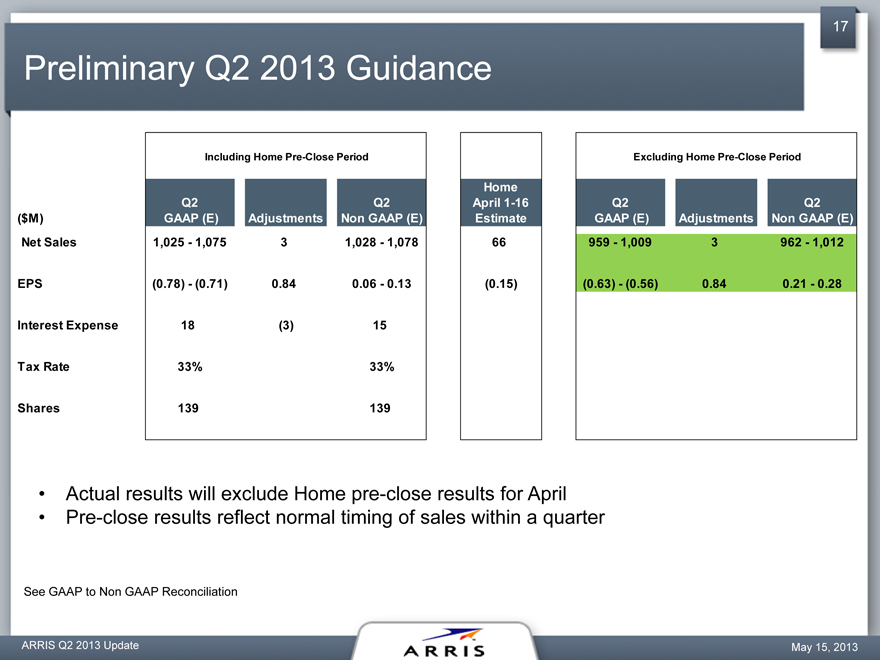
Preliminary Q2 2013 Guidance
Including Home Pre-Close Period
Excluding Home Pre-Close Period
Home
Q2
Q2
April 1-16
Q2
Q2
($M)
GAAP (E)
Adjustments
Non GAAP (E)
Estimate
GAAP (E)
Adjustments
Non GAAP (E)
Net Sales
1,025—1,075
1,028—1,078
66
959—1,009
962—1,012
EPS
(0.78)—(0.71)
0.84
0.06—0.13
(0.15)
(0.63)—(0.56)
0.84
0.21—0.28
Interest Expense
18
15
Tax Rate
33%
33%
Shares
139
139
Actual results will exclude Home pre-close results for April
Pre-close results reflect normal timing of sales within a quarter
See GAAP to Non GAAP Reconciliation
ARRIS Q2 2013 Update
May 15, 2013
18
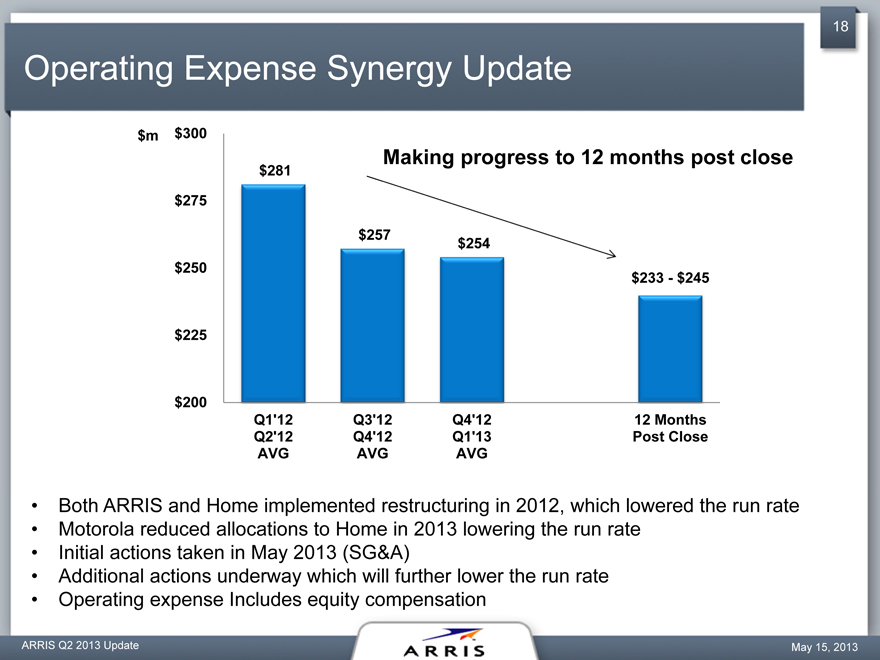
Operating Expense Synergy Update
$m
$
300
Making progress to 12 months post close
$
281
$
275
$
257
$254
$
250
$233—$245
$225
$200
Q1’12 Q3’12 Q4’12 12 Months
Q2’12 Q4’12 Q1’13 Post Close
AVG AVG AVG
Both ARRIS and Home implemented restructuring in 2012, which lowered the run rate
Motorola reduced allocations to Home in 2013 lowering the run rate
Initial actions taken in May 2013 (SG&A)
Additional actions underway which will further lower the run rate
Operating expense Includes equity compensation
ARRIS Q2 2013 Update
May 15, 2013
19
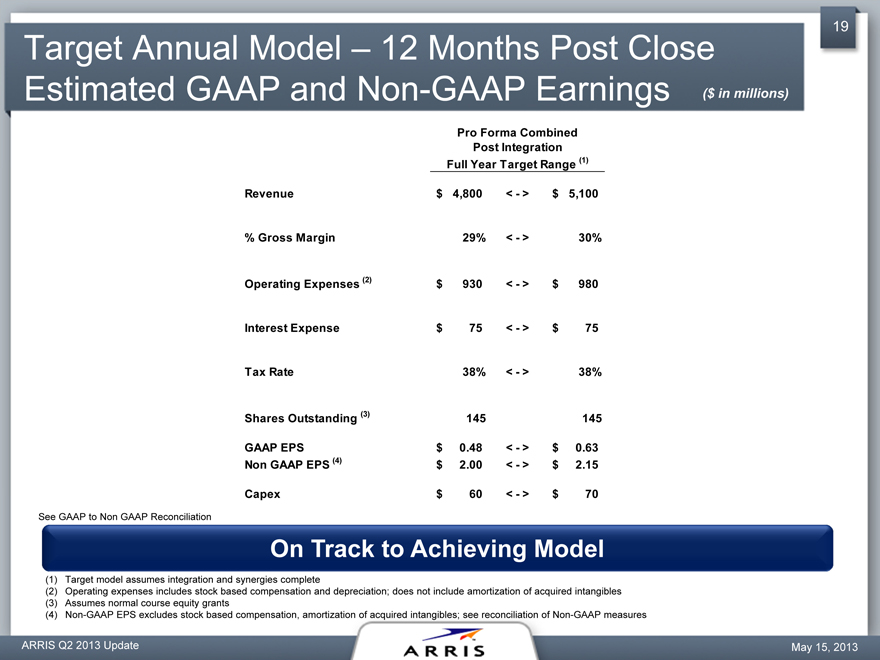
Target Annual Model – 12 Months Post Close
Estimated GAAP and Non-GAAP Earnings
($ in millions)
Pro Forma Combined
Post Integration
Full Year Target Range (1)
Revenue
$ 4,800
<—>
$
5,100
% Gross Margin
29%
<—>
30%
Operating Expenses (2)
$ 930
<—>
$
980
Interest Expense
$
75
<—>
$
75
Tax Rate
38%
<—>
38%
Shares Outstanding (3)
145
145
GAAP EPS
$ 0.48
<—>
$
0.63
Non GAAP EPS (4)
$ 2.00
<—>
$
2.15
Capex
$
60
<—>
$
70
See GAAP to Non GAAP Reconciliation
On Track to Achieving Model
Target model assumes integration and synergies complete
Operating expenses includes stock based compensation and depreciation; does not include amortization of acquired intangibles
Assumes normal course equity grants
Non-GAAP EPS excludes stock based compensation, amortization of acquired intangibles; see reconciliation of Non-GAAP measures
ARRIS Q2 2013 Update
May 15, 2013
20
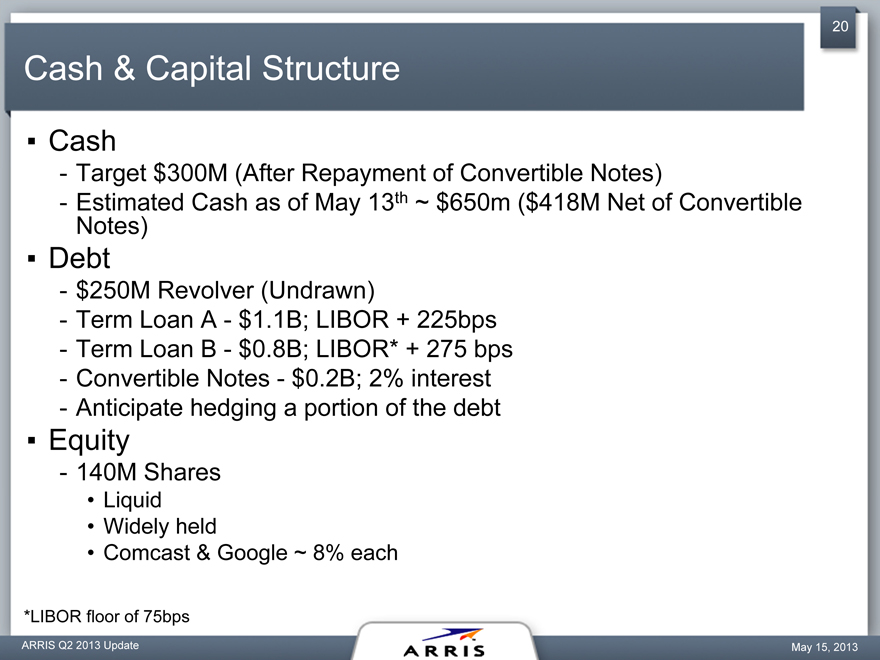
Cash & Capital Structure
Cash
Target $300M (After Repayment of Convertible Notes)
Estimated Cash as of May 13th ~ $650m ($418M Net of Convertible Notes)
Debt
$250M Revolver (Undrawn)
Term Loan A—$1.1B; LIBOR + 225bps
Term Loan B—$0.8B; LIBOR* + 275 bps
Convertible Notes—$0.2B; 2% interest
Anticipate hedging a portion of the debt
Equity
140M Shares
Liquid
Widely held
Comcast & Google ~ 8% each
*LIBOR floor of 75bps
ARRIS Q2 2013 Update
May 15, 2013
Backup
ARRIS Q2 2013 Update
21
May 15, 2013
22
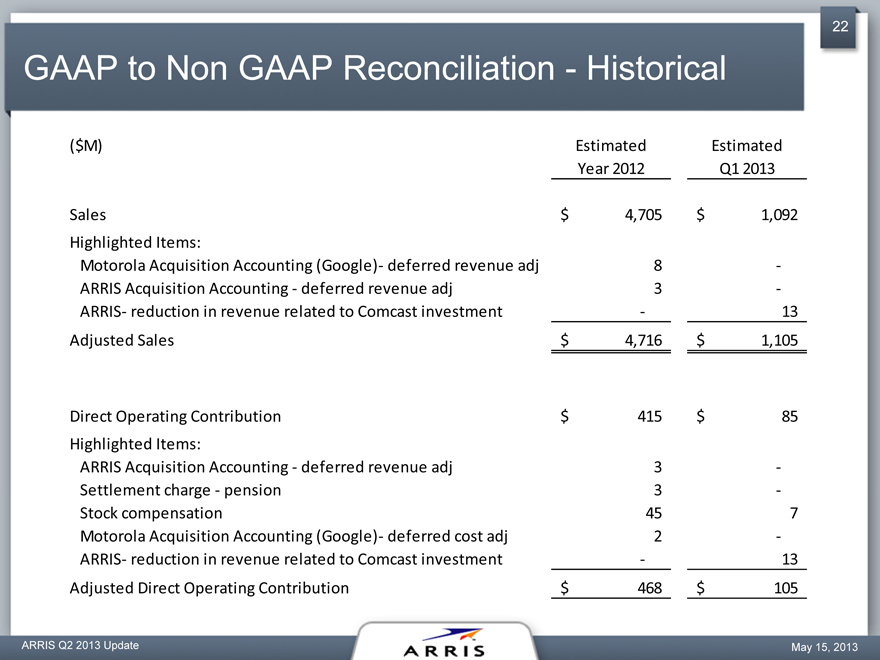
GAAP to Non GAAP Reconciliation—Historical
($M)
Estimated
Estimated
Year 2012
Q1 2013
Sales
$
4,705
$
1,092
Highlighted Items:
Motorola Acquisition Accounting (Google)- deferred revenue adj
-
ARRIS Acquisition Accounting—deferred revenue adj
-
ARRIS- reduction in revenue related to Comcast investment
-
13
Adjusted Sales
$
4,716
$
1,105
Direct Operating Contribution
$
415
$
85
Highlighted Items:
ARRIS Acquisition Accounting—deferred revenue adj
-
Settlement charge—pension
-
Stock compensation
45
Motorola Acquisition Accounting (Google)- deferred cost adj
-
ARRIS- reduction in revenue related to Comcast investment
-
13
Adjusted Direct Operating Contribution
$
468
$
105
ARRIS Q2 2013 Update
May 15, 2013
23
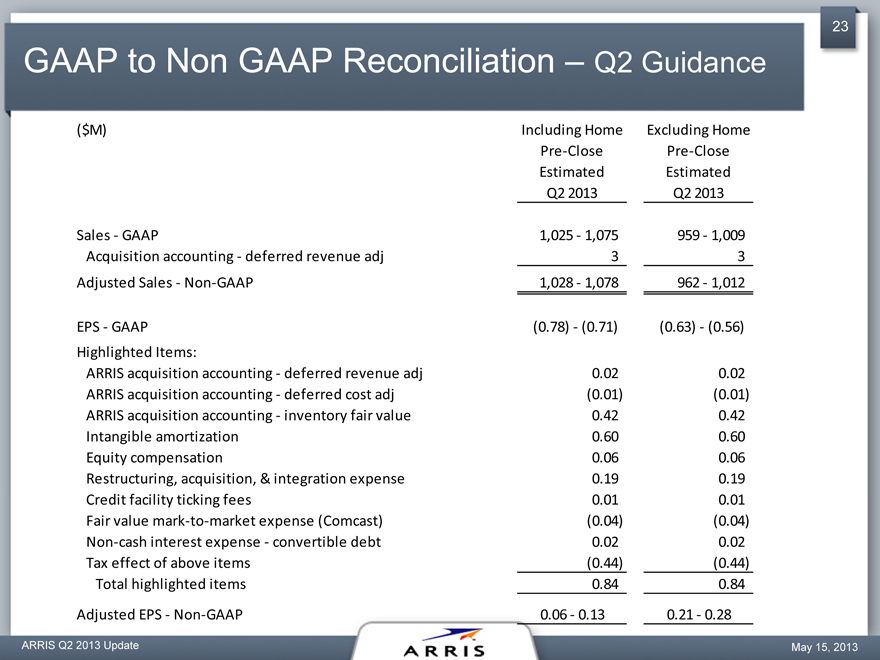
GAAP to Non GAAP Reconciliation – Q2 Guidance
($M)
Including Home
Excluding Home
Pre-Close
Pre-Close
Estimated
Estimated
Q2 2013
Q2 2013
Sales—GAAP
1,025—1,075
959—1,009
Acquisition accounting—deferred revenue adj
Adjusted Sales—Non-GAAP
1,028—1,078
962—1,012
EPS—GAAP
(0.78)—(0.71)
(0.63)—(0.56)
Highlighted Items:
ARRIS acquisition accounting—deferred revenue adj
0.02
0.02
ARRIS acquisition accounting—deferred cost adj
(0.01)
(0.01)
ARRIS acquisition accounting—inventory fair value
0.42
0.42
Intangible amortization
0.60
0.60
Equity compensation
0.06
0.06
Restructuring, acquisition, & integration expense
0.19
0.19
Credit facility ticking fees
0.01
0.01
Fair value mark-to-market expense (Comcast)
(0.04)
(0.04)
Non-cash interest expense—convertible debt
0.02
0.02
Tax effect of above items
(0.44)
(0.44)
Total highlighted items
0.84
0.84
Adjusted EPS—Non-GAAP
0.06—0.13
0.21—0.28
ARRIS Q2 2013 Update
May 15, 2013
24
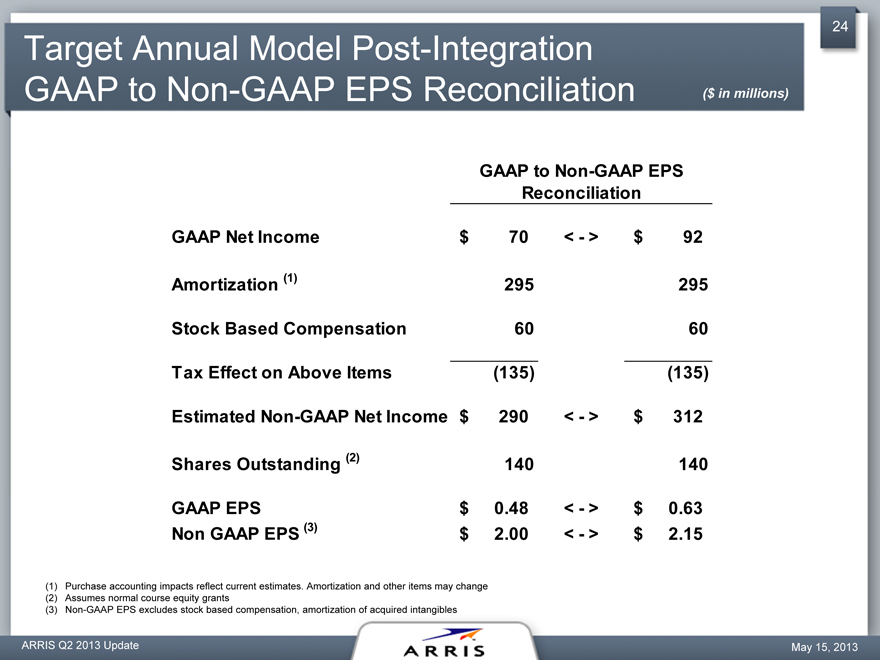
Target Annual Model Post-Integration
GAAP to Non-GAAP EPS Reconciliation ($ in millions)
GAAP to Non-GAAP EPS
Reconciliation
GAAP Net Income
$
70
<
-
>
$
92
Amortization (1)
295
295
Stock Based Compensation
60
60
Tax Effect on Above Items
(135)
(135)
Estimated Non-GAAP Net Income
$
290
<
-
>
$
312
Shares Outstanding (2)
140
140
GAAP EPS
$
0.48
<
-
>
$
0.63
Non GAAP EPS (3)
$
2.00
<
-
>
$
2.15
Purchase accounting impacts reflect current estimates. Amortization and other items may change
Assumes normal course equity grants
Non-GAAP EPS excludes stock based compensation, amortization of acquired intangibles
ARRIS Q2 2013 Update
May 15, 2013
25
Notes to GAAP / Adjusted Non GAAP Financial Measures
The Company reports its financial results in accordance with accounting principles generally accepted in the United States (“GAAP” or referred to herein as “reported”). However, management believes that certain non-GAAP financial measures provide management and other users with additional meaningful financial information that should be considered when assessing our ongoing performance. Our management regularly uses our supplemental non-GAAP financial measures internally to understand, manage and evaluate our business and make operating decisions. These non-GAAP measures are among the factors management uses in planning for and forecasting future periods. Non-GAAP financial measures should be viewed in addition to, and not as an alternative to, the Company’s reported results prepared in accordance with GAAP. Our non-GAAP financial measures reflect adjustments based on the following items, as well as the related income tax effects:
Acquisition Accounting Impacts Related to Deferred Revenue: In connection with our acquisition of Motorola Home, business combination rules require us to account for the fair values of arrangements for which acceptance has not been obtained, and post contract support in our purchase accounting. Fair value reflects estimates of costs relating to fulfilling the remaining obligation plus a normal profit margin. The non-GAAP adjustment to our sales and cost of sales is intended to include the full amounts of such revenues. We believe the adjustment to these revenues is useful as a measure of the ongoing performance of our business. We have historically experienced high renewal rates related to our support agreements and our objective is to increase the renewal rates on acquired post contract support agreements; however, we cannot be certain that our customers will renew our contracts.
Inventory valuation: In connection with our acquisition of Motorola Home, business combinations rules require the inventory be recorded at fair value on the opening balance sheet. This is different from historical cost. Essentially we were required to write the inventory up to end customer price less a reasonable margin as a distributor. This resulted in an increase in the value of inventory and will result in higher cost of goods sold as it is sold.
Amortization of Intangible Assets: We have excluded the effect of amortization of intangible assets in calculating our non-GAAP operating expenses and net income measures. Amortization of intangible assets is non-cash, and is inconsistent in amount and frequency and is significantly affected by the timing and size of our acquisitions. Investors should note that the use of intangible assets contributed to our revenues earned during the periods presented and will contribute to our future period revenues as well. Amortization of intangible assets will recur in future periods.
Stock-Based Compensation Expense: We have excluded the effect of stock-based compensation expenses in calculating our non-GAAP operating expenses and net income measures. Although stock-based compensation is a key incentive offered to our employees, we continue to evaluate our business performance excluding stock-based compensation expenses. We record non-cash compensation expense related to grants of options and restricted stock. Depending upon the size, timing and the terms of the grants, the non-cash compensation expense may vary significantly but will recur in future periods.
Restructuring, Acquisition and Integration Costs: We have excluded the effect of acquisition related and other expenses and the effect of restructuring expenses in calculating our non-GAAP operating expenses and net income measures. We will incur significant expenses in connection with our recent acquisition of Motorola Home, which we generally would not otherwise incur in the periods presented as part of our continuing operations. Acquisition related expenses consist of transaction costs, costs for transitional employees, other acquired employee related costs, and integration related outside services. Restructuring expenses consist of employee severance, abandoned facilities, and other exit costs. We believe it is useful to understand the effects of these items on our total operating expenses.
Credit Facility—Ticking Fees: In connection with our acquisition of Motorola Home, the cash portion of the consideration is funded through debt financing commitments. A ticking fee is a fee paid to our banks to compensate for the time lag between the commitment allocation on a loan and the actual funding. We have excluded the effect of the ticking fee in calculating our non-GAAP financial measures. We believe it is useful to understand the effect of this non-cash item in our other expense (income).
Mark To Market Fair Value Adjustment Related To Comcast Investment in ARRIS: In connection with our acquisition of Motorola Home, Comcast was given an opportunity to invest in ARRIS. The accounting guidance requires we mark to market the changes in the value of the investment and flow through other expense (income). We have excluded the effect of the implied fair value in calculating our non-GAAP financial measures. We believe it is useful to understand the effects of these items on our total other expense (income).
Non-Cash Interest on Convertible Debt: We have excluded the effect of non-cash interest in calculating our non-GAAP operating expenses and net income measures. We record the accretion of the debt discount related to the equity component non-cash interest expense. We believe it is useful to understand the component of interest expense that will not be paid out in cash.
Income Tax Expense (Benefit): We have excluded the tax effect of the non-GAAP items mentioned above. Additionally, we have excluded the effects of certain tax adjustments related to state valuation allowances, research and development tax credits and provision to return differences.
ARRIS Q2 2013 Update May 15, 2013
Transforming how service providers deliver entertainment and communications without boundaries
ARRIS Q2 2013 Update
May 15, 2013