Searchable text section of graphics shown above
[GRAPHIC]
Kerr-McGee Corporation
A.G. Edwards’
Energy Conference
March 15, 2005
[LOGO]
Forward-Looking
Statement
The company makes certain forward-looking statements in this presentation that are subject to risks and uncertainties. Future results and developments discussed in these statements may be affected by numerous factors and risks, such as the accuracy of the assumptions that underlie the statements, the success of the oil and gas exploration and production program, drilling risks, the market value of Kerr-McGee’s products, uncertainties in interpreting engineering data, demand for consumer products for which Kerr-McGee’s businesses supply raw materials, the financial resources of competitors, changes in laws and regulations, the ability to respond to challenges in international markets, including changes in currency exchange rates, political or economic conditions in areas where Kerr-McGee operates, trade and regulatory matters, general economic conditions, and other factors and risks discussed herein and in the company’s other SEC filings, and many such factors and risks are beyond Kerr-McGee’s ability to control or predict. Forward-looking statements are not guarantees of performance. Actual results and developments may differ materially from those expressed or implied in this presentation. Readers are cautioned not to place any undue reliance on any forward-looking statements. Forward-looking statements speak only as of the date of this presentation. Kerr-McGee undertakes no obligation to update publicly any forward-looking statements, whether as a result of new information, future events or otherwise. For such statements, Kerr-McGee claims the protection of the safe harbor for “forward-looking statements” set forth in the Private Securities Litigation Reform Act of 1995.
The SEC permits oil and gas companies, in their filings with the SEC, to disclose only proved reserves. We use certain terms in this presentation, such as “probable and possible resources,” which the SEC’s guidelines strictly prohibit us from including in filings with the SEC. Investors are urged to consider closely the disclosures and risk factors in our Forms 10-K and 10-Q, File No. 1-16619, available from Kerr-McGee’s offices or website, www.kerr-mcgee.com. These forms also can be obtained from the SEC by calling 1-800-SEC-0330.
Kerr-McGee Oil & Gas
Today
• Balanced portfolio
• High-quality assets
• Large inventory of repeatable, low-risk exploitation projects
• Balanced exploration program focused in proven hydrocarbon basins
• Operational and development expertise
• Proven record of value-enhancing transactions
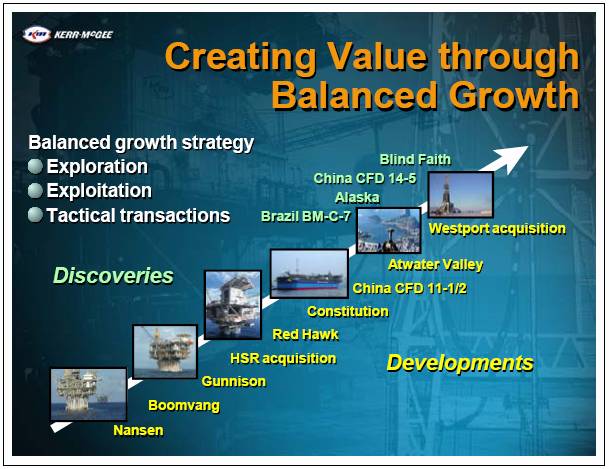
Creating Value through
Balanced Growth
Balanced growth strategy
• Exploration
• Exploitation
• Tactical transactions
Discoveries
Blind Faith
China CFD 14-5
Alaska
Brazil BM-C-7
[GRAPHIC]
Developments
Westport acquisition
Atwater Valley
China CFD 11-1/2
Constitution
Red Hawk
HSR acquisition
Gunnison
Boomvang
Nansen
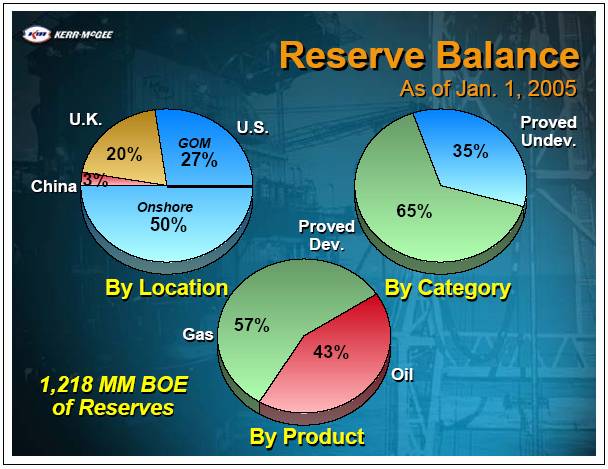
Reserve Balance
As of Jan. 1, 2005
[CHART]
By Location
[CHART]
By Category
[CHART]
By Product
5-Year Changes
in Reserves
MM BOE
[CHART]
2005 Bookings
Pipeline
| | Resource Potential
MM BOE | |
2005 Program Expectations | | Low | | Base | | High | |
Exploitation | | | | | | | |
Rockies | | 30 | | 40 | | 50 | |
| | | | | | | |
Projects Under Way | | | | | | | |
Blind Faith; Tahiti; China (CFD 11-6, 12-1, 12-1S) | | 35 | | 40 | | 45 | |
| | | | | | | |
Appraisal of Discoveries | | | | | | | |
Alaska | | — | | 30 | | 60 | |
Brazil | | — | | — | | 15 | |
China (CFD 14-5) | | — | | 10 | | 20 | |
| | | | | | | |
Exploration | | | | | | | |
Shelf; Satellites; New-field wildcats | | 45 | | 85 | | 135 | |
Total | | 110 | | 205 | | 325 | |
Exploitation
Large inventory of
repeatable, low-risk projects
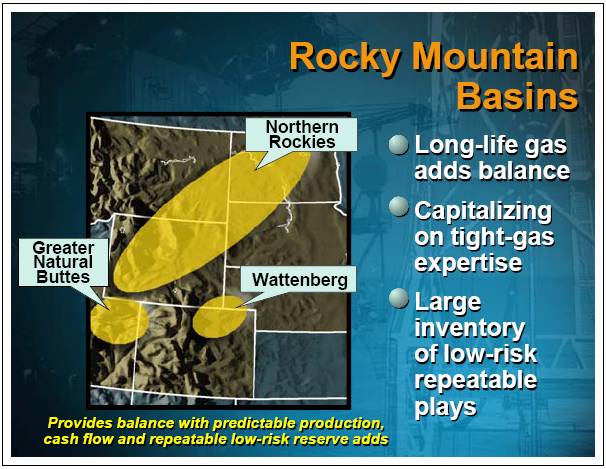
Rocky Mountain
Basins
[GRAPHIC]
• Long-life gas adds balance
• Capitalizing on tight-gas expertise
• Large inventory of low-risk repeatable plays
Provides balance with predictable production, cash flow and repeatable low-risk reserve adds
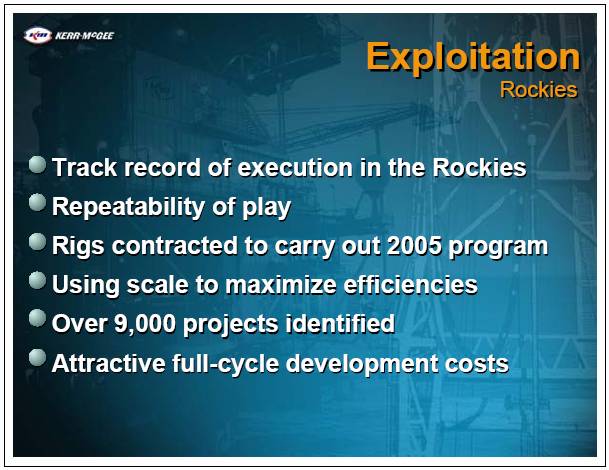
Exploitation
Rockies
• Track record of execution in the Rockies
• Repeatability of play
• Rigs contracted to carry out 2005 program
• Using scale to maximize efficiencies
• Over 9,000 projects identified
• Attractive full-cycle development costs
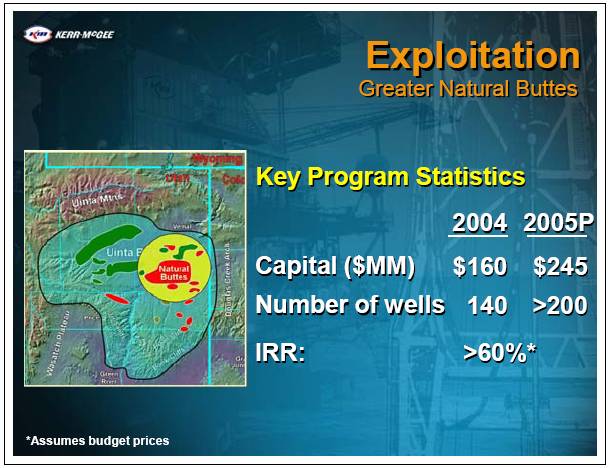
Exploitation
Greater Natural Buttes
[GRAPHIC]
Key Program Statistics
| | 2004 | | 2005P | |
Capital ($MM) | | $ | 160 | | $ | 245 | |
Number of wells | | 140 | | >200 | |
| | | | | |
IRR: | | >60 | %* | | |
| | | | | | | |
Estimated Full-Cycle
Development Costs
$ / BOE
Greater Natural Buttes
| | Resources | | Allocated
Purch. Cost | | Develop.
Cost | | Full-cycle
Cost | |
| | MM BOE | | | | | | | |
Proved Developed | | 51 | | $ | 5.20 | | $ | — | | $ | 5.20 | |
| | | | | | | | | |
Proved Undeveloped | | 59 | | 5.20 | | 5.00 | | 10.20 | |
| | | | | | | | | |
Probable / Possible | | 150 | | 2.10 | | 5.00 | | 7.10 | |
| | | | | | | | | |
Average Full-cycle Cost | | $ | 7.43 | |
| | | | | | | | | | | | |
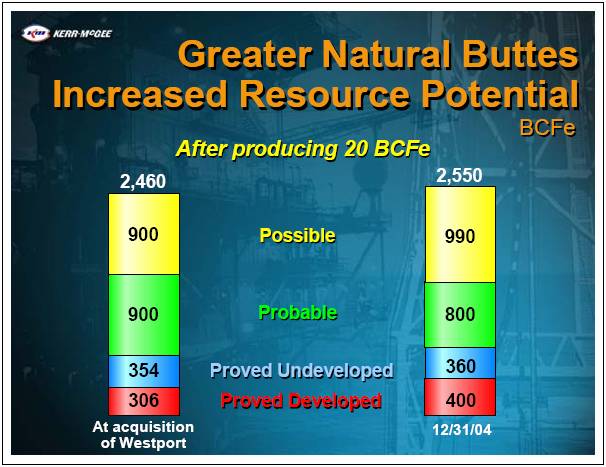
Greater Natural Buttes
Increased Resource Potential
BCFe
After producing 20 BCFe
[CHART]
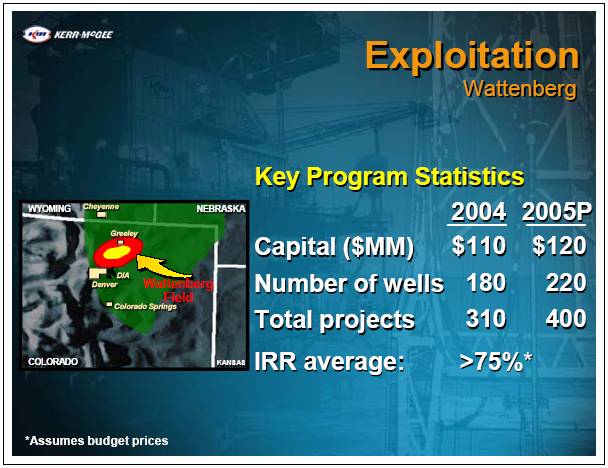
Exploitation
Wattenberg
Key Program Statistics
| | 2004 | | 2005P | |
Capital ($MM) | | $ | 110 | | $ | 120 | |
Number of wells | | 180 | | 220 | |
Total projects | | 310 | | 400 | |
IRR average: | | >75 | %* | | |
| | | | | | | |
*Assumes budget prices
Exploration
Focused on proven hydrocarbon
basins with track record
of success
2005 Exploration
Program
$380 MM
[GRAPHIC]
Deepwater Gulf of Mexico
[GRAPHIC]
Past five years’ results
• 50 new-field wildcats
• >100 total exploration wells
• Discovered approx. 800 MM BOE gross resources
• Developed fields including: Nansen Boomvang, Gunnison Red Hawk, Constitution
• Producing >80 MBOE/D, net
Deepwater Gulf of Mexico
Lookback Assumptions
Pricing:
Actuals 1999-2004, then
| | | | Projected | |
| | | | 2005 | | 2006 | | 2007 | | 2008 | | 2009+ | |
• Low-cycle | | Oil | | 38.00 | | 30.00 | | 24.00 | | 24.00 | | 24.00 | |
| | Gas | | 6.00 | | 5.00 | | 4.00 | | 4.00 | | 4.00 | |
| | | | | | | | | | | | | |
• Budget | | Oil | | 38.00 | | 34.00 | | 32.00 | | 32.00 | | 32.00 | |
| | Gas | | 6.00 | | 5.50 | | 5.00 | | 5.00 | | 5.00 | |
| | | | | | | | | | | | | |
• Strip | | Oil | | 54.65 | | 51.01 | | 48.09 | | 46.68 | | 45.37 | |
| | Gas | | 7.26 | | 7.17 | | 6.65 | | 6.24 | | 5.87 | |
Oil: WTI $/Bbl
Gas: NYMEX $/MMBtu
Nansen
East Breaks 602
3,700’ of water
[GRAPHIC]
Net Investment | | $ | 285 | MM |
Net Resources (2P) | | 88 | MM BOE |
[CHART]
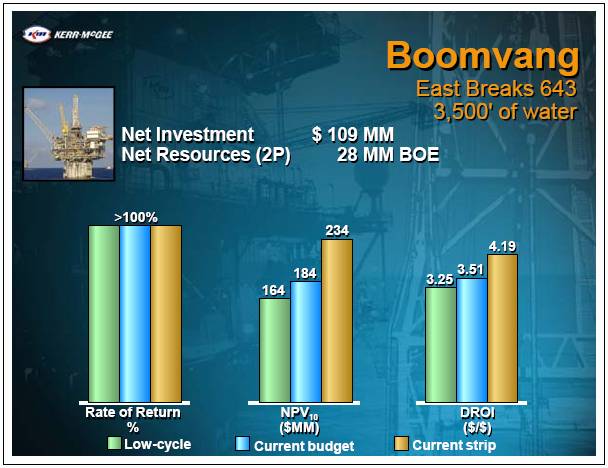
Boomvang
East Breaks 643
3,500’ of water
[GRAPHIC]
Net Investment | | $ | 109 | MM |
Net Resources (2P) | | 28 | MM BOE |
[CHART]
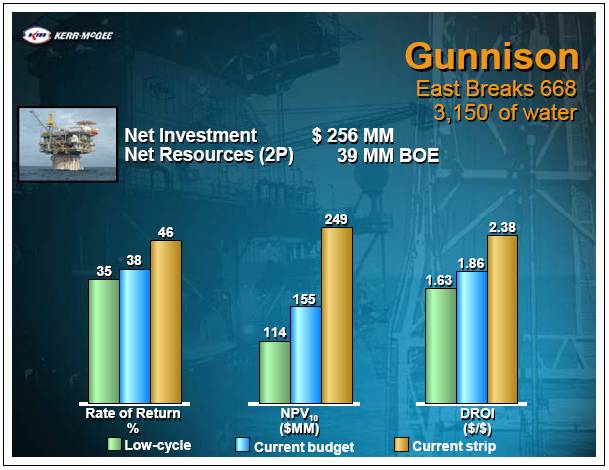
Gunnison
East Breaks 668
3,150’ of water
[GRAPHIC]
Net Investment | | $ | 256 | MM |
Net Resources (2P) | | 39 | MM BOE |
[CHART]
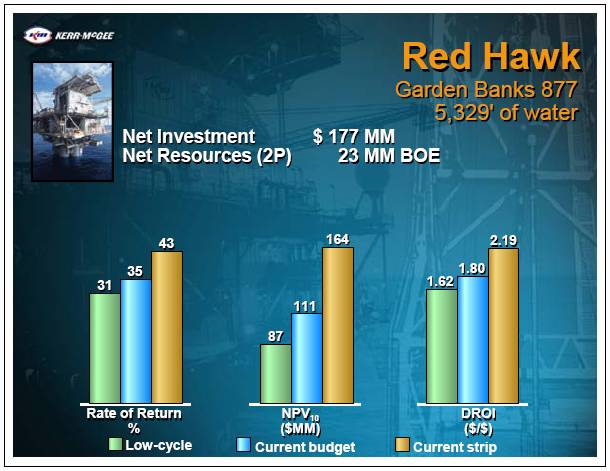
Red Hawk
Garden Banks 877
5,329’ of water
[GRAPHIC]
Net Investment | | $ | 177 | MM |
Net Resources (2P) | | 23 | MM BOE |
[CHART]
Constitution
Green Canyon 680
5,000’ of water
[GRAPHIC]
Net Investment | | $ | 733 | MM |
Net Resources (2P) | | 100 | MM BOE |
[CHART]
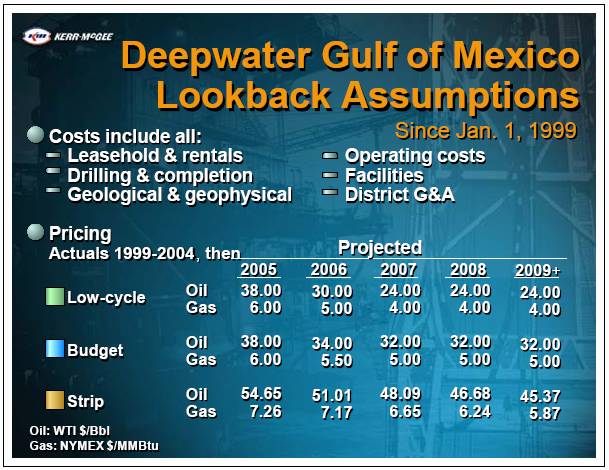
Deepwater Gulf of Mexico
Lookback Assumptions
Since Jan. 1, 1999
• Costs include all:
• Leasehold & rentals
• Drilling & completion
• Geological & geophysical
• Operating costs
• Facilities
• District G&A
• Pricing
Actuals 1999-2004, then
| | | | Projected | |
| | | | 2005 | | 2006 | | 2007 | | 2008 | | 2009+ | |
• Low-cycle | | Oil | | 38.00 | | 30.00 | | 24.00 | | 24.00 | | 24.00 | |
| | Gas | | 6.00 | | 5.00 | | 4.00 | | 4.00 | | 4.00 | |
| | | | | | | | | | | | | |
• Budget | | Oil | | 38.00 | | 34.00 | | 32.00 | | 32.00 | | 32.00 | |
| | Gas | | 6.00 | | 5.50 | | 5.00 | | 5.00 | | 5.00 | |
| | | | | | | | | | | | | |
• Strip | | Oil | | 54.65 | | 51.01 | | 48.09 | | 46.68 | | 45.37 | |
| | Gas | | 7.26 | | 7.17 | | 6.65 | | 6.24 | | 5.87 | |
Oil: WTI $/Bbl
Gas: NYMEX $/MMBtu
Deepwater Gulf of Mexico
Total Program Results
Net Investment | | $ | 2,901 | MM |
Net Resources (2P) | | 325 | MM BOE |
[CHART]
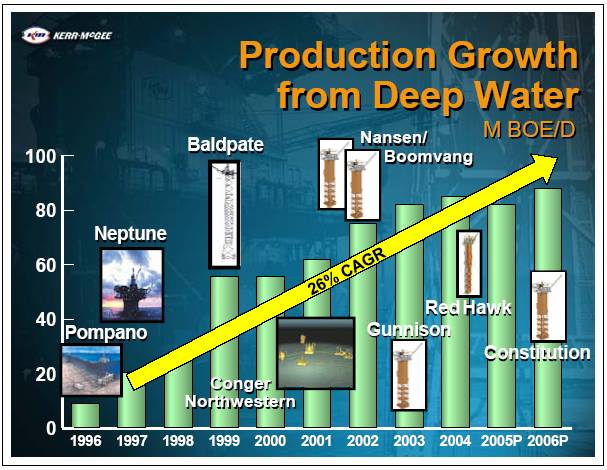
Production Growth
from Deep Water
M BOE/D
[CHART]
Sampling of Large
Prospect Inventory
[GRAPHIC]
Alaska
Nikaitchuq Discovery
[GRAPHIC]
#4 Horizontal Test
• Schrader Bluff reservoir
• Tested up to 1,200 BOPD
• 16°-17° API
#3 Horizontal Well
• Sag River reservoir
• Drilling new fault block
#1 Discovery Well
• Initial vertical test at 960 BOPD of 38° API in Sag River reservoir
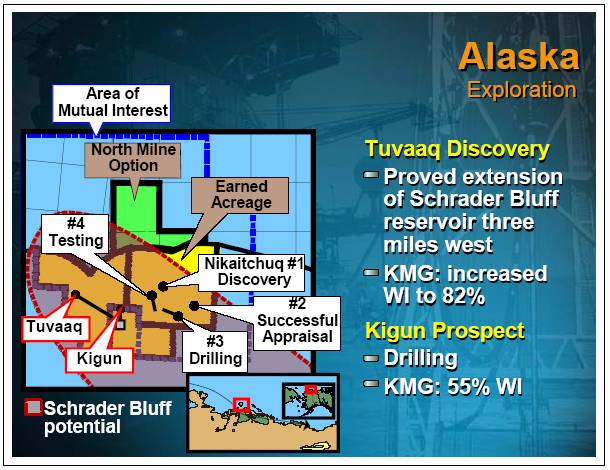
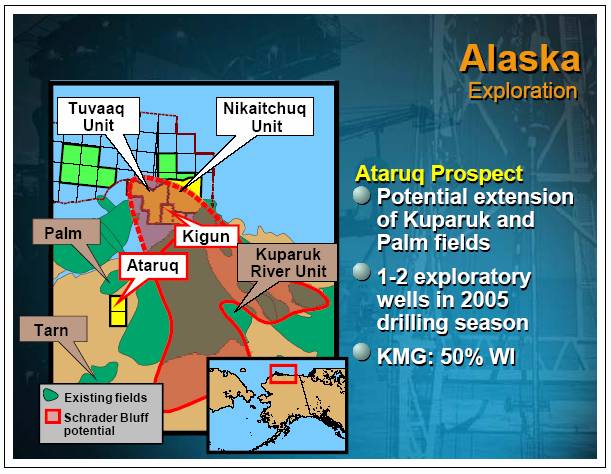
Alaska
Exploration
[GRAPHIC]
Tuvaaq Discovery
• Proved extension of Schrader Bluff reservoir three miles west
• KMG: increased WI to 82%
Kigun Prospect
• Drilling
• KMG: 55% WI
[GRAPHIC]
Ataruq Prospect
• Potential extension of Kuparuk and Palm fields
• 1-2 exploratory wells in 2005 drilling season
• KMG: 50% WI
Transactions
Capitalizing on
core competencies to
enhance value
Comparative
Rockies’ Transactions
[CHART]
Estimates based on public filings of comparable transactions
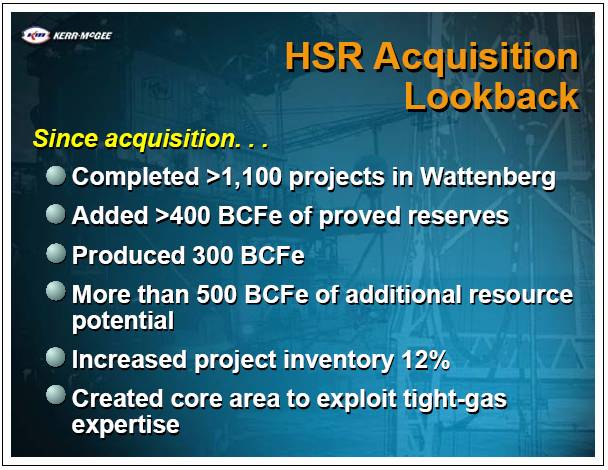
HSR Acquisition
Lookback
Since acquisition. . .
• Completed >1,100 projects in Wattenberg
• Added >400 BCFe of proved reserves
• Produced 300 BCFe
• More than 500 BCFe of additional resource potential
• Increased project inventory 12%
• Created core area to exploit tight-gas expertise
Blind Faith Discovery
Exchanged declining legacy Arkoma assets for 37.5% WI in Blind Faith
• Potential to capitalize on KMG’s industry-leading cycle time
• Adds new hub in central gulf
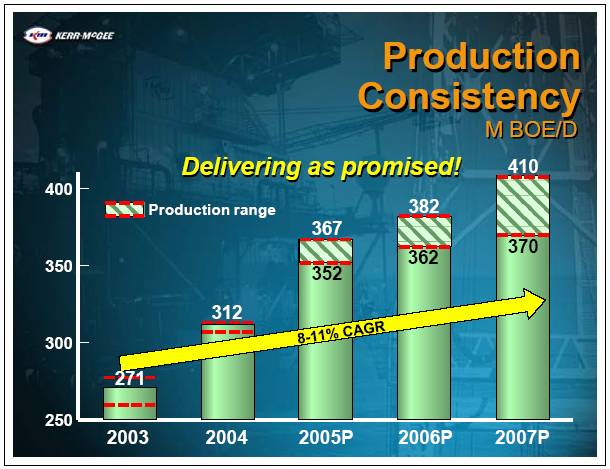
Production
Consistency
M BOE/D
Delivering as promised!
[CHART]
Gross Production Margin
Per BOE
Nine Months 2004 - $ / BOE
Peer Group
[CHART]
Source - Company earnings reports: Gross production margin = oil & gas revenues - LOE - production tax - transportation, adjusted for hedges
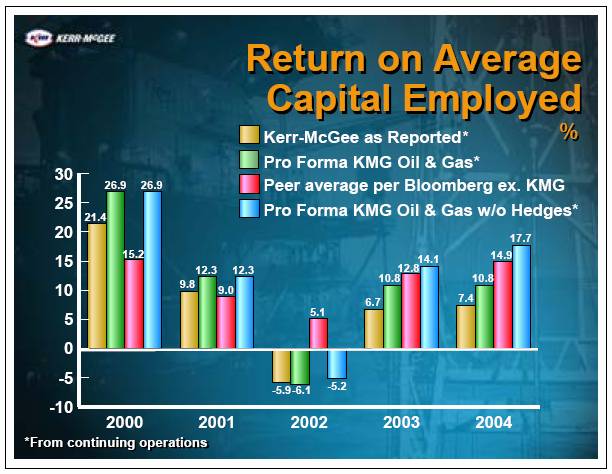
Return on Average
Capital Employed
%
[CHART]
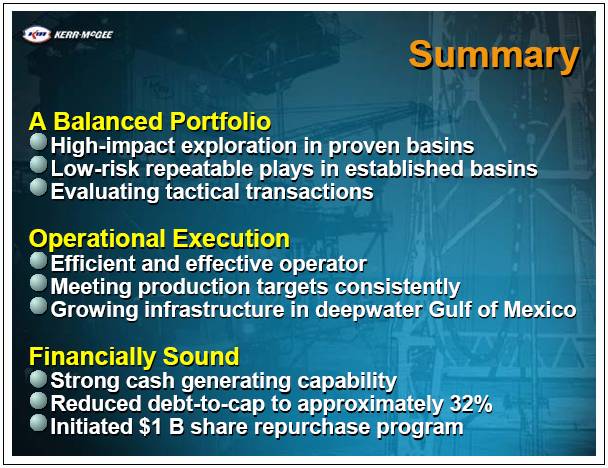
Summary
A Balanced Portfolio
• High-impact exploration in proven basins
• Low-risk repeatable plays in established basins
• Evaluating tactical transactions
Operational Execution
• Efficient and effective operator
• Meeting production targets consistently
• Growing infrastructure in deepwater Gulf of Mexico
Financially Sound
• Strong cash generating capability
• Reduced debt-to-cap to approximately 32%
• Initiated $1 B share repurchase program
[GRAPHIC]
Kerr-McGee Corporation
A.G. Edwards’
Energy Conference
March 15, 2005