©2015 MasterCard. Proprietary MasterCard Incorporated Second-Quarter 2015 Financial Results Conference Call July 29, 2015
©2015 MasterCard. Proprietary Business Update Financial & Operational Overview Economic Update Business Highlights Page 2
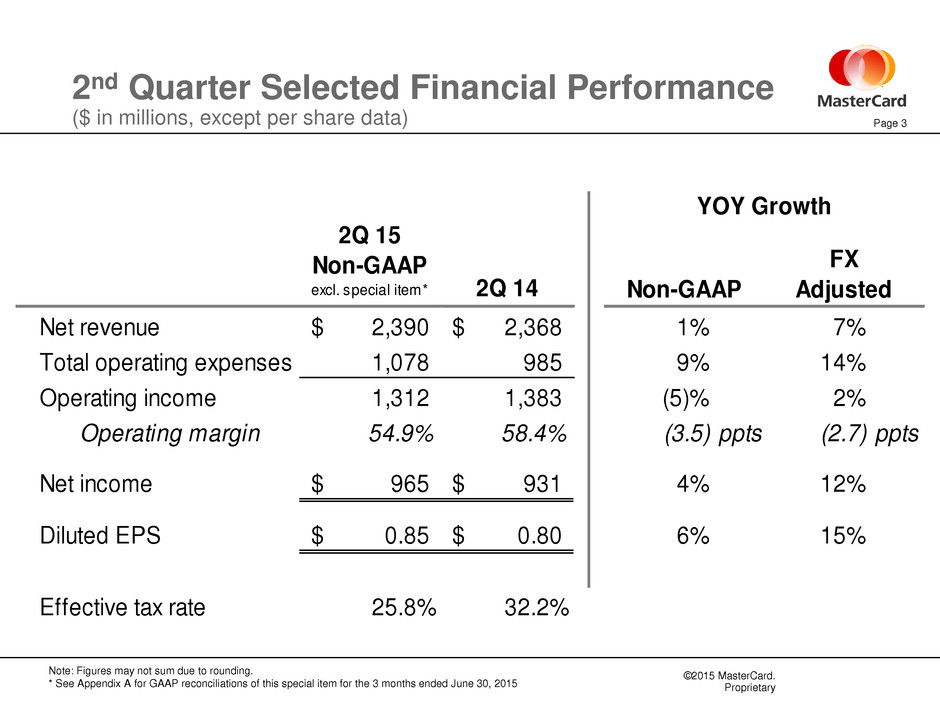
©2015 MasterCard. Proprietary 2nd Quarter Selected Financial Performance ($ in millions, except per share data) 2Q 15 Non-GAAP excl. special item* 2Q 14 Net revenue 2,390$ 2,368$ 1% 7% Total operating expenses 1,078 985 9% 14% Operating income 1,312 1,383 (5)% 2% Operating margin 54.9% 58.4% (3.5) ppts (2.7) ppts N t income 965$ 931$ 4% 12% Diluted EPS 0.85$ 0.80$ 6% 15% Effective tax rate 25.8% 32.2% FX Adjusted YOY Growth Non-GAAP Note: Figures may not sum due to rounding. * See Appendix A for GAAP reconciliations of this special item for the 3 months ended June 30, 2015 Page 3
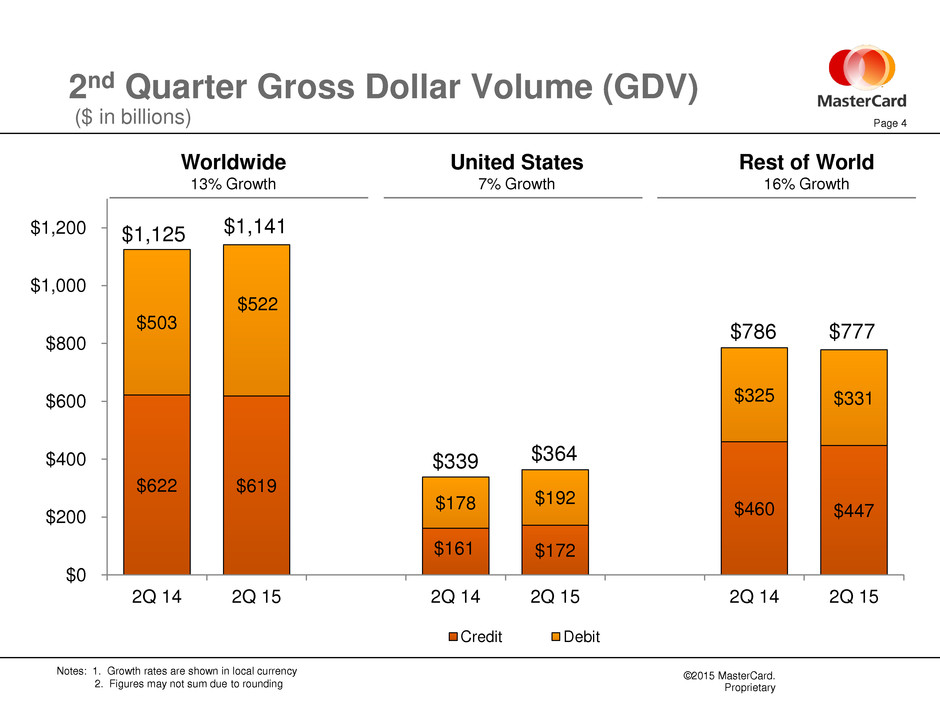
©2015 MasterCard. Proprietary 2nd Quarter Gross Dollar Volume (GDV) ($ in billions) Notes: 1. Growth rates are shown in local currency 2. Figures may not sum due to rounding $622 $619 $161 $172 $460 $447 $503 $522 $178 $192 $325 $331 $0 $200 $400 $600 $800 $1,000 $1,200 2Q 14 2Q 15 2Q 14 2Q 15 2Q 14 2Q 15 Credit Debit $1,125 $1,141 $339 $364 $786 $777 4 Worldwide 13% Growth United States 7% Growth Rest of World 16% Growth Page

©2015 MasterCard. Proprietary 2nd Quarter Processed Transactions and Cards Cards 8% Growth Note: Figures may not sum due to rounding 1,326 1,489 698 701 0 500 1,000 1,500 2,000 2,500 2Q 14 2Q 15 Car d s ( in m ill io n s ) MasterCard Cards Maestro Cards 2,024 10,609 12,012 0 2,000 4,000 6,000 8,000 10,000 12,000 14,000 2Q 14 2Q 15 T ra n s a cti o n s ( in m ill io n s ) Processed Transactions 13% Growth 5 2,190 Page

©2015 MasterCard. Proprietary $1,008 $750 $995 $392 ($777) $2,368 $1,028 $777 $1,051 $474 ($940) $2,390 -$1,500 -$1,000 -$500 $0 $500 $1,000 $1,500 $2,000 $2,500 $3,000 Domestic Assessments Cross-Border Volume Fees Transaction Processing Fees Other Revenues Rebates and Incentives Total Net Revenue 2Q 14 2Q 15 Note: 1. Figures may not sum due to rounding. 2nd Quarter Revenue ($ in millions) 2% 3% 6% 21% 21% 1%As-reported 7%28%29%12%9%FX-adjusted 9% Page 6
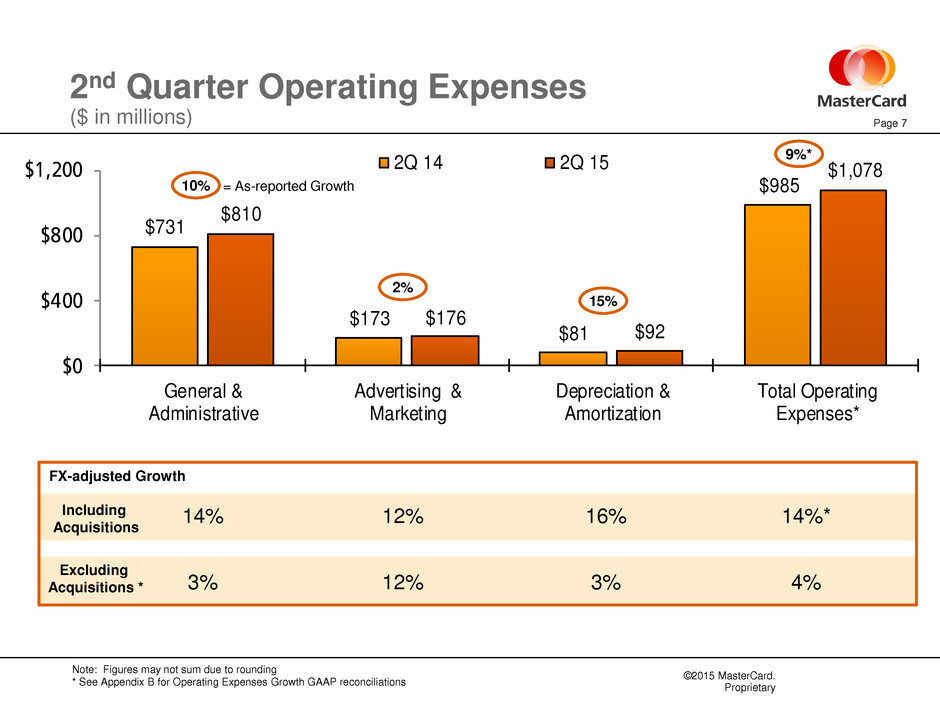
©2015 MasterCard. Proprietary $731 $173 $81 $985 $810 $176 $92 $1,078 $0 $400 $800 $1,200 General & Administrative Advertising & Marketing Depreciation & Amortization Total Operating Expenses* 2Q 14 2Q 15 2nd Quarter Operating Expenses ($ in millions) 14% 12% 16% 14%*Including Acquisitions 4% FX-adjusted Growth 3% 12% 3% Note: Figures may not sum due to rounding * See Appendix B for Operating Expenses Growth GAAP reconciliations Page 7 10% 2% 15% 9%* Excluding Acquisitions * = As-reported Growth
©2015 MasterCard. Proprietary Looking Ahead Business update through July 21st Thoughts for 2015 Long-Term Performance Objectives • Discussion on FX • Revenue • Expenses • Tax Rate Page 8
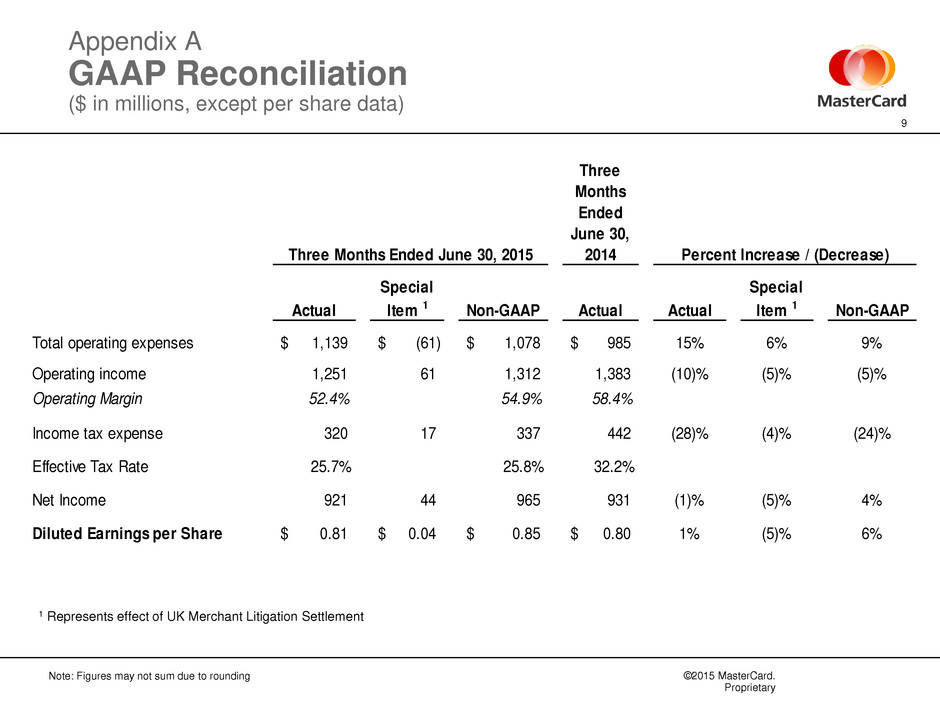
©2015 MasterCard. Proprietary 9 Three Months Ended June 30, 2014 Actual Special Item 1 Non-GAAP Actual Actual Special Item 1 Non-GAAP Total operating expenses 1,139$ (61)$ 1,078$ 985$ 15% 6% 9% Operating income 1,251 61 1,312 1,383 (10)% (5)% (5)% Operating Margin 52.4% 54.9% 58.4% Income tax expense 320 17 337 442 (28)% (4)% (24)% Effective Tax Rate 25.7% 25.8% 32.2% Net Income 921 44 965 931 (1)% (5)% 4% Diluted Earnings per Share 0.81$ 0.04$ 0.85$ 0.80$ 1% (5)% 6% Three Months Ended June 30, 2015 Percent Increase / (Decrease) 1 Represents effect of UK Merchant Litigation Settlement Appendix A GAAP Reconciliation ($ in millions, except per share data) Note: Figures may not sum due to rounding
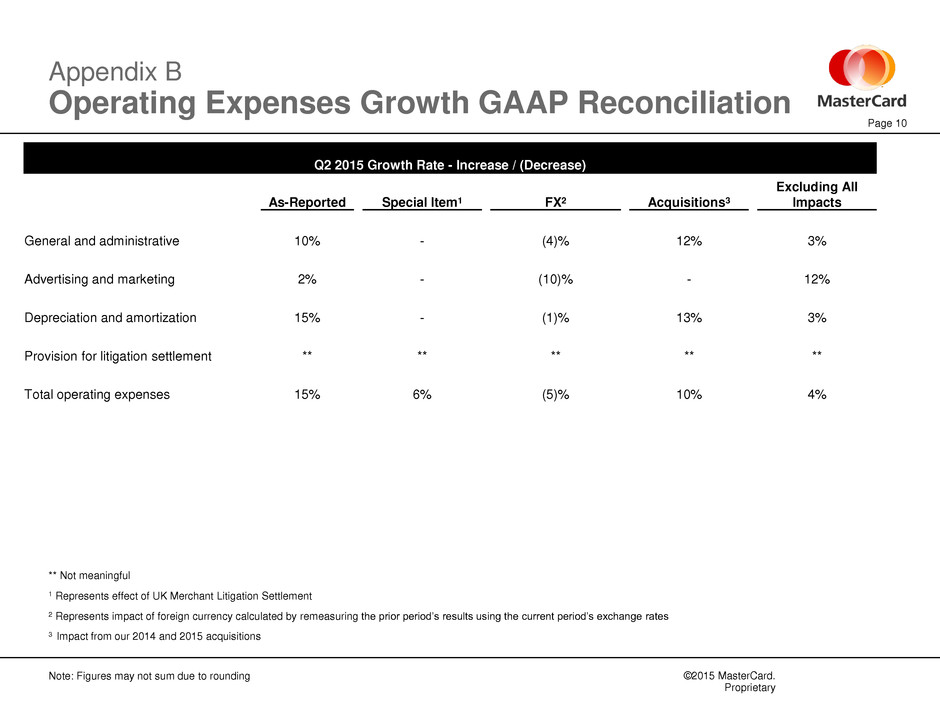
©2015 MasterCard. Proprietary Appendix B Operating Expenses Growth GAAP Reconciliation Page 10 Note: Figures may not sum due to rounding ** Not meaningful 1 Represents effect of UK Merchant Litigation Settlement 2 Represents impact of foreign currency calculated by remeasuring the prior period’s results using the current period’s exchange rates 3 Impact from our 2014 and 2015 acquisitions Q2 2015 Growth Rate - Increase / (Decrease) As-Reported Special Item1 FX2 Acquisitions3 Excluding All Impacts General and administrative 10% - (4)% 12% 3% Advertising and marketing 2% - (10)% - 12% Depreciation and amortization 15% - (1)% 13% 3% Provision for litigation settlement ** ** ** ** ** Total operating expenses 15% 6% (5)% 10% 4%

©2015 MasterCard. Proprietary


