
Martina Hund-Mejean Chief Financial Officer Financial Perspective 2015 Investment Community Meeting September 9, 2015
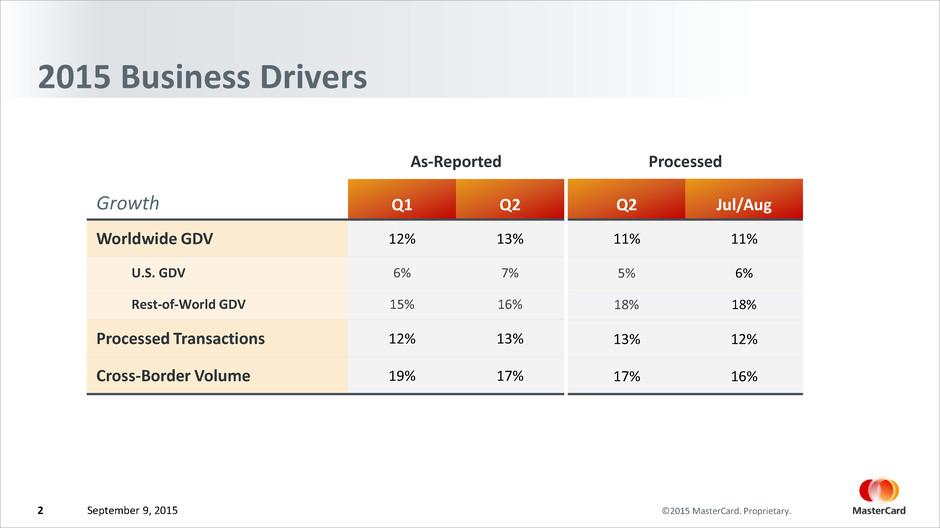
©2015 MasterCard. Proprietary.September 9, 2015 2015 Business Drivers Processed Q2 Jul/Aug 11% 11% 5% 6% 18% 18% 13% 12% 17% 16% As-Reported Growth Q1 Q2 Worldwide GDV 12% 13% U.S. GDV 6% 7% Rest-of-World GDV 15% 16% Processed Transactions 12% 13% Cross-Border Volume 19% 17% 2
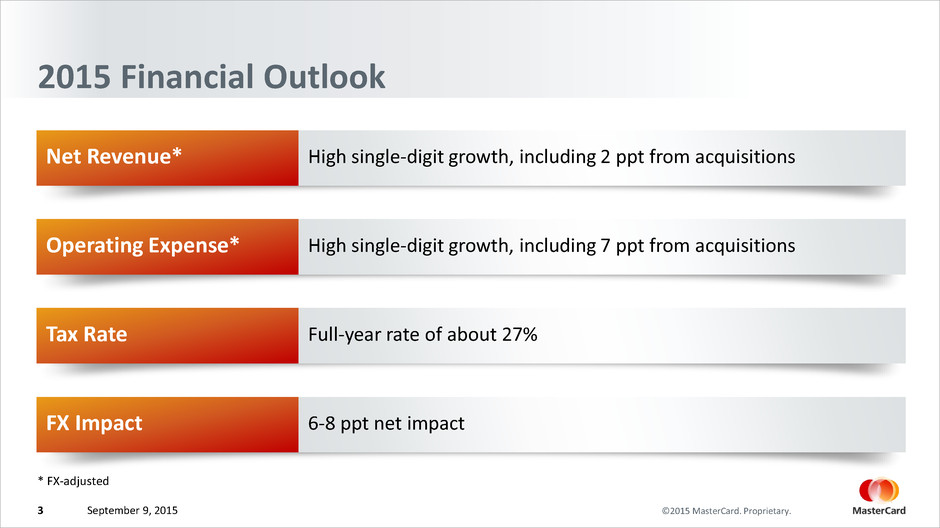
©2015 MasterCard. Proprietary.September 9, 2015 2015 Financial Outlook Net Revenue* High single-digit growth, including 2 ppt from acquisitions * FX-adjusted Operating Expense* High single-digit growth, including 7 ppt from acquisitions Tax Rate Full-year rate of about 27% FX Impact 6-8 ppt net impact 3
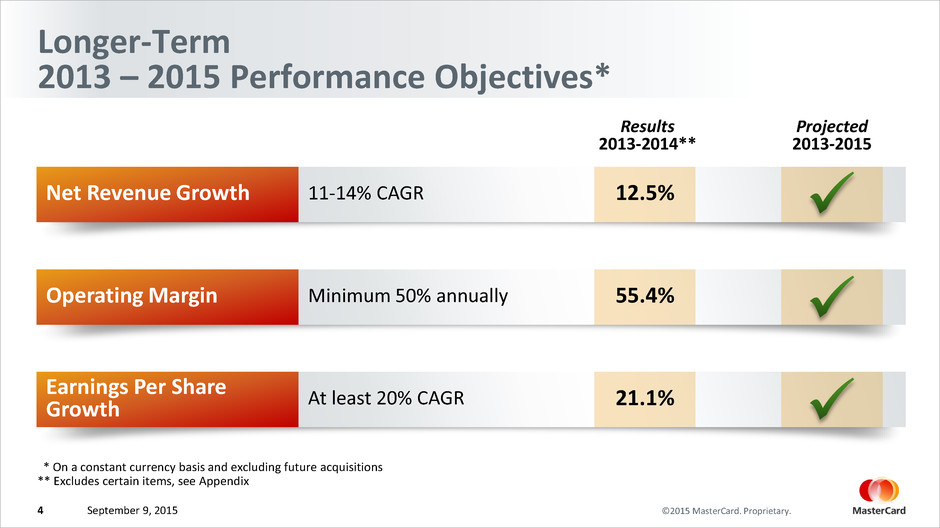
©2015 MasterCard. Proprietary.September 9, 20154 Longer-Term 2013 – 2015 Performance Objectives* ** Excludes certain items, see Appendix Results 2013-2014** Projected 2013-2015 Net Revenue Growth 11-14% CAGR 12.5% Operating Margin Minimum 50% annually 55.4% Earnings Per Share Growth At least 20% CAGR 21.1% * On a constant currency basis and excluding future acquisitions
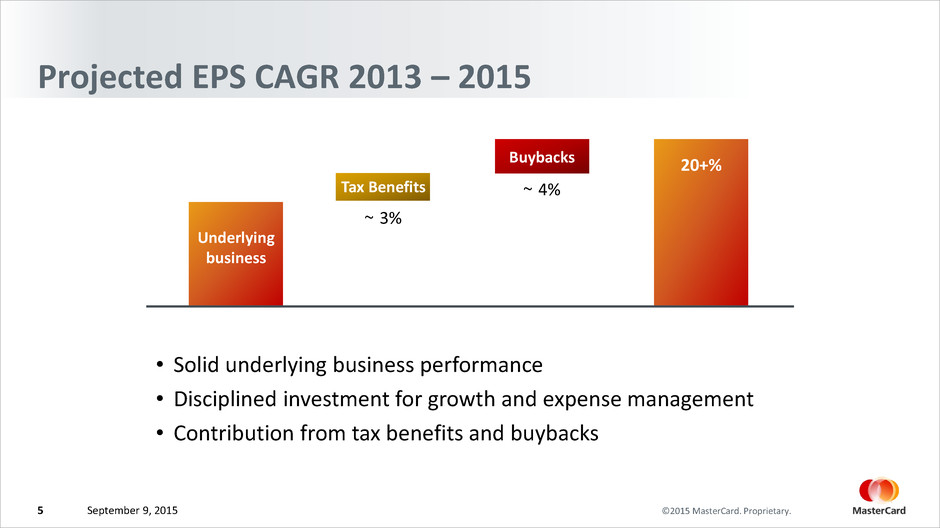
©2015 MasterCard. Proprietary.September 9, 2015 Projected EPS CAGR 2013 – 2015 • Solid underlying business performance • Disciplined investment for growth and expense management • Contribution from tax benefits and buybacks ~ 3% Tax Benefits Buybacks 20+% Underlying business 5 ~ 4%
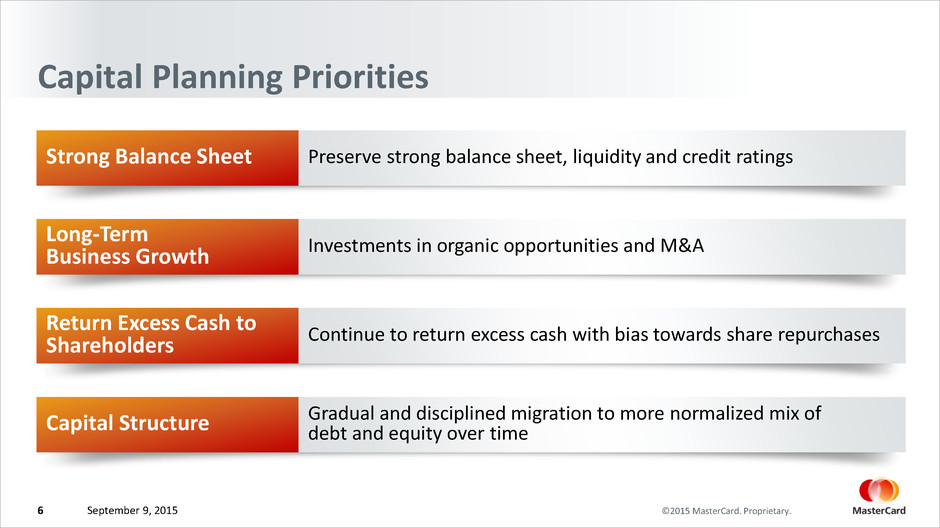
©2015 MasterCard. Proprietary.September 9, 2015 Capital Planning Priorities Strong Balance Sheet Preserve strong balance sheet, liquidity and credit ratings Long-Term Business Growth Investments in organic opportunities and M&A Return Excess Cash to Shareholders Continue to return excess cash with bias towards share repurchases Capital Structure Gradual and disciplined migration to more normalized mix ofdebt and equity over time 6
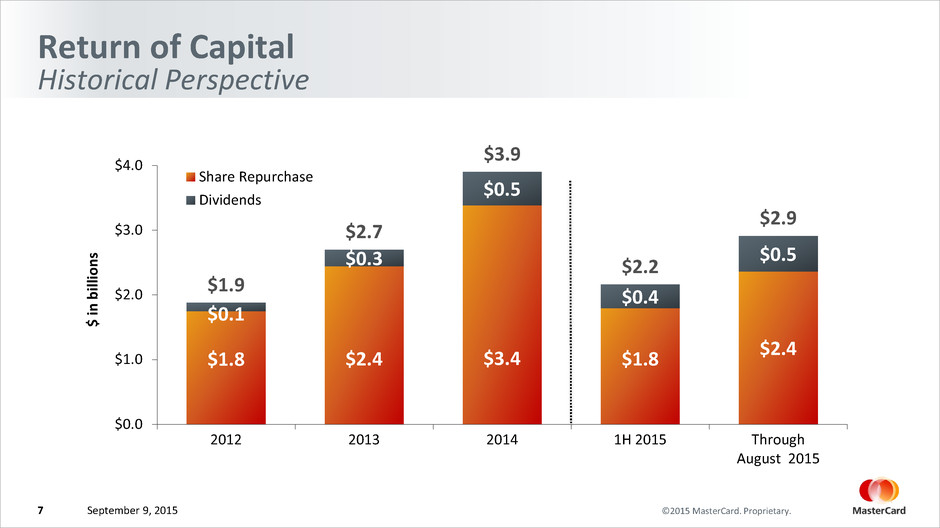
©2015 MasterCard. Proprietary.September 9, 2015 Return of Capital Historical Perspective $1.8 $2.4 $3.4 $1.8 $2.4 $0.1 $0.3 $0.5 $0.4 $0.5 $1.9 $2.7 $3.9 $2.2 $2.9 2012 2013 2014 1H 2015 Through August 2015 $0.0 $1.0 $2.0 $3.0 $4.0 $ in b ill io ns Share Repurchase Dividends 7
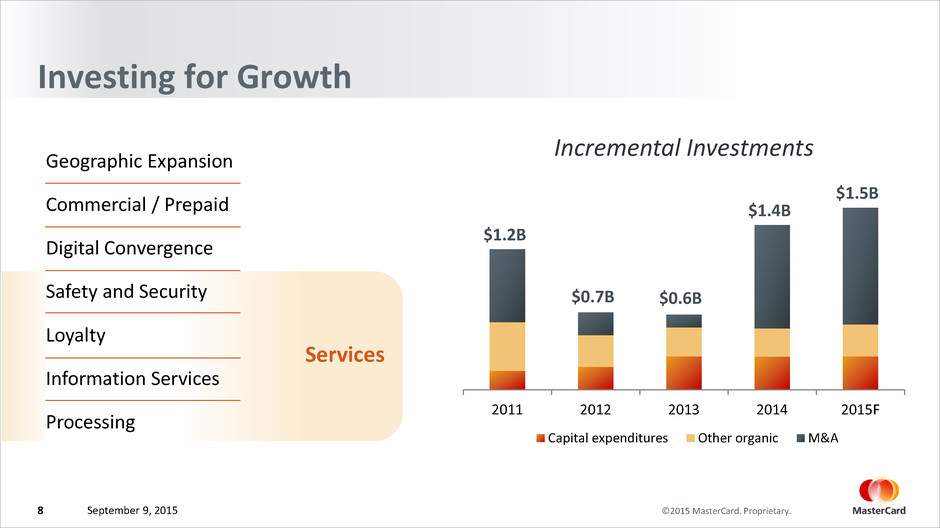
©2015 MasterCard. Proprietary. Services September 9, 2015 Investing for Growth 2011 2012 2013 2014 2015F Incremental Investments Capital expenditures Other organic M&A $1.2B $0.7B $0.6B $1.4B $1.5B Geographic Expansion Commercial / Prepaid Digital Convergence Safety and Security Loyalty Information Services Processing 8
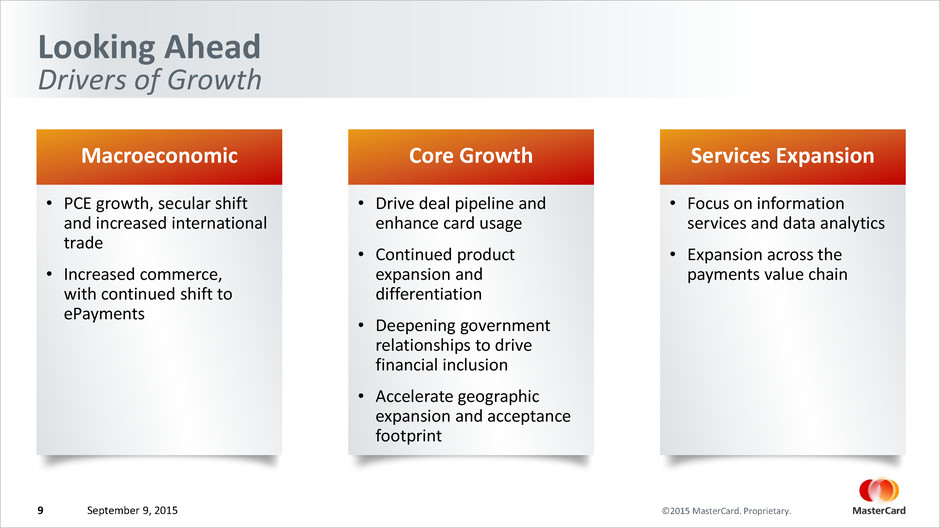
©2015 MasterCard. Proprietary.September 9, 2015 Looking Ahead Drivers of Growth Macroeconomic • PCE growth, secular shift and increased international trade • Increased commerce, with continued shift to ePayments Core Growth • Drive deal pipeline and enhance card usage • Continued product expansion and differentiation • Deepening government relationships to drive financial inclusion • Accelerate geographic expansion and acceptance footprint Services Expansion • Focus on information services and data analytics • Expansion across the payments value chain 9
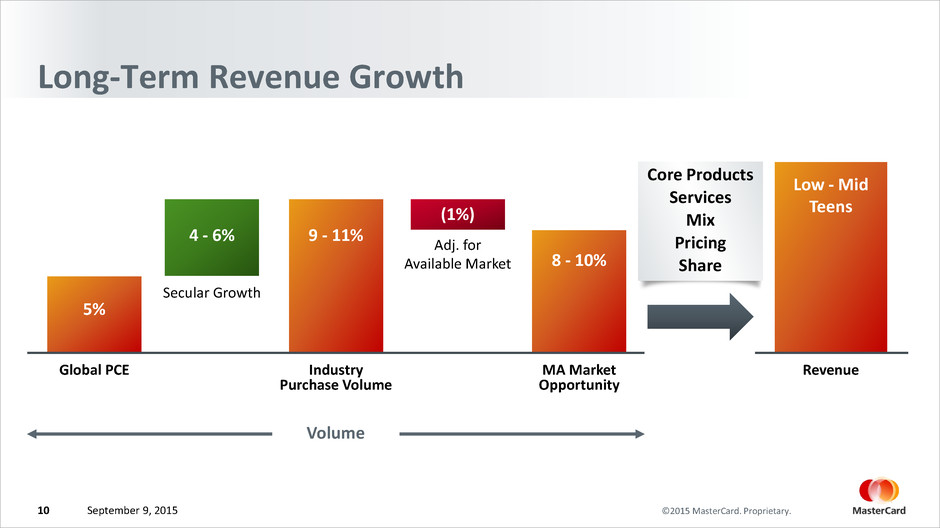
©2015 MasterCard. Proprietary.September 9, 2015 Long-Term Revenue Growth Global PCE 5% Secular Growth 4 - 6% Industry Purchase Volume Adj. for Available Market (1%) MA Market Opportunity 9 - 11% 8 - 10% Revenue Low - Mid Teens Volume Core Products Services Mix Pricing Share 10
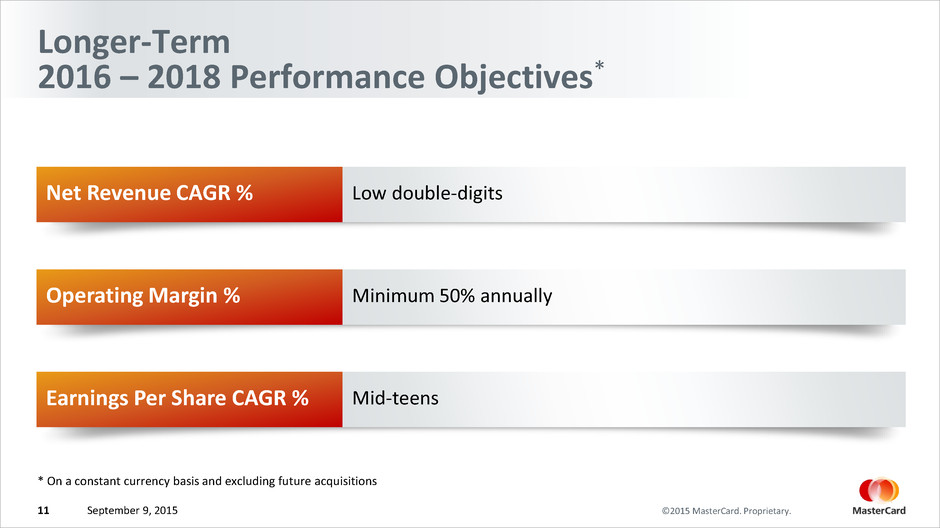
©2015 MasterCard. Proprietary.September 9, 2015 Longer-Term 2016 – 2018 Performance Objectives* * On a constant currency basis and excluding future acquisitions Net Revenue CAGR % Low double-digits Operating Margin % Minimum 50% annually Earnings Per Share CAGR % Mid-teens 11

Appendix
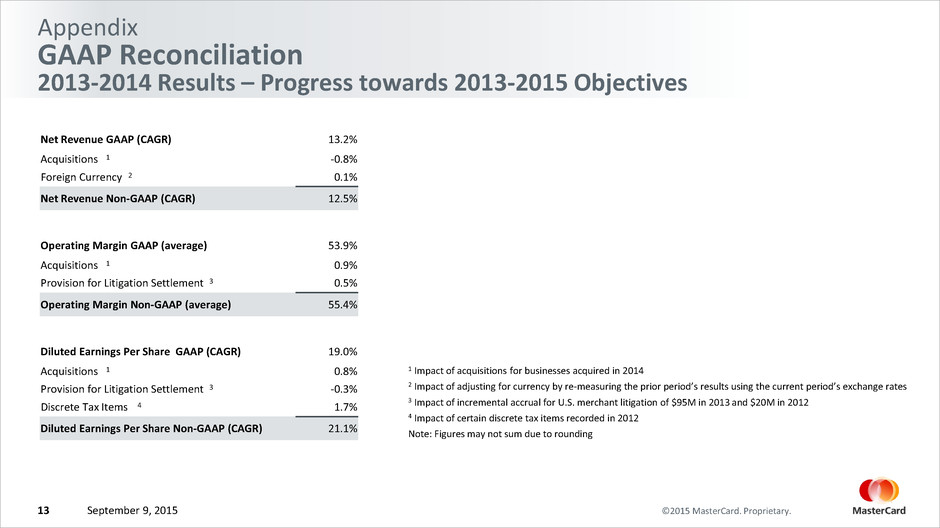
©2015 MasterCard. Proprietary.September 9, 201513 Appendix GAAP Reconciliation 2013-2014 Results – Progress towards 2013-2015 Objectives Net Revenue GAAP (CAGR) 13.2% Acquisitions 1 -0.8% Foreign Currency 2 0.1% Net Revenue Non-GAAP (CAGR) 12.5% Operating Margin GAAP (average) 53.9% Acquisitions 1 0.9% Provision for Litigation Settlement 3 0.5% Operating Margin Non-GAAP (average) 55.4% Diluted Earnings Per Share GAAP (CAGR) 19.0% Acquisitions 1 0.8% Provision for Litigation Settlement 3 -0.3% Discrete Tax Items 4 1.7% Diluted Earnings Per Share Non-GAAP (CAGR) 21.1% 1 Impact of acquisitions for businesses acquired in 2014 2 Impact of adjusting for currency by re-measuring the prior period’s results using the current period’s exchange rates 3 Impact of incremental accrual for U.S. merchant litigation of $95M in 2013 and $20M in 2012 4 Impact of certain discrete tax items recorded in 2012 Note: Figures may not sum due to rounding


