MasterCard Incorporated First-Quarter 2016 Financial Results Conference Call April 28, 2016
©2016 MasterCard. Proprietary Business Update Financial & Operational Overview Economic Update Business Highlights April 28, 20162
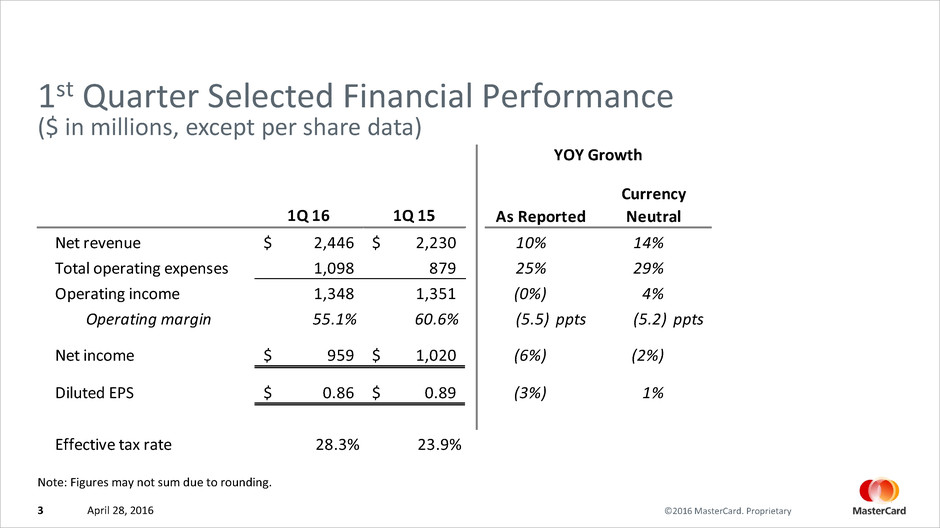
©2016 MasterCard. Proprietary 1st Quarter Selected Financial Performance 1Q 16 1Q 15 Net revenue 2,446$ 2,230$ 10% 14% Total operating expenses 1,098 879 25% 29% Operating income 1,348 1,351 (0%) 4% Operating margin 55.1% 60.6% (5.5) ppts (5.2) ppts Net income 959$ 1,020$ (6%) (2%) Diluted EPS 0.86$ 0.89$ (3%) 1% Effective tax rate 28.3% 23.9% Currency Neutral YOY Growth As Reported ($ in millions, except per share data) Note: Figures may not sum due to rounding. April 28, 20163
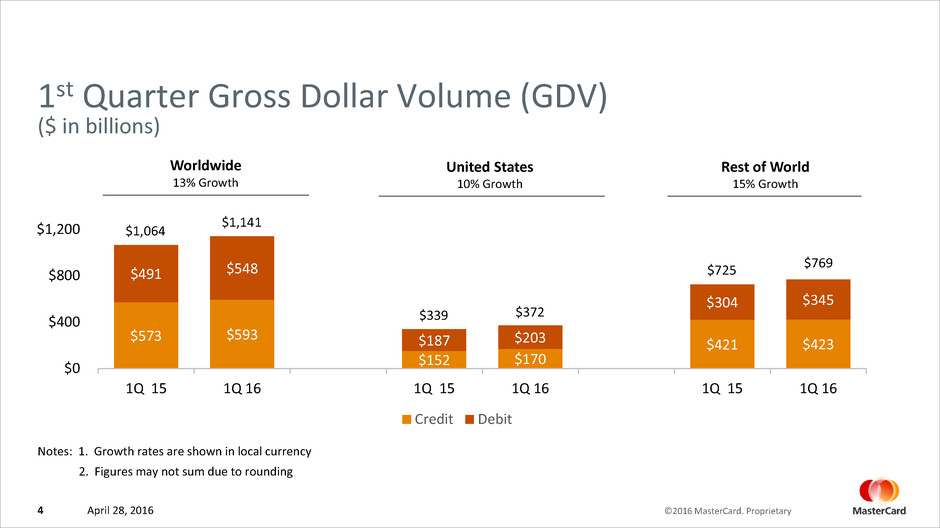
©2016 MasterCard. Proprietary $573 $593 $152 $170 $421 $423 $491 $548 $187 $203 $304 $345 $0 $400 $800 $1,200 1Q 15 1Q 16 1Q 15 1Q 16 1Q 15 1Q 16 Credit Debit Worldwide 13% Growth ($ in billions) 1st Quarter Gross Dollar Volume (GDV) $1,064 $1,141 $339 $372 $725 $769 United States 10% Growth Rest of World 15% Growth Notes: 1. Growth rates are shown in local currency 2. Figures may not sum due to rounding April 28, 20164
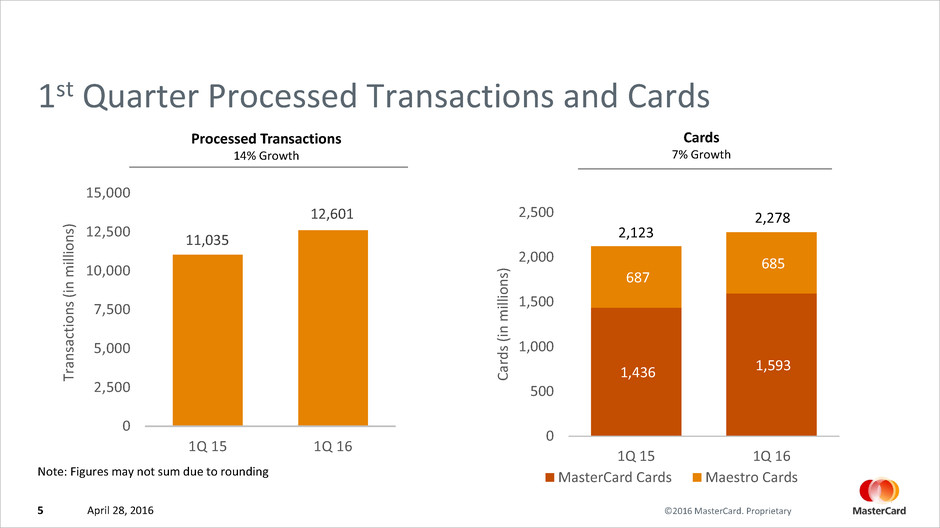
©2016 MasterCard. Proprietary 1st Quarter Processed Transactions and Cards Cards 7% Growth 1,436 1,593 687 685 0 500 1,000 1,500 2,000 2,500 1Q 15 1Q 16 Ca rd s (in m ill io ns ) MasterCard Cards Maestro Cards 2,12311,035 12,601 0 2,500 5,000 7,500 10,000 12,500 15,000 1Q 15 1Q 16 Tr an sa ct io ns (i n m ill io ns ) Processed Transactions 14% Growth 2,278 Note: Figures may not sum due to rounding April 28, 20165

©2016 MasterCard. Proprietary 1st Quarter Revenue ($ in millions) $963 $724 $1,006 $418 ($881) $2,230 $1,027 $796 $1,165 $497 ($1,039) $2,446 Domestic Assessments Cross-Border Volume Fees Transaction Processing Fees Other Revenue Rebates and Incentives Total Net Revenue -$2,000 -$1,000 $0 $1,000 $2,000 $3,000 1Q 15 1Q 16 Note: Figures may not sum due to rounding. 7% 10% 16% 19% 18% 10%As-reported 14%22%22%18%14%Currency-Neutral 13% Growth April 28, 20166
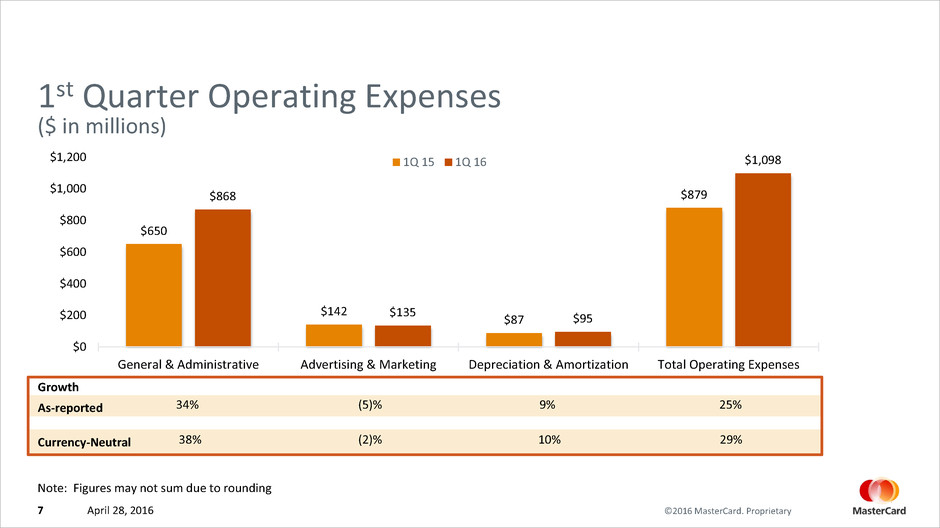
©2016 MasterCard. Proprietary Note: Figures may not sum due to rounding 1st Quarter Operating Expenses ($ in millions) $650 $142 $87 $879$868 $135 $95 $1,098 General & Administrative Advertising & Marketing Depreciation & Amortization Total Operating Expenses $0 $200 $400 $600 $800 $1,000 $1,200 1Q 15 1Q 16 34% (5)% 9% 25%As-reported 29% Growth 38% (2)% 10%Currency-Neutral April 28, 20167

©2016 MasterCard. Proprietary Looking Ahead Business update through April 21st Long-Term Performance Objectives Thoughts for 2016 April 28, 20168


