 MasterCard Incorporated 4 th Quarter and Full-Year 2006 Financial Results Conference Call February 9, 2007 Exhibit 99.2 |
 2 4 th Quarter Financial Results • Delivered net income of $41 million and earnings per share of $0.30 • Achieved strong revenue growth of 17.2% primarily due to: – Gross dollar volume growth (13.8% to 532 billion) – Increase in processed transactions (17.4% to 4.4 billion) – Restructured cross-border pricing (implemented April 2006) • Contributed $14.5 million in cash to the MasterCard Foundation • Improved operating margin to 5.5% from (13.7%) in 2005 • Maintained already solid financial position - $2.5 billion of cash, cash equivalents and available-for-sale securities at year-end |
 3 2006 Accomplishments • Largest U.S. listed IPO in 2006 • Transformed governance structure - new Board of Directors with global representation • Celebrated 40th anniversary and successfully launched new corporate brand • Established The MasterCard Foundation • Made great progress with PayPass initiative • Maestro announced as Belgium’s national debit brand • Launched World Elite product and won Sam’s Club acceptance • Achieved full-year GDV of almost $2 trillion and card growth of 12.3% |
 4 ($0.26) (35) 26 7 (18) 21 (71) (9.9%) 26 _ _ 386 375 $ 716 4Q 2005 adjusted for special items* $0.30 41 (29) _ (17) 41 46 5.5% 25 14 2 353 399 $ 839 4Q 2006 GAAP NM _ Litigation settlements 140.0% (30) Income tax expense (5.6%) (17) Interest expense (3.8%) 25 Depreciation and amortization NM 14 Charitable contributions to the MasterCard Foundation 218.5% 218.5% NM 95.2% 167.6% NM (8.5%) 6.4% 17.2% YOY % Growth Rate _ Other income $0.31 EPS 42 Net Income (Loss) 353 Advertising and marketing 41 Investment income 399 General and administrative 48 5.7% Operating income Operating Margin $ 839 Revenues, net 4Q 2006 adjusted for special items* 4 th Quarter Selected Financial Performance ($ in Millions, except percentages and per share data) * See Appendix A for a GAAP reconciliation of special items for the three and twelve months ended December 31, 2005 and 2006 NM = Not meaningful |
 5 MasterCard Branded Volume (GDV) Fourth Quarter 2006 Note: Figures may not sum due to rounding 14.5 14.5 244 United States 13.8 16.8 532 Worldwide 13.2 16.8 20 Canada 38.3 30.9 9 South Asia / Middle East / Africa 6.8 11.2 77 Asia Pacific 24.8 24.5 37 Latin America 12.9 21.5 145 Europe Local Currency U.S. Dollar GDV ($ billions) YOY Growth Rate % |
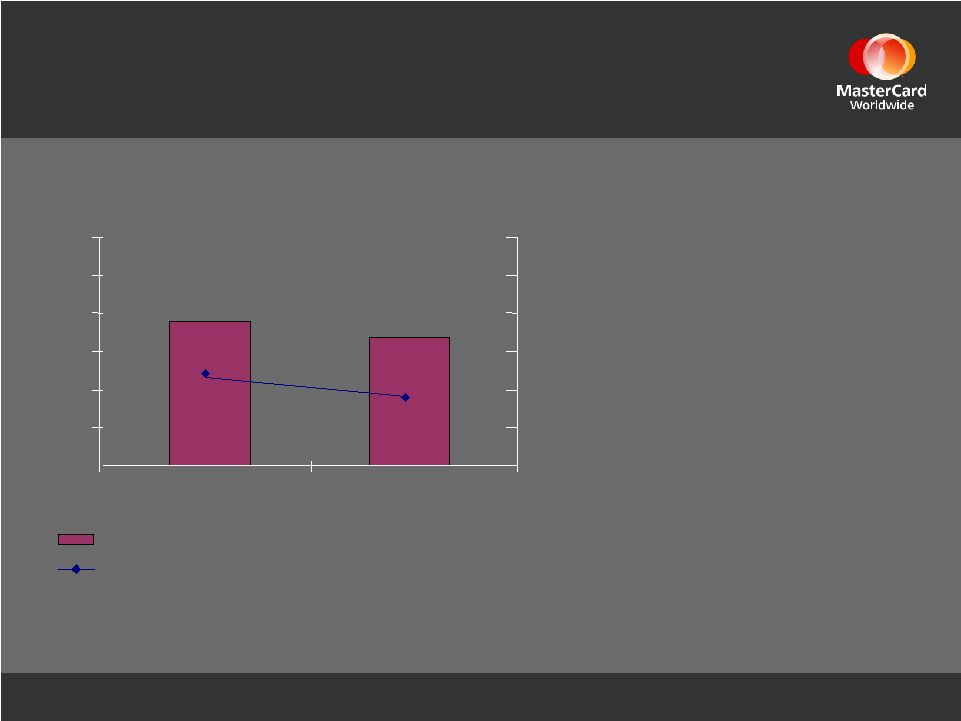 6 4 th Quarter Revenue - Assessments ($ in Millions) $177 $189 $0 $50 $100 $150 $200 $250 $300 4Q05 4Q06 20% 30% 40% 50% 60% 70% 80% Net Assessment Fees Net Assessment Fees as a % of Gross Assessment Fees • Net assessments down $12 or 6.4% • Gross assessments increased $53 or 12.4% over 2005. Key drivers include: – GDV increases – Restructured pricing, primarily $33 reclassification to operations fees (offsets gross assessments) • Net assessments as a % of gross assessments declined due to an increase in incentives primarily from: – New and renewed customer and merchant agreements |
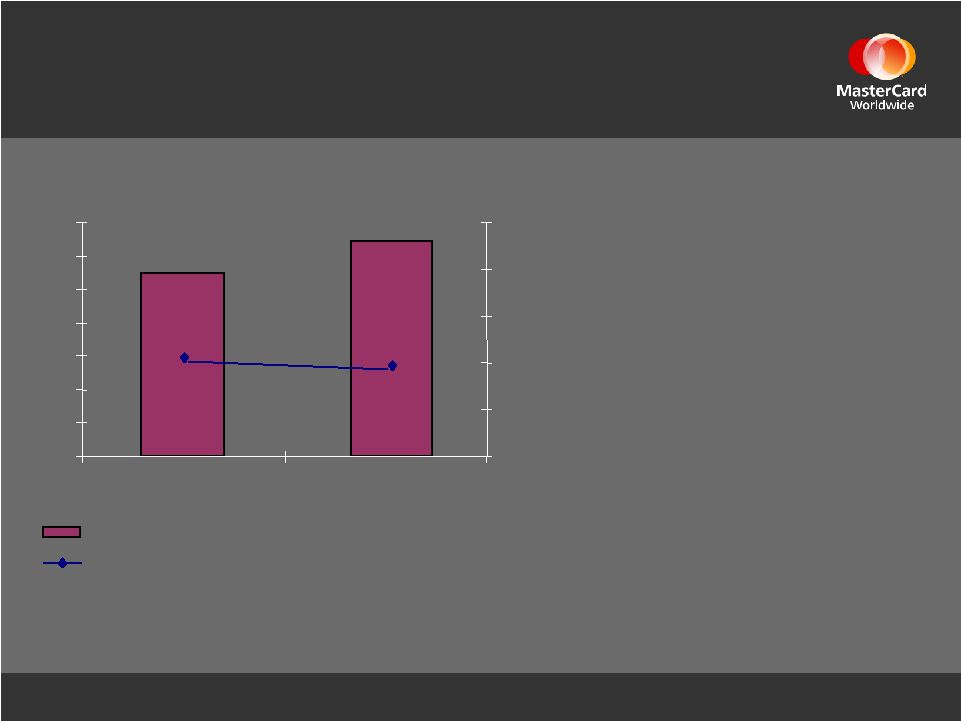 7 4 th Quarter Revenue - Operations Fees ($ in Millions) • Net operations fees up $135 or 25.6% • Gross operations fees increased $159 or 27.3% over 2005. Key drivers include increases in: – Processed transactions: 17.4% – GDV: 13.8% – Restructured pricing, including $33 reclassification from assessments • Net operations fees as a % of gross operations fees slightly decreased due to an increase in rebates primarily from: – Consolidation of major customers – Impact of restructured pricing $662 $527 $0 $100 $200 $300 $400 $500 $600 $700 4Q05 4Q06 85% 88% 91% 94% 97% 100% Net Operations Fees Net Operations Fees as a % of Gross Operations Fees |
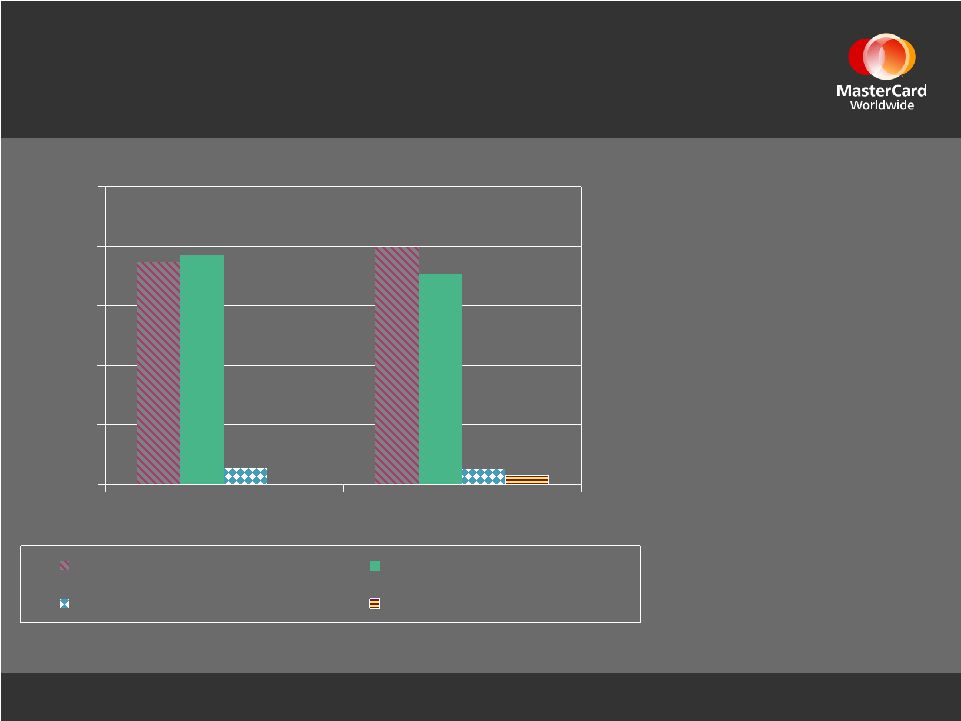 8 $0 $100 $200 $300 $400 $500 4Q05 4Q06 General & Administrative Advertising & Marketing Depreciation & Amortization Charitable Contributions 4 th Quarter Operating Expenses ($ in Millions) $375 $386 $26 $399 $353 $25 • Total operating expenses decreased 2.6% to $793: – Adjusted for special items, increased 0.5% • Charitable contributions increased due to $14.5 cash contribution to the MasterCard Foundation • G&A increased 6.4% to $399: – Driven by increases in professional fees and personnel costs • As expected, advertising and market development decreased 8.5% to $353: – Primarily due to focus on World Cup soccer events which concluded early in 3Q06 $14 |
 9 Cash Flow Statement and Balance Sheet Highlights • Generated $650 million in cash flow from operations during 2006 • Cash, cash equivalents and available-for-sale securities of $2.5 billion • Stockholders’ equity at $2.4 billion • Accounts receivable increased $104 million primarily due to: – Pricing recalibration in Europe – Higher volume and assessments on cards • Accounts payable increased $94 million due to timing of payments principally related to advertising and amounts due to customers and merchants under incentive agreements • Accrued expenses increased $86 million primarily due to higher customer incentives driven by new contracts in 2006 • Obligations under the U.S. Merchant Lawsuit and other litigation settlements decreased $128 million due to: – $195 million in payments of litigation settlements – Offset by $67 million in accruals and interest accretion |
 10 2007 Items for Consideration • No “special items” in 1Q 2006 • 1Q07 last “grow-over” quarter resulting from April 2006 cross-border price restructuring • Advertising and marketing spend pattern more representative of a non-World Cup soccer year |
 11 Full-Year 2006 Progress 30.9% Return on equity, excluding IPO proceeds 44.2% Deliver net income growth* 2.9 ppt improvement versus 2005 Continued margin improvement* 13.2% Grow revenue FY 2006 *See Appendix A for a GAAP reconciliation of special items for the three and twelve months ended December 31, 2005 and 2006 |
 |
 13 Appendix A: GAAP Reconciliation a Litigation settlements b Contribution of cash to the MasterCard Foundation NM = Not meaningful ($ million) YOY Growth Actual Special Items As Adjusted Actual Special Items As Adjusted As Adjusted Revenues, net $839 - $839 $716 - $716 17.2% Operating Expenses General and administrative 399 - 399 375 - 375 6.4% Advertising and marketing 353 - 353 386 - 386 (8.5%) Litigation settlements 2 2 a - 27 27 a - NM Charitable contributions to the MasterCard Foundation 14 - 14 b - - - NM Depreciation and amortization 25 - 25 26 - 26 (3.8%) Total operating expenses 793 2 791 814 27 787 0.5% Operating income (expense) 46 48 (98) 27 (71) 167.6% Operating Margin 5.5% - 5.7% (13.7%) - (9.9%) NM Other Income (Expense) Investment income, net 41 - 41 21 - 21 95.2% Interest expense (17) - (17) (18) - (18) (5.6%) Other income, net - - - 7 - 7 NM Total other income 24 - 24 10 - 10 140.0% Income (loss) before income taxes 70 2 72 (88) 27 (61) 218.0% Income tax expense (benefit) 29 1 30 (35) 9 (26) NM Net Income (loss) $41 1 $42 ($53) $18 ($35) 218.5% Basic Net Income (Loss) per Share $0.30 $0.01 $0.31 ($0.39) $0.13 ($0.26) 218.5% Diluted Net Income (Loss) per Share $0.30 $0.01 $0.31 ($0.39) $0.13 ($0.26) 218.5% For the three months ended 12/31/06 For the three months ended 12/31/05 2 |
 14 Appendix A (cont.): GAAP Reconciliation a Litigation settlements b Contribution of cash to the MasterCard Foundation c Adjustment to reflect accounting methodology change for cash-based executive incentive plans d Contribution of common stock to the MasterCard Foundation e Interest income on IPO proceeds which were used for redemption f Gains from the settlement of a contractual dispute NM = Not meaningful ($ million) YOY Growth Actual Special Items As Adjusted Actual Special Items As Adjusted As Adjusted Revenues, net $3,326 - $3,326 $2,938 - $2,938 13.2% Operating Expenses General and administrative 1,505 - 1,505 1,352 19 c 1,333 12.9% Advertising and marketing 1,052 - 1,052 1,008 - 1,008 4.4% Litigation settlements 25 25 a - 75 75 a - NM Charitable contributions to the MasterCard Foundation 415 395 d 20 b 0 - - NM Depreciation and amortization 100 - 100 110 - 110 (9.1%) Total operating expenses 3,097 420 2,677 2,545 94 2,451 9.2% Operating income 229 420 649 393 94 487 33.3% Operating Margin 6.9% - 19.5% 13.4% - 16.6% 2.9 ppt Other Income (Expense) Investment income, net 125 (7) e 118 61 - 61 93.4% Interest expense (61) - (61) (70) - (70) (12.9%) Other income, net 1 - 1 23 (17) f 6 (83.3%) Total other income (expense) 65 (7) 58 14 (17) (3) NM Income before income taxes 294 413 707 407 77 484 46.1% Income tax expense 244 6 250 140 27 167 49.9% Net Income $50 $407 $457 $267 $50 $317 42.2% Basic Net Income per Share $0.37 $3.00 $3.37 $1.98 $0.37 $2.35 43.4% Diluted Net Income per Share $0.37 $3.00 $3.37 $1.98 $0.37 $2.35 43.4% For the year ended 12/31/06 For the year ended 12/31/05 |