MasterCard Incorporated 1 Quarter 2008 Financial Results Conference Call April 29, 2008 Exhibit 99.2 st |
2 1 Quarter Financial Results • Net income of $398 million, or $3.01 per share, on a diluted basis – Excluding a special item * of $49 million, or $0.37 per share – Including gains from sales of Redecard shares of $56 million, or $0.42 per share • Net income of $447 million, or $3.38 per share, on a diluted basis, including the special item * and gains from sales of Redecard shares • Net revenue of $1.2 billion, representing growth of 29.2% due to: – Gross dollar volume growth (14.1% ** to $611 billion) – Increase in processed transactions (15.7% to 4.9 billion) – Increase in cross-border volumes (23.6%) – Pricing changes (6 percentage points) – Currency fluctuations (5.1 percentage points) • Improved operating margin by 9.3 ppts., to 43.6%, from 34.3%, in Q1 2007 * See Appendix A for a GAAP reconciliation of special items for the three months ended March 31, 2008 ** On a local currency basis st |
3 Business Update • Economic Overview • IPS Debit Processing • Legal and Regulatory Update • Redecard Sales • Share Repurchase and Conversion Programs |
4 $ 3.01 $ 398 516 43.6% 666 $ 1,182 1Q 2008 adjusted for special items* $ 1.57 $ 215 314 34.3% 601 $ 915 1Q 2007 Actual $ 3.38 $ 447 516 43.6% 666 $ 1,182 1Q 2008 Actual 91.7 Diluted EPS 85.3 Net income 10.9 Total operating expenses 64.2 9.3 ppts Operating income Operating margin 29.2 Net revenue YOY Adjusted Growth % 1 Quarter Selected Financial Performance ($ in millions, except percentages and per share data) Note: Figures may not sum due to rounding *See Appendix A for a GAAP reconciliation of special items for the three months ended March 31, 2008 st |
5 MasterCard Branded Volume (GDV) 1 Quarter 2008 Note: Figures may not sum due to rounding 8.9 8.9 259 United States 14.1% 20.0 $611 Worldwide 13.0 31.6 24 Canada 31.3 33.5 12 South Asia/Middle East/Africa (SAMEA) 18.7 27.8 89 Asia Pacific 20.7 28.7 44 Latin America 17.4 30.2 183 Europe Local Currency U.S. Dollar GDV ($ billions) YOY Growth Rate % st |
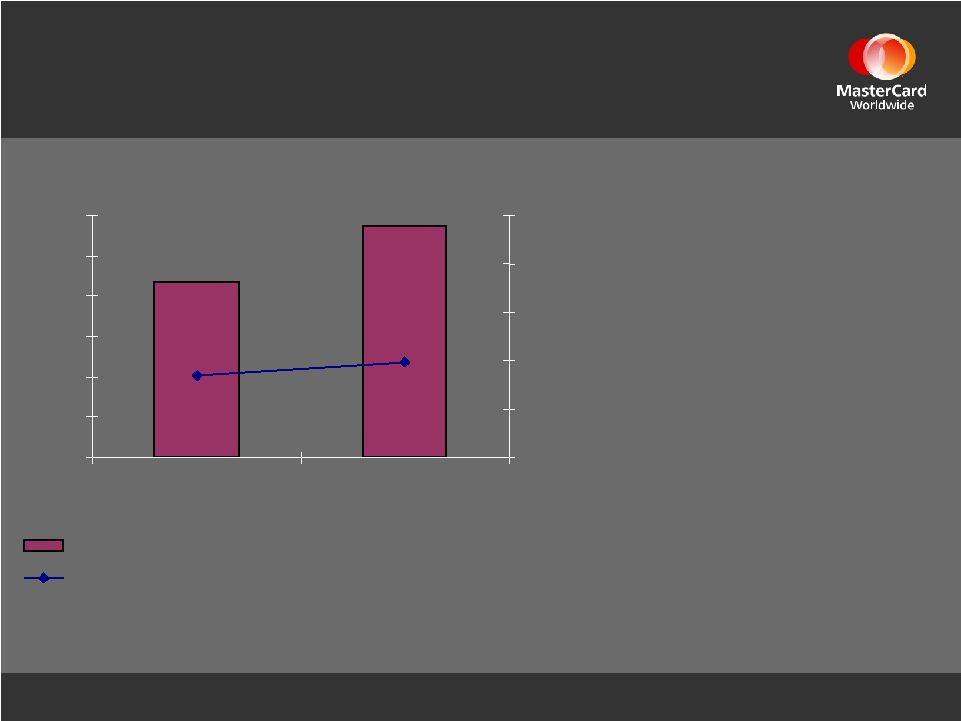
6 1 Quarter Revenue - Operations Fees ($ in millions) • Net operations fees increased 31.4%, or $205 to $858 • Gross operations fees increased 30.2%, or $219 to $944. Key drivers included: – Processed transactions growth: 15.7% – Cross-border volume growth of 23.6% – GDV growth: 14.1% * – Pricing changes • Net operations fees as a % of gross improved slightly: – Rebates tempered by adjustment * On a local currency basis Net Operations Fees Net Operations Fees as a % of Gross Operations Fees $653 $858 $0 $150 $300 $450 $600 $750 $900 1Q07 1Q08 85% 88% 91% 94% 97% 100% st |
7 1 Quarter Revenue - Assessments ($ in millions) • Net assessments increased 23.7%, or $62, to $324 • Gross assessments increased 20.4%, or $94 to $554 due to strong GDV growth of 14.1% * • Net assessments as a % of gross assessments improved slightly: – Rebates tempered by adjustment * On a local currency basis Net Assessment Fees Net Assessment Fees as a % of Gross Assessment Fees $262 $324 $0 $50 $100 $150 $200 $250 $300 $350 1Q07 1Q08 20% 30% 40% 50% 60% 70% 80% st |
8 1st Quarter Operating Expenses ($ in Millions) • Total operating expenses increased 10.9%, or $65, to $666 • G&A increased 10.9%, or $43, to $442 primarily due to: – Higher personnel costs for additional staff and contractors • A&M increased 11.6%, or $21, to $199 primarily due: – Timing of certain expenses for sponsorships and promotions – Currency fluctuations $399 $178 $442 $24 $199 $25 $0 $100 $200 $300 $400 $500 $600 Q107 Q108 General & Administrative Advertising & Marketing Depreciation & Amortization |
9 Cash Flow Statement and Balance Sheet Highlights • Generated $224 million in cash flow from operations during the quarter • Cash, cash equivalents and available-for-sale securities of $2.9 billion at 3/31/08 • Available-for-sale securities (short & long term) decreased $281 million primarily due to: – Sale of remaining shares of Redecard – Sale of short-term bond funds and auction rate securities – Investment losses • Auction rate securities of $237 million reclassified to non-current assets • Repurchased approximately 1.5 million Class A shares for $294 million – Stock repurchases resulted in a $0.02 per share increase to basic EPS for the quarter |
10 Items for Consideration • 2Q07 special items: – Litigation settlements of $3 million – Other income of $90 million related to the World Cup settlement agreement • Thoughts for 2008: – Net revenue growth: slower than 2007, but still double-digit – G&A growth: slower than net revenue growth and below 2007 G&A growth rate – A&M growth: continued modest growth – Assume current F/X rates, no global recession and no event which significantly disrupts cross-border travel |
12 Appendix A: GAAP Reconciliation a. $75 million gain from the termination of a customer business agreement NM = Not meaningful Figures may not sum due to rounding ($ million) YOY Growth Actual Special Items As Adjusted Actual Special Items As Adjusted As Adjusted Revenues, net $1,182 - $1,182 $915 - $915 29.2% Operating Expenses General and administrative 442 - 442 399 - 399 10.9% Advertising and marketing 199 - 199 178 - 178 11.6% Litigation settlements - - - - - - Depreciation and amortization 25 - 25 24 - 24 4.5% Total operating expenses 666 - 666 601 - 601 10.9% Operating income 516 - 516 314 - 314 64.2% Operating Margin 43.6% - 43.6% 34.3% - 34.3% 9.3 ppts. Other Income (Expense) Investment income, net 115 - 115 36 - 36 216.6% Interest expense (15) - (15) (14) - (14) 6.7% Other income, net 74 75 a (1) - - - NM Total other income 173 75 98 22 - 22 348.4% Income before income taxes 689 75 614 336 - 336 82.7% Income tax expense 242 26 216 121 - 121 78.2% Net Income (loss) $447 49 $398 $215 - $215 85.3% Basic Net Income (Loss) per Share $3.40 $0.37 $3.03 $1.58 - $1.58 91.8% Diluted Net Income (Loss) per Share $3.38 $0.37 $3.01 $1.57 - $1.57 91.7% For the three months ended 3/31/08 For the three months ended 3/31/07 |