 May 29, 2008 MasterCard Incorporated 2008 Investment Community Meeting Exhibit 99.1 |
 May 29, 2008 2008 Investment Community Meeting 2 Forward-Looking Statements Today’s presentations may contain, in addition to historical information, forward-looking statements within the meaning of the Private Securities Litigation Reform Act of 1995. These forward-looking statements are based on our current assumptions, expectations and projections about future events which reflect the best judgment of management and involve a number of risks and uncertainties that could cause actual results to differ materially from those suggested by our comments today. You should review and consider the information contained in our filings with the SEC regarding these risks and uncertainties. MasterCard disclaims any obligation to publicly update or revise any forward-looking statements or information provided during today’s presentations. |
 May 29, 2008 Global Overview 2008 Investment Community Meeting Bob Selander, President and Chief Executive Officer |
 May 29, 2008 2008 Investment Community Meeting 4 MA: Two Years Out of the Gate • Extraordinary performance since IPO • Continue to strengthen our organization • Excellent growth in key metrics: – Gross dollar volume – Processed transactions – Net revenue – Net income • Value reflected in stock performance |
 May 29, 2008 2008 Investment Community Meeting 5 Cyclical Economic Considerations Global Overview • International Monetary Fund predicts slower global economic growth • Growth in emerging and developing economies is slowing, but still above trend |
 May 29, 2008 2008 Investment Community Meeting 6 Cyclical Economic Considerations United States • Real GDP growth forecasted to slow in 2008 • SpendingPulse TM data points to relatively weak readings across most sectors • Low consumer confidence |
 May 29, 2008 2008 Investment Community Meeting 7 • Intelligence and Insights • Profitable Growth • Risk Management • Cost Management Driving Customer Value in a Weakened Economy Customer Needs Examples of MasterCard Offerings • SpendingPulse • Portfolio Analytics • Account-Level Management • Portfolio Performance Forecasting • Fraud Monitoring System • Integrated Processing Solution • Customer Marketing TM |
 May 29, 2008 2008 Investment Community Meeting 8 Secular Challenges • Regulatory environment • Threat of disintermediation: – Competition from traditional players – New entrants – Advances in technology – Alternate online payment methods |
 May 29, 2008 2008 Investment Community Meeting 9 Secular Opportunities • Steady shift from cash and checks • Growth in e-payments, mobile • Globalization spurring cross-border commerce/travel patterns • Debit in the U.S. • SEPA in Europe • Emerging markets |
 May 29, 2008 2008 Investment Community Meeting 10 Strategic Approach • Anticipating continued change in payments sector • Exploring broader trends and impact – Other industries – Technological developments – Economic and social factors – Public policy |
 May 29, 2008 2008 Investment Community Meeting 11 Key Differentiators • Our strengths – Unified, global structure – World-renowned brands – Innovative product & payment solutions – Technology/processing platform – Strong relationships – Knowledge leadership/ MasterCard Advisors – Management expertise • These strengths support our solutions-based value proposition to customers |
 May 29, 2008 2008 Investment Community Meeting 12 MA: Well Positioned for Future • Strong underlying business momentum – Strong purchase volume growth – Growth in processed transactions – Robust cross-border transaction growth • Well positioned globally in both developed and emerging markets – Approximately 50% of revenues from outside the U.S. • Critical investments to drive future growth • No direct exposure to cardholder credit risk |
 May 29, 2008 2008 Investment Community Meeting 13 Summary • Exceptional performance since IPO • Making investments now for future growth • Committed to delivering shareholder value |
 May 29, 2008 The Global Growth Story 2008 Investment Community Meeting Walt Macnee, President, Global Markets |
 May 29, 2008 2008 Investment Community Meeting 15 2007 Macroeconomic and Social Snapshot 38 878 2.4 – 11.1 2.3 - 12.5 22,160 Europe 27 543 7.6 * 4.9 * 5,453 LAC 1.8 3.0 1.8% - 14% Inflation Inflation (CPI % YOY) (CPI % YOY) 6.1 5.2 0.7%- 14% Unemployment Unemployment (% of labor force) (% of labor force) 39.1 36.7 21.2 - 38.6 Median Age Median Age 33.1 303 232 - 2,445 Population Population (in millions) (in millions) 35,600 46,000 1,800 - 29,800 GDP per capita GDP per capita (US$) (US$) Canada United States APMEA Source: BMI, CIA World Fact Book, U.S. Census Bureau. * Unemployment and inflation are weighted averages of the rates of 18 countries. |
 May 29, 2008 2008 Investment Community Meeting 16 Trailblazing Asia Pacific Middle East Africa Asia Pacific Middle East Africa |
 May 29, 2008 2008 Investment Community Meeting 17 Macroeconomic and Social Snapshot of APMEA Segment Clusters 29.1 2,445 5.9% 5.8% 1,800 Emerging Mass Markets 2%-14% 3.4% 1.8% Inflation Inflation (CPI % YOY) (CPI % YOY) 0.7%-14% 5.2% 3.6% Unemployment Unemployment (% of labor force) (% of labor force) 21.2 27.2 38.6 Median Age Median Age 1,080 406 232 Population Population (in millions) (in millions) 4,245 3,560 29,800 GDP per capita GDP per capita (US$) (US$) SAMEA (ex India) Middle Income Cluster High Income Cluster Source: 2007 average from IMF, UN Population Division, Asian Development Bank, World Bank High Income Cluster : Japan, Korea, Taiwan, HK, Singapore, Australia; Middle Income Cluster : Thailand, Malaysia, Indonesia, Philippines; Emerging Mass Markets : China, India |
 May 29, 2008 2008 Investment Community Meeting 18 APMEA – Growth Opportunity Examples Opportunity = Trailblazing Opportunity = Trailblazing Opportunity = Trailblazing • Creation of new consumer segments • Tapping into increasing outbound travel • Urbanization |
 May 29, 2008 2008 Investment Community Meeting 19 Penetration Latin America/Caribbean Latin America/Caribbean |
 May 29, 2008 2008 Investment Community Meeting 20 LAC – 2007 Macroeconomic and Social Snapshot 38 878 2.4 – 11.1 2.3 - 12.5 22,160 Europe 27 543 7.6 * 4.9 * 5,453 LAC 1.8 3.0 1.8% - 14% Inflation Inflation (CPI % YOY) (CPI % YOY) 6.1 5.2 0.7%- 14% Unemployment Unemployment (% of labor force) (% of labor force) 39.1 36.7 21.2 - 38.6 Median Age Median Age 33.1 303 232 - 2,445 Population Population (in millions) (in millions) 35,600 46,000 1,800 - 29,800 GDP per capita GDP per capita (US$) (US$) Canada United States APMEA Source: BMI, CIA World Fact Book, U.S. Census Bureau. * Unemployment and inflation are weighted averages of the rates of 18 countries. |
 May 29, 2008 2008 Investment Community Meeting 21 Latin America/Caribbean – Growth Opportunity Examples Opportunity = Penetration Opportunity = Penetration Opportunity = Penetration • Emergence of new consumer segments • Creating acceptance channels • Bringing new ways to pay |
 May 29, 2008 2008 Investment Community Meeting 22 Innovation The United States The United States |
 May 29, 2008 2008 Investment Community Meeting 23 United States – 2007 Macroeconomic and Social Snapshot 38 878 2.4 – 11.1 2.3 - 12.5 22,160 Europe 27 543 7.6 * 4.9 * 5,453 LAC 1.8 3.0 1.8% - 14% Inflation Inflation (CPI % YOY) (CPI % YOY) 6.1 5.2 0.7%- 14% Unemployment Unemployment (% of labor force) (% of labor force) 39.1 36.7 21.2 - 38.6 Median Age Median Age 33.1 303 232 - 2,445 Population Population (in millions) (in millions) 35,600 46,000 1,800 - 29,800 GDP per capita GDP per capita (US$) (US$) Canada United States APMEA Source: BMI, CIA World Fact Book, U.S. Census Bureau. |
 May 29, 2008 2008 Investment Community Meeting 24 United States – Growth Opportunity Examples Opportunity = Innovation Opportunity = Innovation Opportunity = Innovation • Opening up acceptance channels • Expanding ways to pay • Leveraging our insights and information |
 May 29, 2008 2008 Investment Community Meeting 25 Transformation Canada Canada |
 May 29, 2008 2008 Investment Community Meeting 26 Canada – 2007 Macroeconomic and Social Snapshot 38 878 2.4 – 11.1 2.3 - 12.5 22,160 Europe 27 543 7.6 * 4.9 * 5,453 LAC 1.8 3.0 1.8% - 14% Inflation Inflation (CPI % YOY) (CPI % YOY) 6.1 5.2 0.7%- 14% Unemployment Unemployment (% of labor force) (% of labor force) 39.1 36.7 21.2 - 38.6 Median Age Median Age 33.1 303 232 - 2,445 Population Population (in millions) (in millions) 35,600 46,000 1,800 - 29,800 GDP per capita GDP per capita (US$) (US$) Canada United States APMEA Source: BMI, CIA World Fact Book, U.S. Census Bureau. |
 May 29, 2008 2008 Investment Community Meeting 27 Opportunity = Transformation Opportunity = Transformation Opportunity = Transformation Canada – Growth Opportunity Examples • Challenge the debit incumbent • Brand-new acceptance channels • New ways to pay |
 May 29, 2008 2008 Investment Community Meeting 28 Catalyst Europe Europe |
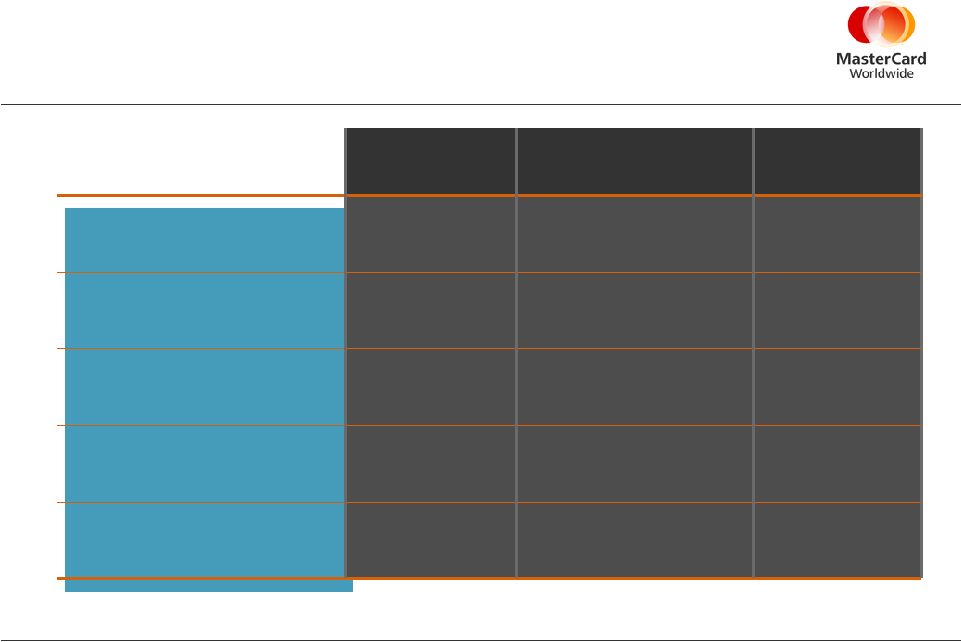 May 29, 2008 2008 Investment Community Meeting 29 Macroeconomic and Social Snapshot of Europe Market Clusters Sources: GDP, population – IMF 2007 statistics; Inflation, unemployment: The Economist – 2008 estimates, Median age – CIA world fact book (*) based on UK, Sweden & Ireland; HGEM: based on Russia, Poland, and Turkey; Cont SEPA: based on France, Germany, and Italy 35 468 6.6 - 11.1 4.0 - 12.5 12,376 High Growth and Emerging Markets 42 313 6.0 - 7.9 2.3 - 2.6 32,709 Continental Europe 2.6 - 3.6 Inflation* Inflation* (CPI % YOY) (CPI % YOY) 2.4 - 6.3 Unemployment* Unemployment* (% of labor force) (% of labor force) 40 Median Age Median Age 97 Population Population (in millions) (in millions) 35,407 GDP GDP per per capita capita (US$) (US$) UK/Nordics |
 May 29, 2008 2008 Investment Community Meeting 30 Europe – Growth Opportunity Examples Opportunity = Catalyst Opportunity = Catalyst Opportunity = Catalyst • Continued debit leadership • Expanding merchant and acquirer relationships • Changing consumer experience |
 May 29, 2008 2008 Investment Community Meeting 31 Summary Opportunity = Diversity Opportunity = Diversity Opportunity = Diversity • New ways to pay • New places to pay • New segments entering the global economy |
 May 29, 2008 SEPA Update 2008 Investment Community Meeting Javier Perez, President of MasterCard Europe |
 May 29, 2008 2008 Investment Community Meeting 33 Evolution of SEPA • • SEPA will . . . SEPA will . . . – Provide cardholders with a payment card they can use across Europe with the same convenience – Increase competition and transparency in the payments industry – Lower barriers to entry for acquirers, issuers and equipment providers – Benefit European society by reducing the overall cost of payments SEPA is not just about the 3% of card business cross-border . . . but also about the 97% of domestic transactions which were not open to competition* • • Current situation Current situation – 16 national debit schemes in Europe – Heterogeneous cardholder experience, domestic debit cards are not accepted everywhere in Europe – Limited competition at national level, many countries have only one acquirer, issuer or processor and few terminal vendors * Source: ECB Blue Book, 2006, Total EU |
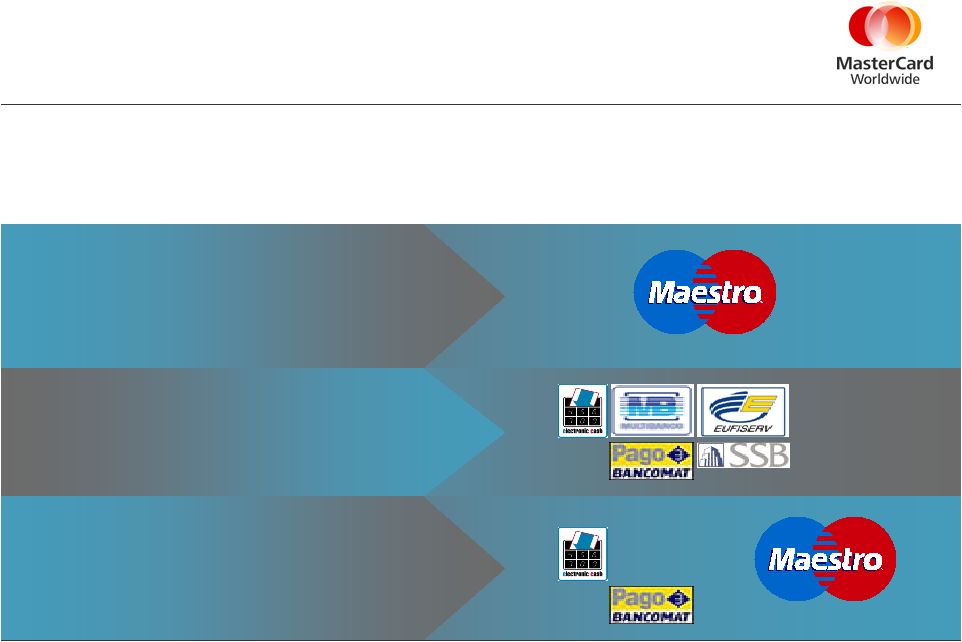 May 29, 2008 2008 Investment Community Meeting 34 SEPA Options for Banks • Migration to existing international schemes • Extend national schemes pan-Europe or create new scheme(s) • “Co-brand” International and SCF-compliant scheme + Multiple options for SEPA compliance exist and new opportunities and business models are being explored |
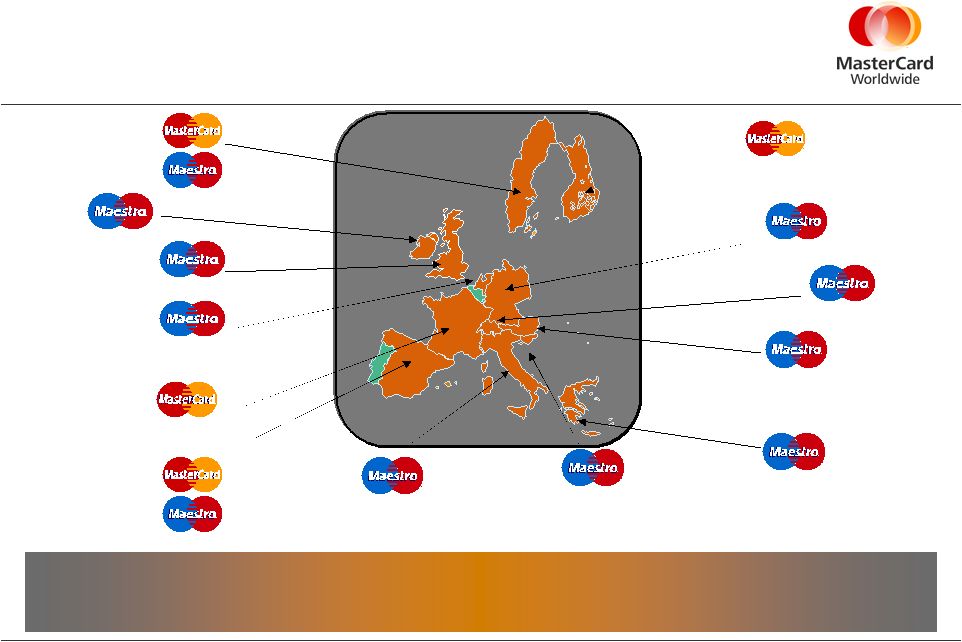  May 29, 2008 2008 Investment Community Meeting 35 Migration to Maestro and MasterCard from National Schemes Switzerland Austria Greece Sweden Slovenia Germany Over 70 million cards issued by over 100 banks in 13 countries have, or are currently, migrating from their national scheme to MasterCard and Maestro only Italy Spain Ireland Netherlands Finland France UK |
  May 29, 2008 2008 Investment Community Meeting 36 Belgium Co-branding with MasterCard and Maestro with Local SCF Compliant Schemes Luxembourg Over 150 million cards now co-branded Maestro and MasterCard Germany Italy France Portugal Ireland Netherlands |
 May 29, 2008 2008 Investment Community Meeting 37 Processing Opportunities Linked to SEPA Footnote appears here • Issuer Processing: – Migrations from local scheme to Maestro only – Maestro co-branded with SCF compliant local brands • Acquirer/Retailer Processing: – Routing of Domestic Transactions on co-branded cards via the Maestro brand and MasterCard processing network instead of local brand/processor |
 May 29, 2008 2008 Investment Community Meeting 3838 38 Consumer Behaviour Creating a True Single Market Berlin München Kleve Emmerich Konstanz Freilassing Schwalbach Passau Trier Bous Eschweiler Rheinberg Aachen Relative number of foreign Maestro transactions by German city, FY 2007 = |
 May 29, 2008 2008 Investment Community Meeting 39 Summary • SEPA is an evolutionary, not revolutionary process • Migration to and co-branding with MasterCard and Maestro result in strengthening our brand and result in opportunities to process • New entrants to domestic debit in SEPA like MasterCard will ensure a competitive and innovative future for payments |
 May 29, 2008 The U.S. Debit Imperative 2008 Investment Community Meeting Tim Murphy, President U.S. Region |
         May 29, 2008 2008 Investment Community Meeting 41 A Look at U.S. Debit Today When a debit card is activated and used, cardholders use it regularly, averaging 17 transactions a month Sources: 1. The Nilson Report 2. TowerGroup 3. Pulse EFT/Dove Consulting 2007 Debit Issuer Study Nearly 90% of US households have a debit card linked to their bank account 2 Between 2006 and 2011 debit purchase volume is expected to grow by 74.7% 1 The dollar volume of purchases on U.S. debit cards grew by an average of 27% from 2002 to 2007 1 3 |
         May 29, 2008 2008 Investment Community Meeting 42 We’ve Seen Tremendous Growth in Debit Building our debit portfolio with significant wins 36% compound annual growth rate in debit purchase volume and 38% compound annual growth in transaction volume from 2005 to 2007 53% growth in PIN Point of Sale switched transactions in 2007 24% growth in debit purchase volume and 19% growth in ATM processed transactions in 2007 |
 May 29, 2008 2008 Investment Community Meeting 43 Commoditization Opportunity With Challenge Comes Opportunity Conversion Consolidation |
    May 29, 2008 2008 Investment Community Meeting 44 Enhancing our U.S. Enhancing our U.S. Debit Strategy Debit Strategy |
    May 29, 2008 2008 Investment Community Meeting 45 Enhancing Our U.S. Debit Strategy Optimizing the Franchise for Debit Expanding Our Role in the Value Chain Supporting Customer Performance |
    May 29, 2008 2008 Investment Community Meeting 46 Optimizing the Franchise for Debit • Expanding acceptance in debit friendly categories – PayPass – Consumer Bill Pay • Leveraging existing A&M spend for debit – Emphasizing everyday spending categories – Including debit in MasterCard brand advertising |
    May 29, 2008 2008 Investment Community Meeting 47 Expanding Our Role in the Value Chain • Processing – MasterCard IPS • Capturing a Larger Share of PIN – Product Integration • Securing Signature Portfolios – Co-brand Debit • Prepaid |
    May 29, 2008 2008 Investment Community Meeting 48 Supporting Customer Performance • Portfolio Optimization – Segmentation • Debit Rewards & Loyalty – Relationship Rewards |
 May 29, 2008 2008 Investment Community Meeting 49 A Strategy That Covers All the Bases Optimizing the Franchise for Debit Supporting Our Customers’ Performance Expanding Our Role in the Value Chain Driving MasterCard Share in Debit |
 May 29, 2008 Financial Perspective 2008 Investment Community Day Martina Hund-Mejean – Chief Financial Officer |
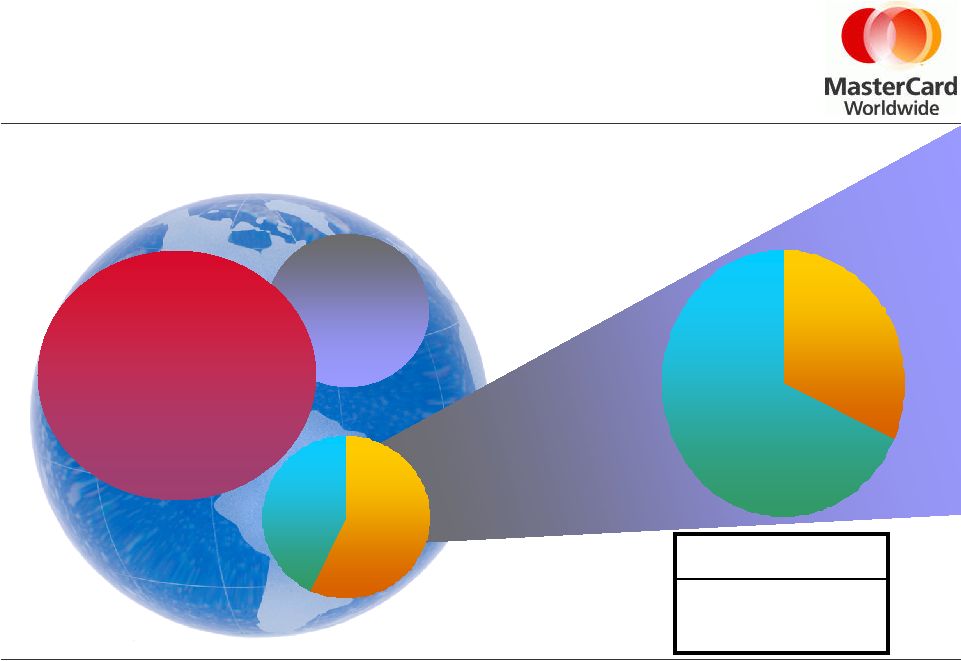 May 29, 2008 2008 Investment Community Meeting 51 Checks 79 B Cash 2, 662 B Global Consumer Payment Transactions 2006-2010 Footnote appears here 2010 Electronic (Card & EFT) 279B 2006 Global Consumer Payments Total 2.9T Source: Speer & Associates, Inc. and MasterCard estimates U.S. 57% R.O.W 43% Electronic (Cards and EFT) 148 B U.S. 32% R.O.W 68% CAGR ’06-10E Region Forecast U.S. 9% Rest of World 22% Global 17% |
 May 29, 2008 2008 Investment Community Meeting 52 $1,248 $1,446 $1,655 $1,922 $2,277 $0 $500 $1,000 $1,500 $2,000 $2,500 2003 2004 2005 2006 2007 0.0% 5.0% 10.0% 15.0% 20.0% 25.0% Worldwide GDV Worldwide % (LC) Worldwide less US % (LC) United States % (LC) (LC) = Local Currency Growth Gross Dollar Volume Trend (2003 – 2007) MasterCard Branded |
 May 29, 2008 2008 Investment Community Meeting 53 15 17 23 27 20 0 5 10 15 20 25 30 2003 2004 2005 2006 2007 0.0% 5.0% 10.0% 15.0% 20.0% 25.0% Worldwide Gross Transactions Worldwide % Worldwide less US % United States % Gross Transaction Trend (2003 – 2007) MasterCard Branded |
 May 29, 2008 2008 Investment Community Meeting 54 2008 View • First eight weeks of the Second Quarter: – Continue to see GDV growth slowing in the U.S. while higher for the ROW, resulting in slightly higher year- over-year GDV growth overall – Cross-border volume remains strong • G&A growth rate expectations remain unchanged • Modest A&M growth also unchanged, with quarterly spending pattern similar to 2006 |
 May 29, 2008 2008 Investment Community Meeting 55 Longer-Term Performance Objectives • Average annual net revenue growth of 12 – 15% • Annual Operating Margin improvement of 3 - 5 ppt • Average annual net income growth of 20 – 30% • Key assumptions – Constant FX rate – Effective tax rate of approximately 35% |
 May 29, 2008 2008 Investment Community Meeting 56 Drivers of Net Revenue • Secular growth • Non-U.S. growing faster than U.S. • U.S. debit vs. credit • Cross border volume • Pricing / Rebates & Incentives • New products and services Impacts: – Gross dollar volume – Purchase volume – Transactions – User-pay services – Revenue yield |
 May 29, 2008 2008 Investment Community Meeting 57 Drivers of Operating Margin • Leveragability of the model • General & Administrative • Capital requirements • Advertising & Marketing programs Impacts: – Operating margin expansion – Net income growth |
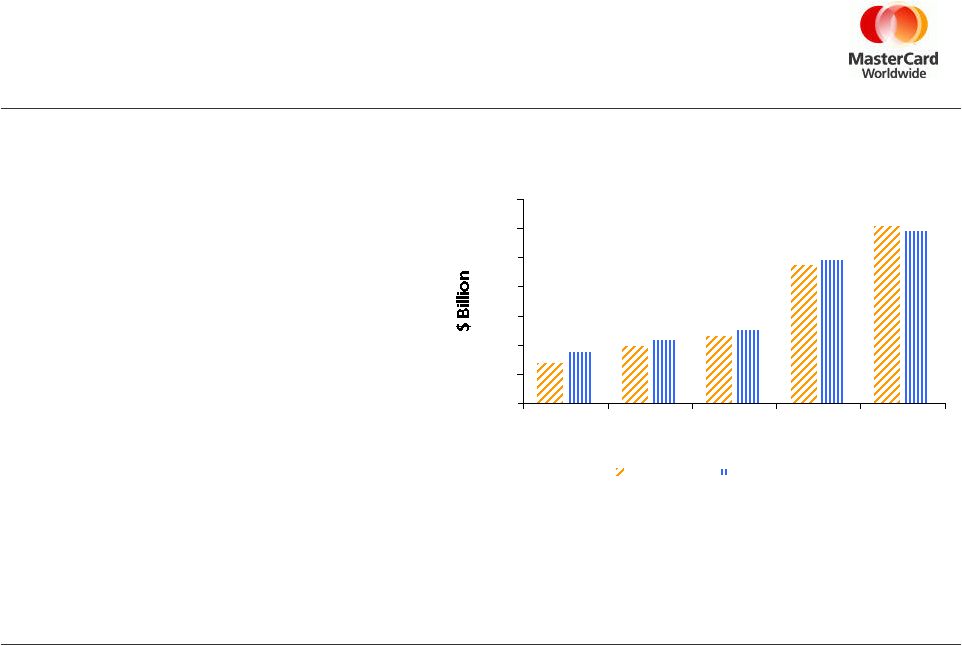 May 29, 2008 2008 Investment Community Meeting 58 0.0 0.5 1.0 1.5 2.0 2.5 3.0 3.5 2003 2004 2005 2006 2007 Book Equity Cash & Investments Strong Capital Position • Strong cash flow generation contributes to healthy balance sheet • Requirement for strong credit position to support settlement guarantee • Litigation constrains capital structure choices • Returning excess cash to shareholders via share repurchases and dividends • 2008 Class B share conversion program now fully subscribed at 13.1 million shares |
 May 29, 2008 2008 Investment Community Meeting 59 Summary • Double-digit net revenue growth for 2008, but GDV growth rates are slowing in the U.S. • Longer-term performance objectives based on secular trends and competitive industry conditions • Growth fueled by strong secular market trends • Global diversity provides buffer against regionalized economic conditions • Investment in the business provides opportunities for future growth • Strong cash flow generation continues to support attractive shareholder returns Strong Business Model Attractive Financial Results |
 |