 MasterCard Incorporated First-Quarter 2009 Financial Results Conference Call May 1, 2009 Exhibit 99.2 |
 2 Business Update • Economic Overview • Business Update • Legal & Regulatory Update |
 3 $ 3.00 $ 398 516 43.6% 666 $ 1,182 1Q 2008 Non-GAAP incl. special items* $ 2.80 $ 367 561 48.6% 595 $ 1,156 1Q 2009 Actual (6.7) Diluted EPS (7.8) Net income (10.8) Total operating expenses 8.9 5.0 ppts Operating income Operating margin (2.2) Net revenue YOY adjusted Growth % 1st Quarter Selected Financial Performance ($ in millions, except percentages and per share data) Note: Figures may not sum due to rounding *See Appendix A for GAAP reconciliations of special items for the three months ended March 31, 2008 |
 4 1st Quarter 2009 MasterCard Branded Volume (GDV & Purchase Volume) Note: Figures may not sum due to rounding APMEA = Asia Pacific / Middle East / Africa $US billions U.S. Dollar Local Currency $US billions U.S. Dollar Local Currency APMEA 103 2.4 16.1 69 0.8 15.0 Canada 19 (19.7) (0.3) 17 (17.9) 1.9 Europe 153 (16.1) 3.9 114 (15.8) 4.2 Latin America 37 (16.0) 7.1 20 (11.4) 10.4 United States 238 (8.0) (8.0) 192 (7.1) (7.1) Worldwide 550 (9.7) 0.3 411 (9.2) 0.3 Purchase Volume Gross Dollar Volume YOY Growth % YOY Growth % |
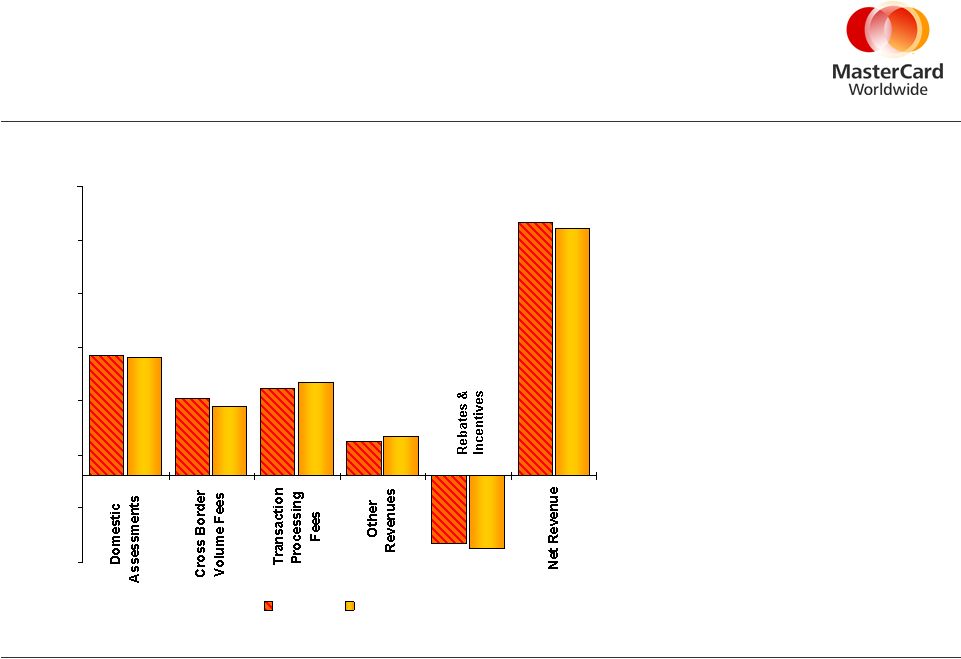 5 • Net Revenue declined 2.2%, but grew 1.8% on a constant currency basis • Domestic Assessments decreased 2.1% • Cross Border Volume Fees declined 11.3% • Transaction Processing Fees grew 7.1% • Other Revenues grew 11.6% • Rebates & Incentives grew 6.6% 1st Quarter Revenue ($ in millions) $565 $362 $407 $164 $1,182 ($316) $1,156 $321 $553 $436 $183 ($337) -$400 -$150 $100 $350 $600 $850 $1,100 $1,350 1Q 2008 1Q 2009 |
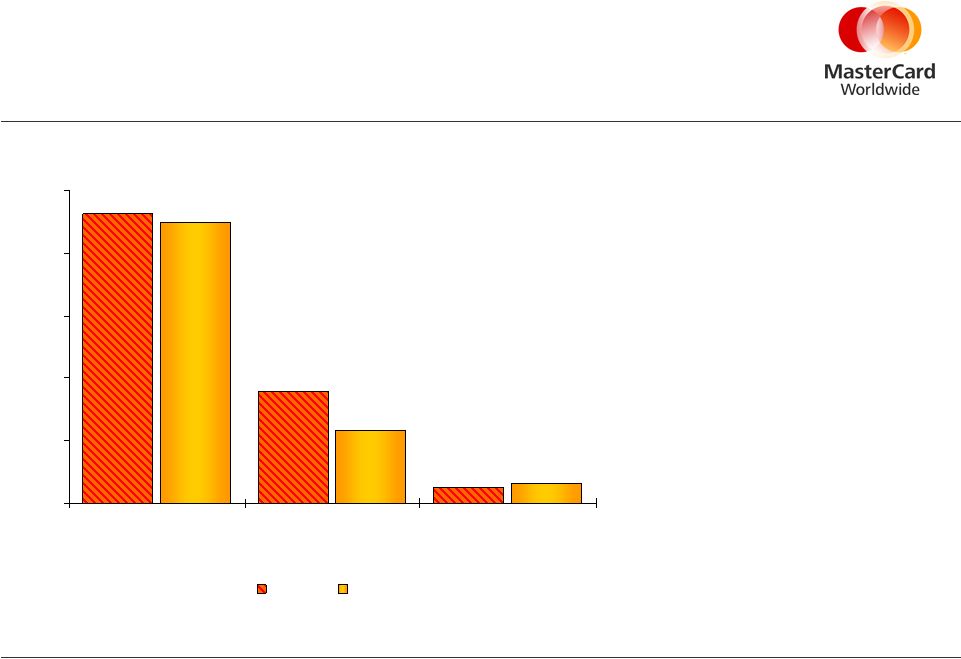 6 1st Quarter Operating Expenses ($ in Millions) • Total operating expenses decreased 10.8%, from $666 to $595 • G&A decreased 3.0% to $448 primarily due to: – Cost-reduction initiatives to reduce travel, personnel and professional fees – Included severance charges of $19 – Favorable foreign currency contributed ~2.6 ppts • A&M decreased 35.4% to $116 primarily due to: – Reductions in response to market conditions and cost containment efforts – Foreign currency contributed ~3.0 ppts to the decrease $462 $180 $25 $116 $448 $31 $0 $100 $200 $300 $400 $500 General & Administrative Advertising & Marketing Depreciation & Amortization 1Q 2008 1Q 2009 |
 7 1st Quarter 2009 Cash Flow Statement and Balance Sheet Highlights Generated $416 million in cash flow from operations for the quarter ended March 31, 2009 Cash, cash equivalents and current available-for-sale securities of $2.3 billion at March 31, 2009 M&A activities – Joint venture with Accor for PrePay Technologies – Increased investment in SPS |
 8 Items for Consideration and 1st Quarter 2009 Business Highlights • Thoughts for 2009 – Net revenue growth expected to be lower than longer-term objective range – Operating expenses expected to be flat to slightly down versus 2008 levels, including impact of all severance charges • Business Highlights – Business retention wins – Mobile |
 9 |
 10 Appendix: GAAP Reconciliations a - Gain from the termination of a customer business agreement b - Amounts have been revised to conform with the adoption of FASB Staff Position EITF 03-06-1 Figures may not sum due to rounding ($ in millions, except per share data) Actual Special Item Non - GAAP Other income (expense), net $ 74 $ 75 (a) $ (1) Total other income 173 75 98 Income before income taxes 689 75 614 Income taxes 242 26 216 Net Income $ 447 $ 49 $ 398 Basic Net Income per Share $ 3.37 (b) $ (0.36) $ 3.01 (b) Diluted Net Income per Share $ 3.37 (b) $ (0.37) $ 3.00 (b) Three Months Ended March 31, 2008 |