 MasterCard Incorporated Second-Quarter 2009 Financial Results Conference Call July 30, 2009 Exhibit 99.2 |
 2 Business Update • Legislative Update • Economic Overview • Business Trends |
 3 $ 2.67 $ 349 558 43.6% 722 $ 1,280 2Q 2009 Non-GAAP excl. special items* $ 2.10 $ 276 416 33.4% 830 $ 1,247 2Q 2008 Non-GAAP excl. special items* $ 2.67 $ 349 557 43.5% 723 $ 1,280 2Q 2009 Actual 27.1 Diluted EPS 26.4 Net income (13.0) Total operating expenses 34.0 10.2 ppts Operating income Operating margin 2.7 Net revenue YOY Non-GAAP Growth % 2nd Quarter Selected Financial Performance ($ in millions, except percentages and per share data) Note: Figures may not sum due to rounding *See Appendix A for GAAP reconciliations of special items for the three months ended June 30, 2009 and June 30, 2008 |
 4 2nd Quarter 2009 MasterCard Branded Volume (GDV & Purchase Volume) Note: Figures may not sum due to rounding APMEA = Asia Pacific / Middle East / Africa $US billions U.S. Dollar Local Currency $US billions U.S. Dollar Local Currency APMEA 114 7.5 17.4 77 6.0 16.3 Canada 23 (16.6) (3.4) 20 (15.5) (2.2) Europe 173 (15.5) 2.1 130 (14.4) 3.0 Latin America 41 (13.2) 7.0 22 (7.8) 11.2 United States 245 (9.7) (9.7) 202 (8.8) (8.8) Worldwide 595 (9.3) (0.6) 450 (8.6) (0.7) Purchase Volume Gross Dollar Volume YOY Growth % YOY Growth % |
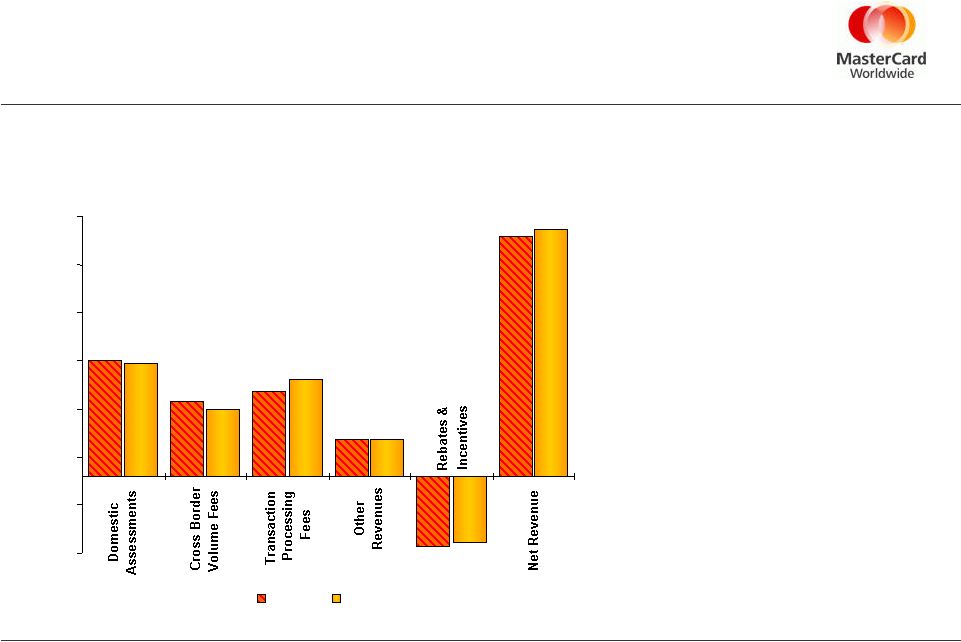 5 • Net Revenue increased 2.7%, and grew 7.0% on a constant currency basis • Domestic Assessments decreased 2.2% • Cross Border Volume Fees declined 9.4% • Transaction Processing Fees grew 14.6% • Other Revenues declined 1.6% • Rebates & Incentives decreased 5.8% 2nd Quarter Revenue ($ in millions) $599 $384 $439 $190 $1,247 ($365) $1,280 ($344) $187 $503 $348 $586 -$400 -$150 $100 $350 $600 $850 $1,100 $1,350 2Q 2008 2Q 2009 |
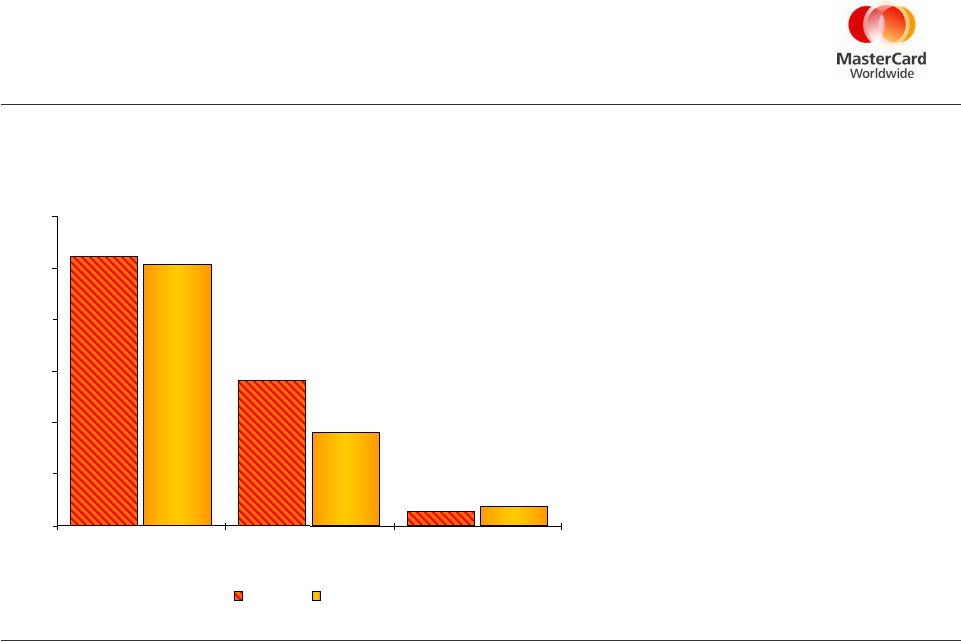 $521 $281 $28 $36 $180 $506 $0 $100 $200 $300 $400 $500 $600 General & Administrative Advertising & Marketing Depreciation & Amortization 2Q 2008 2Q 2009 2nd Quarter Operating Expenses ($ in Millions) • Total operating expenses decreased 13.0%, excluding special items * • G&A, including severance charge of $51, decreased 2.9% primarily due to: • Lower professional fees • Cost-reduction initiatives to reduce travel • Foreign currency contributed ~2.9 ppts to the decrease • A&M decreased 35.8% primarily due to: • Cost containment efforts in response to market conditions • Foreign currency contributed ~3.5 ppts to the decrease * See Appendix A for GAAP reconciliations of special items for the three months ended June 30, 2008 and June 30, 2009 |
 7 2nd Quarter 2009 Cash Flow Statement and Balance Sheet Highlights • Generated $362 million in cash flow from operations for the quarter ended June 30, 2009 • Cash, cash equivalents and current available-for-sale securities of $2.7 billion at June 30, 2009 • Prepayment of $335 million to settle remaining obligations under the 2003 merchant settlement agreement is expected to occur in Third Quarter 2009 |
 8 Items for Consideration and 2nd Quarter Business Highlights • Thoughts for full-year 2009 • Performance objectives for the 2009 - 2011 period • Business Highlights for the second quarter 2009 |
 9 |
 10 Appendix A: GAAP Reconciliations a – Litigation settlement b – Amounts have been revised to conform with the adoption of FASB Staff Position EITF 03-06-1 Figures may not sum due to rounding ($ millions except per share data) Actual Special Item Non -GAAP Actual Special Item Non -GAAP Litigation settlements $ 1 $ (1) a $ - $ 1,649 $ (1,649) a $ - Total operating expenses 723 (1) 722 2,480 (1,649) 830 Operating income (loss) 557 1 558 (1,233) 1,649 416 Operating Margin 43.5% - 43.6% (98.9%) - 33.4% Income (loss) before income taxes 536 1 537 (1,223) 1,649 426 Income taxes (benefit) 187 - 188 (477) 627 150 Net Income (Loss) $ 349 $ - $ 349 $ (747) $ 1,023 $ 276 Basic Net Income (Loss) per Share $2.67 $0.01 $2.68 ($5.70) b $7.80 b $2.10 b Diluted Net Income (Loss) per Share $2.67 - $2.67 ($5.70) b $7.80 b $2.10 b Three Months ended June 30, 2009 Three Months ended June 30, 2008 |
 11 Appendix A (cont.): GAAP Reconciliations Figures may not sum due to rounding Reconciliation to Effective Tax Rate for the American Express Litigation Settlement (In millions, except percentages) Actual Actual Effective Tax Rate Special Item Non- GAAP Non- GAAP Effective Tax Rate Three months ended June 30, 2008: Income (loss) before income taxes $ (1,223) 39.0% $ 1,649 $ 426 35.3% Income tax expense (benefit) (477) 627 150 Net income (loss) $ (747) $ 1,023 $ 276 |