 MasterCard Incorporated Third-Quarter 2009 Financial Results Conference Call November 3, 2009 Exhibit 99.2 |
 2 Business Update • Economic Overview • Business Trends – SpendingPulse – October Operational Performance |
 3 $ 3.48 $ 456 680 49.8% 685 $ 1,364 3Q 2009 Non-GAAP excl. special items* $ 2.46 $ 322 548 41.0% 790 $ 1,338 3Q 2008 Non-GAAP excl. special items* $ 3.45 $ 452 674 49.4% 691 $ 1,364 3Q 2009 Actual 41.5 Diluted EPS 41.6 Net income (13.3) Total operating expenses 24.0 8.8 ppts Operating income Operating margin 2.0 Net revenue YOY Non-GAAP Growth % 3rd Quarter Selected Financial Performance ($ in millions, except percentages and per share data) Note: Figures may not sum due to rounding *See Appendix A for GAAP reconciliations of special items for the three months ended September 30, 2009 and September 30, 2008 |
 4 3rd Quarter 2009 MasterCard Branded Volume (GDV & Purchase Volume) Note: Figures may not sum due to rounding APMEA = Asia Pacific / Middle East / Africa $US billions U.S. Dollar Local Currency $US billions U.S. Dollar Local Currency APMEA 127 15.4 18.2 86 13.6 16.2 Canada 24 (10.2) (5.2) 22 (7.9) (2.7) Europe 190 (9.7) 0.2 143 (8.0) 1.6 Latin America 45 (6.4) 11.1 25 (1.1) 12.0 United States 247 (8.0) (8.0) 204 (6.5) (6.5) Worldwide 633 (4.7) 0.3 480 (3.7) 0.4 Purchase Volume Gross Dollar Volume YOY Growth % YOY Growth % |
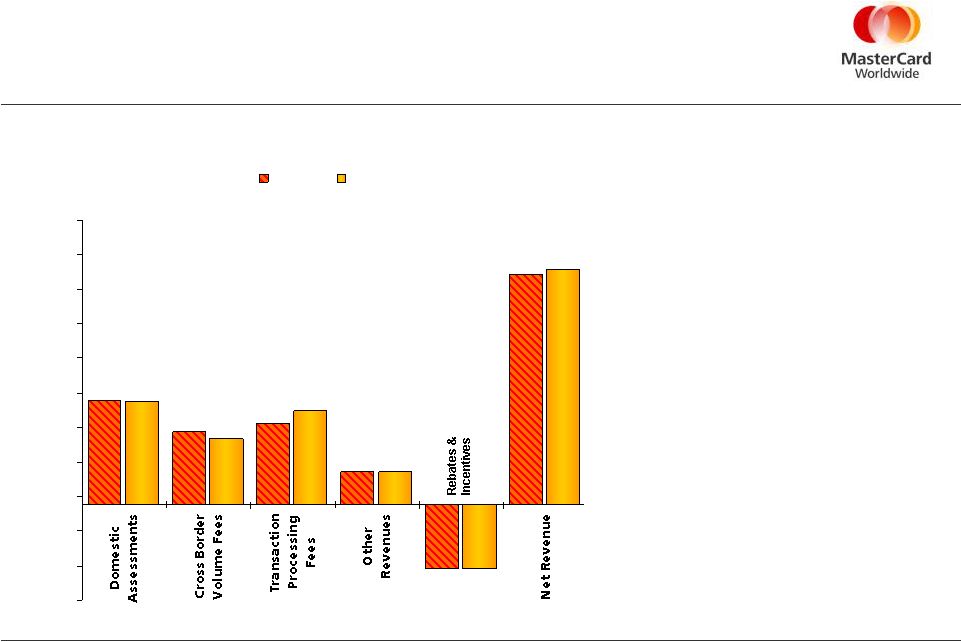 5 $611 $427 $469 $194 ($363) $1,338 $603 $386 $546 $192 ($363) $1,364 -$550 -$350 -$150 $50 $250 $450 $650 $850 $1,050 $1,250 $1,450 $1,650 3Q 2008 3Q 2009 • Net Revenue increased 2.0%, and grew 3.9% on a constant currency basis • Domestic Assessments decreased 1.3% • Cross Border Volume Fees declined 9.6% • Transaction Processing Fees grew 16.4% • Other Revenues declined 1.0% • Rebates & Incentives were flat 3rd Quarter Revenue ($ in millions) |
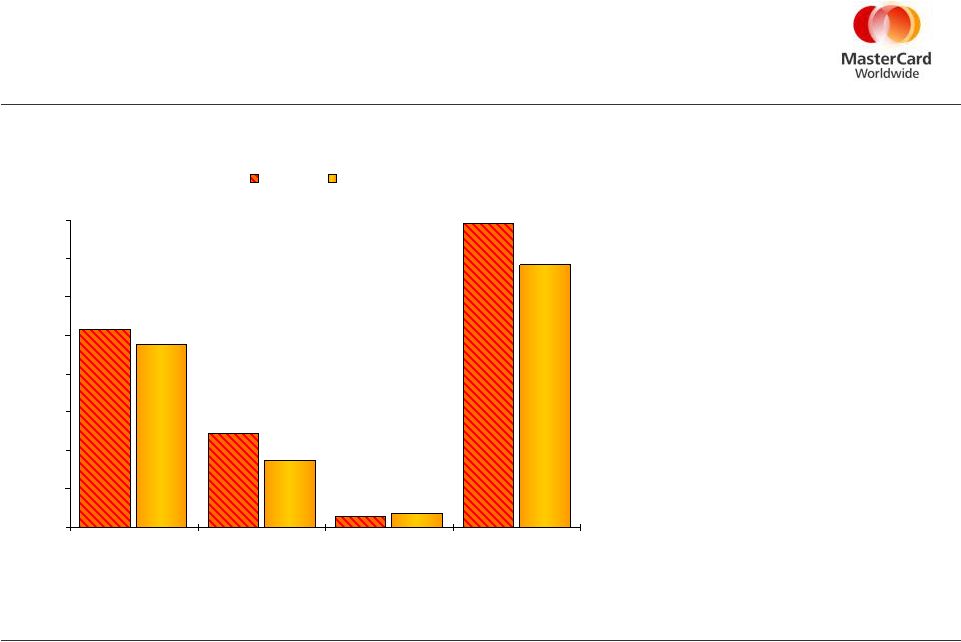 6 3rd Quarter Operating Expenses ($ in millions) • Total operating expenses decreased 13.3%, excluding special items * • G&A, including severance of $31, decreased 7.9% primarily due to: • Lower professional fees • T&E cost-reduction initiatives • Foreign currency contributed ~1.1ppts to the decrease • A&M decreased 29.4% primarily due to: • Slower redeployment of funds • Foreign currency contributed ~1.5 ppts to the decrease $515 $246 $29 $790 $474 $174 $36 $685 $0 $100 $200 $300 $400 $500 $600 $700 $800 General & Administrative Advertising & Marketing Depreciation & Amortization Total Operating Expenses 3Q 2008 3Q 2009 *See Appendix A for GAAP reconciliations of special items for the three months ended September 30, 2008 and September 30, 2009 |
 7 3rd Quarter 2009 Cash Flow Statement and Balance Sheet Highlights • Generated $316 million in cash flow from operations for the quarter ended 09/30/2009 • Cash, cash equivalents and current available-for-sale securities of $2.9 billion at 09/30/2009 • Executed $335 million prepayment to settle remaining obligations under the 2003 merchant settlement agreement • Intend to file universal shelf registration statement in November 2009 |
 8 Items for Consideration and 3rd Quarter Business Highlights • Thoughts for Q4 and full-year 2009 – Net Revenue – Operating Expenses General & Administrative Advertising & Marketing – Tax Rate • Business Highlights for the third quarter 2009 |
 9 |
 10 Appendix A: GAAP Reconciliations ($ millions except percentages and per share data) Actual Special Items Non -GAAP Actual Special Item Non -GAAP Litigation settlements $ $ a $ - $ 828 $ (828) a $ - Total operating expenses 685 1,617 (828) 790 Operating income (loss) 680 (279) 828 548 Operating Margin 49.8% (20.9%) 41.0% Income (loss) before income taxes 680 (294) 828 534 Income taxes (benefit) 224 (100) 312 212 Net Income (Loss) $ $ $ 456 $ (194) $ 516 $ 322 Basic Net Income (Loss) per Share $3.46 $0.03 $3.49 ($1.48) b $3.94 $2.46 b Diluted Net Income (Loss) per Share $3.45 $0.03 $3.48 ($1.48) b $3.94 $2.46 b Three Months ended September 30, 2009 Three Months ended September 30, 2008 a – Litigation settlements b – Amounts have been revised in accordance with the adoption of a new earnings per share accounting standard related to instruments granted in share- based payment transactions on January 1, 2009. Figures may not sum due to rounding 6 691 674 49.4% 673 221 452 (6) (6) 6 6 2 4 |
 11 Appendix A (cont.): GAAP Reconciliations Figures may not sum due to rounding Reconciliation to Effective Tax Rate (In millions, except percentages) Actual Actual Effective Tax Rate Special Item Non- GAAP Non GAAP Effective Tax Rate Three months ended September 30, 2008: Income (loss) before income taxes $ (294) 34.1% $ 828 $ 534 39.7% Income tax expense (benefit) (100) 312 212 Net income (loss) $ (194) $ 516 $ 322 |