 MasterCard Incorporated Fourth-Quarter and Full-Year 2009 Financial Results Conference Call February 4, 2010 Exhibit 99.2 |
 2 Business Update • Economic Overview • Business Trends – SpendingPulse – January Operational Performance |
 3 $ 1.85 $ 243 468 38.2% 756 $ 1,225 4Q 2008 Non-GAAP excl. special items* $ 2.24 $ 294 468 36.1% 830 $ 1,298 4Q 2009 Actual 21.1 Diluted EPS 20.9 Net income 9.8 Total operating expenses - (2.1) ppts Operating income Operating margin 6.0 Net revenue YOY Non-GAAP Growth % 4th Quarter Selected Financial Performance ($ in millions, except per share data) Note: Figures may not sum due to rounding *See Appendix A for GAAP reconciliations of special items for the three months ended December 31, 2008 |
 4 4th Quarter 2009 MasterCard Branded Volume (GDV & Purchase Volume) Note: Figures may not sum due to rounding APMEA = Asia Pacific / Middle East / Africa $US billions U.S. Dollar Local Currency $US billions U.S. Dollar Local Currency APMEA 141 33.7 20.3 95 33.3 18.6 Canada 26 13.2 (1.6) 24 17.0 1.7 Europe 205 15.6 6.9 154 17.4 8.1 Latin America 54 21.1 12.1 31 29.5 12.9 United States 248 (3.4) (3.4) 207 (1.3) (1.3) Worldwide 674 11.0 5.3 510 11.9 5.7 Purchase Volume Gross Dollar Volume YOY Growth % YOY Growth % |
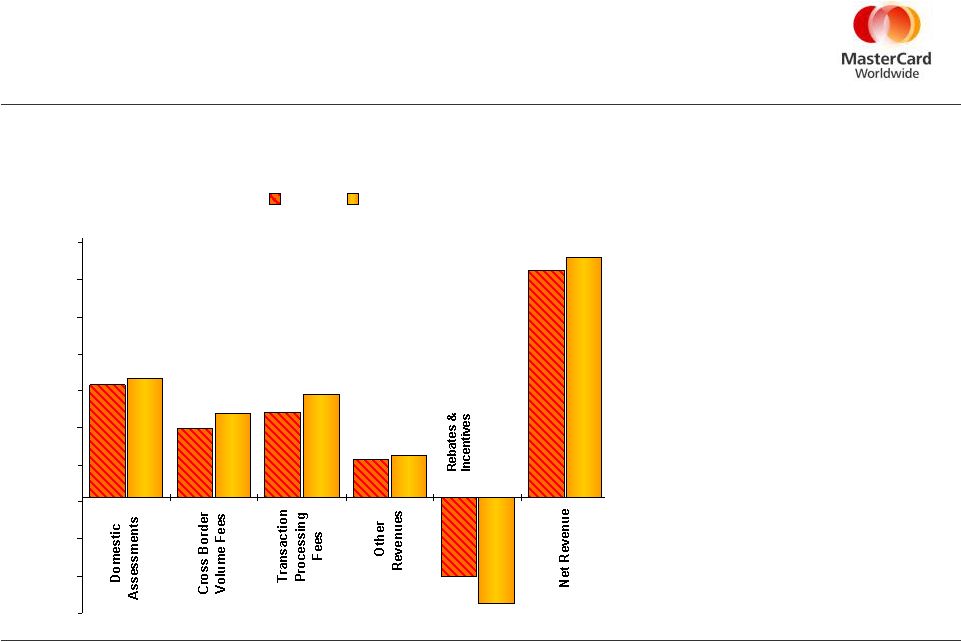 5 $610 $374 $462 $204 ($425) $1,225 $640 $454 $556 $222 ($574) $1,298 -$625 -$425 -$225 -$25 $175 $375 $575 $775 $975 $1,175 $1,375 4Q 2008 4Q 2009 • Net Revenue increased 6.0%, and grew 2.2% on a constant currency basis • Domestic Assessments increased 4.9% • Cross Border Volume Fees increased 21.4% • Transaction Processing Fees grew 20.3% • Other Revenues increased 8.8% • Rebates & Incentives increased 35.1% 4th Quarter Revenue ($ in millions) |
 6 4th Quarter Operating Expenses ($ in millions) • Total operating expenses increased 9.8%, or 6.6% on a constant currency basis * • G&A increased 1.6% primarily due to: • Severance-related charges of $38 million • Foreign currency contributed ~2.3 ppts to the increase • A&M increased 25.1% primarily due to: • Investments in priority countries • Foreign currency contributed ~5.4 ppts to the increase * See Appendix A for GAAP reconciliations of special items for the three months and twelve months ended December 31, 2008 and 2009 $228 $30 $498 $756 $830 $38 $285 $507 $0 $100 $200 $300 $400 $500 $600 $700 $800 General & Administrative Advertising & Marketing Depreciation & Amortization Total Operating Expenses 4Q 2008 4Q 2009 |
 7 Full-Year 2009 Highlights • Delivered full-year net income of $1.5 billion and diluted EPS of $11.19 * • Achieved full-year net revenue of $5.1 billion – Growth of 2.1%, or 3.9% on a constant currency basis – Primarily due to pricing adjustments of approx. 6 ppts. – Partially offset by impact of cross-border growth ** and higher rebates and incentives • Total operating expenses declined 6.9% * , or 10.5% excluding severance • Improved operating margin by 5.5 ppts., to 44.5% * ** On a U.S. dollar basis *See Appendix A for GAAP reconciliations of special items for the twelve months ended December 31, 2008 and 2009 |
 8 4 Quarter 2009 Cash Flow Statement and Balance Sheet Highlights • Generated $284 million in cash flow from operations for the quarter ended 12/31/2009 • Cash, cash equivalents and current available-for-sale securities of $2.9 billion at 12/31/2009 • Class B share 2010 programs th |
 9 2010 Outlook and Business Highlights • Thoughts for 2010 – Net Revenue – Total Operating Expenses General & Administrative Advertising & Marketing – Tax rate – Operating margin and net income growth • Business Highlights for the fourth quarter 2009 |
 10 |
 11 Appendix A: GAAP Reconciliations ($ in millions, except per share data) a – Litigation settlements b – Amounts have been revised in accordance with the adoption of a new earnings per share accounting standard related to instruments granted in share-based payment transactions on January 1, 2009. Figures may not sum due to rounding Three months ended December 31, 2009 Three months ended December 31, 2008 Actual Special Items Non - GAAP Actual Special Items Non - GAAP Litigation settlements $ - $ - $ - $ 6 $ 6 a $ - Total operating expenses 830 - 830 762 6 756 Operating income 468 - 468 462 6 468 Operating Margin 36.1% 36.1% 37.7% 38.2% Income before income taxes 458 - 458 445 6 451 Income taxes 164 - 164 206 2 208 Net Income $ 294 $ - $ 294 $ 239 $ 4 $ 243 Basic Net Income per Share $2.25 - $2.25 $1.83 b $0.03 $1.86 b Diluted Net Income per Share $2.24 - $2.24 $1.83 b $0.02 $1.85 b |
 12 Appendix A (cont.): GAAP Reconciliations ($ in millions, except per share data) a – Litigation settlements b – Gain from the termination of a customer business agreement c – Amounts have been revised in accordance with the adoption of a new earnings per share accounting standard related to instruments granted in share-based payment transactions on January 1, 2009. Figures may not sum due to rounding For the year ended December 31, 2009 For the year ended December 31, 2008 Actual Special Items Non - GAAP Actual Special Items Non - GAAP Litigation settlements $ 7 $ 7 a $ - $ 2,483 $ 2,483 a $ - Total operating expenses 2,839 7 2,832 5,526 2,483 3,043 Operating income (loss) 2,260 7 2,267 (535) 2,483 1,948 Operating Margin 44.3% 44.5% (10.7%) 39.0% Other income (expense), net 15 - 15 72 75 b (3) Total other income (expense) (42) - (42) 151 75 76 Income (loss) before income taxes 2,218 7 2,225 (383) 2,408 2,025 Income taxes (benefit) 755 2 758 (129) 914 785 Net Income (Loss) $ 1,463 $ 4 $ 1,467 $ (254) $ 1,494 $ 1,239 Basic Net Income (Loss) per Share $11.19 $0.04 $11.23 $ (1.94) c $11.39 $9.45 c Diluted Net Income (Loss) per Share $11.16 $0.03 $11.19 $ (1.94) c $11.35 $9.41 c |
 13 Appendix B: 4th Quarter Revenue Detail 6.0% $ 74 $1,225 $1,298 Net revenues (35.1) (149) (425) (574) Rebates and incentives 13.5 223 1,650 1,873 Gross revenues 8.8 18 204 222 Other revenues 20.3 94 462 556 Transaction processing fees 21.4 81 374 454 Cross border volume fees 4.9% $30 $610 $640 Domestic assessments 2009 vs. 2008 2009 vs. 2008 2008 2009 Percent Increase (Decrease) Dollar Increase (Decrease) For the three months ended December 31, ($ in millions) Figures may not sum due to rounding |
 14 Appendix C: 4th Quarter G&A Detail 1.6% $8 $499 $507 General and administrative expenses (30.1) ( 22) 73 51 Other 7.7 1 13 14 Travel and entertainment 4.5 1 22 23 Data processing (10.5) (2) 19 17 Telecommunications 4.0 2 50 52 Professional fees 8.7% $28 $322 $350 Personnel 2009 vs. 2008 2009 vs. 2008 2008 2009 Percent Increase (Decrease) Dollar Increase (Decrease) For the three months ended December 31, ($ in millions) Figures may not sum due to rounding |