Exhibit 99.2
MasterCard Incorporated
Fourth-Quarter and Full-Year 2010 Financial Results Conference Call
February 3, 2011
Business Update
Operational Overview
Regulatory Update
Business Highlights
2
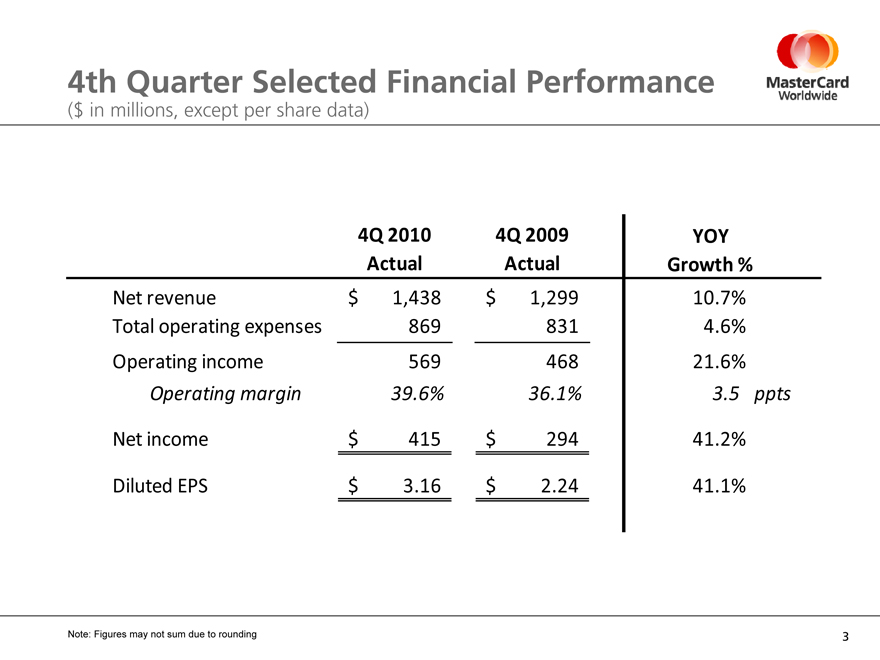
4th Quarter Selected Financial Performance
($ in millions, except per share data)
4Q 2010 4Q 2009 YOY
Actual Actual Growth %
Net revenue $ 1,438 $ 1,299 10.7%
Total operating expenses 869 831 4.6%
Operating income 569 468 21.6%
Operating margin 39.6% 36.1% 3.5 ppts
Net income $ 415 $ 294 41.2%
Diluted EPS $ 3.16 $ 2.24 41.1%
Note: Figures may not sum due to rounding
3
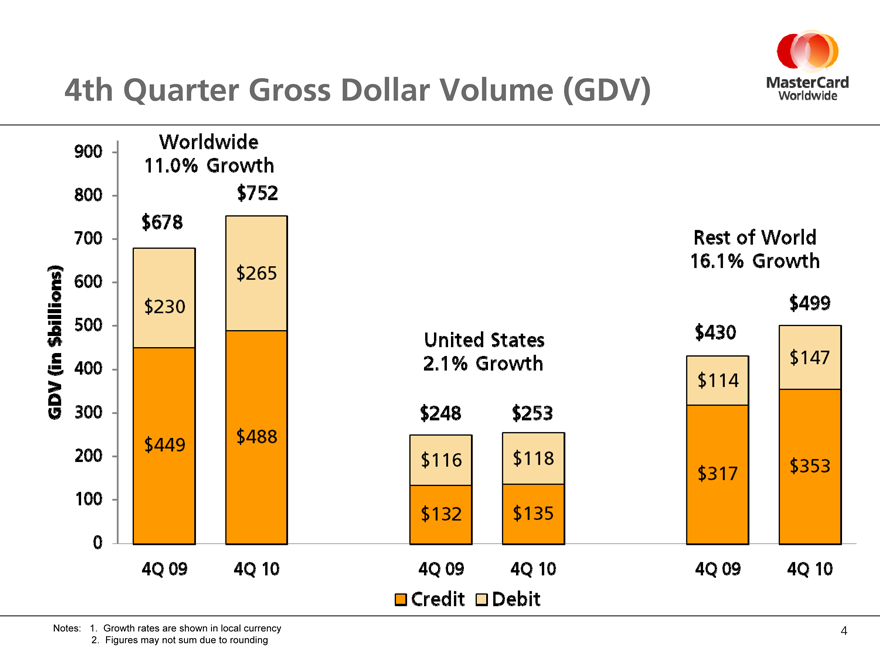
4th Quarter Gross Dollar Volume (GDV)
900
800
700
600
500
400
300
200
100
0
4Q 09
4Q 10
Worldwide 11.0% Growth
$678
$752
$230
$265
$449
$488
United States 2.1% Growth
$248
$253
$132
$135
$116
$118
4Q 09
4Q 10
Rest of World 16.1% Growth
$430
$499
$317
$353
$114
$147
4Q 09
4Q 10
Credit
Debit
GDV (in $billions)
Notes: 1. Growth rates are shown in local currency
2. Figures may not sum due to rounding
4
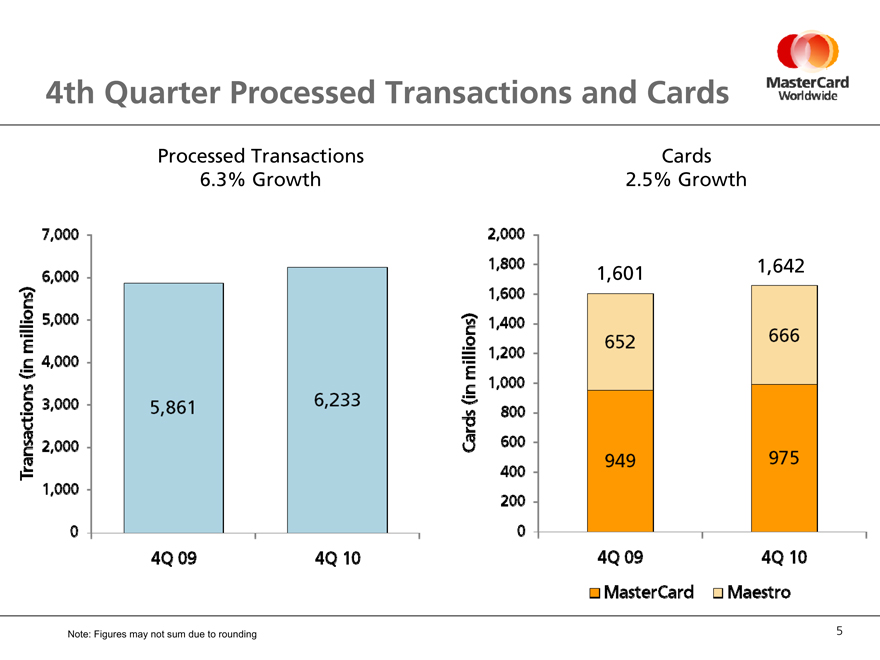
4th Quarter Processed Transactions and Cards
Processed Transactions 6.3% Growth
Transactions (in million)
7,000
6,000
5,000
4,000
3,000
2,000
1,000
0
5,861
6,233
4Q 09
4Q 10
2,000
1,800
1,600
1,400
1,200
1,000
800
600
400
200
0
Cards 2.5% Growth
1,601
1,642
652
666
949
975
4Q 09
4Q 10
MasterCard
Maestro
Cards (in millions)
Note: Figures may not sum due to rounding
5
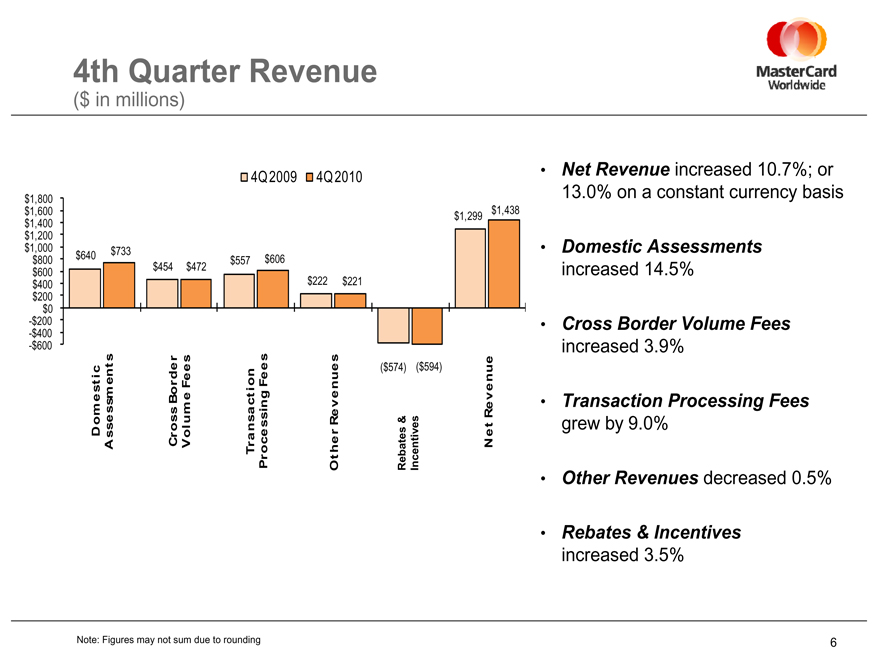
4th Quarter Revenue
($ in millions)
$1,800 $1,600 $1,400 $1,200 $1,000 $800 $600 $400 $200 $0
-$200
-$400
-$600
4Q 2009 4Q 2010
$640 $733 $557 $606 $454 $472 $222 $221
$1,438 $1,299
($574) ($594)
Net Revenue increased 10.7%; or 13.0% on a constant currency basis
Domestic Assessments increased 14.5%
Cross Border Volume Fees increased 3.9%
Transaction Processing Fees grew by 9.0%
Other Revenues decreased 0.5%
Rebates & Incentives increased 3.5%
Domestic Assessments
Cross Border Volume Fees
Transaction Processing Fees
Other Revenues
Rebates & Incentives
Net Revenue
Note: Figures may not sum due to rounding
6
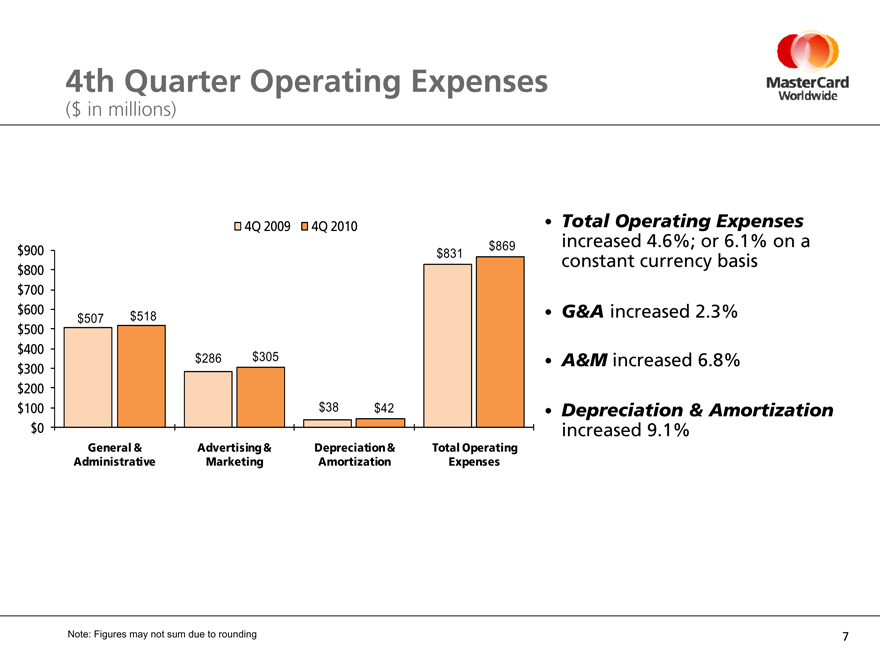
4th Quarter Operating Expenses
($ in millions)
$900 $800 $700 $600 $500 $400 $300 $200 $100 $0
$507 $518
4Q 2009 4Q 2010
$286 $305
$38 $42
$869 $831
General & Administrative
Advertising & Marketing
Depreciation & Amortization
Total Operating Expenses
Total Operating Expenses increased 4.6%; or 6.1% on a constant currency basis
G&A increased 2.3%
A&M increased 6.8%
Depreciation & Amortization increased 9.1%
Note: Figures may not sum due to rounding
7
Full-Year 2010 Highlights
Achieved net revenue of $5.5 billion
Growth of 8.6%, or 9.5% on a constant currency basis Increased operating income by 21.8%
Operating margin of 49.7% Delivered net income of $1.8 billion
Growth of 26.2%, or 27.9% on a constant currency basis Diluted EPS of $14.05
8
4th Quarter 2010 Cash Flow Statement and Balance Sheet Highlights
Generated $670 million in cash flow from operations for the quarter ended 12/31/2010
Cash, cash equivalents and other liquid investments of $4.2 billion at 12/31/2010
9
Looking Ahead
Business update through January 28
Thoughts for 2011
Long-term objectives: 2011-2013
10

MasterCard
Worldwide
The Heart of Commerce TM
11
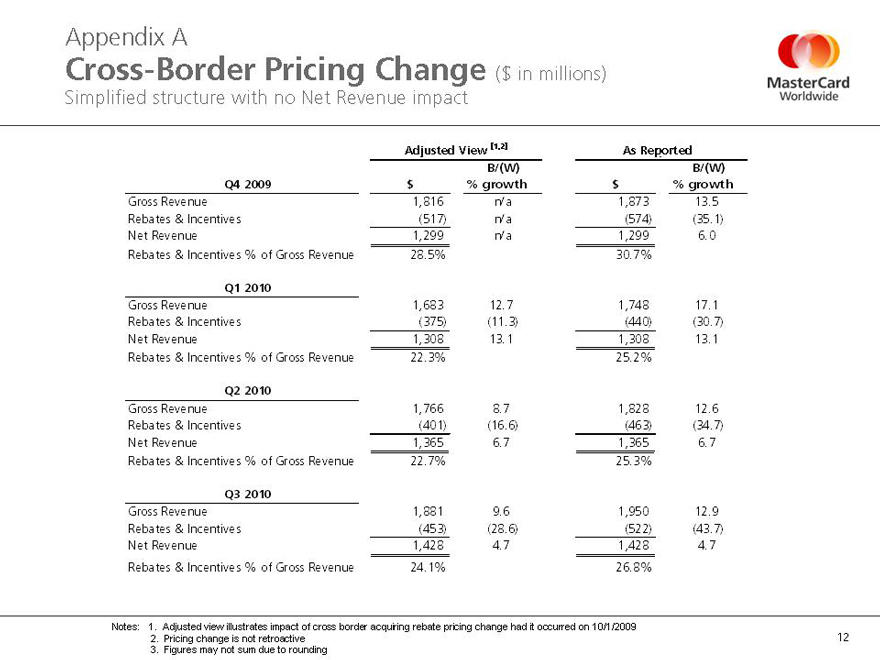
Appendix A
Cross-Border Pricing Change ($ in millions)
($ in millions) Simplified structure with no Net Revenue impact
Adjusted View [1,2] As Reported
B/(W) B/(W)
Q4 2009 $% growth $% growth
Gross Revenue 1,816 n/a 1,873 13.5
Rebates & Incentives(517) n/a(574)(35.1)
Net Revenue 1,299 n/a 1,299 6.0
Rebates & Incentives % of Gross Revenue 28.5% 30.7%
Q1 2010
Gross Revenue 1,683 12.7 1,748 17.1
Rebates & Incentives(375)(11.3)(440)(30.7)
Net Revenue 1,308 13.1 1,308 13.1
Rebates & Incentives % of Gross Revenue 22.3% 25.2%
Q2 2010
Gross Revenue 1,766 8.7 1,828 12.6
Rebates & Incentives(401)(16.6)(463)(34.7)
Net Revenue 1,365 6.7 1,365 6.7
Rebates & Incentives % of Gross Revenue 22.7% 25.3%
Q3 2010
Gross Revenue 1,881 9.6 1,950 12.9
Rebates & Incentives (453) (28.6) (522) (43.7)
Net Revenue 1,428 4.7 1,428 4.7
Rebates & Incentives % of Gross Revenue 24.1% 26.8%
Notes: 1. Adjusted view illustrates impact of cross border acquiring rebate pricing change had it occurred on 10/1/2009
2. Pricing change is not retroactive
3. Figures may not sum due to rounding
12
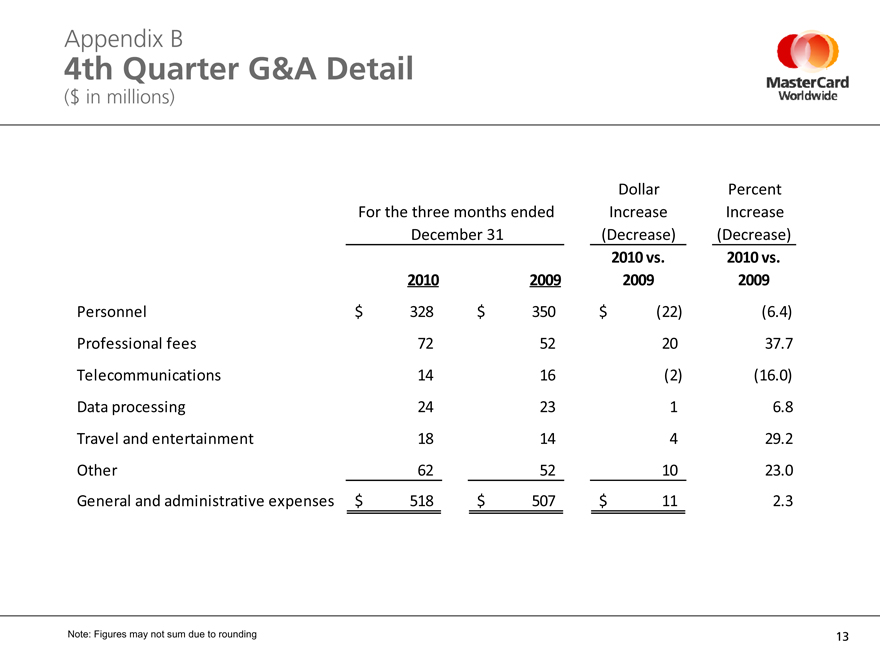
Appendix B
4th Quarter G&A Detail
($ in millions)
Dollar Percent
For the three months ended Increase Increase
December 31 (Decrease)(Decrease)
2010 vs. 2010 vs.
2010 2009 2009 2009
Personnel $ 328 $350 $ (22)(6.4)
Professional fees 72 52 20 37.7
Telecommunications 14 16(2)(16.0)
Data processing 24 23 1 6.8
Travel and entertainment 18 14 4 29.2
Other 62 52 10 23.0
General and administrative expenses $ 518 $507 $ 11 2.3
Note: Figures may not sum due to rounding
13