Exhibit 99.2
Exhibit 99.2
MasterCard Incorporated
Fourth-Quarter and Full-Year 2011 Financial Results Conference Call
February 2, 2012
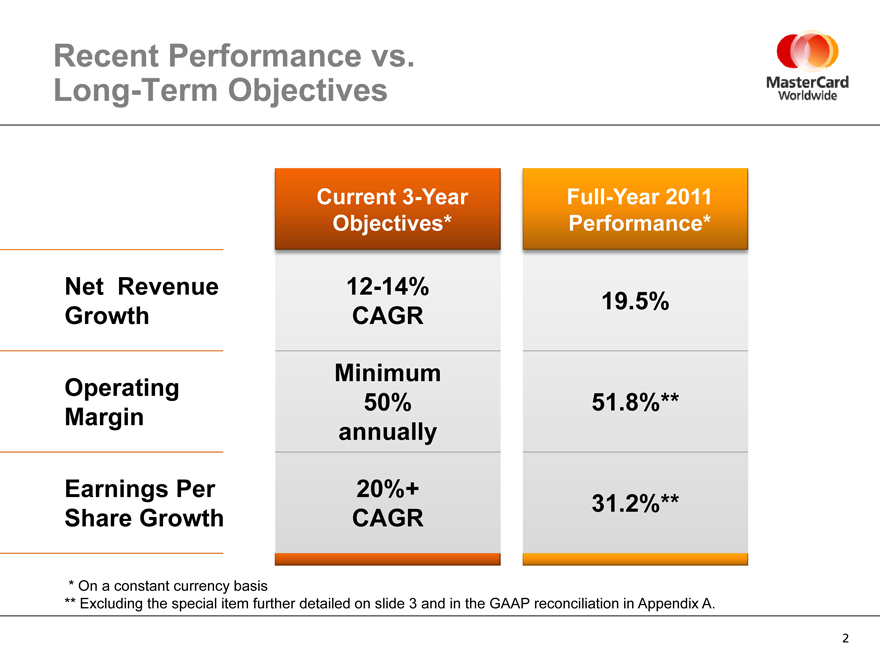
Recent Performance vs. Long-Term Objectives
Net Revenue Growth
Operating Margin
Earnings Per Share Growth
Current 3-Year Full-Year 2011
Objectives* Performance*
12-14% 19.5%
CAGR
Minimum
50% 51.8%**
annually
20%+
CAGR 31.2%**
* | | On a constant currency basis |
** Excluding the special item further detailed on slide 3 and in the GAAP reconciliation in Appendix A.
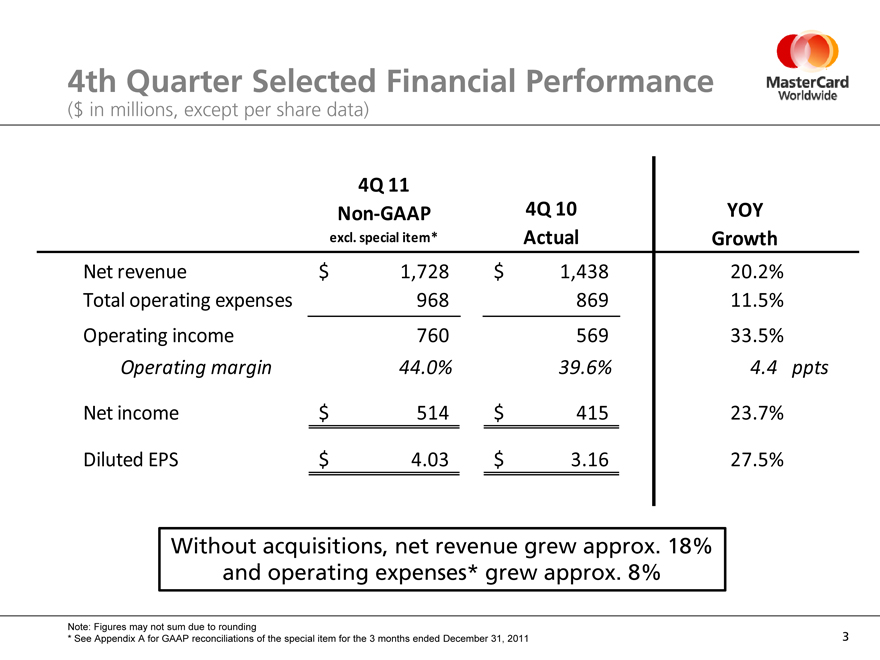
4th Quarter Selected Financial Performance
($ in millions, except per share data)
4Q 11
Non-GAAP 4Q 10 YOY
excl. special item* Actual Growth
Net revenue $ 1,728 $ 1,438 20.2%
Total operating expenses 968 869 11.5%
Operating income 760 569 33.5%
Operating margin 44.0% 39.6% 4.4 ppts
Net income $ 514 $ 415 23.7%
Diluted EPS $ 4.03 $ 3.16 27.5%
Without acquisitions, net revenue grew approx. 18% and operating expenses* grew approx. 8%
Note: Figures may not sum due to rounding
* | | See Appendix A for GAAP reconciliations of the special item for the 3 months ended December 31, 2011 |
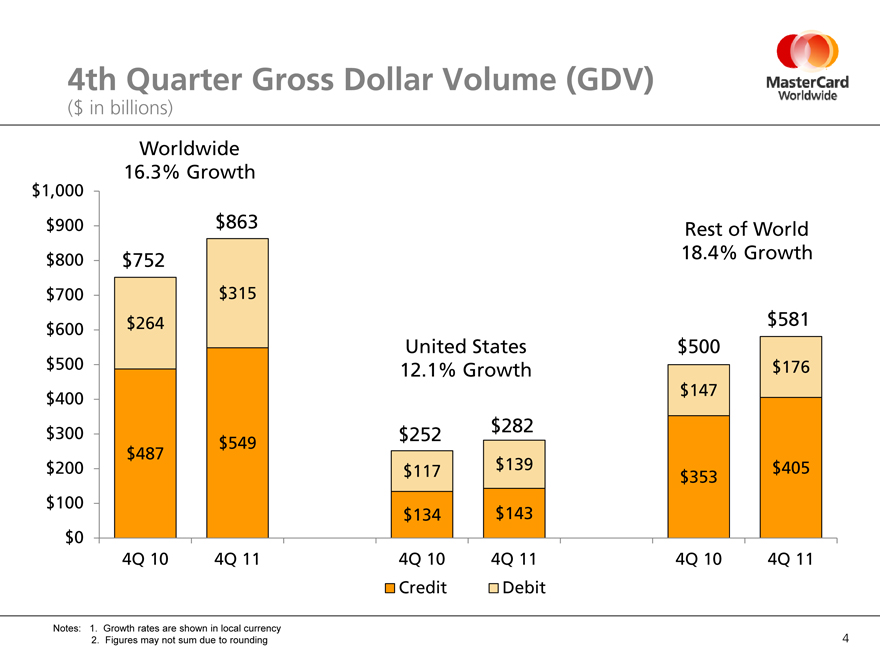
4th Quarter Gross Dollar Volume (GDV)
($ in billions)
Worldwide
16.3% Growth
$1,000
$900 $863 Rest of World
$800 $752 18.4% Growth
$700 $315
$600 $264 $581
United States $500
$500 12.1% Growth $176
$400 $147
$300 $252 $282
$549
$487
$200 $117 $139 $353 $405
$100
$134 $143
$0
4Q 10 4Q 11 4Q 10 4Q 11 4Q 10 4Q 11
Credit Debit
Notes: 1. Growth rates are shown in local currency
2. Figures may not sum due to rounding
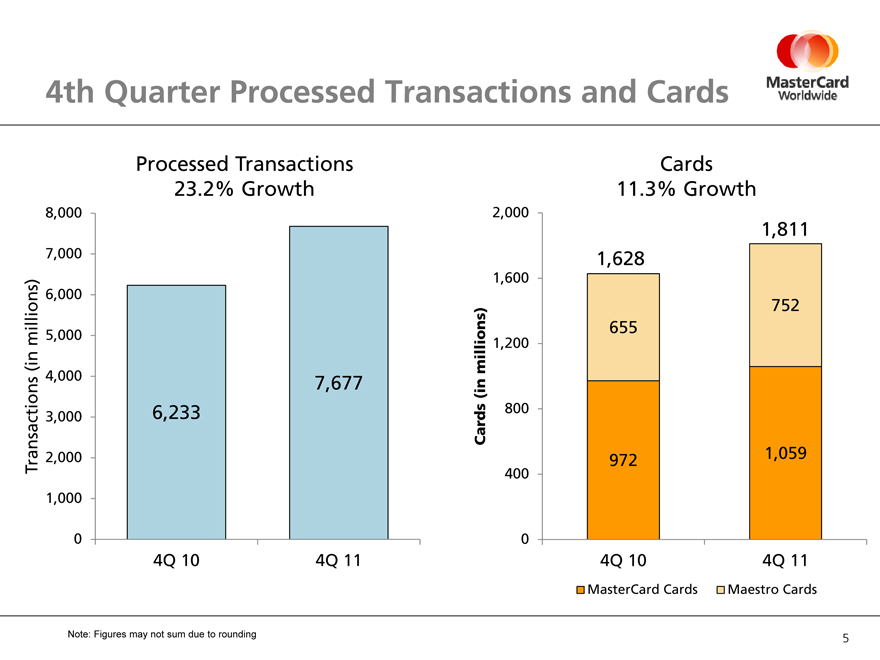
4th Quarter Processed Transactions and Cards
Processed Transactions
23.2% Growth
Cards
11.3% Growth
8,000 2,000
1,811
7,000 1,628
1,600
6,000
752
millions) 5,000 655
1,200
(in millions)
4,000
7,677 (in
3,000 6,233 Cards 800
transactions 2,000 972 1,059
T 400
1,000
0 0
4Q 10 4Q 11 4Q 10 4Q 11
MasterCard Cards Maestro Cards
Note: Figures may not sum due to rounding
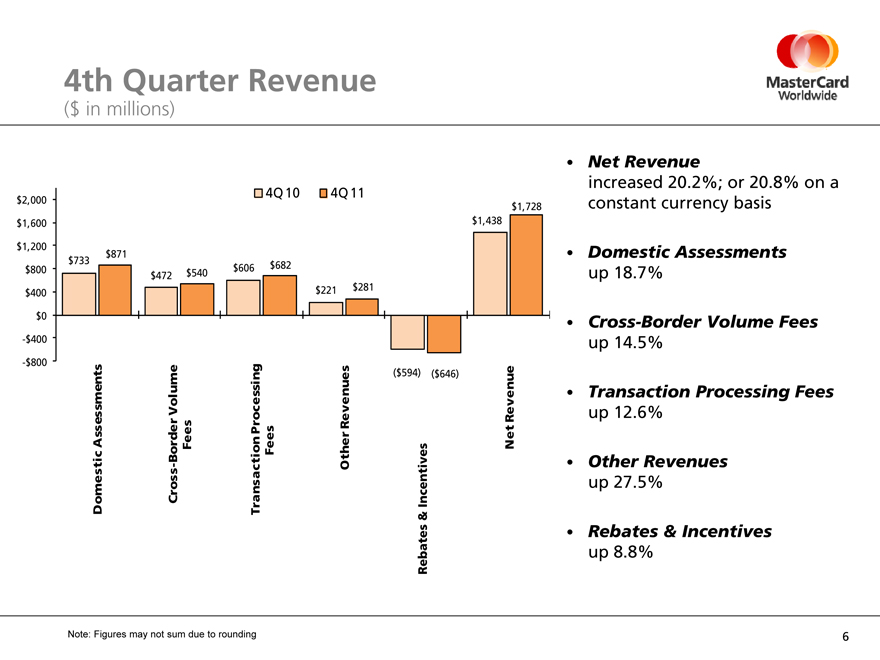
4th Quarter Revenue
($ in millions)
$2,000 $1,600 $1,200 $800 $400 $0
-$400
-$800
$871 $733 $540 $606 $682 $472 $221 $281
4Q 10 4Q 11
$1,728 $1,438
($594) ($646)
Domestic Assessments
Cross-Border Volume Fees
Transaction Processing Fees
Other Revenues
Rebates & Incentives
Net Revenue
Net Revenue increased 20.2%; or 20.8% on a constant currency basis
Domestic Assessments up 18.7%
Cross-Border Volume Fees up 14.5%
Transaction Processing Fees up 12.6%
Other Revenues up 27.5%
Rebates & Incentives up 8.8%
Note: Figures may not sum due to rounding
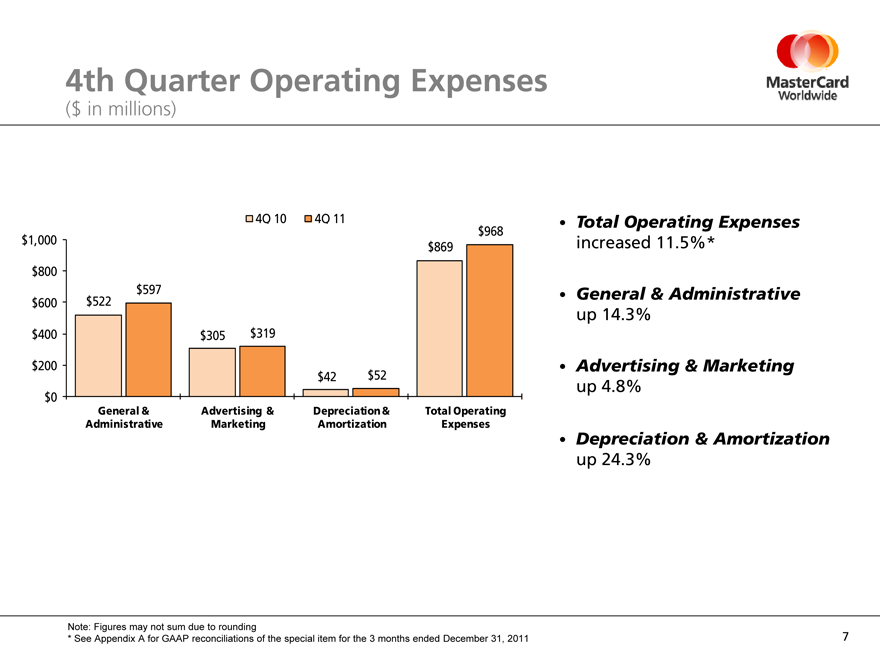
4th Quarter Operating Expenses
($ in millions)
$1,000 $800 $600 $400 $200 $0
$597 $522
$305 $319
$42 $52
$968 $869
4Q 10 4Q 11
General & Advertising & Depreciation & Total Operating Administrative Marketing Amortization Expenses
Total Operating Expenses increased 11.5%*
General & Administrative up 14.3%
Advertising & Marketing up 4.8%
Depreciation & Amortization up 24.3%
Note: Figures may not sum due to rounding
* | | See Appendix A for GAAP reconciliations of the special item for the 3 months ended December 31, 2011 |
4th Quarter Cash Flow Statement and Balance Sheet Highlights
Cash flow from operations of $784 million in 4Q11
Cash, cash equivalents and other liquid investments of $4.9 billion at December 31, 2011
Share Repurchase Activity
4Q11: 84,300 shares (cost of $30 million) FY11: 4.4 million shares (cost of $1.1 billion)
1Q12, through January 27: 304,600 shares (cost of $106 million) As of January 27, remaining authorization: $746 million
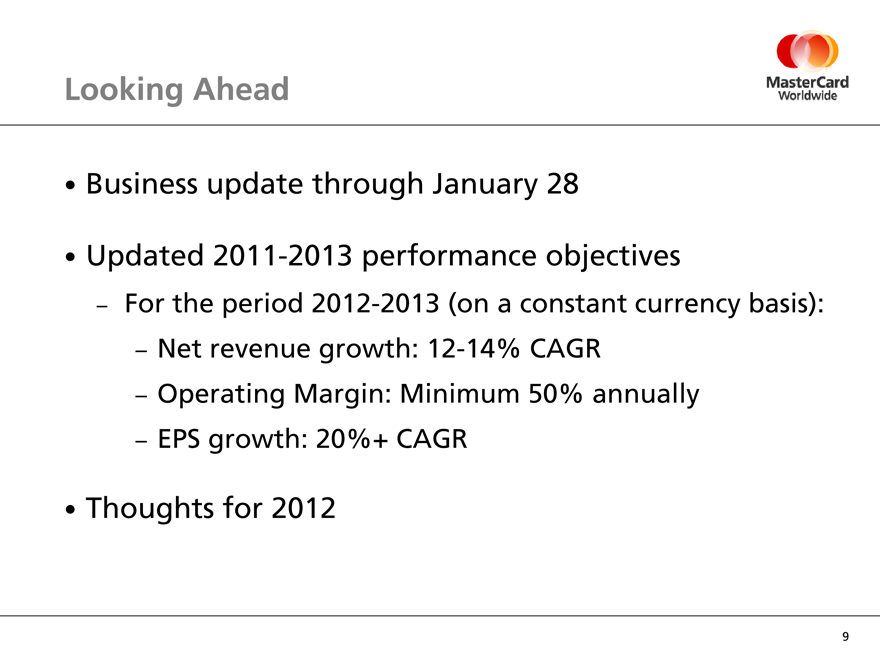
Looking Ahead
Business update through January 28
Updated 2011-2013 performance objectives
For the period 2012-2013 (on a constant currency basis):
Net revenue growth: 12-14% CAGR Operating Margin: Minimum 50% annually EPS growth: 20%+ CAGR
Thoughts for 2012
9

Mastercard Worldwide
The Heart of CommerceTM
10
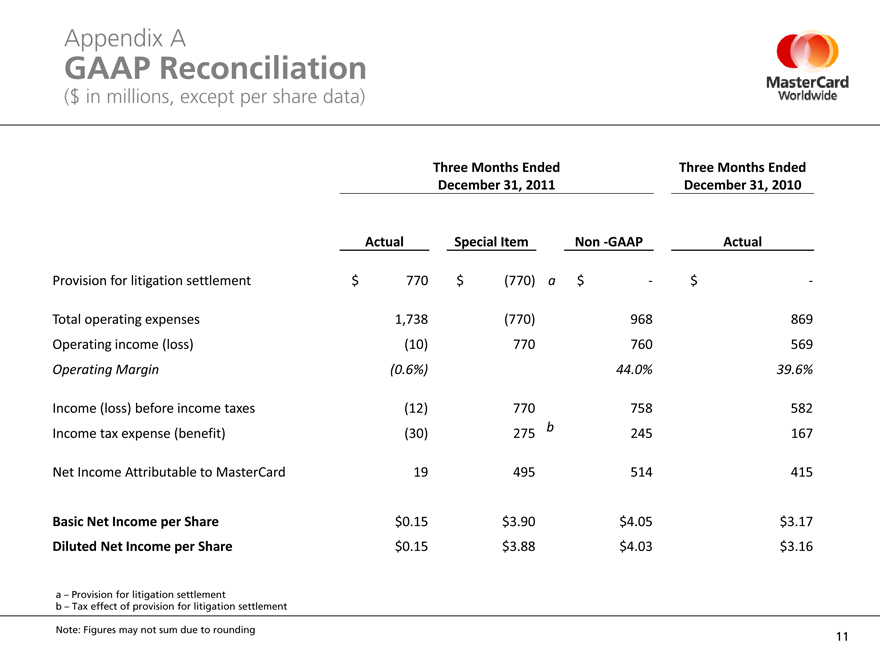
Appendix A
GAAP Reconciliation
($ in millions, except per share data)
Three Months Ended Three Months Ended
December 31, 2011 December 31, 2010
Actual Special Item Non -GAAP Actual
Provision for litigation settlement $ 770 $ (770) a $—$ —
Total operating expenses 1,738 (770) 968 869
Operating income (loss) (10) 770 760 569
Operating Margin (0.6%) 44.0% 39.6%
Income (loss) before income taxes (12) 770 758 582
Income tax expense (benefit) (30) 275 b 245 167
Net Income Attributable to MasterCard 19 495 514 415
Basic Net Income per Share $0.15 $3.90 $4.05 $3.17
Diluted Net Income per Share $0.15 $3.88 $4.03 $3.16
a – Provision for litigation settlement b – Tax effect of provision for litigation settlement
Note: Figures may not sum due to rounding
11
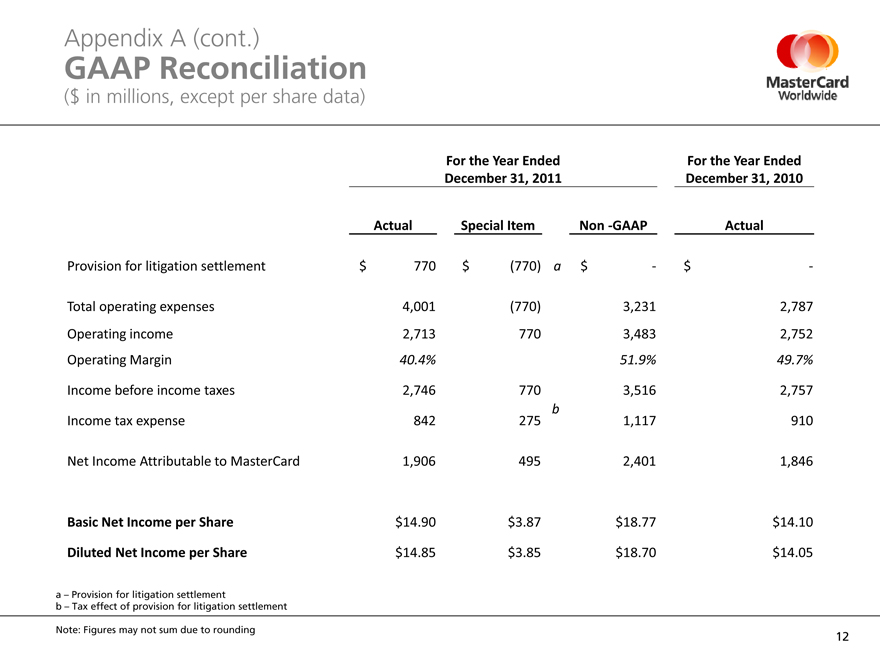
Appendix A (cont.)
GAAP Reconciliation
($ in millions, except per share data)
For the Year Ended For the Year Ended
December 31, 2011 December 31, 2010
Actual Special Item Non -GAAP Actual
Provision for litigation settlement $ 770 $ (770) a $—$—
Total operating expenses 4,001 (770) 3,231 2,787
Operating income 2,713 770 3,483 2,752
Operating Margin 40.4% 51.9% 49.7%
Income before income taxes 2,746 770 3,516 2,757
Income tax expense 842 275 b 1,117 910
Net Income Attributable to MasterCard 1,906 495 2,401 1,846
Basic Net Income per Share $14.90 $3.87 $18.77 $14.10
Diluted Net Income per Share $14.85 $3.85 $18.70 $14.05
a – Provision for litigation settlement
b – Tax effect of provision for litigation settlement
Note: Figures may not sum due to rounding
12
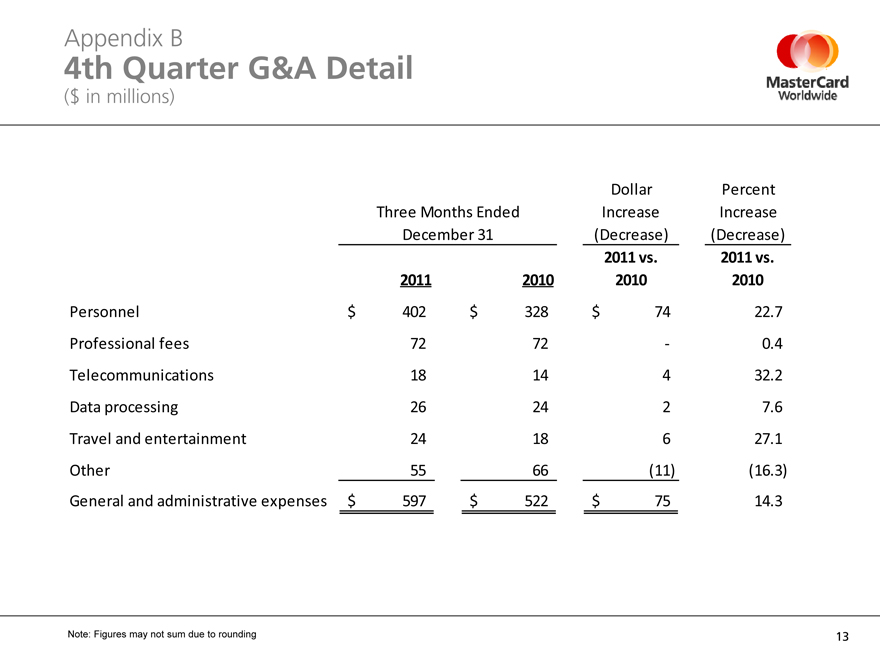
Appendix B
4th Quarter G&A Detail
($ in millions)
Dollar Percent
Three Months Ended Increase Increase
December 31 (Decrease) (Decrease)
2011 vs. 2011 vs.
2011 2010 2010 2010
Personnel $ 402 $ 328 $ 74 22.7
Professional fees 72 72 —0.4
Telecommunications 18 14 4 32.2
Data processing 26 24 2 7.6
Travel and entertainment 24 18 6 27.1
Other 55 66 (11) (16.3)
General and administrative expenses $ 597 $ 522 $ 75 14.3
Note: Figures may not sum due to rounding
13