Exhibit 99.2
MasterCard Incorporated Second-Quarter 2012 Financial Results Conference Call
August 1, 2012
Business Update
• Operational Overview
• Economic Update
• Business Highlights

2nd Quarter Selected Financial Performance
($ in millions, except per share data)
2Q 12
Non-GAAP YOY
excl. special item* 2Q 11 Growth
Net revenue $ 1,820 $ 1,667 9%
Total operating expenses 826 782 6%
Operating income 994 885 12%
Operating margin 54.6% 53.1% 1.5 ppts
Net income $ 713 $ 608 17%
Diluted EPS $ 5.65 $ 4.76 19%
Note: Figures may not sum due to rounding
* | | See Appendix for GAAP reconciliations of the special item for the 3 months ended June 30, 2012 |
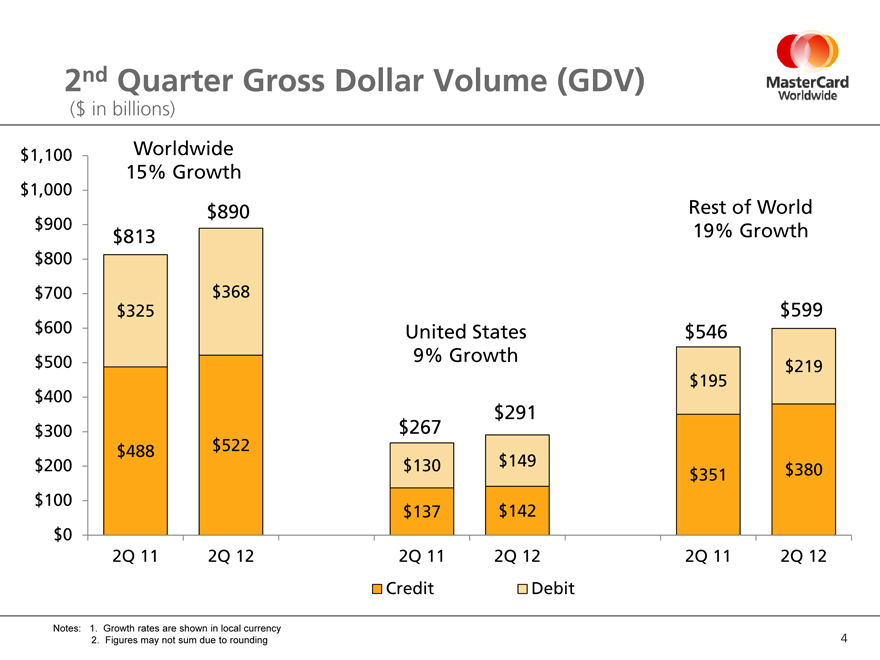
2nd Quarter Gross Dollar Volume (GDV)
($ in billions)
$1,100 $1,000 $900 $800 $700 $600 $500 $400 $300 $200 $100 $0
Worldwide 15% Growth
$813
$325
$488
$890
$368
$522
2Q 11
2Q 12
United States
9% Growth
$267
$130
$137
2Q 11
$291
$149
$142
2Q 12
Rest of World 19% Growth
$546
$195
$351
$599
$219
$380
2Q 11
2Q 12
Credit
Debit
Notes: 1. Growth rates are shown in local currency
2. Figures may not sum due to rounding
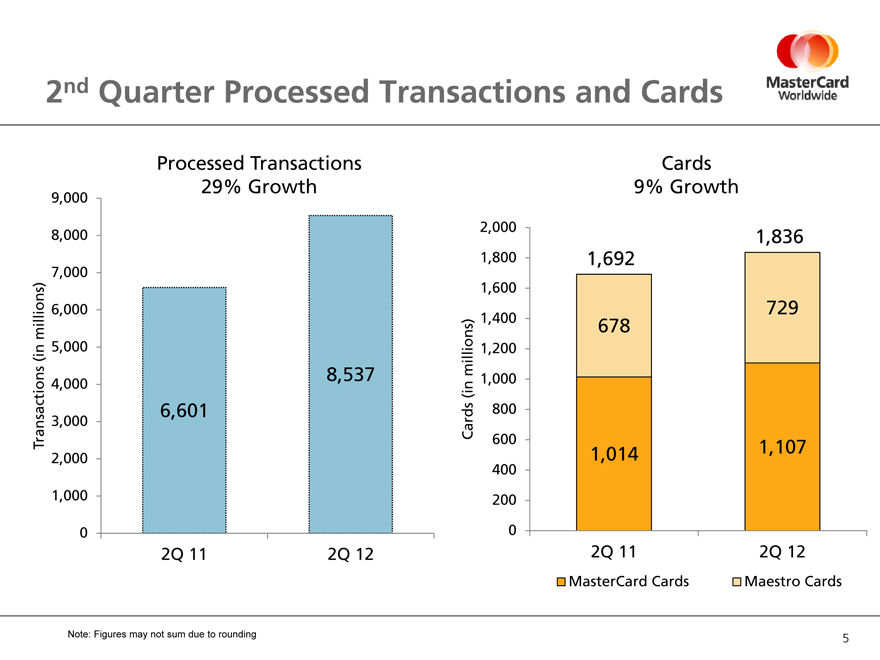
2nd Quarter Processed Transactions and Cards
Processed Transactions
29% Growth
9,000 8,000 7,000 6,000 5,000 4,000 3,000 2,000 1,000 0
Transactions (in millions)
6,601
2Q 11
8,537
2Q 12
Cards
9% Growth
Cards (in millions)
2,000 1,800 1,600 1,400 1,200 1,000 800 600 400 200 0
1,692
678
1,014
2Q 11
1,836
729
1,107
2Q 12
MasterCard Cards
Maestro Cards
Note: Figures may not sum due to rounding
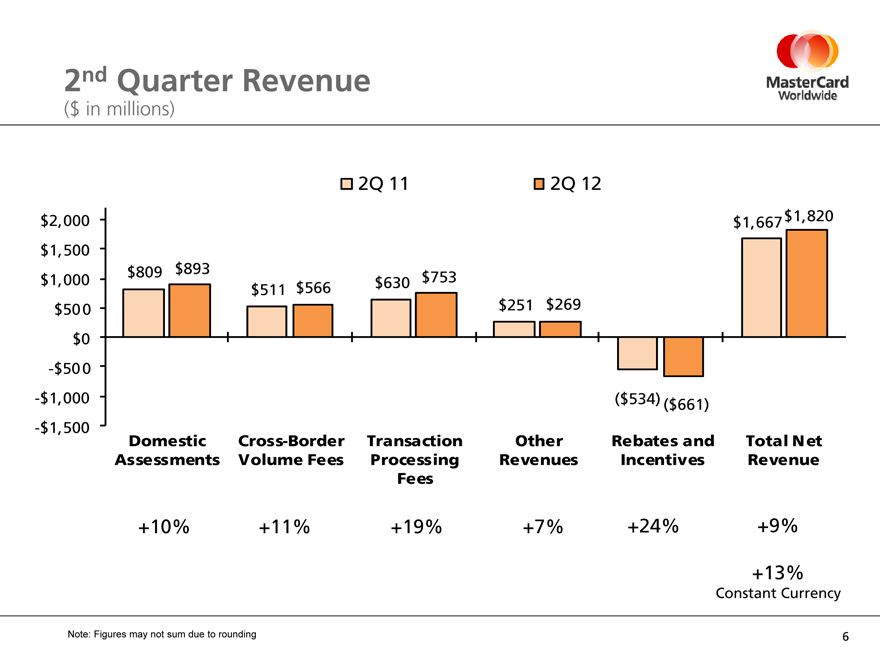
2nd Quarter Revenue
($ in millions)
2Q 11
2Q 12
$2,000
$1,500
$1,000 $500 $0
-$500
-$1,000
-$1,500
$809
$893
$511
$566
$630
$753
$251
$269
$1,667
$1,820
($534)
$661)
Domestic Assessments
Cross-Border Volume Fees
Transaction Processing Fees
Other Revenues
Rebates and Incentives
Total Net Revenue
+10%
+11%
+19%
+7%
+24%
+9%
+13%
Constant Currency
Note: Figures may not sum due to rounding
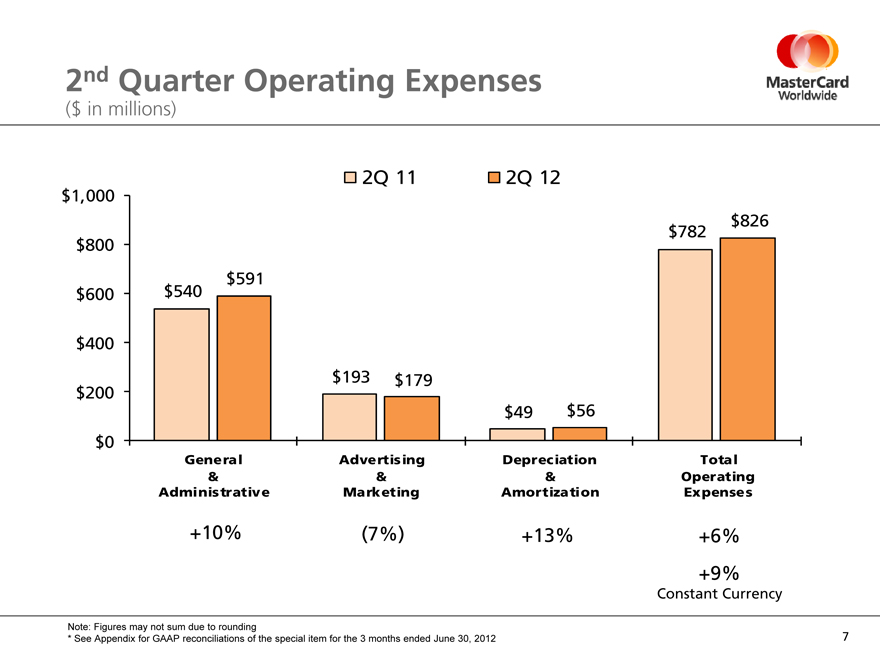
2nd Quarter Operating Expenses
($ in millions)
$1,000 $800 $600 $400 $200 $0
$540
$591
General & Administrative
+10%
2Q 11
2Q 12
$193
$179
Advertising & Marketing
(7%)
$49
$56
Depreciation & Amortization
+13%
$782
$826
Total Operating Expenses
+6%
+9%
Constant Currency
Note: Figures may not sum due to rounding
* | | See Appendix for GAAP reconciliations of the special item for the 3 months ended June 30, 2012 |
Thoughts for the Future
Business update through July 28
Thoughts for 2012
Net Revenue Total Operating Expenses Tax Rate
Long-term financial objectives

The Heart of Commerce™
9
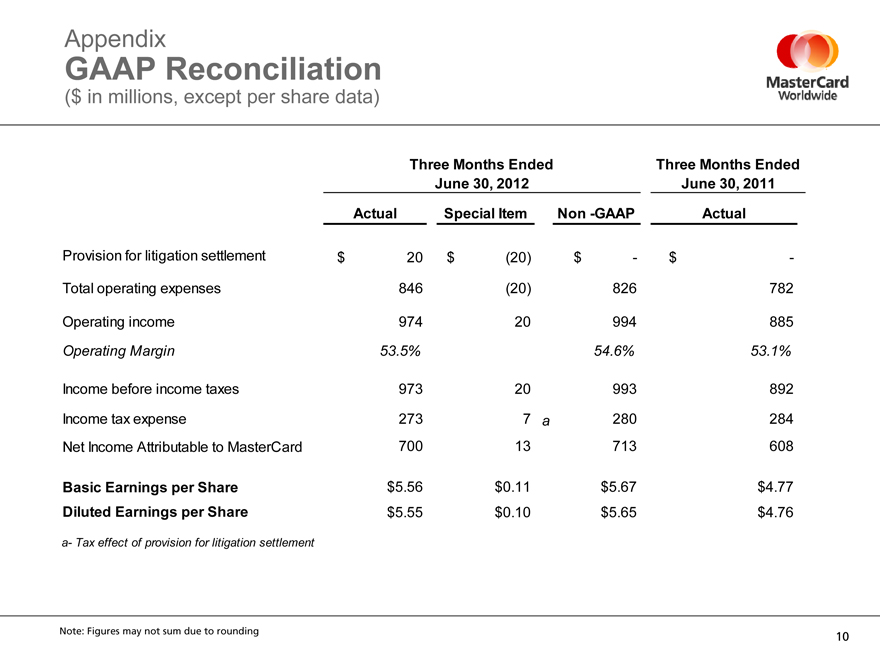
Appendix
GAAP Reconciliation
($ in millions, except per share data)
Three Months Ended Three Months Ended
June 30, 2012 June 30, 2011
Actual Special Item Non -GAAP Actual
Provision for litigation settlement $ 20 $ (20) $—$ -
Total operating expenses 846 (20) 826 782
Operating income 974 20 994 885
Operating Margin 53.5% 54.6% 53.1%
Income before income taxes 973 20 993 892
Income tax expense 273 7 a 280 284
Net Income Attributable to MasterCard 700 13 713 608
Basic Earnings per Share $5.56 $0.11 $5.67 $4.77
Diluted Earnings per Share $5.55 $0.10 $5.65 $4.76
a- Tax effect of provision for litigation settlement
Note: Figures may not sum due to rounding
10