Exhibit 99.2
MasterCard Incorporated Third-Quarter 2012 Financial Results Conference Call
October 31, 2012
Business Update
Operational Overview
Economic Update
Business Highlights
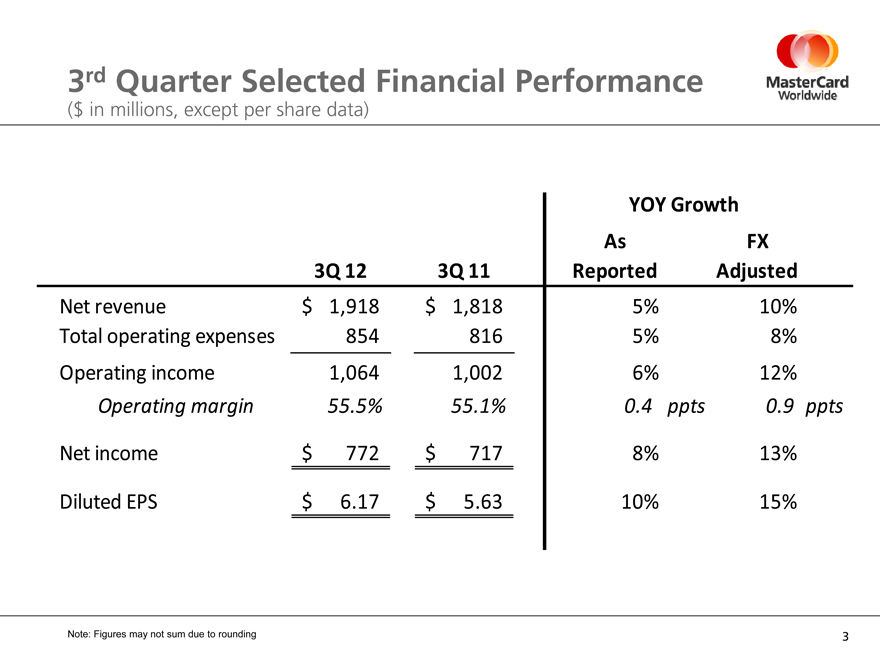
3rd Quarter Selected Financial Performance ($ in millions, except per share data)
YOY Growth
As FX
3Q 12 3Q 11 Reported Adjusted
Net revenue $ 1,918 $ 1,818 5% 10%
Total operating expenses 854 816 5% 8%
Operating income 1,064 1,002 6% 12%
Operating margin 55.5% 55.1% 0.4 ppts 0.9 ppts
Net income $ 772 $ 717 8% 13%
Diluted EPS $ 6.17 $ 5.63 10% 15%
Note: Figures may not sum due to rounding
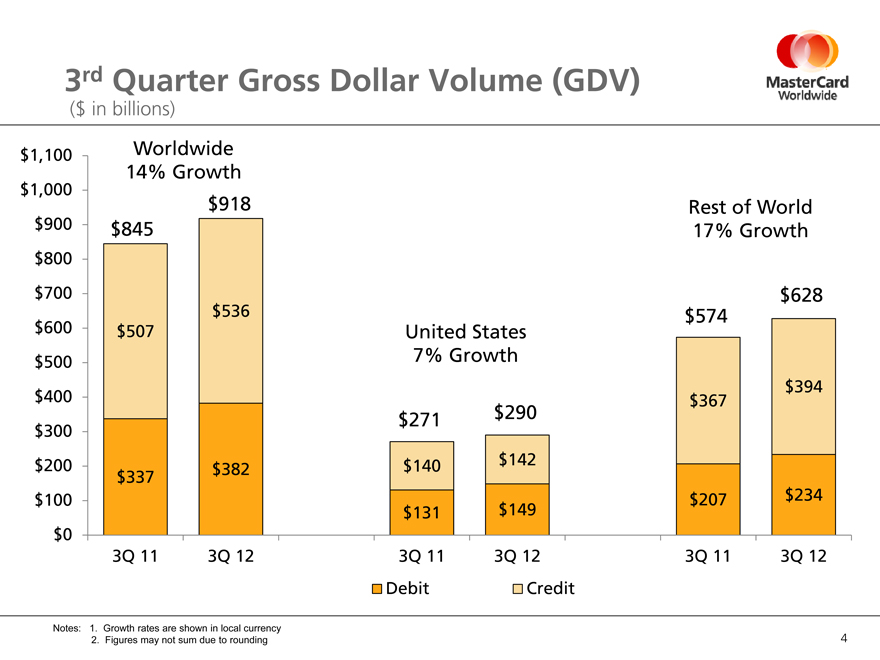
3rd Quarter Gross Dollar Volume (GDV)
($ in billions)
$1,100
Worldwide
14% Growth
$1,000
$918
Rest of World
$900
$845
17% Growth
$800
$700
$628
$536
$574
$600
$507
United States
$500
7% Growth
$394
$400
$367
$271
$290
$300
$200
$382
$140
$142
$337
$100
$207
$234
$131
$149
$0
3Q 11
3Q 12
3Q 11
3Q 12
3Q 11
3Q 12
Debit
Credit
Notes: 1. Growth rates are shown in local currency
2. Figures may not sum due to rounding
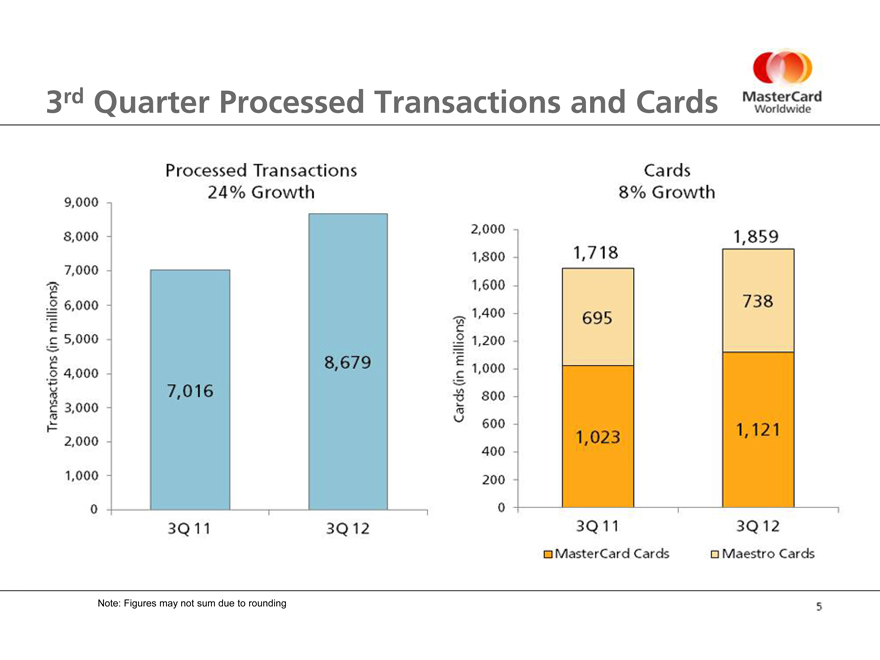
3rd Quarter Processed Transactions and Cards
Processed Transactions 24% Growth
9,000
8,000
7,000
6,000
5,000
8,679
4,000
7,016
Transactions (in millions)
3,000
2,000
1,000
0
3Q 11
3Q 12
Cards
8% Growth
2,000
1,859
1,800
1,718
1,600
738
1,400
695
Cards (in millions)
1,200
1,000
800
600
1,023
1,121
400
200
0
3Q 11
3Q 12
MasterCard Cards
Maestro Cards
Note: Figures may not sum due to rounding
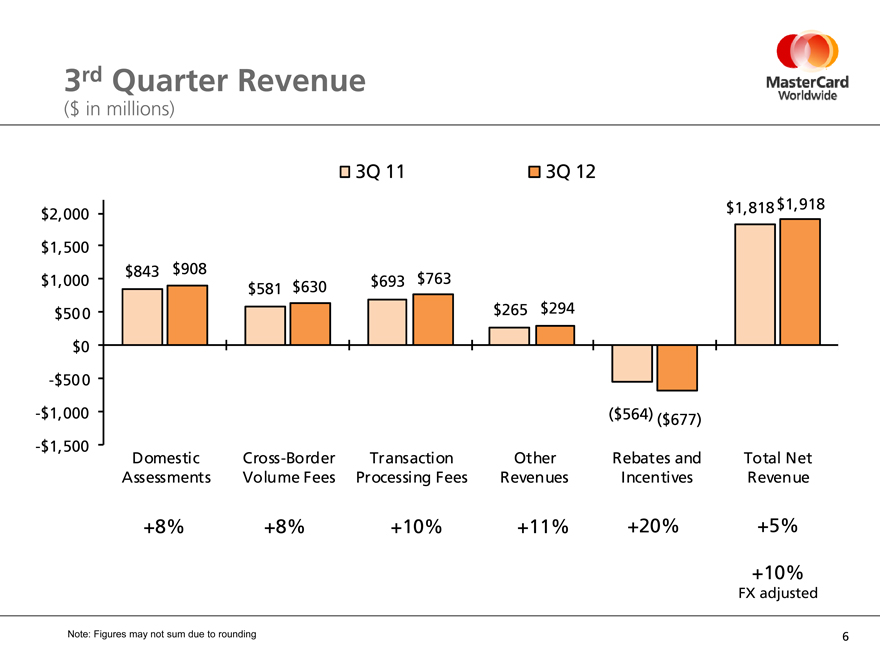
3rd Quarter Revenue
($ in millions)
3Q 11
3Q 12
$2,000
$1,818
$1,918
$1,500
$843
$908
$1, 000
$693
$763
$581
$630
$500
$265
$294
$0
-$500
-$1,000
($564)
($677)
-$1,500
Domestic Assessments
Cross-Border Volume Fees
Transaction Processing Fees
Other Revenues
Rebates and Incentives
Total Net Revenue
+8%
+8%
+10%
+11%
+20%
+5%
+10%
FX adjusted
Note: Figures may not sum due to rounding
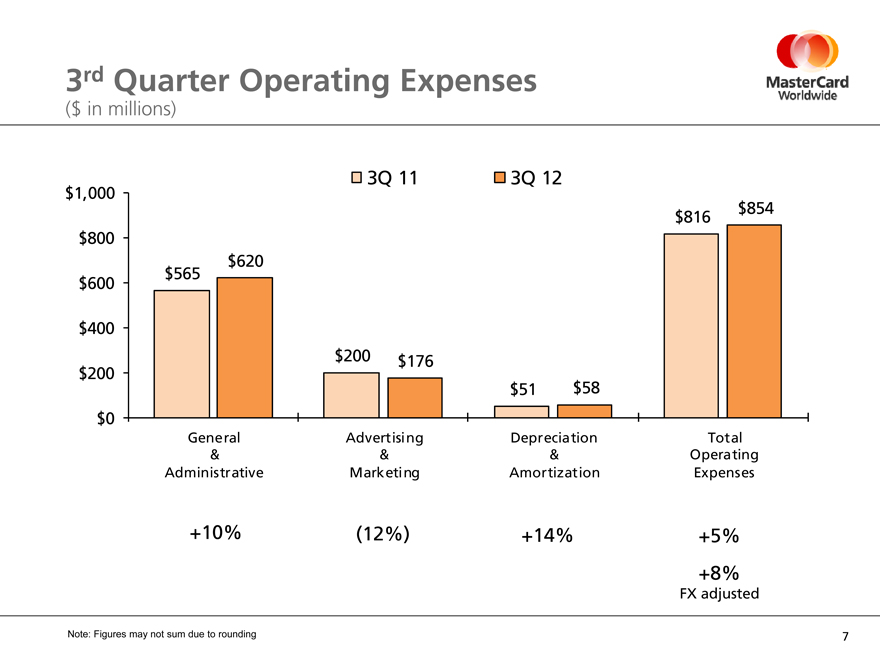
3rd Quarter Operating Expenses
($ in millions)
3Q 11
3Q 12
$1,000
$816
$854
$800
$620
$565
$600
$400
$200
$176
$200
$51
$58
$0
General & Administrative
Advertising & Marketing
Depreciation & Amortization
Total Operating Expenses
+10%
(12%)
+14%
+5%
+8%
FX adjusted
Note: Figures may not sum due to rounding
Thoughts for the Future
Business update through October 28
Thoughts for 2012
Net Revenue Operating Expenses Tax Rate
Long-term financial objectives

The Heart of Commerce™
9