|
Exhibit 99.2 
|
MasterCard Incorporated Fourth-Quarter and Full-Year 2012 Financial Results Conference Call
January 31, 2013
Business Update
Operational Overview Economic Update Business Highlights
2
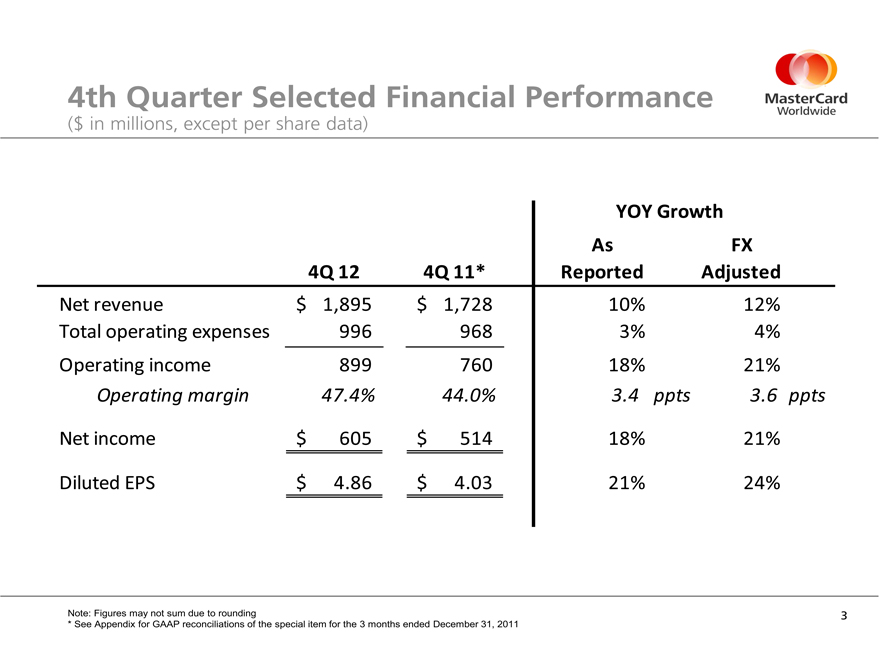
4th Quarter Selected Financial Performance
($ in millions, except per share data)
YOY Growth
As FX
4Q 12 4Q 11* Reported Adjusted
Net revenue $ 1,895 $ 1,728 10% 12%
Total operating expenses 996 968 3% 4%
Operating income 899 760 18% 21%
Operating margin 47.4% 44.0% 3.4 ppts 3.6 ppts
Net income $ 605 $ 514 18% 21%
Diluted EPS $ 4.86 $ 4.03 21% 24%
Note: Figures may not sum due to rounding
* See Appendix for GAAP reconciliations of the special item for the 3 months ended December 31, 2011
3
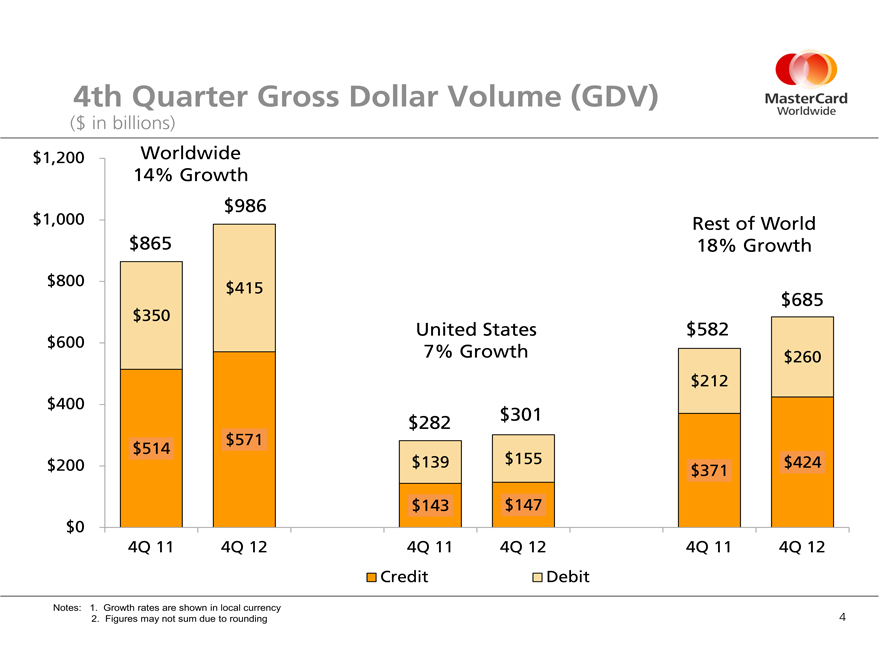
4th Quarter Gross Dollar Volume (GDV)
($ in billions)
$1,200 Worldwide
14% Growth
$ 986
$1,000 Rest of World
$865 18% Growth
$800 $415
$685
$350
United States $582
$600
7% Growth $260
$212
$400
$282 $301
$514 $571
$200 $139 $155 $371 $424
$143 $147
$0
4Q 11 4Q 12 4Q 11 4Q 12 4Q 11 4Q 12
Credit Debit
Notes: 1. Growth rates are shown in local currency
2. Figures may not sum due to rounding
4
4th Quarter Processed Transactions and Cards
Transactions (in millions)
0 2,000 4,000 6,000 8,000 10,000
Processed Transactions 20% Growth
9,222 7,677
4Q 11 4Q 12
Cards (in millions)
0 400 800 1,200 1,600 2,000
1,900 1,760
743 714
1,046 1,158
4Q 11 4Q 12
Cards
8% Growth
MasterCard Cards Maestro Cards
Note: Figures may not sum due to rounding
5
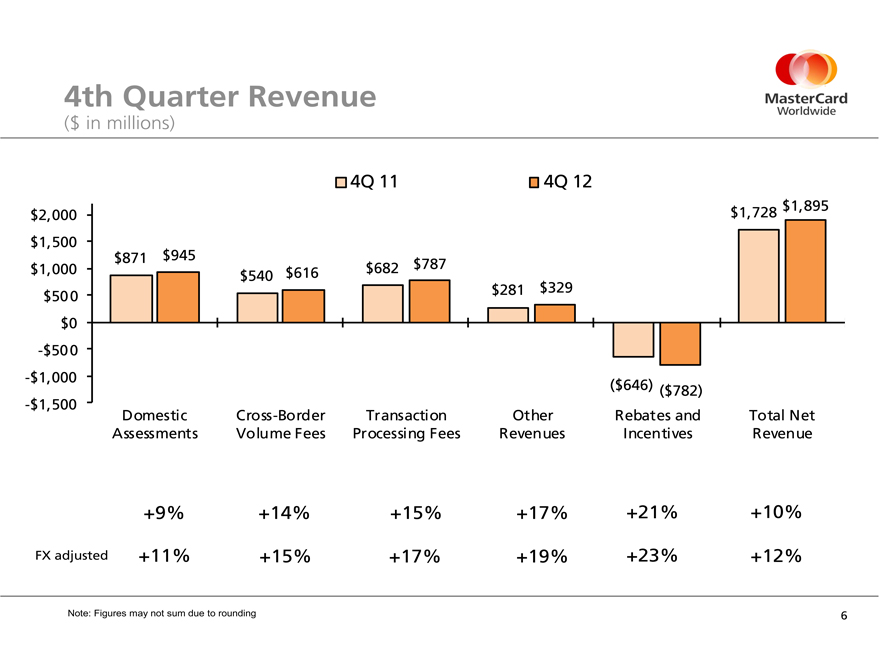
4th Quarter Revenue
($ in millions)
4Q 11 4Q 12
$2,000 $1,500 $1,000 $500 $0
-$500
-$1,000
-$1,500
$871 $945 $682 $787 $540 $616 $281 $329
$1,728 $1,895
($646) ($782)
Domestic Cross -Border Transaction Other Rebates and Total Net
Assessments Volume Fees Processing Fees Revenues Incentives Revenue
+9% +14% +15% +17% +21% +10%
FX adjusted +11% +15% +17% +19% +23% +12%
Note: Figures may not sum due to rounding
6
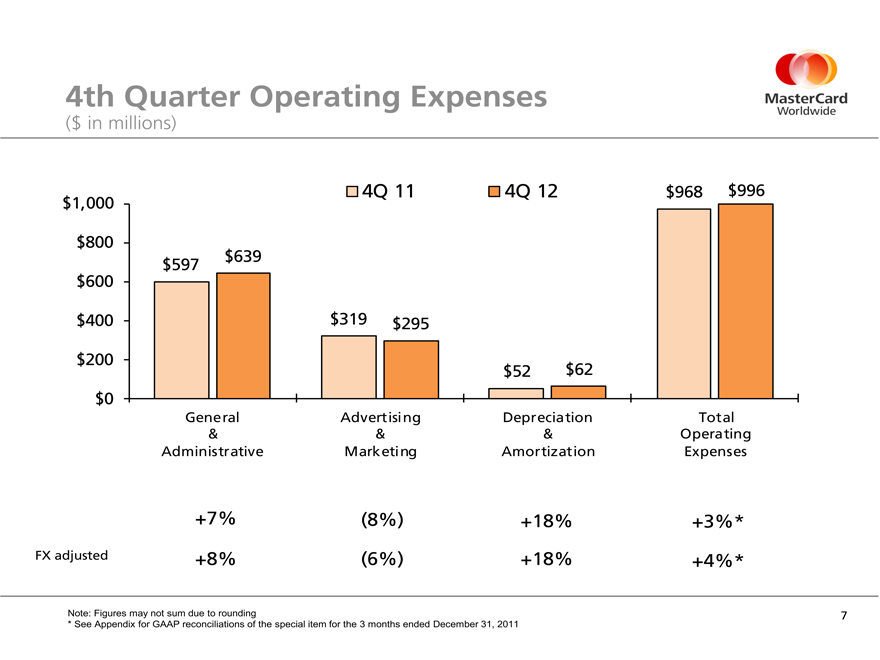
4th Quarter Operating Expenses
($ in millions)
$1,000 4Q 11 4Q 12 $968 $996
$800
$597 $639
$600
$400 $319 $295
$200 $52 $62
$0
General Advertising Depreciation Total
& & & Operating
Administrative Marketing Amortization Expenses
+7% (8%) +18% +3%*
FX adjusted +8% (6%) +18% +4%*
Note: Figures may not sum due to rounding
* See Appendix for GAAP reconciliations of the special item for the 3 months ended December 31, 2011
7
Thoughts for the Future
Business update through January 28 Long-term Performance Objectives Thoughts for 2013
Net Revenue Operating Expenses Tax Rate FX sensitivity
8
Master Card Worldwide
The Heart of CommerceTM
9
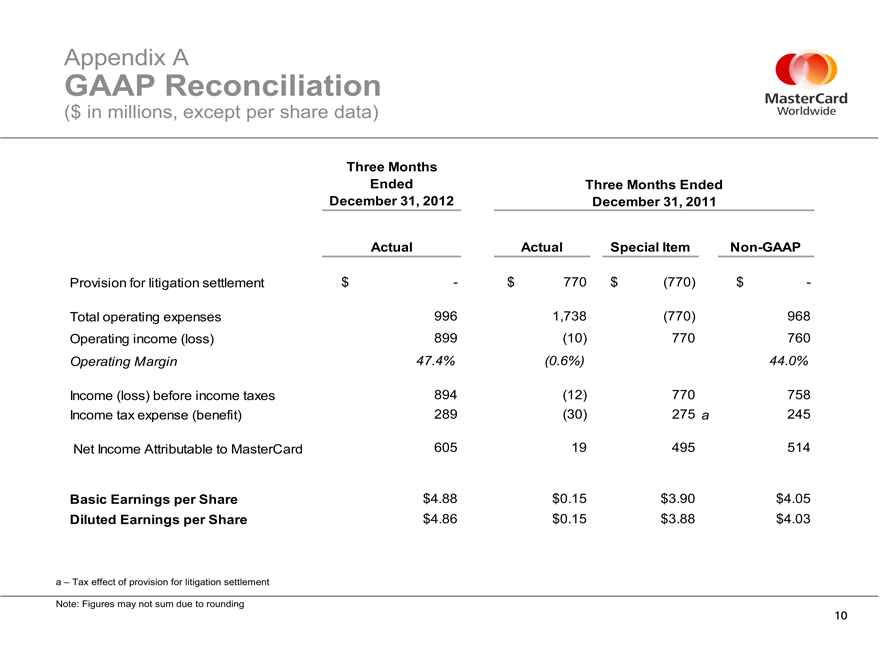
Appendix GAAP Reconciliation A
($ in millions, except per share data)
Three Months
Ended Three Months Ended
December 31, 2012 December 31, 2011
Actual Actual Special Item Non-GAAP
Provision for litigation settlement $ —$ 770 $ (770) $ -
Total operating expenses 996 1,738 (770) 968
Operating income (loss) 899 (10) 770 760
Operating Margin 47.4% (0.6%) 44.0%
Income (loss) before income taxes 894 (12) 770 758
Income tax expense (benefit) 289 (30) 275 a 245
Net Income Attributable to MasterCard 605 19 495 514
Basic Earnings per Share $ 4.88 $ 0.15 $ 3.90 $ 4.05
Diluted Earnings per Share $ 4.86 $ 0.15 $ 3.88 $ 4.03
a – Tax effect of provision for litigation settlement
Note: Figures may not sum due to rounding
10
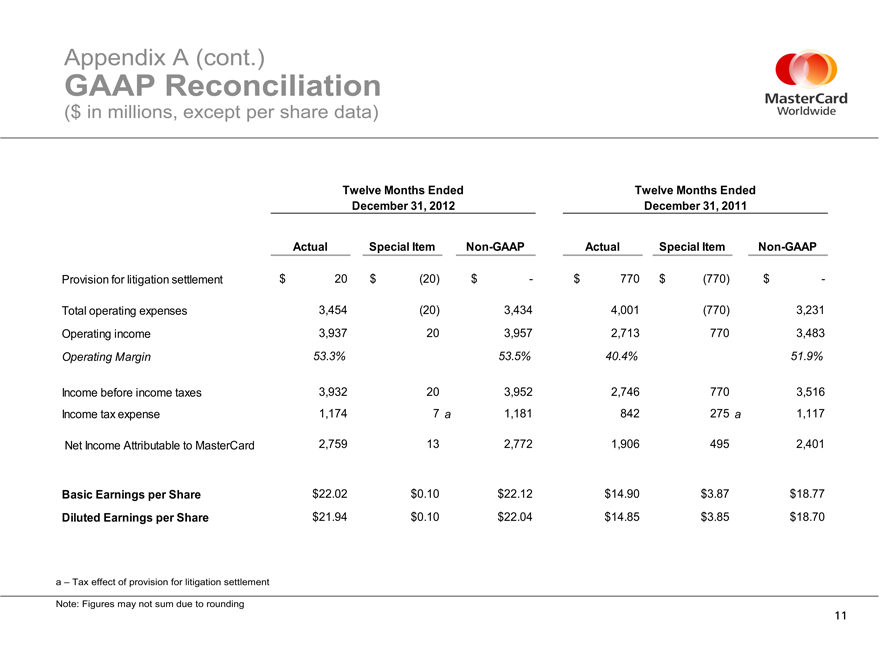
Appendix GAAP Reconciliation A (cont.)
($ in millions, except per share data)
Twelve Months Ended Twelve Months Ended
December 31, 2012 December 31, 2011
Actual Special Item Non-GAAP Actual Special Item Non-GAAP
Provision for litigation settlement $ 20 $ (20) $—$ 770 $ (770) $ -
Total operating expenses 3,454 (20) 3,434 4,001 (770) 3,231
Operating income 3,937 20 3,957 2,713 770 3,483
Operating Margin 53.3% 53.5% 40.4% 51.9%
Income before income taxes 3,932 20 3,952 2,746 770 3,516
Income tax expense 1,174 7 a 1,181 842 275 a 1,117
Net Income Attributable to MasterCard 2,759 13 2,772 1,906 495 2,401
Basic Earnings per Share $22.02 $ 0.10 $22.12 $14.90 $3.87 $18.77
Diluted Earnings per Share $21.94 $ 0.10 $22.04 $14.85 $3.85 $18.70
a – Tax effect of provision for litigation settlement
Note: Figures may not sum due to rounding
11
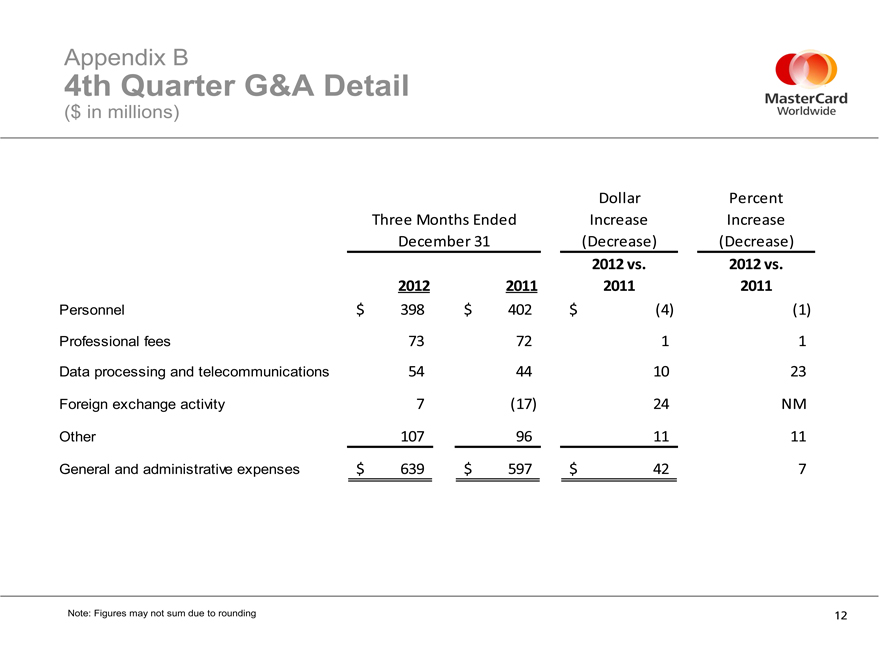
4th Appendix Quarter B G&A Detail
($ in millions)
Dollar Percent
Three Months Ended Increase Increase
December 31 (Decrease) (Decrease)
2012 vs. 2012 vs.
2012 2011 2011 2011
Personnel $ 398 $ 402 $ (4) (1)
Professional fees 73 72 1 1
Data processing and telecommunications 54 44 10 23
Foreign exchange activity 7 (17) 24 NM
Other 107 96 11 11
General and administrative expenses $ 639 $ 597 $ 42 7
Note: Figures may not sum due to rounding
12