EXHIBIT 99.2
|
MasterCard Incorporated Second-Quarter 2013 Financial Results Conference Call July 31, 2013
|
Business Update Recap of 2nd Quarter Results Economic Update Business Highlights 2
|
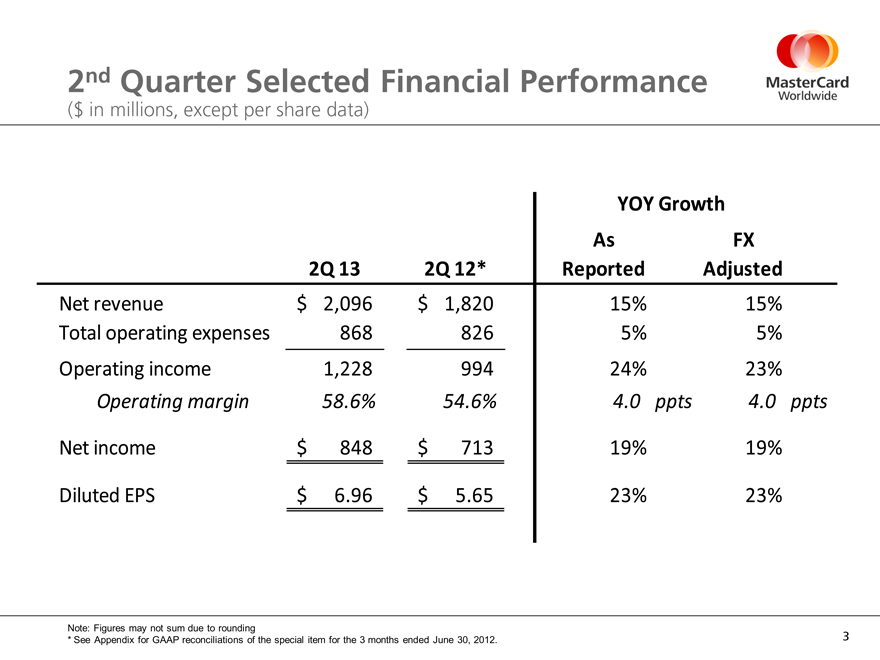
2nd Quarter Selected Financial Performance ($ in millions, except per share data) 3 Note: Figures may not sum due to rounding * See Appendix for GAAP reconciliations of the special item for the 3 months ended June 30, 2012.
|
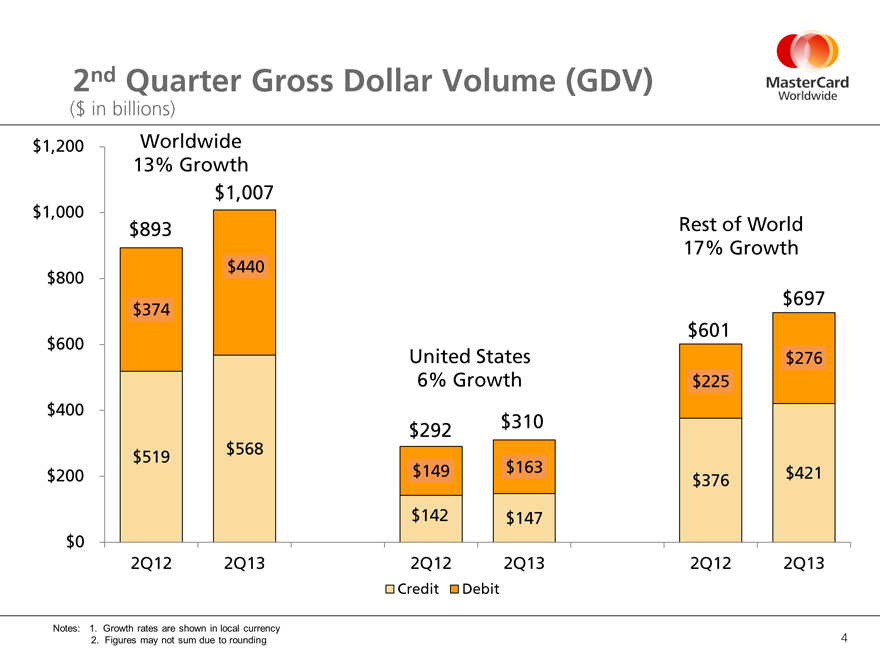
2nd Quarter Gross Dollar Volume (GDV) ($ in billions) 4 Notes: 1. Growth rates are shown in local currency 2. Figures may not sum due to rounding (CHART) $893 $1,007 $292 $310 $601 $697
|
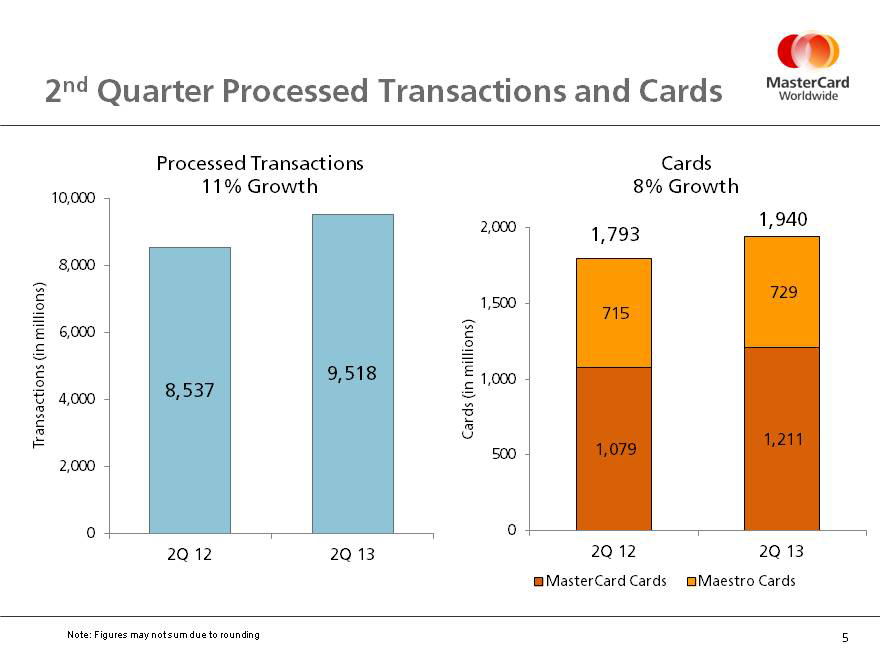
2nd Quarter Processed Transactions and Cards 5 Cards 8% Growth Note: Figures may not sum due to rounding (CHART) 1,793 1,940 (CHART) Processed Transactions 11% Growth
|

2nd Quarter Revenue ($ in millions) 6 Note: Certain prior period amounts have been reclassified to conform to the 2013 presentation. Net revenue is not impacted. Figures may not sum due to rounding +8% +20% +9% +17% +2% +15% +15% +2% +16% +9% +19% FX adjusted +8% As reported
|
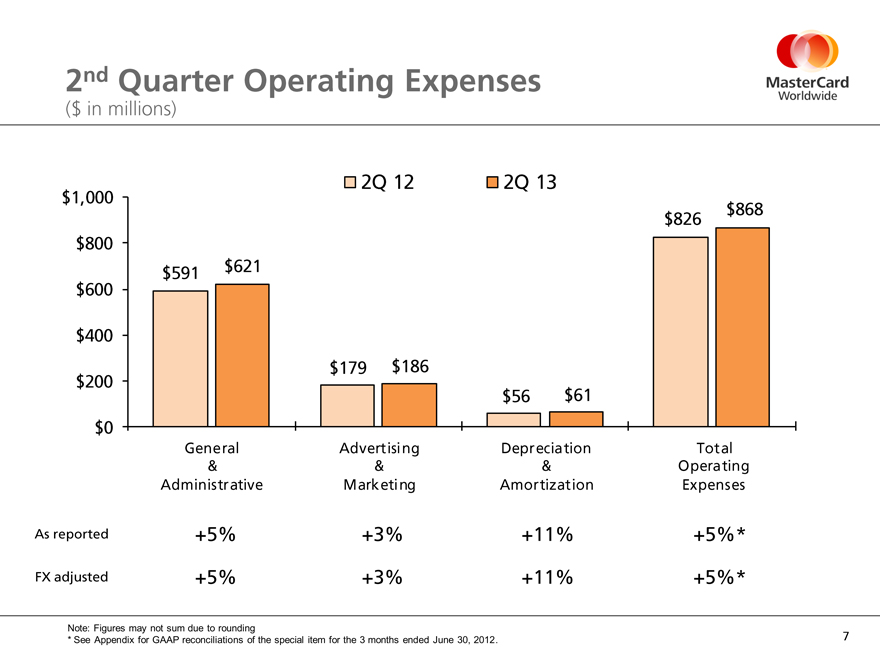
2nd Quarter Operating Expenses ($ in millions) 7 +5% +3% +11% +5%* +5%* FX adjusted +5% +3% +11% As reported Note: Figures may not sum due to rounding * See Appendix for GAAP reconciliations of the special item for the 3 months ended June 30, 2012.
|
Thoughts for the Future Business update through July 28 Long-term Performance Objectives Thoughts for 2013 Revenue Operating Expenses Tax Rate FX sensitivity 8
|

The Heart of Commerce
|
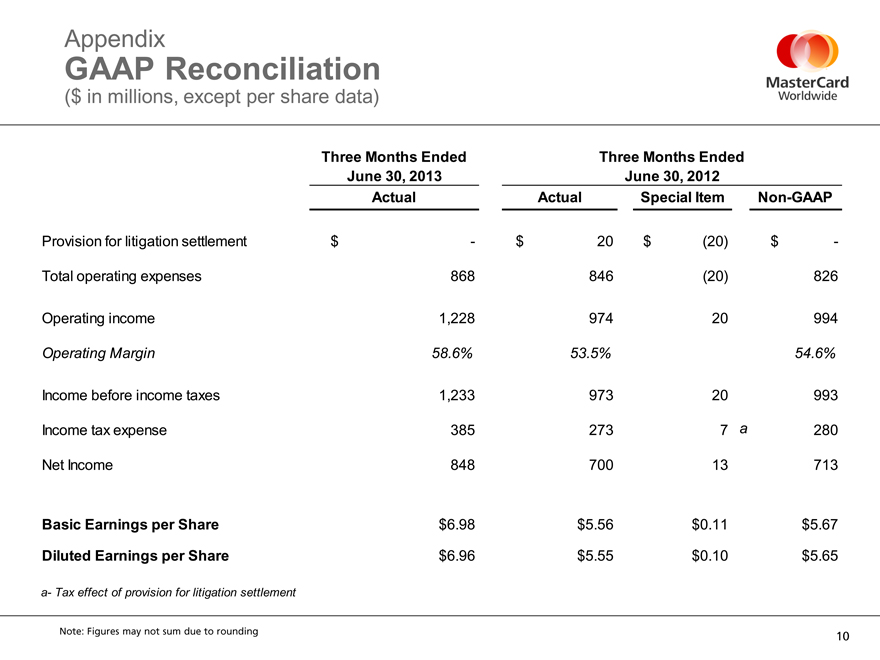
Appendix GAAP Reconciliation ($ in millions, except per share data) Note: Figures may not sum due to rounding 10
|

Appendix (cont.) GAAP Reconciliation ($ in millions, except per share data) Note: Figures may not sum due to rounding 11