Exhibit 99.2
|
MasterCard Incorporated First-Quarter 2014 Financial Results Conference Call
May 1, 2014
©2014 MasterCard. Proprietary
1
|
Thoughts for the Future
Operational Overview
Economic Update
Business Highlights
©2014 MasterCard.
Proprietary
Page 2
2
|
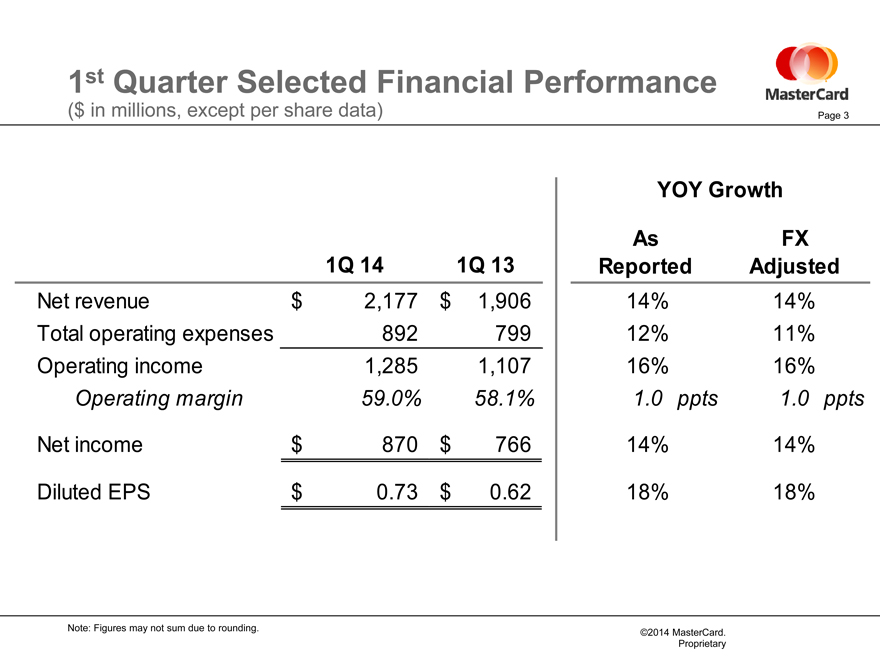
1st Quarter Selected Financial Performance
($ in millions, except per share data)
Page 3
YOY Growth
As FX
1Q 14 1Q 13 Reported Adjusted
Net revenue $ 2,177 $ 1,906 14% 14%
Total operating expenses 892 799 12% 11%
Operating income 1,285 1,107 16% 16%
Operating margin 59.0% 58.1% 1.0 ppts 1.0 ppts
Net income $ 870 $ 766 14% 14%
Diluted EPS $ 0.73 $ 0.62 18% 18%
Note: Figures may not sum due to rounding.
©2014 MasterCard.
Proprietary
3
|
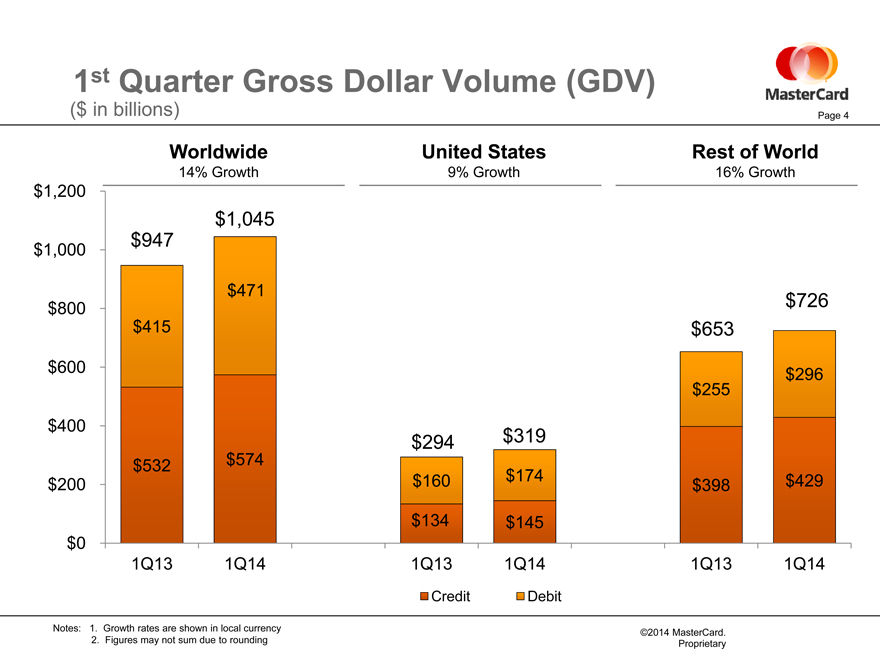
1st Quarter Gross Dollar Volume (GDV)
($ in billions)
Worldwide United States Rest of World
14% Growth 9% Growth 16% Growth $1,200
$1,045 $947
$1,000
$471 $800 $726 $415 $653 $600 $296 $255
$400
$294 $319
$532 $574 $160 $174 $429 $200 $398 $134 $145 $0 1Q13 1Q14 1Q13 1Q14 1Q13 1Q14
Credit Debit
Notes: 1. Growth rates are shown in local currency
2. Figures may not sum due to rounding
©2014 MasterCard.
Proprietary
Page 4
4
|
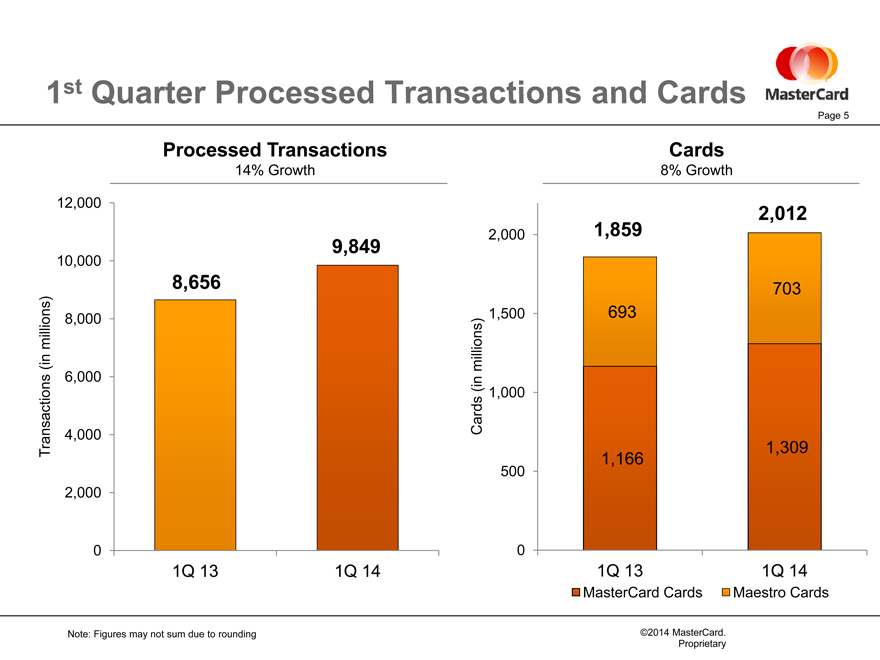
1st Quarter Processed Transactions and Cards
Page 5
Processed Transactions Cards
14% Growth 8% Growth
12,000
2,012
2,000 1,859 10,000 9,849
8,656 703
millions) 8,000 1,500 693 (in millions)
6,000 (in 1,000 4,000 Cards
Transactions 1,309 1,166
500 2,000
0 0
1Q 13 1Q 14 1Q 13 1Q 14
MasterCard Cards Maestro Cards
Note: Figures may not sum due to rounding
©2014 MasterCard.
Proprietary
5
|
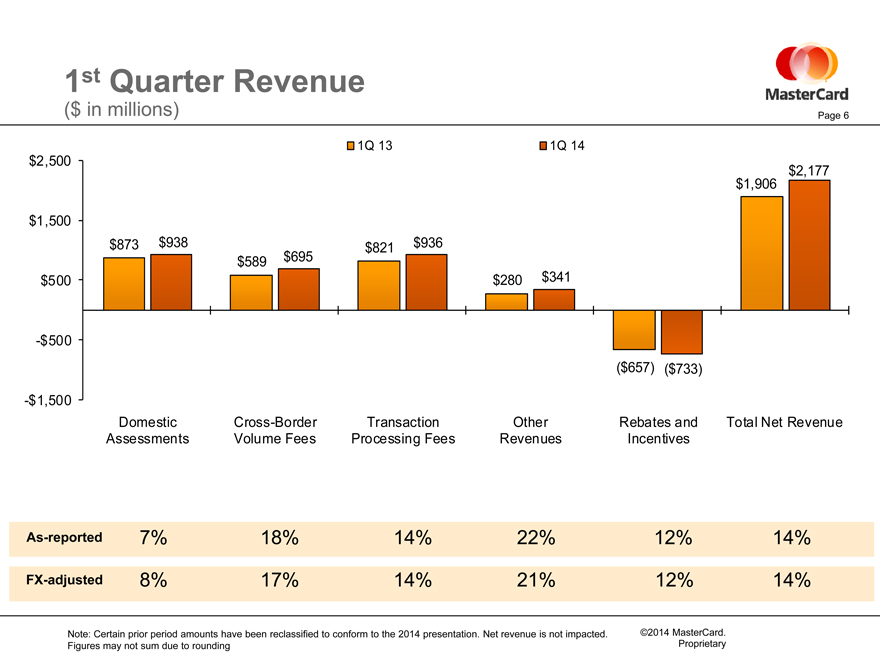
1st Quarter Revenue
($ in millions)
Page 6
1Q 13 1Q 14 $2,500 $2,177 $1,906 $1,500
$873 $938 $821 $936
$589 $695
$500 $280 $341 -$ 500 ($657) ($733)
-$ 1,500
Domestic Cross-Border Transaction Other Rebates and Total Net Revenue Assessments Volume Fees Processing Fees Revenues Incentives
As-reported
7%
18%
14%
22%
12%
14%
FX-adjusted
8%
17%
14%
21%
12%
14%
Note: Certain prior period amounts have been reclassified to conform to the 2014 presentation. Net revenue is not impacted. Figures may not sum due to rounding
©2014 MasterCard.
Proprietary
6
|
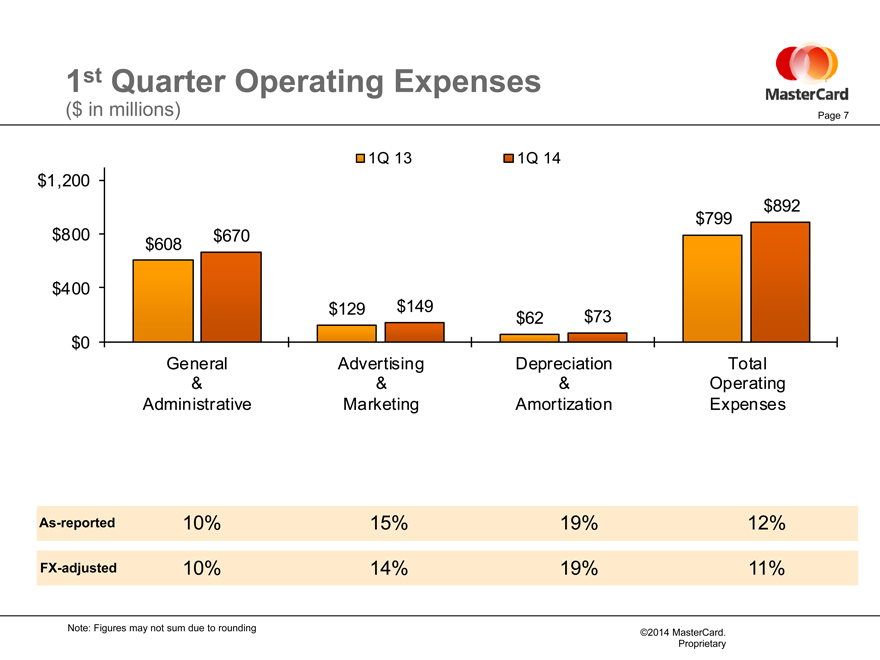
1st Quarter Operating Expenses
($ in millions)
1Q 13 1Q 14 $1,200 $892 $799 $800 $670 $608
$400 $129 $149
$62 $73 $0
General Advertising Depreciation Total
& & & Operating Administrative Marketing Amortization Expenses
Page 7
As-reported 10% 15% 19% 12%
FX-adjusted 10% 14% 19% 11%
Note: Figures may not sum due to rounding
©2014 MasterCard.
Proprietary
7
|
Thoughts for the Future
Page 8
Business update through April 28
Long-Term Performance Objectives
Thoughts for 2014
Impact from Acquisitions
Revenue
Operating Expenses
Tax Rate
FX Impact
MasterCard Incorporated
©2014 MasterCard.
Proprietary
8
|

MasterCard
9
|
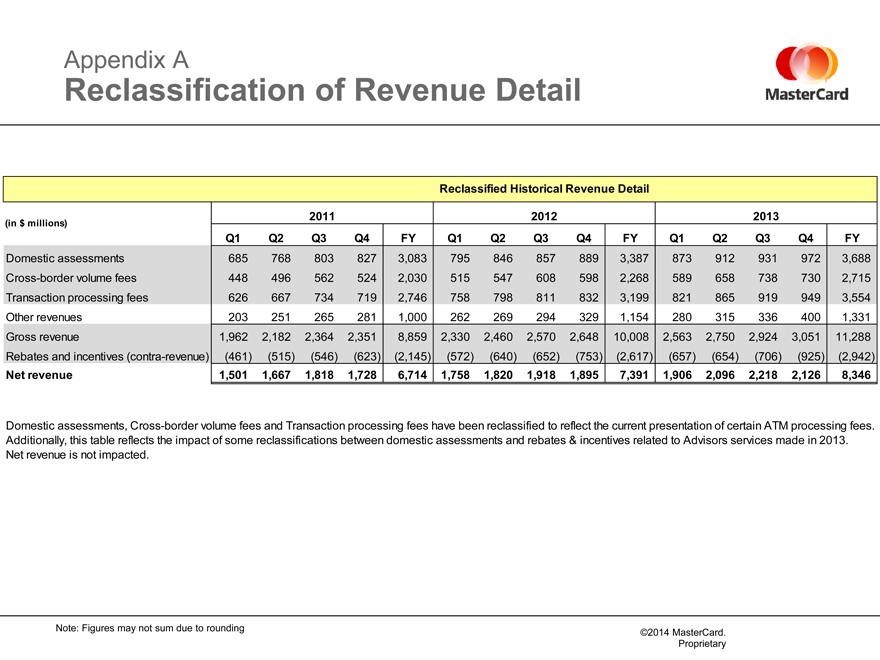
Appendix A
Reclassification of Revenue Detail
Reclassified Historical Revenue Detail
(in $ millions) 2011 2012 2013
Q1 Q2 Q3 Q4 FY Q1 Q2 Q3 Q4 FY Q1 Q2 Q3 Q4 FY
Domestic assessments 685 768 803 827 3,083 795 846 857 889 3,387 873 912 931 972 3,688
Cross-border volume fees 448 496 562 524 2,030 515 547 608 598 2,268 589 658 738 730 2,715
Transaction processing fees 626 667 734 719 2,746 758 798 811 832 3,199 821 865 919 949 3,554
Other revenues 203 251 265 281 1,000 262 269 294 329 1,154 280 315 336 400 1,331
Gross revenue 1,962 2,182 2,364 2,351 8,859 2,330 2,460 2,570 2,648 10,008 2,563 2,750 2,924 3,051 11,288
Rebates and incentives (contra-revenue)(461)(515)(546)(623)(2,145)(572)(640)(652)(753)(2,617)(657)(654)(706)(925)(2,942)
Net revenue 1501, 1,667 1818, 1728, 6714, 1758, 1820, 1918, 1,895 7391, 1906, 2096, 2,218 2126, 8,346
Domestic assessments, Cross-border volume fees and Transaction processing fees have been reclassified to reflect the current presentation of certain ATM processing fees. Additionally, this table reflects the impact of some reclassifications between domestic assessments and rebates & incentives related to Advisors services made in 2013. Net revenue is not impacted.
Note: Figures may not sum due to rounding
©2014 MasterCard.
Proprietary
10