Exhibit 99.1
Bermuda Angle 2003 Presentation
Bermuda Angle 2003

Strategic Position
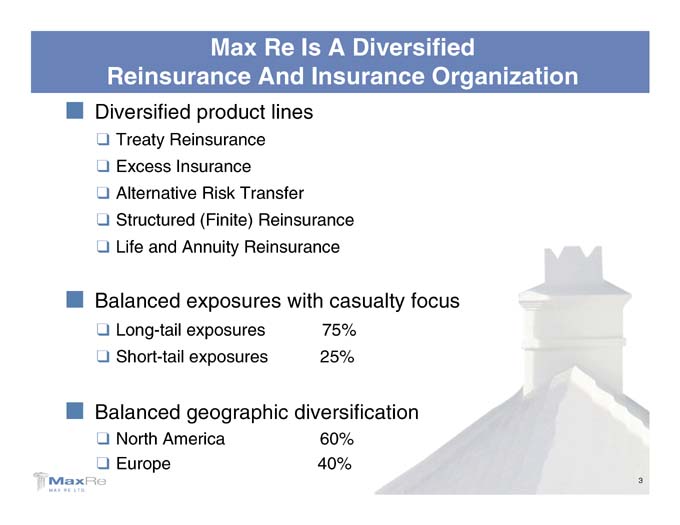
3 Max Re Is A Diversified 75% 25% 60% 40% Reinsurance And Insurance Organization Treaty Reinsurance Excess Insurance Alternative Risk Transfer Structured (Finite) Reinsurance Life and Annuity Reinsurance Long-tail exposures Short-tail exposures North America Europe Diversified product lines q q q q q Balanced exposures with casualty focus q q Balanced geographic diversification q q . . .
• 4 • capabilities issues pricing • Significant Advantages team and recoverable • Several management team strategy managers reinsurance lines management • Has or • Re Competitive senior underwriting product investment investment risk liability Max edge Experienced Superior Superior legacy Experienced Diversified Leading No • . . . . .
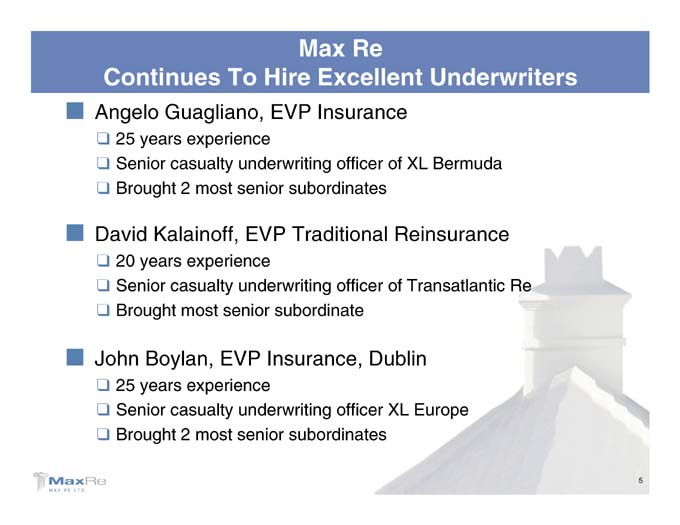
5 Max Re Senior casualty underwriting officer of XL Bermuda Brought 2 most senior subordinates Brought most senior subordinate Brought 2 most senior subordinates Continues To Hire Excellent Underwriters 25 years experience 20 years experience Senior casualty underwriting officer of Transatlantic Re 25 years experience Senior casualty underwriting officer XL Europe Angelo Guagliano, EVP Insurance q q q David Kalainoff, EVP Traditional Reinsurance q q q John Boylan, EVP Insurance, Dublin q q q . . .
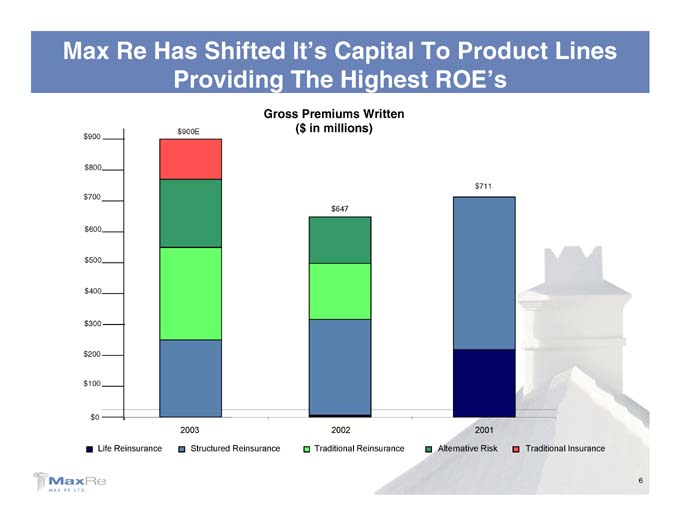
6 Traditional Insurance $711 2001 Alternative Risk Gross Premiums Written ($ in millions) $647 2002 Traditional Reinsurance Structured Reinsurance Providing The Highest ROE’s $900E 2003 Life Reinsurance Max Re Has Shifted It’s Capital To Product Lines $900 $800 $700 $600 $500 $400 $300 $200 $100 $0

Underwriting Product Lines
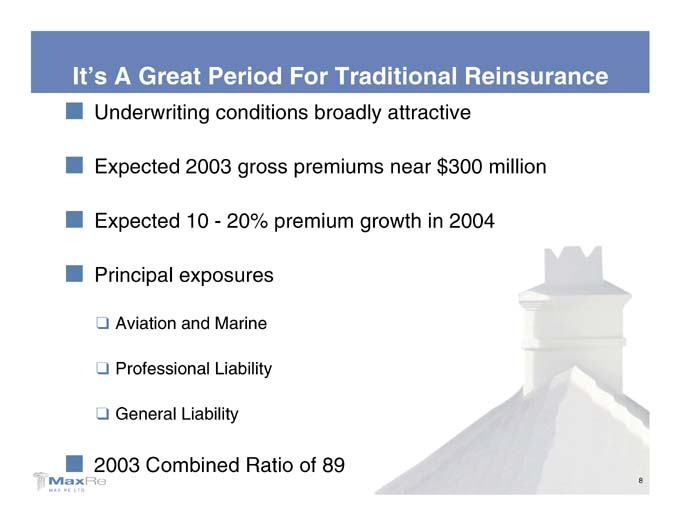
8 20% premium growth in 2004 Aviation and Marine Professional Liability General Liability It’s A Great Period For Traditional Reinsurance Underwriting conditions broadly attractive Expected 2003 gross premiums near $300 million Expected 10—Principal exposures q q q 2003 Combined Ratio of 89 . . . . .
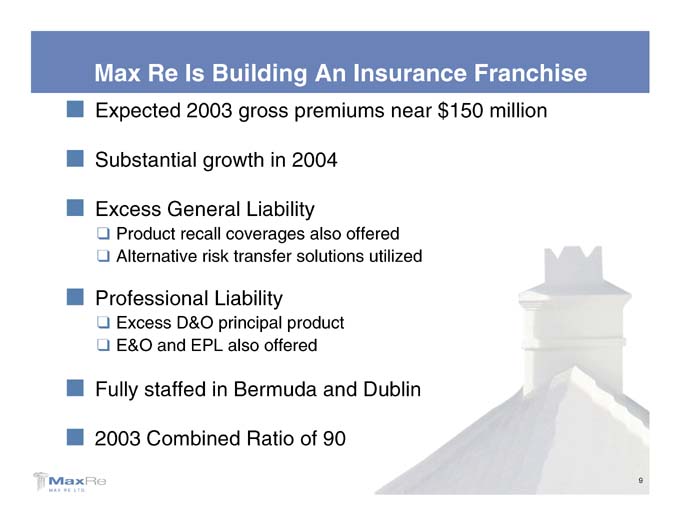
9 Product recall coverages also offered Alternative risk transfer solutions utilized Excess D&O principal product E&O and EPL also offered Max Re Is Building An Insurance Franchise Expected 2003 gross premiums near $150 million Substantial growth in 2004 Excess General Liability q q Professional Liability q q Fully staffed in Bermuda and Dublin 2003 Combined Ratio of 90 . . . . . .
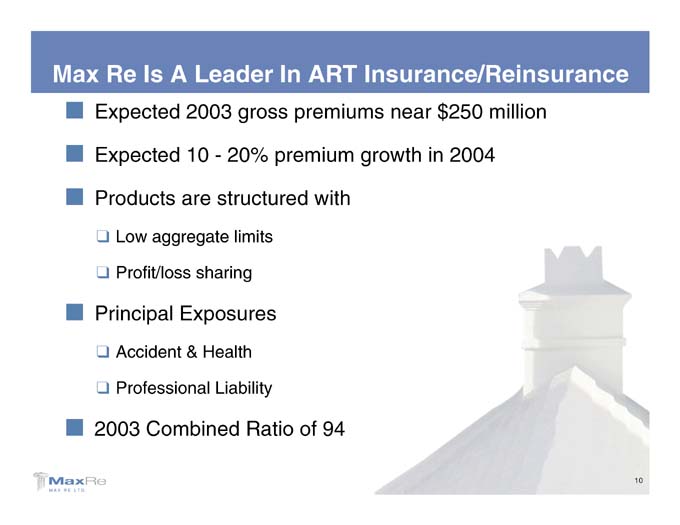
10 20% premium growth in 2004 Low aggregate limits Profit/loss sharing Accident & Health Professional Liability Expected 2003 gross premiums near $250 million Expected
10—Products are structured with q q Principal Exposures q q 2003 Combined Ratio of 94 Max Re Is A Leader In ART Insurance/Reinsurance .. . . . .

11 Investment returns drive income Current GAAP charges traded for future profitability Whole account Workers Comp Max Re Is A Leader In Structured Reinsurance Expected 2003 gross premiums near $250 million Modest premium contraction expected in 2004 Low risk spread business with masked profitability q q Principal Exposures q q . . . .
12 Disability Mortality 20% ROE not available Modest premium volume expected in 2004 Will add value to Max Re franchise in long run Principal Exposures q q Life & Annuity Reinsurance Is Currently Challenged . . . .
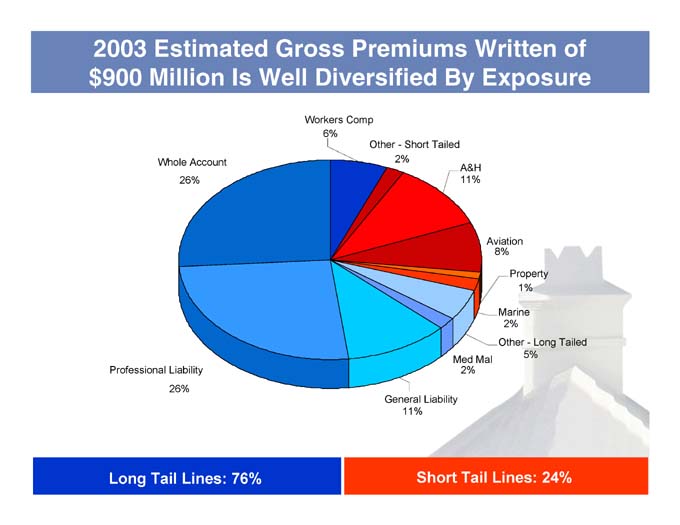
Long Tailed Property 1% 5% Marine 2% Other -Aviation8% A&H 11% Med Mal2% Short Tail Lines: 24% Short Tailed 11% 2% General Liability Other -Workers Comp 6% 26% 2003 Estimated Gross Premiums Written of $900 Million Is Well Diversified By Exposure Whole Account Professional Liability 26% Long Tail Lines: 76%

Superior Investment Strategy
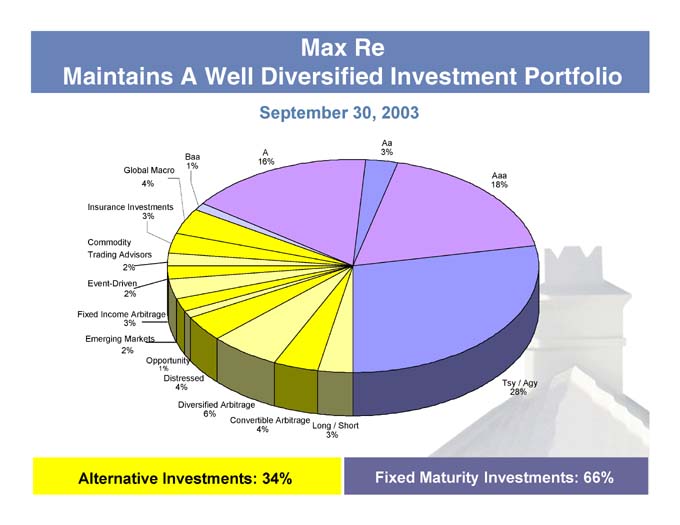
15 Tsy / Agy 28% Aaa 18% Aa 3% Fixed Maturity Investments: 66% Max Re Long / Short 3% September 30, 2003 A 16% Convertible Arbitrage 4% 6% Baa 1% Diversified Arbitrage Distressed 4% Opportunity 1% 4% 3% Maintains A Well Diversified Investment Portfolio Global Macro Insurance Investments Commodity Trading Advisors 2% Event-Driven 2% Fixed Income Arbitrage3% Emerging Markets 2% Alternative Investments: 34%
16 High Grade Fixed Maturities Portfolio Negative convexity avoided Tailored to insurance liabilities q Average credit quality of AA Minimum credit quality of BBB- Never incurred a credit event . . . .
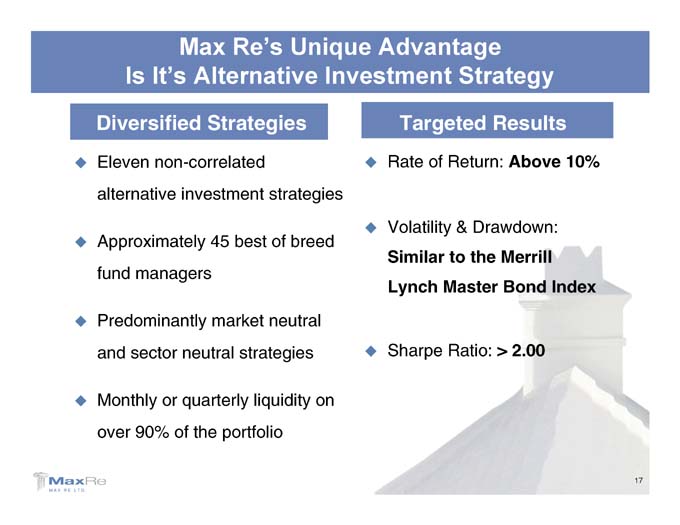
• 17 • 10% Index Above Merrill Bond 2.00 • Results Drawdown: > • Strategy the • Return: & to Master Ratio: Targeted of Volatility Similar Lynch Advantage Rate Sharpe • Investment . . • Unique breed on strategies of neutral strategies liquidity Re’s best market portfolio • Alternative Strategies 45 • Max investment neutral quarterly the of It’s non-correlated managers or Is sector Monthly 90% Diversified Eleven alternative Approximately fund Predominantly and over • . . .
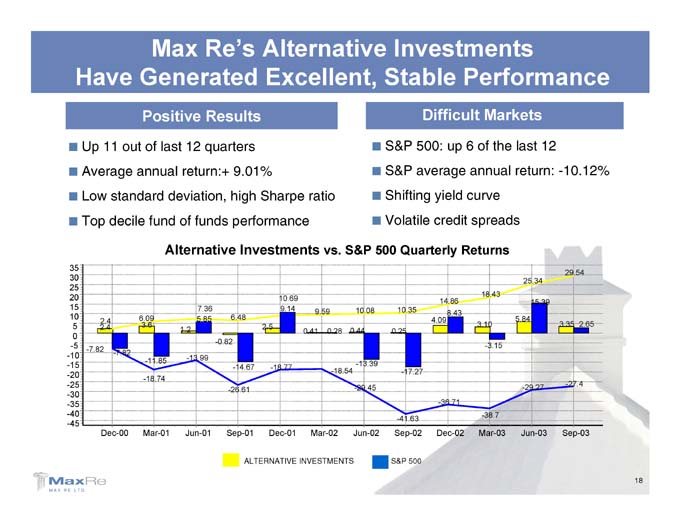
• 18 • 2.65 • -10.12% 29.54 3.35 -27.4 Sep-03 • 12 15.39 last 25.34 -29.27 Jun-03 • return: 5.84 • Markets the -3.15 of annual curve spreads 18.43 3.10 -38.7 Mar-03 • Returns • up yield credit 14.86 8.43 -36.71 Dec-02 • Difficult 500: average 4.09 • Investments Quarterly 10.35 -17.27 -41.63 Sep-02 500 • S&P S&P Shifting Volatile 0.25 S&P • . . 500 • S&P 10.08 0.44 -13.39 -29.45 Jun-02 vs. 0.28 -18.54 ratio 9.59 Mar-02 • 0.41 INVESTMENTS • Alternative 10.69 9.14 -18.77 Dec-01 • 9.01% Sharpe Investments 2.5 ALTERNATIVE • high performance 6.48 -14.67 -26.61 Sep-01 • Re’s Results -0.82 • return:+ funds 7.36 5.85 -13.99 Jun-01 • Max deviation, of Alternative 1.2
• Positive fund -11.85 -18.74 Mar-01 annual 6.093.6 • standard decile -7.82 Dec-00 • 2.42.4 • Average Low Top -7.82 • . . • Performance Stable Excellent, • quarters 12 last • Generated of • out 11 • Have Up • 30 25 20 15 10 5 0 -5 -10 -15 -20 -25 -30 -35 -40 -45
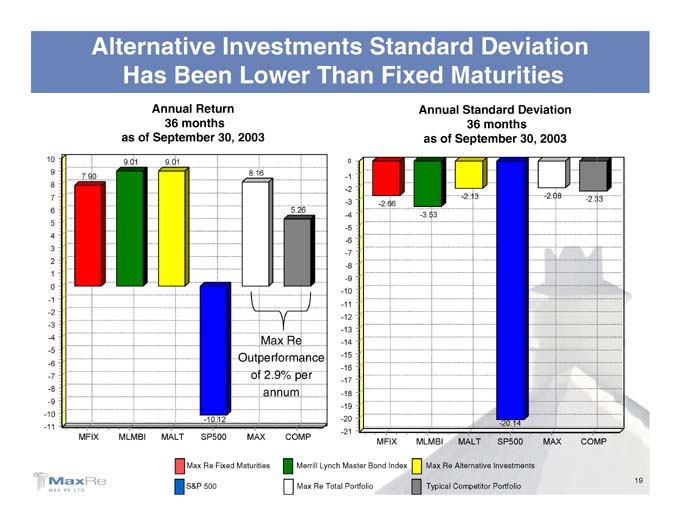
19 -2.33 COMP -2.08 MAX 36 months -20.14 SP500 as of September 30, 2003 -2.13 MALT Max Re Alternative Investments Typical Competitor Portfolio Annual Standard Deviation -3.53 MLMBI -2.66 MFIX 0 -1 -2 -3 -4 -5 -6 -7 -8 -9 -10 -11 -12 -13 -14 -15 -16 -17 -18 -19 -20 -21 Merrill Lynch Master Bond Index Max Re Total Portfolio 5.26 Max Re of 2.9% per annum COMP 8.16 Outperformance MAX -10.12 SP500 Max Re Fixed Maturities S&P 500 Annual Return 36 months 9.01 MALT Alternative Investments Standard Deviation Has Been Lower Than Fixed Maturities as of September 30, 2003 9.01 MLMBI 7.90 MFIX 10 9 8 7 6 5 4 3 2 1 0 -1 -2 -3 -4 -5 -6 -7 -8 -9 -10 -11
Leading Edge Risk Management
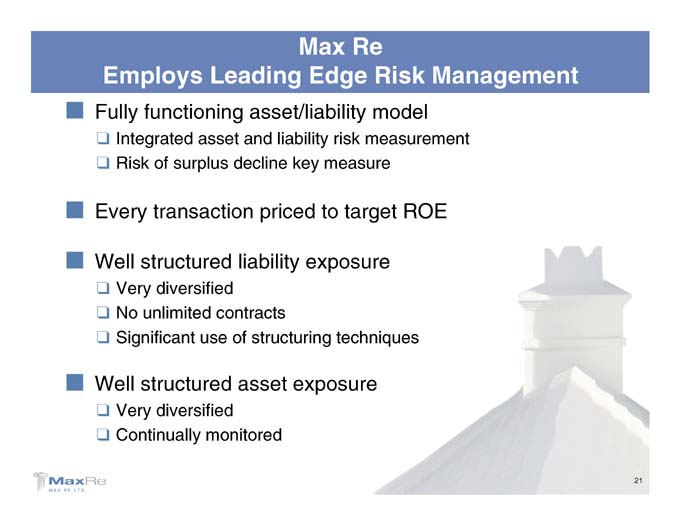
21 Max Re Employs Leading Edge Risk Management Integrated asset and liability risk measurement Risk of surplus decline key measure Very diversified No unlimited contracts Significant use of structuring techniques Very diversified Continually monitored Fully functioning asset/liability model q q Every transaction priced to target ROE Well structured liability exposure q q q Well structured asset exposure q q . . . .

22 60% quota share Max Re Manages Exposure Through Reinsurance Purchases 25% quota share Current contract construction “A” quality counter-party or fully collateralized Traditional Reinsurance (and Insurance) protected by $35 million clash cover Insurance protected by 50—Structured Reinsurance and Life Reinsurance protected by 15—Several covers for specific exposures No reinsurance recoverable issues q q . . . . .

Financial Results
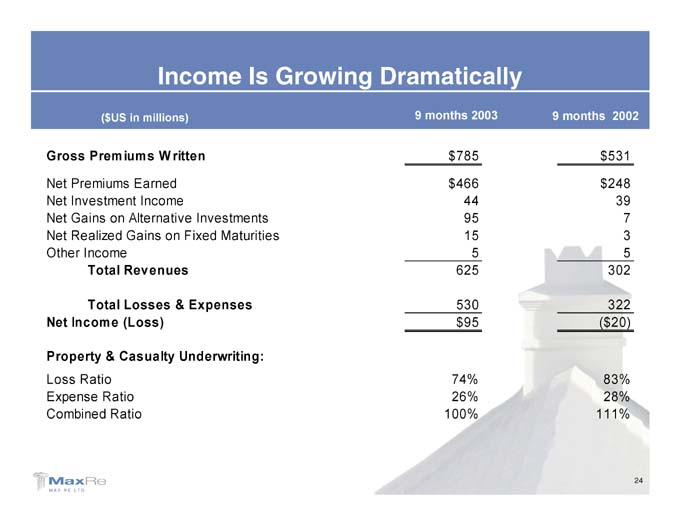
24 2002 $531 $248 39 7 3 5 302 322 ($20) 83% 28% 111% 9 months Income Is Growing Dramatically 9 months 2003 $785 $466 44 95 15 5 625 530 $95 74% 26% 100% ($US in millions) Net Premiums Earned Net Investment Income Net Gains on Alternative Investments Net Realized Gains on Fixed Maturities Total Revenues Total Losses & Expenses Gross Premiums Written Other Income Net Income (Loss) Property & Casualty Underwriting: Loss Ratio Expense Ratio Combined Ratio
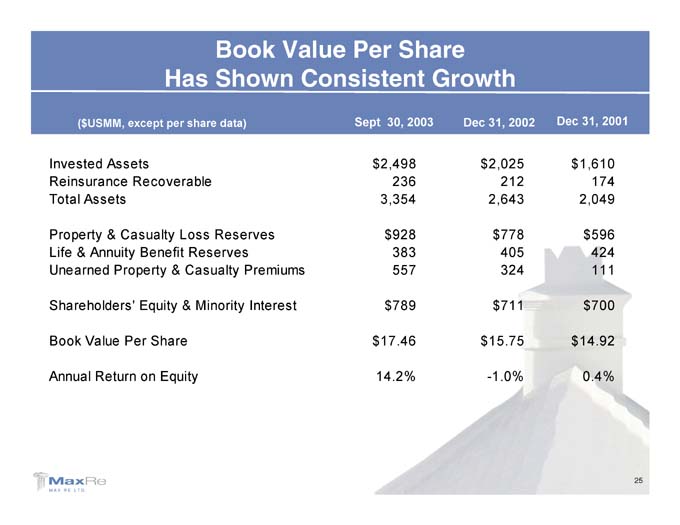
25 Dec 31, 2001 $1,610 174 2,049 $596 424 111 $700 $14.92 0.4% Dec 31, 2002 $2,025 212 2,643 $778 405 324 $711 $15.75 -1.0% 30, 2003 $2,498 236 3,354 $928 383 557 $789 $17.46 14.2% Book Value Per Share Has Shown Consistent Growth Sept ($USMM, except per share data) Invested Assets Reinsurance Recoverable Total Assets Property & Casualty Loss Reserves Life & Annuity Benefit Reserves Unearned Property & Casualty Premiums Shareholders’ Equity & Minority Interest Book Value Per Share Annual Return on Equity
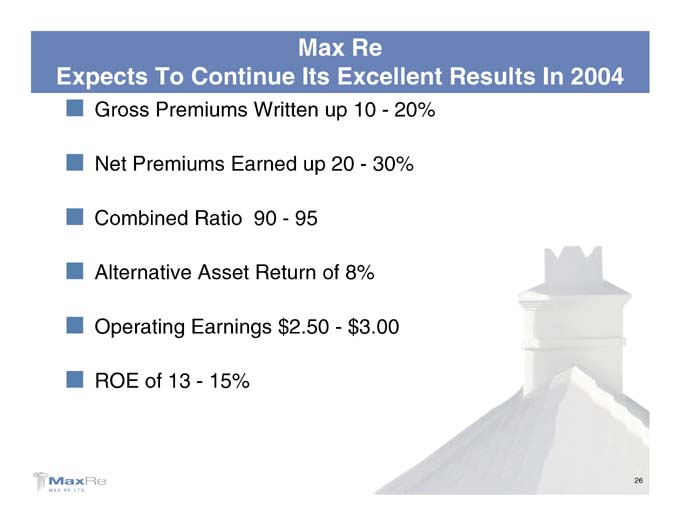
• 26 • 2004 In Results • 20% • 30% • Re Excellent 10—8% $3.00 • up 20 of—• Max Its up 95 •—Return $2.50 Written Earned 90 Asset 15% Continue Ratio Earnings -To Premiums 13 Premiums of Gross Net Combined Alternative Operating ROE • Expects . . . . .

Bermuda Angle 2003