 I N S U R A N C E / R E I N S U R A N C E B E R M U D A I R E L A N D U N I T E D S T A T E S MAX CAPITAL GROUP LTD. (formerly Max Re Capital Ltd.) Nasdaq: MXGL Investor Presentation For the quarter-ended June 30, 2007 Exhibit 99.1 |
 2 INFORMATION CONCERNING FORWARD LOOKING STATEMENTS This presentation includes statements about future expectations, plans and prospects of the Company that constitute forward-looking statements for purposes of the safe harbor provisions of the Private Securities Litigation Reform Act of 1995. Such forward-looking statements are subject to certain risks and uncertainties that could cause actual results to differ materially from those suggested by such statements, including the risk that the SEC’s view of the conclusions reached by the Audit and Risk Management Committee of the Company’s Board of Directors in connection with the internal review of three finite risk retrocessional contracts written in 2001 and 2003, which caused the Company to restate its audited financial statements for the years ended December 31, 2005, 2004, 2003, 2002 and 2001 and unaudited financial statements for the periods ended March 31, 2006 and June 30, 2006, may differ, perhaps materially, and result in material changes to information contained in the Company’s past SEC filings, including financial statements and financial information. For further information regarding cautionary statements and factors affecting future results, please refer to the Company’s Annual Report on Form 10-K for the year ended December 31, 2006 and other documents filed by the Company with the SEC. The Company undertakes no obligation to publicly update or revise any forward-looking statement whether as a result of new information, future developments or otherwise. |
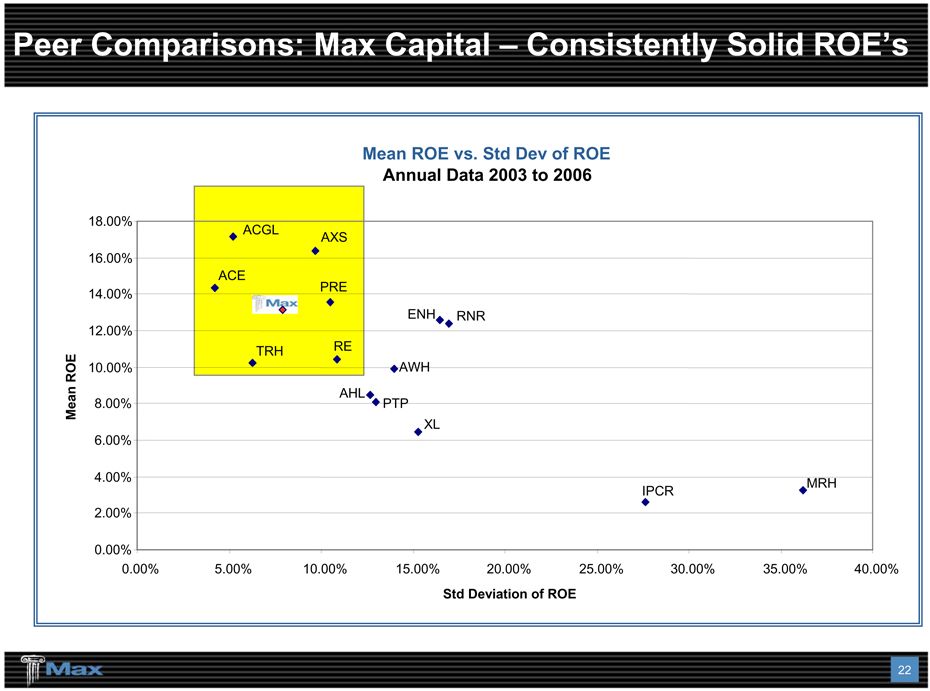
 3 Corporate Objective – Consistent Growth in Book Value Global underwriter of specialty insurance and reinsurance, with operating subsidiaries in Bermuda, Ireland and United States Property & Casualty Insurance Property & Casualty Reinsurance Life & Annuity Reinsurance U.S. Excess & Surplus Lines Insurance Growth through opportunistic expansion and addition of product lines Insurance operations established in 2003 Property Cat Reinsurance operations launched post-KRW in 2005 U.S.-based Excess and Surplus Lines Insurance Company launched in 2007 Portfolio approach to risk through integration of asset / liabilities for all transactions Operating ROE >15% in 3 of last 4 years; 2005 positive ROE with KRW At June 30, 2007 Total assets $6.3 billion Total shareholders’ equity $1.5 billion Book value per share $24.49 Combined ratio (YTD) 93% |
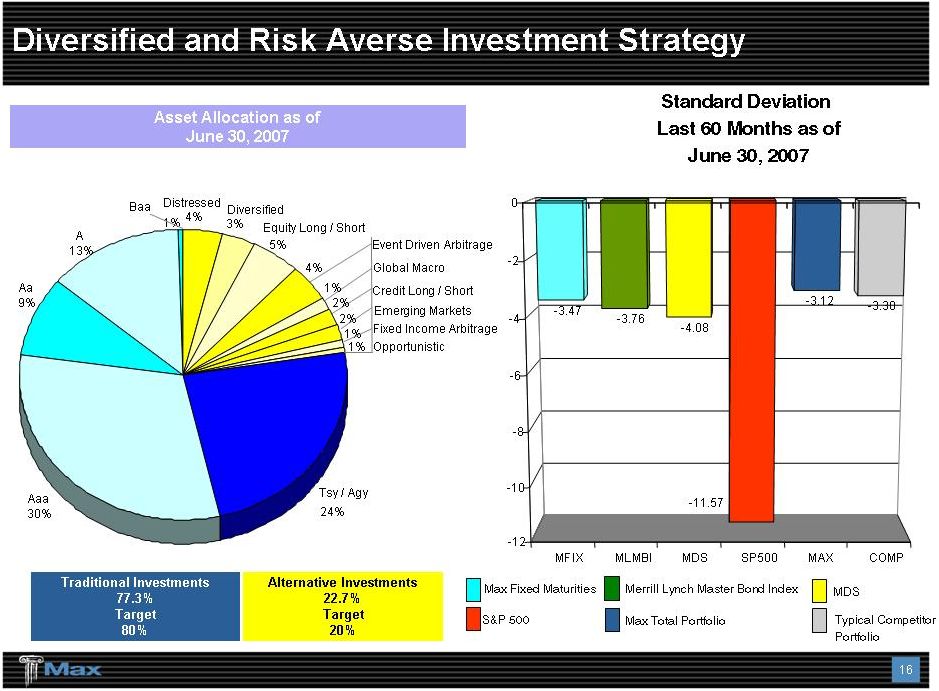
 4 A Balanced, Global Insurance / Reinsurance Business Targets Balanced P&C insurance / reinsurance underwriting Insurance 60% Reinsurance 40% Balanced exposures / focus Long-tail exposures 60% Short-tail exposures 40% Balanced geographic diversification North America 60% Europe 40% Enhanced investment strategy Traditional Fixed Maturities 80% Alternative Investments 20% |
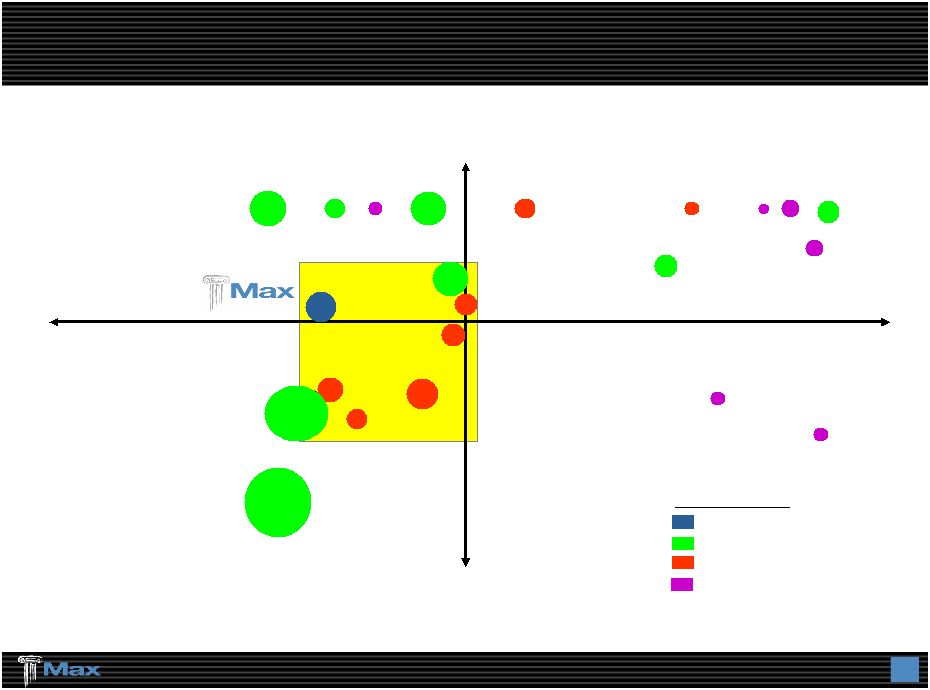 5 Diversified Premium Mix: A Key Differentiator Casualty Reinsurance Property Insurance Max Capital Group Ltd. Incumbent (Re) Insurers Bermuda Underwriters Class of 2001 White Mountains Re Lancashire Ariel Re AHL ACGL AWH PTP IPCR ENH MRH PRE RNR AXS TRH RE Harbor Point Validus Re Flagstone Re ACE Class of 2005 Source: Bank of America (except Ironshore) Ironshore XL |
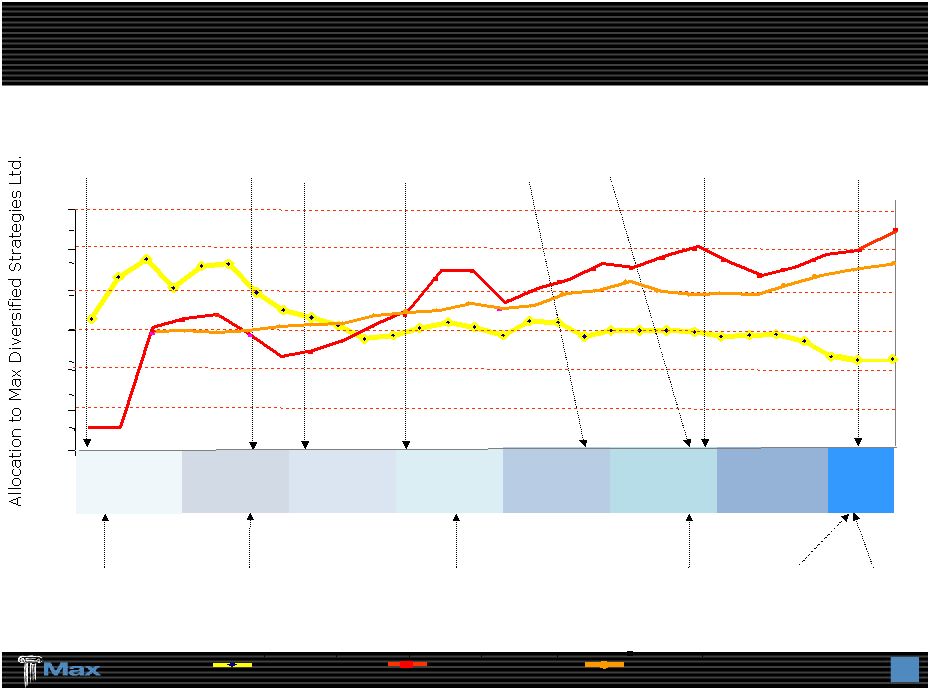 6 2003 IPO - $16 / share 9/11 Shift to Traditional Casualty Reinsurance Begins Hurricanes Katrina, Rita & Wilma Max Specialty Insurance Company Approved by Delaware Max Re Europe formed in Dublin Launch of Casualty Insurance Operations Max Insurance Europe formed in Dublin Common Share Offering – $23.50 / share Property / Cat Reinsurance Begins 2000 2002 2004 2005 2006 0% 10% 20% 30% 40% 50% 60% Start-Up Operations: P&C / Alternative Risk & Life Reinsurance Property Insurance Department Established Max USA Holdings $100m Senior Debt Issue U.S. E&S Insurance Operations Commenced Opportunistic Expansion Of The Company 2001 2007 $- $5 $10 $15 $20 $25 $30 Stock price @ 6/30/07 Book Value @ 6/30/07 MDS Allocation 22.7% $28.30 $24.49 |
 7 Core Strengths / Competitive Advantages Business strategy focused on niches / specialties Consistent financial performance and solid balance sheet Operating ROE exceeding 15% in 3 of past 4 years 2005 Exception – KRW Hurricanes – Operating ROE of 1% Enhanced investment strategy with invested assets / shareholders’ equity leverage – 3.3:1 State-of-the-art Enterprise Risk Management System No reinsurance recovery issues since inception thru June 30, 2007 Strong financial strength ratings A.M. Best “A- (Excellent)”, Fitch “A (Strong)” and Moody “A3” |
 8 Underwriting Strengths Strong quantitative orientation High percentage of employees hold professional designations FCAA, MAAA and / or ACAA, CPA and / or CA and CFA State-of-the art systems, risk controls Capital allocated to maximize return on every transaction Every transaction individually modeled Every transaction priced to target ROE Underwriters compensated on results Reinsurance purchased to manage exposures and pricing cycle Aggregation of cat and clash Line size Ceding commission Sophisticated asset / liability model Integrated asset and liability risk measurement Alternative investments allocated by risk duration Surplus decline is key risk measure |
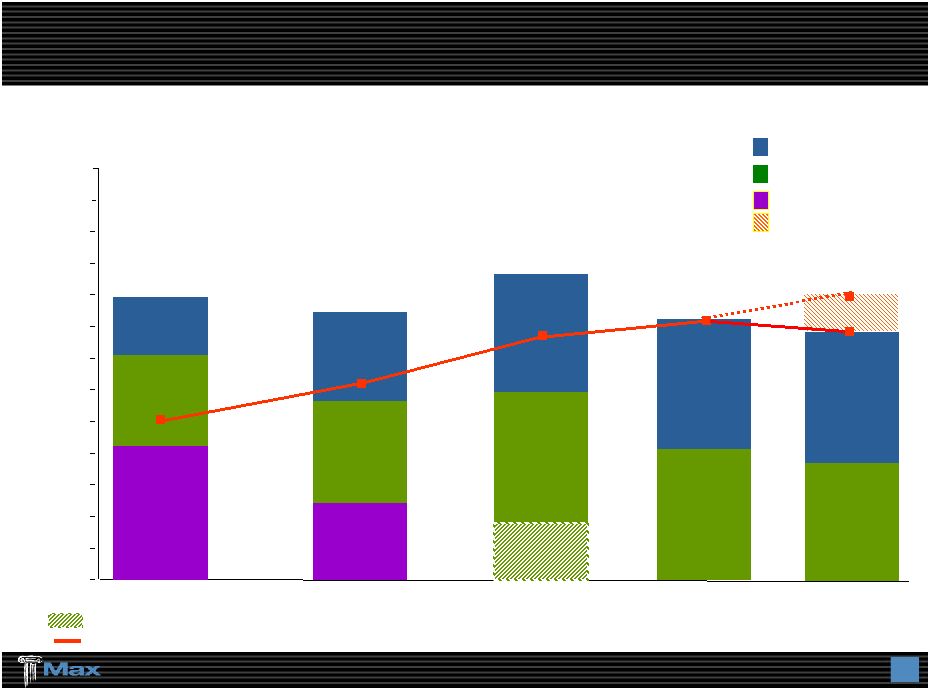 9 P & C Reinsurance Growth of P&C Insurance / Reinsurance Maximizes ROE P&C Annual Gross Premiums Written ($ in millions) P & C Insurance 2003 400 500 600 700 800 900 1,000 100 200 300 0 1,100 1,200 1,300 P&C Alternative Risk Non-recurring additional premiums on prior years’ contracts of $182 million Total P&C Insurance / Reinsurance excluding Alternative Risk and non- recurring additional premiums on prior years’ contracts (year-on-year change) 2006 2005 2004 $902 $831 $971 (+4%) (+36%) (+21%) $820 $ millions 2007 Rolling 12 months $778 (-5%) $903 Max Specialty (expected) (+10%) |
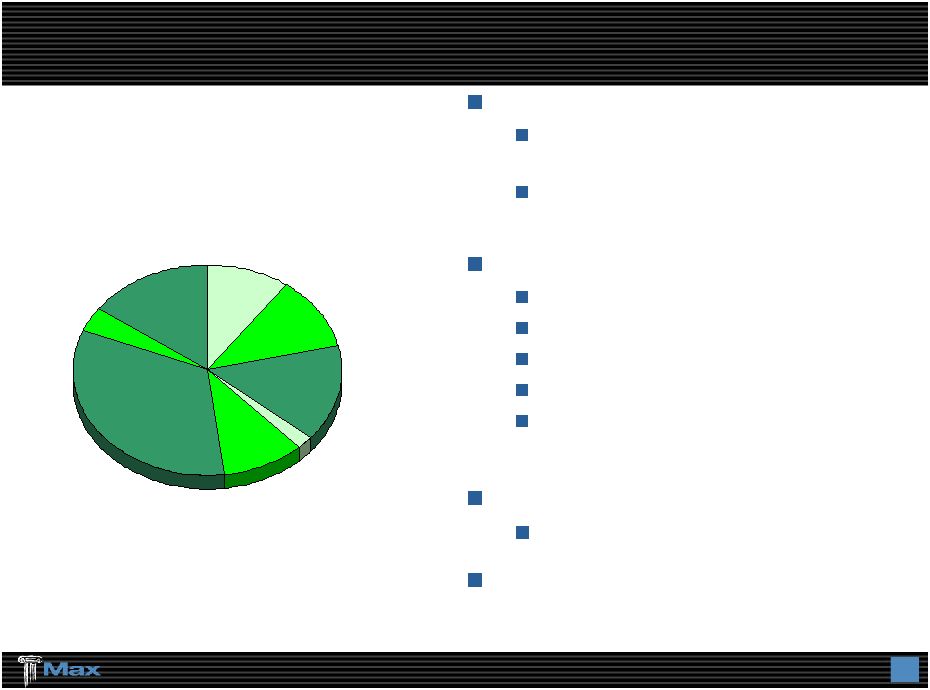
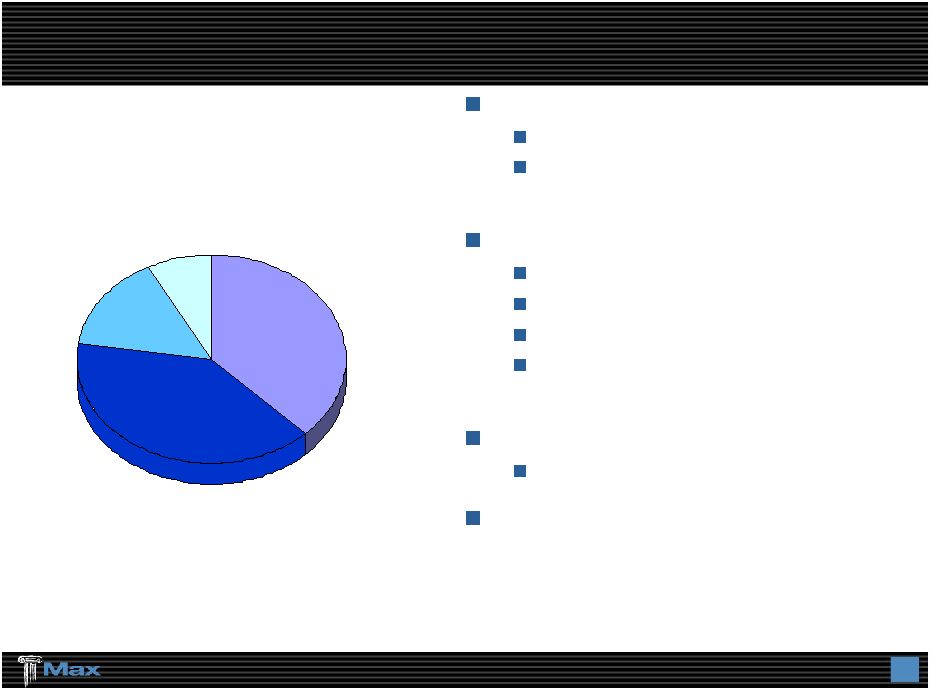 10 P&C Insurance: Our Fastest Growing Business Target: Working layer excess business Larger customer – Fortune 1000 Customer-oriented approach: Responsive and innovative Consider toughest classes of business Offer multi-year programs Flexible in program attachment points Work with all leading brokers Underwritten in Bermuda and Dublin 71% Combined Ratio for 2006 Gross Premiums Written – 2007 Rolling 12 months $403 million By Exposure General Liability 39% 38% Professional Liability Property 15% Aviation 8% |
 11 P&C Reinsurance: A Well-Diversified Underwriting Book Target: Working layer excess business / quota share business Specialty / niche focus Customer-oriented approach: Quick turnaround Line-specific expertise Net line underwriter (stability of capacity) Cross-class capability Modeling and structuring capabilities Work with all leading brokers Underwritten in Bermuda and Dublin 94% Combined Ratio for 2006 Gross Premiums Written - 2007 Rolling 12 Months $365 million By Exposure 11% Aviation 10% Property, Marine, Energy, 33% Whole Account, 4% Workers Compensation, 15% Medical Malpractice, 15% Other, 2% Professional Liability, 10% General Liability, |
 12 Max Specialty Insurance Company Nationwide underwriter of property and casualty insurance, focused on profitable excess and surplus lines niches Operating on a surplus lines non-admitted basis in 46 States Approvals pending – California, Colorado, Louisiana, New Hampshire Well-known and respected management team with a proven track record of controlled growth and profitability Distribution system Select group of national brokers and regional Managing General Agencies with whom management has close relationships for 20+ years Two distinct channels - brokerage & contract binding – seeking to provide stability through all market cycles Current employees – approximately 50 Locations – Richmond, Atlanta & Philadelphia Affiliated service company office in San Francisco |
 13 Max Specialty Insurance Company 2007 Plan: Gross written premium: $100 to $150 million ($40 - $60 million net) Product lines: Brokerage Property (Cat & Non-Cat) Middle Market Property Inland Marine Casualty Umbrella & Excess Liability Contract Binding Property (Non-Cat) Inland Marine Casualty Umbrella & Excess Liability Long-term underwriting objectives: Products priced and underwritten so net incurred loss ratios do not exceed 55% Expense ratios less than 35% Combined ratio less than 85% |
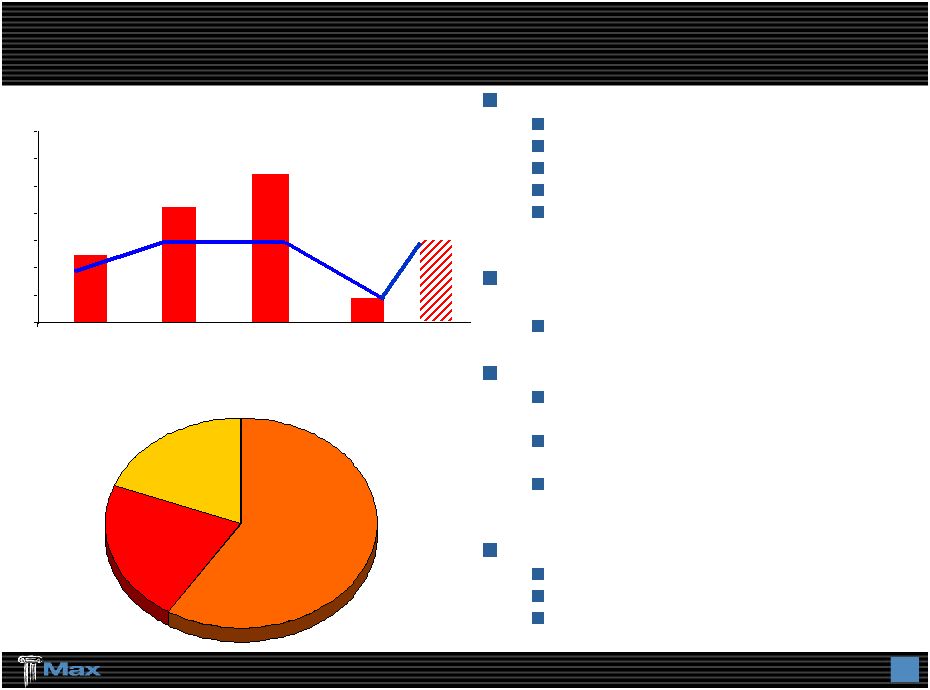 14 Life Reinsurance - Long-Tail, Reserve Buy-Out Business Specialize in: Investment spread business In force, closed / ring-fenced books Mortality, morbidity & longevity Predictable cash flows Asset heavy – no interest sensitive liabilities Closed block reserve buy-out transactions Almost no IBNR Deals per year & deal sizes varies Transactions are large and timing is seller driven Target North America & European Life, Health and Annuity Companies 18 transactions completed with 14 counterparties since inception Differentiated by: Detailed data focus Strong actuarial analysis Bermuda efficiencies Gross Premiums Written US$ Millions $0 $50 $100 $150 $200 $250 $300 $350 2003 2004 2005 $108 $212 $275 2 3 $45 1 2006 3 2007 Target 2/3 $150 Annuity, 59% Life, 22% Health,19% Reserves & Deposits 6/30/2007 $958 million |
 |
 |
 17 De Minimus Exposure to Sub-prime Approximately $40 million par value of bonds have exposure to sub- prime collateral All are high quality, short average life $35 million AAA, $5 million AA+ Most have average lives less than 1 year Significant and growing over-collateralization Most with 30-50% over-collateralization Most issued between 2003 and 2005 Over-collateralization on most has grown in the last 3 months Through July 2007, default and delinquency rates remain in the low single digits Through August 13, 2007, peak to trough mark to market loss is approximately $2 million Alternative asset portfolio held a net short position at June 30, 2007 Based upon stress testing analysis we expect no principal losses from our sub-prime-backed bonds |
 18 YTD June 30, 2007 and Year – End 2006 Results 2006 ($ in millions) YTD June 30, 2007 Gross Premiums Written $455 $865 Net Premiums Earned $277 $665 Net Investment Income 89 150 Net Gains on Alternative Investments 122 85 Net Realized Gains (Losses) on Sale of Fixed Maturities (1) (6) Other Income - 1 Total Revenues 487 895 Total Losses & Expenses 316 678 Net Income Before Taxes $171 $217 Property & Casualty Underwriting Loss Ratio 70% 68% Expense Ratio 23% 18% Combined Ratio 93% 86% |
 19 Cash & Fixed Maturities $3,734 $3,470 Alternative Investments 1,097 1,066 Premium Receivables 467 391 Losses Recoverable 605 538 Other Assets 400 384 Total Assets $6,303 $5,849 Property & Casualty Losses $2,443 $2,335 Life & Annuity Benefits 878 896 Deposit Liabilities 222 204 Funds Withheld 252 255 Unearned Premium 490 436 Bank Loans / Swap (1) 285 150 Senior Notes 100 - Other Liabilities 161 183 Total Liabilites $4,831 $4,459 Shareholders' Equity $1,472 $1,390 $6,303 $5,849 Strong Balance Sheet December 31, 2006 June 30, 2007 ($ in millions) (1) Includes a $235 million collateral related transaction for our reinsurance business. In substance, a Total Return Swap with sale of MDS shares in exchange for cash. Cash received from sale of MDS shares is included in Cash & Fixed Maturities. Return from MDS shares is received in exchange for a payment of interest at LIBOR plus a spread. |
 20 Profitable Financial Trends Despite Hurricanes in 2005 Gross Premiums Written ($ in millions) -3% 0% 5% 10% 15% 20% $0 $300 $600 $900 $1,200 $1,500 P&C Combined Ratio 0% 30% 60% Operating Earnings Per Share (Diluted) Operating ROE 80% 100% 0 $1 $2 2006 17.3% 2006 2006 $865 86% Life $45 2006 $3.52 $3 $4 Life $275 1.0% 2005 $1,246 2005 2005 106% 2005 $0.19 2004 2004 Life $212 2004 15.8% 2004 $1,044 94% $2.70 16.5% 2003 $1,010 2003 2003 100% 2003 $2.58 Life $108 Annualized 2007 YTD 6/30/07 YTD 6/30/07 93% Life $1 YTD 6/30/07 $2.72 $455 24.5% |
 21 A Growing, Global Insurance / Reinsurance Company Invested Assets (Ratio to Shareholders’ Equity) $0 $1,000 $2,000 $3,000 $4,000 Operating Cash Flow $0 $200 $400 $600 Shareholders’ Equity (Book Value per Share) $0 $500 $1,000 $1,500 Dividends Per Share $0.00 $1.00 ($ in millions) $5,000 2006 2006 2006 2006 $529 $1,390 ($23.06) $0.24 $4,536 (3.3:1) $4,223 2005 $395 2005 2005 $1,186 ($20.16) $0.18 2005 (3.6:1) $3,514 2004 $607 2004 2004 $903 ($19.70) $0.12 2004 (3.9:1) $2,637 2003 $397 2003 2003 $763 ($16.88) $0.09 2003 (3.5:1) 6/30/2007 6/30/2007 YTD 6/30/07 YTD 6/30/07 $1,473 ($24.49) $0.14 $4,831 (3.3:1) $128 |
 |
 23 Peer Comparison: Max Capital - Highest Total Shareholder Return over last 5 years Note: The peer set includes Arch Capital Group Ltd. (ACGL), Aspen Insurance Holdings Limited (AHL), Axis Capital Holdings Limited (AXS), Endurance Speciality. (ENH), IPC Holding (IPCR), Odyssey Reinsurance (ORH), Montpelier Re Holding (MRH), Partner Re Holdings (PRE), Platinum Underwriters Holding (PTP), Renaissance Holding (RNR). Data includes only the companies public during the measurement period. (1) Defined as share price appreciation plus reinvested dividends cumulatively over the time period, as of 8/1/07 1, 2 & 5 Year Cumulative TSRs (1) 1-year 2-year cumulative N.A. 5-year cumulative Source: Credit Suisse (11.6%) 16.1% 5.2% 31.5% 27.0% 26.7% 18.6% 17.4% 17.1% 14.5% 12.7% 6.0% (10.9%) S&P 500 S&P Reinsurance Index ORH AXS ENH PTP MXGL PRE ACGL RNR AHL MRH IPCR (53.9%) (35.6%) (9.7%) (2.2%) 1.7% 15.0% 16.1% 32.4% 33.0% 40.2% 51.4% 2.7% 22.4% S&P 500 S&P Reinsurance Index ACGL ORH AXS RNR MXGL PRE ENH PTP AHL IPCR MRH 74.8% 75.9% 167.3% 158.6% 145.4% 65.9% 59.5% (13.0%) S&P 500 S&P Reinsurance Index MXGL ACGL ORH PRE RNR IPCR ENH MRH PTP AHL AXS |
 I N S U R A N C E / R E I N S U R A N C E B E R M U D A I R E L A N D U N I T E D S T A T E S MAX CAPITAL GROUP LTD. (formerly Max Re Capital Ltd.) Nasdaq: MXGL Investor Presentation As of Quarter-end - June 30, 2007 |