 I N S U R A N C E / R E I N S U R A N C E B E R M U D A I R E L A N D U N I T E D S T A T E S Strategy Update Asset Allocation, Performance and Alternative Investments October 13, 2008 Exhibit 99.2 |
 2 INFORMATION CONCERNING FORWARD LOOKING STATEMENTS This presentation includes statements about future economic performance, finances, expectations, plans and prospects of the Company that constitute forward-looking statements for purposes of the safe harbor provisions of the Private Securities Litigation Reform Act of 1995. Such forward-looking statements are subject to certain risks and uncertainties that could cause actual results to differ materially from those suggested by such statements. For further information regarding cautionary statements and factors affecting future results, please refer to the Company’s most recent Annual Report on Form 10-K , Quarterly Reports on Form 10-Q filed subsequent to the Annual Report and other documents filed by the Company with the SEC. The Company undertakes no obligation to update or revise publicly any forward-looking statement whether as a result of new information, future developments or otherwise. Past performance should not be considered to be a reliable indicator of future performance |
 3 Max Capital’s alternative investment portfolio return was negative but in-line with the overall hedge fund industry for Q3 2008 In combination with Max Capital’s fixed income portfolio the total portfolio performance compares favorably to other Benchmark Indices in 2008 Max Capital continues to rebalance its alternative investments portfolio to return to a more balanced, market neutral / absolute return focus Significant redemption activity in the alternative investments portfolio will reduce exposure over the next two quarters to this asset class closer to the mid point (15%) of Max Capital’s revised alternative investments allocation range of 10% - 20% The Company believes a less volatile, more market neutral alternative investments benchmark portfolio has been created and will be used going forward to monitor risk and measure relative returns Overview |
 4 Max Capital’s invested assets allocation As of June 30, 2008, 80% allocated to high-grade (A and above) fixed income securities and 20% to a highly-diversified, un-leveraged alternative investments portfolio Commencing October 1, 2008, 80-90% allocation target for high-grade, fixed income securities and 10-20% allocation target for alternative investments This mix is generally expected to provide a smoothing effect to total portfolio returns Max Capital’s alternative investments allocation, while historically beneficial from a book value growth and income perspective, adds quarterly volatility to Max Capital’s financial statements Volatility is higher over any short term period but tends to dissipate over longer term Volatility results from the necessity of recording changes in market value of the alternative investments portfolio through income rather than through equity Overall Investment Strategy |
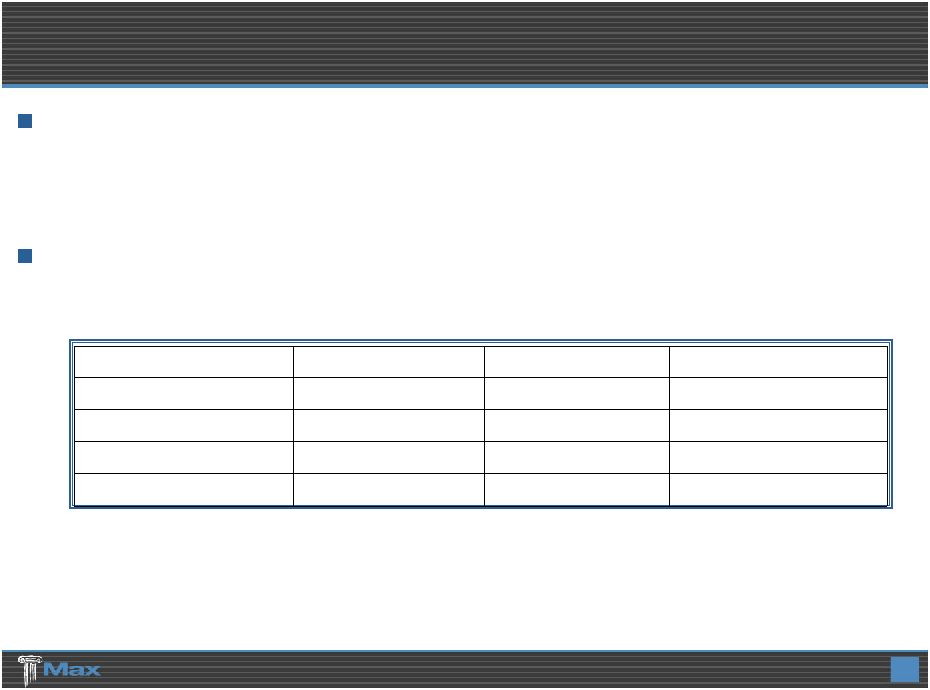
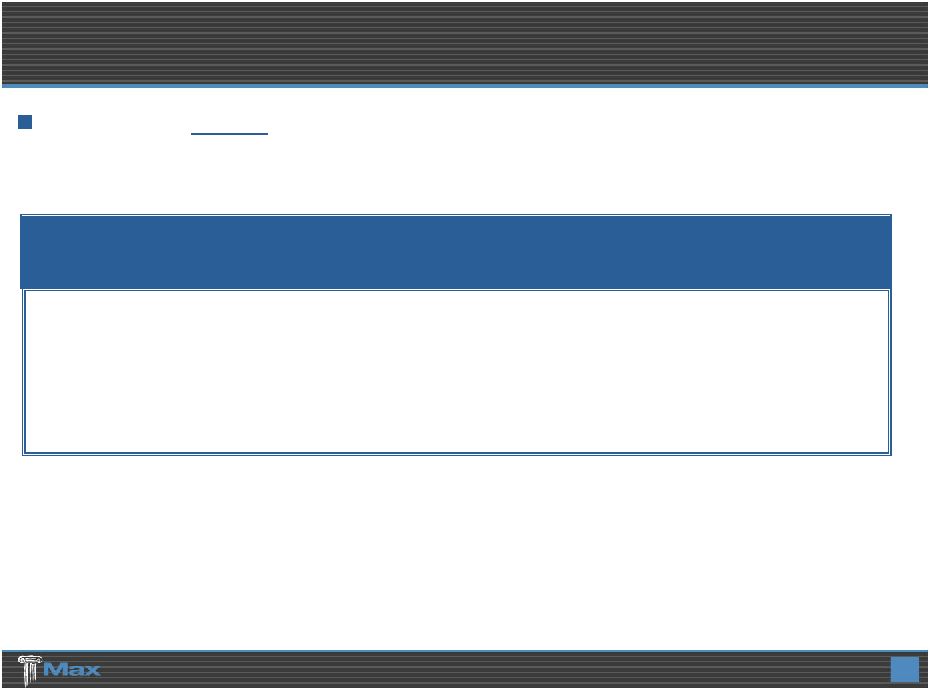 5 Total Portfolio Performance 80.0% 20.0% -2.19% -2.85% 5,237,010,000 Total Investments Portfolio 0.80% 0.31% 4,187,991,000 Cash & Fixed Income Portfolio -11.97% -12.93% 1,049,019,000 Alternative Investments Portfolio YTD 2008 Return Q3 2008 Return Market Value (USD) @ 6/30/2008 Max Capital’s overall investment portfolio performance was in line with other Benchmark Indices in 2008 . |
 6 Alternative Investments Contribution Max Capital’s alternative investments portfolio over the course of Max Capital’s existence has contributed significantly to portfolio returns and book value growth |
 7 Q3 2008 hedge fund returns were the worst since hedge fund industry record-keeping began Max Capital’s alternative investments portfolio, composed of a diversified strategy of underlying funds, had a significant negative return for the quarter Over multiple term time periods, Max Capital’s total portfolio compares favorably to other Benchmark Indices with lower volatility Alternative Investments Portfolio 3.19% 5.14% 7.97% 10.38% -2.19% -2.85% Max Capital Total 3.59% 4.08% 8.29% 7.17% 1.05% -0.28% ML Master 6.34% 1.92% -6.16% 5.44% -11.00% -10.91% 5 - 7 Year Corporate A 4.88% 3.83% 0.10% 5.70% -5.30% -5.37% 5 - 7 Year Corporate BBB 6.59% 7.01% -8.73% 2.09% -10.60% -9.48% High Yield 10.52% 6.42% -14.85% 5.49% -19.29% -8.37% S&P 500 5.63% 5.57% -3.93% 10.26% -12.87% -10.70% Fund of Funds Index 6.06% 7.05% 2.79% 16.78% -11.97% -12.93% Max Capital AI Portfolio Std Dev 2003-2008* 2007-2008 2007 2008 YTD Q3 2008 * Annualized Past performance should not be considered to be a reliable indicator of future performance |
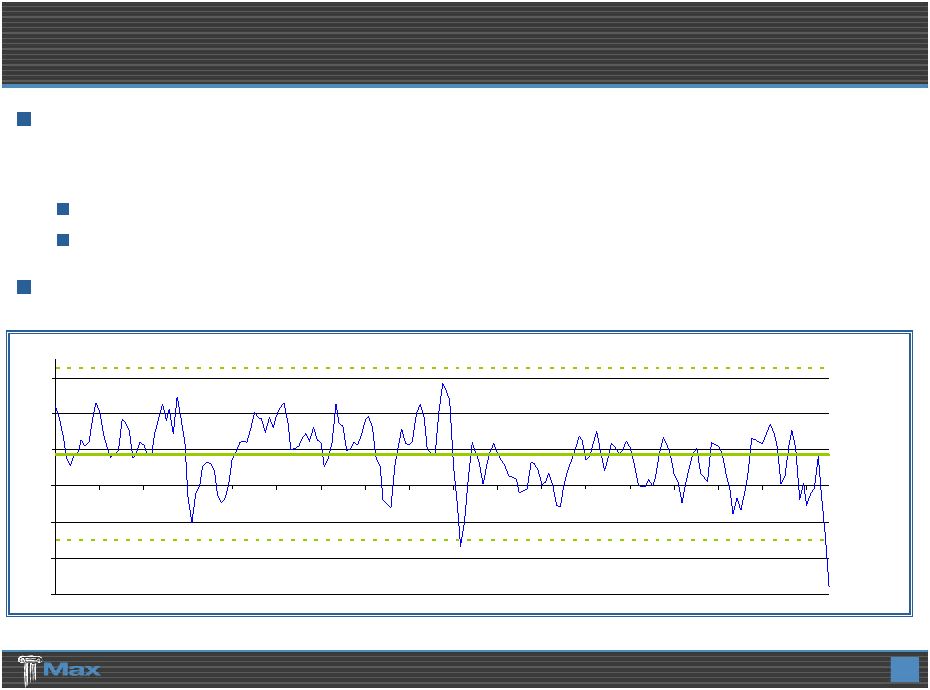 8 Q3 2008’s negative results significantly exceeded the drawdown expectations for Max Capital’s alternative investments, an un-leveraged, diversified, “fund-of-funds” portfolio. 0.000178% probability of a 3 month drawdown greater than or equal to 12.93% a 4.64 standard deviation event Most of this downside was a product of the meltdown in the market. -3 standard deviations -12 -8 -4 0 4 8 12 3/91 3/92 3/93 3/94 3/95 3/96 3/97 3/98 3/99 3/00 3/01 3/02 3/03 3/04 3/05 3/06 3/07 3/08 mean +3 standard deviations Alternative Investments Portfolio |
 9 During 2006, Max Capital reduced the number of managers from 55 to 35 Max Capital’s alternative investments portfolio became more concentrated in 2 strategies – Event Driven and Long/Short Equity Concentration led to significant out-performance in 2007 Max Capital began to reduce concentration in mid 2008 but did not avoid the significant under-performance of these strategies in Q3 Individual managers were hindered by large, concentrated positions as Max Capital sought to liquidate these positions and return to a more neutral position 2.79% -11.97% 16.78% Max Capital’s Alternative Assets Portfolio 0.90% -12.87% 2008 YTD (thru Q3) 6.52% 10.26% 2007 6.72% -3.93% 1/2007 thru 9/2008 Variance Fund of Funds Composite Index (HFRI*) Alternative Investments Portfolio – Tactical Decisions * HFRX for September 2008 |
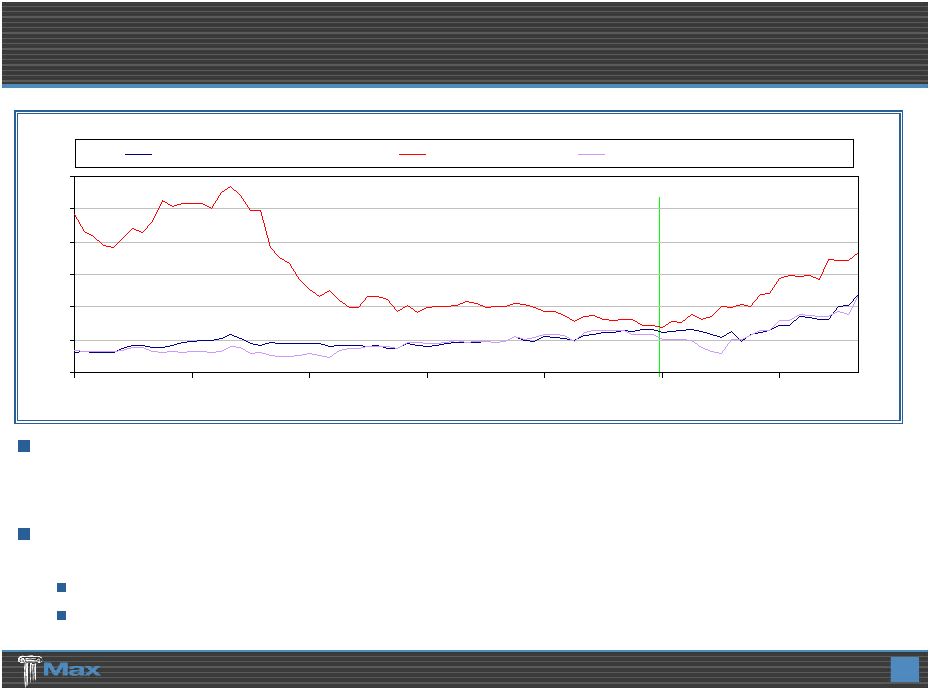 10 The increase in market volatility, the volatility of alternative investments in general, as well as the decrease in market liquidity has led to higher risk of drawdown in any given time period This, and Max Capital’s increase in exposure to short tail liabilities, has changed Max Capital’s view as to the size and construction of its alternative investment portfolio Target allocation becomes 10% to 20% Return to original portfolio construction and objectives – market neutral / absolute return Rolling 12 Month Volatility Manager/Style Concentration 0 4 8 12 16 20 24 1/02 1/03 1/04 1/05 1/06 1/07 1/08 Alternative Investments S&P 500 Fund of Funds Composite Index |
 11 In mid-2008, Max Capital initiated a series of fund redemptions to rebalance the alternative investments portfolio This rebalancing continues and redemptions are expected to be substantially complete by year-end 2008 Reinvestment activity is expected to continue into 2009 as due diligence is completed in the alternative investment new manager selection process and as financial markets stabilize In the interim, cash balances in Max Capital’s alternative investments portfolio are expected to continue to grow and any new cash from operations is intended to flow to the Fixed Income portfolio Redemption Activity |
 12 Lower volatility of monthly, quarterly and annual returns Lower probability of a drawdown below a fixed floor for any time period Higher degree of diversification in both the number of strategies employed and the number of underlying managers Lower correlation and / or exposure to relevant market factors Expectations For Revised (Effective 10/1/2008) Alternative Investments Guidelines |
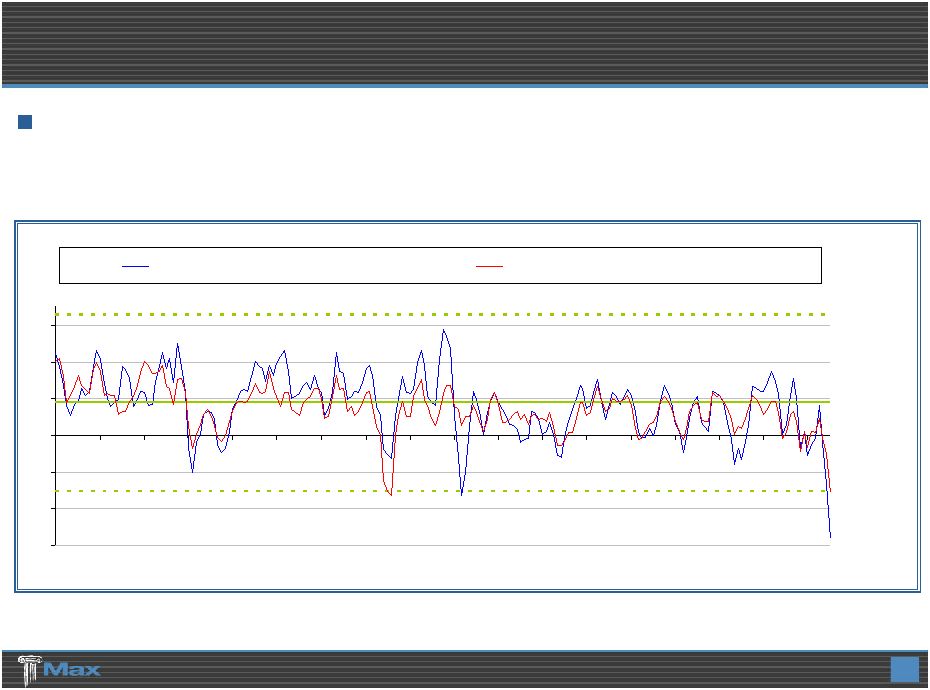 13 Historic Benchmark Performance mean +3 standard deviations -3 standard deviations Back-testing of the benchmark portfolio results in a lower drawdown in both Q3 2008 and on a year-to-date basis -12 -8 -4 0 4 8 12 3/91 3/92 3/93 3/94 3/95 3/96 3/97 3/98 3/99 3/00 3/01 3/02 3/03 3/04 3/05 3/06 3/07 3/08 Alternative Investments Portfolio New Alternatives Investments Benchmark |
 14 High Quality Cash & Fixed Income Portfolio -133,000,000 4,193,000,000 4,060,000,000 9/30/2008 (estimate) -93,175,000 4,281,166,000 4,187,991,000 6/30/2008 -9,588,000 4,176,044,000 4,166,456,000 3/31/2008 -24,132,000 4,085,014,000 4,060,882,000 12/31/2007 Unrealized Gain / Loss Book Value Market Value In addition to holding a significant cash balance, spreads on Max Capital’s significant treasury, agency and agency MBS holdings (in total approximately 49% of book value) have held or narrowed through Q3 2008 to produce a year- to-date positive return on the fixed income portfolio Corporate and ABS fixed income holdings suffered from unprecedented spread- widening in Q3 2008 |
 15 Average quality of AA+ 80%+ of fixed income securities rated Aa or better Less than 2% rated Baa or below Approximately 49% of portfolio is Cash, Governments, Agencies, and Agency MBS Cash balance is approximately $650 million or 16% of the portfolio U.S. and G7 governments approximately $600 million or 15% of the portfolio U.S. Agencies approximately $250 million or 6% of the portfolio U.S. Agency MBS approximately $470 million or 12% of the portfolio Corporate Holdings are well diversified Approximately 35% of the portfolio Approximately 200 different corporate issuers Largest “Aa” issuer is less than 1% of the portfolio Largest “A” issuer is less than 0.5% of the portfolio No CDO’s, CLO’s, SIV’s or other highly structured securities High Quality Cash & Fixed Income Portfolio |
 16 Remaining portfolio is high quality ABS, CMO and CMBS Holdings Almost all CMO holdings are rated AAA, with substantial portion being agency CMO’s Almost all CMBS holdings are rated AAA Principal losses, if any, are expected to be minimal based upon cash flow and stress testing ABS holdings are largely comprised of plain vanilla auto and credit cards Home equity ABS holdings amount to approximately $50 million (all Subprime and Alt – A) Subprime and Alt – A exposures are approximately $92 million book value 91% are AAA rated securities 2.3 year weighted average life Significant over-collateralization No principal losses are expected based upon cash flow and stress testing Unrealized loss of approximately $16 million Credit Risk Issues are Relatively Small at September 30, 2008 No Washington Mutual securities held $15 million Lehman bonds, fair value of $2 million ($13 million impairment charge) $13 million AIG related bonds, fair value of $10 million ($3 million unrealized loss) No equity, preferred, or equity linked securities in the portfolio Besides Lehman, only one security (a military housing bond) is in arrears on either principal or interest $3 million position, fair value of $2.3 million ($700 thousand loss) Limited Credit & Structure Risk |