 Max Capital Group Ltd. NASDAQ: MXGL INVESTOR PRESENTATION QUARTER ENDED – DECEMBER 31, 2008 S P E C I A L T Y I N S U R A N C E & R E I N S U R A N C E B E R M U D A I R E L A N D U N I T E D S T A T E S LLOYD’S Exhibit 99.1 |
 2 2 INFORMATION CONCERNING FORWARD LOOKING STATEMENTS This presentation includes statements about future economic performance, finances, expectations, plans and prospects of the Company that constitute forward-looking statements for purposes of the safe harbor provisions of the Private Securities Litigation Reform Act of 1995. Such forward-looking statements are subject to certain risks and uncertainties that could cause actual results to differ materially from those suggested by such statements. For further information regarding cautionary statements and factors affecting future results, please refer to the Company’s most recent Annual Report on Form 10-K , Quarterly Reports on Form 10-Q filed subsequent to the Annual Report and other documents filed by the Company with the SEC. The Company undertakes no obligation to update or revise publicly any forward-looking statement whether as a result of new information, future developments or otherwise. |
 3 3 Max Capital Today Expert underwriter of specialty insurance and reinsurance risks Four global operating platforms in Bermuda, Dublin, United States, and London Balanced business mix between insurance, reinsurance, property, casualty Geographic and product diversification to execute during all phases of the underwriting cycle Highly experienced management with proven track record Opportunistic and disciplined underwriting strategy Expand product lines with experienced underwriting teams Risk and capital management culture Pricing models based on ROE objectives Strong, liquid balance sheet with solid financial strength ratings $1.52 billion in total capital; $1.28 billion in shareholders equity Excellent liquidity with $508.7 million of operating cash flow in 2008 Repositioning the investment portfolio to reflect traditional underwriting base No longer the alternative risk transfer company with a high percentage of hedge fund exposure that was founded in 1999 |
 4 4 2008: Strong Operating Year Offset By Investment Volatility Profitable 2008 underwriting results despite high industry cat events Total GPW of $1.3 billion up 16.3%; Max Specialty GPW: $194 million Hurricane Gustav and Ike net loss estimate of approximately $50 million, net of reinstatement premiums Overall combined ratio of 91.9% Total Investment Portfolio Return: -0.09% Max Fixed income Return: 4.66% Max Alternative Investments Return: -19.27% HFRI Fund of Fund’s Index return: -20.97% Allocation to alternative investments reduced to 14.1% at 12/31/08 from 20.7% of total invested assets at 12/31/07 Actively managed capital with $130 million returned to shareholders $110 million share repurchases $20 million dividend Ratings reaffirmed during the Q4 Outlook changed to “positive” from “stable” by AM Best and S&P Continued to build out the global platform with Max at Lloyd’s Provides entry into the world’s most famous specialty insurance market |
 Max Is Positioned For A Better Underwriting Market in 2009 Max Bermuda and Dublin (Insurance/Reinsurance) Rates rising in short-tail property cat, energy, marine Long-tail lines have stabilized and stopped declining Max Specialty Strong distribution relationships continue to generate a high flow of business Market dislocations provide the opportunity to add teams and new products Benefiting from improving property rates Profitability improving as the business matures and can retain more business Max at Lloyd’s Newest platform to Max that provides access to global specialty business, high credit ratings, worldwide licenses Experienced team underwriting a seasoned book of business Opportunity to recruit new teams in attractive product lines International casualty reinsurance Marine and personal accident insurance Life Reinsurance Only writes “closed” blocks of business with no variable annuity exposure Provides surplus relief which will be in high demand as many life insurers are capital constrained 5 |
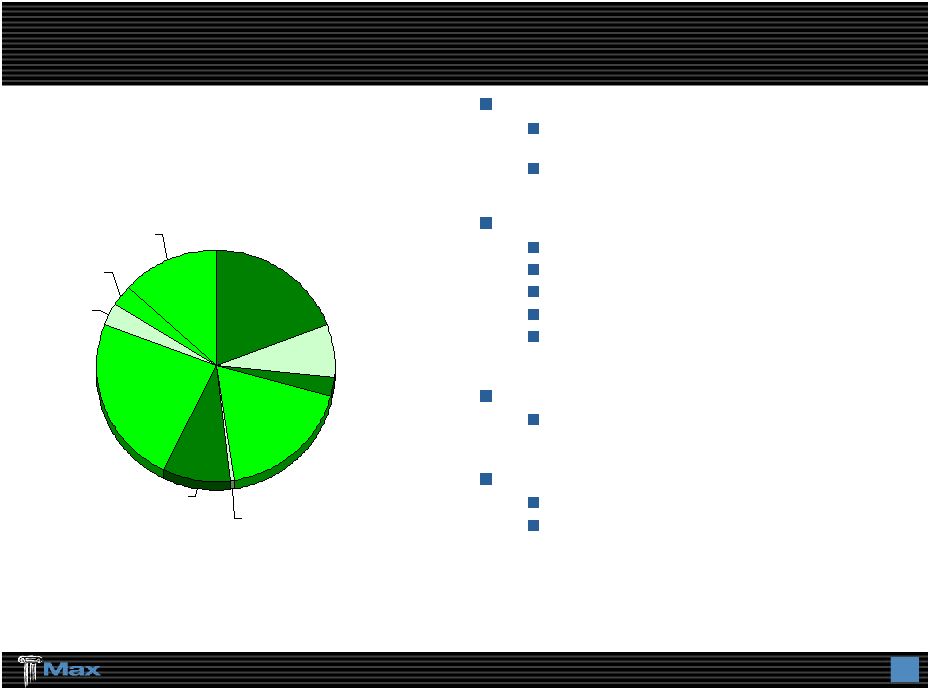
 6 6 Diversified and strategic asset allocation strategy Rebalancing the portfolio to reflect the growing traditional underwriting platform Alternatives should be further reduced to at or below 12% by 3/31/09 Expect to deploy more capital in profitable underwriting opportunities that arise Should reduce the quarterly volatility of operating results Large cash position at 12/31/08 Rebalance The Investment Portfolio – “Back to Basics” Investment Portfolio: Traditional Alternative Allocation 86% 14% Target 88 - 90% 10 - 12% Peers 88 - 90% 10 - 12% 18% 18% 29% 8% 12% 1% 2% 1% 1% 1% 2% 1% 5% 1% 0% 5% 10% 15% 20% 25% 30% 35% Cash Tsy / Agy Aaa Aa A Baa or lower Distressed Securities Diversified Arbitrage Emerging Markets Event-Driven Arbitrage Global Macro Long/Short Credit Long/Short Equity Other |
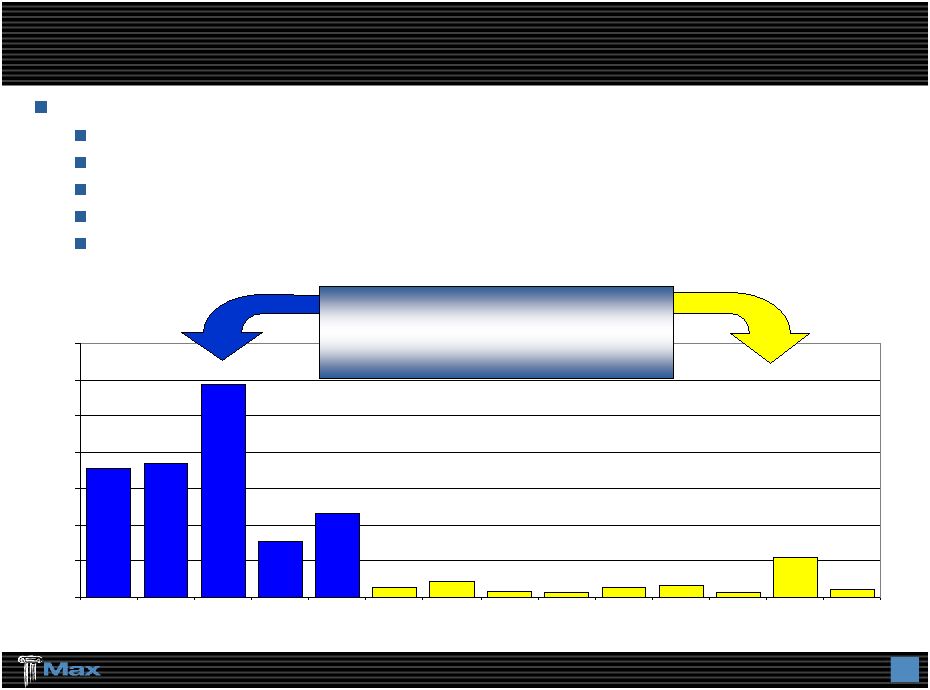
       7 7 Transformation To A More Traditional Underwriting Company Property Insurance 2003 Casualty Insurance Bermuda / Dublin U.S. E&S insurance Max USA $100m Senior Debt Issue U.S. admitted insurance company Lloyd’s operation acquisition Property / Cat Reinsurance $23.50 / share Common Offering Structured & Alternative Life & Annuity Insurance Reinsurance Specialty MDS allocation % 0% 5% 10% 15% 20% 25% 30% 35% 40% 0 200 400 600 800 1,000 1,200 1,400 12/2003 12/2008 2004 2005 2006 2007 31.5% 31.8% 29.1% 23.5% 20.7% 18.5% 14.1% 32.2% 2004 2005 2006 2008 2007 |
 8 8 Identified & Recruited “Franchise Players” Experienced & highly quantitative underwriting teams Lead underwriters average over 20 years in the business High percentage of employees hold professional designations 2004 Property Insurance 2003 Excess Liability Professional Liability Medical Malpractice Reinsurance 2005 Property / Property - Cat Reinsurance 2006 Aviation Insurance 2007 U.S. Excess & Surplus Property Ocean Cargo / Inland Marine U.S. Casualty Multi – peril crop 2008 Agricultural Reinsurance Lloyd’s Accident / Health Reinsurance Financial Institutions Professional Indemnity Property |
       9 9 Specialty Operating Strategy Focused on niches / specialties Opportunities that reward our specialized knowledge and relationships Marketing and distribution to build brand awareness Platform to execute during all phases of the cycle Expand specialty lines business in the U.S. and through Lloyd’s Manage property catastrophe aggregate exposure on a 1:250 year basis. Current year PML target is16-20% of beginning year equity Target product classes where we can invest resources and “intellectual capital,” which leads to long–term franchise value Reinsurance purchased to manage exposures and pricing cycles Capital allocated to maximize return on every transaction State of the art risk management and modeling systems Specialty Lines Focus Leverage Diversified Underwriting Platforms Enterprise Risk Management |
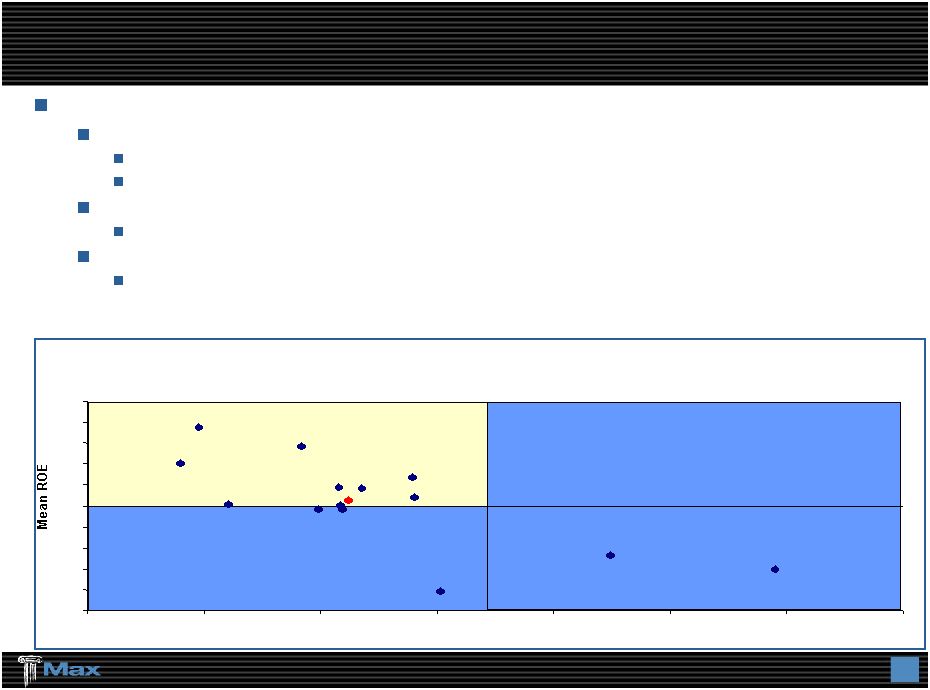 10 10 Seek to achieve high quality, stable and consistent ROEs Target ROE of 15% over the market cycle Compound annual ROE of 8.6% over last 5 years Book value has grown 36% over last 60 months Lower volatility of ROE Do well in the good years - 15% to 20% ROE Our most highly respected and valued competitors have high Sharpe ratios Willing to trade some expected ROE for lower volatility of ROE Financial Objective: Grow Book Value / Create Shareholder Value Our risk/reward profile is consistent with the profile of our strongest peer performers Mean ROE vs Std Dev of ROE Annual Data 2003 to 2007 plus 2008 Q3 annualized 0% 2% 4% 6% 8% 10% 12% 14% 16% 18% 20% 0% 5% 10% 15% 20% 25% 30% 35% Std Deviation of ROE ACGL AXS ACE PRE MXGL TRH RE ENH RNR AWH AHL XL IPCR MRH PTP |
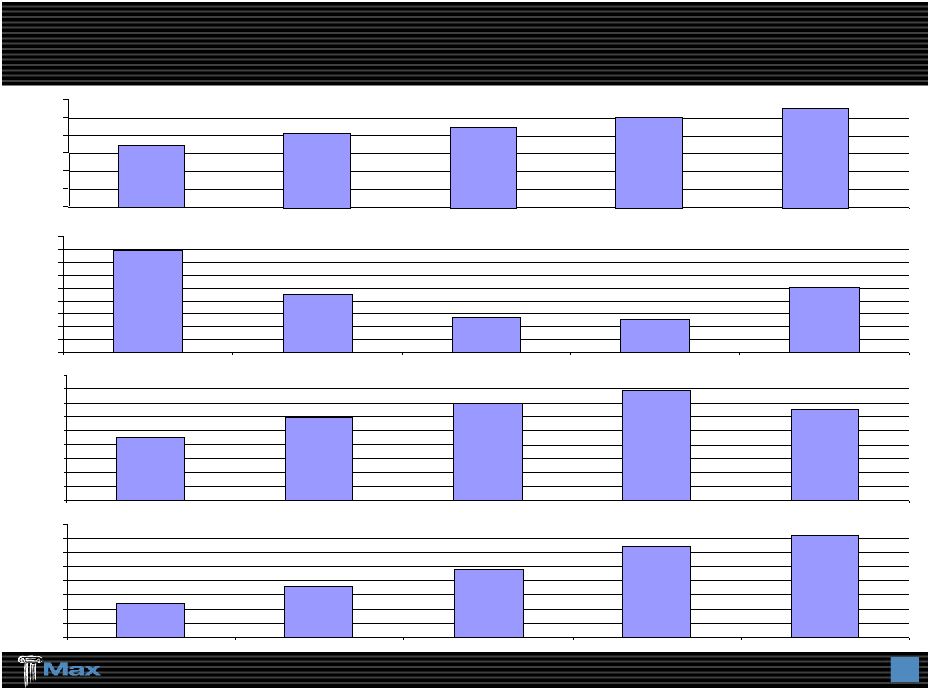
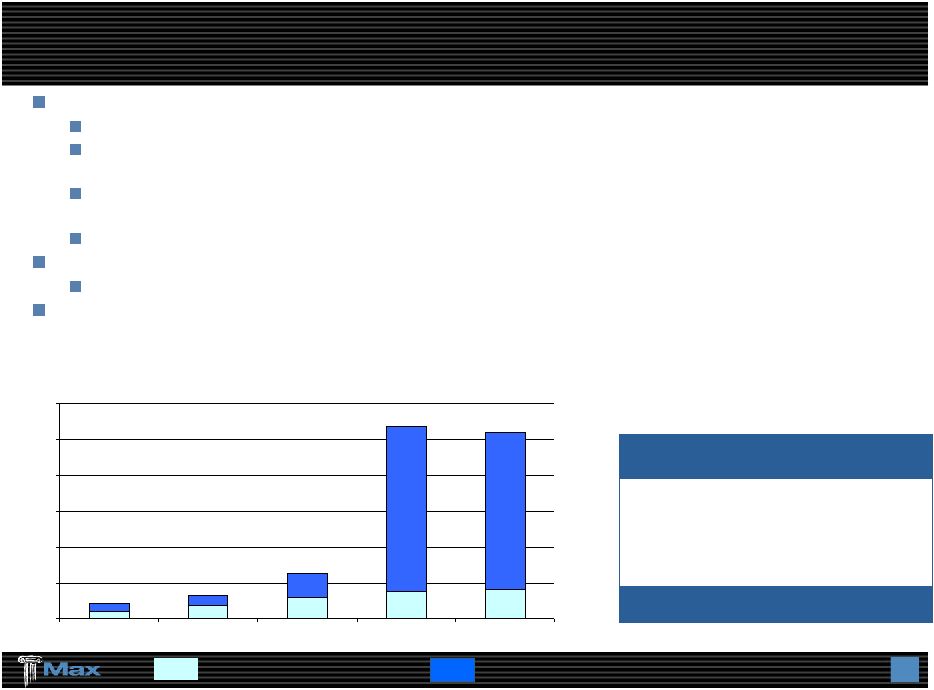 11 11 Track Record Of Proactive Capital Management Dividends Repurchases ($ in thousands) Strong and flexible capital structure 2005: $258 million Equity Offering - launched Property Cat Reinsurance Operations 2007: Max USA $100 million Senior Debt Offering – launched U.S. Excess and Surplus Lines Insurance Company 2008: Max Capital £90 million LOC Facility - Funds at Lloyd’s for Lloyd’s Underwriting platform Debt to total capital ratio of 15.8% Opportunistic share repurchases 4.1 million shares or 7.2% of outstanding purchased in 2008 Increased dividends each year since inception ($ in thousands) Dividends $ 72,081 Share Repurchases 257,484 Total $329,565 2003- 2008 Summary $5,487 $8,955 $14,273 $19,164 $20,414 $4,850 $7,360 $17,624 $109,800 $114,755 $0 $25,000 $50,000 $75,000 $100,000 $125,000 $150,000 2004 2005 2006 2007 2008 |
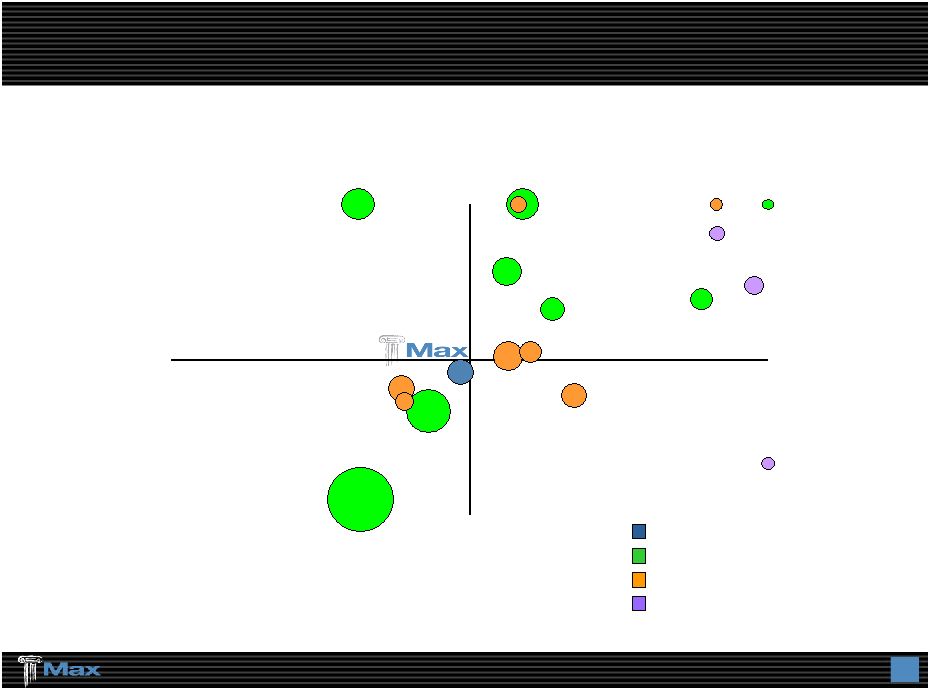 12 Diversified Premium Mix: A Key Differentiator Incumbent (Re) Insurers Class of 2001 Class of 2005 Max Capital Group Ltd. Note: Based on 2007 property and casualty gross premiums written. Certain allocations have been estimated. Source: Merrill Lynch Property Casualty Insurance Reinsurance ACE XL RE TRH PRE ORH AXS ACGL ENH AHL RNR AWH PTP MRH Lancashire VR IPCR FSR |
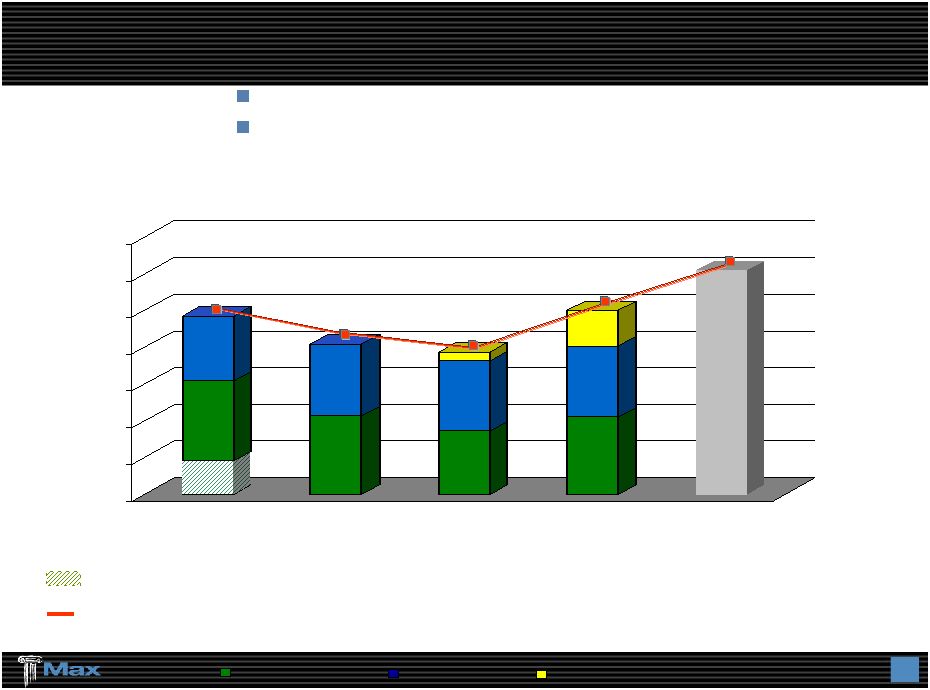 13 13 Diversified Revenue Sources / Product Lines Non-recurring additional premiums on prior years’ contracts of $182 million * Included in 2008’s annual total is $8 million GWP from Max at Lloyd’s Total P&C Insurance / Reinsurance excluding Alternative Risk and non-recurring additional premiums on prior years’ contracts (year-on-year change) Revenue not dependent on single source Capital & risk allocated rationally P&C Annual Gross Premiums Written ($ in millions) Max Specialty P&C Insurance P&C Reinsurance 2005 2006 2007 2008* 2009 Plan 0 200 400 600 800 1000 1200 1400 $931 $820 $776 $1,012 Approx. $1,220 |
 14 14 Bermuda / Dublin P&C Insurance: Niche-Oriented Focus Target: Working layer excess business Larger customer - Fortune 1000 Customer-oriented approach: Responsive and innovative Consider toughest classes of business Offer multi-year programs Flexible in program attachment points Work with all leading brokers Underwritten in Bermuda and Dublin Combined ratio: 2008: 88% 2007: 86% Gross Premiums Written 12 Months at December 31, 2008 $389 million By Type of Risk Aviation 14% Excess Liability 32% Professional Liability 40% Property 14% |
 15 15 Bermuda / Dublin P&C Reinsurance: Diversification & Flexibility Emphasized Target: Working layer excess business / quota share business Specialty / niche focus Customer-oriented approach: Quick turnaround Line-specific expertise Net line underwriter (stability of capacity) Cross-class capability Modeling and structuring capabilities Work with all leading brokers Underwritten in Bermuda and Dublin Combined ratio: 2008: 87% 2007: 84% By Type of Risk Gross Premiums Written 12 Months at December 31, 2008 $420 million Agriculture 19% Aviation 8% General Liability 2% Medical Malpractice 18% Other 0% Professional Liability 9% Property 25% Marine & Energy 3% Whole Account 3% Workers Compensation 13% |
 16 16 U.S. Platform: Max Specialty / Max America Commenced operations in 2007: Nationwide underwriter of excess and surplus lines niches based in Richmond, VA Licensed in 50 states on an admitted basis and non-admitted basis in 49 states Brokerage, Marine and Contract Binding operations Select group of national brokers and regional MGAs with 20+ years relationships Current Products Property-cat & non-cat Umbrella / xs Liability Inland Marine / Ocean Cargo (New 2008) Specialty Casualty (New 2008) 104 employees / 6 U.S. locations Long-term underwriting objectives: Products priced and underwritten so net incurred loss ratios approximate 55% Expense ratio: approximately 35% Combined ratio: approximately 85% Gross Premiums Written 12 Months at December 31, 2008 $194 million By Type of Risk Property 49% General Casualty 31% Marine 20% |
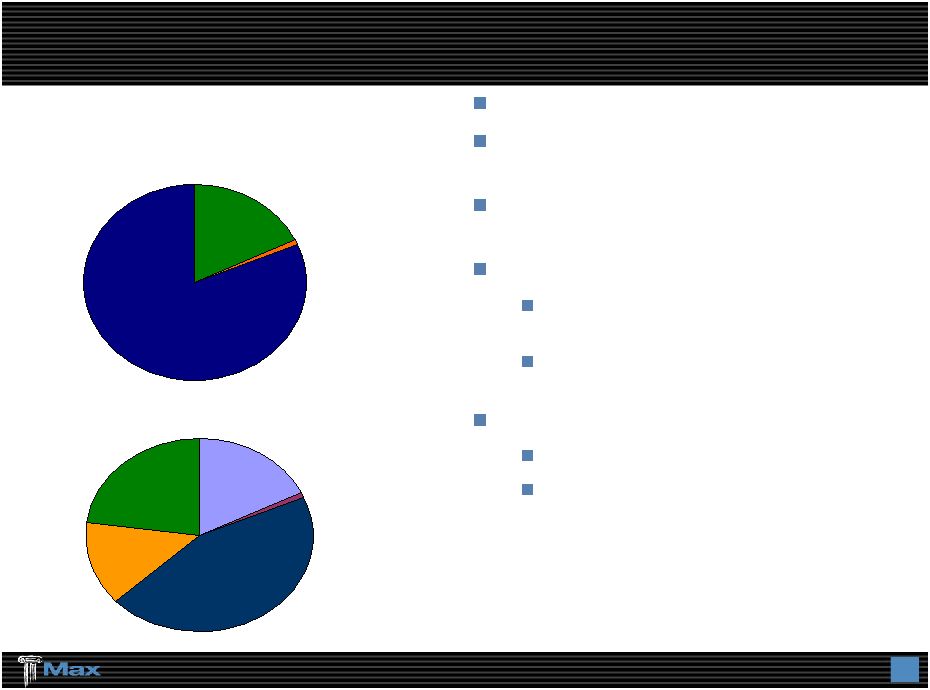 17 17 2008 Gross Premiums Written - £65.2 million Professional Indemnity / Medical Malpractice, 19% Employers' Public Liability, 1% Property Treaty, 45% Financial Institutions, 18% Accident & Health, 17% By Type of Risk Syndicate 2526 19% Syndicate 2525 1% Syndicate 1400 80% By Syndicate Max at Lloyd’s Ltd.: Access to Direct & Reinsurance Markets Worldwide Acquired in November 2008 Provides access to the world’s largest global specialty market Take advantage of Lloyd's credit ratings, worldwide licenses and capital efficiency Specializes in: Reinsurance (62%) - Property Cat - Personal Accident Insurance (38%) - Professional Line - Financial Institutions Growth opportunities in: Reinsurance - International Casualty Insurance - Marine - Personal Accident |
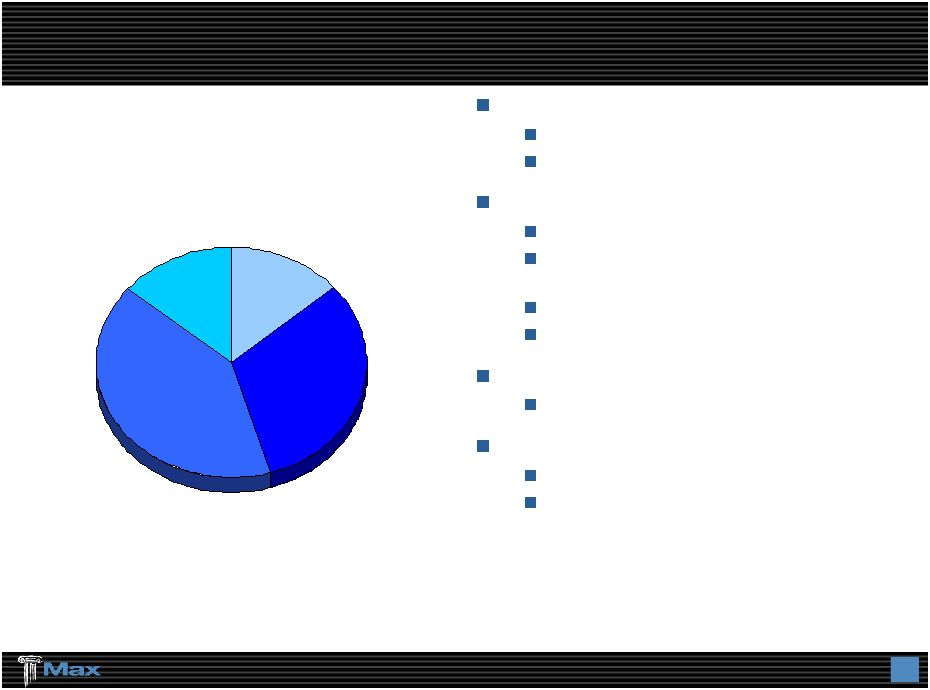
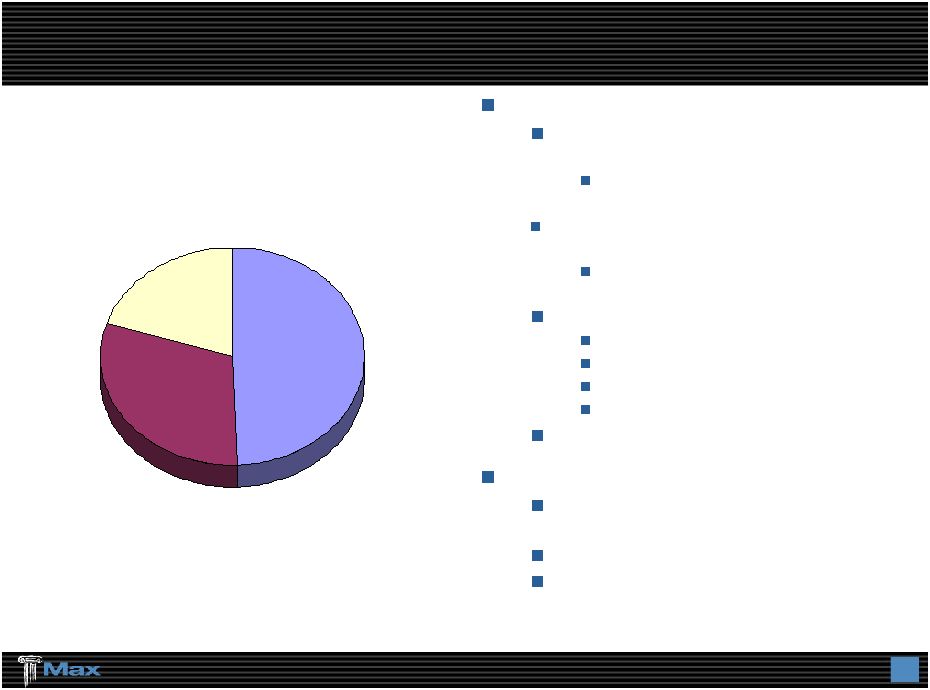
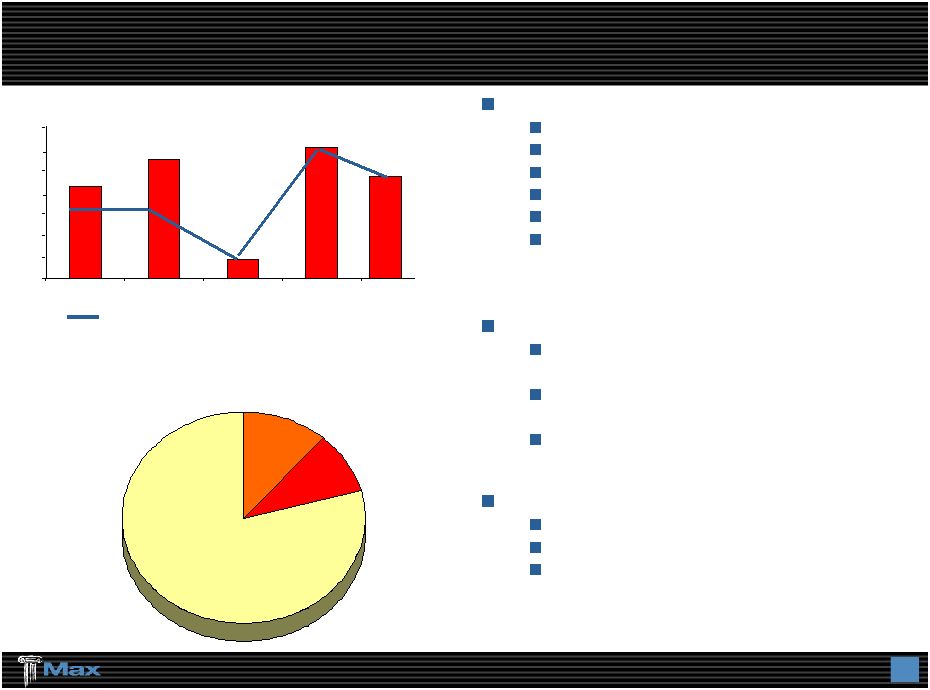 18 18 Life Reinsurance: Long-Tail, Reserve Buy-Out Business Specialize in: Investment spread business No variable annuity exposure In force, closed / ring-fenced books Mortality, morbidity & longevity Predictable cash flows Asset heavy – no interest sensitive liabilities Strategy: Leveraging underwriting skills with low volatility alternative investments Focus on closed block reserve buy-out transactions Almost no IBNR Differentiated by: Detailed data focus Strong actuarial analysis Bermuda efficiencies Gross Premiums Written Reserves & Deposits 12/31/2008 $1.4 billion Number of Deals Written 2008 0 50 100 150 200 250 300 350 2004 2005 2006 2007 $212 $275 $45 $302 3 3 1 6 US$ Millions 3 Health 11% Life 10% Annuity 79% $242 |
 19 2009 Guidance Property and Casualty GPW growth target of 20% to 22% driven by: Max at Lloyd’s Max Specialty Bermuda/Dublin Insurance and Reinsurance relatively flat Combined ratio target of 90% to 92% Assumes a cat load of 4-6 points Does not include reserve releases Improved profitability at Max Specialty as earned premiums offset higher expenses to build-out the platform Investment returns 88% Fixed income 12% Alternatives with 7% targeted return Target ROE is 15% over the course of the cycle |
 20 Investment Opportunity in Max Capital Today Strongly positioned to capitalize on market dislocations Diversified specialty insurer/reinsurer with four quality underwriting platforms Committed to reducing alternative investment exposure Target reduction as a percentage of total investments to 8-12% Further commitment to changing alternative investment mix by reducing hedge funds to 7% Introduction of other alternative investment classes e.g. high yield bonds Demonstrated commitment to enhancing shareholder value Well capitalized liquid balance sheet with financial flexibility Valuation at a significant discount to “specialty insurance” peers 20 |
 APPENDIX |
 22 22 Strong Balance Sheet ($ in millions) 2008 2007 Cash & Fixed Maturities 4,603 $ $4,061 Alternative Investments 754 1,062 Premium Receivables 555 433 Losses Recoverable 847 578 Other Assets 493 405 Total Assets 7,252 $ $6,539 Property & Casualty Losses 2,938 $2,334 Life & Annuity Benefits 1,367 1,204 Deposit Liabilities 219 221 Funds Withheld 164 169 Unearned Premium 574 440 Bank Loan 375 330 Senior Notes 91 100 Other Liabilities 244 157 Total Liabilites 5,972 $ $4,955 Shareholders' Equity 1,280 $1,584 7,252 $ $6,539 December 31, |
 23 23 Year-End Results Comparison ($ in millions) 2008 2007 2006 Gross Premiums Written 1254 1,078 $ $865 Net Premiums Earned 814 818 $665 Net Investment Income 181 188 150 Net (Losses) Gains on Alternative Investments (233) 187 85 Net Realized Losses on Fixed Maturities (19) (4) (6) Other Income 4 1 1 Total Revenues 747 1,190 895 Total Losses, Expenses & Taxes 921 887 678 Net (Loss) Income (174) $ 303 $ $217 Property & Casualty Underwriting Loss Ratio 69% 64% 68% Expense Ratio 23% 24% 18% Combined Ratio 92% 88% 86% December 31, |
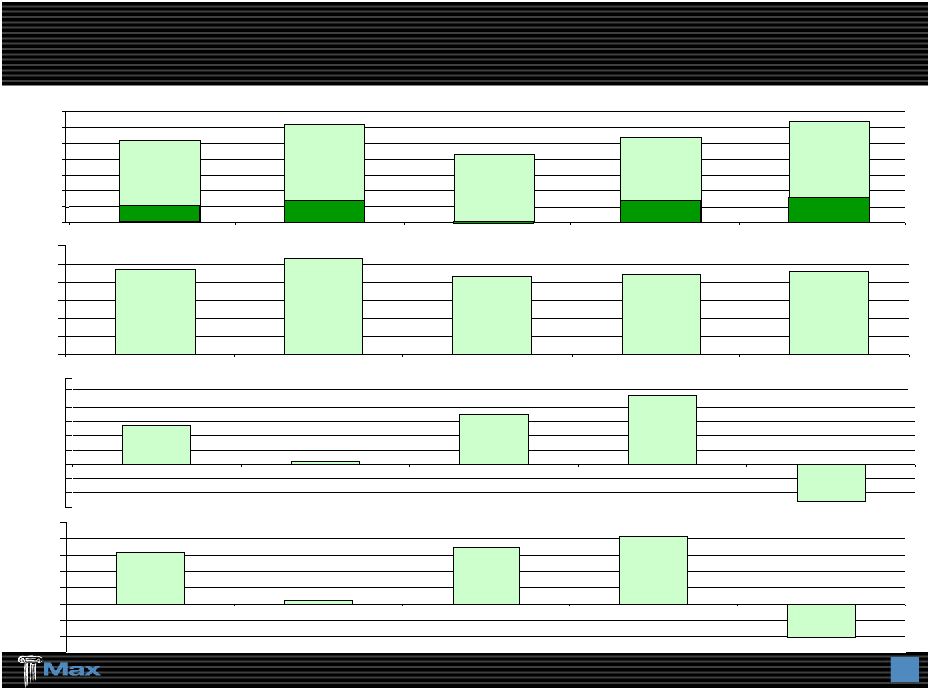 15.8% 1.0% 17.3% 20.7% -10.20% -15.0% -10.0% -5.0% 0.0% 5.0% 10.0% 15.0% 20.0% 25.0% $2.70 $0.19 $3.52 $4.81 -$2.59 -$3.00 -$2.00 -$1.00 $0.00 $1.00 $2.00 $3.00 $4.00 $5.00 $6.00 24 24 P&C Combined Ratio Operating ROE Gross Premiums Written $0 $200 $400 $600 $800 $1,000 $1,200 $1,400 2004 2005 2006 2007 2008 $1,044 Life $212 Life $275 Life $45 Life $302 Life $242 $1,246 $865 $1,078 0% 2004 2005 2006 2007 2008 94% 106% 86% 88% 92% 20% 40% 60% 80% 100% 120% 2004 2005 2006 2007 2004 2005 2006 2007 2008 To Update Profitable Underwriting Trends Despite Hurricanes Losses 2008 Operating Earnings Per Share (Diluted) $1,254 |
 25 25 A Growing, Global Insurance / Reinsurance Company *Operating Cash Flow for 2007 and prior years has been adjusted to conform with the current presentation $3,515 $4,223 $4,536 $5,123 $5,357 $0 $1,000 $2,000 $3,000 $4,000 $5,000 $6,000 2004 2005 2006 2007 Invested Assets (Ratio to Shareholders’ Equity) ($ in millions) $903 $1,186 $1,390 $1,584 $1,280 0 200 400 600 800 1000 1200 1400 1600 1800 ($19.70) ($20.16) ($23.06) ($22.77) ($27.54) 2004 2005 2006 2007 12/31/08 Shareholders’ Equity (Book Value Per Share) 2004 2005 2006 2007 12/31/08 $0.00 $0.05 $0.10 $0.15 $0.20 $0.25 $0.30 $0.35 $0.40 0.12 0.18 0.24 0.32 0.36 Dividends (3.9:1) (3.6:1) (3.3:1) (3.2:1) (3.9:1) 2004* 2005* 2006* 2007* 12/31/08 $799 $447 $273 $252 $508 $0 $100 $200 $300 $400 $500 $600 $700 $800 $900 2008 Operating Cash Flow |
 26 26 Supplemental Investment Data – December 31, 2008 Past performance should not be considered to be a reliable indicator of future performance. -9.60% -20.97% 2.02% Selected Investment Return Data: Fair Investment Last Year Last Value* Distribution 3 Months to Date 60 months** Cash and Fixed Maturities 4,603,263 $ 85.9% 4.09% 4.66% 4.27% Convertible Arbitrage 10,650 0.2% 1.96% -12.19% -3.27% Distressed Securities 115,900 2.2% -10.25% -19.39% 8.17% Diversified Arbitrage 46,034 0.9% -21.88% -39.72% -4.14% Emerging Markets 39,683 0.7% -21.54% -30.59% 5.07% Event-Driven Arbitrage 75,205 1.4% -18.06% -30.31% 5.29% Fixed Income Arbitrage 30,881 0.6% 5.45% 20.43% 9.63% Global Macro 87,304 1.6% -0.04% -5.63% 4.88% Long / Short Credit 38,581 0.7% -8.83% -13.34% 4.60% Long / Short Equity 290,224 5.4% -0.86% -13.66% 5.00% Opportunistic 14,746 0.3% -25.39% -41.25% 6.64% MDS *** 749,208 14.0% -8.31% -19.38% 3.08% Reinsurance Private Equity 4,450 0.1% -1.55% 12.91% 8.26% Alternative Investments 753,658 $ 14.1% -8.28% -19.27% 2.47% Total Investments 5,356,921 $ 100.0% 1.41% -0.09% 4.32% HFRI Fund of Funds Composite Index ^ * Expressed in thousands of United States Dollars ** Annualized *** Net of all fees ^ As reported by HFRI as at February 10, 2009 Periodic Rate of Return |
 27 27 Average quality of AA 80%+ of fixed income securities rated Aa or better Less than 2% rated Baa or below Approximately 55% of portfolio is Cash, Governments, Agencies, and Agency MBS Cash balance is approximately $950 million or 21% of the portfolio U.S. and G7 governments approximately $800 million or 17% of the portfolio U.S. Agencies approximately $280 million or 6% of the portfolio U.S. Agency MBS approximately $580 million or 13% of the portfolio Corporate Holdings are well diversified Approximately 33% of the portfolio Approximately 200 different corporate issuers Largest “Aa” issuer is less than 1% of the portfolio Largest “A” issuer is less than 0.6% of the portfolio No CDO’s, CLO’s, SIV’s or other highly structured securities High Quality Cash & Fixed Income Portfolio |
 28 28 Core Investing Principles Diversification by strategy with concentration limits in any particular fund Rapid liquidity required Return objective – 300 bps over risk free rates with bond like volatility Rigorous manager selection and monitoring process Objectives of Revised Investment Approach Adopted October 2008 More balanced, market neutral / absolute return focus Lower volatility of monthly, quarterly and annual returns Lower probability of a drawdown below a fixed floor for any time period Higher degree of diversification in both the number of strategies employed and the number of underlying managers Lower correlation and / or exposure to relevant market factors Alternative Investment Portfolio |
 Investment Portfolio by Security Type – 9/30/08 ____________________ (1) Includes short-term investments and cash and cash equivalents. (2) Fixed income credit ratings based on 12/31/07 allocation. (3) Everest Re fixed income credit rating allocation includes cash and short-term investments, which are assumed to be AAA and are removed from the distribution. ($ in millions) Non-Investment Grade Fixed Income & Equity / % of Total Cash & Investments Other Securities Fixed Income Securities as a % of Cash & Cash Investment Non-investment Equity / Other Total Cash & Total Cash & Price / Equivalents (1) Grade Grade Total Securities Investments Investment Book Value FlagstoneRe (2) 35.7% 37.4% 0.0% 37.4% 26.9% $1,864.9 26.9% 0.65x Montpelier Re 22.5% 57.1% 2.6% 59.7% 17.8% 2,547.0 20.5% 0.95 OdysseyRe (2) 28.8% 51.0% 2.1% 53.1% 18.1% 8,001.7 20.2% 1.29 RenaissanceRe 28.6% 54.7% 1.1% 55.8% 15.6% 6,530.8 16.7% 1.19 IPC Holdings 8.9% 75.7% 0.1% 75.8% 15.4% 2,314.1 15.4% 0.85 Everest Re (3) 10.1% 76.2% 1.5% 77.6% 12.3% 14,119.6 13.7% 0.87 PartnerRe 6.8% 81.3% 3.4% 84.7% 8.4% 11,535.4 11.8% 1.01 Transatlantic 5.5% 86.3% 0.5% 86.8% 7.7% 11,571.8 8.2% 0.79 Endurance 12.1% 79.8% 1.1% 80.9% 7.0% 5,388.5 8.1% 0.74 Arch Capital 10.9% 81.2% 2.1% 83.3% 5.8% 10,139.4 7.8% 1.20 AXIS 13.3% 79.1% 0.3% 79.5% 7.2% 10,634.8 7.5% 0.87 Allied World 11.6% 84.7% 0.0% 84.7% 3.7% 6,416.7 3.7% 0.87 Platinum Re 16.4% 83.6% 0.0% 83.6% 0.0% 4,258.7 0.0% 0.86 Validus 20.3% 79.7% 0.0% 79.7% 0.0% 3,256.1 0.0% 0.94 Aspen 16.4% NA NA 74.9% 8.7% 5,891.7 NA 0.84 Greenlight Capital 35.7% NA NA 1.4% 62.9% 605.6 NA 0.91 Mean 17.7% 72.0% 1.1% 68.7% 13.6% 11.5% 0.95x Median 14.9% 79.4% 0.8% 78.5% 8.6% 10.0% 0.87x Max Capital 13.1% 68.3% 0.0% 68.3% 18.6% $4,993.9 18.6% 0.81x Source: Merrill Lynch 29 |
 30 30 Remaining portfolio is high quality ABS, CMO and CMBS Holdings Almost all CMO holdings are rated AAA, with substantial portion being agency CMO’s Almost all CMBS holdings are rated AAA Principal losses, if any, are expected to be minimal based upon cash flow and stress testing ABS holdings are largely comprised of plain vanilla auto and credit cards Home equity ABS holdings amount to approximately $50 million (all Subprime and Alt – A) Subprime and Alt – A exposures are approximately $77 million book value >50% are AAA rated securities 2.5 year weighted average life Significant and growing over-collateralization No principal losses are expected based upon cash flow and stress testing Unrealized loss of approximately $19 million Credit Risk Issues are relatively small at December 31, 2008 No Washington Mutual securities held $16 million Lehman bonds, fair value < $2 million ($14 million impairment charge taken in Q3) $13 million AIG related bonds, fair value of $10 million ($3 million unrealized loss) No equity, preferred, or equity linked securities in the portfolio Besides Lehman, no other securities are in arrears on either principal or interest Credit & Structure Risk |
 31 31 Investments With Exposure To Sub-prime And Alt-A Rounded to millions Assets with Subprime content Weighted AA A B Amortized Fair Value ($ millions) Average Life Senior Junior Cost Subprime exposure by vintage year Pre-2005 3.6 2.3 $ 0.4 $ 5.4 $ 8.1 $ 7.1 $ 2005 4.1 1.5 $ 3.4 $ 4.9 $ 3.2 $ 2006 2.4 16.3 $ 4.6 $ 9.3 $ 30.1 $ 22.4 $ 2007 2.5 2.5 $ 2.5 $ 1.6 $ Total Subprime exposure 2.7 22.6 $ 5.0 $ 8.8 $ 9.3 $ - $ 45.6 $ 34.3 $ Alt-A exposure by vintage year Pre-2005 5.3 6.0 $ - $ 6.0 $ 4.8 $ 2005 1.6 16.8 $ 16.8 $ 11.0 $ 2006 0.7 6.0 $ 3.1 $ 9.1 $ 8.1 $ Total Alt-A exposure 2.0 6.0 $ 22.8 $ - $ - $ 3.1 $ 31.9 $ 23.9 $ Sub-prime and Alt-A exposure 2.5 28.6 $ 27.8 $ 8.8 $ 9.3 $ 3.1 $ 77.5 $ 58.2 $ Credit rating AAA |
 32 32 Max Capital’s total investment portfolio compares favorably to other Benchmark Indices with lower volatility Max Capital’s alternative investments portfolio has contributed significantly to portfolio returns and book value growth Q4 2008 hedge fund returns were the worst since hedge fund industry record- keeping began Max Capital’s alternative investments portfolio, composed of an unleveraged diversified “fund-of-funds,” had a significant negative return for the quarter Risk Averse Enhanced Returns * Annualized Past performance should not be considered to be a reliable indicator of future performance Q4 2008 2008 YTD 2007 1/1/2007 - 2008 YTD* Last 60 Months* Standard Deviation Max Capital Total 1.41% -0.09% 7.82% 3.79% 4.32% 3.79% Max Capital Fixed 4.00% 4.66% 5.11% 4.89% 4.27% 3.06% Max Capital AI -8.28% -19.27% 16.97% -2.83% 2.47% 6.77% Fund of Funds Index -9.60% -20.97% 10.26% -6.66% 2.02% 6.69% S&P 500 -21.94% -37.00% 5.49% -18.48% -2.80% 12.81% High Yield -17.47% -26.21% 2.09% -13.21% -0.87% 10.90% 5 - 7 Year Corporate -8.42% -13.27% 5.70% -4.26% 0.30% 6.22% 5 - 7 Year Corporate 3.29% -8.07% 5.44% -1.55% 1.49% 7.03% ML Master 5.12% 6.20% 7.17% 6.69% 4.90% 3.99% |
 |