 B E R M U D A I R E L A N D U N I T E D S T A T E S L L O Y D' S L A T I N A M E R I C A A World Class Specialty Insurer and Reinsurer Investor Presentation Fourth Quarter 2009 Exhibit 99.1 |
 1 INFORMATION CONCERNING FORWARD LOOKING STATEMENTS CAUTIONARY NOTE REGARDING FORWARD-LOOKING INFORMATION This presentation includes statements about future economic performance, finances, expectations, plans and prospects of the Company that constitute forward-looking statements for purposes of the safe harbor provisions of the Private Securities Litigation Reform Act of 1995. Such forward-looking statements are subject to certain risks and uncertainties that could cause actual results to differ materially from those suggested by such statements. For further information regarding cautionary statements and factors affecting future results, please refer to the Company's most recent Annual Report on Form 10-K , Quarterly Reports on Form 10-Q filed subsequent to the Annual Report and other documents filed by the Company with the SEC. The Company undertakes no obligation to update or revise publicly any forward-looking statement whether as a result of new information, future developments or otherwise. |
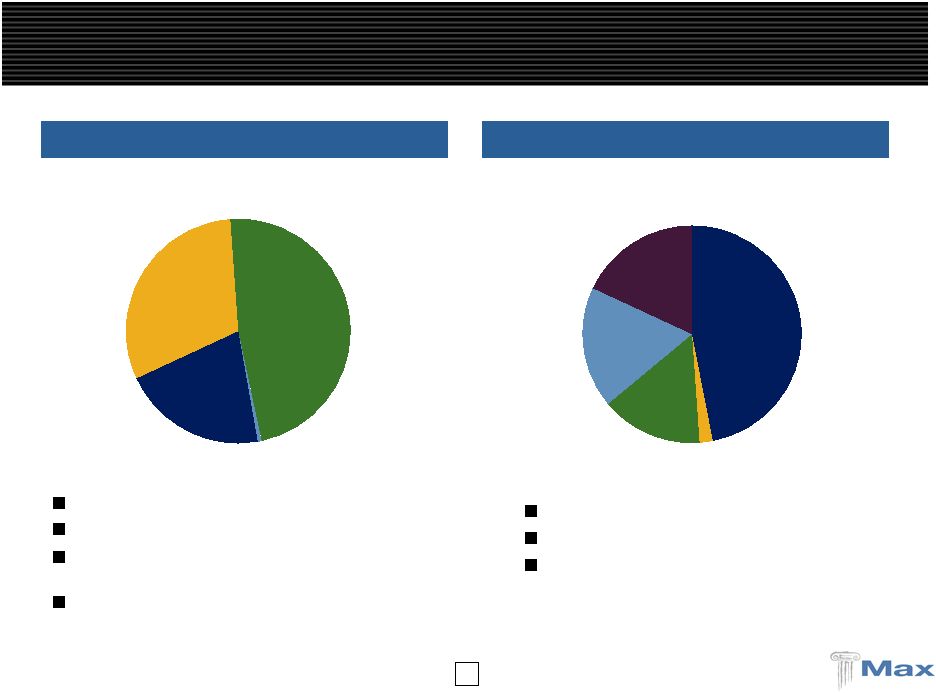
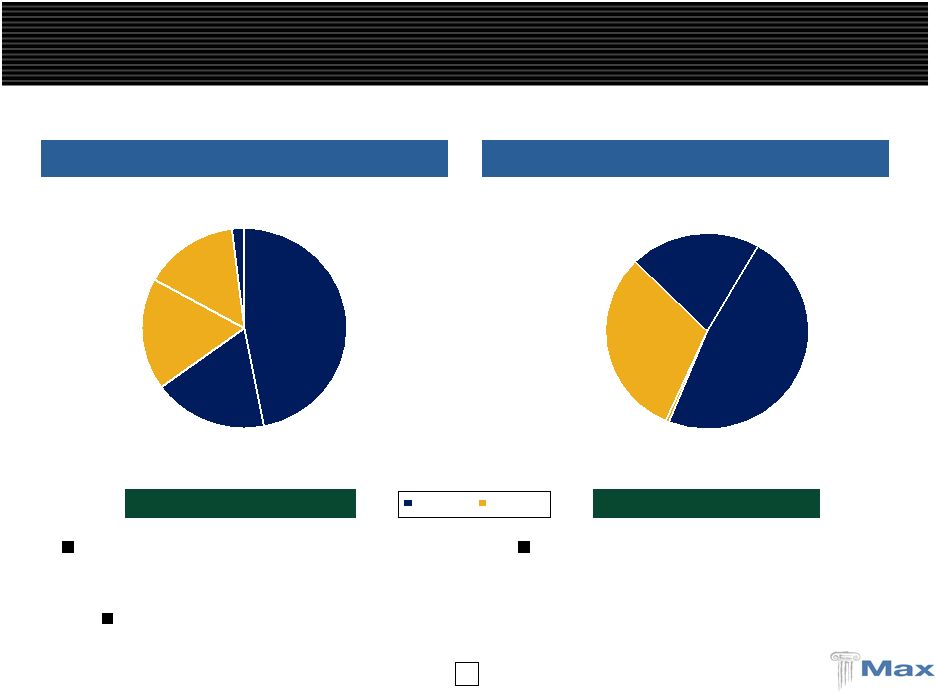
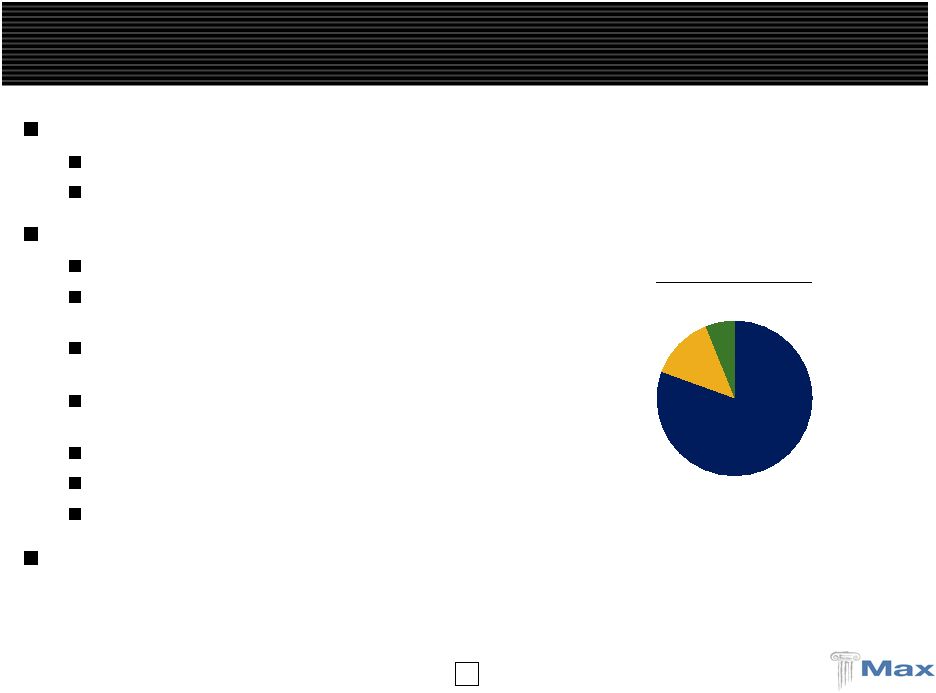
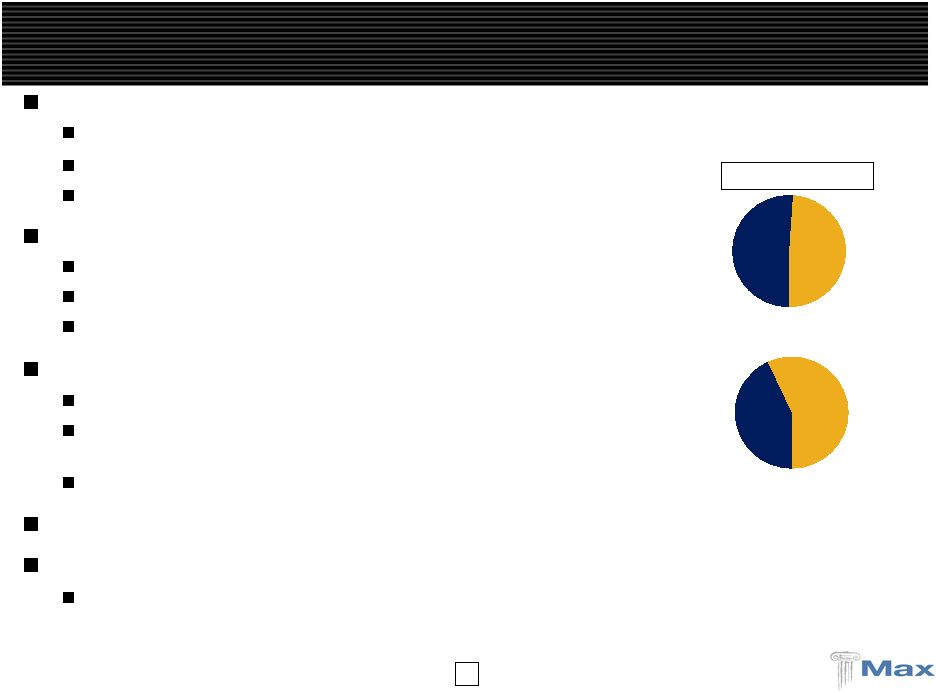 2 Max Capital – Core Operations Global underwriter of specialty insurance and reinsurance Multiple operating platforms - Bermuda, Dublin, United States, Lloyd's, Latin America Diversified business profile across specialty classes of business Highly experienced management with proven track record Opportunistic and disciplined underwriting strategy Analytical and quantitative underwriting orientation 5 year average combined ratio, with cats, of 92% Generates more stable underwriting results and ROE Strong, liquid balance sheet with conservative reserving track record Shareholders equity - $1.56 billion at 12/31/09 Prudent capital management – $350 million in dividends/repurchases over last 5 years Significant expansion of underwriting platforms with minimal goodwill Gross premiums written 2009 of $1.375 billion High quality investment portfolio repositioned to reflect traditional underwriting base Hedge funds are now a much smaller part of Max's invested asset base at 6% Insurance Reinsurance 43% 57% Short-Tail Long-Tail 51% 49% 2009 P&C GPW |
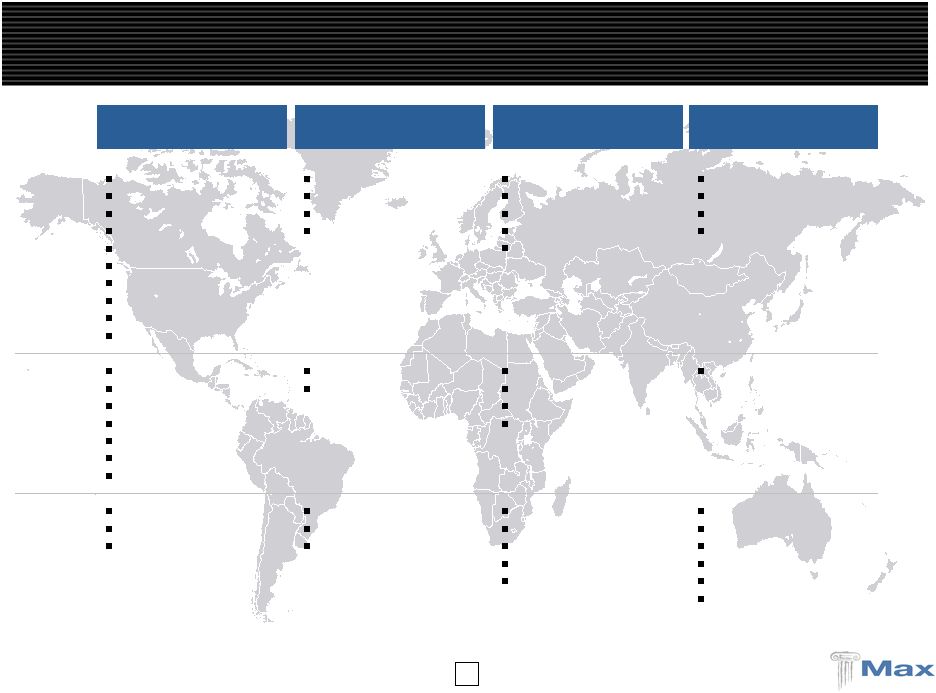
 3 2004 Insurance Property 2003 Insurance Excess Liability Professional Liability 2006 Insurance Aviation 2008 Lloyd's Insurance Financial Institutions Prof. Indemnity Lloyd's Reinsurance Accident / Health Property 2007 U.S. E&S Insurance Property Inland Marine U.S. Casualty Reinsurance Multi Peril Crop Experienced & highly quantitative underwriting teams Lead underwriters average over 20 years in the business High percentage of employees hold professional designations 2009 Lloyd's Casualty (non U.S.) A&H Insurance U.S. Specialty Professional Liability Latin America Reinsurance 2002 Traditional Re Workers' Comp Medical Malpractice GL / PL Aviation Identifying & Recruiting "Franchise Players" Has Been Instrumental In Our Success 2005 Reinsurance Property / Property Cat |
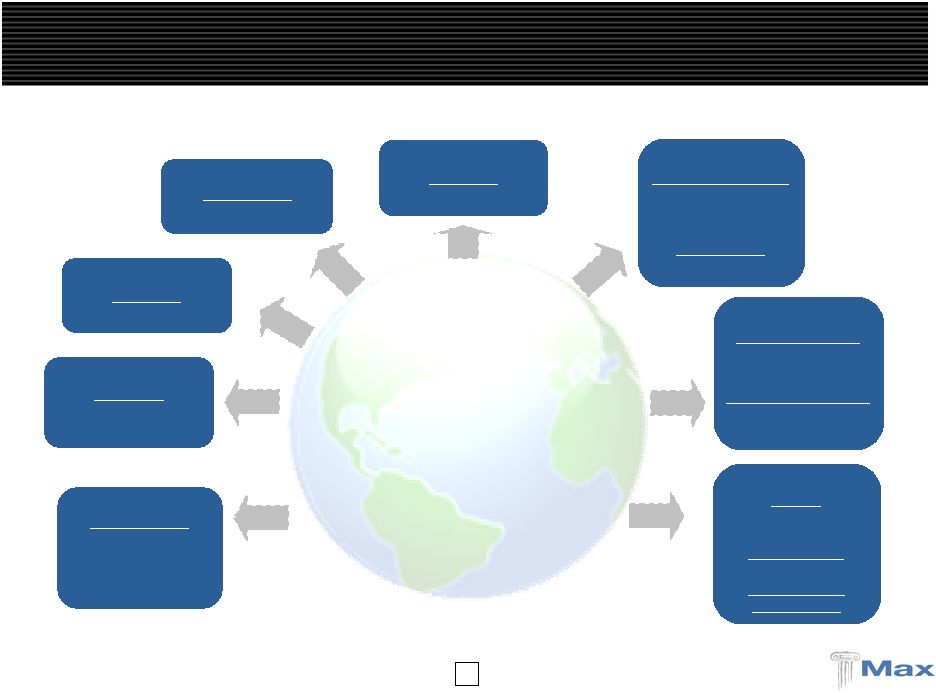
 4 Bermuda / Dublin Reinsurance Bermuda / Dublin Insurance Lloyd’s U.S Specialty Insurance Major Classes Agriculture Aviation Excess liability Medical malpractice Professional liability Property Marine and energy Whole account Workers’ comp Life and annuity Aviation Excess liability Professional liability Property Personal accident Financial institutions Professional liability Property International casualty treaty reinsurance General liability Marine Property Miscellaneous professional liability Operating Regions United States Latin America Canada European Union Japan Australia New Zealand United States European Union United Kingdom Japan Denmark Latin America United States Offices Bermuda Dublin Bogota Bermuda Dublin Hamburg London Leeds Tokyo Copenhagen Rio de Janeiro New York Philadelphia Richmond Atlanta Dallas San Francisco Global Reach Through Established Platforms |
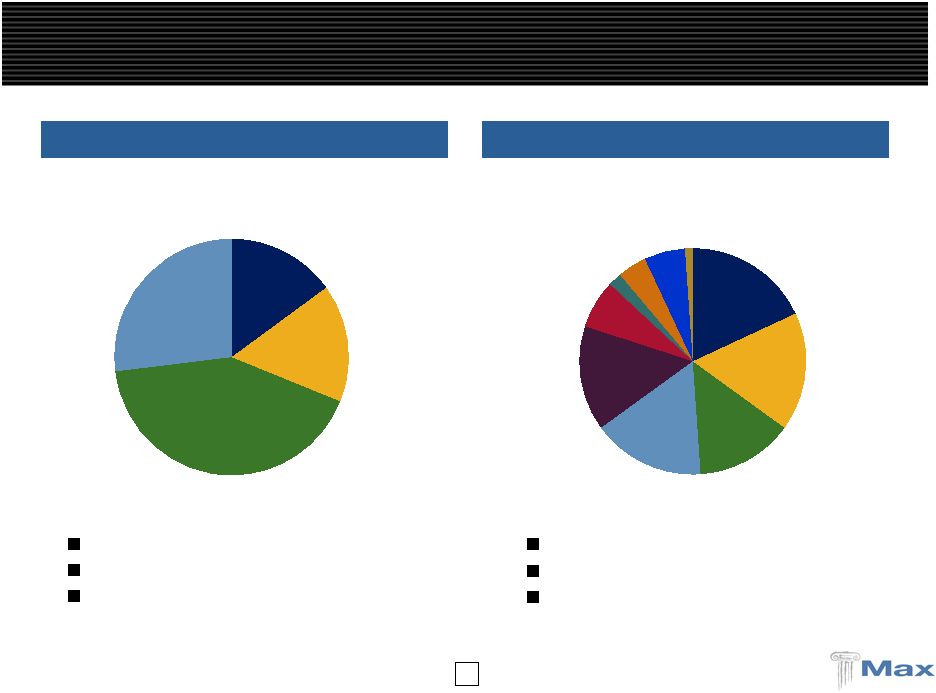 5 Max Has a Strong Market Position in Specialty Classes … Working layer excess business Focus on Fortune 1000 customers 2009 combined ratio = 75.6% 2009 GPW - $427.8 million 2009 GPW - $489.0 million Working layer excess / quota share business Cross class capability 2009 combined ratio = 92.1% Bermuda / Dublin Insurance Bermuda / Dublin Reinsurance Excess Liability Professional Liability Aviation Property 15% 16% 42% 27% Property Agriculture Med. Mal. Workers Comp Prof. Liabliity Aviation Whole Account Marine & Energy General Casualty Other 18% 17% 14% 16% 15% 7% 2% 4% 6% 1% |
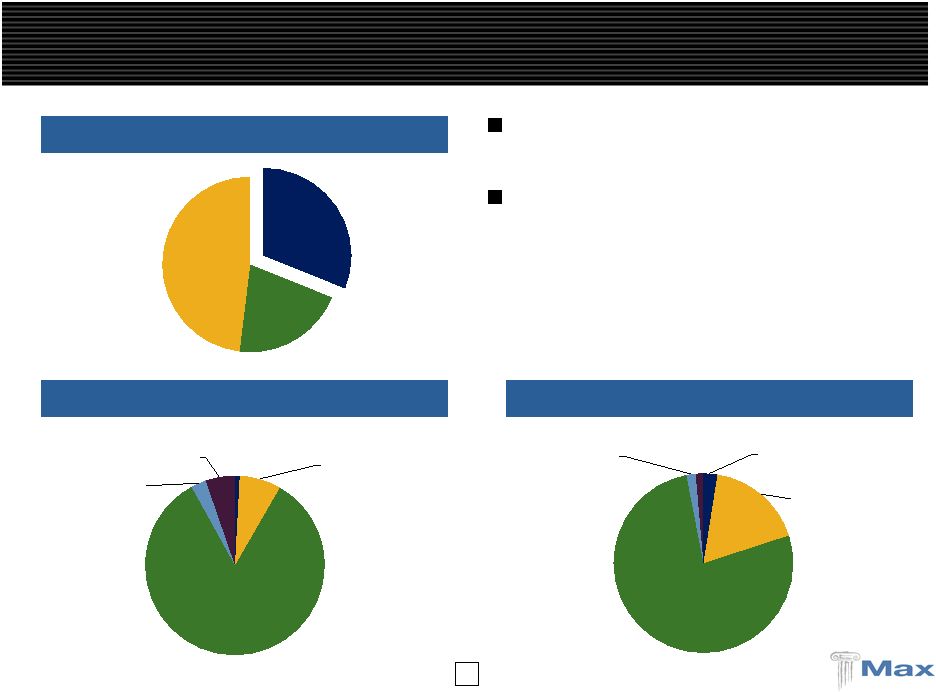
 6 … With an Attractive Position in the U.S. Market and Lloyd's Launched in 2007 Nationwide niche E&S underwriter Growing into expense base – target combined ratio of 85% to 90% 2009 combined ratio = 99.5% 2009 GPW - $285.5 million 2009 GPW - $129.0 million U.S. Specialty Max at Lloyd's Acquired in November 2008 Direct and reinsurance 2009 combined ratio = 86.3% Accident & Health Fin. Institutions Prof. Liability Aviation Property Treaty 47% 2% 15% 18% 18% Prof. Liability Property General Casualty Marine 21% 31% 48% <1% |
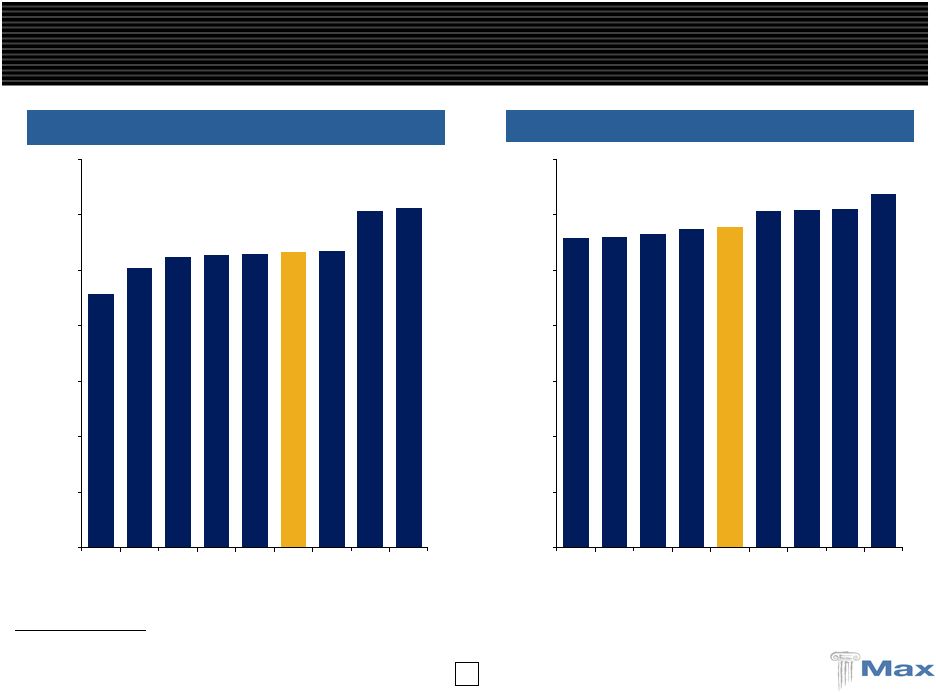
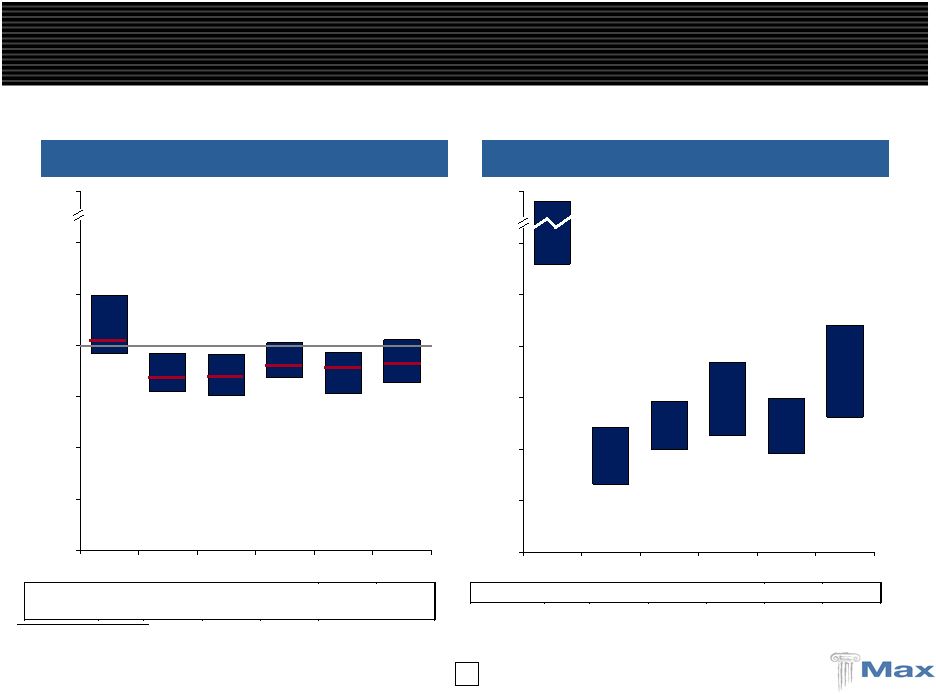 7 140% 33% 50% 56% 48% 65% 252% 60% 73% 92% 74% 110% 0% 25% 50% 75% 100% 125% 150% 300% 2005 2006 2007 2008 Q3'09 Average 96% 77% 75% 84% 76% 82% 124% 96% 96% 101% 97% 103% 0% 25% 50% 75% 100% 125% 150% 300% Average 2005 2006 2007 2008 Q3'09 Median 201% 55% 61% 89% 69% 95% Median 115% 85% 84% 95% 87% 93% Max 106% 86% 88% 92% 91% 93% Source: Company filings. Diversified reinsurers include RE, AXS, ACGL, TRH, PRE, ORH, AWH, ENH, AHL, PTP, AGII and MXGL. Property focused reinsurers include RNR, VR, MRH, FSR and IPCR for historical years. Max has performed well within its diversified peer group with less volatility than property focused reinsurers Diversified Platforms Generate More Consistent Margins Diversified Reinsurers Property Focused Reinsurers |
 8 8.0% 6.6% 10.1% 8.3% 5.3% 3.7% 7.8% 5.2% 6.4% 6.70% 6.7% 6.0% 5.2% 4.2% 3.0% 3.8% 3.4% 4.4% 4.3% 0.0% 0.6% 3.0% 4.3% 0.3% 2.6% 0.7% 2.2% (0.3%) 0.3% 0.8% 0.8% 1.8% 0.8% 0.0% 2.0% 4.0% 6.0% 8.0% 10.0% 12.0% 14.0% VR FSR RNR MRH PTP ACGL AXS PRE AHL IPCR HP ENH ORH TRH AWH RE MXGL 12.4% 11.0% 10.1% 8.9% 8.4% 8.1% 8.1% 7.8% 7.0% 6.7% 6.4% 6.3% 6.0% 5.0% 4.8% 4.6% 3.4% Ike/Gustav Ultimate Net Losses as a % of 6/30/08 Common Equity ($ in millions) (1) (3) (2) Losses $256 $140 $276 $140 $165 $287 $384 $305 $135 $111 $148 $155 $113 $257 $50 (4) Source: Company filings, as of 12/31/08. Losses are generally disclosed net of reinstatement premiums. (1) Results reflect Ike only. (2) Equity includes preferred, which subsequently converted to common. (3) Equity includes preferred, which subsequently converted to common. Reflects net positive development experienced on reserves related to Ike of $5.9 million. (3) TRH does not disclose specific losses but did lose "$169.7 million principally relating to Hurricane Ike." $170 $171 Revised Estimate Initial Estimate (2) Max is less exposed to swings in the cat market than peers PMLs (% of capital) 1:100 yr 1:250 yr Target 8%-12% 15% - 20% 1/1/10E 10% 18% |
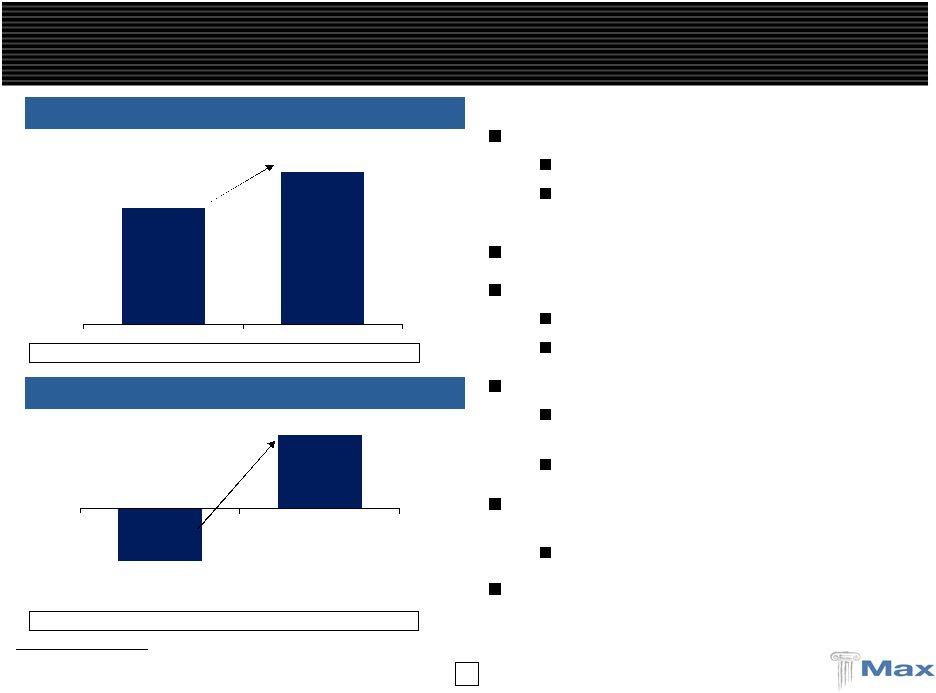 9 ($2.54) $3.62 2008 2009 $1,012.1 $1,331.2 2008 2009 Strong 2009 Results Reflects continued build-out of our global platform Max Specialty - $285.5 million GPW Reflects first year of Max at Lloyd's – $129.0 million GPW Combined ratio reflects higher casualty mix Market conditions vary by line Short-tail lines remain attractive Casualty rates are mixed Strong 2009 results despite high cash balances Once invested, ROE should increase by 1% to 2% ROE points Return on invested portfolio is ~ 6.7% Hedge funds reduced to 6.0% of invested assets as of 12/31/09 Down from 14.1% at 12/31/08 Diluted book value per share increased 21.8% in 2009 to $27.36 P&C GPW (32% increase) Operating Diluted EPS Operating ROE (10.0%) 14.7% Combined ratio 91.9% 88.1% (1) Excludes $0.55 per share in merger and acquisition expenses. Profitable Growth in Gross Premiums Written… …With Strong Operating EPS |
 10 $1,331.2 $1,123.4 2008 2009 ($ in millions) Over the last 3 years 83% of growth is in short-tail lines True growth of business is 18.5% vs. 31.5% reported Lloyd's business experienced 7.3% growth over its expiring book Total growth is being driven by property lines in Lloyd's and U.S. Specialty Long tail lines reflect growth in professional liability Reported GPW 31.5% increase Source of 2009 GPW Growth Long Tail Short Tail (1) (1) Adjusted to include the full year 2008 impact of Max at Lloyd's as if the acquisition occurred on 1/1/08. Adjusted GPW (1) 18.5% increase 44% 56% $1,012.1 $1,331.2 2008 2009 Max's Premium Growth Has Been Intentional and Strategic |
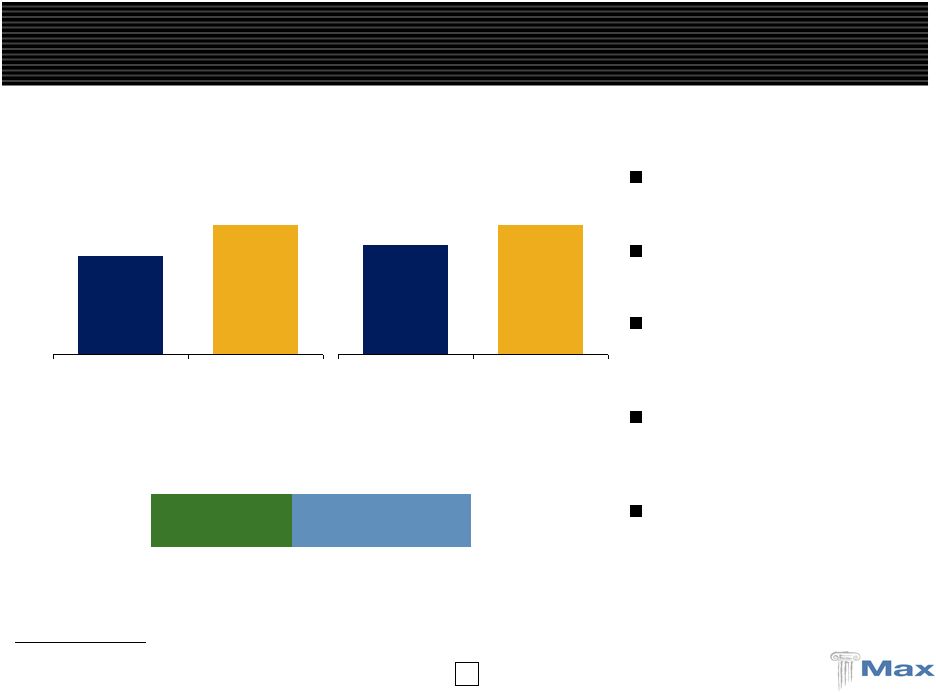
 11 2009 GPW - $129.0 million 2009 GPW - $285.5 million Long Tail Short Tail This represents real growth of 7.3% over the expiring book of business, all driven by short tail lines Short tail increased 16.3% while long tail decreased by 6.8% Increase over 2008 is driven by property and marine, which represented 69% of the change in premiums New Businesses for Max are Short Tail Focused Max at Lloyd's U.S. Specialty Aviation Professional Liability (non- U.S.) Financial Institutions (non-U.S.) Accident & Health Property 47% 18% 18% 15% 2% Marine General Casualty Prof. Liability Property 48% <1% 31% 21% |
 12 Max only retains roughly half of the premium written in its U.S. Specialty casualty book 91.9% of premium is written with limits of $1 million or less Max Specialty Casualty – Small Business Focus U.S. Specialty GPW (12/31/09) 2009 Casualty Premium By Limit 2009 Casualty Policies By Limit Property Marine Casualty 31% 21% 48% $2.5mm to $5.0mm $1.0mm to $2.5mm $500k to $1mm $250k to $500k Less than $250k 1% 8% 84% 3% 5% $2.5mm to $5.0mm $1.0mm to $2.5mm $500k to $1mm $250k to $500k Less than $250k 2% 18% 77% 2% 2% |
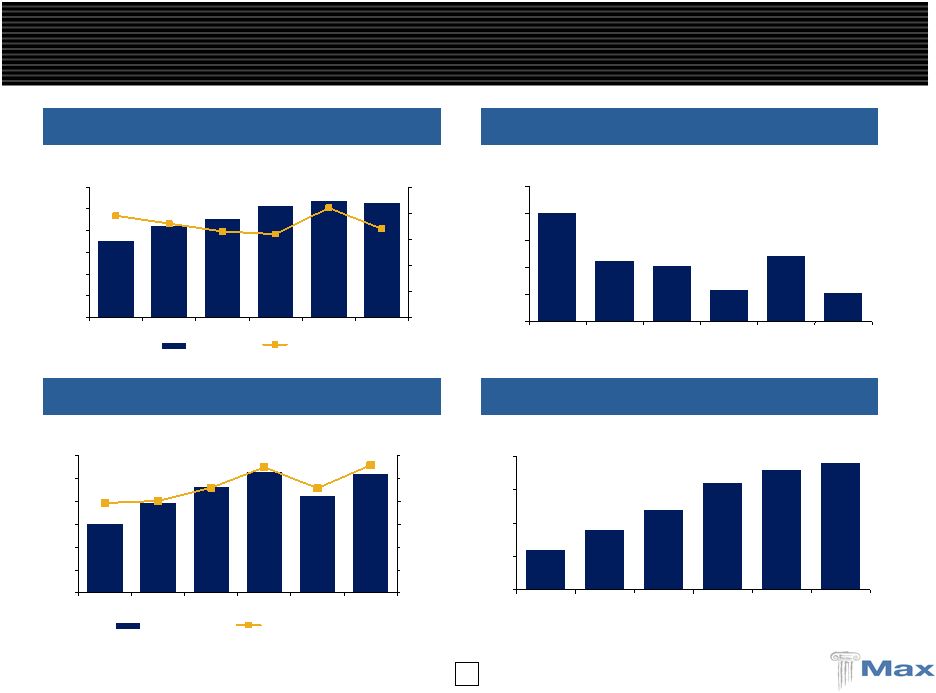
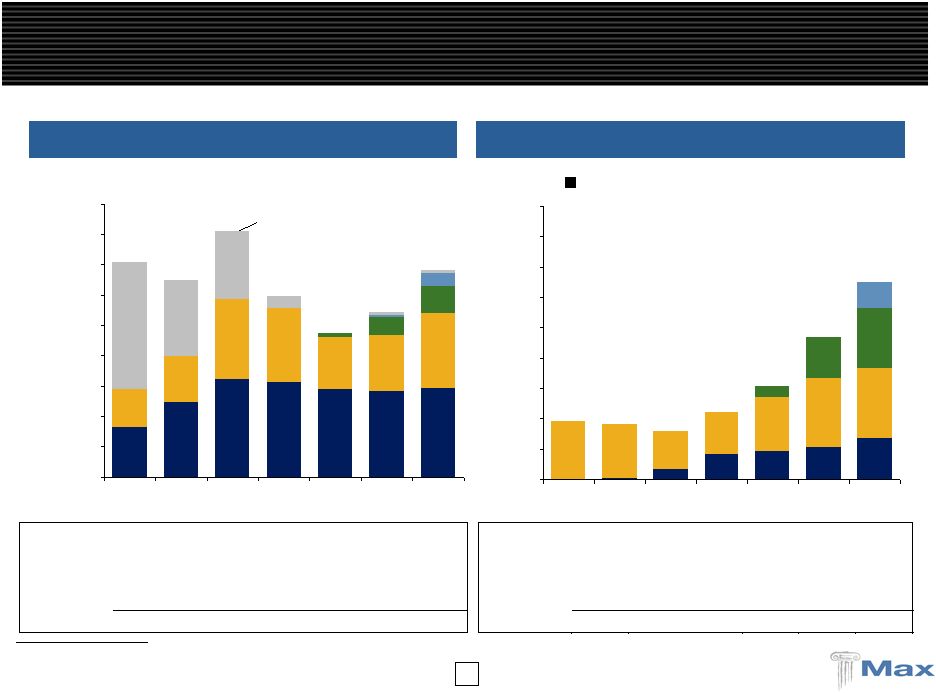 13 Lloyd's -- -- -- -- -- NM U.S. Specialty -- -- -- -- 274.7% 46.5% Reinsurance (6.1%) (30.7%) 11.6% 27.1% 27.4% 2.6% Insurance -- -- 141.7% 13.4% 13.5% 25.7% Total (5.0%) (12.8%) 39.6% 38.1% 52.7% 38.2% (1) Excludes non-traditional, which is composed of structured contracts that Max stopped writing in 2003. Short tail lines contributed to 83% of total growth over the last 3 years Strong Cycle Management Discipline Long Tail (GPW) Short Tail (GPW) ($ in millions) Non-Traditional (1) Year over year growth: Year over year growth: Lloyd's -- -- -- -- -- NM U.S. Specialty -- -- -- -- 386.2% 47.8% Reinsurance (1) 21.8% 72.2% (8.3%) (28.7%) 6.1% 34.2% Insurance 50.7% 30.5% (2.3%) (7.9%) (2.2%) 3.9% Total 38.1% 46.6% (5.0%) (14.7%) 12.4% 26.1% $163.2 $245.9 $321.0 $313.7 $289.0 $282.6 $293.7 $126.4 $154.0 $265.2 $243.2 $173.5 $184.1 $247.1 $12.3 $59.8 $88.4 $7.0 $43.7 $0.0 $100.0 $200.0 $300.0 $400.0 $500.0 $600.0 $700.0 $800.0 $900.0 2003 2004 2005 2006 2007 2008 2009 $289.6 $399.9 $586.2 $556.9 $474.8 $533.6 $672.8 $2.2 $34.3 $82.9 $94.0 $106.7 $134.1 $192.3 $180.5 $125.1 $139.6 $177.4 $226.0 $231.9 $35.9 $134.5 $197.1 $1.9 $85.3 $0.0 $100.0 $200.0 $300.0 $400.0 $500.0 $600.0 $700.0 $800.0 $900.0 2003 2004 2005 2006 2007 2008 2009 $192.3 $182.7 $159.4 $222.5 $307.3 $469.1 $648.4 |
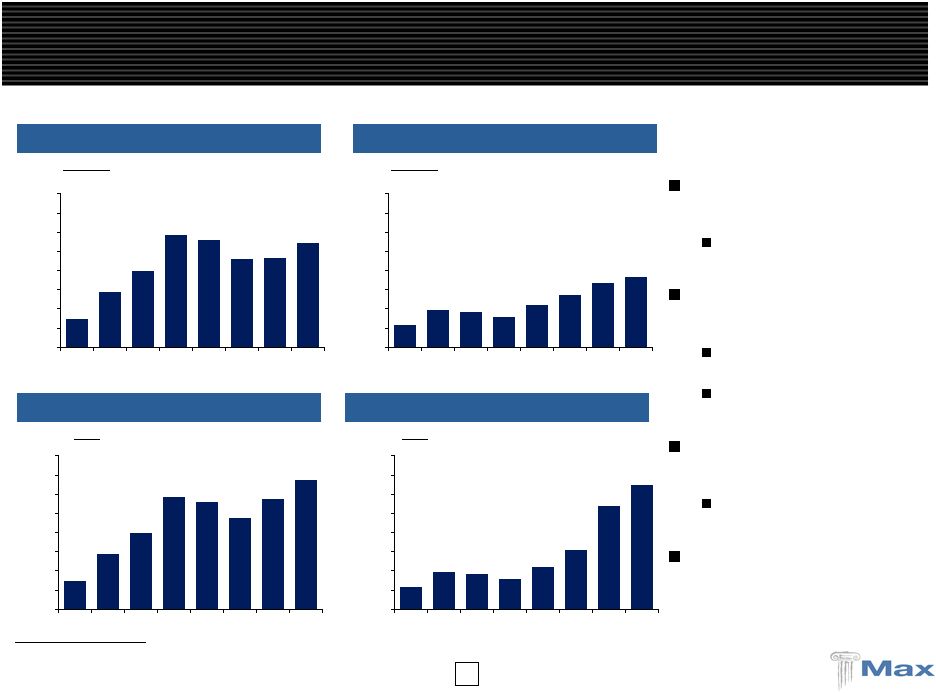 14 ($ in millions) Growth in casualty has been focused in the strong pricing period from 2002 to 2005 Premiums down approximately 7.7% since 2005 Growth in property has been focused in the strong post KRW pricing period from 2005 to 2007 Property insurance group founded after 2004 storms Property reinsurance group founded after KRW This is true even including the addition of U.S. Specialty and most recently Max at Lloyds Premiums in the new segments are focused on short tailed lines Max will grow its casualty lines as market conditions allow Growth Geared to the Insurance Cycle Bermuda/Dublin Long Tail (GPW) (without U.S Specialty and Lloyd's) Bermuda/Dublin Short Tail (GPW) (without U.S Specialty and Lloyd's) Total Long Tail (GPW) (with U.S Specialty and Lloyd's) Total Short Tail (GPW) (with U.S Specialty and Lloyd's) Note: Excludes non-traditional. 2008 includes full year pro forma Max at Lloyd’s GPW. $648.4 $540.5 $307.3 $222.5 $159.4 $182.7 $192.3 $116.3 $0.0 $100.0 $200.0 $300.0 $400.0 $500.0 $600.0 $700.0 $800.0 2002 2003 2004 2005 2006 2007 2008 2009 $366.0 $332.7 $271.3 $222.5 $159.4 $182.7 $192.3 $116.3 $0.0 $100.0 $200.0 $300.0 $400.0 $500.0 $600.0 $700.0 $800.0 2002 2003 2004 2005 2006 2007 2008 2009 $672.8 $573.5 $474.8 $556.9 $586.2 $399.9 $289.6 $148.5 $0.0 $100.0 $200.0 $300.0 $400.0 $500.0 $600.0 $700.0 $800.0 2002 2003 2004 2005 2006 2007 2008 2009 $148.5 $289.6 $399.9 $586.2 $556.9 $462.5 $466.7 $540.8 $0.0 $100.0 $200.0 $300.0 $400.0 $500.0 $600.0 $700.0 $800.0 2002 2003 2004 2005 2006 2007 2008 2009 |
 15 Calendar Year Accident Year Note: Five year average is the mean combined ratio of each of the five years from 2004 to 2008. (1) Since 2006. Peer Comparison – 5 Year Average Combined Ratios 86% 91% 92% 93% 93% 93% 94% 101% 101% 40.0% 50.0% 60.0% 70.0% 80.0% 90.0% 100.0% 110.0% AXS ACGL AHL ENH AWH MXGL PTP TRH ORH 96% 96% 97% 97% 98% 101% 101% 101% 104% 40.0% 50.0% 60.0% 70.0% 80.0% 90.0% 100.0% 110.0% TRH ACGL ORH AXS MXGL PTP ENH AHL AWH |
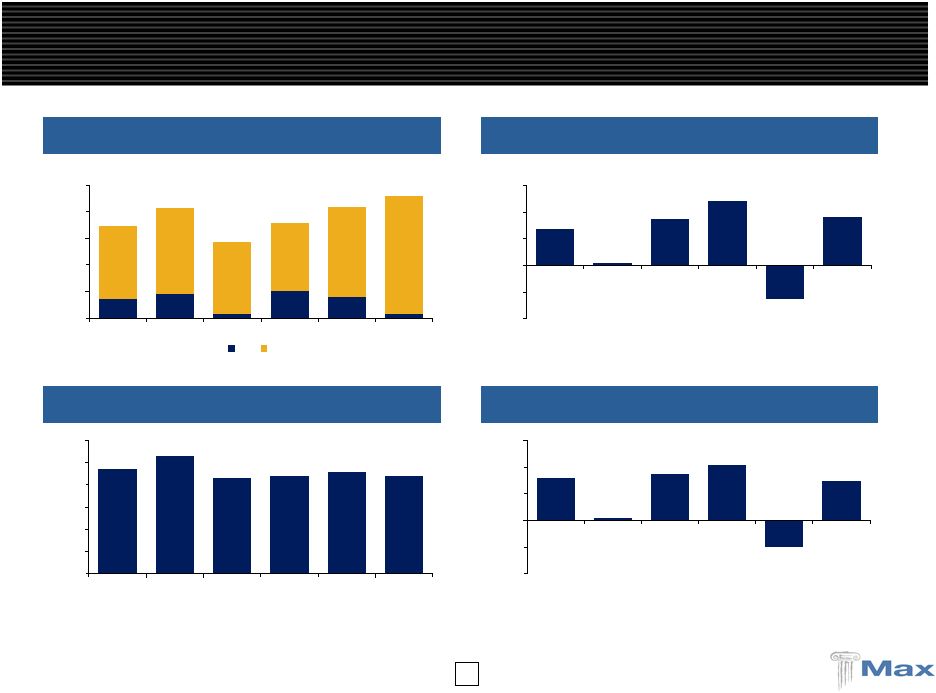
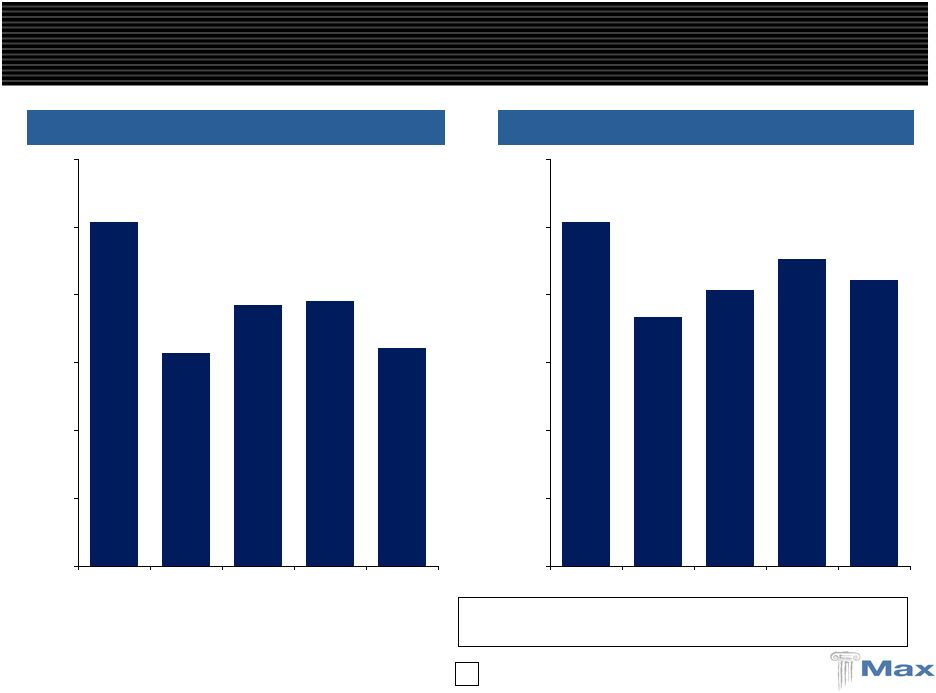 16 ($ in millions) Total favorable (adverse) development $0.0 $20.9 $8.8 $22.6 $41.3 Calendar Year Accident Year 64.3% 78.1% 77.1% 62.8% 101.5% 0.0% 20.0% 40.0% 60.0% 80.0% 100.0% 120.0% 2005 2006 2007 2008 2009 Bermuda/Dublin Insurance Loss Ratios 84.3% 90.6% 81.5% 73.3% 101.5% 0.0% 20.0% 40.0% 60.0% 80.0% 100.0% 120.0% 2005 2006 2007 2008 2009 Note: Favorable (adverse) development excludes changes in reserves resulting from changes in premium estimates in prior years’ contracts. |
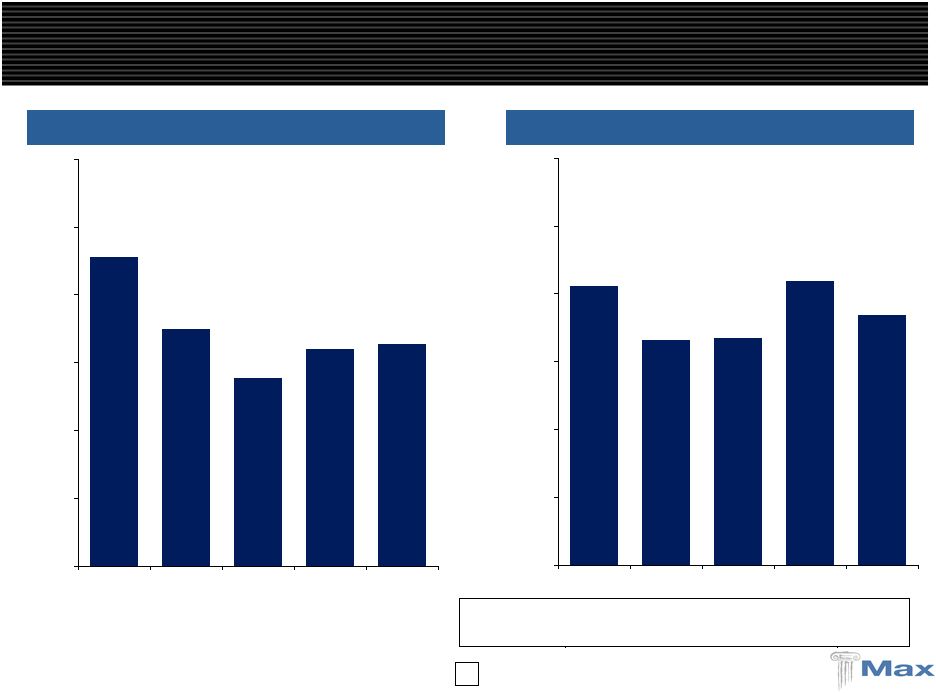 17 ($ in millions) Total favorable (adverse) development ($10.1) ($15.0) $36.3 $68.1 $32.0 Calendar Year Accident Year 65.6% 64.0% 55.4% 70.0% 91.1% 0.0% 20.0% 40.0% 60.0% 80.0% 100.0% 120.0% 2005 2006 2007 2008 2009 Bermuda/Dublin Reinsurance Loss Ratios Note: Favorable (adverse) development excludes changes in reserves resulting from changes in premium estimates in prior years’ contracts. 73.9% 83.9% 67.0% 66.5% 82.3% 0.0% 20.0% 40.0% 60.0% 80.0% 100.0% 120.0% 2005 2006 2007 2008 2009 |
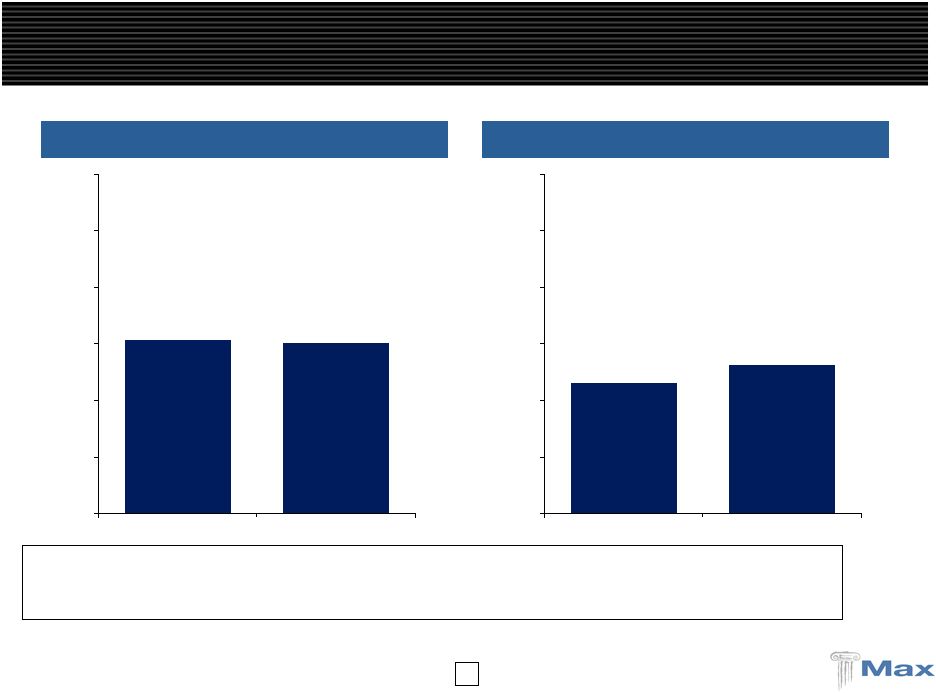 18 Total favorable (adverse) development ($1.1) $6.1 ($ in millions) U.S. Specialty and Lloyd's Loss Ratios U.S. Specialty 2009 Max at Lloyd's 2009 0.0% 20.0% 40.0% 60.0% 80.0% 100.0% 120.0% Calendar Year Accident Year 46.2% 52.7% 0.0% 20.0% 40.0% 60.0% 80.0% 100.0% 120.0% Calendar Year Accident Year 61.5% 60.4% |
 19 Max Investment Portfolio Philosophy Max maintains a high quality, liquid portfolio 94% of portfolio in fixed income/cash, which are comprised of highly rated securities Assets are generally matched to liabilities Cycle management extends to investments – current posture is defensive Cash balance of $702 million or 13.4% of portfolio Larger than normal cash position provides incremental investment income as cash is redeployed Current average fixed income duration of approximately 5.4 years excluding the impact of cash 68% of the cash and fixed maturities portfolio is held in cash, government / agency-backed securities, or AAA securities 73% of fixed income portfolio rated AA or better No CDO's, CLO's, SIV's or other highly structured securities Hedge fund investments are marked-to-market Fixed income portfolio has outperformed peer group in both returns and quality with meaningfully lower OTTI losses than peers As of December 31, 2009 $5.3 billion Hedge funds Cash Fixed income 80.6% 13.4% 6.0% |
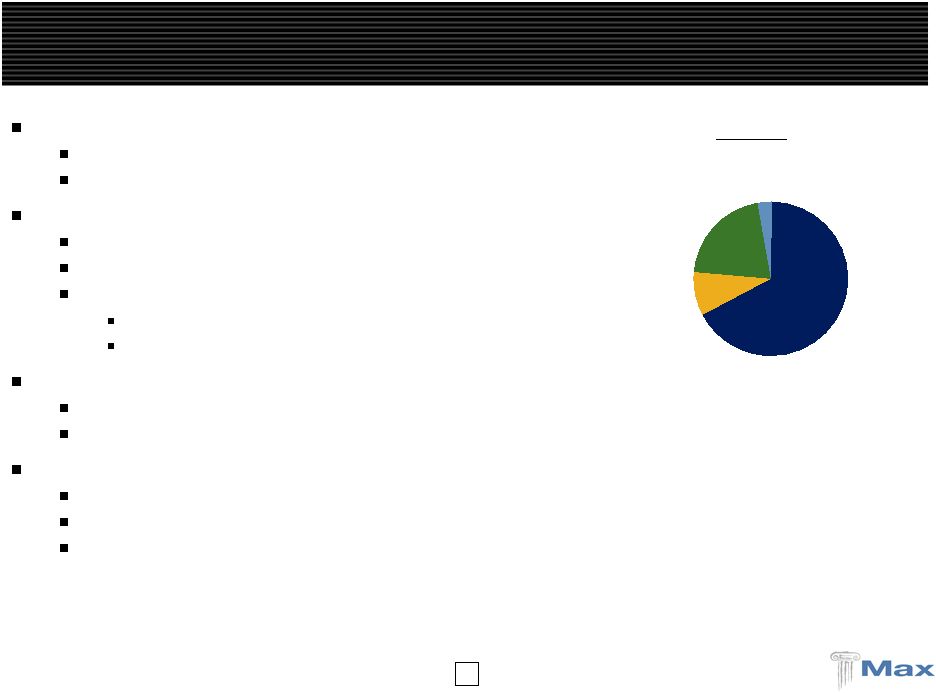 20 Max is Well Positioned To Navigate The Softer Cycle Max Bermuda and Dublin (Insurance/Reinsurance) Rates remain favorable in short-tail property cat Long-tail professional lines still attractive Max at Lloyd's Provides access to global specialty business, high credit ratings, worldwide licenses Experienced team underwriting a seasoned book of business Building out the platform recruiting new teams with recent additions International casualty reinsurance Marine and personal accident insurance Max Specialty Strong distribution relationships continue to generate a high flow of business Profitability improving as the business matures into its expense base Max Latin America Emerging market with significant growth potential Bringing on a seasoned underwriting team with strong market relationships and profitable track record Anticipate GPW of $50 million in 2010 2009 GPW Max Specialty Max at Lloyd's Bermuda / Dublin Insurance / Reinsurance 67% 9% 21% 3% Life Reinsurance |
 21 Well established operating platforms provide full access to business Diversified portfolio of business across casualty and property lines Specialty orientation with a balance of insurance vs. reinsurance Opportunistic approach – nimble and responsive to market trends Defensive, high quality investment portfolio Invested asset leverage will drive more consistent returns Balance sheet strength with low leverage / financial flexibility Max Offers a Compelling Story We believe we can generate an average ROE of 13% to 16% across the cycle Attractive entry point – current price / book value of 0.82x Note: Price / book multiple as of 2/5/10. |
 Appendix |
 23 ($ in millions) December 31, December 31, 2009 2008 Cash & Fixed Maturities $4,944 $4,603 Other Investments 315 754 Premium Receivables 567 555 Losses Recoverable 1,001 847 Other Assets 513 493 Total Assets $7,340 $7,252 Property & Casualty Losses $3,178 $2,938 Life & Annuity Benefits 1,373 1,367 Deposit Liabilities 153 219 Funds Withheld 140 164 Unearned Premium 628 574 Bank Loan - 375 Senior Notes 90 91 Other Liabilities 213 244 Total Liabilites $5,775 $5,972 Shareholders' Equity 1,565 1,280 $7,340 $7,252 Strong Balance Sheet |
 24 ($ in millions) December 31, December 31, 2009 2008 Gross Premiums Written $1,375 $1,254 Net Premiums Earned 834 814 Net Investment Income 170 182 Net Realized and Unrealized Gains (Losses) on Investments 82 (235) Other Than Temporary Impairment Charges (3) (17) Realized Gain on Retirement of Senior Notes 0 2 Other Income 3 1 Total Revenues 1,086 747 Total Losses, Expenses & Taxes 830 921 Net Income $256 ($174) Net Operating Income $209 ($144) Property & Casualty Underwriting Loss Ratio 62% 69% Expense Ratio 26% 23% Combined Ratio 88% 92% Yearly Results Comparison |
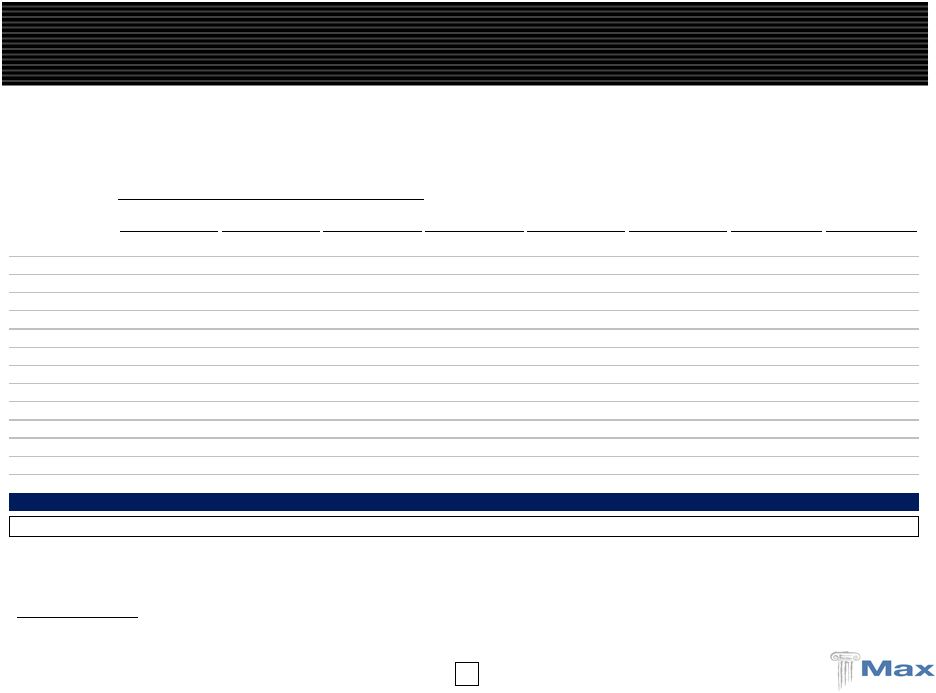
 25 Year ended December 31, 2009 ($ in millions) (1) Property and Casualty only. Diversified Operating Platform Life & Property & Casualty Annuity Corporate Consolidated Bermuda / Dublin Max at Insurance Reinsurance U.S. Specialty Lloyd's Total Reinsurance Gross premiums written $427.8 $489.0 $285.5 $129.0 $1,331.2 $43.8 $0.0 $1,375.0 Reinsurance premiums ceded (212.1) (80.0) (155.1) (32.9) (480.1) (0.4) 0.0 (480.5) Net premiums written $215.7 $409.0 $130.4 $96.1 $851.2 $43.3 $0.0 $894.5 Earned premiums 417.1 476.4 256.7 125.0 1,275.2 43.8 0.0 1,318.9 Earned premiums ceded (211.1) (88.6) (154.6) (29.9) (484.2) (0.4) 0.0 (484.6) Net premiums earned $206.0 $387.9 $102.1 $95.1 $791.0 $43.3 $0.0 $834.4 Net investment income $22.9 $40.2 $6.0 $4.4 $73.5 $51.0 $45.3 $169.7 Net realized and unrealized gains (losses) on investments 4.4 10.5 0.2 2.6 17.8 37.3 26.6 81.8 Net impairment losses recognized in earnings 0.0 0.0 0.0 0.0 0.0 0.0 (3.1) (3.1) Net realized gain on retirement of senior notes 0.0 0.0 0.0 0.0 0.0 0.0 0.1 0.1 Other income 1.2 0.0 0.3 0.7 2.2 (0.1) 0.8 2.9 Total revenues $234.5 $438.6 $108.6 $102.7 $884.5 $131.6 $69.7 $1,085.8 Net losses and loss expenses $132.4 $254.5 $62.8 $44.0 $493.6 $0.0 $0.0 $493.6 Claims and policy benefits 0.0 0.0 0.0 0.0 0.0 101.1 0.0 101.1 Acquisition costs (1.2) 71.1 7.5 18.1 95.5 1.4 0.0 96.9 Interest expense 0.8 6.6 0.0 0.0 7.4 3.3 10.6 21.3 Net foreign exchange losses 0.0 0.0 0.0 (5.1) (5.1) 0.0 (0.7) (5.8) Merger and acquisition expenses 0.0 0.0 0.0 0.0 0.0 0.0 (31.6) (31.6) General and administrative expenses 24.6 31.8 31.2 20.0 107.6 2.8 43.6 154.0 Total losses and expenses 156.5 363.9 101.5 77.0 699.0 108.6 22.0 829.6 Income before taxes $78.0 $74.7 $7.1 $25.7 $185.5 $23.0 $47.8 $256.2 Loss ratio 64.3% 65.6% 61.5% 46.2% 62.4% Acquisition cost ratio -0.6% 18.3% 7.3% 19.1% 12.1% General and administrative expense ratio 11.9% 8.2% 30.7% 21.0% 13.6% Combined ratio (1) 75.6% 92.1% 99.5% 86.3% 88.1% |
 26 14.7% (10.0%) 20.7% 17.3% 1.0% 15.8% (20.0%) (10.0%) 0.0% 10.0% 20.0% 30.0% 2004 2005 2006 2007 2008 2009 88% 92% 88% 86% 106% 94% 0% 20% 40% 60% 80% 100% 120% 2004 2005 2006 2007 2008 2009 $3.62 ($2.54) $4.81 $3.52 $0.19 $2.70 ($4.00) ($2.00) $0.00 $2.00 $4.00 $6.00 2004 2005 2006 2007 2008 2009 Gross Premiums Written ($ in millions) P&C Combined Ratio Operating Diluted EPS (1) Operating ROE ____________________ (1) Excludes merger and acquisition related revenue and expenses. Profitable Underwriting Trends $44 $242 $302 $45 $275 $212 $0 $300 $600 $900 $1,200 $1,500 Life P&C $1,044 $1,246 $865 $1,078 $1,254 $1,375 2004 2005 2006 2007 2008 2009 |
 27 $1,565 $1,280 $1,584 $1,390 $1,186 $903 $28.01 $22.94 $27.54 $23.06 $20.16 $19.70 $0 $300 $600 $900 $1,200 $1,500 $1,800 $0.00 $5.00 $10.00 $15.00 $20.00 $25.00 $30.00 Shareholders' Equity Book Value per Share 2004 2005 2006 2007 2008 2009 $0.38 $0.36 $0.32 $0.24 $0.18 $0.12 $0.00 $0.10 $0.20 $0.30 $0.40 2004 2005 2006 2007 2008 2009 Investment Leverage Shareholders' Equity Book Value per Share Invested Assets ($ in millions) Shareholders Equity and BVPS ($ in millions) Operating Cash Flow ($ in millions) Dividends A Growing, Global Insurance / Reinsurance Company $5,259 $3,515 $4,228 $4,536 $5,123 $5,357 3.4x 3.9x 3.6x 3.3x 3.2x 4.2x $0 $1,000 $2,000 $3,000 $4,000 $5,000 $6,000 0.0x 1.0x 2.0x 3.0x 4.0x 5.0x Invested Assets Leverage 2004 2005 2006 2007 2008 2009 $193 $482 $228 $405 $442 $799 $0 $200 $400 $600 $800 $1,000 2004 2005 2006 2007 2008 2009 |
 28 (As of September 30, 2009) ($ in millions) Source: Company filings. (1) Includes short term investments. (2) OTTI not applicable. All realized and unrealized gains run through the income statement. Investment Portfolio is Currently In-Line With its Peers 2008 and % of Total Cash & Investments Equity / Other YTD Q3 '09 Cash & Cash Fixed Income Equity / Other Total Cash & Investment YTD Q3 '09 as a % of OTTI as % Equivalents (1) Securities Securities Investments Leverage Investment Yield Equity of Equity PartnerRe (2) 6.3% 86.2% 7.5% $13,058.1 2.4x 4.5% 18.1% NA Everest Re 10.6% 84.0% 5.4% 15,113.0 2.5x 3.7% 13.4% 3.1% Arch Capital 8.8% 84.2% 7.1% 12,461.0 2.8x 5.1% 19.8% 7.3% AXIS 12.8% 81.5% 5.7% 11,884.1 2.2x 4.1% 12.6% 7.7% Validus (2) 17.3% 80.4% 2.3% 5,707.5 1.4x 2.5% 3.3% NA RenaissanceRe 18.5% 67.8% 13.7% 6,640.8 1.8x 5.4% 24.4% 7.7% Transatlantic 7.3% 86.3% 6.4% 12,130.1 3.0x 4.1% 19.2% 10.0% Allied World 4.6% 93.3% 2.1% 7,554.2 2.5x 4.2% 5.3% 9.1% Aspen 20.9% 78.7% 0.4% 6,590.6 2.1x 4.1% 0.8% 2.5% Endurance 21.5% 72.8% 5.7% 6,172.5 2.3x 5.2% 13.0% 4.9% Platinum Re 10.4% 89.5% 0.1% 4,413.8 2.0x 4.0% 0.2% 2.8% Montpelier Re (2) 9.2% 81.9% 8.9% 2,720.3 1.6x 3.1% 14.0% NA FlagstoneRe (2) 29.2% 68.1% 2.7% 1,838.1 1.6x 1.5% 4.4% NA Argo Group 14.4% 77.5% 8.1% 4,334.2 2.8x 3.6% 22.3% 5.6% Mean 13.7% 80.9% 5.4% 2.2x 3.9% 12.2% 6.1% Max Capital 19.5% 73.3% 7.2% $5,418.3 3.5x 4.6% 25.2% 1.4% |