Annual Report
Convergence Long/Short Equity ETF
(CLSE)
November 30, 2022
Investment Adviser
Convergence Investment Partners, LLC
3801 PGA Boulevard
Suite 1001
Palm Beach Gardens, Florida 33410
Phone: 877-677-9414
Table of Contents
| LETTER TO SHAREHOLDERS | 3 |
| EXPENSE EXAMPLES | 6 |
| INVESTMENT HIGHLIGHTS | 7 |
| SCHEDULE OF INVESTMENTS | 10 |
| SCHEDULE OF SECURITIES SOLD SHORT | 16 |
| STATEMENT OF ASSETS AND LIABILITIES | 24 |
| STATEMENT OF OPERATIONS | 25 |
| STATEMENTS OF CHANGES IN NET ASSETS | 26 |
| STATEMENT OF CASH FLOWS | 27 |
| FINANCIAL HIGHLIGHTS | 28 |
| NOTES TO FINANCIAL STATEMENTS | 30 |
| REPORT OF INDEPENDENT REGISTERED | |
| PUBLIC ACCOUNTING FIRM | 40 |
| NOTICE OF PRIVACY POLICY & PRACTICES | 41 |
| ADDITIONAL INFORMATION | 42 |
Convergence Investment Partners
2022 Annual Shareholder Report
Convergence Long/Short Equity ETF (CLSE)
Shareholder Letter (Unaudited)
Dear Shareholder:
We are pleased to provide you the annual report of the Convergence Long/Short Equity ETF (the “ETF”) for the one-year period ended November 30, 2022. We are especially pleased to report that we were able to deliver a positive return for our investors over the past twelve months, a period when the Russell 3000® Total Return Index was negative. The net asset value (NAV) of the ETF was up 2.39% over the twelve months ended November 30, 2022, while the Russell 3000® Total Return Index was down -10.80%, which equates to over 13 percentage points of outperformance for the ETF, net of fees.
We manage our ETF with the philosophy that over the long term strong “fundamentals” outperform weak “fundamentals.” Our ETF employs the Convergence systematic long/short investment approach which seeks to benefit from fundamentally strong companies outperforming their counterparts with comparatively weaker fundamentals. Over time the ETF seeks strong total returns from favored long positions with the potential for downside risk mitigation through a carefully selected program of actively selling disfavored stocks short. To construct both the long portfolio and short portfolio, our ETF utilizes the Convergence proprietary stock ranking process which analyzes the domestic investment universe and helps to identify, quantify, and rank strong and weak fundamentals.
Convergence monitors the performance of different stock market characteristics to learn what the market is rewarding or punishing at any time. Our long-term investors know that we analyze numerous statistical observations and stock factors for over 3,000 domestic stocks. Those observations are then grouped into composites to develop signals for each stock that we use to rank their potential on different dimensions to which we give names like Traditional Value and Accelerating Sales. Over the twelve months ended November 30, 2022, we see that much of the positive differentiation between stocks has been a combination of value, earnings risk, and economic size. Conversely, only two signals showed a negative contribution in this period: companies with robust price momentum and sales momentum. These were the only two signals in our process that had negative spread returns because much of these companies’ prior momentum declined or reversed. Tilts to companies based on price reversal and quality were the least beneficial as their spread returns were the least positive when compared to our suite of signals. We believe that, even in times of market stress like the last twelve months, there can be benefits to a fundamental approach to investing which guides the signal diversification we employ at Convergence. While it is unlikely for all fundamental tilts to generate a positive spread in short time periods, we believe these fundamental spreads, based on sound economic principles, can help produce real wealth for investors over time as they provide complementary attributes. We remain steadfast to our philosophy that strong fundamentals win in the long run.
Digging a bit deeper into the performance of the past twelve months, our ETF outperformed its benchmark in both the long and short portions of the portfolio. Our long positions outperformed the Russell 3000® Total Return Index and the short positions underperformed, thereby generating a positive long-short spread for the year. It is important to remember that our ETF maintained a net exposure of approximately 76.4% for the most recent six months ended November 30, 2022, with 40.2% of capital allocated to short positions, while our long-only benchmark has a 0% weight to short holdings. Positions in the Energy, Pharmaceuticals and Healthcare Equipment & Services industry groups contributed the most to our total returns for the most recent twelve months. The largest detracting industry groups for the same period were Media, Automobiles, and Diversified Financials.
At Convergence, we understand that selection of portfolio positions, be they long or short, will not add to the ETF’s outperformance in every consecutive month, quarter, or year. We do, however, firmly believe that investment decisions based on a sound and logical philosophy, paired with a long-term approach, can deliver superior results. Buying reasonably valued stocks with strong earnings and sales growth, while shorting low quality, unprofitable stocks with wild valuations is our recipe for success at Convergence.
The objective of the Convergence Long/Short Equity ETF is to achieve long-term capital growth. The ETF seeks to realize its investment objective by establishing long and short positions in equity securities of domestic companies with medium and large market capitalizations. The ETF will hold purchased securities (long positions) that Convergence believes will outperform the market, and it will sell short securities (short positions) expected to underperform the market. Convergence constructs the portfolio as an actively managed equity strategy that adapts to ever changing market dynamics through a market cycle. The ETF intends to maintain a net long exposure (the market value of long positions minus the market value of short positions) of approximately 50% to 100% of the ETF’s total assets. Under normal market conditions, the ETF’s long positions may range from 90% to 150% of the ETF’s total assets, and its short positions may range from 20% to 70% of the ETF’s total assets. In making investment decisions for the ETF, Convergence utilizes stock-level analysis to focus on the individual strengths of the underlying companies and the market’s preferences to judge the relative and absolute attractiveness of the companies within each industry group.
Convergence Long/Short Equity ETF Performance
In the twelve months ended November 30, 2022, the ETF returned 2.39% as measured by the change in ETF net asset value, versus the Russell 3000® Total Return Index at -10.80%.
Average Annual Total Returns (net of fees)
| | | | | | | | Since |
| Through | One | | | One | Three | Five | Inception |
November 30, 2022 | Month | Quarter | YTD | Year | Years | Years | Annualized |
| Convergence | | | | | | | |
| Long/Short Equity ETF | | | | | | | |
| (CLSE@NAV) | 3.58% | 6.40% | -3.24% | 2.39% | 6.63% | 6.45% | 11.15% |
| Convergence | | | | | | | |
| Long/Short Equity ETF | | | | | | | |
| (CLSE@Market) | 3.35% | 6.14% | -3.41% | 2.20% | 6.56% | 6.42% | 11.13% |
Russell 3000® | | | | | | | |
| Total Return | 5.22% | 3.29% | -14.18% | -10.80% | 10.28% | 10.33% | 12.43% |
Strategy inception = 12/29/2009
Mutual Fund Inception = 12/29/2009
Mutual Fund to ETF conversion = 02/18/2022
Performance data quoted represents past performance and does not guarantee future results. The investment return and principal value of an investment will fluctuate so that an investor’s shares, when redeemed, may be worth more or less than their original cost. Current performance of the ETF may be lower or higher than the performance quoted. Performance data current to the most recent month-end may be obtained by calling 1-877-677-9414. Shares are bought and sold at market price not net asset value (NAV). Market price returns are based upon the closing composite market price and do not represent the returns you would receive if you traded shares at other times.
Total Expense Ratio of the ETF applicable to all investors is 1.56%, comprised of the Management Fee of 0.95% and dividends and interest on short positions of 0.61%.
The Convergence fundamental stock picking methodology is geared toward long holdings with strong cash flow, earnings, profits, and other desirable financial characteristics. We strive to achieve these favorable portfolio statistics while seeking companies that are undervalued relative to their peers. Our research has shown that, over time, companies with these characteristics have rewarded investors, as the portfolio statistics demonstrate attributes of healthy and growing companies with competitively strong business models. The Convergence process separately seeks to identify companies with weak or declining fundamentals, and our research has shown this to be effective in sourcing alpha from shorting. The current environment is especially interesting as mega cap technology stocks are likely to face challenges from rising cost pressures along with slowing revenues. Therefore, we believe the forthcoming market cycle will continue to offer opportunities for active managers such as Convergence.
In closing, as we always say, stay fundamental.
Thank you for your support.
| David J. Abitz, CFA | Justin Neuberg, CFA |
| President & Chief Investment Officer | Co-Portfolio Manager |
| Convergence Investment Partners, LLC | Convergence Investment Partners, LLC |
Disclosures
Past performance is not indicative of future results.
This commentary is for informational purposes only and should not be viewed as a recommendation to buy or sell any security. Investors should seek financial advice regarding the appropriateness of investing in any securities or investment strategies discussed in this documentation and should understand that statements regarding future prospects may not be realized. Investors should note that income from such securities may fluctuate, and that each security’s price or value may rise or fall. Accordingly, investors may receive back less than originally invested. There is no guarantee that the views expressed will come to pass.
Mutual fund investing involves risk. Principal loss is possible. Investments in small, micro and midcap companies involve additional risks such as limited liquidity and greater volatility than larger capitalization companies. The ETF may invest in foreign securities which involve greater volatility and political, economic and currency risks and differences in accounting methods. The ETF regularly make short sales of securities, which involves unlimited risk including the possibility that losses may exceed the original amount invested. However, a fund investor’s risk is limited to one’s amount of investment in the fund.
Must be preceded or accompanied by a prospectus.
Diversification does not assure a profit nor protect against loss in a declining market.
Foreside Fund Services, LLC, distributor.
Alpha – The excess return of an investment relative to the return of a benchmark index is the investment’s alpha.
The Russell 3000® Total Return Index measures the total return performance of the largest 3,000 U.S. companies representing approximately 96% of the investable U.S. equity market. You cannot invest directly in an index. The volatility of an index may be materially different from that of the strategy due to varying degrees of diversification and other factors. Index returns do not reflect the deduction of any fees.
CONVERGENCE LONG/SHORT EQUITY ETF
Expense Examples
(Unaudited)
As a shareholder of the Fund, you incur two types of costs: (1) transaction costs, including brokerage commissions on purchases and sales of Fund shares, and (2) ongoing costs, such as investment management fees and dividends and interest on short positions. This Example is intended to help you understand your ongoing costs (in dollars) of investing in the Fund, and to compare these costs with the ongoing costs of investing in other ETFs. The Example is based on an investment of $1,000 invested at the beginning of the period and held for the entire period (6/1/22 – 11/30/22).
Actual Expenses
The first line of the following table provides information about actual account values and actual expenses. You may use the information in this line, together with the amount you invested, to estimate the expenses that you paid over the period. Simply divide your account value by $1,000 (for example, an $8,600 account value divided by $1,000 = 8.6), then multiply the result by the number in the first line under the heading titled “Expenses Paid During Period” to estimate the expenses you paid on your account during this period.
Hypothetical Example for Comparison Purposes
The second line of the following table provides information about hypothetical account values and hypothetical expenses based on the Fund’s actual expense ratios and an assumed rate of return of 5% per year before expenses, which is not the Fund’s actual return. The hypothetical account values and expenses may not be used to estimate the actual ending account balance or expenses you paid for the period. You may use this information to compare the ongoing costs of investing in the Fund and other funds. To do so, compare this 5% hypothetical example with the 5% hypothetical examples that appear in the shareholder reports of other funds. Please note that the expenses shown in the table are meant to highlight your ongoing costs only and do not reflect any transactional costs, such as redemption fees. Therefore, the second line of the table is useful in comparing ongoing costs only, and will not help you determine the relative total costs of owning different funds. In addition, if these transactional costs were included, your costs would have been higher.
| | Beginning | Ending | Expenses Paid |
| | Account Value | Account Value | During Period |
| | 6/1/22 | 11/30/22 | 6/1/22 – 11/30/22* |
| Actual | $1,000.00 | $ 981.40 | $5.22 |
| Hypothetical (5% return | | | |
| before expenses) | $1,000.00 | $1,019.80 | $5.32 |
| | * | Expenses are equal to the Fund’s annualized expense ratio of 1.05%, multiplied by the average account value over the period, multiplied by 183/365 (to reflect the one-half year period). Excluding dividends on short positions, interest and broker expenses, the Fund’s annualized expense ratio would be 0.95%. |
CONVERGENCE LONG/SHORT EQUITY ETF
Investment Highlights
(Unaudited)
The investment objective of the Fund is to seek long-term capital growth. The Fund seeks to achieve its investment objective by investing, under normal market conditions, at least 80% of its net assets (plus any borrowings for investment purposes) in long and short positions in equity securities of domestic companies. The Fund focuses primarily on companies with medium and large market capitalizations, although the Fund may establish long and short positions in companies of any market capitalization. The Fund generally considers companies with medium and large market capitalizations to be those companies that comprise the upper half of the Russell 3000® Total Return Index. As of December 31, 2021, the market capitalization range of the upper half of the Russell 3000® Total Return Index was between $2.02 billion and $2,737.82 billion. The Fund will hold long (purchase) securities that the Adviser believes will outperform the market, and will sell short securities expected to underperform the market.
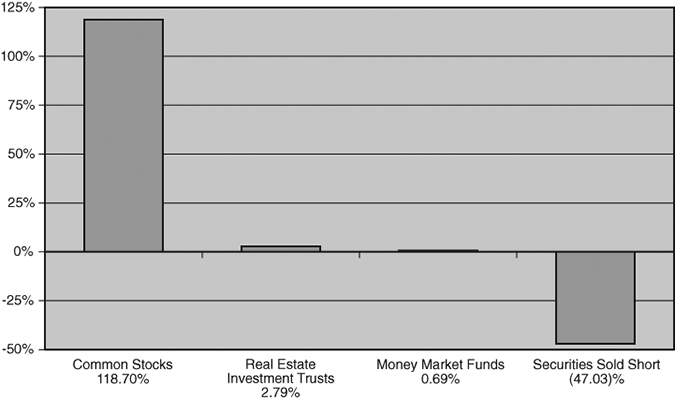
Allocation of Portfolio Holdings
(as a percentage of net assets)
Continued
CONVERGENCE LONG/SHORT EQUITY ETF
Investment Highlights (Continued)
(Unaudited)
Average Annual Total Returns as of November 30, 2022
| | Six | One | Five | Ten |
| | Months | Year | Years | Years |
| Convergence Long/Short Equity ETF — NAV | -1.74% | 2.39% | 6.45% | 10.15% |
| Convergence Long/Short Equity ETF — Market | -1.86% | 2.20% | 6.42% | 10.13% |
Russell 3000® Total Return Index | -0.33% | -10.80% | 10.33% | 12.95% |
The Fund converted from a mutual fund to an ETF pursuant to an Agreement and Plan of Reorganization on February 18, 2022. Performance data includes the Fund’s prior performance history as a mutual fund. The Market Price returns shown prior to February 18, 2022, reflect the mutual fund’s NAV.
The performance data quoted represents past performance and does not guarantee future results. The investment return and principal value of an investment will fluctuate so that an investor’s shares, when redeemed, may be worth more or less than their original cost. Current performance of the Fund may be lower or higher than the performance quoted. Performance data current to the most recent month-end may be obtained by calling 877-677-9414.
Investment performance reflects fee waivers in effect for the Fund prior to February 18, 2022. In the absence of such waivers, total returns would be reduced for the periods prior to February 18, 2022.
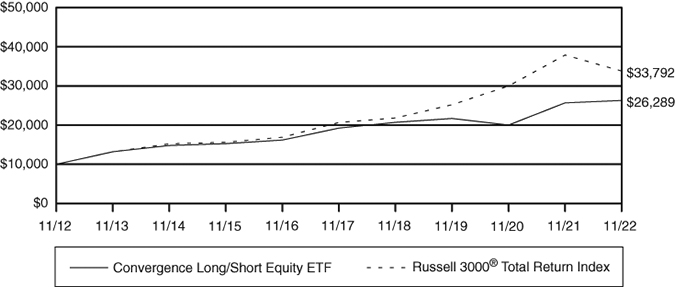
The returns shown assume reinvestment of Fund distributions and do not reflect the deduction of taxes that a shareholder would pay on Fund distributions or the redemption of Fund shares. The following graph illustrates performance of a hypothetical investment made in the Fund and a broad-based securities index over the last 10 year time period. The graph does not imply any future performance.
Shares are bought and sold at market price (closing price), not net asset value (“NAV”), and are not individually redeemed from the Fund. Market performance is determined using the bid/ask midpoint at 4:00 p.m. Eastern time when the NAV is typically calculated. Brokerage commissions will reduce returns. Returns shown include the reinvestment of all dividends and distribution. Returns shown do not reflect the deduction of taxes that a shareholder would pay on fund distributions or the redemption of fund shares.
The Russell 3000® Total Return Index measures the performance of the largest 3,000 U.S. companies representing approximately 98% of the investable U.S. equity market. One cannot invest directly in an index.
Continued
CONVERGENCE LONG/SHORT EQUITY ETF
Investment Highlights (Continued)
(Unaudited)
Growth of $10,000 Investment
CONVERGENCE LONG/SHORT EQUITY ETF
November 30, 2022
| | | Shares | | | Value | |
| COMMON STOCKS* – 118.70% | | | | | | |
| | | | | | | |
| Accommodation – 0.56% | | | | | | |
| Boyd Gaming Corp. | | | 2,232 | | | $ | 136,888 | |
| | | | | | | | | |
| Administrative and Support Services – 5.06% | | | | | | | | |
| CBIZ, Inc. (a) | | | 1,708 | | | | 84,801 | |
| Fair Isaac Corp. (a) | | | 656 | | | | 406,536 | |
| Mastercard, Inc. | | | 837 | | | | 298,307 | |
| TripAdvisor, Inc. (a) | | | 5,581 | | | | 113,797 | |
| Visa, Inc. | | | 1,516 | | | | 328,972 | |
| | | | | | | | 1,232,413 | |
| Animal Production and Aquaculture – 0.99% | | | | | | | | |
| Cal-Maine Foods, Inc.(c) | | | 4,123 | | | | 240,289 | |
| | | | | | | | | |
| Broadcasting (except Internet) – 0.61% | | | | | | | | |
| Sirius XM Holdings, Inc. | | | 23,101 | | | | 149,926 | |
| | | | | | | | | |
| Building Material and Garden Equipment – 1.51% | | | | | | | | |
| Home Depot, Inc. | | | 1,130 | | | | 366,109 | |
| | | | | | | | | |
| Chemical Manufacturing – 13.44% | | | | | | | | |
| AbbVie, Inc. | | | 2,258 | | | | 363,945 | |
| Albemarle Corp. | | | 568 | | | | 157,898 | |
| Amgen, Inc. | | | 1,162 | | | | 332,797 | |
| Amicus Therapeutics, Inc. (a) | | | 5,707 | | | | 69,055 | |
| Bristol-Myers Squibb Co. | | | 4,358 | | | | 349,861 | |
| CF Industries Holdings, Inc. | | | 1,693 | | | | 183,167 | |
| Colgate-Palmolive Co. | | | 2,046 | | | | 158,524 | |
| Gilead Sciences, Inc. | | | 4,510 | | | | 396,112 | |
| Harmony Biosciences Holdings, Inc. (a) | | | 2,090 | | | | 124,919 | |
| Incyte Corp. (a) | | | 785 | | | | 62,541 | |
| Ionis Pharmaceuticals, Inc. (a) | | | 1,487 | | | | 60,655 | |
| Lantheus Holdings, Inc. (a) | | | 3,252 | | | | 201,885 | |
| Merck & Co., Inc. | | | 2,577 | | | | 283,779 | |
| Neurocrine Biosciences, Inc. (a) | | | 399 | | | | 50,697 | |
| Procter & Gamble Co. | | | 654 | | | | 97,551 | |
| Vertex Pharmaceuticals, Inc. (a) | | | 1,207 | | | | 381,895 | |
| | | | | | | | 3,275,281 | |
| Computer and Electronic Product Manufacturing – 21.33% | | | | | | | | |
| Advanced Energy Industries, Inc. | | | 623 | | | | 57,715 | |
| Alphabet, Inc. – Class A (a) | | | 4,510 | | | | 455,464 | |
| Alphabet, Inc. – Class C (a) | | | 6,408 | | | | 650,091 | |
| Apple, Inc.(c) | | | 3,730 | | | | 552,152 | |
The accompanying notes are an integral part of these financial statements.
CONVERGENCE LONG/SHORT EQUITY ETF
| Schedule of Investments (Continued) |
November 30, 2022
| | | Shares | | | Value | |
| Computer and Electronic Product | | | | | | |
| Manufacturing – 21.33% (Continued) | | | | | | |
| Arista Networks, Inc. (a) | | | 838 | | | $ | 116,733 | |
| Broadcom, Inc. | | | 711 | | | | 391,782 | |
| Cisco Systems, Inc.(c) | | | 8,871 | | | | 441,066 | |
| Enphase Energy, Inc. (a) | | | 1,109 | | | | 355,534 | |
| Extreme Networks, Inc. (a) | | | 17,112 | | | | 358,839 | |
| Hologic, Inc. (a) | | | 1,094 | | | | 83,319 | |
| Iridium Communications, Inc. (a) | | | 6,168 | | | | 327,521 | |
| Jabil, Inc. | | | 7,198 | | | | 519,624 | |
| Microchip Technology, Inc. | | | 4,236 | | | | 335,449 | |
| Rambus, Inc. (a) | | | 1,473 | | | | 56,534 | |
| Sanmina Corp. (a) | | | 4,490 | | | | 296,744 | |
| Sonos, Inc. (a) | | | 4,674 | | | | 81,934 | |
| Super Micro Computer, Inc. (a) | | | 1,321 | | | | 119,194 | |
| | | | | | | | 5,199,695 | |
| Construction of Buildings – 0.25% | | | | | | | | |
| NVR, Inc. (a) | | | 13 | | | | 60,307 | |
| | | | | | | | | |
| Couriers and Messengers – 0.77% | | | | | | | | |
| United Parcel Service, Inc. – Class B | | | 992 | | | | 188,212 | |
| | | | | | | | | |
| Credit Intermediation and Related Activities – 5.55% | | | | | | | | |
| Ameris Bancorp | | | 3,258 | | | | 172,283 | |
| Bank of America Corp. | | | 4,701 | | | | 177,933 | |
| BankUnited, Inc. | | | 4,318 | | | | 158,557 | |
| FNB Corp./PA | | | 11,890 | | | | 167,649 | |
| JPMorgan Chase & Co. | | | 1,382 | | | | 190,965 | |
| Popular, Inc. | | | 1,871 | | | | 136,620 | |
| Regions Financial Corp. | | | 7,156 | | | | 166,091 | |
| Wells Fargo & Co. | | | 3,869 | | | | 185,519 | |
| | | | | | | | 1,355,617 | |
| Educational Services – 0.61% | | | | | | | | |
| Grand Canyon Education, Inc. (a) | | | 1,326 | | | | 149,931 | |
| | | | | | | | | |
| Electrical Equipment, Appliance, and Component – 0.75% | | | | | | | | |
| Hubbell, Inc. | | | 717 | | | | 182,161 | |
| | | | | | | | | |
| Fabricated Metal Product Manufacturing – 1.33% | | | | | | | | |
| Mueller Industries, Inc. | | | 2,844 | | | | 195,582 | |
| Nucor Corp. | | | 856 | | | | 128,357 | |
| | | | | | | | 323,939 | |
| Food and Beverage Stores – 1.02% | | | | | | | | |
| Kroger Co. | | | 5,024 | | | | 247,130 | |
The accompanying notes are an integral part of these financial statements.
CONVERGENCE LONG/SHORT EQUITY ETF
| Schedule of Investments (Continued) |
November 30, 2022
| | | Shares | | | Value | |
| Food Manufacturing – 3.07% | | | | | | |
| Archer-Daniels-Midland Co. | | | 3,077 | | | $ | 300,008 | |
| General Mills, Inc. | | | 2,534 | | | | 216,150 | |
| TreeHouse Foods, Inc. (a) | | | 4,726 | | | | 233,606 | |
| | | | | | | | 749,764 | |
| Food Services and Drinking Places – 1.31% | | | | | | | | |
| Manhattan Associates, Inc. (a) | | | 2,527 | | | | 318,250 | |
| | | | | | | | | |
| General Merchandise Stores – 0.88% | | | | | | | | |
| Walmart, Inc. | | | 1,412 | | | | 215,217 | |
| | | | | | | | | |
| Health and Personal Care Stores – 1.38% | | | | | | | | |
| CVS Health Corp. | | | 1,944 | | | | 198,055 | |
| Ulta Beauty, Inc. (a) | | | 301 | | | | 139,917 | |
| | | | | | | | 337,972 | |
| Heavy and Civil Engineering Construction – 0.46% | | | | | | | | |
| Dycom Industries, Inc. (a) | | | 1,240 | | | | 113,014 | |
| | | | | | | | | |
| Insurance Carriers and Related Activities – 5.31% | | | | | | | | |
| American International Group, Inc. | | | 2,321 | | | | 146,478 | |
| Chubb Ltd. | | | 775 | | | | 170,182 | |
| Cigna Corp. | | | 830 | | | | 272,978 | |
| Jackson Financial, Inc. | | | 2,515 | | | | 93,936 | |
| MetLife, Inc. | | | 1,533 | | | | 117,581 | |
| RLI Corp. | | | 872 | | | | 113,421 | |
| UnitedHealth Group, Inc. | | | 371 | | | | 203,219 | |
| Unum Group | | | 4,214 | | | | 177,748 | |
| | | | | | | | 1,295,543 | |
| Machinery Manufacturing – 0.51% | | | | | | | | |
| Caterpillar, Inc. | | | 526 | | | | 124,352 | |
| | | | | | | | | |
| Merchant Wholesalers, Durable Goods – 0.62% | | | | | | | | |
| WW Grainger, Inc. | | | 250 | | | | 150,765 | |
| | | | | | | | | |
| Merchant Wholesalers, Nondurable Goods – 3.75% | | | | | | | | |
| AmerisourceBergen Corp. | | | 1,749 | | | | 298,536 | |
| Cardinal Health, Inc. | | | 3,463 | | | | 277,628 | |
| McKesson Corp. | | | 688 | | | | 262,596 | |
| Wingstop, Inc. | | | 427 | | | | 70,673 | |
| | | | | | | | 909,433 | |
| Mining (except Oil and Gas) – 2.01% | | | | | | | | |
| Alpha Metallurgical Resources, Inc. | | | 1,130 | | | | 193,490 | |
The accompanying notes are an integral part of these financial statements.
CONVERGENCE LONG/SHORT EQUITY ETF
| Schedule of Investments (Continued) |
November 30, 2022
| | | Shares | | | Value | |
| Mining (except Oil and Gas) – 2.01% (Continued) | | | | | | |
| APA Corp. | | | 6,356 | | | $ | 297,780 | |
| | | | | | | | 491,270 | |
| Miscellaneous Manufacturing – 1.44% | | | | | | | | |
| Johnson & Johnson | | | 1,491 | | | | 265,398 | |
| Shockwave Medical, Inc. (a) | | | 340 | | | | 86,224 | |
| | | | | | | | 351,622 | |
| Motor Vehicle and Parts Dealers – 2.50% | | | | | | | | |
| Group 1 Automotive, Inc. | | | 1,548 | | | | 299,290 | |
| Murphy USA, Inc. | | | 1,050 | | | | 310,601 | |
| | | | | | | | 609,891 | |
| Nonstore Retailers – 2.50% | | | | | | | | |
| Amazon.com, Inc. (a) | | | 2,984 | | | | 288,075 | |
| Box, Inc. (a) | | | 9,629 | | | | 264,316 | |
| Dillard’s, Inc. | | | 165 | | | | 59,351 | |
| | | | | | | | 611,742 | |
| Other Information Services – 1.09% | | | | | | | | |
| VeriSign, Inc. (a) | | | 1,330 | | | | 265,747 | |
| | | | | | | | | |
| Paper Manufacturing – 1.18% | | | | | | | | |
| Boise Cascade Co. | | | 2,555 | | | | 189,172 | |
| Sylvamo Corp. | | | 1,810 | | | | 97,903 | |
| | | | | | | | 287,075 | |
| Petroleum and Coal Products Manufacturing – 5.04% | | | | | | | | |
| Exxon Mobil Corp.(c) | | | 2,333 | | | | 259,756 | |
| Marathon Petroleum Corp. | | | 2,056 | | | | 250,441 | |
| PBF Energy, Inc.(c) | | | 7,990 | | | | 317,763 | |
| Phillips 66 | | | 987 | | | | 107,030 | |
| Valero Energy Corp. | | | 2,178 | | | | 291,024 | |
| | | | | | | | 1,226,014 | |
| Pipeline Transportation – 1.05% | | | | | | | | |
| Scorpio Tankers, Inc. | | | 4,996 | | | | 254,896 | |
| | | | | | | | | |
| Primary Metal Manufacturing – 1.41% | | | | | | | | |
| ATI, Inc. (a) | | | 2,423 | | | | 73,926 | |
| Commercial Metals Co. | | | 1,664 | | | | 81,902 | |
| Encore Wire Corp. | | | 1,274 | | | | 186,144 | |
| | | | | | | | 341,972 | |
| Professional, Scientific, and Technical Services – 5.26% | | | | | | | | |
| Accenture PLC | | | 788 | | | | 237,133 | |
The accompanying notes are an integral part of these financial statements.
CONVERGENCE LONG/SHORT EQUITY ETF
| Schedule of Investments (Continued) |
November 30, 2022
| | | Shares | | | Value | |
| Professional, Scientific, and Technical Services – 5.26% (Continued) | | | | | | |
| Booz Allen Hamilton Holding Corp. | | | 382 | | | $ | 40,645 | |
| DXC Technology Co. (a) | | | 8,992 | | | | 266,793 | |
| H&R Block, Inc. | | | 3,227 | | | | 141,052 | |
| Insperity, Inc. | | | 585 | | | | 69,352 | |
| Jack Henry & Associates, Inc. | | | 1,956 | | | | 370,368 | |
| Parsons Corp. (a) | | | 3,146 | | | | 155,727 | |
| | | | | | | | 1,281,070 | |
| Publishing Industries (Except Internet) – 5.50% | | | | | | | | |
| Cadence Design Systems, Inc. (a) | | | 2,590 | | | | 445,583 | |
| Dropbox, Inc. (a) | | | 11,019 | | | | 259,608 | |
| Electronic Arts, Inc. | | | 2,809 | | | | 367,361 | |
| Qualys, Inc. (a) | | | 2,170 | | | | 267,604 | |
| | | | | | | | 1,340,156 | |
| Real Estate – 1.05% | | | | | | | | |
| Jefferies Financial Group, Inc. | | | 6,725 | | | | 255,483 | |
| | | | | | | | | |
| Rental and Leasing Services – 0.49% | | | | | | | | |
| Ryder System, Inc. | | | 1,289 | | | | 120,509 | |
| | | | | | | | | |
| Securities, Commodity Contracts, and Other Financial | | | | | | | | |
| Investments and Related Activities – 5.16% | | | | | | | | |
| Cboe Global Markets, Inc. | | | 1,986 | | | | 251,904 | |
| LPL Financial Holdings, Inc.(c) | | | 1,205 | | | | 285,235 | |
| Raymond James Financial, Inc. | | | 2,167 | | | | 253,322 | |
| SLM Corp. | | | 12,717 | | | | 222,038 | |
| StoneX Group, Inc. (a) | | | 2,413 | | | | 244,847 | |
| | | | | | | | 1,257,346 | |
| Specialty Trade Contractors – 1.64% | | | | | | | | |
| Comfort Systems USA, Inc. | | | 1,051 | | | | 133,225 | |
| EMCOR Group, Inc. | | | 1,211 | | | | 187,583 | |
| Installed Building Products, Inc. | | | 931 | | | | 79,070 | |
| | | | | | | | 399,878 | |
| Transportation Equipment Manufacturing – 3.97% | | | | | | | | |
| General Dynamics Corp. | | | 692 | | | | 174,654 | |
| General Motors Co. | | | 6,558 | | | | 265,993 | |
| Lockheed Martin Corp. | | | 351 | | | | 170,302 | |
| Tesla, Inc. (a) | | | 1,372 | | | | 267,129 | |
| Visteon Corp. (a) | | | 620 | | | | 91,015 | |
| | | | | | | | 969,093 | |
| Utilities – 4.53% | | | | | | | | |
| First Solar, Inc. (a) | | | 2,361 | | | | 407,343 | |
| FirstEnergy Corp. | | | 4,195 | | | | 173,002 | |
The accompanying notes are an integral part of these financial statements.
CONVERGENCE LONG/SHORT EQUITY ETF
| Schedule of Investments (Continued) |
November 30, 2022
| | | Shares | | | Value | |
| Utilities – 4.53% (Continued) | | | | | | |
| NRG Energy, Inc. | | | 4,554 | | | $ | 193,316 | |
| ONE Gas, Inc. | | | 1,917 | | | | 166,683 | |
| UGI Corp. | | | 4,321 | | | | 167,007 | |
| | | | | | | | 1,107,351 | |
| Warehousing and Storage – 0.91% | | | | | | | | |
| Landstar System, Inc. | | | 1,273 | | | | 220,203 | |
| | | | | | | | | |
| Waste Management and Remediation Services – 0.59% | | | | | | | | |
| Clean Harbors, Inc. (a) | | | 1,185 | | | | 142,200 | |
| | | | | | | | | |
| Wood Product Manufacturing – 0.31% | | | | | | | | |
| Skyline Champion Corp. (a) | | | 1,442 | | | | 74,970 | |
| TOTAL COMMON STOCKS (Cost $25,500,249) | | | | | | | 28,930,696 | |
| | | | | | | | | |
| REAL ESTATE INVESTMENT TRUSTS* – 2.79% | | | | | | | | |
| | | | | | | | | |
| Real Estate – 2.33% | | | | | | | | |
| Apartment Income REIT Corp. | | | 2,886 | | | | 109,812 | |
| Apple Hospitality REIT, Inc. | | | 6,860 | | | | 117,032 | |
| Camden Property Trust | | | 980 | | | | 117,924 | |
| Equity Commonwealth | | | 4,105 | | | | 111,205 | |
| Equity Residential | | | 1,716 | | | | 111,300 | |
| | | | | | | | 567,273 | |
| Warehousing and Storage – 0.46% | | | | | | | | |
| Extra Space Storage, Inc. | | | 702 | | | | 112,804 | |
| TOTAL REAL ESTATE INVESTMENT TRUSTS (Cost $696,346) | | | | | | | 680,077 | |
| | | | | | | | | |
| MONEY MARKET FUNDS – 0.69% | | | | | | | | |
| | | | | | | | | |
| Funds, Trusts, and Other Financial Vehicles – 0.69% | | | | | | | | |
| First American Government Obligations Fund – X Class, 3.668% (b)(c) | | | 167,708 | | | | 167,708 | |
| TOTAL MONEY MARKET FUNDS (Cost $167,708) | | | | | | | 167,708 | |
| Total Investments (Cost $26,364,303) – 122.18% | | | | | | | 29,778,481 | |
| Liabilities in Excess of Other Assets – (22.18)% | | | | | | | (5,403,683 | ) |
| TOTAL NET ASSETS – 100.00% | | | | | | $ | 24,374,788 | |
Percentages are stated as a percent of net assets.
| PLC | Public Limited Company |
| * | Unless otherwise noted, all or a portion of these securities, totaling $27,023,010, are pledged as collateral for securities sold short. |
| (a) | Non-income producing security. |
| (b) | The rate shown represents the seven-day yield as of November 30, 2022. |
| (c) | This security is not pledged as collateral for securities sold short. |
The accompanying notes are an integral part of these financial statements.
CONVERGENCE LONG/SHORT EQUITY ETF
| Schedule of Securities Sold Short |
November 30, 2022
| | | Shares | | | Value | |
| COMMON STOCKS – (45.71)% | | | | | | |
| | | | | | | |
| Accommodation – (0.37)% | | | | | | |
| Caesars Entertainment, Inc. (a) | | | (861 | ) | | $ | (43,747 | ) |
| Las Vegas Sands Corp. (a) | | | (973 | ) | | | (45,575 | ) |
| | | | | | | | (89,322 | ) |
| Administrative and Support Services – (2.86)% | | | | | | | | |
| AdaptHealth Corp. (a) | | | (2,024 | ) | | | (45,155 | ) |
| Coinbase Global, Inc. (a) | | | (782 | ) | | | (35,761 | ) |
| DigitalBridge Group, Inc. | | | (1,817 | ) | | | (26,219 | ) |
| Equifax, Inc. | | | (101 | ) | | | (19,934 | ) |
| Fidelity National Information Services, Inc. | | | (2,790 | ) | | | (202,498 | ) |
| GXO Logistics, Inc. (a) | | | (954 | ) | | | (44,704 | ) |
| nCino, Inc. (a) | | | (4,143 | ) | | | (108,215 | ) |
| R1 RCM, Inc. (a) | | | (5,703 | ) | | | (51,612 | ) |
| ROBLOX Corp. (a) | | | (1,854 | ) | | | (58,902 | ) |
| Scotts Miracle-Gro Co. | | | (590 | ) | | | (32,999 | ) |
| SentinelOne, Inc. (a) | | | (3,368 | ) | | | (48,836 | ) |
| TransUnion | | | (340 | ) | | | (21,447 | ) |
| | | | | | | | (696,282 | ) |
| Air Transportation – (0.27)% | | | | | | | | |
| Delta Air Lines, Inc. (a) | | | (1,391 | ) | | | (49,199 | ) |
| Frontier Group Holdings, Inc. (a) | | | (1,322 | ) | | | (17,239 | ) |
| | | | | | | | (66,438 | ) |
| Ambulatory Health Care Services – (1.10)% | | | | | | | | |
| Guardant Health, Inc. (a) | | | (1,394 | ) | | | (72,962 | ) |
| LifeStance Health Group, Inc. (a) | | | (5,926 | ) | | | (30,163 | ) |
| Natera, Inc. (a) | | | (1,139 | ) | | | (46,836 | ) |
| Oak Street Health, Inc. (a) | | | (3,292 | ) | | | (71,173 | ) |
| Teladoc Health, Inc. (a) | | | (1,776 | ) | | | (50,634 | ) |
| | | | | | | | (271,768 | ) |
| Amusement, Gambling, and Recreation Industries – (0.13)% | | | | | | | | |
| Wynn Resorts Ltd. (a) | | | (393 | ) | | | (32,878 | ) |
| | | | | | | | | |
| Apparel Manufacturing – (0.09)% | | | | | | | | |
| VF Corp. | | | (672 | ) | | | (22,055 | ) |
| | | | | | | | | |
| Beverage and Tobacco Product Manufacturing – (0.56)% | | | | | | | | |
| Celsius Holdings, Inc. (a) | | | (629 | ) | | | (70,033 | ) |
| MGP Ingredients, Inc. | | | (534 | ) | | | (66,782 | ) |
| | | | | | | | (136,815 | ) |
The accompanying notes are an integral part of these financial statements.
CONVERGENCE LONG/SHORT EQUITY ETF
| Schedule of Securities Sold Short (Continued) |
November 30, 2022
| | | Shares | | | Value | |
| Broadcasting (except Internet) – (1.24)% | | | | | | |
| Cable One, Inc. | | | (57 | ) | | $ | (41,285 | ) |
| Liberty Broadband Corp. (a) | | | (817 | ) | | | (74,233 | ) |
| Roku, Inc. (a) | | | (1,214 | ) | | | (72,075 | ) |
| Warner Bros Discovery, Inc. (a) | | | (10,097 | ) | | | (115,106 | ) |
| | | | | | | | (302,699 | ) |
| Chemical Manufacturing – (4.83)% | | | | | | | | |
| 10X Genomics, Inc. (a) | | | (1,705 | ) | | | (65,915 | ) |
| Blueprint Medicines Corp. (a) | | | (1,343 | ) | | | (64,182 | ) |
| Bridgebio Pharma, Inc. (a) | | | (2,173 | ) | | | (20,361 | ) |
| Element Solutions, Inc. | | | (1,523 | ) | | | (29,790 | ) |
| Fate Therapeutics, Inc. (a) | | | (2,240 | ) | | | (46,637 | ) |
| Green Plains, Inc. (a) | | | (1,678 | ) | | | (57,992 | ) |
| Intellia Therapeutics, Inc. (a) | | | (1,548 | ) | | | (79,660 | ) |
| Inter Parfums, Inc. | | | (598 | ) | | | (56,983 | ) |
| Krystal Biotech, Inc. (a) | | | (1,176 | ) | | | (91,422 | ) |
| Mirati Therapeutics, Inc. (a) | | | (1,408 | ) | | | (128,663 | ) |
| Moderna, Inc. (a) | | | (559 | ) | | | (98,334 | ) |
| Novavax, Inc. (a) | | | (2,129 | ) | | | (35,107 | ) |
| Olaplex Holdings, Inc. (a) | | | (7,051 | ) | | | (42,095 | ) |
| Pfizer, Inc. | | | (3,777 | ) | | | (189,341 | ) |
| QuidelOrtho Corp. (a) | | | (873 | ) | | | (76,484 | ) |
| SiteOne Landscape Supply, Inc. (a) | | | (243 | ) | | | (30,504 | ) |
| SpringWorks Therapeutics, Inc. (a) | | | (1,424 | ) | | | (34,432 | ) |
| Twist Bioscience Corp. (a) | | | (1,078 | ) | | | (29,483 | ) |
| | | | | | | | (1,177,385 | ) |
| Clothing and Clothing Accessories Stores – (0.63)% | | | | | | | | |
| Five Below, Inc. (a) | | | (532 | ) | | | (85,578 | ) |
| KKR & Co., Inc. | | | (1,297 | ) | | | (67,340 | ) |
| | | | | | | | (152,918 | ) |
| Computer and Electronic Product Manufacturing – (3.53)% | | | | | | | | |
| Ambarella, Inc. (a) | | | (1,454 | ) | | | (107,887 | ) |
| Power Integrations, Inc. | | | (1,088 | ) | | | (87,562 | ) |
| SiTime Corp. (a) | | | (855 | ) | | | (90,168 | ) |
| Universal Display Corp. | | | (741 | ) | | | (83,451 | ) |
| Vertiv Holdings Co. | | | (3,615 | ) | | | (50,068 | ) |
| Viasat, Inc. (a) | | | (3,849 | ) | | | (131,212 | ) |
| Vicor Corp. (a) | | | (582 | ) | | | (31,422 | ) |
| Western Digital Corp. (a) | | | (3,485 | ) | | | (128,074 | ) |
| Zebra Technologies Corp. (a) | | | (549 | ) | | | (148,384 | ) |
| | | | | | | | (858,228 | ) |
The accompanying notes are an integral part of these financial statements.
CONVERGENCE LONG/SHORT EQUITY ETF
| Schedule of Securities Sold Short (Continued) |
November 30, 2022
| | | Shares | | | Value | |
| Construction of Buildings – (0.16)% | | | | | | |
| LGI Homes, Inc. (a) | | | (398 | ) | | $ | (39,537 | ) |
| | | | | | | | | |
| Credit Intermediation and Related Activities – (2.58)% | | | | | | | | |
| Affirm Holdings, Inc. (a) | | | (3,983 | ) | | | (55,443 | ) |
| Ally Financial, Inc. | | | (1,642 | ) | | | (44,350 | ) |
| Bank of Hawaii Corp. | | | (470 | ) | | | (37,915 | ) |
| Citigroup, Inc. | | | (1,714 | ) | | | (82,975 | ) |
| First Republic Bank/CA | | | (329 | ) | | | (41,984 | ) |
| Flywire Corp. (a) | | | (3,586 | ) | | | (77,780 | ) |
| PacWest Bancorp | | | (2,551 | ) | | | (66,632 | ) |
| Signature Bank/New York NY | | | (287 | ) | | | (40,037 | ) |
| Silvergate Capital Corp. (a) | | | (457 | ) | | | (12,536 | ) |
| SVB Financial Group (a) | | | (303 | ) | | | (70,229 | ) |
| TFS Financial Corp. | | | (2,777 | ) | | | (37,906 | ) |
| Western Alliance Bancorp | | | (902 | ) | | | (61,823 | ) |
| | | | | | | | (629,610 | ) |
| Data Processing, Hosting, and Related Services – (0.56)% | | | | | | | | |
| Marqeta, Inc. (a) | | | (10,722 | ) | | | (71,730 | ) |
| Shutterstock, Inc. | | | (899 | ) | | | (48,384 | ) |
| Upwork, Inc. (a) | | | (1,395 | ) | | | (17,089 | ) |
| | | | | | | | (137,203 | ) |
| Electrical Equipment, Appliance, and Component – (0.92)% | | | | | | | | |
| Fluence Energy, Inc. (a) | | | (1,808 | ) | | | (31,061 | ) |
| Generac Holdings, Inc. (a) | | | (182 | ) | | | (19,205 | ) |
| Littelfuse, Inc. | | | (583 | ) | | | (143,710 | ) |
| Plug Power, Inc. (a) | | | (1,815 | ) | | | (28,967 | ) |
| | | | | | | | (222,943 | ) |
| Electronics and Appliance Stores – (0.31)% | | | | | | | | |
| UiPath, Inc. (a) | | | (6,134 | ) | | | (76,491 | ) |
| | | | | | | | | |
| Fabricated Metal Product Manufacturing – (0.20)% | | | | | | | | |
| Stanley Black & Decker, Inc. | | | (611 | ) | | | (49,931 | ) |
| | | | | | | | | |
| Food and Beverage Stores – (0.25)% | | | | | | | | |
| Grocery Outlet Holding Corp. (a) | | | (1,983 | ) | | | (60,025 | ) |
| | | | | | | | | |
| Food Manufacturing – (1.26)% | | | | | | | | |
| Bunge Ltd. | | | (641 | ) | | | (67,202 | ) |
| Freshpet, Inc. (a) | | | (1,172 | ) | | | (78,547 | ) |
| Ingredion, Inc. | | | (254 | ) | | | (24,884 | ) |
The accompanying notes are an integral part of these financial statements.
CONVERGENCE LONG/SHORT EQUITY ETF
| Schedule of Securities Sold Short (Continued) |
November 30, 2022
| | | Shares | | | Value | |
| Food Manufacturing – (1.26)% (Continued) | | | | | | |
| J & J Snack Foods Corp. | | | (431 | ) | | $ | (70,693 | ) |
| McCormick & Co., Inc./MD | | | (767 | ) | | | (65,333 | ) |
| | | | | | | | (306,659 | ) |
| Food Services and Drinking Places – (0.42)% | | | | | | | | |
| Casey’s General Stores, Inc. | | | (302 | ) | | | (73,392 | ) |
| Shake Shack, Inc. (a) | | | (550 | ) | | | (28,930 | ) |
| | | | | | | | (102,322 | ) |
| Furniture and Home Furnishings Stores – (0.73)% | | | | | | | | |
| Floor & Decor Holdings, Inc. (a) | | | (1,052 | ) | | | (78,511 | ) |
| MillerKnoll, Inc. | | | (933 | ) | | | (19,024 | ) |
| RH (a) | | | (282 | ) | | | (80,886 | ) |
| | | | | | | | (178,421 | ) |
| General Merchandise Stores – (0.38)% | | | | | | | | |
| Burlington Stores, Inc. (a) | | | (473 | ) | | | (92,557 | ) |
| | | | | | | | | |
| Heavy and Civil Engineering Construction – (0.12)% | | | | | | | | |
| St Joe Co. | | | (776 | ) | | | (29,822 | ) |
| | | | | | | | | |
| Insurance Carriers and Related Activities – (0.79)% | | | | | | | | |
| Assured Guaranty Ltd. | | | (913 | ) | | | (60,778 | ) |
| RenaissanceRe Holdings Ltd. | | | (200 | ) | | | (37,782 | ) |
| Ryan Specialty Holdings, Inc. (a) | | | (709 | ) | | | (28,559 | ) |
| Voya Financial, Inc. | | | (524 | ) | | | (34,574 | ) |
| White Mountains Insurance Group Ltd. | | | (22 | ) | | | (29,895 | ) |
| | | | | | | | (191,588 | ) |
| Leather and Allied Product Manufacturing – (0.05)% | | | | | | | | |
| Crocs, Inc. (a) | | | (130 | ) | | | (13,130 | ) |
| | | | | | | | | |
| Machinery Manufacturing – (0.94)% | | | | | | | | |
| AAON, Inc. | | | (589 | ) | | | (46,684 | ) |
| Coherent Corp. (a) | | | (3,642 | ) | | | (133,552 | ) |
| Xometry, Inc. (a) | | | (1,151 | ) | | | (48,607 | ) |
| | | | | | | | (228,843 | ) |
| Management of Companies and Enterprises – (0.78)% | | | | | | | | |
| AZEK Co., Inc. (a) | | | (1,762 | ) | | | (34,077 | ) |
| Enstar Group Ltd. (a) | | | (212 | ) | | | (46,214 | ) |
| Rivian Automotive, Inc. (a) | | | (2,057 | ) | | | (65,906 | ) |
| Stock Yards Bancorp, Inc. | | | (584 | ) | | | (43,228 | ) |
| | | | | | | | (189,425 | ) |
The accompanying notes are an integral part of these financial statements.
CONVERGENCE LONG/SHORT EQUITY ETF
| Schedule of Securities Sold Short (Continued) |
November 30, 2022
| | | Shares | | | Value | |
| Merchant Wholesalers, Durable Goods – (0.20)% | | | | | | |
| XPEL, Inc. (a) | | | (717 | ) | | $ | (49,150 | ) |
| | | | | | | | | |
| Merchant Wholesalers, Nondurable Goods – (0.61)% | | | | | | | | |
| Arrowhead Pharmaceuticals, Inc. (a) | | | (3,005 | ) | | | (96,761 | ) |
| Relay Therapeutics, Inc. (a) | | | (2,745 | ) | | | (51,002 | ) |
| | | | | | | | (147,763 | ) |
| Mining (except Oil and Gas) – (1.91)% | | | | | | | | |
| CNX Resources Corp. (a) | | | (3,202 | ) | | | (55,619 | ) |
| Coterra Energy, Inc. | | | (4,786 | ) | | | (133,577 | ) |
| Freeport-McMoRan, Inc. | | | (2,054 | ) | | | (81,749 | ) |
| Hecla Mining Co. | | | (5,996 | ) | | | (32,678 | ) |
| Martin Marietta Materials, Inc. | | | (91 | ) | | | (33,350 | ) |
| Novagold Resources, Inc. (a) | | | (6,270 | ) | | | (36,178 | ) |
| Royal Gold, Inc. | | | (284 | ) | | | (31,902 | ) |
| Southwestern Energy Co. (a) | | | (8,392 | ) | | | (58,073 | ) |
| | | | | | | | (463,126 | ) |
| Miscellaneous Manufacturing – (1.30)% | | | | | | | | |
| ICU Medical, Inc. (a) | | | (360 | ) | | | (57,323 | ) |
| Inari Medical, Inc. (a) | | | (721 | ) | | | (53,051 | ) |
| Neogen Corp. (a) | | | (3,632 | ) | | | (60,146 | ) |
| Peloton Interactive, Inc. (a) | | | (2,242 | ) | | | (25,514 | ) |
| PROCEPT BioRobotics Corp. (a) | | | (1,230 | ) | | | (52,767 | ) |
| Tandem Diabetes Care, Inc. (a) | | | (874 | ) | | | (36,752 | ) |
| YETI Holdings, Inc. (a) | | | (605 | ) | | | (27,158 | ) |
| | | | | | | | (312,711 | ) |
| Motor Vehicle and Parts Dealers – (0.53)% | | | | | | | | |
| Carvana Co. (a) | | | (3,662 | ) | | | (28,234 | ) |
| Lithia Motors, Inc. | | | (417 | ) | | | (99,792 | ) |
| | | | | | | | (128,026 | ) |
| Nonstore Retailers – (0.59)% | | | | | | | | |
| DoorDash, Inc. (a) | | | (1,559 | ) | | | (90,812 | ) |
| Wayfair, Inc. (a) | | | (1,485 | ) | | | (54,410 | ) |
| | | | | | | | (145,222 | ) |
| Performing Arts, Spectator Sports, and – (0.13)% | | | | | | | | |
| Madison Square Garden Entertainment Corp. (a) | | | (654 | ) | | | (31,471 | ) |
| | | | | | | | | |
| Personal and Laundry Services – (0.28)% | | | | | | | | |
| IAC, Inc. (a) | | | (1,323 | ) | | | (68,650 | ) |
The accompanying notes are an integral part of these financial statements.
CONVERGENCE LONG/SHORT EQUITY ETF
| Schedule of Securities Sold Short (Continued) |
November 30, 2022
| | | Shares | | | Value | |
| Petroleum and Coal Products Manufacturing – (0.43)% | | | | | | |
| EQT Corp. | | | (1,585 | ) | | $ | (67,220 | ) |
| Quaker Chemical Corp. | | | (188 | ) | | | (36,997 | ) |
| | | | | | | | (104,217 | ) |
| Pipeline Transportation – (0.14)% | | | | | | | | |
| Equitrans Midstream Corp. | | | (4,019 | ) | | | (33,719 | ) |
| | | | | | | | | |
| Plastics and Rubber Products Manufacturing – (0.35)% | | | | | | | | |
| Entegris, Inc. | | | (1,119 | ) | | | (86,488 | ) |
| | | | | | | | | |
| Professional, Scientific, and Technical Services – (2.43)% | | | | | | | | |
| AppLovin Corp. (a) | | | (4,536 | ) | | | (65,364 | ) |
| Bumble, Inc. (a) | | | (2,811 | ) | | | (68,476 | ) |
| Cognizant Technology Solutions Corp. – Class A | | | (2,410 | ) | | | (149,926 | ) |
| Coursera, Inc. (a) | | | (2,780 | ) | | | (38,753 | ) |
| Digital Turbine, Inc. (a) | | | (3,235 | ) | | | (59,071 | ) |
| Match Group, Inc. (a) | | | (1,206 | ) | | | (60,975 | ) |
| Trade Desk, Inc. (a) | | | (785 | ) | | | (40,930 | ) |
| Unity Software, Inc. (a) | | | (2,699 | ) | | | (106,638 | ) |
| | | | | | | | (590,133 | ) |
| Publishing Industries (Except Internet) – (1.56)% | | | | | | | | |
| BigCommerce Holdings, Inc. (a) | | | (2,481 | ) | | | (21,436 | ) |
| Bill.com Holdings, Inc. (a) | | | (589 | ) | | | (70,927 | ) |
| Clear Secure, Inc. | | | (1,852 | ) | | | (57,560 | ) |
| Confluent, Inc. (a) | | | (3,019 | ) | | | (69,528 | ) |
| Okta, Inc. (a) | | | (1,336 | ) | | | (71,236 | ) |
| Toast, Inc. (a) | | | (2,675 | ) | | | (49,113 | ) |
| ZoomInfo Technologies, Inc. (a) | | | (1,354 | ) | | | (38,724 | ) |
| | | | | | | | (378,524 | ) |
| Real Estate – (0.86)% | | | | | | | | |
| CBRE Group, Inc. (a) | | | (499 | ) | | | (39,721 | ) |
| Howard Hughes Corp. (a) | | | (434 | ) | | | (32,350 | ) |
| MP Materials Corp. (a) | | | (959 | ) | | | (31,887 | ) |
| Walker & Dunlop, Inc. | | | (478 | ) | | | (42,690 | ) |
| Zillow Group, Inc. – Class A (a) | | | (755 | ) | | | (28,237 | ) |
| Zillow Group, Inc. – Class C (a) | | | (953 | ) | | | (36,195 | ) |
| | | | | | | | (211,080 | ) |
| Rental and Leasing Services – (0.10)% | | | | | | | | |
| Hertz Global Holdings, Inc. (a) | | | (1,390 | ) | | | (23,908 | ) |
The accompanying notes are an integral part of these financial statements.
CONVERGENCE LONG/SHORT EQUITY ETF
| Schedule of Securities Sold Short (Continued) |
November 30, 2022
| | | Shares | | | Value | |
| Securities, Commodity Contracts, and Other | | | | | | |
| Financial Investments and Related Activities – (3.40)% | | | | | | |
| Ares Management Corp. | | | (838 | ) | | $ | (65,691 | ) |
| Beauty Health Co. (a) | | | (3,614 | ) | | | (38,851 | ) |
| Blackstone, Inc. | | | (664 | ) | | | (60,776 | ) |
| Brighthouse Financial, Inc. (a) | | | (1,455 | ) | | | (81,102 | ) |
| Carlyle Group, Inc. | | | (1,885 | ) | | | (58,755 | ) |
| ChargePoint Holdings, Inc. (a) | | | (2,586 | ) | | | (32,118 | ) |
| Clarivate PLC (a) | | | (2,209 | ) | | | (21,626 | ) |
| DraftKings, Inc. (a) | | | (1,927 | ) | | | (29,522 | ) |
| E2open Parent Holdings, Inc. (a) | | | (12,351 | ) | | | (72,747 | ) |
| Enovix Corp. (a) | | | (1,975 | ) | | | (25,774 | ) |
| Joby Aviation, Inc. (a) | | | (6,873 | ) | | | (28,317 | ) |
| Morningstar, Inc. | | | (257 | ) | | | (62,998 | ) |
| Robinhood Markets, Inc. (a) | | | (5,124 | ) | | | (49,139 | ) |
| Rocket Lab USA, Inc. (a) | | | (8,010 | ) | | | (33,562 | ) |
| S&P Global, Inc. | | | (181 | ) | | | (63,857 | ) |
| SoFi Technologies, Inc. (a) | | | (7,145 | ) | | | (34,510 | ) |
| Stem, Inc. (a) | | | (2,643 | ) | | | (34,544 | ) |
| Trupanion, Inc. (a) | | | (663 | ) | | | (34,655 | ) |
| | | | | | | | (828,544 | ) |
| Specialty Trade Contractors – (0.35)% | | | | | | | | |
| Ameresco, Inc. (a) | | | (522 | ) | | | (34,201 | ) |
| Sunrun, Inc. (a) | | | (1,567 | ) | | | (51,053 | ) |
| | | | | | | | (85,254 | ) |
| Support Activities for Mining – (0.76)% | | | | | | | | |
| Civitas Resources, Inc. | | | (871 | ) | | | (58,671 | ) |
| Northern Oil and Gas, Inc. | | | (1,649 | ) | | | (60,007 | ) |
| SSR Mining, Inc. | | | (1,980 | ) | | | (30,017 | ) |
| Targa Resources Corp. | | | (487 | ) | | | (36,228 | ) |
| | | | | | | | (184,923 | ) |
| Telecommunications – (1.32)% | | | | | | | | |
| Bandwidth, Inc. (a) | | | (572 | ) | | | (13,076 | ) |
| Doximity, Inc. (a) | | | (1,405 | ) | | | (47,756 | ) |
| Frontier Communications Parent, Inc. (a) | | | (3,414 | ) | | | (87,979 | ) |
| Integer Holdings Corp. (a) | | | (439 | ) | | | (32,627 | ) |
| Twilio, Inc. (a) | | | (1,062 | ) | | | (52,059 | ) |
| Zoom Video Communications, Inc. (a) | | | (1,186 | ) | | | (89,460 | ) |
| | | | | | | | (322,957 | ) |
| Transit and Ground Passenger Transportation – (0.12)% | | | | | | | | |
| Lyft, Inc. (a) | | | (2,617 | ) | | | (29,363 | ) |
The accompanying notes are an integral part of these financial statements.
CONVERGENCE LONG/SHORT EQUITY ETF
| Schedule of Securities Sold Short (Continued) |
November 30, 2022
| | | Shares | | | Value | |
| Transportation Equipment Manufacturing – (0.39)% | | | | | | |
| Boeing Co. (a) | | | (279 | ) | | $ | (49,908 | ) |
| Luminar Technologies, Inc. (a) | | | (6,167 | ) | | | (47,239 | ) |
| | | | | | | | (97,147 | ) |
| Utilities – (1.69)% | | | | | | | | |
| ALLETE, Inc. | | | (481 | ) | | | (31,842 | ) |
| American States Water Co. | | | (300 | ) | | | (29,397 | ) |
| Atmos Energy Corp. | | | (615 | ) | | | (73,923 | ) |
| MGE Energy, Inc. | | | (435 | ) | | | (31,324 | ) |
| New Fortress Energy, Inc. | | | (1,124 | ) | | | (57,212 | ) |
| PG&E Corp. (a) | | | (5,446 | ) | | | (85,502 | ) |
| Public Service Enterprise Group, Inc. | | | (914 | ) | | | (55,343 | ) |
| Sunnova Energy International, Inc. (a) | | | (2,117 | ) | | | (48,331 | ) |
| | | | | | | | (412,874 | ) |
| Wood Product Manufacturing – (0.20)% | | | | | | | | |
| Enviva, Inc. | | | (859 | ) | | | (48,748 | ) |
| TOTAL COMMON STOCKS (Proceeds $13,599,008) | | | | | | | (11,139,293 | ) |
| | | | | | | | | |
| REAL ESTATE INVESTMENT TRUSTS – (1.32)% | | | | | | | | |
| | | | | | | | | |
| Accommodation – (0.11)% | | | | | | | | |
| Sunstone Hotel Investors, Inc. | | | (2,410 | ) | | | (26,486 | ) |
| | | | | | | | | |
| Real Estate – (1.05)% | | | | | | | | |
| AGNC Investment Corp. | | | (4,805 | ) | | | (48,002 | ) |
| Annaly Capital Management, Inc. | | | (2,293 | ) | | | (49,689 | ) |
| Host Hotels & Resorts, Inc. | | | (1,721 | ) | | | (32,596 | ) |
| Independence Realty Trust, Inc. | | | (1,493 | ) | | | (27,053 | ) |
| Kite Realty Group Trust | | | (1,625 | ) | | | (37,050 | ) |
| Pebblebrook Hotel Trust | | | (1,831 | ) | | | (30,486 | ) |
| Ryman Hospitality Properties, Inc. | | | (357 | ) | | | (32,676 | ) |
| | | | | | | | (257,552 | ) |
| Wood Product Manufacturing – (0.16)% | | | | | | | | |
| Weyerhaeuser Co. | | | (1,160 | ) | | | (37,944 | ) |
| TOTAL REAL ESTATE INVESTMENT TRUSTS (Proceeds $334,368) | | | | | | | (321,982 | ) |
| TOTAL SECURITIES SOLD SHORT | | | | | | | | |
| (Proceeds $13,933,376) – (47.03)% | | | | | | $ | (11,461,275 | ) |
Percentages are stated as a percent of net assets.
| PLC | Public Limited Company |
| S&P | Standards & Poor’s |
| (a) | Non-income producing security. |
The accompanying notes are an integral part of these financial statements.
CONVERGENCE LONG/SHORT EQUITY ETF
| Statement of Assets and Liabilities |
November 30, 2022
| Assets | | | |
| Investments, at value (cost $26,364,303) | | $ | 29,778,481 | |
| Deposit for short sales at broker | | | 6,034,681 | |
| Dividends and interest receivable | | | 47,511 | |
| Total Assets | | | 35,860,673 | |
| | | | | |
| Liabilities | | | | |
| Securities sold short, at value (proceeds $13,933,376) | | | 11,461,275 | |
| Dividends payable on short positions | | | 6,833 | |
| Payable to Adviser | | | 17,777 | |
| Total Liabilities | | | 11,485,885 | |
| Net Assets | | $ | 24,374,788 | |
| | | | | |
| Net Assets Consist Of: | | | | |
| Paid-in capital | | | 19,691,916 | |
| Total distributable earnings | | | 4,682,872 | |
| Net Assets | | $ | 24,374,788 | |
| | | | | |
| Shares of beneficial interest outstanding (unlimited | | | | |
| number of shares authorized, $0.001 par value) | | | 1,577,329 | |
| Net asset value, redemption price and offering price per share | | $ | 15.45 | |
The accompanying notes are an integral part of these financial statements.
CONVERGENCE LONG/SHORT EQUITY ETF
For the Year Ended November 30, 2022(a)
| Investment Income | | | |
| Dividend income | | $ | 452,349 | |
| Interest Income | | | 8,961 | |
| Total Investment Income | | | 461,310 | |
| | | | | |
| Expenses | | | | |
| Management fees | | | 241,647 | |
| Dividend expense | | | 72,853 | |
| Administration fees | | | 30,532 | |
| Federal and state registration fees | | | 22,964 | |
| Legal fees | | | 6,425 | |
| Trustees’ fees | | | 6,224 | |
| Chief Compliance Officer fees | | | 3,998 | |
| Transfer agent fees and expenses | | | 3,488 | |
| Insurance fees | | | 2,748 | |
| Reports to shareholders | | | 1,767 | |
| Fund accounting fees | | | 1,501 | |
| Interest and broker expenses | | | 657 | |
| Custody fees | | | 528 | |
| Other expenses | | | 680 | |
| Total Expenses | | | 396,012 | |
| Expense reimbursement due from Adviser (Note 4) | | | (50,044 | ) |
| Net Expenses | | | 345,968 | |
| Net Investment Income | | | 115,342 | |
| | | | | |
| Realized and Unrealized Gain (Loss) on Investments | | | | |
| Net realized gain (loss) from: | | | | |
| Investments | | | (3,695,829 | ) |
| Short transactions | | | 2,398,166 | |
| In-kind redemptions | | | 4,375,199 | |
| Change in net unrealized appreciation/depreciation on: | | | | |
| Investments | | | (3,199,363 | ) |
| Short transactions | | | 757,203 | |
| Realized and Unrealized Gain on Investments | | | 635,376 | |
| Net Increase in Net Assets from Operations | | $ | 750,718 | |
(a) | The Fund converted from a mutual fund to an ETF pursuant to an Agreement and Plan of Reorganization on February 18, 2022. See Note 1 in the Notes to Financial Statements for additional information about the Reorganization. |
The accompanying notes are an integral part of these financial statements.
CONVERGENCE LONG/SHORT EQUITY ETF
| Statements of Changes in Net Assets |
| | | Year Ended | | | Year Ended | |
| | | November 30, | | | November 30, | |
| | | 2022(a) | | | 2021 | |
| From Operations | | | | | | |
| Net investment income | | $ | 115,342 | | | $ | (50,567 | ) |
| Net realized gain (loss) from: | | | | | | | | |
| Investments | | | (3,695,829 | ) | | | 9,853,452 | |
| Short transactions | | | 2,398,166 | | | | (3,340,029 | ) |
| In-kind redemptions | | | 4,375,199 | | | | — | |
| Change in net unrealized appreciation/depreciation on: | | | | | | | | |
| Investments | | | (3,199,363 | ) | | | (1,146,890 | ) |
| Short transactions | | | 757,203 | | | | 1,511,174 | |
| Net increase in net assets from operations | | | 750,718 | | | | 6,827,140 | |
| | | | | | | | | |
| From Distributions | | | | | | | | |
| Net distributions | | | (4,719,159 | ) | | | (62,000 | ) |
| Net decrease in net assets resulting | | | | | | | | |
| from distributions paid | | | (4,719,159 | ) | | | (62,000 | ) |
| | | | | | | | | |
| From Capital Share Transactions | | | | | | | | |
| Proceeds from shares sold | | | 17,432,127 | | | | 12,942,673 | |
| Net asset value of shares issued in | | | | | | | | |
| reinvestment of distributions to shareholders | | | 4,325,163 | | | | 28,272 | |
| Payments for shares redeemed | | | (22,727,413 | ) | | | (12,959,595 | ) |
| Net increase (decrease) in net assets | | | | | | | | |
| from capital share transactions | | | (970,123 | ) | | | 11,350 | |
| | | | | | | | | |
| Total Increase (Decrease) In Net Assets | | | (4,938,564 | ) | | | 6,776,490 | |
| | | | | | | | | |
| Net Assets | | | | | | | | |
| Beginning of year | | | 29,313,352 | | | | 22,536,862 | |
| End of year | | $ | 24,374,788 | | | $ | 29,313,352 | |
(a) | The Fund converted from a mutual fund to an ETF pursuant to an Agreement and Plan of Reorganization on February 18, 2022. See Note 1 in the Notes to Financial Statements for additional information about the Reorganization. |
The accompanying notes are an integral part of these financial statements.
CONVERGENCE LONG/SHORT EQUITY ETF
For the Year Ended November 30, 2022(a)
| CASH FLOWS FROM OPERATING ACTIVITIES: | | | |
| Net increase in net assets resulting from operations | | $ | 750,718 | |
| Adjustments to reconcile net increase in net assets | | | | |
| from operations to net cash used in operating activities: | | | | |
| Purchases of investments | | | (86,725,690 | ) |
| Purchases of short-term investments, net | | | (96,659 | ) |
| Proceeds from sales of long-term investments | | | 87,956,761 | |
| Return of capital distributions received from underlying investments | | | 53,666 | |
| Increase in dividends and interest receivable | | | (1,393 | ) |
| Decrease in receivable for investment securities sold | | | 2,387,695 | |
| Decrease in other assets | | | 15,061 | |
| Proceeds from securities sold short | | | 30,224,648 | |
| Purchases to cover securities sold short | | | (25,418,470 | ) |
| Increase in payable for investment securities purchased | | | (2,550,385 | ) |
| Decrease in payable for fund shares redeemed | | | (6,824 | ) |
| Increase in dividends payable on short positions | | | 3,366 | |
| Decrease in payable to broker for interest expense | | | (1,929 | ) |
| Increase in payable to Adviser | | | 662 | |
| Decrease in accrued expenses and other liabilities | | | (86,410 | ) |
| Unrealized depreciation on investments | | | 3,199,363 | |
| Unrealized appreciation on short transactions | | | (757,203 | ) |
| Net realized gain on investments | | | (679,370 | ) |
| Net realized gain on short transactions | | | (2,398,166 | ) |
| Net cash provided by operating activities | | | 5,869,441 | |
| CASH FLOWS FROM FINANCING ACTIVITIES: | | | | |
| Proceeds from shares sold | | | 17,452,127 | |
| Payment on shares redeemed | | | (22,727,413 | ) |
| Cash distributions paid to shareholders | | | (393,996 | ) |
| Net cash used in financing activities | | | (5,669,282 | ) |
| Net change in cash | | | 200,159 | |
| Beginning balance | | | 5,834,522 | |
| Ending balance | | $ | 6,034,681 | |
| SUPPLEMENTAL DISCLOSURES: | | | | |
| Cash paid for interest | | | 6,125 | |
| Non-cash operating activities – purchases of investment securities in-kind | | | (15,161,175 | ) |
| Non-cash operating activities – sales of investment securities in-kind | | | 16,069,429 | |
| Non-cash operating activities – proceeds from shares sold in-kind | | | 15,161,175 | |
| Non-cash financing activities – payment on shares redeemed in-kind | | | (16,069,429 | ) |
| Non-cash financing activities – distributions reinvested | | | 4,325,163 | |
| Non-cash financing activities – decrease in receivable for Fund shares sold | | | 20,000 | |
| Non-cash financing activities – decrease in payable for Fund shares redeemed | | | 6,824 | |
| RESTRICTED AND UNRESTRICTED CASH: | | | | |
| Beginning Balances: | | | | |
| Cash | | | — | |
| Deposit with brokers short sale proceeds | | | 5,834,522 | |
| Ending Balances: | | | | |
| Cash | | | — | |
| Deposit with brokers short sale proceeds | | | 6,034,681 | |
(a) | The Fund converted from a mutual fund to an ETF pursuant to an Agreement and Plan of Reorganization on February 18, 2022. See Note 1 in the Notes to Financial Statements for additional information about the Reorganization. |
The accompanying notes are an integral part of these financial statements.
CONVERGENCE LONG/SHORT EQUITY ETF
Net Asset Value, Beginning of Year
Income from investment operations:
Net investment income (loss)(1)
Net realized and unrealized gain (loss) on investments
Total from Investment Operations
Less distributions paid:
From net investment income
From net realized gains
Total distributions paid
Net Asset Value, End of Year
Market Price, End of Year
Total Return on NAV(2)
Total Return on Market Price(4)
Supplemental Data and Ratios:
Net assets at end of year (000’s)
Ratio of expenses to average net assets:
Before waiver, expense reimbursement and recoupments(3)
After waiver, expense reimbursement and recoupments(3)
Ratio of net investment income (loss) to average net assets:
Before waiver, expense reimbursement and recoupments
After waiver, expense reimbursement and recoupments
Portfolio turnover rate
(1) | Per share net investment income was calculated using the daily average shares outstanding method. |
(2) | Total return on net asset value (NAV) represents the rate that the investor would have earned or lost on an investment in the Fund, assuming reinvestment of dividends. |
(3) | The ratio of expenses to average net assets includes dividends on short positions, interest and broker expenses. The annualized before waiver, expense reimbursement and recoupments and after waiver, expense reimbursement and recoupments ratios excluding dividends on short positions, interest and broker expenses were 1.28% and 1.08%, 1.95% and 1.50%, 1.69% and 1.50%, 1.32% and 1.32%, 1.27% and 1.27% for the years ended November 30, 2022, November 30, 2021, November 30, 2020, November 30, 2019, November 30, 2018, respectively. |
(4) | Total return on market price is calculated assuming an initial investment made at the market price on the first day of the period, reinvestment of dividends and distributions at market price during the period and redemption at market price on the last day of the period. |
(5) | Excludes the impact of in-kind transactions. |
(6) | The Fund converted from a mutual fund to an ETF pursuant to an Agreement and Plan of Reorganization on February 18, 2022. See Note 1 in the Notes to Financial Statements for additional information about the Reorganization. |
The accompanying notes are an integral part of these financial statements.
Per Share Data for a Share Outstanding Throughout Each Year
| Year Ended November 30, | |
2022(6) | | | 2021 | | | 2020 | | | 2019 | | | 2018 | |
| $ | 17.94 | | | $ | 14.03 | | | $ | 19.76 | | | $ | 19.83 | | | $ | 21.03 | |
| | | | | | | | | | | | | | | | | | | |
| | | | | | | | | | | | | | | | | | | |
| | 0.07 | | | | (0.03 | ) | | | 0.01 | | | | 0.14 | | | | 0.01 | |
| | 0.31 | | | | 3.98 | | | | (1.11 | ) | | | 0.65 | | | | 1.47 | |
| | 0.38 | | | | 3.95 | | | | (1.10 | ) | | | 0.79 | | | | 1.48 | |
| | | | | | | | | | | | | | | | | | | |
| | | | | | | | | | | | | | | | | | | |
| | — | | | | (0.04 | ) | | | (0.13 | ) | | | (0.07 | ) | | | (0.04 | ) |
| | (2.87 | ) | | | — | | | | (4.50 | ) | | | (0.79 | ) | | | (2.64 | ) |
| | (2.87 | ) | | | (0.04 | ) | | | (4.63 | ) | | | (0.86 | ) | | | (2.68 | ) |
| | | | | | | | | | | | | | | | | | | |
| $ | 15.45 | | | $ | 17.94 | | | $ | 14.03 | | | $ | 19.76 | | | $ | 19.83 | |
| $ | 15.43 | | | $ | — | | | $ | — | | | $ | — | | | $ | — | |
| | | | | | | | | | | | | | | | | | | |
| | 2.39 | % | | | 28.26 | % | | | -7.68 | % | | | 4.72 | % | | | 7.69 | % |
| | 2.20 | % | | | — | % | | | — | % | | | — | % | | | — | % |
| | | | | | | | | | | | | | | | | | | |
| | | | | | | | | | | | | | | | | | | |
| $ | 24,375 | | | $ | 29,313 | | | $ | 22,537 | | | $ | 67,741 | | | $ | 112,861 | |
| | | | | | | | | | | | | | | | | | | |
| | 1.58 | % | | | 2.56 | % | | | 2.58 | % | | | 2.18 | % | | | 2.20 | % |
| | 1.38 | % | | | 2.11 | % | | | 2.39 | % | | | 2.18 | % | | | 2.20 | % |
| | | | | | | | | | | | | | | | | | | |
| | 0.26 | % | | | (0.63 | )% | | | (0.13 | )% | | | 0.76 | % | | | 0.03 | % |
| | 0.46 | % | | | (0.18 | )% | | | 0.06 | % | | | 0.76 | % | | | 0.03 | % |
| | 244.44 | %(5) | | | 303.76 | % | | | 251.72 | % | | | 239.08 | % | | | 193.55 | % |
The accompanying notes are an integral part of these financial statements.
CONVERGENCE LONG/SHORT EQUITY ETF
Notes to Financial Statements
November 30, 2022
| (1) | Organization |
| | |
| | Trust for Professional Managers (the “Trust”) was organized as a Delaware statutory trust under a Declaration of Trust dated May 29, 2001. The Trust is registered under the Investment Company Act of 1940, as amended (the “1940 Act”), as an open-end management investment company. The Convergence Long/Short Equity ETF (the “Fund”) represents a distinct diversified series with its own investment objectives, and policies within the Trust. The investment objective of the Fund is to seek long-term capital growth. The Fund is an actively managed exchange-traded fund (“ETF”). The Trust may issue an unlimited number of shares of beneficial interest at $0.001 par value. |
| | |
| | Effective February 18, 2022, the Fund converted from a mutual fund to an ETF, pursuant to an Agreement and Plan of Reorganization. The reorganization was accomplished by a tax-free exchange of shares (with an exception for fractional mutual fund shares). The costs of the reorganization were borne by the Fund’s investment adviser Convergence Investment Partners, LLC (the “Adviser”). The reorganization did not result in a material change to the investment portfolio. The mutual fund offered Institutional Class shares and commenced operations on December 29, 2009. The following table illustrates the specifics of the reorganization of the mutual fund into the ETF: |
| | | Shares Issued | | | |
| | Convergence | to Shareholders | Convergence | | |
| | Long/Short | of Convergence | Long/Short | | |
| | Equity Fund | Long/Short | Equity ETF | Combined | Tax Status |
| | Net Assets* | Equity Fund | Net Assets | Net Assets | of Transfer |
| | $26,419,556 | 1,707,329 | $ — | $26,419,556 | Non-Taxable |
| | * | Includes accumulated net investment losses, accumulated realized gains and unrealized appreciation in the amounts of $(86,871), $2,453,571, and $8,049,316, respectively. |
| | The Fund is an investment company and accordingly follows the investment company accounting and reporting guidance of the Financial Accounting Standards Board (“FASB”) Accounting Standard Codification Topic 946 “Financial Services–Investment Companies.” |
| | |
| (2) | Significant Accounting Policies |
| | |
| | The following is a summary of significant accounting policies consistently followed by the Fund in the preparation of the financial statements. These policies are in conformity with generally accepted accounting principles in the United States of America (“GAAP”). |
| | |
| | (a) Investment Valuation |
| | |
| | Each security owned by the Fund, including long and short positions of common stock and real estate investment trusts, that is listed on a securities exchange, except those listed on the NASDAQ Stock Market LLC (“NASDAQ”), is valued at its last sale price on that exchange on the date as of which assets are valued. When the security is listed on more than one exchange, the Fund will use the price of the exchange that the Fund generally consider to be the principal exchange on which the stock is traded. |
CONVERGENCE LONG/SHORT EQUITY ETF
Notes to Financial Statements (Continued)
November 30, 2022
| | Fund securities listed on NASDAQ will be valued at the NASDAQ Official Closing Price, which may not necessarily represent the last sale price. If there has been no sale on such exchange or on NASDAQ on such day, the security shall be valued at, (i) the mean between the most recent quoted bid and asked prices at the close of the exchange on such day or (ii) the last sales price on the Composite Market for the day such security is being valued. “Composite Market” means a consolidation of the trade information provided by national securities and foreign exchanges and over-the-counter markets, as published by an approved independent pricing service (“Pricing Service”). |
| | |
| | Debt securities, including short-term debt instruments having a maturity of 60 days or less, are valued at the mean in accordance with prices supplied by a Pricing Service. Pricing Services may use various valuation methodologies such as the mean between the bid and the asked prices, matrix pricing and other analytical pricing models as well as market transactions and dealer quotations. If a price is not available from a Pricing Service, the most recent quotation obtained from one or more broker-dealers known to follow the issue will be obtained. Quotations will be valued at the mean between the bid and the offer. In the absence of available quotations, the securities will be priced at fair value, as described below. Any discount or premium is accreted or amortized using the constant yield method until maturity. |
| | |
| | Redeemable securities issued by open-end, registered investment companies are valued at the net asset value (“NAV”) of such companies for purchase and/or redemption orders placed on that day. If, on a particular day, a share of an investment company is not listed on NASDAQ, such security’s fair value will be determined as described below. Money market mutual funds are valued at cost. If cost does not represent current market value the securities will be priced at fair value. |
| | |
| | When market quotations are not readily available, any security or other asset is valued at its fair value in accordance with Rule 2a-5 of the 1940 Act as determined under the Adviser’s fair value pricing procedures, subject to oversight by the Trust’s Board of Trustees. These fair value procedures will also be used to price a security when corporate events, events in the securities market or world events cause the Adviser to believe that a security’s last sale price may not reflect its actual fair market value. The intended effect of using fair value pricing procedures is to ensure that the Fund is accurately priced. |
| | |
| | FASB Accounting Standards Codification, “Fair Value Measurements and Disclosures” Topic 820 (“ASC 820”), establishes an authoritative definition of fair value and sets out a hierarchy for measuring fair value. ASC 820 requires an entity to evaluate certain factors to determine whether there has been a significant decrease in volume and level of activity for the security such that recent transactions and quoted prices may not be determinative of fair value and further analysis and adjustment may be necessary to estimate fair value. ASC 820 also requires enhanced disclosures regarding the inputs and valuation techniques used to measure fair value in those instances as well as expanded disclosure of valuation levels for each class of investments. These inputs are summarized in the three broad levels listed below: |
| | Level 1— | Quoted prices in active markets for identical securities. |
CONVERGENCE LONG/SHORT EQUITY ETF
Notes to Financial Statements (Continued)
November 30, 2022
| | Level 2— | Other significant observable inputs (including quoted prices for similar securities, interest rates, prepayment speeds, credit risk, etc.). |
| | | |
| | Level 3— | Significant unobservable inputs (including a Fund’s own assumptions in determining the fair value of investments). |
| | The inputs or methodology used for valuing securities are not necessarily an indication of the risk associated with investing in those securities. The following is a summary of the inputs used to value the Fund’s investments carried at fair value as of November 30, 2022: |
| | | | Level 1 | | | Level 2 | | | Level 3 | | | Total | |
| | Assets(1): | | | | | | | | | | | | |
| | Common Stock | | $ | 28,930,696 | | | $ | — | | | $ | — | | | $ | 28,930,696 | |
| | Real Estate Investment Trusts | | | 680,077 | | | | — | | | | — | | | | 680,077 | |
| | Short-Term Investments | | | 167,708 | | | | — | | | | — | | | | 167,708 | |
| | Total Investments | | | 29,778,481 | | | | — | | | | — | | | | 29,778,481 | |
| | Total Assets | | $ | 29,778,481 | | | $ | — | | | $ | — | | | $ | 29,778,481 | |
| | | | | | | | | | | | | | | | | | |
| | Liabilities: | | | | | | | | | | | | | | | | |
| | Securities Sold Short | | | | | | | | | | | | | | | | |
| | Common Stocks | | $ | (11,139,293 | ) | | $ | — | | | $ | — | | | $ | (11,139,293 | ) |
| | Real Estate Investment Trusts | | | (321,982 | ) | | | — | | | | — | | | | (321,982 | ) |
| | Total Securities Sold Short | | | (11,461,275 | ) | | | — | | | | — | | | | (11,461,275 | ) |
| | Total Liabilities | | $ | (11,461,275 | ) | | $ | — | | | $ | — | | | $ | (11,461,275 | ) |
| | (1) See the Schedule of Investments for industry classifications. |
| | The Fund did not hold any Level 3 securities during the year ended November 30, 2022. |
| | |
| | Except for securities sold short, the Fund did not engage in any derivative securities or engage in hedging activities during the year ended November 30, 2022. |
| | |
| | (b) Short Positions |
| | |
| | The Fund may sell a security it does not own in anticipation of a decline in the fair value of that security. When the Fund sells a security short, it must borrow the security sold short and deliver it to the broker-dealer through which it made the short sale. A gain, limited to the price at which the Fund sold the security short, or a loss, unlimited in size, will be recognized upon the termination of a short sale. For financial statement purposes, an amount equal to the settlement amount is included in the Statement of Assets and Liabilities as a liability. The amount of the liability is subsequently marked-to-market to reflect the current value of the short positions. Subsequent fluctuations in the market prices of the securities sold, but not yet purchased, may require purchasing the securities at prices which could differ from the amount reflected in the Statement of Assets and Liabilities. The Fund is liable for any dividends or interest payable on securities while those securities are in a short position. Such amounts are recorded on the ex-dividend date as a dividend expense, and interest expense is accrued daily. As collateral for its short positions, the Fund is required under the 1940 Act to maintain |
CONVERGENCE LONG/SHORT EQUITY ETF
Notes to Financial Statements (Continued)
November 30, 2022
| | segregated assets consisting of cash, cash equivalents or liquid securities. The segregated assets are valued consistent with Note 2a above. The amount of segregated assets is required to be adjusted daily to the extent additional collateral is required based on the change in fair value of the securities sold short. The Fund’s securities sold short and deposits for short sales are held with one major securities broker-dealer. The Fund does not require this broker-dealer to maintain collateral in support of the receivable for proceeds on securities sold short. |
| | |
| | Rule 18f-4 imposes limits on the amount of derivatives a fund can enter into, eliminates the asset segregation framework currently used by funds to comply with Section 18 of the 1940 Act, treats derivatives as senior securities and requires funds whose use of derivatives is more than a limited specified exposure amount to establish and maintain a comprehensive derivatives risk management program and appoint a derivatives risk manager. Effective August 19, 2022, the Fund has adopted a Full Derivatives Fund Program and the Adviser has nominated a Derivatives Risk Manager. |
| | |
| | (c) Federal Income Taxes |
| | |
| | The Fund complies with the requirements of Subchapter M of the Internal Revenue Code, as amended, necessary to qualify as a regulated investment company and makes the requisite distributions of income and capital gains to their shareholders sufficient to relieve them from all or substantially all federal income taxes. Therefore, no federal income tax provision has been provided. |
| | |
| | As of and during the year ended November 30, 2022, the Fund did not have a liability for any unrecognized tax benefits. The Fund recognizes interest and penalties, if any, related to unrecognized tax benefits as income tax expense in the Statement of Operations. During the year ended November 30, 2022, the Fund did not incur any interest or penalties. The Fund is not subject to examination by U.S. taxing authorities for the tax periods prior to the year ended November 30, 2019. |
| | |
| | (d) Distributions to Shareholders |
| | |
| | The Fund will distribute any net investment income and any net capital gains at least annually. Distributions from net realized gains for book purposes may include short-term capital gains. All short-term capital gains are included in ordinary income for tax purposes. Distributions to shareholders are recorded on the ex-dividend date. The Fund may also pay a special distribution at the end of the calendar year to comply with federal tax requirements. |
| | |
| | (e) Use of Estimates |
| | |
| | The preparation of financial statements in conformity with GAAP requires management to make estimates and assumptions that affect the reported amounts of assets and liabilities and disclosure of contingent assets and liabilities at the date of the financial statements and the reported amounts of revenues and expenses during the reporting period. Actual results could differ from those estimates. |
CONVERGENCE LONG/SHORT EQUITY ETF
Notes to Financial Statements (Continued)
November 30, 2022
| | (f) Share Valuation |
| | |
| | The NAV per share of the Fund is calculated by dividing the sum of the fair value of the securities held by the Fund, plus cash or other assets, minus all liabilities (including estimated accrued expenses) by the total number of shares outstanding for the Fund, rounded to the nearest cent. The Fund’s shares will not be priced on the days on which the New York Stock Exchange is closed for trading. The Fund does not charge a redemption fee, and therefore the offering and redemption price per share are equal to the Fund’s NAV per share. |
| | |
| | (g) Allocation of Income, Expenses and Gains/Losses |
| | |
| | Expenses associated with a specific fund in the Trust are charged to that Fund. Common Trust expenses are typically allocated evenly between the funds of the Trust, or by other equitable means. |
| | |
| | (h) Other |
| | |
| | Investment transactions are recorded on the trade date. The Fund determines the gain or loss from investment transactions on the identified cost basis by comparing original cost of the security lot sold with the net sale proceeds. Dividend income and expense is recognized on the ex-dividend date and interest income and expense is recognized on an accrual basis. Dividend income from real estate investment trusts (“REITs”) is recognized on the ex-date and included in dividend income. The calendar year-end classification of distributions received from REITs during the fiscal year are reported subsequent to year end; accordingly, the Fund estimates the character of REIT distributions based on the most recent information available and adjusts for actual classifications in the calendar year the information is reported. |
| | |
| | Withholding taxes on foreign dividends, net of any reclaims, have been provided for in accordance with the Fund’s understanding of the applicable country’s tax rules and rates. |
| | |
| (3) | Federal Tax Matters |
| | |
| | The tax character of distributions paid by the Fund during the fiscal years ended November 30, 2022 and November 30, 2021 was as follows: |
| | | November 30, 2022 | November 30, 2021 |
| | Ordinary Income | $2,017,958 | $ 62,000 |
| | Long-Term Capital Gain | $2,701,201 | $ — |
| | The Fund designated as long-term capital gain dividend, pursuant to Internal Revenue Code Section 852(b)(3), the amount necessary to reduce the earnings and profits of the Fund related to net capital gain to zero for the tax year ended November 30, 2022. The Fund utilized earnings and profits distributed to shareholders on redemption of shares as part of the dividend paid deduction. The amounts designated as gain for the fiscal years ended November 30, 2022 and 2021 were as follows: |
| | | November 30, 2022 | November 30, 2021 |
| | Long-term | $ — | $1,489,805 |
CONVERGENCE LONG/SHORT EQUITY ETF
Notes to Financial Statements (Continued)
November 30, 2022
| | As of November 30, 2022, the components of distributable earnings on a tax basis were as follows: |
| | Cost basis of investments for federal income tax purposes(1) | | $ | 12,632,469 | |
| | Gross tax unrealized appreciation | | $ | 6,866,549 | |
| | Gross tax unrealized depreciation | | | (1,181,812 | ) |
| | Net tax unrealized appreciation | | | 5,684,737 | |
| | Undistributed ordinary income | | | 122,991 | |
| | Undistributed long-term capital gain | | | — | |
| | Total distributable earnings | | | 122,991 | |
| | Other accumulated losses | | | (1,124,856 | ) |
| | Total distributable earnings | | $ | 4,682,872 | |
| | (1) Includes securities sold short. |
| | The tax basis of distributable earnings for tax and financial reporting purposes differs principally due to the deferral of losses on wash sales. |
| | |
| | At November 30, 2022, the Fund had short-term capital loss carryovers of $1,074,293. |
| | |
| | Income and capital gains distributions may differ from GAAP, primarily due to timing differences in the recognition of income, gains and losses, and equalization by the Fund. To the extent that these differences are attributable to permanent book and tax accounting differences, the components of net assets have been adjusted. Additionally, GAAP requires that certain components of net assets relating to permanent differences be reclassified between financial and tax reporting. These reclassifications are due to redemptions in-kind and have no effect on net assets or NAV per share. For the year ended November 30, 2022, the following table shows the reclassifications made: |
| | Paid-in capital | | $ | 4,285,565 | |
| | Total distributable earnings | | $ | (4,285,565 | ) |
| (4) | Investment Adviser |
| | |
| | The Trust has an Investment Advisory Agreement (the “Agreement”) with the Adviser to furnish investment advisory services to the Fund. For the year ended November 30, 2022, under the terms of the Agreement, the Fund compensated the Adviser for its management services at the annual rate of 0.96% of the Fund’s average daily net assets. This represents a blended rate of 1.00% pre-Reorganization and 0.95% post-Reorganization. |
| | |
| | Prior to the Reorganization, the Adviser contractually agreed to waive its management fee and/or reimburse the Fund’s other expenses at least through the expiration date listed below, at the discretion of the Adviser and the Board of Trustees, to the extent necessary to ensure that the Fund’s operating expenses (exclusive of front-end or contingent deferred loads, Rule 12b-1 plan fees, shareholder servicing plan fees, taxes, leverage (i.e., any expenses incurred in connection with borrowings made by the Fund), interest (including interest incurred in connection with bank and custody overdrafts), |
CONVERGENCE LONG/SHORT EQUITY ETF
Notes to Financial Statements (Continued)
November 30, 2022
| | brokerage commissions and other transactional expenses, expenses incurred in connection with any merger or reorganization, dividends or interest on short positions, acquired fund fees and expenses or extraordinary expenses such as litigation) did not exceed 1.50% of the Fund’s average daily net assets (the “Expense Limitation Cap”). |
| | |
| | Pursuant to the Reorganization, any previously waived expenses are no longer subject to recoupment and have expired. |
| | |
| | After the Reorganization, under the terms of the Agreement, the Adviser has agreed to pay all expenses of the Fund except interest charges on any borrowings, dividends, and other expenses on securities sold short, taxes, brokerage commissions and other expenses incurred in placing orders for the purchase and sale of securities and other investments, acquired fund fees and expenses, accrued deferred tax liability, extraordinary expenses, distribution fees and expenses paid by the Fund under any distribution plan adopted pursuant to Rule 12b-1 under the 1940 Act (the “Excluded Expenses”), and the unitary management fee payable to the Adviser. |
| | |
| (5) | Related Party Transactions |
| | |
| | U.S. Bancorp Fund Services, LLC, doing business as U.S. Bank Global Fund Services (“Fund Services” or the “Administrator”), acts as the Fund’s administrator under an Administration Agreement. The Administrator prepares various federal and state regulatory filings, reports and returns for the Fund; prepares reports and materials to be supplied to the Trustees; monitors the activities of the Fund’s custodian, transfer agent and accountants; coordinates the preparation and payment of the Fund’s expenses and reviews the Fund’s expense accruals. Fund Services also serves as the fund accountant and transfer agent to the Fund. U.S. Bank National Association (“U.S. Bank”), an affiliate of Fund Services, serves as the Fund’s custodian. The Trust’s Chief Compliance Officer is also an employee of Fund Services. Fees incurred for the year ended November 30, 2022, and owed as of November 30, 2022 were as follows: |
| | | | Incurred | | | Owed | |
| | Fund Administration and Accounting | | $ | 30,532 | | | $ | — | |
| | Pricing | | $ | 1,501 | | | $ | — | |
| | Transfer Agency | | $ | 3,488 | | | $ | — | |
| | Custody | | $ | 528 | | | $ | — | |
| | Chief Compliance Officer | | $ | 3,998 | | | $ | — | |
| | The Adviser paid the above referenced expenses for any periods following the Reorganization due to the unitary fee structure adopted by the Fund in connection with the Reorganization. |
| | |
| | The Fund had a line of credit with U.S. Bank through February 18, 2022 (see Note 9). |
| | |
| | Quasar Distributors, LLC (“Quasar”), a wholly owned broker-dealer subsidiary of Foreside Financial Group, LLC, acts as the Fund’s principal underwriter in a continuous public offering of Fund shares. |
| | |
| | Certain officers of the Fund are also employees of Fund Services. A Trustee of the Trust is affiliated with Fund Services and U.S. Bank. |
CONVERGENCE LONG/SHORT EQUITY ETF
Notes to Financial Statements (Continued)
November 30, 2022
| (6) | Capital Share Transactions |
| | |
| | Transactions in the Fund were as follows: |
| | | | Year Ended | | | Year Ended | |
| | | | November 30, 2022 | | | November 30, 2021 | |
| | Shares sold | | | 1,135,206 | | | | 836,583 | |
| | Shares reinvested | | | 283,803 | | | | 1,964 | |
| | Shares redeemed | | | (1,475,356 | ) | | | (811,170 | ) |
| | Net increase (decrease) | | | (56,347 | ) | | | 27,377 | |
| (7) | Investment Transactions |
| | |
| | The aggregate purchases and sales of securities (excluding short-term investments and securities sold short), creations in-kind and redemptions in-kind for the Fund for the year ended November 30, 2022 is summarized below. There were no purchases or sales of U.S. government securities for the Fund. |
Purchases | Sales | Creations In-Kind | Redemptions In-Kind |
| $71,564,514 | $71,887,333 | $15,161,175 | $16,069,429 |
| (8) | Creation and Redemption Transactions |
| | |
| | Shares of the Fund are listed and traded on the Cboe BZX Exchange, Inc. (the “Exchange”). The Fund issues and redeems shares on a continuous basis at NAV only in large blocks of shares called “Creation Units.” A Creation Unit generally consists of 10,000 shares. Creation Units are to be issued and redeemed principally in kind for a basket of securities and a balancing cash amount. Shares generally will trade in the secondary market in amounts less than a Creation Unit at market prices that change throughout the day. Market prices for the shares may be different from their NAV. The NAV is determined as of the close of trading (generally, 4:00 p.m. Eastern Time) on each day the NYSE is open for trading. The NAV of the shares of the Fund will be equal to the Fund’s total assets minus the Fund’s total liabilities divided by the total number of shares outstanding. The NAV that is published will be rounded to the nearest cent; however, for purposes of determining the price of Creation Units, the NAV will be calculated to five decimal places. |
| | |
| | Only “Authorized Participants” may purchase or redeem shares directly from the Fund. An Authorized Participant is either (i) a broker-dealer or other participant in the clearing process through the Continuous Net Settlement System of National Securities Clearing Corporation or (ii) a DTC participant and, in each case, must have executed a Participant Agreement with the Distributor. Most retail investors will not qualify as Authorized Participants or have the resources to buy and sell whole Creation Units. Therefore, they will be unable to purchase or redeem the shares directly from the Fund. Rather, most retail investors will purchase shares in the secondary market with the assistance of a broker and will be subject to customary brokerage commissions or fees. Securities received or delivered in connection with in-kind creates and redeems are valued as of the close of business on the effective date of the creation or redemption. |
CONVERGENCE LONG/SHORT EQUITY ETF
Notes to Financial Statements (Continued)
November 30, 2022
| | Creation Unit Transaction Fee |
| | |
| | Authorized Participants will be required to pay to the Custodian a fixed transaction fee (the “Creation Transaction Fee”) in connection with the issuance of Creation Units. The standard Creation Transaction Fee will be the same regardless of the number of Creation Units purchased by an investor on the applicable Business Day. The Creation Transaction Fee for the Fund is $300. |
| | |
| | An additional variable fee of up to a maximum of 2% of the value of the Creation Units subject to the transaction may be imposed for cash purchases, non-standard orders, or partial purchase of Creation Units. The variable charge is primarily designed to cover additional costs (e.g., brokerage, taxes) involved with buying the securities with cash. The Fund may determine to not charge a variable fee on certain orders when the Adviser has determined that doing so is in the best interests of Fund shareholders. |
| | |
| | A creation unit will generally not be issued until the transfer of good title of the deposit securities to the Fund and the payment of any cash amounts have been completed. To the extent contemplated by the applicable participant agreement, Creation Units of the Fund will be issued to such authorized participant notwithstanding the fact that the Fund’s deposits have not been received in part or in whole, in reliance on the undertaking of the authorized participant to deliver the missing deposit securities as soon as possible. If the Fund or its agents do not receive all of the deposit securities, or the required cash amounts, by such time, then the order may be deemed rejected and the authorized participant shall be liable to the Fund for losses, if any. |
| | |
| (9) | Line of Credit |
| | |
| | The Fund had a line of credit in the amount of the lesser of 33.33% of the fair value of unencumbered assets of the Fund or $4,000,000 through February 18, 2022. The unsecured line of credit was intended to provide short-term financing, if necessary, subject to certain restrictions, in connection with shareholder redemptions. The credit facility was with the Fund’s custodian, U.S. Bank. Interest was accrued at the prime rate of 3.25%. There were no loans outstanding for the Fund as of November 30, 2022. The following table provides information regarding usage of the line of credit for the year ended November 30, 2022. |
| | Average | | Maximum | Maximum |
| Days | Amount of | Interest | Amount of | Borrowing |
Utilized | Borrowing | Expense* | Borrowing | Dates |
| 3 | $63,167 | $10 | $89,000 | 2/11/2022 through |
| | | | | 2/13/2022 |
| | * Interest expense is included within Interest and broker expenses on the Statement of Operations. | |
| (10) | Recent Market Events |
| | |
| | U.S. and international markets have experienced and may continue to experience significant periods of volatility in recent years and months due to a number of economic, political and global macro factors including rising inflation, uncertainty |
CONVERGENCE LONG/SHORT EQUITY ETF
Notes to Financial Statements (Continued)
November 30, 2022
| | regarding central banks’ interest rate increases, the possibility of a national or global recession, trade tensions, political events, the war between Russia and Ukraine and the impact of the coronavirus (COVID-19) global pandemic. The global recovery from COVID-19 may last for an extended period of time. As a result of continuing political tensions and armed conflicts, including the war between Ukraine and Russia, the U.S. and the European Union imposed sanctions on certain Russian individuals and companies, including certain financial institutions, and have limited certain exports and imports to and from Russia. The war has contributed to recent market volatility and may continue to do so. These developments, as well as other events, could result in further market volatility and negatively affect financial asset prices, the liquidity of certain securities and the normal operations of securities exchanges and other markets, despite government efforts to address market disruptions. Continuing market volatility as a result of recent market conditions or other events may have adverse effects on your account. |
| | |
| (11) | Subsequent Events |
| | |
| | Management has evaluated the Fund’s related events and transactions that occurred subsequent to November 30, 2022, through the date of issuance of the Fund’s financial statements. Management has determined that there were no subsequent events requiring recognition or disclosure in the financial statements other than the following: |
| | |
| | The Fund paid distributions to shareholders as follows: |
| | | | Ordinary | Ordinary |
| Record | | Reinvestment | Income | Distribution |
Date | Ex-Date | Payable Date | Rate | Paid |
| 12/16/22 | 12/15/22 | 12/19/22 | 0.12498259 | $194,639 |
CONVERGENCE LONG/SHORT EQUITY FUND
Report of Independent Registered Public Accounting Firm
To the Shareholders of Convergence Long/Short Equity ETF and
Board of Trustees of Trust for Professional Managers
Opinion on the Financial Statements
We have audited the accompanying statement of assets and liabilities, including the schedules of investments and securities sold short, of Convergence Long/Short Equity ETF (formerly Convergence Long/Short Equity Fund) (the “Fund”), a series of Trust for Professional Managers, as of November 30, 2022, the related statements of operations and cash flows for the year then ended, the statements of changes in net assets for each of the two years in the period then ended, the related notes, and the financial highlights for each of the five years in the period then ended (collectively referred to as the “financial statements”). In our opinion, the financial statements present fairly, in all material respects, the financial position of the Fund as of November 30, 2022, the results of its operations and its cash flows for the year then ended, the changes in net assets for each of the two years in the period then ended, and the financial highlights for each of the five years in the period then ended, in conformity with accounting principles generally accepted in the United States of America.
Basis for Opinion
These financial statements are the responsibility of the Fund’s management. Our responsibility is to express an opinion on the Fund’s financial statements based on our audits. We are a public accounting firm registered with the Public Company Accounting Oversight Board (United States) (“PCAOB”) and are required to be independent with respect to the Fund in accordance with the U.S. federal securities laws and the applicable rules and regulations of the Securities and Exchange Commission and the PCAOB.
We conducted our audits in accordance with the standards of the PCAOB. Those standards require that we plan and perform the audit to obtain reasonable assurance about whether the financial statements are free of material misstatement whether due to error or fraud.
Our audits included performing procedures to assess the risks of material misstatement of the financial statements, whether due to error or fraud, and performing procedures that respond to those risks. Such procedures included examining, on a test basis, evidence regarding the amounts and disclosures in the financial statements. Our procedures included confirmation of securities owned as of November 30, 2022, by correspondence with the custodian and brokers. Our audits also included evaluating the accounting principles used and significant estimates made by management, as well as evaluating the overall presentation of the financial statements. We believe that our audits provide a reasonable basis for our opinion.
We have served as the Fund’s auditor since 2009.
COHEN & COMPANY, LTD.
Milwaukee, Wisconsin
January 26, 2023
CONVERGENCE LONG/SHORT EQUITY ETF
Notice of Privacy Policy & Practices
(Unaudited)
We collect non-public personal information about you from the following sources:
• information we receive about you on applications or other forms;
• information you give us orally; and
• information about your transactions with us or others.
The types of non-public personal information we collect and share can include:
• social security numbers;
• account balances;
• account transactions;
• transaction history;
• wire transfer instructions; and
• checking account information.
What Information We Disclose
We do not disclose any non-public personal information about our shareholders or former shareholders without the shareholder’s authorization, except as permitted by law or in response to inquiries from governmental authorities. We may share information with affiliated parties and unaffiliated third parties with whom we have contracts for servicing the Fund. We will provide unaffiliated third parties with only the information necessary to carry out their assigned responsibility.
How We Protect Your Information
All shareholder records will be disposed of in accordance with applicable law. We maintain physical, electronic and procedural safeguards to protect your non-public personal information and require third parties to treat your non-public personal information with the same high degree of confidentiality.
In the event that you hold shares of the Fund through a financial intermediary, including, but not limited to, a broker-dealer, bank or trust company, the privacy policy of your financial intermediary would govern how your non-public personal information would be shared with unaffiliated third parties.
CONVERGENCE LONG/SHORT EQUITY ETF
Additional Information
(Unaudited)
Tax Information
For the year ended November 30, 2022, the Fund designated 23.67% of its ordinary income distribution as qualified dividend income under the Jobs and Growth Tax Relief Reconciliation Act of 2003.
For the year ended November 30, 2022, 24.24% of dividends paid from net ordinary income for the Fund qualified for the dividends received deduction available to corporate shareholders.
For the fiscal year ended November 30, 2022, the Fund designated 100.00% of its taxable ordinary income distributions as short-term capital gain distributions under Internal Revenue Code Section 871(k)(2)(c).
Indemnifications
Under the Trust’s organizational documents, its officers and Trustees are indemnified against certain liabilities arising out of the performance of their duties to the Fund. In addition, in the normal course of business, the Fund enters into contracts that provide general indemnifications to other parties. The Fund’s maximum exposure under these arrangements is unknown as this would involve future claims that may be made against the Fund that have not yet occurred. However, the Fund has not had prior claims or losses pursuant to these contracts and expect the risk of loss to be remote.
CONVERGENCE LONG/SHORT EQUITY ETF
Additional Information (Continued)
(Unaudited)
Information about Trustees
The business and affairs of the Trust are managed under the direction of the Board of Trustees. Information pertaining to the Trustees of the Trust is set forth below. The Statement of Additional Information includes additional information about the Trustees and is available, without charge, upon request by calling 877-677-9414.
| | | | | | Other |
| | | | | | Directorships |
| | | Term of | Number of | Principal | Held by |
| | | Office and | Portfolios | Occupation(s) | Trustee |
| | Position(s) | Length | in Trust | During the | During the |
| Name, Address | Held with | of Time | Overseen | Past Five | Past Five |
and Year of Birth | the Trust | Served | by Trustee | Years | Years |
| | | | | | |
| Independent Trustees | | | | | |
| | | | | | |
| Michael D. Akers, Ph.D. | Trustee | Indefinite | 22 | Professor Emeritus, | Independent |
| 615 E. Michigan St. | | Term; Since | | Department | Trustee, USA |
| Milwaukee, WI 53202 | | August 22, | | of Accounting, | MUTUALS |
| Year of Birth: 1955 | | 2001 | | (June 2019– | (an open-end |
| | | | | present), Professor, | investment |
| | | | | Department | company) |
| | | | | of Accounting, | (2001–2021). |
| | | | | (2004–May 2019), | |
| | | | | Chair, Department | |
| | | | | of Accounting | |
| | | | | (2004–2017), | |
| | | | | Marquette University. | |
| | | | | | |
| Gary A. Drska | Trustee | Indefinite | 22 | Retired; | Independent |
| 615 E. Michigan St. | | Term; Since | | Former Pilot, | Trustee, USA |
| Milwaukee, WI 53202 | | August 22, | | Frontier/Midwest | MUTUALS |
| Year of Birth: 1956 | | 2001 | | Airlines, Inc. | (an open-end |
| | | | | (airline company) | investment |
| | | | | (1986–2021). | company) |
| | | | | | (2001–2021). |
| | | | | | |
| Vincent P. Lyles | Trustee | Indefinite | 22 | System Vice | Independent |
| 615 E. Michigan St. | | Term; Since | | President of | Director, BMO |
| Milwaukee, WI 53202 | | April 6, | | Community | Funds, Inc. (an |
| Year of Birth: 1961 | | 2022 | | Relations, Advocate | open-end |
| | | | | Aurora Health | investment |
| | | | | Care (health care | company) |
| | | | | provider) (2019– | (2017–2022). |
| | | | | present); President | |
| | | | | and Chief Executive | |
| | | | | Officer, Boys & Girls | |
| | | | | Club of Greater | |
| | | | | Milwaukee | |
| | | | | (2012–2018). | |
CONVERGENCE LONG/SHORT EQUITY ETF
Additional Information (Continued)
(Unaudited)
| | | | | | Other |
| | | | | | Directorships |
| | | Term of | Number of | Principal | Held by |
| | | Office and | Portfolios | Occupation(s) | Trustee |
| | Position(s) | Length | in Trust | During the | During the |
| Name, Address | Held with | of Time | Overseen | Past Five | Past Five |
and Year of Birth | the Trust | Served | by Trustee | Years | Years |
| Erik K. Olstein | Trustee | Indefinite | 22 | Retired; President | Trustee, The |
| 615 E. Michigan St. | | Term; Since | | and Chief Operating | Olstein Funds |
| Milwaukee, WI 53202 | | April 6, | | Officer (2000– | (an open-end |
| Year of Birth: 1967 | | 2022 | | 2020), Vice | investment |
| | | | | President of Sales | company) |
| | | | | and Chief Operating | (1995–2018). |
| | | | | Officer (1995–2000), | |
| | | | | Olstein Capital | |
| | | | | Management, L.P. | |
| | | | | (asset management | |
| | | | | firm); Secretary and | |
| | | | | Assistant Treasurer, | |
| | | | | The Olstein Funds | |
| | | | | (1995–2018). | |
| | | | | | |
| Lisa Zúñiga Ramírez | Trustee | Indefinite | 22 | Retired; Principal | N/A |
| 615 E. Michigan St. | | Term; Since | | and Senior Portfolio | |
| Milwaukee, WI 53202 | | April 6, | | Manager, Segall, | |
| Year of Birth: 1969 | | 2022 | | Bryant & Hamill, LLC | |
| | | | | (asset management | |
| | | | | firm) (2018–2020); | |
| | | | | Partner and Senior | |
| | | | | Portfolio Manager, | |
| | | | | Denver Investments | |
| | | | | LLC (asset | |
| | | | | management firm) | |
| | | | | (2009–2018). | |
| | | | | | |
| Gregory M. Wesley | Trustee | Indefinite | 22 | Senior Vice | N/A |
| 615 E. Michigan St. | | Term; Since | | President of | |
| Milwaukee, WI 53202 | | April 6, | | Strategic Alliances | |
| Year of Birth: 1969 | | 2022 | | and Business | |
| | | | | Development, Medical | |
| | | | | College of Wisconsin | |
| | | | | (2016–present). | |
CONVERGENCE LONG/SHORT EQUITY ETF
Additional Information (Continued)
(Unaudited)
| | | | | | Other |
| | | | | | Directorships |
| | | Term of | Number of | Principal | Held by |
| | | Office and | Portfolios | Occupation(s) | Trustee |
| | Position(s) | Length | in Trust | During the | During the |
| Name, Address | Held with | of Time | Overseen | Past Five | Past Five |
and Year of Birth | the Trust | Served | by Trustee | Years | Years |
| | | | | | |
| Officers | | | | | |
| | | | | | |
| John P. Buckel | President | Indefinite | N/A | Vice President, | N/A |
| 615 E. Michigan St. | and | Term; Since | | U.S. Bancorp Fund | |
| Milwaukee, WI 53202 | Principal | January 24, | | Services, LLC | |
| Year of Birth: 1957 | Executive | 2013 | | (2004–present). | |
| | Officer | | | | |
| | | | | | |
| Jennifer A. Lima | Vice | Indefinite | N/A | Vice President, | N/A |
| 615 E. Michigan St. | President, | Term; Since | | U.S. Bancorp Fund | |
| Milwaukee, WI 53202 | Treasurer | January 24, | | Services, LLC | |
| Year of Birth: 1974 | and | 2013 | | (2002–present). | |
| | Principal | | | | |
| | Financial | | | | |
| | and | | | | |
| | Accounting | | | | |
| | Officer | | | | |
CONVERGENCE LONG/SHORT EQUITY ETF
Additional Information (Continued)
(Unaudited)
| | | | | | Other |
| | | | | | Directorships |
| | | Term of | Number of | Principal | Held by |
| | | Office and | Portfolios | Occupation(s) | Trustee |
| | Position(s) | Length | in Trust | During the | During the |
| Name, Address | Held with | of Time | Overseen | Past Five | Past Five |
and Year of Birth | the Trust | Served | by Trustee | Years | Years |
| Deanna B. Marotz | Chief | Indefinite | N/A | Senior Vice President | N/A |
| 615 E. Michigan St. | Compliance | Term; Since | | US Bancorp Fund | |
| Milwaukee, WI 53202 | Officer, | October 21, | | Services, LLC | |
| Year of Birth: 1965 | Vice | 2021 | | (2021–present); | |
| | President | | | Chief Compliance | |
| | and Anti- | | | Officer of Keeley-Teton | |
| | Money | | | Advisors, LLC and | |
| | Laundering | | | Teton Advisors, Inc | |
| | Officer | | | (since 2017); Chief | |
| | | | | Compliance Officer | |
| | | | | of Keeley Asset | |
| | | | | Management Corp. | |
| | | | | (2015–2017). | |
| | | | | | |
| Jay S. Fitton | Secretary | Indefinite | N/A | Assistant Vice | N/A |
| 615 E. Michigan St. | | Term; Since | | President, U.S. | |
| Milwaukee, WI 53202 | | July 22, 2019 | | Bancorp Fund | |
| Year of Birth: 1970 | | | | Services, LLC | |
| | | | | (2019–present); | |
| | | | | Partner, Practus, LLP | |
| | | | | (2018–2019); | |
| | | | | Counsel, Drinker | |
| | | | | Biddle & Reath, LLP | |
| | | | | (2016–2018). | |
| | | | | | |
| Kelly A. Strauss | Assistant | Indefinite | N/A | Assistant Vice | N/A |
| 615 E. Michigan St. | Treasurer | Term; Since | | President, U.S. | |
| Milwaukee, WI 53202 | | April 23, | | Bancorp Fund | |
| Year of Birth: 1987 | | 2015 | | Services, LLC | |
| | | | | (2011–present). | |
| | | | | | |
| Shannon Coyle | Assistant | Indefinite | N/A | Officer, | N/A |
| 615 E. Michigan St. | Treasurer | Term; Since | | U.S. Bancorp Fund | |
| Milwaukee, WI 53202 | | August 26, | | Services, LLC | |
| Year of Birth: 1990 | | 2022 | | (2015–present). | |
| | | | | | |
| Laura A. Carroll | Assistant | Indefinite | N/A | Assistant Vice | N/A |
| 615 E. Michigan St. | Treasurer | Term; Since | | President, U.S. | |
| Milwaukee, WI 53202 | | August 20, | | Bancorp Fund | |
| Year of Birth: 1985 | | 2018 | | Services, LLC | |
| | | | | (2007–present). | |
A NOTE ON FORWARD LOOKING STATEMENTS (Unaudited)
Except for historical information contained in this report for the Fund, the matters discussed in this report may constitute forward-looking statements made pursuant to the safe-harbor provisions of the Private Securities Litigation Reform Act of 1995. These include any adviser or portfolio manager predictions, assessments, analyses or outlooks for individual securities, industries, market sectors and/or markets. These statements involve risks and uncertainties. In addition to the general risks described for the Fund in the current Prospectus, other factors bearing on this report include the accuracy of the Adviser’s or portfolio managers’ forecasts and predictions, and the appropriateness of the investment programs designed by the Adviser or portfolio managers to implement their strategies efficiently and effectively. Any one or more of these factors, as well as other risks affecting the securities markets and investment instruments generally, could cause the actual results of the Fund to differ materially as compared to benchmarks associated with the Fund.
ADDITIONAL INFORMATION (Unaudited)
The Fund has adopted proxy voting policies and procedures that delegate to the Adviser the authority to vote proxies. A description of the Fund’s proxy voting policies and procedures is available without charge, upon request, by calling the Fund toll free at 1-877-677-9414. A description of these policies and procedures is also included in the Fund’s Statement of Additional Information, which is available on the SEC’s website at http://www.sec.gov.
The Fund’s proxy voting record for the most recent 12-month period ended June 30 is available without charge, upon request, by calling, toll free, 1-877-677-9414, or by accessing the SEC’s website at http://www.sec.gov.
The Fund files its complete schedules of portfolio holdings with the SEC for the first and third quarters of each fiscal year on Part F of Form N-PORT. Shareholders may view the Fund’s Form N-PORT reports on the SEC’s website at www.sec.gov.
HOUSEHOLDING (Unaudited)
In an effort to decrease costs, the Fund intends to reduce the number of duplicate prospectuses, supplements and certain other shareholder documents you receive by sending only one copy of each to those addresses shared by two or more accounts and to shareholders the Fund reasonably believes are from the same family or household. Once implemented, if you would like to discontinue householding for your accounts, please call the Fund toll-free at 1-877-677-9414 to request individual copies of these documents. Once the Fund receives notice to stop householding, the Fund will begin sending individual copies 30 days after receiving your request. This policy does not apply to account statements.
FREQUENCY OF DISTRIBUTIONS OF PREMIUMS AND DISCOUNTS (Unaudited)
Information regarding how often shares of the Fund trade on the Exchange at a price above (i.e., at a premium) or below (i.e., at a discount) to its daily net asset value (“NAV”) is available, without charge, on the Fund’s website at https://www.investcip.com/.
CONVERGENCE LONG/SHORT EQUITY ETF
| Investment Adviser | Convergence Investment Partners, LLC |
| | 3801 PGA Boulevard |
| | Suite 1001 |
| | Palm Beach Gardens, Florida 33410 |
| | |
| Legal Counsel | Godfrey & Kahn, S.C. |
| | 833 East Michigan Street |
| | Suite 1800 |
| | Milwaukee, Wisconsin 53202 |
| | |
| Independent Registered Public | Cohen & Company, Ltd. |
| Accounting Firm | 342 North Water Street |
| | Suite 830 |
| | Milwaukee, Wisconsin 53202 |
| | |
| Transfer Agent, Fund Accountant and | U.S. Bancorp Fund Services, LLC |
| Fund Administrator | 615 East Michigan Street |
| | Milwaukee, Wisconsin 53202 |
| | |
| Custodian | U.S. Bank National Association |
| | Custody Operations |
| | 1555 North River Center Drive |
| | Milwaukee, Wisconsin 53212 |
| | |
| Distributor | Foreside Fund Services |
| | Three Canal Plaza |
| | Suite 100 |
| | Portland, Maine 04101 |
This report is intended for shareholders of the Fund and may not be used as sales literature unless preceded or accompanied by a current prospectus.
MN-ANNUAL
Item 2. Code of Ethics.
The registrant has adopted a code of ethics that applies to the registrant’s principal executive officer and principal financial officer. The registrant has not made any substantive amendments to its code of ethics during the period covered by this report. The registrant has not granted any waivers from any provisions of the code of ethics during the period covered by this report. Incorporated by reference to the registrant’s Form N-CSR filed on February 3, 2017.
Item 3. Audit Committee Financial Expert.
The registrant’s board of trustees has determined that there is at least one audit committee financial expert serving on its audit committee. Dr. Michael Akers is the “audit committee financial expert” and is considered to be “independent” as each term is defined in Item 3 of Form N‑CSR. Dr. Akers holds a Ph.D. in accountancy and is a professor Emeritus of accounting at Marquette University in Milwaukee, Wisconsin.
Item 4. Principal Accountant Fees and Services.
The registrant has engaged its principal accountant to perform audit services, audit-related services, tax services and other services during the past two fiscal years. “Audit services” refer to performing an audit of the registrant's annual financial statements or services that are normally provided by the accountant in connection with statutory and regulatory filings or engagements for those fiscal years. “Audit-related services” refer to the assurance and related services by the principal accountant that are reasonably related to the performance of the audit. “Tax services” refer to professional services rendered by the principal accountant for tax compliance, tax advice, and tax planning. The following table details the aggregate fees billed or expected to be billed for each of the last two fiscal years for audit fees, audit-related fees, tax fees and other fees by the principal accountant.
| | FYE 11/30/2022 | FYE 11/30/2021 |
Audit Fees | $16,500 | $16,500 |
Audit-Related Fees | $4,000 | $0 |
Tax Fees | $3,000 | $3,000 |
All Other Fees | $0 | $0 |
The audit committee has adopted pre-approval policies and procedures that require the audit committee to pre‑approve all audit and non‑audit services of the registrant, including services provided to any entity affiliated with the registrant.
The percentage of fees billed by Cohen & Company, Ltd. applicable to non-audit services pursuant to waiver of pre-approval requirement were as follows:
| | FYE 11/30/2022 | FYE 11/30/2021 |
Audit-Related Fees | 0% | 0% |
Tax Fees | 0% | 0% |
All Other Fees | 0% | 0% |
All of the principal accountant’s hours spent on auditing the registrant’s financial statements were attributed to work performed by full‑time permanent employees of the principal accountant.
The following table indicates the non-audit fees billed or expected to be billed by the registrant’s accountant for services to the registrant and to the registrant’s investment adviser (and any other controlling entity, etc.—not sub-adviser) for the last two years. The audit committee of the board of trustees/directors has considered whether the provision of non-audit services that were rendered to the registrant's investment adviser is compatible with maintaining the principal accountant's independence and has concluded that the provision of such non-audit services by the accountant has not compromised the accountant’s independence.
Non-Audit Related Fees | FYE 11/30/2022 | FYE 11/30/2021 |
Registrant | 0 | 0 |
Registrant’s Investment Adviser | 0 | 0 |
The registrant has not been identified by the U.S. Securities and Exchange Commission as having filed an annual report issued by a registered public accounting firm branch or office that is located in a foreign jurisdiction where the Public Company Accounting Oversight Board is unable to inspect or completely investigate because of a position taken by an authority in that jurisdiction.
The registrant is not a foreign issuer.
Item 5. Audit Committee of Listed Registrants.
| (a) | The registrant is an issuer as defined in Rule 10A-3 under the Securities Exchange Act of 1934, (the “Act”) and has a separately-designated standing audit committee established in accordance with Section 3(a)(58)(A) of the Act. The entire Board of Trustees is acting as the registrant’s audit committee. |
Item 6. Investments.
| (a) | Schedule of Investments is included as part of the report to shareholders filed under Item 1 of this Form. |
Item 7. Disclosure of Proxy Voting Policies and Procedures for Closed-End Management Investment Companies.
Not applicable to open-end investment companies.
Item 8. Portfolio Managers of Closed-End Management Investment Companies.
Not applicable to open-end investment companies.
Item 9. Purchases of Equity Securities by Closed‑End Management Investment Company and Affiliated Purchasers.
Not applicable to open-end investment companies.
Item 10. Submission of Matters to a Vote of Security Holders.
There have been no material changes to the procedures by which shareholders may recommend nominees to the registrant’s board of trustees.
Item 11. Controls and Procedures.
| (a) | The Registrant’s President and Treasurer have reviewed the Registrant's disclosure controls and procedures (as defined in Rule 30a-3(c) under the Investment Company Act of 1940 (the “Act”)) as of a date within 90 days of the filing of this report, as required by Rule 30a-3(b) under the Act and Rules 13a-15(b) or 15d‑15(b) under the Securities Exchange Act of 1934. Based on their review, such officers have concluded that the disclosure controls and procedures are effective in ensuring that information required to be disclosed in this report is appropriately recorded, processed, summarized and reported and made known to them by others within the Registrant and by the Registrant’s service provider. |
| (b) | There were no changes in the Registrant's internal control over financial reporting (as defined in Rule 30a-3(d) under the Act) that occurred during the period covered by this report that have materially affected, or are reasonably likely to materially affect, the Registrant's internal control over financial reporting. |
Item 12. Disclosure of Securities Lending Activities for Closed-End Management Investment Companies
Not applicable to open-end investment companies.
Item 13. Exhibits.
(3) Any written solicitation to purchase securities under Rule 23c‑1 under the Act sent or given during the period covered by the report by or on behalf of the registrant to 10 or more persons. Not applicable to open-end investment companies.
(4) Change in the registrant’s independent public accountant. There was no change in the registrant’s independent public accountant for the period covered by this report.
SIGNATURES
Pursuant to the requirements of the Securities Exchange Act of 1934 and the Investment Company Act of 1940, the registrant has duly caused this report to be signed on its behalf by the undersigned, thereunto duly authorized.
(Registrant) Trust for Professional Managers
By (Signature and Title)* /s/John Buckel
John Buckel, President
Date 2/1/2023
Pursuant to the requirements of the Securities Exchange Act of 1934 and the Investment Company Act of 1940, this report has been signed below by the following persons on behalf of the registrant and in the capacities and on the dates indicated.
By (Signature and Title)* /s/John Buckel
John Buckel, President
Date 2/1/2023
By (Signature and Title)* /s/Jennifer Lima
Jennifer Lima, Treasurer
Date 2/1/2023
* Print the name and title of each signing officer under his or her signature.