Annual Report | August 31, 2022
Performance Trust Strategic Bond Fund
(Symbols: PTIAX, PTAOX, PTCOX),
Performance Trust Municipal Bond Fund
(Symbols: PTIMX, PTRMX) and
Performance Trust Credit Fund
(Symbol: PTCRX)
© 2022 PT Asset Management, LLC. All Rights Reserved.
LETTER FROM THE INVESTMENT ADVISER
Dear Fellow Shareholders:
Performance Trust Strategic Bond Fund (PTIAX) Annual Management’s
Discussion of Fund Performance: 9/1/2021 – 8/31/2022
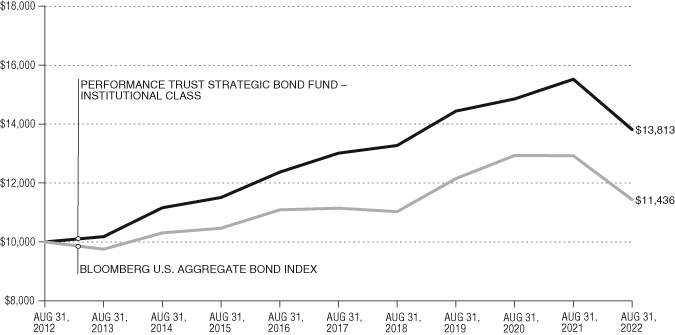
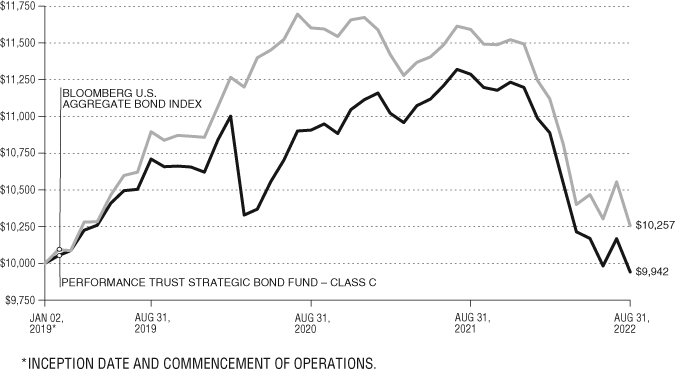
Over the past fiscal year ended August 31, 2022, the Performance Trust Strategic Bond Fund – Institutional Class (“PTIAX” or the “Fund”) posted a return of -11.00% compared to -11.52% for the Bloomberg U.S. Aggregate Bond Index (“Index”). The Morningstar Intermediate Core-Plus Bond Fund category returned -11.65%.
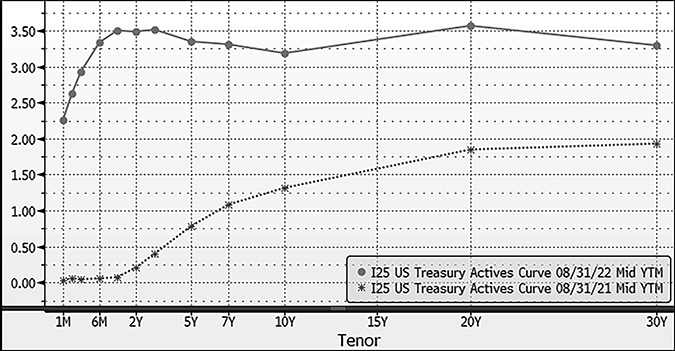
During the past year, interest rates rose dramatically as the Federal Reserve began an aggressive interest rate hiking cycle and began to shrink its holdings of Treasury, agency, and agency mortgage-backed securities accumulated during the COVID-19 pandemic. The Fed Funds rate rose 2.25% during the second half of the year with the market anticipating further increases. The chart below shows the U.S. Treasury yield curve from the beginning of the period and the end.
Treasury Yield Curve
Not only did interest rates increase significantly, but the Treasury yield curve became much flatter during the year. A 1-year Treasury, which is quite sensitive to changes in the Fed Funds rate, yielded approximately 3.50% at the end of the year after beginning the year yielding only 0.07%. The benchmark 10-year Treasury yield rose approximately 1.88% during the year.
The Federal Reserve’s rapid reduction in monetary stimulus was prompted by persistent increases in inflation. While it was initially believed that inflation was being driven by temporary factors that would moderate over time, the annualized Consumer Price Index continued to climb for most of the year and ended the year at approximately 8.3%. That is significantly higher than the 2% core inflation rate targeted by the Federal Reserve.
As a result of the withdrawal of monetary stimulus and the fear of rising inflation, risk markets have been volatile and credit spreads have widened considerably. Investment grade corporate (IG) spreads rose 0.53% to end the year at 1.40% while high yield corporate (HY) spreads increased 1.96% to end the year at 4.84% (Source: Bloomberg). In combination, Treasury yield increases and credit spread widening has led to substantial price declines and meaningfully negative total returns across much of the domestic fixed income landscape.
Treasuries and Agency Mortgage-backed Securities (MBS), two of the largest sectors within the Index, produced negative returns, but slightly outperformed the Index as a result of having minimal credit risk and less duration than IG Corporates. IG Corporates, the other large Index sector, underperformed significantly as the sector’s higher duration amplified the impact of both higher Treasury rates and wider spreads.
Outperformance relative to the Index was driven primarily by the sectors we consider to be our Interest Rate Defense. The Fund’s investments in Structured Credit sectors, such as Non-Agency Residential Mortgage-Backed Securities (RMBS), certain Commercial Mortgage-Backed Securities (CMBS), and Collateralized Loan Obligations (CLOs) tend to be less sensitive to interest rate moves and fall into this category. Other defensive sectors contributing to the outperformance include short-term Treasuries, Asset-Backed Securities (ABS), and short corporate bank debt.
PERFORMANCE TRUST MUTUAL FUNDS (PTIAX, PTAOX, PTCOX, PTIMX, PTRMX, PTCRX)
LETTER FROM THE INVESTMENT ADVISER
However, outperformance from the above sectors was almost entirely offset by the sectors we consider to be our Interest Rate Offense. Similar to the IG Corporates within the Index, the Fund’s Taxable and Tax-Exempt Municipals, IG Corporates, and more rate-sensitive CMBS suffered from the combination of higher rates and widening spreads. Further, HY Corporates, which are often times less sensitive to interest rates, suffered significant spread widening that also contributed to underperformance relative to the Index.
The table below shows a general breakdown of the portfolio at the beginning and end of the period.
PTIAX Allocations
| | | 8/31/2021 | 8/31/2022 |
| | Non-Agency RMBS | 11.97% | 10.83% |
| | CLOs | 9.82% | 5.96% |
| | CMBS | 22.04% | 26.25% |
| | ABS | 0.47% | 1.46% |
| | Structured Credit | 44.30% | 44.51% |
| | Cash | 2.52% | 0.16% |
| | Government Security & Agency Issue | 3.35% | 5.20% |
| | Investment Grade Corporates | 14.00% | 15.80% |
| | High Yield | 2.89% | 6.35% |
| | Taxable Municipal | 21.13% | 20.84% |
| | Tax-Exempt Municipal | 11.81% | 7.14% |
The Fund reduced its exposure to CLOs. As primarily floating rate securities, CLOs were impacted less by rising interest rates. As Treasury yields climbed during the year, fixed rate alternatives in other sectors became more attractive in our opinion. The allocation to Tax-Exempt Municipals was also trimmed as the sector was relatively expensive relative to taxable alternatives for much of the year. The combination of rising rates and much wider credit spreads prompted us to increase our allocations to HY Corporates, CMBS, and IG Corporates. As these sectors carry a higher credit risk component, we offset these increases somewhat by adding to Treasury and ABS securities.
Looking Forward
During the year, all-in yields for IG Corporates climbed to levels not seen since 2009 when the economy was beginning to recover from the Great Financial Crisis. Similarly, all-in yields for HY Corporates ended the year at levels seen only briefly during the COVID scare in early 2020 and when energy prices were collapsing in early 2016. As a result of significantly higher total return potential in credit-sensitive fixed income products, we gradually increased exposure to sectors such as HY Corporate, IG Corporate, and CMBS during the year. This is in sharp contrast to last year when all-in yields were near historic lows, and we were attempting to minimize credit risk.
We do not attempt to predict interest rates or credit spreads. We have positioned the portfolio so that it has what we believe to be a balance of high-quality Interest Rate Offense and higher yielding Interest Rate Defense. Within our Interest Rate Defense, we are attempting to prudently add higher yielding structured credit and corporate securities that are not exposed, in our opinion, to excessive credit risk or structural leverage.
As a total return bond fund, we seek to position ourselves in the most undervalued fixed-income securities we can find, consistent with the need for proper diversification and liquidity. To identify such opportunities, we find scenario analysis (over roughly a three-year investment horizon) to be more valuable than rate or market forecasting. We call this methodology Shape Management®, and we attribute our historical performance largely to our allocation decisions.
PERFORMANCE TRUST MUTUAL FUNDS (PTIAX, PTAOX, PTCOX, PTIMX, PTRMX, PTCRX)
LETTER FROM THE INVESTMENT ADVISER
Performance Trust Municipal Bond Fund (PTIMX) Annual Management’s
Discussion of Fund Performance: 9/1/2021 – 8/31/2022
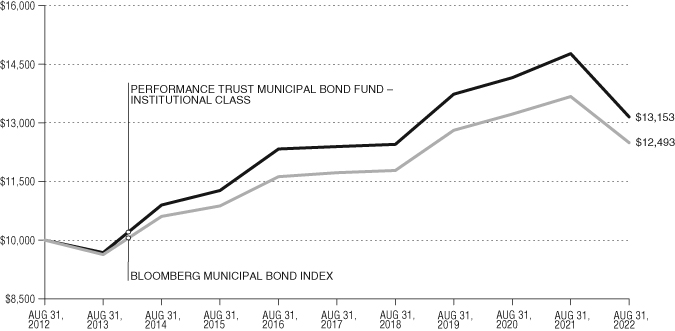
Over the past fiscal year ended August 31, 2022, Performance Trust Municipal Bond Fund – Institutional Class (“PTIMX” or the “Fund”) posted a return of -10.96% compared to -8.63% for the Bloomberg Municipal Bond Index (“Index”). PTIMX’s underperformance can generally be attributed to its exposure to the longer end of the yield curve making the Fund a little more sensitive to movements in interest rates.
The table below shows the Municipal Market Data (MMD) AAA municipal benchmark yield curve at the beginning and end of the period which saw a significant increase in interest rates brought about by headline inflation and the subsequent tightening of monetary policy by the Federal Reserve.
MMD AAA Scale
| Maturity | August 31, 2021 | August 31, 2022 | Change (bp) |
| 1 | 0.08% | 2.21% | +213 |
| 5 | 0.41% | 2.32% | +191 |
| 7 | 0.65% | 2.40% | +175 |
| 10 | 0.92% | 2.59% | +167 |
| 15 | 1.15% | 2.93% | +178 |
| 20 | 1.33% | 3.14% | +181 |
| 25 | 1.48% | 3.25% | +177 |
| 30 | 1.52% | 3.29% | +177 |
Source: MMD AAA Scale as of August 31, 2021 and August 31, 2022
While we do not predict the direction or magnitude of changes in interest rates, the go forward shapes of bonds purchased in the lower interest rate environment of the last few years changed due to the increase in interest rates and the passage of time. Therefore, PTIMX has been actively using the opportunity brought about by the increase in interest rates during the period to shore up call protection, primarily in the market for new issues but also in the secondary market, and lock in the higher yields provided by the current interest rate environment.
We have exited bonds, for example, with calls that had generally shortened into the five-to-eight-year range and replaced them with bonds with a full ten years of call protection while maintaining our high coupon preference to help protect the portfolio from extension risk as interest rates rise. Historically, for PTIMX a “high coupon” has generally meant a 5% coupon. However, near the end of the period, we have been increasing allocations to tax-exempt bonds with 5.25%, 5.50%, and even 6% coupons.
The increase in tax-exempt yields over the last year has resulted in taxable-equivalent yields for tax-exempt bonds rising accordingly. We have primarily added tax-exempt, investment grade bonds in the most recent period, so our exposure to taxable and below investment grade municipal bonds in PTIMX has drifted lower compared to a year ago. As of August 31, 2022, 7.0% of the holdings in PTIMX were taxable compared to 9.3% as of August 31, 2021. As high-yield municipal credit spreads tightened relative to those experienced in 2020 and 2021, PTIMX’s exposure to below investment grade bonds decreased to 10% as of August 31, 2022 compared to nearly 17% as of August 31, 2021.
Looking Forward
The level of the longer part of the MMD AAA yield curve as of August 31, 2022 in the table above is near the higher end of the range over the last several years. The volatility in the credit markets as a result of the withdrawal of monetary stimulus and rising inflation along with technical factors such as the steady supply of new municipal issuance has seen yield spreads for many municipal bond sectors increase to historically wide levels. For example, spreads for AA-rated revenue bonds that price off the AAA municipal benchmark have increased to over 50 basis points (0.50%) compared to an average spread of 35 basis points (0.35%) over the last six and a half years.*
Looking forward, interest rates and spreads may increase, decrease, or be unchanged from current levels. Our Shape Management® discipline uses bond math and logic to evaluate total return outcomes over various interest rate scenarios. As we look forward over a longer-term investment horizon (3-years) the go forward return outcomes revealed by Shape Management® for PTIMX and the opportunities available to us have improved notably compared to those available at the beginning of the period.
* Source: Bloomberg
PERFORMANCE TRUST MUTUAL FUNDS (PTIAX, PTAOX, PTCOX, PTIMX, PTRMX, PTCRX)
LETTER FROM THE INVESTMENT ADVISER
Performance Trust Credit Fund (PTCRX) Annual Management’s
Discussion and Analysis: 9/1/2021 – 8/31/2022
Over the past fiscal year ended August 31, 2022, the Institutional Class of Performance Trust Credit Fund (“PTCRX” or the “Fund”) posted a return of -9.66%, assuming all dividends were reinvested into the Fund. The Bloomberg U.S. Aggregate Bond Index (“Index”) returned -11.52% over the same time, and the Morningstar Multisector US Bond Category (“Category”) returned -9.37%.
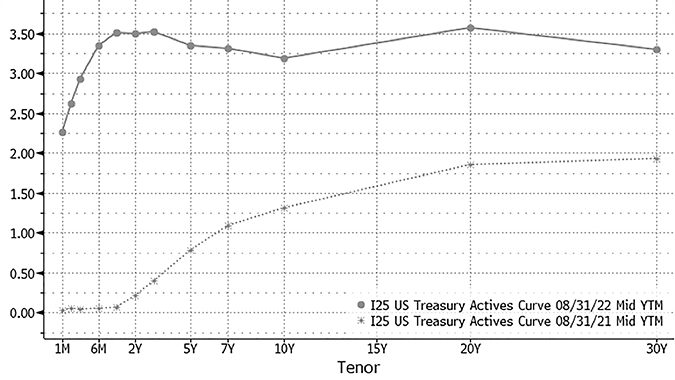
The Fed hiked for the first time since 2018, raising the Federal Funds Rate nine times in a period of less than five months, as inflation has remained stubbornly high and well outside the Fed’s targeted range. This aggressive Fed action, coupled with balance sheet reduction has led to a dramatically higher and flatter U.S. Treasury yield curve. The 2-year and 10-year Treasuries have risen 328 basis points (3.28%) and 188 basis points (1.88%) over the past fiscal year respectively and the yield curve is now inverted, a hallmark sign for a recession.
The graph below shows the Treasury yield curve at the beginning and end of the period.
Credit markets behaved accordingly as they digested what effect the aggressive Fed action, historically high inflation, and Russia’s invasion of Ukraine would have on the global economies as well as corporate and consumer balance sheets. Almost all credit metrics were down/wider during the fiscal period with the S&P 500 Index down 11.25% and investment grade (LUACOAS Index) and high yield (LF98OAS Index) corporate credit spreads wider by 53 basis points (0.53%) and 190 basis points (1.90%) respectively.
��
Despite additional credit risk relative to the Index, the Fund was able to outperform given the lower duration and outperformance of some of our Structured Credit sectors. Within the Index, the Investment Grade Corporate Bond exposure performed the worse as both higher rates and wider spreads led to negative performance. This sector has a higher duration and lower credit ratings compared to the Treasury and Agency MBS sectors held in the Index.
Looking more closely at the Fund, outperformance relative to the Index can be attributed to the relative strong performance of the Structured Credit portion of the portfolio, specifically CLOs and Non-Agency RMBS. CLOs have been insulated from the rise in rates as the coupon on these bonds are floating and reset quarterly. While credit spreads have risen on CLOs, leading to price declines, the high carry of these bonds has almost perfectly offset the price declines. The Non-Agency RMBS in the Fund are mostly bonds which had been originated before the Great Financial Crisis. These bonds have experienced modest credit spread widening and that, coupled with the lower duration given the amortizing nature of sector, has led to relative outperformance.
PERFORMANCE TRUST MUTUAL FUNDS (PTIAX, PTAOX, PTCOX, PTIMX, PTRMX, PTCRX)
LETTER FROM THE INVESTMENT ADVISER
The table below shows a general breakdown of the portfolio at the beginning and end of the period:
| | | 8/31/2021 | 8/31/2022 |
| | Non-Agency RMBS | 16.3% | 5.0% |
| | CLOs | 14.8% | 14.2% |
| | Non-Agency CMBS | 12.6% | 17.5% |
| | Agency CMBS | 2.1% | 5.4% |
| | ABS | 0.0% | 7.4% |
| | Structured Credit | 45.8% | 49.5% |
| | Cash | 0.6% | 1.9% |
| | Treasuries | 0.0% | 5.5% |
| | IG Corporate | 18.5% | 19.0% |
| | HY Corporate | 14.0% | 15.8% |
| | Taxable Muni | 12.5% | 3.6% |
| | Tax-Exempt Muni | 8.6% | 4.7% |
Overall, the Fund increased the allocation to Structured Credit by reducing the allocation to Municipal bonds. The reduction in Municipal bonds also funded the purchase of additional IG/HY Corporates and Treasuries, which were added as an additional source of liquidity. Within Structured Credit, Non-Agency RMBS started the period with the largest allocation of the Fund, but this allocation was reduced given the sector’s strong outperformance. Some of this was redirected into Non-Agency CMBS which offer attractive spreads, but the most obvious replacement was ABS, where the Fund has gone from a zero allocation to over seven percent. While ABS is a broad sector, the bonds within the Fund are all backed by subprime auto loans, with tranche ratings ranging from AAA to A and weighted average lives ranging from two to three and a half years. These bonds have become attractive this year as rates have risen dramatically in the short end and the Treasury curve has inverted.
Looking Forward
Opportunities are plentiful in this investment landscape with rates at or near levels not seen in over a decade and credit spreads at wide levels. However, volatility also remains at elevated levels. Rather than guess where rates might end up, we believe the best approach is to focus instead on maximizing returns across a variety of interest rate scenarios. This approach, Shape Management®, aids in our security and sector allocation as it looks beyond traditional bond metrics and focuses instead on total returns over a horizon period. We combine this approach with a disciplined credit perspective to create a diversified portfolio across multiple sectors that together creates a unique and attractive blend of interest rate and credit risk.
Mutual fund investing involves risk. Principal loss is possible. Investments in debt securities typically decrease in value when interest rates rise. This risk is usually greater for longer-term debt securities. Investments in lower rated and non-rated securities present a greater risk of loss to principal and interest than higher-rated securities. Investments in asset-backed and mortgage-backed securities include additional risks that investors should be aware of such as credit risk, prepayment risk, possible illiquidity and default, as well as increased susceptibility to adverse economic developments. Investments in Real Estate Investment Trusts (REITs) involve additional risks such as declines in the value of real estate and increased susceptibility to adverse economic or regulatory developments. Derivatives involve investment exposure that may exceed the original cost and a small investment in derivatives could have a large potential impact on the performance of the Fund. Options and Swap positions held in a Fund may be illiquid and the Fund manager may have difficulty closing out a position. Diversification does not assure a profit or protect against a loss in a declining market. Income from tax-exempt bonds may be subject to state and local taxes and a portion of income may be subject to the federal alternative minimum tax for certain investors. Federal income tax rules will apply to any capital gains distributions.
PERFORMANCE TRUST MUTUAL FUNDS (PTIAX, PTAOX, PTCOX, PTIMX, PTRMX, PTCRX)
GROWTH OF PERFORMANCE TRUST STRATEGIC BOND FUND (PTIAX)
Performance Trust Strategic Bond Fund – Institutional Class (Unaudited)
Total Return vs. Bloomberg U.S. Aggregate Bond Index
Average Annual Returns—For the Periods Ended August 31, 2022 (Unaudited)
| | | | | | ANNUALIZED |
| | ONE | THREE | FIVE | TEN | SINCE INCEPTION |
| | YEAR | YEAR | YEAR | YEAR | (AUGUST 31, 2010)(1) |
| Performance Trust Strategic | | | | | |
| Bond Fund – Institutional Class | -11.00% | -1.47% | 1.20% | 3.28% | 4.53% |
| Bloomberg U.S. Aggregate Bond Index | -11.52% | -2.00% | 0.52% | 1.35% | 1.98% |
(1) | The Performance Trust Strategic Bond Fund (the “Fund”) commenced investment operations on September 1, 2010. |
The Bloomberg U.S. Aggregate Bond Index is a broad-based benchmark that measures the investment grade, Bloomberg Capital dollar denominated, fixed-rate taxable bond market, including Treasuries, government-related and corporate securities, Mortgage-Backed Securities (agency fixed-rate and hybrid Adjustable-Rate Mortgage Passthroughs), Asset-Backed Securities, and Commercial Mortgage-Backed Securities. The Bloomberg U.S. Aggregate Bond Index was created in 1986, with index history backfilled to January 1, 1976. The chart at the top of the page assumes an initial gross investment of $10,000 made on August 31, 2012 for Institutional Class shares of the Fund.
Returns shown do not reflect the deduction of taxes that a shareholder would pay on Fund distributions or the redemption of Fund shares. Returns shown include the reinvestment of all Fund distributions. Investment performance reflects fee waivers in effect. In the absence of such waivers, total returns would be reduced.
For a period of time following the Fund’s inception when the Fund’s asset levels were lower than current asset levels, the Fund’s investments in certain fixed-income instruments purchased in odd lot-sized transactions contributed positively to the Fund’s performance. As Fund asset levels increased, similar odd lot-sized transactions, if any, did not have the same relative impact on the Fund’s performance and are not anticipated to have the same relative impact on the Fund’s future performance.
Performance data shown represents past performance. Past performance does not guarantee future results. The investment return and principal value of an investment will fluctuate so that an investor’s shares, when redeemed, may be worth more or less than their original cost. Current performance of the Fund may be lower or higher than the performance shown. Performance data current to the most recent month end may be obtained by calling 1 (877) 738-9095 or by visiting www.PTAM.com.
The expense ratio for Institutional Class shares is 0.76% per the prospectus dated December 29, 2021. Please see the Financial Highlights in this report for the most recent expense ratio.
PERFORMANCE TRUST MUTUAL FUNDS (PTIAX, PTAOX, PTCOX, PTIMX, PTRMX, PTCRX)
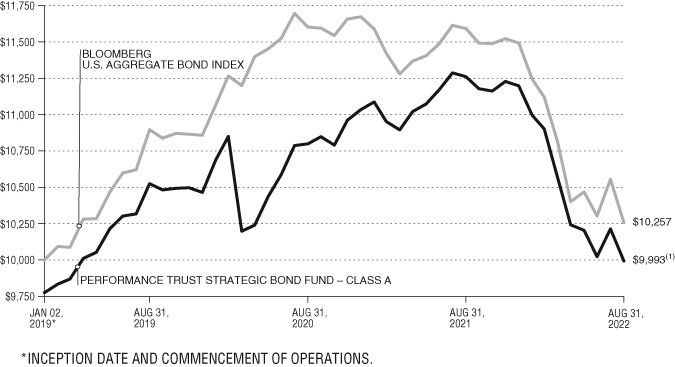
GROWTH OF PERFORMANCE TRUST STRATEGIC BOND FUND (PTAOX)
Performance Trust Strategic Bond Fund – Class A (Unaudited)
Total Return vs. Bloomberg U.S. Aggregate Bond Index
| | (1) | Reflects 2.25% initial sales load. |
Average Annual Returns—For the Periods Ended August 31, 2022 (Unaudited)
| | | | ANNUALIZED |
| | ONE | THREE | SINCE INCEPTION |
| | YEAR | YEAR | (JANUARY 2, 2019) |
| Performance Trust Strategic Bond Fund – Class A (with sales charge) | -13.24% | -2.45% | -0.02% |
| Performance Trust Strategic Bond Fund – Class A (without sales charge) | -11.26% | -1.71% | 0.61% |
| Bloomberg U.S. Aggregate Bond Index | -11.52% | -2.00% | 0.70% |
The Bloomberg U.S. Aggregate Bond Index is a broad-based benchmark that measures the investment grade, Bloomberg Capital dollar denominated, fixed-rate taxable bond market, including Treasuries, government-related and corporate securities, Mortgage-Backed Securities (agency fixed-rate and hybrid Adjustable-Rate Mortgage Passthroughs), Asset-Backed Securities, and Commercial Mortgage-Backed Securities. The Bloomberg U.S. Aggregate Bond Index was created in 1986, with index history backfilled to January 1, 1976. The chart at the top of the page assumes an initial gross investment of $10,000 made on January 2, 2019, the inception date for Class A shares of the Performance Trust Strategic Bond Fund (the “Fund”).
Returns shown do not reflect the deduction of taxes that a shareholder would pay on Fund distributions or the redemption of Fund shares. Returns shown include the reinvestment of all Fund distributions.
Performance data shown represents past performance. Past performance does not guarantee future results. The investment return and principal value of an investment will fluctuate so that an investor’s shares, when redeemed, may be worth more or less than their original cost. Current performance of the Fund may be lower or higher than the performance shown. Performance data current to the most recent month end may be obtained by calling 1 (877) 738-9095 or by visiting www.PTAM.com.
The expense ratio for Class A shares is 1.01% per the prospectus dated December 29, 2021. Please see the Financial Highlights in this report for the most recent expense ratio.
PERFORMANCE TRUST MUTUAL FUNDS (PTIAX, PTAOX, PTCOX, PTIMX, PTRMX, PTCRX)
GROWTH OF PERFORMANCE TRUST STRATEGIC BOND FUND (PTCOX)
Performance Trust Strategic Bond Fund – Class C (Unaudited)
Total Return vs. Bloomberg U.S. Aggregate Bond Index
Average Annual Returns—For the Periods Ended August 31, 2022 (Unaudited)
| | | | ANNUALIZED |
| | ONE | THREE | SINCE INCEPTION |
| | YEAR | YEAR | (JANUARY 2, 2019) |
| Performance Trust Strategic Bond Fund – Class C | -11.92% | -2.45% | -0.16% |
| Bloomberg U.S. Aggregate Bond Index | -11.52% | -2.00% | 0.70% |
The Bloomberg U.S. Aggregate Bond Index is a broad-based benchmark that measures the investment grade, Bloomberg Capital dollar denominated, fixed-rate taxable bond market, including Treasuries, government-related and corporate securities, Mortgage-Backed Securities (agency fixed-rate and hybrid Adjustable-Rate Mortgage Passthroughs), Asset-Backed Securities, and Commercial Mortgage-Backed Securities. The Bloomberg U.S. Aggregate Bond Index was created in 1986, with index history backfilled to January 1, 1976. The chart at the top of the page assumes an initial gross investment of $10,000 made on January 2, 2019, the inception date for Class C shares of the Performance Trust Strategic Bond Fund (the “Fund”).
Returns shown do not reflect the deduction of taxes that a shareholder would pay on Fund distributions or the redemption of Fund shares. Returns shown include the reinvestment of all Fund distributions.
Performance data shown represents past performance. Past performance does not guarantee future results. The investment return and principal value of an investment will fluctuate so that an investor’s shares, when redeemed, may be worth more or less than their original cost. Current performance of the Fund may be lower or higher than the performance shown. Performance data current to the most recent month end may be obtained by calling 1 (877) 738-9095 or by visiting www.PTAM.com.
The expense ratio for Class C shares is 1.76% per the prospectus dated December 29, 2021. Please see the Financial Highlights in this report for the most recent expense ratio.
PERFORMANCE TRUST MUTUAL FUNDS (PTIAX, PTAOX, PTCOX, PTIMX, PTRMX, PTCRX)
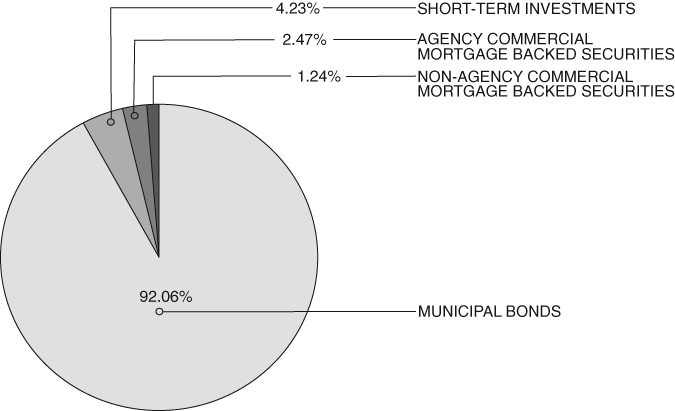
PERFORMANCE TRUST STRATEGIC BOND FUND (PTIAX, PTAOX, PTCOX)
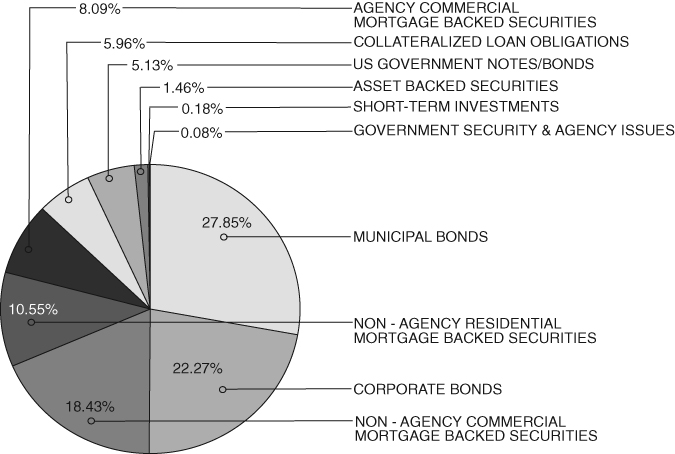
Allocation of Portfolio Holdings (% of Investments) (Unaudited)
As of August 31, 2022
PERFORMANCE TRUST MUTUAL FUNDS (PTIAX, PTAOX, PTCOX, PTIMX, PTRMX, PTCRX)
GROWTH OF PERFORMANCE TRUST MUNICIPAL BOND FUND (PTIMX)
Performance Trust Municipal Bond Fund – Institutional Class (Unaudited)
Total Return vs. Bloomberg Municipal Bond Index
Average Annual Returns—For the Periods Ended August 31, 2022 (Unaudited)
| | | | | | ANNUALIZED |
| | ONE | THREE | FIVE | TEN | SINCE INCEPTION |
| | YEAR | YEAR | YEAR | YEAR | (JUNE 30, 2011) |
| Performance Trust Municipal | | | | | |
| Bond Fund – Institutional Class | -10.96% | -1.43% | 1.20% | 2.78% | 4.06% |
| Bloomberg Municipal Bond Index | -8.63% | -0.83% | 1.28% | 2.25% | 3.03% |
The Bloomberg Municipal Bond Index is a rules based, market-value-weighted index engineered for the long-term tax-exempt bond market. The index tracks general obligation bonds, revenue bonds, insured bonds, and pre-refunded bonds rated Baa3/ BBB or higher by at least two of the ratings agencies: Moody’s, S&P and Fitch. The Bloomberg Municipal Bond Index was created in 1986, with index history backfilled to January 1, 1976. The chart at the top of the page assumes an initial gross investment of $10,000 made on August 31, 2012 for the Institutional Class shares of the Performance Trust Municipal Bond Fund (the “Fund”).
Returns shown do not reflect the deduction of taxes that a shareholder would pay on Fund distributions or the redemption of Fund shares. Returns shown include the reinvestment of all Fund distributions. Investment performance reflects fee waivers in effect. In the absence of such waivers, total returns would be reduced.
For a period of time following the Fund’s inception when the Fund’s asset levels were lower than current asset levels, the Fund’s investments in certain fixed-income instruments purchased in odd lot-sized transactions contributed positively to the Fund’s performance. As Fund asset levels increased, similar odd lot-sized transactions, if any, did not have the same relative impact on the Fund’s performance and are not anticipated to have the same relative impact on the Fund’s future performance.
Performance data shown represents past performance. Past performance does not guarantee future results. The investment return and principal value of an investment will fluctuate so that an investor’s shares, when redeemed, may be worth more or less than their original cost. Current performance of the Fund may be lower or higher than the performance shown. Performance data current to the most recent month end may be obtained by calling 1 (877) 738-9095 or by visiting www.PTAM.com.
The expense ratio for Institutional Class shares is 0.49% per the prospectus dated December 29, 2021. Please see the Financial Highlights in this report for the most recent expense ratio.
PERFORMANCE TRUST MUTUAL FUNDS (PTIAX, PTAOX, PTCOX, PTIMX, PTRMX, PTCRX)
GROWTH OF PERFORMANCE TRUST MUNICIPAL BOND FUND (PTRMX)
Performance Trust Municipal Bond Fund – Class A (Unaudited)
Total Return vs. Bloomberg Municipal Bond Index
| | (1) | Reflects 2.25% initial sales load. |
Average Annual Returns—For the Periods Ended August 31, 2022 (Unaudited)
| | | | | ANNUALIZED |
| | ONE | THREE | FIVE | SINCE INCEPTION |
| | YEAR | YEAR | YEAR | (SEPTEMBER 28, 2012) |
| Performance Trust Municipal Bond Fund – Class A | | | | |
| (with sales charge) | -13.18% | -2.42% | 0.50% | 2.25% |
| Performance Trust Municipal Bond Fund – Class A | | | | |
| (without sales charge) | -11.17% | -1.67% | 0.95% | 2.49% |
| Bloomberg Municipal Bond Index | -8.63% | -0.83% | 1.28% | 2.21% |
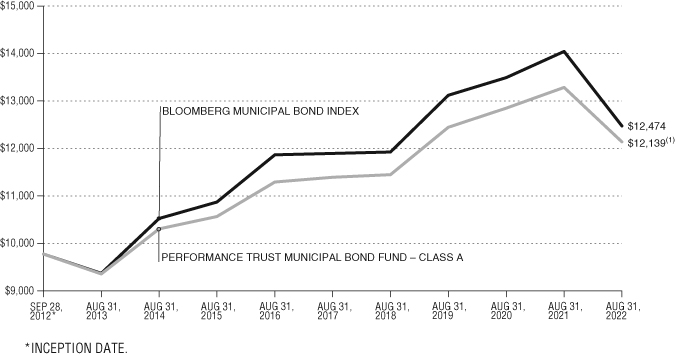
The Bloomberg Municipal Bond Index is a rules based, market-value-weighted index engineered for the long-term tax-exempt bond market. The index tracks general obligation bonds, revenue bonds, insured bonds, and pre-refunded bonds rated Baa3/ BBB or higher by at least two of the ratings agencies: Moody’s, S&P and Fitch. The Bloomberg Municipal Bond Index was created in 1986, with index history backfilled to January 1, 1976. The chart at the top of the page assumes an initial gross investment of $10,000 made on September 28, 2012, the inception date for the Class A shares of the Performance Trust Municipal Bond Fund (the “Fund”).
Returns shown do not reflect the deduction of taxes that a shareholder would pay on Fund distributions or the redemption of Fund shares. Returns shown include the reinvestment of all Fund distributions. Investment performance reflects fee waivers in effect. In the absence of such waivers, total returns would be reduced.
Performance data shown represents past performance. Past performance does not guarantee future results. The investment return and principal value of an investment will fluctuate so that an investor’s shares, when redeemed, may be worth more or less than their original cost. Current performance of the Fund may be lower or higher than the performance shown. Performance data current to the most recent month end may be obtained by calling 1 (877) 738-9095 or by visiting www.PTAM.com.
The expense ratio for Class A shares is 0.74% per the prospectus dated December 29, 2021. Please see the Financial Highlights in this report for the most recent expense ratio.
PERFORMANCE TRUST MUTUAL FUNDS (PTIAX, PTAOX, PTCOX, PTIMX, PTRMX, PTCRX)
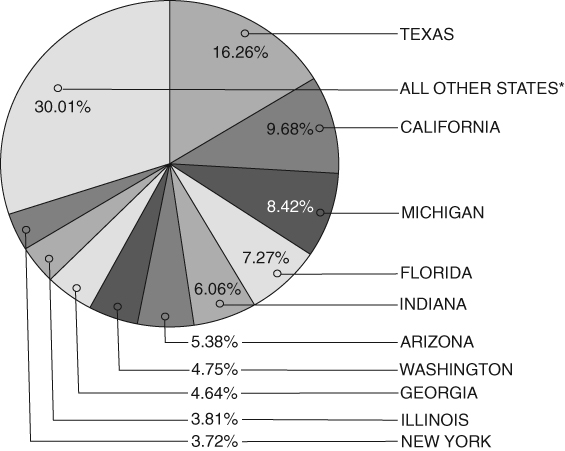
PERFORMANCE TRUST MUNICIPAL BOND FUND (PTIMX, PTRMX)
Allocation of Portfolio Holdings (% of Investments) (Unaudited)
As of August 31, 2022
| * | For additional details on allocation of portfolio assets by state, please see the Schedule of Investments. |
PERFORMANCE TRUST MUTUAL FUNDS (PTIAX, PTAOX, PTCOX, PTIMX, PTRMX, PTCRX)
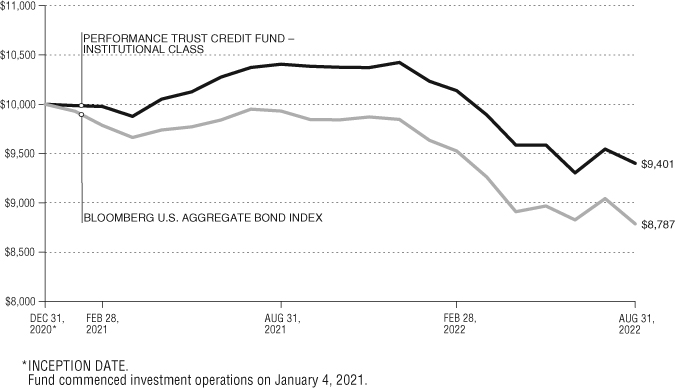
GROWTH OF PERFORMANCE TRUST CREDIT FUND (PTCRX)
Performance Trust Credit Fund – Institutional Class (Unaudited)
Total Return vs. Bloomberg U.S. Aggregate Bond Index
Returns—For the Periods Ended August 31, 2022 (Unaudited)
| | | ANNUALIZED |
| | ONE | SINCE INCEPTION |
| | YEAR | (DECEMBER 31, 2020)(1) |
| Performance Trust Credit Fund – Institutional Class | -9.66% | -3.64% |
| Bloomberg U.S. Aggregate Bond Index | -11.52% | -7.47% |
(1) | The Performance Trust Credit Fund (the “Fund”) commenced investment operations on January 4, 2021. |
The Bloomberg U.S. Aggregate Bond Index is a broad-based benchmark that measures the investment grade, Capital dollar denominated, fixed-rate taxable bond market, including Treasuries, government-related and corporate securities, Mortgage-Backed Securities (agency fixed-rate and hybrid Adjustable-Rate Mortgage Passthroughs), Asset-Backed Securities, and Commercial Mortgage-Backed Securities. The Bloomberg U.S. Aggregate Bond Index was created in 1986, with index history backfilled to January 1, 1976. The chart at the top of the page assumes an initial gross investment of $10,000 made on December 31, 2020, the inception date for Institutional Class shares of the Fund.
Returns shown do not reflect the deduction of taxes that a shareholder would pay on Fund distributions or the redemption of Fund shares. Returns shown include the reinvestment of all Fund distributions. Investment performance reflects fee waivers in effect. In the absence of such waivers, total returns would be reduced.
Performance data shown represents past performance. Past performance does not guarantee future results. The investment return and principal value of an investment will fluctuate so that an investor’s shares, when redeemed, may be worth more or less than their original cost. Current performance of the Fund may be lower or higher than the performance shown. Performance data current to the most recent month end may be obtained by calling 1 (877) 738-9095 or by visiting www.PTAM.com.
The Fund’s investment adviser, PT Asset Management, LLC, has contractually agreed to waive its fees and/or pay for operating expenses of the Fund to ensure that total annual fund operating expenses (excluding any front-end or contingent deferred loads, Rule 12b-1 plan fees, shareholder servicing plan fees, taxes, leverage, interest, brokerage commissions and other transactional expenses, expenses incurred in connection with any merger or reorganization, dividends or interest on short positions, acquired fund fees and expenses or extraordinary expenses such as litigation expenses) do not exceed 0.99% of the average daily net assets of the Fund. This agreement is effective at least through December 31, 2023.
The net expense ratio for Institutional Class shares is 0.99% per the prospectus dated December 29, 2021. Please see the Financial Highlights in this report for the most recent expense ratio.
PERFORMANCE TRUST MUTUAL FUNDS (PTIAX, PTAOX, PTCOX, PTIMX, PTRMX, PTCRX)
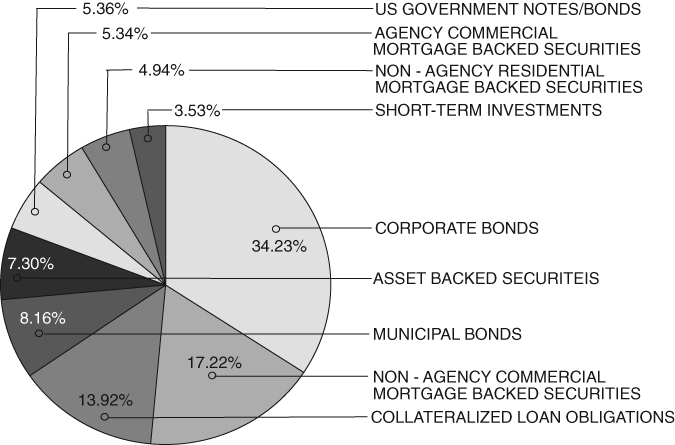
PERFORMANCE TRUST CREDIT FUND (PTCRX)
Allocation of Portfolio Holdings (% of Investments) (Unaudited)
As of August 31, 2022
PERFORMANCE TRUST MUTUAL FUNDS (PTIAX, PTAOX, PTCOX, PTIMX, PTRMX, PTCRX)
(This Page Intentionally Left Blank.)
PERFORMANCE TRUST MUTUAL FUNDS (PTIAX, PTAOX, PTCOX, PTIMX, PTRMX, PTCRX)
STATEMENTS OF ASSETS AND LIABILITIES
August 31, 2022
| | | Performance Trust | | | Performance Trust | | | | |
| | | Strategic | | | Municipal | | | Performance Trust | |
| | | Bond Fund | | | Bond Fund | | | Credit Fund | |
| Assets | | | | | | | | | |
Investments, at value (cost $6,264,324,841, | | | | | | | | | |
$780,965,224 and $87,678,933, respectively) | | $ | 5,519,501,022 | | | $ | 750,545,680 | | | $ | 82,632,015 | |
Dividend and interest receivable | | | 50,605,296 | | | | 6,347,001 | | | | 683,729 | |
Receivable for investments sold | | | 44,624,713 | | | | 4,353,924 | | | | 1,002,305 | |
Receivable for Fund shares sold | | | 19,659,938 | | | | 1,956,413 | | | | 205,562 | |
Other assets | | | 102,934 | | | | 29,370 | | | | 9,227 | |
| Total Assets | | | 5,634,493,903 | | | | 763,232,388 | | | | 84,532,838 | |
| | | | | | | | | | | | | |
| Liabilities | | | | | | | | | | | | |
Payable for investments purchased | | | 45,782,710 | | | | 46,034,290 | | | | 2,353,993 | |
Payable for Fund shares redeemed | | | 39,554,550 | | | | 1,003,689 | | | | 97,582 | |
Payable to Adviser | | | 1,814,620 | | | | 134,447 | | | | 25,214 | |
Payable to affiliates | | | 523,062 | | | | 78,056 | | | | 11,149 | |
Payable for distribution fees | | | 36,901 | | | | 9,920 | | | | — | |
Payable for shareholder servicing fees | | | 19,817 | | | | — | | | | — | |
Accrued expenses and other liabilities | | | 456,219 | | | | 34,226 | | | | 29,819 | |
| Total Liabilities | | | 88,187,879 | | | | 47,294,628 | | | | 2,517,757 | |
| | | | | | | | | | | | | |
| Net Assets | | | 5,546,306,024 | | | | 715,937,760 | | | | 82,015,081 | |
| | | | | | | | | | | | | |
| Net Assets Consist Of: | | | | | | | | | | | | |
Paid-in capital | | $ | 6,420,076,852 | | | $ | 796,786,486 | | | $ | 87,281,278 | |
Total accumulated loss | | | (873,770,828 | ) | | | (80,848,726 | ) | | | (5,266,197 | ) |
| Net Assets | | $ | 5,546,306,024 | | | $ | 715,937,760 | | | $ | 82,015,081 | |
The accompanying notes are an integral part of these financial statements.
PERFORMANCE TRUST MUTUAL FUNDS (PTIAX, PTAOX, PTCOX, PTIMX, PTRMX, PTCRX)
STATEMENTS OF ASSETS AND LIABILITIES (CONT.)
August 31, 2022
| | | Performance Trust | | | Performance Trust | | | | |
| | | Strategic | | | Municipal | | | Performance Trust | |
| | | Bond Fund | | | Bond Fund | | | Credit Fund | |
| Strategic Bond Fund, Municipal Bond Fund | | | | | | | | | |
| and Credit Fund Shares – Institutional Class | | | | | | | | | |
Net assets | | $ | 5,466,749,689 | | | $ | 670,094,646 | | | $ | 82,015,081 | |
Shares of beneficial interest outstanding (unlimited | | | | | | | | | | | | |
number of shares authorized, $0.001 par value) | | | 274,837,881 | | | | 29,579,635 | | | | 9,401,065 | |
Net asset value, redemption | | | | | | | | | | | | |
and offering price per share | | $ | 19.89 | | | $ | 22.65 | | | $ | 8.72 | |
| | | | | | | | | | | | | |
| Strategic Bond Fund and Municipal | | | | | | | | | | | | |
| Bond Fund Shares – Class A | | | | | | | | | | | | |
Net assets | | $ | 32,475,648 | | | $ | 45,843,114 | | | | | |
Shares of beneficial interest outstanding (unlimited | | | | | | | | | | | | |
number of shares authorized, $0.001 par value) | | | 1,632,646 | | | | 2,022,171 | | | | | |
Net asset value, redemption | | | | | | | | | | | | |
and offering price per share | | $ | 19.89 | | | $ | 22.67 | | | | | |
Maximum offering price per share | | | | | | | | | | | | |
(Net asset value per share divided by 0.9775)(1) | | $ | 20.35 | | | $ | 23.19 | | | | | |
| | | | | | | | | | | | | |
| Strategic Bond Fund Shares – Class C | | | | | | | | | | | | |
Net assets | | $ | 47,080,687 | | | | | | | | | |
Shares of beneficial interest outstanding (unlimited | | | | | | | | | | | | |
number of shares authorized, $0.001 par value) | | | 2,376,540 | | | | | | | | | |
Net asset value, redemption | | | | | | | | | | | | |
and offering price per share | | $ | 19.81 | | | | | | | | | |
| | | | | | | | | | | | | |
| (1) | Reflects a maximum sales charge of 2.25%. |
The accompanying notes are an integral part of these financial statements.
PERFORMANCE TRUST MUTUAL FUNDS (PTIAX, PTAOX, PTCOX, PTIMX, PTRMX, PTCRX)
PERFORMANCE TRUST STRATEGIC BOND FUND — SCHEDULE OF INVESTMENTS
August 31, 2022
| | PRINCIPAL | | | |
| | AMOUNT | | VALUE | |
| ASSET BACKED SECURITIES – 1.45% | | | | |
| | | | | |
| American Credit Acceptance | | | | |
| Receivables Trust | | | | |
| 2021-4, 1.320%, 02/14/2028 (a) | $ | 1,085,000 | | $ | 1,039,337 | |
| 2022-2, 4.410%, 06/13/2028 (a) | | 4,400,000 | | | 4,297,142 | |
| 2022-3, 4.860%, 10/13/2028 (a) | | 4,000,000 | | | 3,985,748 | |
| | | | | | | |
| Exeter Automobile | | | | | | |
| Receivables Trust | | | | | | |
| 2022-2A, 3.650%, 10/15/2026 | | 9,500,000 | | | 9,329,743 | |
| 2022-4A, 4.920%, 12/15/2028 | | 4,000,000 | | | 3,982,820 | |
| | | | | | | |
| First Investors Auto Owner Trust | | | | | | |
| 2021-1A, 1.170%, 03/15/2027 (a) | | 1,795,000 | | | 1,695,359 | |
| 2022-1A, 3.130%, 05/15/2028 (a) | | 5,000,000 | | | 4,734,868 | |
| | | | | | | |
| Flagship Credit Auto Trust | | | | | | |
| 2022-3, 0.000%, 04/15/2027 (a) | | 7,000,000 | | | 6,973,122 | |
| | | | | | | |
| GLS Auto Receivables | | | | | | |
| Issuer Trust | | | | | | |
| 2021-4A, 1.940%, 10/15/2027 (a) | | 8,650,000 | | | 8,115,644 | |
| | | | | | | |
| Honda Auto Receivables | | | | | | |
| Owner Trust | | | | | | |
| 2022-2, 3.810%, 03/18/2025 | | 4,225,000 | | | 4,216,331 | |
| 2022-2, 3.730%, 07/20/2026 | | 4,125,000 | | | 4,103,386 | |
| | | | | | | |
| New Residential Advance | | | | | | |
| Receivables Trust | | | | | | |
| 2020-T1, 2.269%, 08/15/2053 (a) | | 1,700,000 | | | 1,619,460 | |
| 2020-T1, 3.011%, 08/15/2053 (a) | | 4,400,000 | | | 4,186,696 | |
| | | | | | | |
| Santander Drive Auto | | | | | | |
| Receivables Trust | | | | | | |
| 2022-2, 3.440%, 09/15/2027 | | 10,000,000 | | | 9,803,013 | |
| 2022-5, 4.740%, 10/16/2028 | | 7,500,000 | | | 7,469,497 | |
| 2022-2, 3.760%, 07/16/2029 | | 5,000,000 | | | 4,857,959 | |
| TOTAL ASSET BACKED | | | | | | |
| SECURITIES (Cost $82,301,231) | | | | | 80,410,125 | |
| | | | | | | |
| COLLATERALIZED LOAN | | | | | | |
| OBLIGATIONS – 5.94% | | | | | | |
| | | | | | | |
| Apidos CLO XI | | | | | | |
| | 2012-11A, 6.49% | | | | | | |
| (3 Month LIBOR USD + 3.750%), | | | | | | |
| 04/17/2034 (a)(b)(c) | | 1,500,000 | | | 1,446,957 | |
| | | | | | | |
| Apidos CLO XII | | | | | | |
| | 2013-12A, 7.912% | | | | | | |
| (3 Month LIBOR USD + 5.400%), | | | | | | |
| 04/15/2031 (a)(b)(c) | | 6,150,000 | | | 5,203,872 | |
| | | | | | | |
| Apidos CLO XV | | | | | | |
| | 2013-15A, 4.260% | | | | | | |
| (3 Month LIBOR USD + 1.550%), | | | | | | |
| 04/20/2031 (a)(b)(c) | | 4,000,000 | | | 3,889,124 | |
| | 2013-15A, 4.560% | | | | | | |
| (3 Month LIBOR USD + 1.850%), | | | | | | |
| 04/20/2031 (a)(b)(c) |
| 5,000,000 | | | 4,707,225 | |
| | 2013-15A, 8.410% | | | | | | |
| (3 Month LIBOR USD + 5.700%), | | | | | | |
| 04/20/2031 (a)(b)(c) | | 3,843,000 | | | 3,398,730 | |
| | | | | | | |
| Apidos CLO XX | | | | | | |
| | 2015-20A, 4.690% | | | | | | |
| (3 Month LIBOR USD + 1.950%), | | | | | | |
| 07/16/2031 (a)(b)(c) | | 1,250,000 | | | 1,196,836 | |
| | | | | | | |
| Apidos CLO XXIII | | | | | | |
| | 2015-23A, 4.112% | | | | | | |
| (3 Month LIBOR USD + 1.600%), | | | | | | |
| 04/15/2033 (a)(b)(c) | | 6,500,000 | | | 6,292,097 | |
| | | | | | | |
| Apidos CLO XXIV | | | | | | |
| | 2016-24A, 8.510 | | | | | | |
(3 Month LIBOR USD + 5.800%), | | | | | | |
10/20/2030 (a)(b)(c) | | 2,550,000 | | | 2,220,882 | |
| | | | | | | |
| Apidos CLO XXIX | | | | | | |
| | 2018-29A, 4.683 | | | | | | |
(3 Month LIBOR USD + 1.900%), | | | | | | |
07/25/2030 (a)(b)(c) | | 7,600,000 | | | 7,148,659 | |
| | 2018-29A, 5.533% | | | | | | |
| (3 Month LIBOR USD + 2.750%), | | | | | | |
| 07/25/2030 (a)(b)(c) | | 6,250,000 | | | 5,697,869 | |
| | | | | | | |
| Apidos CLO XXVIII | | | | | | |
| | 2017-28A, 3.860 | | | | | | |
| (3 Month LIBOR USD + 1.150%), | | | | | | |
| 01/20/2031 (a)(b)(c) | | 2,000,000 | | | 1,936,392 | |
| Apidos CLO XXX | | | | | | |
XXXA, 4.740% | | | | | | |
| (3 Month LIBOR USD + 2.000%), | | | | | | |
| 10/18/2031 (a)(b)(c) | | 3,100,000 | | | 2,940,998 | |
| | | | | | | |
| Ares XLII CLO Ltd. | | | | | | |
| | 2017-42A, 6.209% | | | | | | |
| (3 Month LIBOR USD + 3.450%), | | | | | | |
| 01/22/2028 (a)(b)(c) | | 2,300,000 | | | 2,188,728 | |
| | | | | | | |
| Ares XLVI CLO Ltd. | | | | | | |
| | 2017-46A, 3.570%, | | | | | | |
01/15/2030 (a)(c) | | 3,600,000 | | | 3,357,421 | |
| | 2017-46A, 4.212% | | | | | | |
| (3 Month LIBOR USD + 1.700%), | | | | | | |
| 01/15/2030 (a)(b)(c) | | 1,436,843 | | | 1,357,165 | |
| | | | | | | |
| Ares XLVII CLO Ltd. | | | | | | |
| | 2018-47A, 5.212% | | | | | | |
| (3 Month LIBOR USD + 2.700%), | | | | | | |
| 04/15/2030 (a)(b)(c) | | 1,915,000 | | | 1,730,180 | |
Percentages are stated as a percent of net assets.The accompanying notes are an integral part of these financial statements.
PERFORMANCE TRUST MUTUAL FUNDS (PTIAX, PTAOX, PTCOX, PTIMX, PTRMX, PTCRX)
PERFORMANCE TRUST STRATEGIC BOND FUND — SCHEDULE OF INVESTMENTS (CONT.)
August 31, 2022
| | PRINCIPAL | | | |
| | AMOUNT | | VALUE | |
| | | | | |
| Ares XXXIR CLO Ltd. | | | | |
| | 2014-31A, 4.580 | | | | |
| (3 Month LIBOR USD + 1.600%), | | | | |
| 05/24/2030 (a)(b)(c) | $ | 3,000,000 | | $ | 2,885,613 | |
| | | | | | | |
| Ares XXXIX CLO Ltd. | | | | | | |
| | 2016-39A, 6.090% | | | | | | |
| (3 Month LIBOR USD + 3.350%), | | | | | | |
| 04/18/2031 (a)(b)(c) | | 7,335,000 | | | 6,793,824 | |
| | | | | | | |
| Ares XXXVIII CLO Ltd. | | | | | | |
| | 2015-38A, 5.210% | | | | | | |
| (3 Month LIBOR USD + 2.500%), | | | | | | |
| 04/20/2030 (a)(b)(c) | | 7,450,000 | | | 6,662,192 | |
| | | | | | | |
| BCRED MML CLO, LLC | | | | | | |
2022-1A, 3.345% (TSFR3M + 2.750%), | | | | | | |
| 04/20/2035 (a)(b) | | 2,000,000 | | | 1,871,988 | |
| | | | | | | |
| Betony CLO 2 Ltd. | | | | | | |
| | 2018-1A, 4.632% | | | | | | |
(3 Month LIBOR USD + 1.850%), | | | | | | |
04/30/2031 (a)(b)(c) | | 1,200,000 | | | 1,139,284 | |
| | | | | | | |
| BlueMountain CLO Ltd. | | | | | | |
| | 2018-1A, 4.482% | | | | | | |
| (3 Month LIBOR USD + 1.700%), | | | | | | |
| 07/30/2030 (a)(b)(c) | | 6,996,770 | | | 6,756,361 | |
| | 2014-2A, 4.460% | | | | | | |
| (3 Month LIBOR USD + 1.750%), | | | | | | |
| 10/20/2030 (a)(b)(c) | | 5,500,000 | | | 5,301,719 | |
| | | | | | | |
| Burnham Park CLO Ltd. | | | | | | |
| | 2016-1A, 4.860% | | | | | | |
| (3 Month LIBOR USD + 2.150%), | | | | | | |
| 10/20/2029 (a)(b)(c) | | 5,250,000 | | | 5,096,605 | |
| | | | | | | |
| Buttermilk Park CLO Ltd. | | | | | | |
| | 2018-1A, 5.612% | | | | | | |
| (3 Month LIBOR USD + 3.100%), | | | | | | |
| 10/15/2031 (a)(b)(c) | | 1,000,000 | | | 938,132 | |
| | | | | | | |
| Catskill Park CLO Ltd. | | | | | | |
| | 2017-1A, 6.410% | | | | | | |
| (3 Month LIBOR USD + 3.700%), | | | | | | |
| 04/20/2029 (a)(b)(c) | | 3,500,000 | | | 3,382,533 | |
| | 2017-1A, 8.710% | | | | | | |
| (3 Month LIBOR USD + 6.000%), | | | | | | |
| 04/20/2029 (a)(b)(c) | | 1,250,000 | | | 1,115,001 | |
| | | | | | | |
| Chenango Park CLO Ltd. | | | | | | |
| | 2018-1A, 5.512% | | | | | | |
| (3 Month LIBOR USD + 3.000%), | | | | | | |
| 04/15/2030 (a)(b)(c) | | 1,000,000 | | | 930,370 | |
| | | | | | | |
| CIFC Funding Ltd. | | | | | | |
| | 2017-3A, 4.510% | | | | | | |
| (3 Month LIBOR USD + 1.800%), | | | | | | |
| 07/20/2030 (a)(b)(c) | | 2,100,000 | | | 2,058,454 | |
| | 2018-1A, 4.490% | | | | | | |
| (3 Month LIBOR USD + 1.750%), | | | | | | |
| 04/18/2031 (a)(b)(c) |
| 3,750,000 | |
| 3,544,481 | |
| | | | | | | |
| Gilbert Park CLO Ltd. | | | | | | |
| | 2017-1A, 5.462 | | | | | | |
| (3 Month LIBOR USD + 2.950%), | | | | | | |
| 10/15/2030 (a)(b)(c) | | 8,475,000 | | | 7,990,484 | |
| | | | | | | |
| Goldentree Loan | | | | | | |
| Management US CLO 2 Ltd. | | | | | | |
| | 2017-2A, 7.410% | | | | | | |
| (3 Month LIBOR USD + 4.700%), | | | | | | |
| 11/28/2030 (a)(b)(c) | | 5,519,000 | | | 4,759,310 | |
| | | | | | | |
| Goldentree Loan | | | | | | |
| Management US CLO 4 Ltd. | | | | | | |
| | 2019-4A, 7.533% | | | | | | |
| (3 Month LIBOR USD + 4.750%), | | | | | | |
| 04/24/2031 (a)(b)(c) | | 8,150,000 | | | 6,933,564 | |
| | | | | | | |
| Goldentree Loan | | | | | | |
| Management US CLO 5 Ltd. | | | | | | |
| | 2019-5A, 7.560% | | | | | | |
| (3 Month LIBOR USD + 4.850%), | | | | | | |
| 10/20/2032 (a)(b)(c) | | 7,500,000 | | | 6,376,357 | |
| | | | | | | |
| Goldentree Loan | | | | | | |
| Opportunities X Ltd. | | | | | | |
| | 2015-10A, 5.760% | | | | | | |
| (3 Month LIBOR USD + 3.050%), | | | | | | |
| 07/20/2031 (a)(b)(c) | | 4,000,000 | | | 3,796,888 | |
| | | | | | | |
| Goldentree Loan | | | | | | |
| Opportunities XI Ltd. | | | | | | |
| | 2015-11A, 5.140% | | | | | | |
| (3 Month LIBOR USD + 2.400%), | | | | | | |
| 01/18/2031 (a)(b)(c) | | 2,250,000 | | | 2,108,205 | |
| | 2015-11A, 8.140% | | | | | | |
| (3 Month LIBOR USD + 5.400%), | | | | | | |
| 01/18/2031 (a)(b)(c) | | 3,750,000 | | | 3,305,310 | |
| | | | | | | |
| GoldentTree Loan | | | | | | |
| Management US CLO 1 Ltd. | | | | | | |
| | 2021-9A, 7.460% | | | | | | |
| (3 Month LIBOR USD + 4.750%), | | | | | | |
| 01/20/2033 (a)(b)(c) | | 6,500,000 | | | 5,518,025 | |
| | | | | | | |
| Golub Capital BDC 3 CLO 1, LLC | | | | | | |
| | 2021-1A, 5.312% | | | | | | |
| (3 Month LIBOR USD + 2.800%), | | | | | | |
| 04/15/2033 (a)(b)(c) | | 7,000,000 | | | 6,597,717 | |
| | | | | | | |
| Greenwood Park CLO Ltd. | | | | | | |
| | 2018-1A, 7.462% | | | | | | |
| (3 Month LIBOR USD + 4.950%), | | | | | | |
| 04/15/2031 (a)(b)(c) | | 3,250,000 | | | 2,796,706 | |
Percentages are stated as a percent of net assets.The accompanying notes are an integral part of these financial statements.
PERFORMANCE TRUST MUTUAL FUNDS (PTIAX, PTAOX, PTCOX, PTIMX, PTRMX, PTCRX)
PERFORMANCE TRUST STRATEGIC BOND FUND — SCHEDULE OF INVESTMENTS (CONT.)
August 31, 2022
| PRINCIPAL | | | |
| | AMOUNT | | VALUE | |
| | | | | |
| Grippen Park CLO Ltd. | | | | |
| | 2017-1A, 6.010% | | | | |
| (3 Month LIBOR USD + 3.300%), | | | | |
| 01/20/2030 (a)(b)(c) | $ | 7,550,000 | | $ | 7,140,443 | |
| | 2017-1A, 8.410% | | | | | | |
| (3 Month LIBOR USD + 5.700%), | | | | | | |
| 01/20/2030 (a)(b)(c) | | 1,150,000 | | | 1,035,579 | |
| | | | | | | |
| Jay Park CLO Ltd. | | | | | | |
| | 2016-1A, 5.360% | | | | | | |
| (3 Month LIBOR USD + 2.650%), | | | | | | |
| 10/20/2027 (a)(b)(c) | | 1,124,000 | | | 1,076,668 | |
| | | | | | | |
| LCM 26 Ltd. | | | | | | |
| | 26A, 5.210% | | | | | | |
| (3 Month LIBOR USD + 2.500%), | | | | | | |
| 01/20/2031 (a)(b)(c) | | 1,000,000 | | | 856,868 | |
| | 26A, 8.010% | | | | | | |
| (3 Month LIBOR USD + 5.300%), | | | | | | |
| 01/20/2031 (a)(b)(c) | | 4,000,000 | | | 3,211,988 | |
| | | | | | | |
| LCM 29 Ltd. | | | | | | |
| | 29A, 4.112% | | | | | | |
| (3 Month LIBOR USD + 1.600%), | | | | | | |
| 04/15/2031 (a)(b)(c) | | 4,750,000 | | | 4,572,397 | |
| | | | | | | |
| LCM 34 Ltd. | | | | | | |
| | 34A, 9.250% | | | | | | |
| (3 Month LIBOR USD + 6.540%), | | | | | | |
| 10/20/2034 (a)(b)(c) | | 3,250,000 | | | 2,828,677 | |
| | | | | | | |
| LCM 35 Ltd. | | | | | | |
| | 35A, 9.122% | | | | | | |
(3 Month LIBOR USD + 6.610%), | | | | | | |
10/15/2034 (a)(b)(c) | | 4,750,000 | | | 4,161,912 | |
| | | | | | | |
| LCM 36 Ltd. | | | | | | |
| | 36A, 9.222% | | | | | | |
| (3 Month LIBOR USD + 6.710%), | | | | | | |
| 01/15/2034 (a)(b)(c) | | 6,000,000 | | | 5,278,644 | |
| | | | | | | |
| LCM Loan Income Fund I | | | | | | |
| Income Note Issuer Ltd. | | | | | | |
| | 27A, 4.690% | | | | | | |
| (3 Month LIBOR USD + 1.950%), | | | | | | |
| 07/16/2031 (a)(b)(c) | | 2,700,000 | | | 2,532,314 | |
| | 27A, 5.690% | | | | | | |
| (3 Month LIBOR USD + 2.950%), | | | | | | |
| 07/16/2031 (a)(b)(c) | | 4,000,000 | | | 3,490,316 | |
| | 27A, 8.340% | | | | | | |
| (3 Month LIBOR USD + 5.600%), | | | | | | |
| 07/16/2031 (a)(b)(c) | | 2,000,000 | | | 1,499,624 | |
| | | | | | | |
| LCM XIV LP | | | | | | |
| | 14A, 4.290% | | | | | | |
| (3 Month LIBOR USD + 1.580%), | | | | | | |
| 07/20/2031 (a)(b)(c) | | 10,800,000 | | | 10,466,334 | |
| | 14A, 4.560% | | | | | | |
| (3 Month LIBOR USD + 1.850%), | | | | | | |
| 07/20/2031 (a)(b)(c) |
| 6,000,000 | | | 5,592,714 | |
| | 14A, 8.210% | | | | | | |
| (3 Month LIBOR USD + 5.500%), | | | | | | |
| 07/20/2031 (a)(b)(c) | | 1,000,000 | | | 730,291 | |
| | | | | | | |
| LCM XV LP | | | | | | |
| | 15A, 6.410% | | | | | | |
| (3 Month LIBOR USD + 3.700%), | | | | | | |
| 07/20/2030 (a)(b)(c) | | 9,000,000 | | | 8,307,189 | |
| | | | | | | |
| LCM XVI LP | | | | | | |
| | 16A, 4.262% | | | | | | |
| (3 Month LIBOR USD + 1.750%), | | | | | | |
| 10/15/2031 (a)(b)(c) | | 4,000,000 | | | 3,895,360 | |
| | 16A, 4.662% | | | | | | |
| (3 Month LIBOR USD + 2.150%), | | | | | | |
| 10/15/2031 (a)(b)(c) | | 5,100,000 | | | 4,811,457 | |
| | 16A, 8.892% | | | | | | |
| (3 Month LIBOR USD + 6.380%), | | | | | | |
| 10/15/2031 (a)(b)(c) | | 1,600,000 | | | 1,298,373 | |
| | | | | | | |
| LCM XVII LP | | | | | | |
| | 17A, 8.512 | | | | | | |
| (3 Month LIBOR USD + 6.000%), | | | | | | |
| 10/15/2031 (a)(b)(c) | | 1,000,000 | | | 761,114 | |
| | | | | | | |
| LCM XVIII LP | | | | | | |
| | 19A, 4.262% | | | | | | |
| (3 Month LIBOR USD + 1.750%), | | | | | | |
| 07/15/2027 (a)(b)(c) | | 2,500,000 | | | 2,476,720 | |
| | 19A, 5.212% | | | | | | |
| (3 Month LIBOR USD + 2.700%), | | | | | | |
| 07/15/2027 (a)(b)(c) | | 4,000,000 | | | 3,970,284 | |
| | 18A, 8.660% | | | | | | |
| (3 Month LIBOR USD + 5.950%), | | | | | | |
| 04/20/2031 (a)(b)(c) | | 5,300,000 | | | 4,058,136 | |
| | | | | | | |
| LCM XXII Ltd. | | | | | | |
| | 22A, 5.510% | | | | | | |
| (3 Month LIBOR USD + 2.800%), | | | | | | |
| 10/20/2028 (a)(b)(c) | | 2,000,000 | | | 1,791,814 | |
| | | | | | | |
| LCM XXV Ltd. | | | | | | |
| | 25A, 6.160% | | | | | | |
| (3 Month LIBOR USD + 3.450%), | | | | | | |
| 07/20/2030 (a)(b)(c) | | 4,000,000 | | | 3,506,568 | |
| | | | | | | |
| Long Point Park CLO Ltd. | | | | | | |
| | 2017-1A, 5.140% | | | | | | |
| (3 Month LIBOR USD + 2.400%), | | | | | | |
| 01/17/2030 (a)(b)(c) | | 4,000,000 | | | 3,693,160 | |
| | 2017-1A, 8.340% | | | | | | |
| (3 Month LIBOR USD + 5.600%), | | | | | | |
| 01/17/2030 (a)(b)(c) | | 2,000,000 | | | 1,755,180 | |
Percentages are stated as a percent of net assets.The accompanying notes are an integral part of these financial statements.
PERFORMANCE TRUST MUTUAL FUNDS (PTIAX, PTAOX, PTCOX, PTIMX, PTRMX, PTCRX)
PERFORMANCE TRUST STRATEGIC BOND FUND — SCHEDULE OF INVESTMENTS (CONT.)
August 31, 2022
| | PRINCIPAL | | | |
| | AMOUNT | | VALUE | |
| | | | | |
| Magnetite VIII Ltd. | | | | |
| | 2014-8A, 5.412% | | | | |
| (3 Month LIBOR USD + 2.900%), | | | | |
| 04/15/2031 (a)(b)(c) | $ | 10,150,000 | | $ | 9,669,479 | |
| | | | | | | |
| Magnetite XII Ltd. | | | | | | |
| | 2015-12A, 8.192% | | | | | | |
| (3 Month LIBOR USD + 5.680%), | | | | | | |
| 10/15/2031 (a)(b)(c) | | 8,923,000 | | | 8,049,224 | |
| | | | | | | |
| Magnetite XIV-R Ltd. | | | | | | |
2015-14RA, 5.590% | | | | | | |
| (3 Month LIBOR USD + 2.850%), | | | | | | |
| 10/18/2031 (a)(b)(c) | | 1,500,000 | | | 1,428,774 | |
| | | | | | | |
| Magnetite XV Ltd. | | | | | | |
| | 2015-15A, 5.533% | | | | | | |
| (3 Month LIBOR USD + 2.750%), | | | | | | |
| 07/25/2031 (a)(b)(c) | | 2,000,000 | | | 1,882,958 | |
| | | | | | | |
| Magnetite XVIII Ltd. | | | | | | |
| | 2016-18A, 5.605% | | | | | | |
| (3 Month LIBOR USD + 2.700%), | | | | | | |
| 11/15/2028 (a)(b)(c) | | 10,315,000 | | | 9,825,141 | |
| | | | | | | |
| Magnetite XXIII Ltd. | | | | | | |
| | 2019-23A, 9.083% | | | | | | |
| (3 Month LIBOR USD + 6.300%), | | | | | | |
| 01/25/2035 (a)(b)(c) | | 2,750,000 | | | 2,549,553 | |
| | | | | | | |
| Magnetite XXVII Ltd. | | | | | | |
| | 2020-27A, 8.710% | | | | | | |
| (3 Month LIBOR USD + 6.000%), | | | | | | |
| 10/20/2034 (a)(b)(c) | | 5,250,000 | | | 4,787,097 | |
| | | | | | | |
| Magnetite XXVIII Ltd. | | | | | | |
| | 2020-28A, 8.860% | | | | | | |
| (3 Month LIBOR USD + 6.150%), | | | | | | |
| 01/20/2035 (a)(b)(c) | | 2,250,000 | | | 2,067,140 | |
| | | | | | | |
| Magnetite XXX Ltd. | | | | | | |
| | 2021-30A, 8.983% | | | | | | |
| (3 Month LIBOR USD + 6.200%), | | | | | | |
| 10/25/2034 (a)(b)(c) | | 4,100,000 | | | 3,782,008 | |
| | | | | | | |
| Mountain View CLO XV Ltd. | | | | | | |
| | 2019-2A, 4.412% | | | | | | |
| (3 Month LIBOR USD + 1.900%), | | | | | | |
| 01/15/2033 (a)(b)(c) | | 3,000,000 | | | 2,930,274 | |
| | | | | | | |
| Neuberger Berman CLO XXI Ltd. | | | | | | |
| | 2016-21A, 6.010% | | | | | | |
| (3 Month LIBOR USD + 3.300%), | | | | | | |
| 04/20/2034 (a)(b)(c) | | 2,500,000 | | | 2,384,740 | |
| | | | | | | |
| Neuberger Berman Loan | | | | | | |
| Advisers CLO 33 Ltd. | | | | | | |
| | 2019-33A, 5.640% | | | | | | |
| (3 Month LIBOR USD + 2.900%), | | | | | | |
| 10/16/2033 (a)(b)(c) | | 2,000,000 | | | 1,872,310 | |
| | | | | | | | |
| Neuberger Berman Loan | | | | | | |
| Advisers CLO 35 Ltd. | | | | | | |
| | 2019-35A, 6.438% | | | | | | |
| (3 Month LIBOR USD + 3.700%), | | | | | | |
| 01/19/2033 (a)(b)(c) |
| 6,971,955 | | | 6,691,069 | |
| | | | | | | |
| Niagara Park CLO Ltd. | | | | | | |
| | 2019-1A, 8.690% | | | | | | |
| (3 Month LIBOR USD + 5.950%), | | | | | | |
| 07/17/2032 (a)(b)(c) | | 2,000,000 | | | 1,838,004 | |
| | | | | | | |
| Octagon Investment | | | | | | |
| Partners 26 Ltd. | | | | | | |
| | 2016-1A, 4.312% | | | | | | |
| (3 Month LIBOR USD + 1.800%), | | | | | | |
| 07/15/2030 (a)(b)(c) | | 6,220,000 | | | 5,804,560 | |
| | | | | | | |
| Webster Park CLO Ltd. | | | | | | |
| | 2015-1A, 4.510% | | | | | | |
| (3 Month LIBOR USD + 1.800%), | | | | | | |
| 07/20/2030 (a)(b)(c) | | 10,300,000 | | | 9,698,810 | |
| | 2015-1A, 5.610% | | | | | | |
| (3 Month LIBOR USD + 2.900%), | | | | | | |
| 07/20/2030 (a)(b)(c) | | 4,800,000 | | | 4,538,712 | |
| | | | | | | |
| Whetstone Park CLO Ltd. | | | | | | |
| | 2021-1A, 2.790%, | | | | | | |
| 01/20/2035 (a)(c) | | 1,400,000 | | | 1,208,498 | |
| | | | | | | |
| TOTAL COLLATERALIZED LOAN | | | | | | |
| OBLIGATIONS (Cost $349,087,258) | | | | | 329,180,733 | |
| | | | | | | | |
| CORPORATE BONDS – 22.17% | | | | | | |
| | | | | | | |
| Aerospace & Defense – 0.49% | | | | | | |
| | | | | | | |
| Howmet Aerospace, Inc. | | | | | | |
| 5.900%, 02/01/2027 | | 6,826,000 | | | 6,873,406 | |
| 3.000%, 01/15/2029 | | 13,437,000 | | | 11,366,896 | |
| | | | | | | |
| TransDigm, Inc. | | | | | | |
| 8.000%, 12/15/2025 | | 8,610,000 | | | 8,829,211 | |
| | | | | | | |
| Airlines – 0.16% | | | | | | |
| | | | | | | |
| Southwest Airlines Co. | | | | | | |
| 5.125%, 06/15/2027 | | 8,780,000 | | | 8,966,648 | |
| | | | | | | |
| Auto Components – 0.22% | | | | | | |
| | | | | | | |
| Dana, Inc. | | | | | | |
| 5.375%, 11/15/2027 | | 5,500,000 | | | 4,910,895 | |
| 4.250%, 09/01/2030 | | 4,500,000 | | | 3,639,434 | |
| 4.500%, 02/15/2032 | | 4,208,000 | | | 3,365,068 | |
| | | | | | | |
| Automobiles – 0.26% | | | | | | |
| | | | | | | |
| Thor Industries, Inc. | | | | | | |
| 4.000%, 10/15/2029 | | 5,340,000 | | | 4,336,601 | |
Percentages are stated as a percent of net assets.The accompanying notes are an integral part of these financial statements.
PERFORMANCE TRUST MUTUAL FUNDS (PTIAX, PTAOX, PTCOX, PTIMX, PTRMX, PTCRX)
PERFORMANCE TRUST STRATEGIC BOND FUND — SCHEDULE OF INVESTMENTS (CONT.)
August 31, 2022
| | | PRINCIPAL | | | | |
| | | AMOUNT | | | VALUE | |
| | | | | | | |
| Volkswagen Group of | | | | | | |
| America Finance, LLC | | | | | | |
3.750%, 05/13/2030 | | $ | 10,000,000 | | | $ | 9,103,985 | |
| | | | | | | | | |
| Winnebago Industries, Inc. | | | | | | | | |
6.250%, 07/15/2028 | | | 1,000,000 | | | | 949,720 | |
| | | | | | | | | |
| Banks – 7.20% | | | | | | | | |
| | | | | | | | | |
| Atlantic Union Bankshares Corp. | | | | | | | | |
2.875% (TSFR3M + 1.860%), | | | | | | | | |
12/15/2031 (b) | | | 8,000,000 | | | | 7,048,958 | |
| | | | | | | | | |
| Bank of America Corp. | | | | | | | | |
2.087% (SOFR + 1.060%), | | | | | | | | |
06/14/2029 | | | 12,000,000 | | | | 10,230,027 | |
2.651% (SOFR + 1.220%), | | | | | | | | |
03/11/2032 (b) | | | 10,000,000 | | | | 8,319,066 | |
| | | | | | | | | |
| Bank of Montreal | | | | | | | | |
3.088% (5 Year CMT Rate + | | | | | | | | |
1.400%), 01/10/2037 (b) | | | 15,000,000 | | | | 12,077,045 | |
| | | | | | | | | |
| Bank of Nova Scotia | | | | | | | | |
2.450%, 02/02/2032 | | | 15,000,000 | | | | 12,484,267 | |
| | | | | | | | | |
| Bank of NT Butterfield & Son Ltd. | | | | | | | | |
5.250% (3 Month LIBOR USD + | | | | | | | | |
2.255%), 06/01/2028 (b) | | | 3,000,000 | | | | 3,000,493 | |
5.250% (TSFR3M + 5.060%), | | | | | | | | |
06/15/2030 (b) | | | 5,000,000 | | | | 4,984,472 | |
| | | | | | | | | |
| Bank OZK | | | | | | | | |
2.750% (TSFR3M + 2.090%), | | | | | | | | |
10/01/2031 (b) | | | 13,175,000 | | | | 11,792,834 | |
| | | | | | | | | |
| Banner Corp. | | | | | | | | |
5.000% (TSFR3M + 4.890%), | | | | | | | | |
06/30/2030 (b) | | | 5,000,000 | | | | 4,928,579 | |
| | | | | | | | | |
| Barclays PLC | | | | | | | | |
6.125% (5 Year CMT Rate + | | | | | | | | |
5.867%), 09/15/2166 (b) | | | 15,050,000 | | | | 13,920,498 | |
| | | | | | | | | |
| Bryn Mawr Bank Corp. | | | | | | | | |
4.250% (3 Month LIBOR USD + | | | | | | | | |
2.050%), 12/15/2027 (b) | | | 3,500,000 | | | | 3,482,470 | |
| | | | | | | | | |
| Central Pacific Financial Corp. | | | | | | | | |
4.750% (TSFR3M + 4.560%), | | | | | | | | |
11/01/2030 (b) | | | 5,000,000 | | | | 4,830,147 | |
| | | | | | | | | |
| Citigroup, Inc. | | | | | | | | |
3.980% (3 Month LIBOR USD + | | | | | | | | |
1.338%), 03/20/2030 (b) | | | 8,679,000 | | | | 8,140,918 | |
| | | | | | | | | |
| CNB Financial Corp. | | | | | | | | |
3.250% (TSFR3M + 2.580%), | | | | | | | | |
06/15/2031 | | | 8,000,000 | | | | 7,255,297 | |
| | | | | | | | | |
| First Busey Corp. | | | | | | | | |
5.250% (TSFR3M + 5.110%), | | | | | | | | |
06/01/2030 (b) | | | 4,000,000 | | | | 3,931,239 | |
5.000% (TSFR3M + 2.520%), | | | | | | | | |
06/15/2032 (b) | |
| 2,000,000 | | | | 1,912,662 | |
| | | | | | | | | |
| First Citizens BancShares, Inc. | | | | | | | | |
3.375% (SOFR + 2.465%), | | | | | | | | |
03/15/2030 (b) | | | 4,750,000 | | | | 4,505,411 | |
| | | | | | | | | |
| First Financial Bancorp. | | | | | | | | |
5.250% (TSFR3M + 5.090%), | | | | | | | | |
05/15/2030 (b) | | | 4,000,000 | | | | 3,937,606 | |
| | | | | | | | | |
| First Foundation, Inc. | | | | | | | | |
3.500% (SOFR + 2.040%), | | | | | | | | |
02/01/2032 (b) | | | 9,500,000 | | | | 8,340,162 | |
| | | | | | | | | |
| First Interstate BancSystem, Inc. | | | | | | | | |
5.250% (TSFR3M + 5.180%), | | | | | | | | |
05/15/2030 (b) | | | 5,000,000 | | | | 4,941,126 | |
| | | | | | | | | |
| First Mid Bancshares, Inc. | | | | | | | | |
3.950% (TSFR3M + 3.830%), | | | | | | | | |
10/15/2030 (b) | | | 5,300,000 | | | | 5,044,842 | |
| | | | | | | | | |
| First Midwest Bancorp, Inc. | | | | | | | | |
5.875%, 09/29/2026 | | | 8,500,000 | | | | 8,729,161 | |
| | | | | | | | | |
| Firstbank | | | | | | | | |
4.500% (SOFR + 4.390%), | | | | | | | | |
09/01/2030 (b) | | | 8,000,000 | | | | 7,729,839 | |
| | | | | | | | | |
| First-Citizens Bank & Trust Co. | | | | | | | | |
6.125%, 03/09/2028 | | | 6,841,000 | | | | 7,077,179 | |
| | | | | | | | | |
| Flushing Financial Corp. | | | | | | | | |
3.125% (TSFR3M + 2.035%), | | | | | | | | |
12/01/2031 (b) | | | 5,000,000 | | | | 4,456,463 | |
| | | | | | | | | |
| FNB Corp. | | | | | | | | |
5.150%, 08/25/2025 | | | 6,000,000 | | | | 6,009,649 | |
| | | | | | | | | |
| Great Southern Bank | | | | | | | | |
5.500% (TSFR3M + 5.325%), | | | | | | | | |
06/15/2030 (b) | | | 4,750,000 | | | | 4,763,087 | |
| | | | | | | | | |
| Heartland Financial USA, Inc. | | | | | | | | |
2.750% (TSFR3M + 2.100%), | | | | | | | | |
09/15/2031 (b) | | | 6,000,000 | | | | 5,372,466 | |
| | | | | | | | | |
| Hilltop Holdings, Inc. | | | | | | | | |
6.125% (TSFR3M + 5.800%), | | | | | | | | |
05/15/2035 (b) | | | 9,000,000 | | | | 9,046,430 | |
| | | | | | | | | |
| Home BancShares, Inc. | | | | | | | | |
3.125% (TSFR3M + 1.820%), | | | | | | | | |
01/30/2032 (b) | | | 8,000,000 | | | | 7,020,784 | |
| | | | | | | | | |
| HomeStreet, Inc. | | | | | | | | |
3.500% (TSFR3M + 2.150%), | | | | | | | | |
01/30/2032 (b) | | | 6,500,000 | | | | 5,862,673 | |
| | | | | | | | | |
| Huntington National Bank | | | | | | | | |
5.500% (3 Month LIBOR USD + | | | | | | | | |
5.090%), 05/06/2030 (b) | | | 9,000,000 | | | | 9,090,240 | |
Percentages are stated as a percent of net assets.The accompanying notes are an integral part of these financial statements.
PERFORMANCE TRUST MUTUAL FUNDS (PTIAX, PTAOX, PTCOX, PTIMX, PTRMX, PTCRX)
PERFORMANCE TRUST STRATEGIC BOND FUND — SCHEDULE OF INVESTMENTS (CONT.)
August 31, 2022
| | | PRINCIPAL | | | | |
| | | AMOUNT | | | VALUE | |
| | | | | | | |
| Independent Bank Group, Inc. | | | | | | |
4.000% (TSFR3M + 3.885%), | | | | | | |
09/15/2030 (b) | | $ | 7,000,000 | | | $ | 6,885,321 | |
| | | | | | | | | |
| JPMorgan Chase & Co. | | | | | | | | |
2.069% (SOFR + 1.015%), | | | | | | | | |
06/01/2029 (b) | | | 5,000,000 | | | | 4,286,228 | |
2.963% (SOFR + 1.260%), | | | | | | | | |
01/25/2033 (b) | | | 10,000,000 | | | | 8,523,423 | |
| | | | | | | | | |
| Mercantile Bank Corp. | | | | | | | | |
3.250% (SOFR + 2.120%), | | | | | | | | |
01/30/2032 (b) | | | 7,000,000 | | | | 6,182,867 | |
| | | | | | | | | |
| National Australia Bank Ltd. | | | | | | | | |
3.347% (5 Year CMT Rate + | | | | | | | | |
1.700%), 01/12/2037 (b) | | | 9,500,000 | | | | 7,902,035 | |
| | | | | | | | | |
| NBT Bancorp, Inc. | | | | | | | | |
5.000% (TSFR3M + 4.850%), | | | | | | | | |
07/01/2030 (b) | | | 7,500,000 | | | | 7,377,811 | |
| | | | | | | | | |
| NexBank Capital, Inc. | | | | | | | | |
4.000% (TSFR3M + 3.390%), | | | | | | | | |
08/15/2031 (b) | | | 6,500,000 | | | | 6,014,492 | |
| | | | | | | | | |
| OceanFirst Financial Corp. | | | | | | | | |
5.250% (TSFR3M + 5.095%), | | | | | | | | |
05/15/2030 (b) | | | 5,000,000 | | | | 4,934,007 | |
| | | | | | | | | |
| Pacific Premier Bancorp, Inc. | | | | | | | | |
4.875% (3 Month LIBOR USD + | | | | | | | | |
2.500%), 05/15/2029 (b) | | | 3,500,000 | | | | 3,423,100 | |
5.375% (TSFR3M + 5.170%), | | | | | | | | |
06/15/2030 (b) | | | 5,000,000 | | | | 4,946,895 | |
| | | | | | | | | |
| Park National Corp. | | | | | | | | |
4.500% (TSFR3M + 4.390%), | | | | | | | | |
09/01/2030 (b) | | | 15,100,000 | | | | 14,590,091 | |
| | | | | | | | | |
| Peapack-Gladstone | | | | | | | | |
| Financial Corp. | | | | | | | | |
3.500% (TSFR3M + 3.260%), | | | | | | | | |
12/30/2030 (b) | | | 7,500,000 | | | | 7,061,383 | |
| | | | | | | | | |
| RBB Bancorp | | | | | | | | |
4.000% (TSFR3M + 3.290%), | | | | | | | | |
04/01/2031 (b) | | | 5,450,000 | | | | 5,153,162 | |
| | | | | | | | | |
| Renasant Corp. | | | | | | | | |
3.000% (TSFR3M + 1.910%), | | | | | | | | |
12/01/2031 (b) | | | 5,000,000 | | | | 4,341,929 | |
4.500% (TSFR3M + 4.025%), | | | | | | | | |
09/15/2035 | | | 5,000,000 | | | | 4,622,446 | |
| | | | | | | | | |
| Sandy Spring Bancorp, Inc. | | | | | | | | |
4.250% (3 Month LIBOR USD + | | | | | | | | |
2.882%), 11/15/2029 | | | 5,500,000 | | | | 5,354,640 | |
| | | | | | | | | |
| Southside Bancshares, Inc. | | | | | | | | |
3.875% (TSFR3M + 3.660%), | | | | | | | | |
11/15/2030 (b) | | | 7,000,000 | | | | 6,680,816 | |
| | | | | | | | | |
| Summit Financial Group, Inc. | | | | | | | | |
3.250% (TSFR3M + 2.300%), | | | | | | | | |
12/01/2031 (b) | |
| 4,000,000 | | | | 3,583,499 | |
| | | | | | | | | |
| Synovus Financial Corp. | | | | | | | | |
5.900% (5 Year Swap Rate USD | | | | | | | | |
+ 3.379%), 02/07/2029 (b) | | | 4,000,000 | | | | 3,966,257 | |
| | | | | | | | | |
| Texas Capital Bancshares, Inc. | | | | | | | | |
4.000% (5 Year CMT Rate + | | | | | | | | |
3.150%), 05/06/2031 (b) | | | 10,942,000 | | | | 9,678,409 | |
| | | | | | | | | |
| Texas Capital Bank, NA | | | | | | | | |
5.250%, 01/31/2026 | | | 5,000,000 | | | | 4,968,876 | �� |
| | | | | | | | | |
| Toronto-Dominion Bank | | | | | | | | |
2.000%, 09/10/2031 | | | 10,000,000 | | | | 8,121,616 | |
2.450%, 01/12/2032 | | | 6,000,000 | | | | 5,018,845 | |
| | | | | | | | | |
| Towne Bank | | | | | | | | |
3.125% (TSFR3M + 1.680%), | | | | | | | | |
02/15/2032 (b) | | | 4,000,000 | | | | 3,673,646 | |
| | | | | | | | | |
| Trustmark Corp. | | | | | | | | |
3.625% (TSFR3M + 3.387%), | | | | | | | | |
12/01/2030 (b) | | | 6,500,000 | | | | 6,063,100 | |
| | | | | | | | | |
| UMB Financial Corp. | | | | | | | | |
3.700% (5 Year CMT Rate + | | | | | | | | |
3.437%), 09/17/2030 (b) | | | 5,000,000 | | | | 4,760,836 | |
| | | | | | | | | |
| Valley National Bancorp | | | | | | | | |
3.000% (TSFR3M + 2.360%), | | | | | | | | |
06/15/2031 (b) | | | 7,300,000 | | | | 6,621,044 | |
| | | | | | | | | |
| Western Alliance Bancorp | | | | | | | | |
3.000% (TSFR3M + 2.250%), | | | | | | | | |
06/15/2031 (b) | | | 5,900,000 | | | | 5,241,931 | |
| | | | | | | | | |
| Western Alliance Bank | | | | | | | | |
5.250% (TSFR3M + 5.120%), | | | | | | | | |
06/01/2030 (b) | | | 5,000,000 | | | | 4,914,876 | |
| | | | | | | | | |
| WSFS Financial Corp. | | | | | | | | |
2.750% (SOFR + 2.485%), | | | | | | | | |
12/15/2030 (b) | | | 4,470,000 | | | | 4,138,217 | |
| | | | | | | | | |
| Building Products – 0.38% | | | | | | | | |
| | | | | | | | | |
| Builders FirstSource, Inc. | | | | | | | | |
4.250%, 02/01/2032 | | | 5,750,000 | | | | 4,597,010 | |
6.375%, 06/15/2032 | | | 2,000,000 | | | | 1,857,410 | |
| | | | | | | | | |
| Masonite International Corp. | | | | | | | | |
3.500%, 02/15/2030 | | | 10,536,000 | | | | 8,528,326 | |
| | | | | | | | | |
| TopBuild Corp. | | | | | | | | |
3.625%, 03/15/2029 | | | 5,915,000 | | | | 4,982,737 | |
4.125%, 02/15/2032 | | | 1,565,000 | | | | 1,291,029 | |
| | | | | | | | | |
| Capital Markets – 0.89% | | | | | | �� | | |
| | | | | | | | | |
| Ares Capital Corp. | | | | | | | | |
3.200%, 11/15/2031 | | | 15,000,000 | | | | 11,741,098 | |
Percentages are stated as a percent of net assets.The accompanying notes are an integral part of these financial statements.
PERFORMANCE TRUST MUTUAL FUNDS (PTIAX, PTAOX, PTCOX, PTIMX, PTRMX, PTCRX)
PERFORMANCE TRUST STRATEGIC BOND FUND — SCHEDULE OF INVESTMENTS (CONT.)
August 31, 2022
| | | PRINCIPAL | | | | |
| | | AMOUNT | | | VALUE | |
| | | | | | | |
| Blackstone Holdings | | | | | | |
| Finance Co., LLC | | | | | | |
1.625%, 08/05/2028 | | $ | 15,000,000 | | | $ | 12,720,550 | |
| | | | | | | | | |
| Brookfield Asset | | | | | | | | |
| Management, Inc. | | | | | | | | |
7.375%, 03/01/2033 | | | 3,000,000 | | | | 3,404,948 | |
| | | | | | | | | |
| MSCI, Inc. | | | | | | | | |
4.000%, 11/15/2029 | | | 5,000,000 | | | | 4,459,825 | |
3.625%, 11/01/2031 | | | 7,000,000 | | | | 5,842,845 | |
3.250%, 08/15/2033 | | | 3,960,000 | | | | 3,177,841 | |
| | | | | | | | | |
| UBS Group AG | | | | | | | | |
2.746% (1 Year CMT Rate + | | | | | | | | |
1.100%), 02/11/2033 | | | 10,000,000 | | | | 8,042,467 | |
| | | | | | | | | |
| Chemicals – 0.56% | | | | | | | | |
| | | | | | | | | |
| Axalta Coating Systems, LLC | | | | | | | | |
3.375%, 02/15/2029 | | | 15,105,000 | | | | 12,549,427 | |
| | | | | | | | | |
| Scotts Miracle-Gro Co. | | | | | | | | |
4.000%, 04/01/2031 | | | 5,025,000 | | | | 3,781,312 | |
4.375%, 02/01/2032 | | | 9,878,000 | | | | 7,471,127 | |
| | | | | | | | | |
| Valvoline, Inc. | | | | | | | | |
3.625%, 06/15/2031 | | | 8,734,000 | | | | 7,047,421 | |
| | | | | | | | | |
| Commercial Services & | | | | | | | | |
| Supplies – 0.24% | | | | | | | | |
| | | | | | | | | |
| Central Storage | | | | | | | | |
| Safety Project Trust | | | | | | | | |
4.823%, 02/01/2038 | | | 6,381,760 | | | | 5,662,456 | |
| | | | | | | | | |
| Nature Conservancy | | | | | | | | |
1.711%, 07/01/2031 | | | 1,250,000 | | | | 1,016,312 | |
1.811%, 07/01/2032 | | | 1,150,000 | | | | 916,389 | |
1.861%, 07/01/2033 | | | 532,000 | | | | 413,468 | |
| | | | | | | | | |
| Wildflower Improvement | | | | | | | | |
| Association | | | | | | | | |
6.625%, 03/01/2031 | | | 5,527,867 | | | | 5,373,594 | |
| | | | | | | | | |
| Construction & | | | | | | | | |
| Engineering – 0.32% | | | | | | | | |
| | | | | | | | | |
| AECOM | | | | | | | | |
5.125%, 03/15/2027 | | | 18,210,000 | | | | 17,696,478 | |
| | | | | | | | | |
| Consumer Finance – 0.37% | | | | | | | | |
| | | | | | | | | |
| BlueHub Loan Fund, Inc. | | | | | | | | |
3.099%, 01/01/2030 | | | 3,040,000 | | | | 2,730,516 | |
| | | | | | | | | |
| Ford Motor Credit Co., LLC | | | | | | | | |
4.950%, 05/28/2027 | | | 5,853,000 | | | | 5,503,108 | |
| | | | | | | | | |
| OneMain Finance Corp. | | | | | | | | |
3.500%, 01/15/2027 | | | 5,000,000 | | | | 4,136,203 | |
5.375%, 11/15/2029 | | | 10,103,000 | | | | 8,384,025 | |
| | | | | | | | | |
| Containers & Packaging – 0.67% | | | | | | | | |
| | | | | | | | | |
| AptarGroup, Inc. | | | | | | | | |
3.600%, 03/15/2032 | | | 10,000,000 | | | | 8,766,896 | |
| | | | | | | | | |
| Ball Corp. | | | | | | | | |
2.875%, 08/15/2030 | |
| 18,537,000 | | |
| 15,061,127 | |
3.125%, 09/15/2031 | | | 3,500,000 | | | | 2,839,757 | |
| | | | | | | | | |
| Graphic Packaging | | | | | | | | |
| International, LLC | | | | | | | | |
4.750%, 07/15/2027 | | | 1,700,000 | | | | 1,626,233 | |
3.500%, 03/15/2028 | | | 4,855,000 | | | | 4,328,276 | |
3.750%, 02/01/2030 | | | 5,000,000 | | | | 4,304,973 | |
| | | | | | | | | |
| Distributors – 0.15% | | | | | | | | |
| | | | | | | | | |
| Genuine Parts Co. | | | | | | | | |
2.750%, 02/01/2032 | | | 10,000,000 | | | | 8,339,053 | |
| | | | | | | | | |
| Diversified Consumer | | | | | | | | |
| Services – 0.79% | | | | | | | | |
| | | | | | | | | |
| ADT Security Corp. | | | | | | | | |
4.125%, 08/01/2029 | | | 9,400,000 | | | | 8,083,812 | |
| | | | | | | | | |
| Liberty University, Inc. | | | | | | | | |
3.338%, 03/01/2034 | | | 16,000,000 | | | | 14,615,495 | |
| | | | | | | | | |
| Prime Security | | | | | | | | |
| Services Borrower, LLC | | | | | | | | |
3.375%, 08/31/2027 | | | 1,000,000 | | | | 861,860 | |
| | | | | | | | | |
| Service Corp. International | | | | | | | | |
3.375%, 08/15/2030 | | | 11,785,000 | | | | 9,732,348 | |
4.000%, 05/15/2031 | | | 7,475,000 | | | | 6,402,864 | |
| | | | | | | | | |
| United Jewish Appeal-Federation | | | | | | | | |
| of Jewish Philanthropies | | | | | | | | |
| of New York, Inc. | | | | | | | | |
2.145%, 02/01/2031 | | | 4,565,000 | | | | 3,889,707 | |
| | | | | | | | | |
| Diversified Financial | | | | | | | | |
| Services – 0.47% | | | | | | | | |
| | | | | | | | | |
| American AGcredit FLCA | | | | | | | | |
3.375% (SOFR + 2.120%), | | | | | | | | |
06/15/2036 | | | 10,000,000 | | | | 8,008,733 | |
| | | | | | | | | |
| Compeer Financial FLCA | | | | | | | | |
2.750% (SOFR + 2.030%), | | | | | | | | |
06/01/2031 (b) | | | 5,000,000 | | | | 4,489,034 | |
3.375% (SOFR + 1.965%), | | | | | | | | |
06/01/2036 (b) | | | 4,750,000 | | | | 3,816,745 | |
| | | | | | | | | |
| Enterprise Community | | | | | | | | |
| Loan Fund, Inc. | | | | | | | | |
3.685%, 11/01/2023 | | | 5,010,000 | | | | 4,993,931 | |
4.152%, 11/01/2028 | | | 5,000,000 | | | | 4,752,061 | |
| | | | | | | | | |
| Diversified Telecommunication | | | | | | | | |
| Services – 0.16% | | | | | | | | |
| | | | | | | | | |
| Verizon Communications, Inc. | | | | | | | | |
4.500%, 08/10/2033 | | | 9,180,000 | | | | 8,877,512 | |
| | | | | | | | | |
| Electrical Equipment – 0.23% | | | | | | | | |
| | | | | | | | | |
| Sensata Technologies, Inc. | | | | | | | | |
4.375%, 02/15/2030 | | | 8,393,000 | | | | 7,490,752 | |
3.750%, 02/15/2031 | | | 6,355,000 | | | | 5,260,336 | |
Percentages are stated as a percent of net assets.The accompanying notes are an integral part of these financial statements.
PERFORMANCE TRUST MUTUAL FUNDS (PTIAX, PTAOX, PTCOX, PTIMX, PTRMX, PTCRX)
PERFORMANCE TRUST STRATEGIC BOND FUND — SCHEDULE OF INVESTMENTS (CONT.)
August 31, 2022
| | | PRINCIPAL | | | | |
| | | AMOUNT | | | VALUE | |
| | | | | | | |
| Electronic Equipment, | | | | | | |
| Instruments & Components – 0.37% | | | | | | |
| | | | | | | |
| CDW Finance Corp. | | | | | | |
3.276%, 12/01/2028 | | $ | 1,650,000 | | | $ | 1,456,123 | |
3.250%, 02/15/2029 | | | 13,530,000 | | | | 11,766,229 | |
3.569%, 12/01/2031 | | | 2,482,000 | | | | 2,089,378 | |
| | | | | | | | | |
| Corning, Inc. | | | | | | | | |
5.750%, 08/15/2040 | | | 5,107,000 | | | | 5,312,516 | |
| | | | | | | | | |
| Equity Real Estate | | | | | | | | |
| Investment Trusts (REITs) – 0.28% | | | | | | | | |
| | | | | | | | | |
| American Finance Trust, Inc. | | | | | | | | |
4.500%, 09/30/2028 | | | 10,000,000 | | | | 8,036,750 | |
| | | | | | | | | |
| Simon Property Group LP | | | | | | | | |
6.750%, 02/01/2040 | | | 6,738,000 | | | | 7,630,399 | |
| | | | | | | | | |
| Healthcare Providers | | | | | | | | |
| & Services – 1.89% | | | | | | | | |
| | | | | | | | | |
| Baptist Health South Florida, Inc. | | | | | | | | |
4.342%, 11/15/2041 | | | 6,000,000 | | | | 5,670,289 | |
| | | | | | | | | |
| Centene Corp. | | | | | | | | |
2.450%, 07/15/2028 | | | 13,941,000 | | | | 11,777,636 | |
3.000%, 10/15/2030 | | | 5,965,000 | | | | 4,985,547 | |
| | | | | | | | | |
| CHRISTUS Health | | | | | | | | |
4.341%, 07/01/2028 | | | 7,070,000 | | | | 7,046,336 | |
| | | | | | | | | |
| CommonSpirit Health | | | | | | | | |
3.347%, 10/01/2029 | | | 13,075,000 | | | | 11,727,650 | |
2.782%, 10/01/2030 | | | 10,000,000 | | | | 8,406,517 | |
3.817%, 10/01/2049 | | | 1,800,000 | | | | 1,477,949 | |
| | | | | | | | | |
| Hackensack Meridian Health, Inc. | | | | | | | | |
2.675%, 09/01/2041 | | | 9,920,000 | | | | 7,402,751 | |
| | | | | | | | | |
| HumanGood California | | | | | | | | |
| Obligated Group | | | | | | | | |
3.000%, 10/01/2028 (d) | | | 6,880,000 | | | | 6,588,150 | |
| | | | | | | | | |
| Northwell Healthcare, Inc. | | | | | | | | |
3.391%, 11/01/2027 | | | 4,652,000 | | | | 4,385,198 | |
| | | | | | | | | |
| Oglethorpe Power Corp. | | | | | | | | |
6.191%, 01/01/2031 | | | 6,445,000 | | | | 6,718,159 | |
| | | | | | | | | |
| Orlando Health Obligated Group | | | | | | | | |
2.891%, 10/01/2035 | | | 1,000,000 | | | | 835,945 | |
| | | | | | | | | |
| Penn State Health | | | | | | | | |
3.806%, 11/01/2049 | | | 3,500,000 | | | | 2,906,972 | |
| | | | | | | | | |
| Piedmont Healthcare, Inc. | | | | | | | | |
2.044%, 01/01/2032 | | | 12,725,000 | | | | 10,309,289 | |
| | | | | | | | | |
| Sutter Health | | | | | | | | |
2.294%, 08/15/2030 | | | 8,553,000 | | | | 7,256,537 | |
| | | | | | | | | |
| Toledo Hospital | | | | | | | | |
6.015%, 11/15/2048 | | | 6,980,000 | | | | 7,159,282 | |
| | | | | | | | | |
| Hotels, Restaurants | | | | | | | | |
| & Leisure – 0.36% | | | | | | | | |
| | | | | | | | | |
| New Red Finance, Inc. | | | | | | | | |
3.875%, 01/15/2028 | | | 1,000,000 | | | | 890,340 | |
3.500%, 02/15/2029 | | | 2,250,000 | | | | 1,938,634 | |
| | | | | | | | | |
| Papa John’s International, Inc. | | | | | | | | |
3.875%, 09/15/2029 | | | 10,274,000 | | | | 8,798,037 | |
| | | | | | | | | |
| YMCA of Greater New York | | | | | | | | |
2.303%, 08/01/2026 | | | 5,730,000 | | | | 5,207,705 | |
| | | | | | | | | |
| Yum! Brands, Inc. | | | | | | | | |
4.750%, 01/15/2030 | | | 3,600,000 | | | | 3,285,306 | |
| | | | | | | | | |
| Household Durables – 0.73% | | | | | | | | |
| | | | | | | | | |
| Ashton Woods USA, LLC | | | | | | | | |
4.625%, 04/01/2030 | | | 7,600,000 | | | | 6,005,677 | |
| | | | | | | | | |
| Century Communities, Inc. | | | | | | | | |
3.875%, 08/15/2029 | | | 3,925,000 | | | | 3,174,677 | |
| | | | | | | | | |
| KB Home | | | | | | | | |
4.800%, 11/15/2029 | | | 8,222,000 | | | | 7,082,579 | |
7.250%, 07/15/2030 | | | 1,000,000 | | | | 961,875 | |
| | | | | | | | | |
| LGI Homes, Inc. | | | | | | | | |
4.000%, 07/15/2029 | | | 6,000,000 | | | | 4,688,010 | |
| | | | | | | | | |
| M/I Homes, Inc. | | | | | | | | |
3.950%, 02/15/2030 | | | 5,611,000 | | | | 4,519,326 | |
| | | | | | | | | |
| Meritage Homes Corp. | | | | | | | | |
3.875%, 04/15/2029 | | | 4,500,000 | | | | 3,829,927 | |
| | | | | | | | | |
| Tempur Sealy International, Inc. | | | | | | | | |
3.875%, 10/15/2031 | | | 13,151,000 | | | | 10,142,215 | |
| | | | | | | | | |
| Insurance – 0.94% | | | | | | | | |
| | | | | | | | | |
| Metropolitan Life Global Funding I | | | | | | | | |
2.400%, 01/11/2032 | | | 20,000,000 | | | | 16,786,597 | |
| | | | | | | | | |
| New York Life Global Funding | | | | | | | | |
1.850%, 08/01/2031 | | | 10,000,000 | | | | 8,121,955 | |
| | | | | | | | | |
| Northwestern Mutual | | | | | | | | |
| Global Funding | | | | | | | | |
1.700%, 06/01/2028 | | | 10,000,000 | | | | 8,761,638 | |
| | | | | | | | | |
| Pacific Life Global Funding II | | | | | | | | |
2.450%, 01/11/2032 | | | 14,000,000 | | | | 11,597,883 | |
| | | | | | | | | |
| RGA Global Funding | | | | | | | | |
2.700%, 01/18/2029 | | | 7,750,000 | | | | 6,803,003 | |
| | | | | | | | | |
| IT Services – 0.25% | | | | | | | | |
| | | | | | | | | |
| Gartner, Inc. | | | | | | | | |
3.625%, 06/15/2029 | | | 10,378,000 | | | | 8,938,934 | |
| | | | | | | | | |
| Global Payments, Inc. | | | | | | | | |
5.300%, 08/15/2029 | | | 5,000,000 | | | | 4,960,459 | |
| | | | | | | | | |
| Machinery – 0.18% | | | | | | | | |
| | | | | | | | | |
| Allison Transmission, Inc. | | | | | | | | |
3.750%, 01/30/2031 | | | 12,165,000 | | | | 9,857,604 | |
Percentages are stated as a percent of net assets.The accompanying notes are an integral part of these financial statements.
PERFORMANCE TRUST MUTUAL FUNDS (PTIAX, PTAOX, PTCOX, PTIMX, PTRMX, PTCRX)
PERFORMANCE TRUST STRATEGIC BOND FUND — SCHEDULE OF INVESTMENTS (CONT.)
August 31, 2022
| | | PRINCIPAL | | | | |
| | | AMOUNT | | | VALUE | |
| | | | | | | |
| Media – 0.39% | | | | | | |
| | | | | | | |
| CCO Holdings Capital Corp. | | | | | | |
4.750%, 02/01/2032 | | $ | 9,312,000 | | | $ | 7,719,369 | |
4.250%, 01/15/2034 | | | 11,250,000 | | | | 8,579,362 | |
| | | | | | | | | |
| Sirius XM Radio, Inc. | | | | | | | | |
3.875%, 09/01/2031 | | | 6,500,000 | | | | 5,256,680 | |
| | | | | | | | | |
| Mortgage Real Estate | | | | | | | | |
| Investment Trusts (REITs) – 0.22% | | | | | | | | |
| | | | | | | | | |
| Arbor Realty SR, Inc. | | | | | | | | |
5.000%, 12/30/2028 | | | 5,000,000 | | | | 4,288,214 | |
| | | | | | | | | |
| Arbor Realty Trust, Inc. | | | | | | | | |
4.750%, 10/15/2024 | | | 4,000,000 | | | | 3,793,002 | |
4.500%, 03/15/2027 | | | 5,000,000 | | | | 4,366,570 | |
| | | | | | | | | |
| Pharmaceuticals – 0.60% | | | | | | | | |
| | | | | | | | | |
| Bristol-Myers Squibb Co. | | | | | | | | |
4.125%, 06/15/2039 | | | 8,734,000 | | | | 8,206,815 | |
| | | | | | | | | |
| Johnson & Johnson | | | | | | | | |
5.850%, 07/15/2038 | | | 8,180,000 | | | | 9,465,155 | |
| | | | | | | | | |
| Wyeth, LLC | | | | | | | | |
5.950%, 04/01/2037 | | | 13,738,000 | | | | 15,665,144 | |
| | | | | | | | | |
| Professional Services – 0.33% | | | | | | | | |
| | | | | | | | | |
| Booz Allen Hamilton, Inc. | | | | | | | | |
3.875%, 09/01/2028 | | | 12,502,000 | | | | 11,141,157 | |
| | | | | | | | | |
| Equifax, Inc. | | | | | | | | |
2.350%, 09/15/2031 | | | 5,000,000 | | | | 4,044,331 | |
| | | | | | | | | |
| Science Applications | | | | | | | | |
| International Corp. | | | | | | | | |
4.875%, 04/01/2028 | | | 3,354,000 | | | | 3,106,891 | |
| | | | | | | | | |
| Road & Rail – 0.17% | | | | | | | | |
| | | | | | | | | |
| ERAC USA Finance, LLC | | | | | | | | |
7.000%, 10/15/2037 | | | 8,316,000 | | | | 9,451,749 | |
| | | | | | | | | |
| Software – 0.52% | | | | | | | | |
| | | | | | | | | |
| Open Text Corp. | | | | | | | | |
3.875%, 12/01/2029 | | | 8,830,000 | | | | 7,138,369 | |
| | | | | | | | | |
| Open Text Holdings, Inc. | | | | | | | | |
4.125%, 12/01/2031 | | | 6,250,000 | | | | 4,947,906 | |
| | | | | | | | | |
| Oracle Corp. | | | | | | | | |
2.300%, 03/25/2028 | | | 10,000,000 | | | | 8,717,584 | |
3.850%, 07/15/2036 | | | 10,200,000 | | | | 8,188,006 | |
| | | | | | | | | |
| Specialty Retail – 0.86% | | | | | | | | |
| | | | | | | | | |
| Asbury Automotive Group, Inc. | | | | | | | | |
5.000%, 02/15/2032 | | | 5,800,000 | | | | 4,853,498 | |
| | | | | | | | | |
| Group 1 Automotive, Inc. | | | | | | | | |
4.000%, 08/15/2028 | | | 13,317,000 | | | | 11,399,419 | |
| | | | | | | | | |
| Home Depot, Inc. | | | | | | | | |
5.400%, 09/15/2040 | | | 5,000,000 | | | | 5,339,781 | |
| | | | | | | | | |
| Lithia Motors, Inc. | | | | | | | | |
4.625%, 12/15/2027 | | | 4,300,000 | | | | 3,988,164 | |
3.875%, 06/01/2029 | | | 7,150,000 | | | | 6,092,515 | |
4.375%, 01/15/2031 | | | 4,000,000 | | | | 3,525,540 | |
| | | | | | | | | |
| O’Reilly Automotive, Inc. | | | | | | | | |
4.700%, 06/15/2032 | | | 5,000,000 | | | | 4,971,108 | |
| | | | | | | | | |
| Penske Automotive Group, Inc. | | | | | | | | |
3.750%, 06/15/2029 | | | 8,950,000 | | | | 7,582,440 | |
| | | | | | | | | |
| Technology Hardware, | | | | | | | | |
| Storage & Peripherals – 0.18% | | | | | | | | |
| | | | | | | | | |
| Dell International, LLC | | | | | | | | |
5.300%, 10/01/2029 | | | 10,100,000 | | | | 10,038,055 | |
| | | | | | | | | |
| Trading Companies | | | | | | | | |
| & Distributors – 0.16% | | | | | | | | |
| | | | | | | | | |
| United Rentals North America, Inc. | | | | | | | | |
3.750%, 01/15/2032 | | | 10,500,000 | | | | 8,747,027 | |
| | | | | | | | | |
| Wireless Telecommunication | | | | | | | | |
| | | | | | | | | |
| Services – 0.18% | | | | | | | | |
| | | | | | | | | |
| T-Mobile USA, Inc. | | | | | | | | |
2.625%, 02/15/2029 | | | 11,689,000 | | | | 10,095,831 | |
| | | | | | | | | |
| TOTAL CORPORATE BONDS | | | | | | | | |
| (Cost $1,400,149,638) | | | | | | | 1,229,516,844 | |
| | | | | | | | | |
| NON-AGENCY RESIDENTIAL MORTGAGE BACKED SECURITIES – 10.50% | | | | | | | | |
| | | | | | | | | |
| Adjustable Rate Mortgage Trust | | | | | | | | |
2005-3, 2.920%, 07/25/2035 (f) | | | 285,962 | | | | 286,580 | |
2005-10, 3.426%, 01/25/2036 (f) | | | 5,315,363 | | | | 4,366,968 | |
2006-2, 3.225%, 05/25/2036 (f) | | | 912,791 | | | | 837,363 | |
| | | | | | | | | |
| Alternative Loan Trust | | | | | | | | |
2004-28CB, 5.000%, | | | | | | | | |
01/25/2020 (g) | | | 127,195 | | | | 94,400 | |
2006-J3, 5.750%, 05/25/2026 | | | 543,157 | | | | 513,633 | |
2004-27CB, 6.000%, 12/25/2034 | | | 1,032,104 | | | | 954,553 | |
2004-28CB, 6.000%, 01/25/2035 | | | 305,795 | | | | 287,449 | |
2005-6CB, 5.750%, 04/25/2035 | | | 1,974,708 | | | | 1,788,720 | |
2005-6CB, 7.500%, 04/25/2035 | | | 231,554 | | | | 211,555 | |
2005-13CB, 2.944% | | | | | | | | |
(1 Month LIBOR USD + 0.500%), | | | | | | | | |
05/25/2035 (b) | | | 969,975 | | | | 803,251 | |
2005-9CB, 2.944% | | | | | | | | |
(1 Month LIBOR USD + 0.500%), | | | | | | | | |
05/25/2035 (b) | | | 2,114,424 | | | | 1,907,895 | |
2005-9CB, 6.000%, 05/25/2035 | | | 7,212,577 | | | | 4,167,554 | |
2005-21CB, 5.250%, 06/25/2035 | | | 2,830,040 | | | | 2,325,669 | |
2005-21CB, 6.000%, 06/25/2035 | | | 1,707,871 | | | | 1,450,855 | |
2005-J6, 2.944% | | | | | | | | |
(1 Month LIBOR USD + 0.500%), | | | | | | | | |
07/25/2035 (b) | | | 2,781,141 | | | | 2,367,270 | |
2005-20CB, 5.500%, 07/25/2035 | | | 1,051,165 | | | | 866,329 | |
Percentages are stated as a percent of net assets.The accompanying notes are an integral part of these financial statements.
PERFORMANCE TRUST MUTUAL FUNDS (PTIAX, PTAOX, PTCOX, PTIMX, PTRMX, PTCRX)
PERFORMANCE TRUST STRATEGIC BOND FUND — SCHEDULE OF INVESTMENTS (CONT.)
August 31, 2022
| PRINCIPAL | | | |
| AMOUNT | | VALUE | |
| | | | | |
| Alternative Loan Trust (Cont.) | | | | |
| 2005-43, 4.257%, 09/25/2035 (f) | $ | 183,963 | | $ | 164,672 | |
| 2005-63, 2.838%, 11/25/2035 (f) | | 899,715 | | | 814,739 | |
| 2005-54CB, 5.500%, 11/25/2035 | | 590,179 | | | 378,423 | |
| 2005-J13, 5.500%, 11/25/2035 | | 543,049 | | | 413,302 | |
| 2005-65CB, 0.000%, | | | | | | |
| 12/25/2035 (d)(h) | | 750,510 | | | 370,529 | |
| 2005-65CB, 5.500%, 01/25/2036 | | 108,075 | | | 80,875 | |
| 2005-75CB, 5.500%, 01/25/2036 | | 1,361,693 | | | 1,046,058 | |
| 2005-73CB, 5.750%, 01/25/2036 | | 363,993 | | | 231,364 | |
| 2005-86CB, 5.500%, 02/25/2036 | | 136,426 | | | 93,470 | |
| 2005-86CB, 5.500%, 02/25/2036 | | 984,483 | | | 674,509 | |
| 2005-80CB, 6.000%, 02/25/2036 | | 4,580,330 | | | 4,406,908 | |
| 2006-6CB, 5.500%, 05/25/2036 | | 101,919 | | | 88,575 | |
| 2006-12CB, 5.750% | | | | | | |
| (1 Month LIBOR USD + 5.750%), | | | | | | |
| 05/25/2036 (b) | | 569,427 | | | 329,864 | |
| 2006-14CB, 6.000%, 06/25/2036 | | 2,462,920 | | | 1,572,084 | |
| 2006-16CB, 6.000%, 06/25/2036 | | 898,187 | | | 591,835 | |
| 2006-16CB, 6.000%, 06/25/2036 | | 1,034,631 | | | 681,770 | |
| 2006-16CB, 6.000%, 06/25/2036 | | 394,730 | | | 260,107 | |
| 2006-19CB, 2.844% | | | | | | |
| (1 Month LIBOR USD + 0.400%), | | | | | | |
| 08/25/2036 (b) | | 674,890 | | | 344,185 | |
| 2006-24CB, 5.750%, 08/25/2036 | | 2,525,949 | | | 1,590,848 | |
| 2006-24CB, 5.750%, 08/25/2036 | | 4,071,888 | | | 2,564,484 | |
| 2006-19CB, 6.000%, 08/25/2036 | | 3,931,976 | | | 2,623,394 | |
| 2006-19CB, 6.000%, 08/25/2036 | | 227,819 | | | 151,890 | |
| 2006-19CB, 6.000% | | | | | | |
| (1 Month LIBOR USD + 1.000%), | | | | | | |
| 08/25/2036 (b) | | 2,573,029 | | | 1,716,253 | |
| 2006-19CB, 6.000% | | | | | | |
| (1 Month LIBOR USD + 1.000%), | | | | | | |
| 08/25/2036 (b) | | 1,014,498 | | | 676,628 | |
| 2006-23CB, 6.000%, 08/25/2036 | | 632,262 | | | 603,169 | |
| 2006-23CB, 6.500%, 08/25/2036 | | 5,681,216 | | | 2,309,691 | |
| 2006-J6, 6.000%, 09/25/2036 | | 2,760,226 | | | 1,662,875 | |
| 2006-J6, 6.000%, 09/25/2036 | | 2,049,122 | | | 1,234,476 | |
| 2006-26CB, 6.250%, 09/25/2036 | | 5,570,117 | | | 3,310,175 | |
| 2006-J5, 6.500%, 09/25/2036 | | 1,972,367 | | | 1,251,515 | |
| 2006-J5, 6.500%, 09/25/2036 (d) | | 9,548,395 | | | 6,058,693 | |
| 2006-31CB, 5.750%, 11/25/2036 | | 2,000,979 | | | 1,300,914 | |
| 2006-31CB, 6.000%, 11/25/2036 | | 221,819 | | | 147,372 | |
| 2006-30T1, 6.500%, | | | | | | |
| 11/25/2036 (d) | | 8,342,217 | | | 3,247,250 | |
| 2006-39CB, 6.000%, 01/25/2037 | | 2,486,595 | | | 2,233,986 | |
| 2006-41CB, 6.000%, 01/25/2037 | | 542,260 | | | 349,411 | |
| 2007-2CB, 5.750%, 03/25/2037 | | 5,697,923 | | | 3,457,937 | |
| 2007-4CB, 5.750%, 04/25/2037 | | 1,191,015 | | | 1,057,815 | |
| 2007-4CB, 5.750%, 04/25/2037 | | 1,583,371 | | | 1,406,291 | |
| 2007-8CB, 5.500%, 05/25/2037 | | 5,938,141 | | | 3,653,873 | |
| 2007-8CB, 6.000%, 05/25/2037 | | 802,351 | | | 519,482 | |
| 2007-J2, 6.000%, 07/25/2037 |
| 4,314,802 | |
| 4,023,470 | |
| 2008-2R, 6.000%, 08/25/2037 (f) | | 7,022,981 | | | 3,927,355 | |
| 2007-23CB, 6.000%, 09/25/2037 | | 4,435,993 | | | 2,762,980 | |
| 2007-13, 6.000%, 06/25/2047 | | 2,582,438 | | | 1,559,133 | |
| | | | | | | |
| American Home | | | | | | |
| Mortgage Investment Trust | | | | | | |
| 2006-2, 6.750%, 06/25/2036 (i) | | 2,747,648 | | | 532,332 | |
| | | | | | | |
| Banc of America | | | | | | |
| Alternative Loan Trust | | | | | | |
| 2005-11, 5.750%, 12/25/2035 | | 725,371 | | | 644,885 | |
| 2005-11, 5.750%, 12/25/2035 | | 118,254 | | | 105,133 | |
| 2006-9, 2.844% | | | | | | |
| (1 Month LIBOR USD + 0.400%), | | | | | | |
| 01/25/2037 (b) | | 938,677 | | | 727,921 | |
| 2006-9, 6.000%, 01/25/2037 | | 192,495 | | | 171,409 | |
| 2006-4, 6.000%, 05/25/2046 | | 975,050 | | | 878,685 | |
| 2006-4, 6.500%, 05/25/2046 | | 589,287 | | | 535,155 | |
| 2006-4, 6.500%, 05/25/2046 | | 1,162,604 | | | 1,034,675 | |
| 2006-5, 6.000%, 06/25/2046 | | 285,778 | | | 259,738 | |
| 2006-6, 6.000%, 07/25/2046 | | 1,150,244 | | | 1,008,427 | |
| | | | | | | |
| Banc of America Funding Trust | | | | | | |
| 2003-3, 5.500%, 10/25/2033 | | 222,182 | | | 211,087 | |
| 2004-1, 6.000%, 02/25/2034 | | 590,693 | | | 582,571 | |
| 2004-1, 6.000%, 03/25/2034 | | 3,639,840 | | | 3,676,559 | |
| 2004-B, 2.398%, 11/20/2034 (f) | | 2,054,932 | | | 1,970,259 | |
| 2007-4, 5.500%, 11/25/2034 | | 259,796 | | | 241,264 | |
| 2005-3, 5.500%, 06/25/2035 | | 83,154 | | | 80,285 | |
| 2014-R3, 3.133%, | | | | | | |
| 06/26/2035 (a)(f) | | 1,615,478 | | | 1,592,816 | |
| 2014-R3, 3.253%, | | | | | | |
| 06/26/2035 (a)(f) | | 3,103,499 | | | 2,973,255 | |
| 2005-4, 5.500%, 08/25/2035 | | 36,977 | | | 36,059 | |
| 2005-5, 5.500%, 09/25/2035 | | 162,686 | | | 158,341 | |
| 2005-5, 5.500%, 09/25/2035 | | 1,681,917 | | | 1,629,812 | |
| 2005-7, 5.500%, 11/25/2035 | | 3,175,670 | | | 2,925,714 | |
| 2005-7, 5.750%, 11/25/2035 | | 4,019 | | | 3,978 | |
| 2005-7, 6.000%, 11/25/2035 | | 19,989 | | | 19,505 | |
| 2005-8, 5.750%, 01/25/2036 | | 2,004,553 | | | 1,854,908 | |
| 2006-B, 2.673%, 03/20/2036 (f) | | 635,169 | | | 549,719 | |
| 2006-F, 3.488%, 07/20/2036 (f) | | 6,632,846 | | | 5,916,557 | |
| 2006-5, 5.750%, 09/25/2036 | | 337,227 | | | 311,646 | |
| 2006-7, 6.000%, 09/25/2036 | | 512,562 | | | 448,249 | |
| 2006-I, 2.524%, 12/20/2036 (f) | | 2,539,652 | | | 2,448,075 | |
| 2006-I, 2.524%, 12/20/2036 (f) | | 441,761 | | | 418,640 | |
| 2006-I, 3.012%, 12/20/2036 (f) | | 590,311 | | | 583,069 | |
| 2007-1, 6.689%, 01/25/2037 (i) | | 759,300 | | | 701,771 | |
| 2007-2, 2.504% | | | | | | |
| (1 Month LIBOR USD + 0.060%), | | | | | | |
| 03/25/2037 (b) | | 386,937 | | | 374,924 | |
Percentages are stated as a percent of net assets.The accompanying notes are an integral part of these financial statements.
PERFORMANCE TRUST MUTUAL FUNDS (PTIAX, PTAOX, PTCOX, PTIMX, PTRMX, PTCRX)
PERFORMANCE TRUST STRATEGIC BOND FUND — SCHEDULE OF INVESTMENTS (CONT.)
August 31, 2022
| | PRINCIPAL | | | |
| | AMOUNT | | VALUE | |
| | | | | |
| Banc of America Funding Trust (Cont.) | | | | |
| | 2007-3, 3.304% | | | | |
| (1 Month LIBOR USD + 0.860%), | | | | |
| 04/25/2037 (b) | $ | 923,037 | | $ | 892,540 | |
| | 2007-6, 2.724% | | | | | | |
| (1 Month LIBOR USD + 0.280%), | | | | | | |
| 07/25/2037 (b) | | 4,307,745 | | | 4,002,585 | |
| | 2007-6, 2.734% | | | | | | |
| (1 Month LIBOR USD + 0.290%), | | | | | | |
| 07/25/2037 (b) | | 1,043,705 | | | 970,672 | |
| 2007-5, 5.500%, 07/25/2037 | | 1,402,624 | | | 1,157,190 | |
| | 2010-R3, 6.000% | | | | | | |
| 09/26/2037 (a)(f) | | 6,462,751 | | | 6,193,906 | |
| 2006-J, 3.510%, 01/20/2047 (f) | | 124,262 | | | 117,140 | |
| | | | | | | |
| Banc of America Mortgage Trust | | | | | | |
| 2005-A, 2.541%, 02/25/2035 (f) | | 1,428,070 | | | 1,433,615 | |
| 2005-F, 3.942%, 07/25/2035 (f) | | 788,603 | | | 744,033 | |
| 2007-1, 6.000%, 03/25/2037 | | 1,629,458 | | | 1,385,054 | |
| 2006-B, 2.619%, 10/20/2046 (f) | | 433,186 | | | 403,411 | |
| | | | | | | |
| BCAP LLC Trust | | | | | | |
| 2007-AA2, 7.500%, | | | | | | |
| 04/25/2037 (j) | | 302,344 | | | 194,173 | |
| | | | | | | |
| Bear Stearns ALT-A Trust | | | | | | |
| 2006-6, 3.515%, 11/25/2036 (f) | | 825,938 | | | 441,474 | |
| | | | | | | |
| Bear Stearns ARM Trust | | | | | | |
| 2004-12, 2.857%, 02/25/2035 (f) | | 47,265 | | | 45,771 | |
| | | | | | | |
| Bear Stearns Asset | | | | | | |
| Backed Securities I Trust | | | | | | |
| 2005-AC5, 3.444% | | | | | | |
| (1 Month LIBOR USD + 1.000%), | | | | | | |
| 08/25/2035 (b) | | 538,193 | | | 383,536 | |
| 2006-AC4, 2.694% | | | | | | |
| (1 Month LIBOR USD + 0.250%), | | | | | | |
| 07/25/2036 (b) | | 3,238,230 | | | 2,763,307 | |
| 2006-AC4, 25.661% | | | | | | |
| (1 Month LIBOR USD + 36.250%), | | | | | | |
| 07/25/2036 (b)(d)(j) | | 748,327 | | | 793,762 | |
| | | | | | | |
| Charlie Mac Trust | | | | | | |
| 2004-2, 6.000%, 10/25/2034 | | 3,476 | | | 3,371 | |
| | | | | | | |
| Chase Funding Trust | | | | | | |
| | 2004-1, 3.194% | | | | | | |
| (1 Month LIBOR USD + 0.750%), | | | | | | |
| 09/25/2033 (b) | | 68,069 | | | 67,962 | |
| | | | | | | |
| Chase Mortgage Finance Trust | | | | | | |
| 2005-S2, 5.500%, 10/25/2035 | | 645,314 | | | 614,802 | |
| 2005-S3, 5.500%, 11/25/2035 | | 5,563,425 | | | 4,451,112 | |
| 2005-A1, 2.943%, 12/25/2035 (f) | | 810,042 | | | 769,238 | |
| 2005-A1, 2.943%, 12/25/2035 (f) | | 844,503 | | | 801,962 | |
| 2006-S3, 6.000%, 11/25/2036 | | 6,916,491 | | | 3,636,219 | |
| 2006-S4, 6.000%, 12/25/2036 | | 1,226,693 | | | 654,149 | |
| 2006-S4, 6.000%, 12/25/2036 | | 3,958,334 | | | 2,110,831 | |
| 2007-S1, 6.000%, 02/25/2037 | | 4,037,332 | | | 1,881,285 | |
| 2007-S3, 5.750%, 05/25/2037 | | 696,121 | | | 371,737 | |
| 2007-S3, 6.000%, 05/25/2037 | | 2,121,079 | | | 1,153,460 | |
| 2007-A2, 3.337%, 07/25/2037 (f) | | 890,162 | | | 803,380 | |
| | | | | | | |
| ChaseFlex Trust | | | | | | |
| 2005-1, 5.500%, 02/25/2035 | | 307,565 | | | 266,264 | |
| 2006-2, 6.170%, 09/25/2036 (f) | | 2,514,153 | | | 2,297,416 | |
| 2007-M1, 4.149%, 08/25/2037 (i) | | 1,433,385 | | | 1,239,759 | |
| | | | | | | |
| CHL Mortgage | | | | | | |
| Pass-Through Trust | | | | | | |
| 2005-20, 5.250%, 12/25/2027 | | 19,810 | | | 13,708 | |
| 2003-42, 2.254%, 10/25/2033 (f) | | 916,842 | | | 874,203 | |
| 2003-44, 5.000%, 10/25/2033 | | 261,000 | | | 259,708 | |
| 2004-4, 5.500%, 05/25/2034 | | 434,389 | | | 405,122 | |
| 2004-14, 4.269%, 08/25/2034 (f) | | 2,260,841 | | | 2,165,121 | |
| 2004-21, 4.000%, 11/25/2034 | | 522,919 | | | 494,423 | |
| 2004-24, 5.500%, 12/25/2034 | | 2,473,995 | | | 2,304,555 | |
| 2004-J9, 5.500%, 01/25/2035 | | 502,396 | | | 488,576 | |
| 2004-HYB5, 3.068%, | | | | | | |
| 04/20/2035 (f) | | 591,982 | | | 596,884 | |
| 2005-HYB2, 2.950%, | | | | | | |
| 05/20/2035 (f) | | 774,727 | | | 754,297 | |
| 2005-13, 5.500%, 06/25/2035 | | 1,687,245 | | | 1,120,824 | |
| 2005-J3, 5.500%, 09/25/2035 | | 71,047 | | | 64,341 | |
| 2005-27, 5.500%, 12/25/2035 | | 508,884 | | | 245,728 | |
| 2005-27, 5.500%, 12/25/2035 | | 1,007,303 | | | 811,831 | |
| 2005-31, 2.878%, 01/25/2036 (f) | | 872,838 | | | 814,195 | |
| 2005-30, 5.500%, 01/25/2036 | | 66,955 | | | 47,123 | |
| 2005-HY10, 3.186%, 02/20/2036 (f) | | 46,449 | | | 38,582 | |
| 2005-HY10, 3.231%, 02/20/2036 (f) | | 1,635,394 | | | 1,567,397 | |
| 2005-HY10, 3.237%, 02/20/2036 (f) | | 112,408 | | | 93,042 | |
| 2006-6, 6.000%, 04/25/2036 | | 645,609 | | | 389,389 | |
| 2006-9, 6.000%, 05/25/2036 | | 1,149,104 | | | 624,182 | |
| 2006-J4, 6.250%, 09/25/2036 | | 96,095 | | | 45,681 | |
| 2006-16, 6.500%, 11/25/2036 | | 514,338 | | | 229,396 | |
| | 2006-17, 6.000% | | | | | | |
| (1 Month LIBOR USD + 0.550%), | | | | | | |
| 12/25/2036 (b) | | 2,976,069 | | | 1,500,230 | |
| 2006-17, 6.000%, 12/25/2036 | | 2,200,469 | | | 1,072,532 | |
| 2006-18, 6.000%, 12/25/2036 | | 279,372 | | | 182,694 | |
| 2006-21, 5.750%, 02/25/2037 | | 1,235,183 | | | 681,962 | |
| 2006-21, 6.000%, 02/25/2037 | | 2,852,205 | | | 1,617,974 | |
| 2006-21, 6.000%, 02/25/2037 | | 651,223 | | | 369,420 | |
| 2007-1, 6.000%, 03/25/2037 | | 2,028,974 | | | 1,135,890 | |
| 2007-5, 5.500%, 05/25/2037 | | 791,868 | | | 467,172 | |
| 2007-5, 5.750%, 05/25/2037 | | 5,636,931 | | | 3,393,480 | |
| 2007-5, 5.750%, 05/25/2037 | | 860,726 | | | 518,164 | |
| 2007-5, 5.750%, 05/25/2037 | | 1,660,894 | | | 999,872 | |
| 2007-10, 6.000%, 07/25/2037 | | 1,801,765 | | | 1,024,320 | |
| 2007-J2, 6.000%, 07/25/2037 | | 2,956,117 | | | 1,347,008 | |
Percentages are stated as a percent of net assets.The accompanying notes are an integral part of these financial statements.
PERFORMANCE TRUST MUTUAL FUNDS (PTIAX, PTAOX, PTCOX, PTIMX, PTRMX, PTCRX)
PERFORMANCE TRUST STRATEGIC BOND FUND — SCHEDULE OF INVESTMENTS (CONT.)
August 31, 2022
| | PRINCIPAL | | | |
| | AMOUNT | | VALUE | |
| | | | | |
| CHL Mortgage | | | | |
| Pass-Through Trust (Cont.) | | | | |
| 2007-J2, 6.000%, 07/25/2037 | $ | 190,918 | | $ | 86,995 | |
| 2007-HY5, 3.902%, 09/25/2037 (f) | | 1,916,623 | | | 1,787,172 | |
| 2007-HY6, 3.412%, 11/25/2037 (f) | | 263,492 | | | 239,142 | |
| 2007-HY5, 3.859%, 09/25/2047 (f) | | 5,576,767 | | | 4,645,376 | |
| | | | | | | |
| Citicorp Mortgage Securities Trust | | | | | | |
| 2006-3, 5.500%, 06/25/2021 (g) | | 50,926 | | | 35,992 | |
| 2006-1, 6.000%, 02/25/2036 | | 82,448 | | | 78,786 | |
| 2006-3, 5.750%, 06/25/2036 | | 358,054 | | | 325,692 | |
| 2006-3, 6.000%, 06/25/2036 | | 1,255,849 | | | 1,152,453 | |
| 2006-3, 6.250%, 06/25/2036 | | 786,267 | | | 727,832 | |
| 2006-7, 6.000%, 12/25/2036 | | 2,861,532 | | | 2,506,342 | |
| 2007-3, 5.500%, 04/25/2037 | | 38,111 | | | 36,038 | |
| 2007-3, 6.000%, 04/25/2037 | | 519,054 | | | 487,154 | |
| | | | | | | |
| Citigroup Mortgage Loan Trust | | | | | | |
| 2004-2, 9.250%, 08/25/2033 (a) | | 14,474 | | | 14,308 | |
| 2004-HYB3, 3.386%, | | | | | | |
| 09/25/2034 (f) | | 481,549 | | | 461,340 | |
| 2005-WF1, 5.330%, 11/25/2034 (i) | | 2,742,380 | | | 2,696,970 | |
| 2005-1, 2.511%, 04/25/2035 (f) | | 341,027 | | | 326,485 | |
| 2005-2, 2.883%, 05/25/2035 (f) | | 403,250 | | | 394,576 | |
| 2005-5, 6.000%, 08/25/2035 | | 1,951,993 | | | 1,830,409 | |
| 2005-7, 2.749%, 09/25/2035 (f) | | 415,152 | | | 373,564 | |
| 2005-10, 2.989%, 12/25/2035 (f) | | 1,148,922 | | | 802,395 | |
| 2006-WF1, 5.040%, 03/25/2036 (i) | | 27,232,930 | | | 15,105,595 | |
| 2006-AR7, 3.389%, 11/25/2036 (f) | | 1,468,952 | | | 1,374,137 | |
| 2007-AR4, 3.327%, 03/25/2037 (f) | | 1,030,995 | | | 929,294 | |
| | | | | | | |
| CitiMortgage Alternative Loan Trust | | | | | | |
| | 2006-A2, 3.044% | | | | | | |
| (1 Month LIBOR USD + 0.600%), | | | | | | |
| 05/25/2036 (b) | | 422,371 | | | 373,845 | |
| 2006-A4, 6.000%, 09/25/2036 | | 1,032,218 | | | 905,343 | |
| 2007-A1, 6.000%, 01/25/2037 | | 1,541,775 | | | 1,384,411 | |
| 2007-A1, 6.000%, 01/25/2037 | | 2,477,763 | | | 2,224,866 | |
| | | | | | | |
| Credit Suisse First Boston | | | | | | |
| Mortgage Securities Corp. | | | | | | |
| 2005-8, 7.000%, 09/25/2035 | | 2,699,175 | | | 1,500,176 | |
| | | | | | | |
| CSFB Mortgage-Backed | | | | | | |
| Pass-Through Certificates | | | | | | |
| 2004-8, 5.500%, 12/25/2034 | | 145,170 | | | 141,655 | |
| 2005-3, 5.500%, 07/25/2035 | | 542,738 | | | 536,062 | |
| 2005-9, 5.500%, 10/25/2035 | | 565,755 | | | 332,754 | |
| 2005-10, 5.500%, 11/25/2035 | | 430,588 | | | 348,420 | |
| 2005-10, 5.500%, 11/25/2035 | | 1,697,318 | | | 1,373,436 | |
| 2005-10, 6.000%, 11/25/2035 | | 818,286 | | | 284,009 | |
| | | | | | | |
| CSMC Mortgage-Backed Trust | | | | | | |
| 2006-CF1, 5.500%, | | | | | | |
| 11/25/2035 (a)(i) | | 2,565,000 | | | 2,310,659 | |
| 2006-1, 5.500%, 02/25/2036 | | 304,781 | | | 281,780 | |
| 2006-1, 5.500%, 02/25/2036 | | 31,374 | | | 29,048 | |
| 2006-2, 5.750%, 03/25/2036 | | 560,915 | | | 406,790 | |
| 2006-2, 6.000%, 03/25/2036 | | 4,205,104 | | | 2,085,938 | |
| 2006-4, 6.000%, 05/25/2036 | | 520,344 | | | 333,995 | |
| 2006-4, 7.000%, 05/25/2036 | | 505,858 | | | 97,214 | |
| | 2011-12R, 3.498% | | | | | | |
| 07/27/2036 (a)(f) | | 1,050,935 | | | 1,053,309 | |
| 2006-7, 6.000%, 08/25/2036 | | 741,070 | | | 626,453 | |
| 2007-2, 5.500%, 03/25/2037 | | 1,361,430 | | | 830,213 | |
| 2007-3, 5.500%, 04/25/2037 | | 305,199 | | | 261,263 | |
| 2007-3, 5.500%, 04/25/2037 | | 426,978 | | | 365,510 | |
| | 2013-2R, 3.136% | | | | | | |
| 05/27/2037 (a)(f) | | 1,988,399 | | | 1,365,203 | |
| | | | | | | |
| Deutsche Alt-A Securities, Inc. | | | | | | |
| Mortgage Loan Trust | | | | | | |
| | 2005-3, 2.944% | | | | | | |
| (1 Month LIBOR USD + 0.500%), | | | | | | |
| 05/25/2035 (b) | | 1,189,795 | | | 1,141,628 | |
| 2005-6, 5.500%, 12/25/2035 | | 1,509,539 | | | 1,301,561 | |
| | | | | | | |
| Deutsche Alt-B Securities, Inc. | | | | | | |
| Mortgage Loan Trust | | | | | | |
| 2006-AB4, 2.544% | | | | | | |
| (1 Month LIBOR USD + 0.100%), | | | | | | |
| 10/25/2036 (b) | | 476,380 | | | 407,827 | |
| | | | | | | |
| DFC HEL Trust | | | | | | |
| | 2001-1, 4.041% | | | | | | |
(1 Month LIBOR USD + 1.650%), | | | | | | |
08/15/2031 (b) | | 1,469,777 | | | 1,468,539 | |
| | | | | | | |
| Equity One Mortgage | | | | | | |
| Pass-Through Trust | | | | | | |
| 2003-1, 4.860%, 08/25/2033 (f) | | 535,378 | | | 522,894 | |
| 2003-3, 4.868%, 12/25/2033 (f) | | 1,318,929 | | | 1,235,975 | |
| | | | | | | |
| Fannie Mae Connecticut | | | | | | |
| Avenue Securities | | | | | | |
| | 2015-C03, 7.444% | | | | | | |
| (1 Month LIBOR USD + 5.000%), | | | | | | |
| 07/25/2025 (b) | | 2,747,359 | | | 2,798,703 | |
| | 2016-C01, 9.394% | | | | | | |
| (1 Month LIBOR USD + 6.950%), | | | | | | |
| 08/25/2028 (b) | | 1,462,627 | | | 1,518,973 | |
| | 2017-C05, 6.044% | | | | | | |
| (1 Month LIBOR USD + 3.600%), | | | | | | |
| 01/25/2030 (b) | | 6,599,636 | | | 6,676,127 | |
| | 2018-C03, 6.194% | | | | | | |
| (1 Month LIBOR USD + 3.750%), | | | | | | |
| 10/25/2030 (b) | | 5,000,000 | | | 5,035,559 | |
| | 2021-R02, 4.183% | | | | | | |
| (SOFR30A + 2.000%), | | | | | | |
| 11/25/2041 (a)(b) | | 2,250,000 | | | 2,124,361 | |
Percentages are stated as a percent of net assets.The accompanying notes are an integral part of these financial statements.
PERFORMANCE TRUST MUTUAL FUNDS (PTIAX, PTAOX, PTCOX, PTIMX, PTRMX, PTCRX)
PERFORMANCE TRUST STRATEGIC BOND FUND — SCHEDULE OF INVESTMENTS (CONT.)
August 31, 2022
| | PRINCIPAL | | | |
| | AMOUNT | | VALUE | |
| | | | | |
| First Horizon Alternative | | | | |
| Mortgage Securities Trust | | | | |
| 2005-FA11, 5.250%, | | | | |
| 02/25/2021 (g) | $ | 698 | | $ | — | |
| 2006-FA6, 5.750%, 11/25/2021 (g) | | 985 | | | 755 | |
| 2004-AA6, 3.221%, 01/25/2035 (f) | | 286,770 | | | 285,246 | |
| 2004-AA7, 3.617%, 02/25/2035 (f) | | 869,217 | | | 837,677 | |
| 2005-AA5, 3.329%, 07/25/2035 (f) | | 1,440,242 | | | 1,346,961 | |
| 2005-AA7, 3.722%, 09/25/2035 (f) | | 1,517,099 | | | 1,368,486 | |
| 2005-FA8, 5.500%, 11/25/2035 | | 1,213,369 | | | 714,998 | |
| 2006-FA1, 5.750%, 04/25/2036 | | 1,967,083 | | | 1,084,775 | |
| 2006-FA2, 6.000%, 05/25/2036 | | 2,306,438 | | | 1,186,826 | |
| 2006-FA2, 6.000%, 05/25/2036 | | 1,464,016 | | | 753,340 | |
| 2006-FA6, 6.000%, 11/25/2036 | | 969,170 | | | 387,562 | |
| 2006-FA6, 6.250%, 11/25/2036 | | 1,228,482 | | | 503,616 | |
| 2006-FA6, 6.250%, 11/25/2036 | | 6,469,632 | | | 3,524,583 | |
| 2007-AA1, 3.104%, 05/25/2037 (f) | | 2,419,139 | | | 1,809,488 | |
| 2007-FA4, 6.250%, 08/25/2037 | | 1,864,285 | | | 918,739 | |
| | | | | | | |
| First Horizon Mortgage | | | | | | |
| Pass-Through Trust | | | | | | |
| 2005-AR3, 3.890%, 08/25/2035 (f) | | 1,328,311 | | | 1,297,249 | |
| 2006-AR4, 2.916%, 01/25/2037 (f) | | 2,439,403 | | | 1,641,856 | |
| 2006-4, 5.750%, 02/25/2037 | | 953,213 | | | 313,830 | |
| 2006-4, 6.000%, 02/25/2037 | | 577,204 | | | 197,428 | |
| 2007-AR1, 2.846%, 05/25/2037 (f) | | 496,819 | | | 225,622 | |
| 2007-AR2, 3.546%, 08/25/2037 (f) | | 2,286,116 | | | 809,785 | |
| | | | | | | |
| Freddie Mac STACR REMIC Trust | | | | | | |
| 2021-HQA1, 4.433% | | | | | | |
| (SOFR30A + 2.250%), | | | | | | |
| 08/25/2033 (a)(b) | | 5,855,000 | | | 5,642,598 | |
| 2021-DNA5, 5.233% | | | | | | |
| (SOFR30A + 3.050%), | | | | | | |
| 01/25/2034 (a)(b) | | 7,759,414 | | | 7,181,422 | |
| 2021-DNA7, 3.983% | | | | | | |
| (SOFR30A + 1.800%), | | | | | | |
| 11/25/2041 (a)(b) | | 7,750,000 | | | 7,297,498 | |
| | | | | | | |
| Freddie Mac Structured Agency | | | | | | |
| Credit Risk Debt Notes | | | | | | |
| 2018-DNA2, 6.144% | | | | | | |
| (1 Month LIBOR USD + 3.700%), | | | | | | |
| 12/25/2030 (a)(b) | | 5,000,000 | | | 4,975,968 | |
| 2022-DNA1, 4.033% | | | | | | |
| (SOFR30A + 1.850%), | | | | | | |
| 01/25/2042 (a)(b) | | 6,800,000 | | | 6,527,890 | |
| 2022-DNA1, 4.683% | | | | | | |
| (SOFR30A + 2.500%), | | | | | | |
| 01/25/2042 (a)(b) | | 9,000,000 | | | 8,236,323 | |
| 2018-HRP2, 6.644% | | | | | | |
| (1 Month LIBOR USD + 4.200%), | | | | | | |
| 02/25/2047 (a)(b) | | 10,000,000 | | | 10,047,716 | |
| 2020-DNA5, 6.983% | | | | | | |
| (SOFR30A + 4.800%), | | | | | | |
| 10/25/2050 (a)(b) | | 10,606,000 | | | 10,814,455 | |
| | | | | | | |
| GSAA Home Equity Trust | | | | | | |
| 2005-1, 6.260%, 11/25/2034 (i) | | 2,050,000 | | | 1,955,761 | |
| 2006-15, 6.692%, 09/25/2036 (i) | | 2,129,678 | | | 673,946 | |
| 2006-18, 6.182%, 11/25/2036 (i) | | 1,717,821 | | | 493,639 | |
| | 2007-7, 2.804% | | | | | | |
| (1 Month LIBOR USD + 0.360%), | | | | | | |
| 07/25/2037 (b) | | 856,240 | | | 825,298 | |
| | | | | | | |
| GSR Mortgage Loan Trust | | | | | | |
| 2005-4F, 6.500%, 05/25/2035 (g) | | 47,882 | | | 47,766 | |
| 2003-5F, 3.000%, 08/25/2032 | | 899,075 | | | 831,456 | |
| 2004-15F, 6.000%, 12/25/2034 | | 1,134,421 | | | 1,005,185 | |
| 2005-1F, 6.000%, 01/25/2035 | | 14,460 | | | 13,372 | |
| 2005-AR4, 3.652%, 07/25/2035 (f) | | 169,206 | | | 154,913 | |
| 2005-7F, 6.000%, 09/25/2035 | | 21,207 | | | 20,597 | |
| 2005-AR5, 3.755%, 10/25/2035 (f) | | 591,390 | | | 563,098 | |
| 2005-AR7, 2.843%, 11/25/2035 (f) | | 459,063 | | | 433,653 | |
| 2006-2F, 5.750%, 02/25/2036 | | 473,758 | | | 430,782 | |
| | | | | | | |
| HarborView Mortgage Loan Trust | | | | | | |
| 2006-6, 3.304%, 08/19/2036 (f) | | 2,374,820 | | | 1,982,259 | |
| | | | | | | |
| Home Partners of America Trust | | | | | | |
| 2019-1, 2.908%, 09/17/2039 (a) | | 2,387,230 | | | 2,222,915 | |
| 2019-2, 2.703%, 10/19/2039 (a) | | 3,300,507 | | | 3,006,268 | |
| | | | | | | |
| Impac CMB Trust | | | | | | |
| | 2005-5, 2.944% | | | | | | |
| (1 Month LIBOR USD + 0.250%), | | | | | | |
| 08/25/2035 (b) | | 443,925 | | | 409,952 | |
| | | | | | | |
| Impac Secured Assets | | | | | | |
| CMN Owner Trust | | | | | | |
| 2002-2, 6.500%, 04/25/2033 | | 1,030,274 | | | 988,463 | |
| 2004-2, 6.400%, 08/25/2034 (i) | | 194,914 | | | 190,175 | |
| | | | | | | |
| IndyMac IMSC Mortgage Loan Trust | | | | | | |
| 2007-AR1, 3.071%, 06/25/2037 (f) | | 368,722 | | | 269,653 | |
| | | | | | | |
| IndyMac INDA Mortgage Loan Trust | | | | | | |
| 2007-AR1, 3.007%, 03/25/2037 (f) | | 326,386 | | | 278,528 | |
| | | | | | | |
| IndyMac INDX Mortgage Loan Trust | | | | | | |
| 2004-AR4, 3.694%, 08/25/2034 (f) | | 2,527,767 | | | 2,440,890 | |
| 2004-AR11, 2.497%, 12/25/2034 (f) | | 933,023 | | | 919,568 | |
| 2005-AR3, 2.766%, 04/25/2035 (f) | | 885,817 | | | 838,351 | |
| 2005-AR9, 3.530%, 07/25/2035 (f) | | 3,045,377 | | | 1,911,379 | |
| 2005-AR23, 2.906%, 11/25/2035 (f) | | 627,459 | | | 574,695 | |
| 2005-AR23, 2.929%, 11/25/2035 (f) | | 1,088,588 | | | 995,641 | |
| 2005-AR25, 3.039%, 12/25/2035 (f) | | 1,891,632 | | | 1,285,809 | |
| 2005-AR35, 2.976%, 02/25/2036 (f) | | 1,246,208 | | | 1,069,599 | |
| 2006-AR3, 3.008%, 03/25/2036 (f) | | 5,229,624 | | | 4,225,094 | |
| 2006-AR9, 3.075%, 06/25/2036 (f) | | 1,673,008 | | | 1,528,549 | |
| 2006-AR25, 3.180%, 09/25/2036 (f) | | 1,258,432 | | | 1,160,710 | |
| 2006-AR25, 3.435%, 09/25/2036 (f) | | 2,007,123 | | | 1,459,805 | |
| 2006-AR31, 3.018%, 11/25/2036 (f) | | 4,166,813 | | | 3,885,487 | |
| | | | | | | |
| Jefferies Resecuritization Trust | | | | | | |
| 2009-R1, 2.843%, 11/26/2035 (a)(f) | | 631,627 | | | 602,451 | |
Percentages are stated as a percent of net assets.The accompanying notes are an integral part of these financial statements.
PERFORMANCE TRUST MUTUAL FUNDS (PTIAX, PTAOX, PTCOX, PTIMX, PTRMX, PTCRX)
PERFORMANCE TRUST STRATEGIC BOND FUND — SCHEDULE OF INVESTMENTS (CONT.)
August 31, 2022
| | PRINCIPAL | | | |
| | AMOUNT | | VALUE | |
| | | | | |
| JP Morgan Alternative Loan Trust | | | | |
| 2006-S4, 6.460%, 12/25/2036 (i) | $ | 465,056 | | $ | 447,347 | |
| 2008-R4, 6.000%, 12/27/2036 (a) | | 6,632,773 | | | 3,828,468 | |
| | | | | | | |
| JP Morgan Mortgage Trust | | | | | | |
| 2005-S3, 5.750%, 01/25/2036 | | 46,739 | | | 25,884 | |
| 2007-A3, 2.841%, 05/25/2037 (f) | | 2,626,106 | | | 2,174,523 | |
| | | | | | | |
| JP Morgan Resecuritization Trust | | | | | | |
| 2009-7, 4.946%, 07/27/2037 (a)(f) | | 25,832 | | | 25,767 | |
| | | | | | | |
| Lehman Mortgage Trust | | | | | | |
| 2005-2, 5.500%, 12/25/2035 | | 1,484,227 | | | 914,288 | |
| 2005-2, 5.750%, 12/25/2035 | | 530,103 | | | 337,742 | |
| | 2005-3, 2.306% | | | | | | |
| (1 Month LIBOR USD + 4.750%), | | | | | | |
| 01/25/2036 (b)(d)(j)(k) | | 879,579 | | | 94,649 | |
| | 2005-3, 2.944% | | | | | | |
| (1 Month LIBOR USD + 0.500%), | | | | | | |
| 01/25/2036 (b) | | 879,579 | | | 415,836 | |
| 2005-3, 5.500%, 01/25/2036 | | 221,079 | | | 135,208 | |
| 2006-1, 5.500%, 02/25/2036 | | 372,212 | | | 222,396 | |
| 2006-3, 6.000%, 07/25/2036 | | 3,228,165 | | | 1,869,670 | |
| 2006-3, 6.000%, 07/25/2036 | | 7,141,797 | | | 4,133,485 | |
| 2007-4, 5.750%, 05/25/2037 | | 1,041,939 | | | 646,065 | |
| 2007-4, 5.750%, 05/25/2037 | | 2,276,636 | | | 1,411,652 | |
| 2007-5, 5.750%, 06/25/2037 | | 1,530,826 | | | 1,464,571 | |
| 2007-5, 6.000%, 06/25/2037 | | 2,371,652 | | | 776,261 | |
| 2007-5, 6.000%, 06/25/2037 (d) | | 6,477,694 | | | 2,120,202 | |
| | | | | | | |
| MASTR Adjustable | | | | | | |
| Rate Mortgages Trust | | | | | | |
| 2004-4, 1.931%, 05/25/2034 (f) | | 92,861 | | | 88,360 | |
| 2005-1, 2.780%, 02/25/2035 (f) | | 114,703 | | | 110,131 | |
| | | | | | | |
| MASTR Alternative Loan Trust | | | | | | |
| 2003-5, 5.898%, 08/25/2033 (f) | | 687,583 | | | 471,318 | |
| 2003-7, 6.250%, 11/25/2033 | | 69,392 | | | 66,396 | |
| 2004-6, 5.500%, 07/25/2034 | | 189,981 | | | 178,553 | |
| 2004-6, 6.000%, 07/25/2034 | | 146,502 | | | 141,148 | |
| 2004-11, 6.500%, 10/25/2034 | | 401,960 | | | 394,310 | |
| 2005-2, 5.500%, 03/25/2035 | | 2,000,000 | | | 1,974,963 | |
| 2005-6, 5.500%, 12/25/2035 | | 330,070 | | | 255,810 | |
| | | | | | | |
| MASTR Asset Securitization Trust | | | | | | |
| 2002-NC1, 5.594% | | | | | | |
| (1 Month LIBOR USD + 3.150%), | | | | | | |
| 10/25/2032 (b) | | 249,559 | | | 248,782 | |
| | 2006-1, 2.894% | | | | | | |
| (1 Month LIBOR USD + 0.450%), | | | | | | |
| 05/25/2036 (b) | | 600,845 | | | 98,034 | |
| | | | | | | |
| Merrill Lynch Mortgage | | | | | | |
| Investors Trust | | | | | | |
2006-F1, 6.000%, 04/25/2036 | | 2,093,312 | | | 1,175,180 | |
| | | | | | | | |
| Merrill Lynch Mortgage | | | | | | |
| Investors Trust MLCC | | | | | | |
| | 2004-D, 4.286% | | | | | | |
| (6 Month LIBOR USD + 0.720%), | | | | | | |
| 09/25/2029 (b) | | 503,551 | | | 483,053 | |
| | | | | | | |
| Merrill Lynch Mortgage | | | | | | |
| Investors Trust MLMI | | | | | | |
| 2005-A5, 3.466%, 06/25/2035 (f) | | 320,637 | | | 309,262 | |
| 2005-A7, 3.841%, 09/25/2035 (f) | | 4,065,577 | | | 3,475,769 | |
| | | | | | | |
| Morgan Stanley | | | | | | |
| Mortgage Loan Trust | | | | | | |
| 2005-7, 5.500%, 11/25/2035 | | 852,879 | | | 817,761 | |
| 2005-7, 5.500%, 11/25/2035 | | 328,843 | | | 293,182 | |
| 2006-2, 5.467%, 02/25/2036 (f) | | 1,322,377 | | | 857,420 | |
| 2006-2, 6.500%, 02/25/2036 | | 894,514 | | | 497,952 | |
| 2006-11, 6.000%, 08/25/2036 | | 1,984,925 | | | 1,047,266 | |
| 2006-11, 6.000%, 08/25/2036 | | 1,385,835 | | | 1,006,777 | |
| 2007-8XS, 6.000%, 04/25/2037 (f) | | 1,326,436 | | | 533,797 | |
| 2007-3XS, 5.763%, 01/25/2047 (i) | | 6,658,685 | | | 2,302,832 | |
| | | | | | | |
| Morgan Stanley Reremic Trust | | | | | | |
| | 2012-R3, 2.594% | | | | | | |
| 11/26/2036 (a)(f) | | 956,537 | | | 886,127 | |
| | | | | | | |
| Nomura Asset Acceptance Corp. | | | | | | |
| Alternative Loan Trust | | | | | | |
| 2005-WF1, 5.659%, 03/25/2035 (i) | | 26,909 | | | 26,432 | |
| 2005-AR3, 5.688%, 07/25/2035 (f) | | 746,974 | | | 733,960 | |
| 2007-1, 5.669%, 03/25/2047 (i) | | 876,726 | | | 796,164 | |
| 2007-1, 5.995%, 03/25/2047 (i) | | 1,612,142 | | | 1,469,319 | |
| | | | | | | |
| Nomura Resecuritization Trust | | | | | | |
| 2014-5R, 5.547%, 06/26/2035 (a)(f) | | 3,588,211 | | | 3,066,121 | |
| 2011-4RA, 2.768%, | | | | | | |
| 12/26/2036 (a)(f) | | 5,806,099 | | | 5,521,960 | |
| | | | | | | |
| Opteum Mortgage Acceptance | | | | | | |
| Corp. Asset Backed | | | | | | |
| Pass-Through Certificates | | | | | | |
| 2005-5, 5.850%, 12/25/2035 (f) | | 96,051 | | | 95,248 | |
| | | | | | | |
| RAAC Trust | | | | | | |
| 2005-SP1, 6.000%, 09/25/2034 | | 2,788 | | | 2,578 | |
| | | | | | | |
| RALI Trust | | | | | | |
| 2006-QA1, 5.334%, 01/25/2036 (f) | | 169,009 | | | 163,816 | |
| 2006-QS1, 5.750%, 01/25/2036 | | 199,193 | | | 176,622 | |
| 2006-QS9, 3.144% | | | | | | |
| (1 Month LIBOR USD + 0.700%), | | | | | | |
| 07/25/2036 (b) | | 1,429,956 | | | 1,021,472 | |
| 2006-QS13, 6.000%, 09/25/2036 | | 2,141,333 | | | 1,770,185 | |
| 2006-QS17, 2.794% | | | | | | |
| (1 Month LIBOR USD + 0.350%), | | | | | | |
| 12/25/2036 (b) | | 817,732 | | | 640,612 | |
| 2006-QS17, 6.000%, 12/25/2036 | | 324,351 | | | 281,734 | |
| 2007-QS1, 5.750%, 01/25/2037 | | 388,120 | | | 321,466 | |
Percentages are stated as a percent of net assets.The accompanying notes are an integral part of these financial statements.
PERFORMANCE TRUST MUTUAL FUNDS (PTIAX, PTAOX, PTCOX, PTIMX, PTRMX, PTCRX)
PERFORMANCE TRUST STRATEGIC BOND FUND — SCHEDULE OF INVESTMENTS (CONT.)
August 31, 2022
| | PRINCIPAL | | | |
| | AMOUNT | | VALUE | |
| | | | | |
| RALI Trust (Cont.) | | | | |
| 2007-QS1, 6.000%, 01/25/2037 | $ | 1,204,445 | | $ | 1,007,409 | |
| 2007-QS6, 6.000%, 04/25/2037 | | 2,736,502 | | | 2,381,456 | |
| 2007-QS10, 6.500%, 09/25/2037 | | 299,972 | | | 254,085 | |
| | | | | | | |
| RBSSP Resecuritization Trust | | | | | | |
| 2009-7, 6.000%, 03/26/2036 (a)(f) | | 3,795,168 | | | 2,339,429 | |
| | | | | | | |
| Renaissance Home | | | | | | |
| Equity Loan Trust | | | | | | |
| 2005-1, 5.516%, 05/25/2035 (i) | | 151,756 | | | 151,514 | |
| | | | | | | |
| Resecuritization | | | | | | |
| Pass-Through Trust | | | | | | |
| 2005-8R, 6.000%, 10/25/2034 | | 1,687,074 | | | 1,624,623 | |
| | | | | | | |
| Residential Asset | | | | | | |
| Securitization Trust | | | | | | |
| 2003-A9, 4.000%, 08/25/2033 | | 956,006 | | | 899,073 | |
| 2004-R2, 5.500%, 08/25/2034 | | 1,673,890 | | | 1,596,191 | |
| 2005-A5, 5.500%, 05/25/2035 | | 1,069,778 | | | 807,894 | |
| 2005-A11, 4.850%, 10/25/2035 | | 3,539,861 | | | 1,768,994 | |
| 2005-A11, 5.500%, 10/25/2035 | | 248,885 | | | 189,160 | |
| 2005-A11, 6.000%, 10/25/2035 | | 403,046 | | | 233,386 | |
| 2005-A15, 5.750%, 02/25/2036 | | 3,463,718 | | | 1,601,493 | |
| 2006-A5CB, 6.000%, 06/25/2036 | | 2,273,540 | | | 1,087,086 | |
| | 2006-A10, 3.094% | | | | | | |
| (1 Month LIBOR USD + 0.650%), | | | | | | |
| 09/25/2036 (b) | | 10,202,322 | | | 2,639,580 | |
| | 2006-A10, 3.406% | | | | | | |
| (1 Month LIBOR USD + 5.850%), | | | | | | |
| 09/25/2036 (b)(d)(j)(k) | | 10,202,322 | | | 1,572,495 | |
| | 2006-A15, 3.044% | | | | | | |
| (1 Month LIBOR USD + 0.600%), | | | | | | |
| 01/25/2037 (b) | | 16,542,097 | | | 4,304,537 | |
| | 2006-A15, 3.206% | | | | | | |
| (1 Month LIBOR USD + 5.650%), | | | | | | |
| 01/25/2037 (b)(d)(j)(k) | | 16,542,097 | | | 2,498,948 | |
| | | | | | | |
| RFMSI Trust | | | | | | |
| 2005-SA4, 3.725%, 09/25/2035 (f) | | 1,715,118 | | | 1,221,646 | |
| 2005-SA4, 4.019%, 09/25/2035 (f) | | 1,329,656 | | | 932,313 | |
| 2005-SA4, 4.099%, 09/25/2035 (f) | | 66,111 | | | 63,477 | |
| 2006-S3, 5.500%, 03/25/2036 | | 1,988,769 | | | 1,676,920 | |
| 2006-S4, 6.000%, 04/25/2036 | | 1,853,333 | | | 1,577,495 | |
| 2006-S5, 6.000%, 06/25/2036 | | 177,124 | | | 155,043 | |
| 2006-S5, 6.000%, 06/25/2036 | | 364,618 | | | 319,164 | |
| 2006-S5, 6.000%, 06/25/2036 | | 1,528,029 | | | 1,337,542 | |
| 2006-S5, 6.000%, 06/25/2036 | | 189,907 | | | 163,249 | |
| 2006-S6, 6.000%, 07/25/2036 | | 110,836 | | | 95,477 | |
| 2006-S6, 6.000%, 07/25/2036 | | 570,607 | | | 491,538 | |
| 2006-S7, 6.250%, 08/25/2036 | | 1,207,879 | | | 1,066,523 | |
| 2006-S7, 6.500%, 08/25/2036 | | 722,144 | | | 639,084 | |
| 2006-S9, 5.750%, 09/25/2036 | | 1,471,845 | | | 1,220,136 | |
| 2007-S1, 6.000%, 01/25/2037 | | 491,873 | | | 423,562 | |
| 2007-S7, 6.000%, 07/25/2037 | | 1,545,130 | | | 1,287,100 | |
| | | | | | | |
| Specialty Underwriting & | | | | | | |
| Residential Finance Trust | | | | | | |
| 2006-BC2, 6.350%, | | | | | | |
| 02/25/2037 (i) | | 808,587 | | | 340,001 | |
| | | | | | | |
| STARM Mortgage Loan Trust | | | | | | |
| 2007-S1, 3.118%, 01/25/2037 (f) | | 343,720 | | | 271,612 | |
| 2007-1, 2.313%, 02/25/2037 (f) | | 4,463,021 | | | 3,946,621 | |
| 2007-2, 2.276%, 04/25/2037 (f) | | 484,115 | | | 242,338 | |
| | | | | | | |
| Structured Adjustable Rate | | | | | | |
| Mortgage Loan Trust | | | | | | |
| 2004-18, 3.162%, 12/25/2034 (f) | | 484,054 | | | 460,207 | |
| 2005-12, 3.006%, 06/25/2035 (f) | | 656,131 | | | 530,119 | |
| 2005-21, 3.498%, 11/25/2035 (f) | | 3,377,564 | | | 2,512,248 | |
| 2006-1, 2.731%, 02/25/2036 (f) | | 205,403 | | | 186,897 | |
| 2006-1, 3.278%, 02/25/2036 (f) | | 1,175,147 | | | 992,537 | |
| 2006-4, 3.314%, 05/25/2036 (f) | | 618,436 | | | 450,283 | |
| 2006-12, 3.785%, 01/25/2037 (f) | | 590,701 | | | 491,394 | |
| | 2007-5, 2.884% | | | | | | |
| (1 Month LIBOR USD + 0.440%), | | | | | | |
| 06/25/2037 (b) | | 1,679,482 | | | 1,518,410 | |
| | 2007-6, 2.824% | | | | | | |
| (1 Month LIBOR USD + 0.380%), | | | | | | |
| 07/25/2037 (b) | | 4,692,540 | | | 4,299,244 | |
| | 2007-9, 4.841% | | | | | | |
| (6 Month LIBOR USD + 1.500%), | | | | | | |
| 10/25/2037 (b) | | 922,173 | | | 867,652 | |
| | | | | | | |
| Suntrust Alternative Loan Trust | | | | | | |
| 2005-1F, 5.750%, 12/25/2035 | | 872,301 | | | 796,549 | |
| 2005-1F, 6.000%, 12/25/2035 | | 2,014,331 | | | 1,854,319 | |
| 2005-1F, 6.500%, 12/25/2035 | | 2,031,579 | | | 1,876,888 | |
| | | | | | | |
| TBW Mortgage-Backed Trust | | | | | | |
| 2006-2, 5.500%, 07/25/2036 (d) | | 80,750 | | | 8,211 | |
| | | | | | | |
| Volt, LLC | | | | | | |
| 2021-NPL4, 4.949%, | | | | | | |
| 03/27/2051 (a)(i) | | 1,650,000 | | | 1,499,461 | |
| | | | | | | |
| WaMu Mortgage Pass-Through | | | | | | |
| Certificates Trust | | | | | | |
| 2003-S4, 5.652%, 06/25/2033 (f) | | 1,950,893 | | | 1,830,494 | |
| 2003-AR10, 2.533%, 10/25/2033 (f) | | 7,644,568 | | | 7,374,169 | |
| 2004-S2, 6.000%, 06/25/2034 | | 47,400 | | | 46,275 | |
| 2005-AR14, 2.871%, 12/25/2035 (f) | | 4,855,728 | | | 4,699,979 | |
| 2006-AR10, 3.443%, 09/25/2036 (f) | | 954,870 | | | 819,012 | |
| 2006-AR16, 2.738%, 12/25/2036 (f) | | 1,097,278 | | | 1,016,562 | |
| 2007-HY2, 3.338%, 12/25/2036 (f) | | 13,886,605 | | | 13,011,056 | |
| 2007-HY3, 3.192%, 03/25/2037 (f) | | 2,273,363 | | | 2,136,630 | |
| 2007-HY5, 3.278%, 05/25/2037 (f) | | 1,189,514 | | | 1,100,193 | |
| 2007-HY7, 3.390%, 07/25/2037 (f) | | 207,702 | | | 160,384 | |
| 2006-AR8, 3.686%, 08/25/2046 (f) | | 1,564,721 | | | 1,461,674 | |
Percentages are stated as a percent of net assets.The accompanying notes are an integral part of these financial statements.
PERFORMANCE TRUST MUTUAL FUNDS (PTIAX, PTAOX, PTCOX, PTIMX, PTRMX, PTCRX)
PERFORMANCE TRUST STRATEGIC BOND FUND — SCHEDULE OF INVESTMENTS (CONT.)
August 31, 2022
| | | PRINCIPAL | | | | |
| | | AMOUNT | | | VALUE | |
| | | | | | | |
| Washington Mutual | | | | | | |
| Mortgage Pass-Through | | | | | | |
| Certificates WMALT Trust | | | | | | |
2005-1, 6.000%, 03/25/2035 | | $ | 1,046,570 | | | $ | 959,284 | |
2005-4, 5.500%, 06/25/2035 | | | 981,891 | | | | 890,983 | |
2005-5, 5.500%, 07/25/2035 | | | 1,099,544 | | | | 1,016,123 | |
2005-6, 5.500%, 08/25/2035 | | | 2,780,689 | | | | 2,446,212 | |
2005-6, 5.500%, 08/25/2035 | | | 607,895 | | | | 534,774 | |
2005-6, 5.500%, 08/25/2035 | | | 1,189,659 | | | | 1,057,119 | |
2005-6, 6.500%, 08/25/2035 | | | 308,071 | | | | 278,659 | |
2005-9, 5.500%, 11/25/2035 | | | 414,775 | | | | 369,979 | |
2006-8, 4.174%, 10/25/2036 (i) | | | 2,342,372 | | | | 960,274 | |
2007-HY1, 2.764% | | | | | | | | |
(1 Month LIBOR USD + 0.320%), | | | | | | | | |
02/25/2037 (b) | | | 1,855,979 | | | | 1,597,250 | |
2007-HY2, 3.385%, 04/25/2037 (f) | | | 1,193,124 | | | | 667,366 | |
2007-OC2, 3.064% | | | | | | | | |
(1 Month LIBOR USD + 0.620%), | | | | | | | | |
06/25/2037 (b) | | | 3,184,455 | | | | 2,999,341 | |
2007-OC1, 2.684% | | | | | | | | |
(1 Month LIBOR USD + 0.240%), | | | | | | | | |
05/26/2037 (b) | | | 3,717,177 | | | | 3,512,286 | |
| | | | | | | | | |
| Wells Fargo Alternative Loan Trust | | | | | | | | |
2007-PA1, 6.000%, 03/25/2037 | | | 853,041 | | | | 760,490 | |
2007-PA6, 3.396%, 12/28/2037 (f) | | | 3,750,753 | | | | 3,559,806 | |
| | | | | | | | | |
| Wells Fargo Mortgage | | | | | | | | |
| Backed Securities Trust | | | | | | | | |
2004-J, 3.640%, 07/25/2034 (f) | | | 3,455,756 | | | | 3,250,370 | |
2005-AR14, 4.077%, 08/25/2035 (f) | | | 590,698 | | | | 574,811 | |
2006-AR1, 2.673%, 03/25/2036 (f) | | | 1,640,769 | | | | 1,576,022 | |
2006-AR5, 2.735%, 04/25/2036 (f) | | | 2,277,454 | | | | 2,184,584 | |
2006-AR5, 2.755%, 04/25/2036 (f) | | | 1,559,280 | | | | 1,494,058 | |
2006-AR19, 2.820%, 12/25/2036 (f) | | | 1,725,516 | | | | 1,677,117 | |
2007-AR3, 2.801%, 04/25/2037 (f) | | | 742,035 | | | | 661,305 | |
| TOTAL NON-AGENCY RESIDENTIAL | | | | | | | | |
| MORTGAGE BACKED SECURITIES | | | | | | | | |
| (Cost $696,581,885) | | | | | | | 582,620,323 | |
| | | | | | | | | |
| NON-AGENCY COMMERCIAL | | | | | | | | |
| MORTGAGE BACKED SECURITIES – 18.34% | | | | | | | | |
| | | | | | | | | |
| 225 Liberty Street Trust | | | | | | | | |
2016-225L, 4.803%, | | | | | | | | |
02/10/2036 (a)(f) | | | 4,789,053 | | | | 4,263,589 | |
| | | | | | | | | |
| Arbor Multifamily | | | | | | | | |
| Mortgage Securities Trust | | | | | | | | |
2022-MF4, 1.403%, | | | | | | | | |
02/15/2055 (a)(f)(k) | | | 19,700,000 | | | | 1,809,766 | |
2022-MF4, 3.403%, | | | | | | | | |
02/15/2055 (a)(f) | | | 7,852,000 | | | | 6,640,549 | |
| | | | | | | | | |
| BANK | | | | | | | | |
2019-BNK16, 1.103%, | | | | | | | | |
02/15/2052 (f)(k) | | | 78,423,629 | | | | 3,586,603 | |
2019-BNK17, 0.720%, | | | | | | | | |
04/15/2052 (f)(k) | | | 123,653,000 | | | | 4,046,779 | |
2019-BNK17, 1.748%, | | | | | | | | |
04/15/2052 (a)(f)(k) | | | 11,541,000 | | | | 967,032 | |
2019-BNK21, 1.232%, | | | | | | | | |
10/17/2052 (a)(f)(k) | | | 18,699,333 | | | | 1,172,356 | |
2019-BNK21, 2.808%, | | | | | | | | |
10/17/2052 | | | 11,582,000 | | | | 10,856,547 | |
2019-BNK23, 0.266%, | | | | | | | | |
12/15/2052 (f)(k) | | | 238,421,000 | | | | 2,918,321 | |
2019-BNK23, 0.811%, | | | | | | | | |
12/15/2052 (f)(k) | | | 85,144,685 | | | | 3,384,127 | |
2020-BNK29, 0.726%, | | | | | | | | |
11/15/2053 (f)(k) | | | 132,417,000 | | | | 5,702,392 | |
2020-BNK29, 2.500%, | | | | | | | | |
11/15/2053 (a) | | | 1,250,000 | | | | 880,592 | |
2020-BNK29, 3.134%, | | | | | | | | |
11/15/2053 (f) | | | 1,170,000 | | | | 926,239 | |
2020-BNK30, 2.500%, | | | | | | | | |
12/15/2053 (a)(f) | | | 5,550,000 | | | | 3,923,308 | |
2020-BNK30, 2.757%, | | | | | | | | |
12/15/2053 (f) | | | 2,450,000 | | | | 1,889,963 | |
2021-BNK31, 1.739%, | | | | | | | | |
02/15/2054 | | | 7,250,000 | | | | 6,341,294 | |
2021-BNK32, 2.332%, | | | | | | | | |
04/15/2054 | | | 10,727,500 | | | | 9,613,534 | |
2021-BNK32, 2.500%, | | | | | | | | |
04/15/2054 (a) | | | 5,000,000 | | | | 3,431,549 | |
2019-BNK20, 2.933%, | | | | | | | | |
09/15/2062 | | | 2,100,000 | | | | 1,975,362 | |
2019-BNK24, 0.303%, | | | | | | | | |
11/15/2062 (f)(k) | | | 174,693,000 | | | | 2,379,004 | |
2020-BNK25, 0.997%, | | | | | | | | |
01/15/2063 (f)(k) | | | 108,835,348 | | | | 5,406,037 | |
2020-BNK26, 0.716%, | | | | | | | | |
03/15/2063 (f)(k) | | | 226,593,000 | | | | 8,682,636 | |
2020-BNK28, 1.088%, | | | | | | | | |
03/15/2063 (f)(k) | | | 29,969,467 | | | | 1,891,406 | |
2020-BNK26, 2.041%, | | | | | | | | |
03/15/2063 | | | 5,200,000 | | | | 4,687,400 | |
2021-BNK34, 1.087%, | | | | | | | | |
06/15/2063 (f)(k) | | | 95,726,145 | | | | 5,763,403 | |
2021-BNK34, 2.754%, | | | | | | | | |
06/15/2063 (f) | | | 8,000,000 | | | | 6,565,478 | |
2022-BNK40, 2.500%, | | | | | | | | |
03/15/2064 (a) | | | 2,470,000 | | | | 1,669,528 | |
2021-BNK33, 2.218%, | | | | | | | | |
05/15/2064 | | | 12,599,000 | | | | 11,212,543 | |
Percentages are stated as a percent of net assets.
The accompanying notes are an integral part of these financial statements.
PERFORMANCE TRUST MUTUAL FUNDS (PTIAX, PTAOX, PTCOX, PTIMX, PTRMX, PTCRX)
PERFORMANCE TRUST STRATEGIC BOND FUND — SCHEDULE OF INVESTMENTS (CONT.)
August 31, 2022
| | PRINCIPAL | | | |
| | AMOUNT | | VALUE | |
| | | | | |
| BANK (Cont.) | | | | |
| 2021-BNK35, 1.154%, | | | | |
| 06/15/2064 (f)(k) | $ | 48,678,313 | | $ | 3,107,219 | |
| 2021-BNK35, 2.067%, | | | | | | |
| 06/15/2064 | | 10,400,000 | | | 9,123,686 | |
| 2021-BNK35, 2.902%, | | | | | | |
| 06/15/2064 (f) | | 7,650,000 | | | 5,980,098 | |
| 2021-BNK36, 1.021%, | | | | | | |
| 09/15/2064 (f)(k) | | 93,845,155 | | | 4,794,042 | |
| 2021-BNK36, 2.283%, | | | | | | |
| 09/15/2064 | | 12,250,000 | | | 10,911,281 | |
| 2021-BNK37, 2.487%, | | | | | | |
| 11/15/2064 | | 14,400,000 | | | 12,909,276 | |
| | | | | | | |
| Barclays Commercial | | | | | | |
| Mortgage Trust | | | | | | |
| | 2019-C3, 0.933%, | | | | | | |
| 05/15/2052 (f)(k) | | 56,340,000 | | | 2,497,259 | |
| | 2019-C4, 1.276%, | | | | | | |
| 08/15/2052 (f)(k) | | 43,170,000 | | | 2,748,604 | |
| | 2019-C5, 0.500%, | | | | | | |
| 11/15/2052 (f)(k) | | 174,774,000 | | | 3,561,649 | |
| | 2019-C5, 1.480%, | | | | | | |
| 11/15/2052 (a)(f)(k) | | 12,996,000 | | | 952,602 | |
| | | | | | | |
| BBCMS Mortgage Trust | | | | | | |
| | 2020-C6, 0.790%, | | | | | | |
| 02/15/2053 (f)(k) | | 59,000,000 | | | 2,556,854 | |
| | 2020-C6, 1.165%, | | | | | | |
| 02/15/2053 (f)(k) | | 93,159,998 | | | 5,249,743 | |
| | 2020-C7, 1.100%, | | | | | | |
| 04/15/2053 (f)(k) | | 17,140,000 | | | 1,069,862 | |
| | 2020-C7, 1.738%, | | | | | | |
| 04/15/2053 (f)(k) | | 22,021,171 | | | 1,725,070 | |
| | 2021-C9, 1.118%, | | | | | | |
| 02/15/2054 (f)(k) | | 68,467,000 | | | 4,614,826 | |
| 2021-C9, 1.960%, 02/15/2054 | | 10,000,000 | | | 8,872,407 | |
| 2021-C9, 2.534%, 02/15/2054 | | 8,500,000 | | | 7,047,897 | |
| | 2021-C10, 1.146%, | | | | | | |
| 07/15/2054 (f)(k) | | 73,112,500 | | | 5,201,128 | |
| | 2021-C10, 1.424%, | | | | | | |
| 07/15/2054 (f)(k) | | 65,364,545 | | | 5,088,597 | |
| 2021-C10, 2.268%, 07/15/2054 | | 10,000,000 | | | 8,901,078 | |
| | 2021-C11, 1.083%, | | | | | | |
| 09/15/2054 (f)(k) | | 29,540,000 | | | 2,061,780 | |
| | 2021-C12, 0.712%, | | | | | | |
| 11/15/2054 (f)(k) | | 59,992,000 | | | 2,766,495 | |
| | 2021-C12, 1.075%, | | | | | | |
| 11/15/2054 (f)(k) | | 101,780,083 | | | 6,125,787 | |
| | 2021-C12, 2.500%, | | | | | | |
| 11/15/2054 (a) | | 4,750,000 | | | 3,185,044 | |
| 2021-C12, 2.542%, 11/15/2054 | | 12,000,000 | | | 10,750,568 | |
| 2021-C12, 2.758%, 11/15/2054 | | 9,000,000 | | | 7,244,208 | |
| | 2022-C14, 0.374%, | | | | | | |
| 02/15/2055 (f)(k) | | 166,823,000 | | | 4,163,302 | |
| | 2022-C14, 0.853%, | | | | | | |
| 02/15/2055 (f)(k) | | 100,240,222 | | | 4,666,874 | |
| | 2022-C15, 1.459%, | | | | | | |
| 04/15/2055 (a)(f)(k) | | 25,000,000 | | | 2,493,485 | |
| | 2022-C17, 1.152%, | | | | | | |
| 09/15/2055 (f)(k) | | 65,310,000 | | | 5,652,816 | |
| | | | | | | |
| Benchmark Mortgage Trust | | | | | | |
| | 2019-B9, 1.201%, | | | | | | |
| 03/15/2052 (f)(k) | | 29,617,462 | | | 1,511,503 | |
| | 2019-B9, 2.168%, | | | | | | |
| 03/15/2052 (a)(f)(k) | | 11,513,000 | | | 1,175,622 | |
| | 2019-B12, 0.541%, | | | | | | |
| 08/15/2052 (a)(f)(k) | | 93,260,000 | | | 2,184,793 | |
| | 2020-B16, 0.302%, | | | | | | |
| 02/15/2053 (a)(f)(k) | | 70,467,000 | | | 1,080,463 | |
| | 2020-B16, 1.046%, | | | | | | |
| 02/15/2053 (f)(k) | | 102,902,776 | | | 5,352,478 | |
| | 2020-B20, 0.696%, | | | | | | |
| 10/15/2053 (f)(k) | | 79,394,000 | | | 2,915,689 | |
| 2020-B21, 1.798%, 12/17/2053 | | 5,966,000 | | | 5,250,766 | |
| 2020-B22, 1.731%, 01/15/2054 | | 2,490,000 | | | 2,160,625 | |
| | 2021-B23, 1.012%, | | | | | | |
| 02/15/2054 (a)(f)(k) | | 105,441,000 | | | 6,539,029 | |
| | 2021-B23, 1.380%, | | | | | | |
| 02/15/2054 (f)(k) | | 125,664,051 | | | 9,127,621 | |
| 2021-B23, 1.766%, 02/15/2054 | | 5,000,000 | | | 4,365,184 | |
| | 2021-B24, 0.708%, | | | | | | |
| 03/15/2054 (f)(k) | | 99,123,000 | | | 4,226,525 | |
| | 2021-B24, 1.270%, | | | | | | |
| 03/15/2054 (f)(k) | | 66,615,358 | | | 4,360,708 | |
| 2021-B24, 2.256%, 03/15/2054 | | 5,400,000 | | | 4,813,965 | |
| | 2021-B25, 0.780%, | | | | | | |
| 04/15/2054 (f)(k) | | 93,350,000 | | | 4,445,906 | |
| | 2021-B25, 1.224%, | | | | | | |
| 04/15/2054 (f)(k) | | 79,358,356 | | | 5,342,270 | |
| | 2021-B26, 1.481%, | | | | | | |
| 06/15/2054 (a)(f)(k) | | 10,836,000 | | | 1,005,992 | |
| 2021-B26, 2.000%, 06/15/2054 (a) | | 2,250,000 | | | 1,463,692 | |
| 2021-B26, 2.688%, 06/15/2054 (f) | | 6,000,000 | | | 4,828,675 | |
| | 2021-B27, 1.385%, | | | | | | |
| 07/15/2054 (f)(k) | | 100,667,621 | | | 7,733,367 | |
| | 2021-B27, 1.604%, | | | | | | |
| 07/15/2054 (a)(f)(k) | | 21,507,000 | | | 2,189,606 | |
| 2021-B27, 2.000%, 07/15/2054 (a) | | 5,000,000 | | | 3,239,124 | |
| 2021-B27, 2.355%, 07/15/2054 | | 6,000,000 | | | 4,785,524 | |
| 2021-B27, 2.703%, 07/15/2054 | | 2,000,000 | | | 1,570,961 | |
| | 2021-B28, 1.068%, | | | | | | |
| 08/15/2054 (f)(k) | | 32,491,000 | | | 2,243,926 | |
Percentages are stated as a percent of net assets.The accompanying notes are an integral part of these financial statements.
PERFORMANCE TRUST MUTUAL FUNDS (PTIAX, PTAOX, PTCOX, PTIMX, PTRMX, PTCRX)
PERFORMANCE TRUST STRATEGIC BOND FUND — SCHEDULE OF INVESTMENTS (CONT.)
August 31, 2022
| | PRINCIPAL | | | |
| | AMOUNT | | VALUE | |
| | | | | |
| Benchmark Mortgage Trust (Cont.) | | | | |
| | 2021-B28, 1.398%, | | | | |
| 08/15/2054 (f)(k) | $ | 86,248,065 | | $ | 6,714,860 | |
| 2021-B28, 1.980%, 08/15/2054 | | 10,000,000 | | | 8,669,276 | |
| | 2021-B29, 1.417%, | | | | | | |
| 09/15/2054 (a)(f)(k) | | 27,615,000 | | | 2,430,473 | |
| 2021-B29, 2.000%, 09/15/2054 (a) | | 8,953,000 | | | 5,193,189 | |
| | 2021-B30, 0.594%, | | | | | | |
| 11/15/2054 (a)(f)(k) | | 83,683,000 | | | 3,461,380 | |
| | 2021-B30, 1.410%, | | | | | | |
| 11/15/2054 (a)(f)(k) | | 18,582,000 | | | 1,646,644 | |
| 2021-B30, 2.000%, 11/15/2054 (a) | | 2,250,000 | | | 1,324,028 | |
| 2021-B30, 2.000%, 11/15/2054 (a) | | 1,500,000 | | | 956,222 | |
| 2021-B30, 2.431%, 11/15/2054 | | 5,250,000 | | | 4,671,430 | |
| 2021-B30, 2.990%, 11/15/2054 (f) | | 7,250,000 | | | 5,627,174 | |
| | 2021-B31, 0.541%, | | | | | | |
| 12/15/2054 (a)(f)(k) | | 124,409,000 | | | 4,280,939 | |
| | 2021-B31, 0.887%, | | | | | | |
| 12/15/2054 (f)(k) | | 143,755,666 | | | 7,419,704 | |
| | 2021-B31, 1.256%, | | | | | | |
| 12/15/2054 (a)(f)(k) | | 31,991,000 | | | 2,571,952 | |
| 2021-B31, 2.250%, 12/15/2054 (a) | | 3,000,000 | | | 1,911,748 | |
| 2021-B31, 2.615%, 12/15/2054 | | 10,000,000 | | | 9,013,955 | |
| 2021-B31, 3.195%, 12/15/2054 (f) | | 5,000,000 | | | 3,966,610 | |
| | 2022-B32, 1.639%, | | | | | | |
| 01/15/2055 (a)(f)(k) | | 39,202,000 | | | 3,982,198 | |
| 2022-B32, 2.000%, 01/15/2055 (a) | | 10,000,000 | | | 6,210,539 | |
| | 2022-B32, 3.528%, | | | | | | |
| 01/15/2055 (f) | | 10,000,000 | | | 8,782,228 | |
| | 2022-B33, 1.736%, | | | | | | |
| 03/15/2055 (a)(f)(k) | | 21,919,000 | | | 2,438,511 | |
| | 2019-B13, 0.536%, | | | | | | |
| 08/15/2057 (a)(f)(k) | | 82,774,000 | | | 1,928,907 | |
| | 2019-B13, 1.637%, | | | | | | |
| 08/15/2057 (a)(f)(k) | | 12,071,000 | | | 1,002,967 | |
| | | | | | | |
| BMO Mortgage Trust | | | | | | |
| | 2022-C1, 1.892%, | | | | | | |
| 02/15/2055 (a)(f)(k) | | 30,550,000 | | | 3,808,155 | |
| 2022-C1, 3.468%, 02/15/2055 (f) | | 10,000,000 | | | 8,536,554 | |
| | | | | | | |
| California Housing | | | | | | |
| Finance Agency | | | | | | |
| 2021-2, 0.844%, 03/25/2035 (f)(k) | | 32,142,065 | | | 1,878,704 | |
| 0.796%, 11/20/2035 (k) | | 28,403,464 | | | 1,641,436 | |
| 2021-3, 0.788%, 08/20/2036 (f)(k) | | 26,004,105 | | | 1,636,958 | |
| | | | | | | |
| Cantor Commercial | | | | | | |
| Real Estate Lending | | | | | | |
| 2019-CF2, 0.749%, | | | | | | |
| 11/15/2052 (f)(k) | | 134,736,000 | | | 4,915,816 | |
| | | | | | | |
| CCUBS Commercial | | | | | | |
| Mortgage Trust | | | | | | |
| | 2017-C1, 0.424%, | | | | | | |
| 11/15/2050 (f)(k) | | 40,062,667 | | | 580,312 | |
| | | | | | | |
| CD Mortgage Trust | | | | | | |
| 2017-CD3, 0.715%, | | | | | | |
| 02/10/2050 (f)(k) | | 61,857,000 | | | 1,426,125 | |
| 2018-CD7, 4.213%, 08/15/2051 | | 3,236,000 | | | 3,208,760 | |
| | | | | | | |
| CGMS Commercial | | | | | | |
| Mortgage Trust | | | | | | |
| | 2017-B1, 0.296%, | | | | | | |
| 08/15/2050 (f)(k) | | 38,016,000 | | | 338,989 | |
| | | | | | | |
| Citigroup Commercial | | | | | | |
| Mortgage Trust | | | | | | |
| 2013-GC17, 5.252%, | | | | | | |
| 11/10/2046 (f) | | 5,000,000 | | | 4,872,482 | |
| 2014-GC19, 4.805%, | | | | | | |
| 03/10/2047 (f) | | 3,030,000 | | | 2,998,612 | |
| 2014-GC19, 5.258%, | | | | | | |
| 03/10/2047 (f) | | 2,882,579 | | | 2,841,616 | |
| 2016-C1, 4.117%, 05/10/2049 | | 3,000,000 | | | 2,799,904 | |
| 2016-C1, 5.107%, 05/10/2049 (f) | | 7,858,000 | | | 7,467,828 | |
| 2016-P6, 4.303%, 12/10/2049 (f) | | 6,835,000 | | | 6,327,175 | |
| | 2017-P7, 0.755%, | | | | | | |
| 04/14/2050 (f)(k) | | 45,124,000 | | | 1,108,214 | |
| 2017-P8, 4.192%, 09/15/2050 | | 4,160,000 | | | 3,894,821 | |
| 2017-P8, 4.406%, 09/15/2050 (f) | | 5,000,000 | | | 4,550,793 | |
| | 2017-C4, 0.382%, | | | | | | |
| 10/12/2050 (f)(k) | | 42,746,500 | | | 549,357 | |
| | 2017-C4, 1.224%, | | | | | | |
| 10/12/2050 (f)(k) | | 31,371,098 | | | 1,099,272 | |
| | 2018-B2, 0.546%, | | | | | | |
| 03/10/2051 (f)(k) | | 49,202,000 | | | 943,793 | |
| | 2018-C5, 0.331%, | | | | | | |
| 06/10/2051 (a)(f)(k) | | 28,400,000 | | | 533,673 | |
| 2018-C6, 4.343%, 11/10/2051 | | 5,000,000 | | | 4,995,966 | |
| 2020-GC46, 0.439%, | | | | | | |
| 02/15/2053 (a)(f)(k) | | 92,457,000 | | | 2,093,254 | |
| 2020-GC46, 1.103%, | | | | | | |
| 02/15/2053 (f)(k) | | 89,422,161 | | | 4,829,163 | |
| 2019-GC41, 1.182%, | | | | | | |
| 08/10/2056 (f)(k) | | 52,829,264 | | | 2,648,056 | |
| 2019-GC41, 3.018%, 08/10/2056 | | 10,339,000 | | | 9,121,665 | |
| | 2019-C7, 0.411%, | | | | | | |
| 12/15/2072 (a)(f)(k) | | 50,711,000 | | | 946,318 | |
| | 2019-C7, 0.997%, | | | | | | |
| 12/15/2072 (f)(k) | | 76,074,289 | | | 3,620,893 | |
| | 2019-C7, 1.328%, | | | | | | |
| 12/15/2072 (a)(f)(k) | | 39,933,000 | | | 2,771,949 | |
| 2019-C7, 3.667%, 12/15/2072 (f) | | 10,000,000 | | | 8,934,246 | |
| | | | | | | |
| COMM Mortgage Trust | | | | | | |
| 2014-CR18, 4.456%, | | | | | | |
| 07/15/2047 (f) | | 4,550,700 | | | 4,407,928 | |
| 2013-CR11, 1.067%, | | | | | | |
| 08/10/2050 (f)(k) | | 49,040,777 | | | 305,666 | |
| 2019-GC44, 1.142%, | | | | | | |
| 08/15/2057 (a)(f)(k) | | 19,460,000 | | | 1,175,608 | |
Percentages are stated as a percent of net assets.The accompanying notes are an integral part of these financial statements.
PERFORMANCE TRUST MUTUAL FUNDS (PTIAX, PTAOX, PTCOX, PTIMX, PTRMX, PTCRX)
PERFORMANCE TRUST STRATEGIC BOND FUND — SCHEDULE OF INVESTMENTS (CONT.)
August 31, 2022
| | PRINCIPAL | | | |
| | AMOUNT | | VALUE | |
| | | | | |
| Connecticut Avenue | | | | |
| Securities Trust | | | | |
| | 2021-R03, 4.933% | | | | |
| (SOFR30A + 2.750%), | | | | |
| 12/25/2041 (a)(b) | $ | 5,685,000 | | $ | 5,168,372 | |
| | 2022-R02, 5.183% | | | | | | |
| (SOFR30A + 3.000%), | | | | | | |
| 01/25/2042 (a)(b) | | 10,000,000 | | | 9,620,237 | |
| | | | | | | |
| CSAIL Commercial | | | | | | |
| Mortgage Trust | | | | | | |
| | 2016-C5, 1.000% | | | | | | |
| 11/15/2048 (a)(f)(k) | | 46,821,000 | | | 1,222,782 | |
| | 2015-C1, 0.500% | | | | | | |
| 04/15/2050 (a)(f)(k) | | 62,192,000 | | | 602,746 | |
| | 2017-C8, 0.447% | | | | | | |
| 06/15/2050 (f)(k) | | 74,773,000 | | | 1,072,447 | |
| | 2019-C17, 1.498% | | | | | | |
| 09/15/2052 (f)(k) | | 85,035,379 | | | 5,647,013 | |
| | 2019-C18, 1.194% | | | | | | |
| 12/15/2052 (f)(k) | | 91,063,736 | | | 4,552,112 | |
| | | | | | | |
| Freddie Mac Multifamily | | | | | | |
| Structured Credit Risk | | | | | | |
| 2021-MN3, 6.183% | | | | | | |
| (SOFR30A + 4.000%), | | | | | | |
| 11/25/2051 (a)(b) | | 7,000,000 | | | 6,289,872 | |
| | | | | | | |
| FREMF Mortgage Trust | | | | | | |
| 2019-KF62, 4.412% | | | | | | |
| (1 Month LIBOR USD + 2.050%), | | | | | | |
| 04/25/2026 (a)(b) | | 1,574,816 | | | 1,542,285 | |
| | 2019-K735, 4.156% | | | | | | |
| 05/25/2026 (a)(f) | | 6,000,000 | | | 5,831,822 | |
2018-KF48, 4.412% | | | | | | |
| (1 Month LIBOR USD + 2.050%), | | | | | | |
| 06/25/2028 (a)(b) | | 4,516,885 | | | 4,340,528 | |
2018-KF50, 4.262% | | | | | | |
| (1 Month LIBOR USD + 1.900%), | | | | | | |
| 07/25/2028 (a)(b) | | 2,452,343 | | | 2,416,142 | |
| | 2019-K734, 4.190% | | | | | | |
| 02/25/2051 (a)(f) | | 5,000,000 | | | 4,871,468 | |
| | 2019-K101, 3.640% | | | | | | |
| 10/25/2052 (a)(f) | | 10,000,000 | | | 9,098,336 | |
| | | | | | | |
| GS Mortgage Securities Corp. II | | | | | | |
| 2012-BWTR, 3.255%, | | | | | | |
| 11/05/2034 (a)(d) | | 6,608,000 | | | 6,165,801 | |
| 2018-GS10, 1.555%, | | | | | | |
| 07/10/2051 (a)(f)(k) | | 24,049,000 | | | 1,740,554 | |
| | | | | | | |
| GS Mortgage Securities Trust | | | | | | |
| 2015-GC32, 4.548%, | | | | | | |
| 07/10/2048 (f) | | 5,853,000 | | | 5,649,372 | |
| 2016-GS3, 3.395%, | | | | | | |
| 10/10/2049 (f) | | 10,417,000 | | | 9,279,355 | |
| 2015-GC30, 4.161%, | | | | | | |
| 05/10/2050 (f) |
| 2,960,000 | |
| 2,827,581 | |
| 2017-GS8, 0.527%, | | | | | | |
| 11/10/2050 (f)(k) | | 44,642,000 | | | 805,074 | |
| 2019-GC38, 1.994%, | | | | | | |
| 02/10/2052 (a)(f)(k) | | 20,916,000 | | | 2,041,270 | |
| 2019-GC39, 0.789%, | | | | | | |
| 05/10/2052 (f)(k) | | 69,588,000 | | | 2,568,152 | |
| 2019-GC39, 1.776%, | | | | | | |
| 05/10/2052 (a)(f)(k) | | 8,215,000 | | | 716,452 | |
| 2019-GSA1, 0.948%, | | | | | | |
| 11/10/2052 (f)(k) | | 72,291,279 | | | 3,285,624 | |
| 2020-GSA2, 1.054%, | | | | | | |
| 12/12/2053 (a)(f)(k) | | 73,324,000 | | | 4,632,933 | |
| | | | | | | |
| JP Morgan Chase Commercial | | | | | | |
| Mortgage Securities Trust | | | | | | |
| 2015-JP1, 4.883%, 01/15/2049 (f) | | 7,485,000 | | | 7,088,495 | |
| 2007-CB20, 0.000%, | | | | | | |
| 02/12/2051 (a)(d)(f)(h)(k) | | 198,958 | | | — | |
| | | | | | | |
| JPMBB Commercial | | | | | | |
| Mortgage Securities Trust | | | | | | |
| | 2015-C30, 4.373% | | | | | | |
| 07/15/2048 (f) | | 3,085,000 | | | 2,913,010 | |
| | 2015-C32, 0.500% | | | | | | |
| 11/15/2048 (a)(f)(k) | | 23,066,000 | | | 290,862 | |
| | | | | | | |
| JPMCC Commercial | | | | | | |
| Mortgage Securities Trust | | | | | | |
| 2017-JP6, 0.711%, | | | | | | |
| 07/15/2050 (f)(k) | | 68,830,000 | | | 1,875,452 | |
| | | | | | | |
| JPMDB Commercial | | | | | | |
| Mortgage Securities Trust | | | | | | |
| 2016-C4, 3.638%, 12/15/2049 (f) | | 5,500,000 | | | 4,937,915 | |
| | | | | | | |
| Morgan Stanley Bank of | | | | | | |
| America Merrill Lynch Trust | | | | | | |
| 2013-C12, 4.482%, 10/15/2046 (f) | | 5,000,000 | | | 4,944,634 | |
| 2015-C27, 4.650%, 12/15/2047 (f) | | 3,000,000 | | | 2,886,426 | |
| 2015-C25, 4.677%, 10/15/2048 (f) | | 5,195,000 | | | 4,963,914 | |
| | 2016-C31, 1.409% | | | | | | |
| 11/15/2049 (a)(f)(k) | | 21,212,500 | | | 900,466 | |
| 2015-C23, 4.281%, 07/15/2050 (f) | | 3,845,000 | | | 3,709,891 | |
| 2017-C34, 2.700%, 11/15/2052 (a) | | 4,328,000 | | | 3,150,606 | |
| 2017-C34, 4.111%, 11/15/2052 (f) | | 5,054,000 | | | 4,699,382 | |
| | | | | | | |
| Morgan Stanley Capital I Trust | | | | | | |
| 2016-BNK2, 0.659%, | | | | | | |
| 11/15/2049 (f)(k) | | 58,680,000 | | | 1,156,442 | |
| | 2017-H1, 2.310% | | | | | | |
| 06/15/2050 (a)(f)(k) | | 8,725,000 | | | 724,876 | |
| 2017-H1, 4.281%, 06/15/2050 (f) | | 5,380,000 | | | 4,964,752 | |
| | 2018-H3, 0.533% | | | | | | |
| 07/15/2051 (f)(k) | | 135,712,000 | | | 2,601,056 | |
Percentages are stated as a percent of net assets.The accompanying notes are an integral part of these financial statements.
PERFORMANCE TRUST MUTUAL FUNDS (PTIAX, PTAOX, PTCOX, PTIMX, PTRMX, PTCRX)
PERFORMANCE TRUST STRATEGIC BOND FUND — SCHEDULE OF INVESTMENTS (CONT.)
August 31, 2022
| | PRINCIPAL | | | |
| | AMOUNT | | VALUE | |
| | | | | |
| Morgan Stanley Capital I Trust (Cont.) | | | | |
| | 2018-H3, 2.025%, | | | | |
| 07/15/2051 (a)(f)(k) | $ | 15,363,500 | | $ | 1,308,938 | |
2018-H3, 4.120%, 07/15/2051 | | 5,000,000 | | | 4,928,858 | |
| | 2019-L2, 0.790%, | | | | | | |
| 03/15/2052 (f)(k) | | 127,093,000 | | | 4,536,102 | |
| | 2019-H7, 0.806%, | | | | | | |
| 07/15/2052 (f)(k) | | 130,723,000 | | | 4,950,794 | |
2019-H7, 3.000%, 07/15/2052 (a) | | 2,402,000 | | | 1,837,698 | |
2019-H7, 4.128%, 07/15/2052 | | 9,593,000 | | | 8,447,666 | |
| | 2021-L5, 0.837%, | | | | | | |
| 05/15/2054 (f)(k) | | 70,387,500 | | | 3,667,048 | |
2021-L5, 2.500%, 05/15/2054 (a) | | 3,500,000 | | | 2,387,977 | |
2021-L5, 3.102%, 05/15/2054 | | 6,627,000 | | | 5,544,945 | |
2021-L6, 2.250%, 06/15/2054 (f) | | 11,900,000 | | | 10,484,858 | |
2021-L6, 2.951%, 06/15/2054 (f) | | 7,500,000 | | | 6,128,286 | |
| | 2021-L7, 0.526%, | | | | | | |
| 10/15/2054 (f)(k) | | 143,080,000 | | | 4,682,965 | |
2021-L7, 2.336%, 10/15/2054 | | 15,100,000 | | | 13,353,398 | |
| | | | | | | |
| UBS Commercial Mortgage Trust | | | | | | |
| | 2017-C1, 1.106%, | | | | | | |
| 06/15/2050 (f)(k) | | 13,000,000 | | | 513,711 | |
| | 2017-C7, 0.480%, | | | | | | |
| 12/15/2050 (f)(k) | | 170,396,000 | | | 2,886,423 | |
| | 2017-C6, 0.565%, | | | | | | |
| 12/15/2050 (f)(k) | | 63,420,500 | | | 1,489,196 | |
| | 2018-C12, 0.341%, | | | | | | |
| 08/15/2051 (f)(k) | | 139,858,000 | | | 2,491,430 | |
| | 2018-C12, 0.947%, | | | | | | |
| 08/15/2051 (f)(k) | | 47,331,815 | | | 1,774,082 | |
| | 2018-C13, 0.376%, | | | | | | |
| 10/15/2051 (f)(k) | | 128,678,000 | | | 2,486,934 | |
| | 2018-C13, 2.139%, | | | | | | |
| 10/15/2051 (a)(f)(k) | | 16,442,000 | | | 1,698,126 | |
2018-C13, 4.241%, 10/15/2051 | | 3,274,000 | | | 3,236,793 | |
| | 2018-C14, 0.433%, | | | | | | |
| 12/15/2051 (f)(k) | | 114,392,000 | | | 2,257,926 | |
| | 2019-C17, 0.994%, | | | | | | |
| 10/15/2052 (f)(k) | | 128,213,000 | | | 6,452,717 | |
2019-C18, 2.987%, 12/15/2052 | | 4,500,000 | | | 4,238,096 | |
2019-C18, 3.378%, 12/15/2052 (f) | | 9,000,000 | | | 8,026,445 | |
| | | | | | | |
| Washington State Housing | | | | | | |
| Finance Commission | | | | | | |
0.725%, 12/20/2035 (k) | | 20,896,118 | | | 1,105,196 | |
| | | | | | | |
| Wells Fargo Commercial | | | | | | |
| Mortgage Trust | | | | | | |
2015-NXS1, 3.658%, | | | | | | |
| 05/15/2048 (f) | | 1,320,000 | | | 1,250,567 | |
2015-C28, 4.219%, 05/15/2048 (f) | | 10,000,000 | | | 9,386,539 | |
2015-C28, 4.219%, 05/15/2048 (f) | | 4,376,000 | | | 3,872,311 | |
2016-LC24, 1.123%, | | | | | | |
| 10/15/2049 (f)(k) | | 66,264,075 | | | 2,267,331 | |
| | 2016-C37, 3.338%, | | | | | | |
| 12/15/2049 (a)(f) | | 3,350,000 | | | 2,677,808 | |
2016-C37, 4.638%, 12/15/2049 (f) | | 5,695,000 | | | 5,282,172 | |
2017-RB1, 0.851%, | | | | | | |
| 03/15/2050 (f)(k) | | 69,254,209 | | | 2,032,632 | |
| | 2017-C42, 0.469%, | | | | | | |
| 12/15/2050 (f)(k) | | 116,750,000 | | | 1,976,741 | |
| | 2018-C48, 0.376%, | | | | | | |
| 01/15/2052 (f)(k) | | 138,642,000 | | | 2,220,975 | |
2018-C48, 4.245%, 01/15/2052 | | 7,000,000 | | | 6,947,424 | |
| | 2019-C49, 0.773%, | | | | | | |
| 03/15/2052 (f)(k) | | 125,812,000 | | | 4,413,586 | |
2019-C49, 3.933%, 03/15/2052 | | 5,000,000 | | | 4,911,367 | |
2019-C49, 4.546%, 03/15/2052 | | 4,647,000 | | | 4,390,176 | |
| | 2019-C50, 1.056%, | | | | | | |
| 05/15/2052 (f)(k) | | 36,427,311 | | | 1,830,330 | |
| | 2019-C51, 0.825%, | | | | | | |
| 06/15/2052 (f)(k) | | 130,394,000 | | | 4,908,682 | |
| | 2019-C52, 1.256%, | | | | | | |
| 08/15/2052 (f)(k) | | 113,763,146 | | | 7,061,813 | |
| | 2019-C52, 1.751%, | | | | | | |
| 08/15/2052 (f)(k) | | 57,753,640 | | | 4,422,872 | |
| | 2019-C53, 0.582%, | | | | | | |
| 10/15/2052 (f)(k) | | 105,325,000 | | | 3,068,907 | |
2019-C53, 3.514%, 10/15/2052 (f) | | 5,200,000 | | | 4,486,243 | |
| | 2020-C55, 0.946%, | | | | | | |
| 02/15/2053 (f)(k) | | 58,030,370 | | | 2,885,386 | |
| | 2020-C56, 0.371%, | | | | | | |
| 06/15/2053 (f)(k) | | 127,035,000 | | | 2,491,906 | |
2020-C56, 2.422%, 06/15/2053 | | 2,250,000 | | | 2,055,573 | |
| | 2020-C58, 1.252%, | | | | | | |
| 07/15/2053 (f)(k) | | 109,974,000 | | | 8,152,735 | |
| | 2020-C57, 0.812%, | | | | | | |
| 08/15/2053 (f)(k) | | 74,972,000 | | | 3,556,792 | |
2020-C57, 1.914%, 08/15/2053 | | 7,250,000 | | | 6,430,799 | |
| | 2021-C59, 1.039%, | | | | | | |
| 04/15/2054 (f)(k) | | 65,782,000 | | | 4,066,946 | |
| | 2021-C59, 1.582 | | | | | | |
| 04/15/2054 (a)(f)(k) | | 40,274,000 | | | 3,795,543 | |
2021-C59, 3.284%, 04/15/2054 | | 7,648,000 | | | 6,118,536 | |
| | 2021-C60, 1.225%, | | | | | | |
| 08/15/2054 (f)(k) | | 40,551,000 | | | 3,216,749 | |
| | 2021-C60, 1.675%, | | | | | | |
| 08/15/2054 (f)(k) | | 41,361,453 | | | 3,923,456 | |
2021-C60, 2.730%, 08/15/2054 | | 6,814,678 | | | 5,503,984 | |
2021-C60, 2.738%, 08/15/2054 | | 3,000,000 | | | 2,278,111 | |
| | 2021-C61, 1.520%, | | | | | | |
| 11/15/2054 (a)(f)(k) | | 9,132,000 | | | 879,282 | |
2021-C61, 2.525%, 11/15/2054 | | 15,000,000 | | | 13,311,762 | |
2021-C61, 3.113%, 11/15/2054 | | 4,221,000 | | | 3,518,415 | |
Percentages are stated as a percent of net assets.The accompanying notes are an integral part of these financial statements.
PERFORMANCE TRUST MUTUAL FUNDS (PTIAX, PTAOX, PTCOX, PTIMX, PTRMX, PTCRX)
PERFORMANCE TRUST STRATEGIC BOND FUND — SCHEDULE OF INVESTMENTS (CONT.)
August 31, 2022
| | PRINCIPAL | | | |
| | AMOUNT | | VALUE | |
| | | | | |
| Wells Fargo Commercial | | | | |
| Mortgage Trust (Cont.) | | | | |
| | 2015-C30, 4.400%, | | | | |
| 09/15/2058 (f) | $ | 5,800,000 | | $ | 5,573,268 | |
| | 2018-C47, 0.279%, | | | | | | |
| 09/15/2061 (f)(k) | | 164,144,000 | | | 1,621,693 | |
2018-C47, 4.673%, 09/15/2061 (f) | | 8,000,000 | | | 7,783,896 | |
| | | | | | | |
| WFRBS Commercial | | | | | | |
| Mortgage Trust | | | | | | |
2013-UBS1, 5.192%, | | | | | | |
| 03/15/2046 (f) | | 7,500,000 | | | 7,414,568 | |
| | | | | | | |
| TOTAL NON-AGENCY | | | | | | |
| COMMERCIAL MORTGAGE | | | | | | |
| BACKED SECURITIES | | | | | | |
| (Cost $1,226,616,621) | | | | | 1,017,240,876 | |
| | | | | | | | |
| AGENCY COMMERCIAL MORTGAGE | | | | | | |
| BACKED SECURITIES – 8.05% | | | | | | |
| | | | | | | |
| Freddie Mac Multiclass | | | | | | |
| Certificates Series | | | | | | |
| | 2015-P001, 2.038%, | | | | | | |
| 08/27/2027 (d)(f)(k) | | 70,015,000 | | | 5,384,798 | |
2020-RR09, 2.676%, | | | | | | |
| 08/27/2029 (d)(f)(k) | | 42,360,000 | | | 5,455,896 | |
| | | | | | | |
| Freddie Mac Multifamily | | | | | | |
| ML Certificates | | | | | | |
2020-ML07, 2.015%, | | | | | | |
| 10/25/2036 (a)(f)(k) | | 25,070,238 | | | 4,140,099 | |
2019-ML06, 1.132%, | | | | | | |
| 06/25/2037 (f)(k) | | 10,795,968 | | | 975,740 | |
2021-ML08, 1.869%, | | | | | | |
| 07/25/2037 (f)(k) | | 33,218,259 | | | 5,107,972 | |
2021-ML10, 2.126%, | | | | | | |
| 01/25/2038 (f)(k) | | 14,326,393 | | | 2,573,736 | |
2021-ML11, 0.771%, | | | | | | |
| 03/25/2038 (a)(f)(k) | | 34,431,237 | | | 2,055,889 | |
2021-ML10, 1.578%, | | | | | | |
| 06/25/2038 (f)(k) | | 15,216,201 | | | 2,011,430 | |
2021-ML09, 1.552%, | | | | | | |
| 02/25/2040 (a)(f)(k) | | 44,150,173 | | | 5,999,567 | |
2021-ML12, 1.300%, | | | | | | |
| 07/25/2041 (f)(k) | | 18,160,744 | | | 1,982,972 | |
| | | | | | | |
| Freddie Mac Multifamily Structured | | | | | | |
| Pass Through Certificates | | | | | | |
| K723, 1.037%, 08/25/2023 (f)(k) | | 62,555,884 | | | 402,597 | |
| K723, 0.964%, 09/25/2023 (f)(k) | | 61,645,000 | | | 474,130 | |
| K728, 0.502%, 08/25/2024 (f)(k) | | 57,412,679 | | | 408,049 | |
| K729, 0.469%, 10/25/2024 (f)(k) | | 47,606,453 | | | 268,134 | |
| K042, 1.156%, 12/25/2024 (f)(k) | | 113,412,129 | | | 2,155,352 | |
| K046, 0.465%, 03/25/2025 (f)(k) | | 435,311,147 | | | 3,450,407 | |
| K049, 0.696%, 07/25/2025 (f)(k) | | 89,946,477 | | | 1,235,379 | |
| K734, 0.785%, 02/25/2026 (f)(k) |
| 64,396,658 | |
| 1,165,702 | |
| K735, 1.094%, 05/25/2026 (f)(k) | | 58,884,535 | | | 1,716,125 | |
| K735, 1.501%, 05/25/2026 (f)(k) | | 70,547,000 | | | 3,148,230 | |
| K737, 1.119%, 10/25/2026 (f)(k) | | 20,050,000 | | | 736,198 | |
| K061, 0.176%, 11/25/2026 (f)(k) | | 72,512,000 | | | 282,202 | |
| K062, 0.305%, 12/25/2026 (f)(k) | | 79,423,000 | | | 661,999 | |
| K063, 0.416%, 01/25/2027 (f)(k) | | 370,759,130 | | | 3,893,824 | |
| K064, 0.739%, 03/25/2027 (f)(k) | | 124,569,163 | | | 2,890,677 | |
| K738, 1.481%, 03/25/2027 (f)(k) | | 24,099,000 | | | 1,301,038 | |
| K065, 0.692%, 05/25/2027 (f)(k) | | 57,193,000 | | | 1,359,409 | |
| K066, 0.887%, 06/25/2027 (f)(k) | | 31,414,324 | | | 924,674 | |
| KW03, 0.972%, 06/25/2027 (f)(k) | | 15,047,405 | | | 421,434 | |
| K067, 0.711%, 07/25/2027 (f)(k) | | 40,198,974 | | | 950,915 | |
| K068, 0.558%, 08/25/2027 (f)(k) | | 102,638,111 | | | 1,871,616 | |
| K069, 0.478%, 09/25/2027 (f)(k) | | 28,881,182 | | | 455,251 | |
| K739, 1.667%, 09/25/2027 (f)(k) | | 32,621,072 | | | 2,187,895 | |
| K072, 0.493%, 12/25/2027 (f)(k) | | 60,535,086 | | | 1,011,632 | |
| K073, 0.336%, 01/25/2028 (f)(k) | | 54,203,000 | | | 628,896 | |
| K073, 0.436%, 01/25/2028 (f)(k) | | 155,538,161 | | | 2,360,789 | |
| K742, 1.016%, 04/25/2028 (f)(k) | | 89,849,000 | | | 4,122,793 | |
| K743, 1.391%, 05/25/2028 (f)(k) | | 99,488,000 | | | 6,395,238 | |
| KW06, 0.249%, 06/25/2028 (f)(k) | | 581,366,300 | | | 4,345,190 | |
| K080, 0.265%, 07/25/2028 (f)(k) | | 428,169,997 | | | 3,457,087 | |
| K081, 0.217%, 08/25/2028 (f)(k) | | 154,070,050 | | | 881,635 | |
| K084, 0.333%, 10/25/2028 (f)(k) | | 337,476,805 | | | 4,066,596 | |
| K747, 0.486%, 12/25/2028 (f)(k) | | 160,000,000 | | | 3,563,744 | |
| K089, 0.601%, 01/25/2029 (f)(k) | | 53,965,000 | | | 1,470,811 | |
| K748, 0.638%, 01/25/2029 (f)(k) | | 175,000,000 | | | 5,486,233 | |
| K090, 0.853%, 02/25/2029 (f)(k) | | 77,716,917 | | | 3,058,821 | |
| K091, 0.634%, 03/25/2029 (f)(k) | | 53,659,000 | | | 1,561,380 | |
| K090, 0.769%, 03/25/2029 (f)(k) | | 50,517,000 | | | 1,849,230 | |
| KW09, 0.943%, 05/25/2029 (f)(k) | | 63,117,414 | | | 2,599,352 | |
| K093, 1.093%, 05/25/2029 (f)(k) | | 54,427,322 | | | 2,794,587 | |
| K094, 1.015%, 06/25/2029 (f)(k) | | 195,516,123 | | | 9,546,837 | |
| K097, 1.218%, 07/25/2029 (f)(k) | | 72,786,852 | | | 4,475,482 | |
| K097, 1.478%, 07/25/2029 (f)(k) | | 66,115,000 | | | 5,231,521 | |
| KG02, 1.148%, 08/25/2029 (f)(k) | | 32,003,005 | | | 1,742,317 | |
| K098, 1.269%, 08/25/2029 (f)(k) | | 61,923,677 | | | 3,974,336 | |
| K098, 1.517%, 08/25/2029 (f)(k) | | 24,691,000 | | | 2,012,635 | |
| K099, 1.004%, 09/25/2029 (f)(k) | | 210,527,292 | | | 10,625,523 | |
| K100, 1.033%, 09/25/2029 (f)(k) | | 62,086,000 | | | 3,426,371 | |
| K102, 0.945%, 10/25/2029 (f)(k) | | 165,465,357 | | | 7,939,210 | |
| K101, 1.206%, 10/25/2029 (f)(k) | | 65,686,000 | | | 4,324,852 | |
| K103, 0.758%, 11/25/2029 (f)(k) | | 125,237,887 | | | 4,771,538 | |
| K105, 1.889%, 01/25/2030 (f)(k) | | 64,122,000 | | | 6,950,985 | |
| K107, 1.666%, 02/25/2030 (f)(k) | | 118,898,000 | | | 11,418,643 | |
| K108, 1.780%, 03/25/2030 (f)(k) | | 70,601,000 | | | 7,344,022 | |
| K108, 1.810%, 03/25/2030 (f)(k) | | 16,044,752 | | | 1,625,176 | |
| K110, 1.814%, 04/25/2030 (f)(k) | | 29,903,753 | | | 2,982,101 | |
| K112, 1.535%, 05/25/2030 (f)(k) | | 96,407,797 | | | 8,451,204 | |
Percentages are stated as a percent of net assets.The accompanying notes are an integral part of these financial statements.
PERFORMANCE TRUST MUTUAL FUNDS (PTIAX, PTAOX, PTCOX, PTIMX, PTRMX, PTCRX)
PERFORMANCE TRUST STRATEGIC BOND FUND — SCHEDULE OF INVESTMENTS (CONT.)
August 31, 2022
| | PRINCIPAL | | | |
| | AMOUNT | | VALUE | |
| | | | | |
| Freddie Mac Multifamily Structured | | | | |
| Pass Through Certificates (Cont.) | | | | |
| K111, 1.680%, 05/25/2030 (f)(k) | $ | 108,853,071 | | $ | 10,349,369 | |
| K112, 1.766%, 05/25/2030 (f)(k) | | 44,272,000 | | | 4,699,163 | |
| K114, 1.211%, 06/25/2030 (f)(k) | | 136,308,922 | | | 9,370,162 | |
| K115, 1.429%, 06/25/2030 (f)(k) | | 54,107,510 | | | 4,356,986 | |
| K114, 1.436%, 06/25/2030 (f)(k) | | 42,500,000 | | | 3,634,043 | |
| KG03, 1.483%, 06/25/2030 (f)(k) | | 15,585,293 | | | 1,293,824 | |
| K113, 1.490%, 06/25/2030 (f)(k) | | 91,733,722 | | | 7,802,430 | |
| K115, 1.649%, 07/25/2030 (f)(k) | | 22,290,414 | | | 2,195,046 | |
| K116, 1.704%, 08/25/2030 (f)(k) | | 23,000,000 | | | 2,400,880 | |
| K118, 1.053%, 09/25/2030 (f)(k) | | 120,699,942 | | | 7,290,156 | |
| K118, 1.263%, 09/25/2030 (f)(k) | | 35,916,184 | | | 2,789,129 | |
| K121, 1.120%, 10/25/2030 (f)(k) | | 48,905,285 | | | 3,113,012 | |
| K119, 1.229%, 10/25/2030 (f)(k) | | 51,000,000 | | | 3,856,717 | |
| KG04, 0.939%, 11/25/2030 (f)(k) | | 111,084,411 | | | 6,019,164 | |
| K122, 0.973%, 11/25/2030 (f)(k) | | 111,910,977 | | | 6,292,653 | |
| K122, 1.172%, 11/25/2030 (f)(k) | | 35,211,000 | | | 2,586,818 | |
| K121, 1.290%, 11/25/2030 (f)(k) | | 49,550,000 | | | 3,979,846 | |
| K123, 1.068%, 12/25/2030 (f)(k) | | 108,000,000 | | | 7,251,790 | |
| K125, 0.676%, 01/25/2031 (f)(k) | | 179,442,171 | | | 6,936,983 | |
| K125, 0.873%, 01/25/2031 (f)(k) | | 103,992,000 | | | 5,709,816 | |
| K124, 1.027%, 01/25/2031 (f)(k) | | 89,626,000 | | | 5,794,688 | |
| K1502, 1.101%, 01/25/2031 (f)(k) | | 29,785,070 | | | 1,740,065 | |
| K127, 0.595%, 02/25/2031 (f)(k) | | 186,332,000 | | | 6,636,140 | |
| K128, 0.613%, 03/25/2031 (f)(k) | | 154,023,691 | | | 5,369,790 | |
| K128, 0.829%, 03/25/2031 (f)(k) | | 37,700,000 | | | 1,973,723 | |
| K129, 1.159%, 05/25/2031 (f)(k) | | 71,507,955 | | | 4,903,987 | |
| K129, 1.334%, 05/25/2031 (f)(k) | | 31,700,000 | | | 2,737,764 | |
| K130, 1.144%, 06/25/2031 (f)(k) | | 122,752,079 | | | 8,766,192 | |
| K131, 0.830%, 07/25/2031 (f)(k) | | 135,646,101 | | | 7,045,011 | |
| K130, 1.321%, 07/25/2031 (f)(k) | | 43,372,188 | | | 3,795,210 | |
| K138, 0.794%, 01/25/2032 (f)(k) | | 195,000,000 | | | 10,522,629 | |
| K141, 0.407%, 02/25/2032 (f)(k) | | 162,765,648 | | | 4,105,226 | |
| K141, 0.426%, 02/25/2032 (f)(k) | | 195,000,000 | | | 5,221,808 | |
| K155, 0.259%, 04/25/2033 (f)(k) | | 245,083,024 | | | 3,105,643 | |
| K1511, 0.929%, 03/25/2034 (f)(k) | | 131,943,143 | | | 8,152,160 | |
| K1512, 1.053%, 04/25/2034 (f)(k) | | 47,508,069 | | | 3,397,126 | |
| K1513, 0.994%, 08/25/2034 (f)(k) | | 75,949,155 | | | 5,148,198 | |
| K1514, 0.700%, 10/25/2034 (f)(k) | | 80,424,994 | | | 4,094,525 | |
| K1515, 1.637%, 02/25/2035 (f)(k) | | 78,693,418 | | | 10,146,092 | |
| K1516, 1.630%, 05/25/2035 (f)(k) | | 41,775,306 | | | 5,699,743 | |
| K1517, 1.443%, 07/25/2035 (f)(k) | | 81,843,936 | | | 9,874,856 | |
| K1521, 1.095%, 08/25/2036 (f)(k) | | 95,955,683 | | | 8,786,355 | |
| | | | | | | |
| FREMF Mortgage Trust | | | | | | |
| | 2018-K82, 4.269%, | | | | | | |
| 10/25/2051 (a)(f) | | 3,065,000 | | | 2,923,968 | |
| | | | | | | | |
| TOTAL AGENCY COMMERCIAL | | | | | | |
| MORTGAGE BACKED SECURITIES | | | | | | |
| (Cost $476,023,715) | | | | | 446,414,989 | |
| | | | | | | | |
| MUNICIPAL BONDS – 27.71% | | | | | | |
| | | | | | | | |
| Alabama – 0.19% | | | | | | |
| | | | | | | | |
| Alabama Federal Aid Highway | | | | | | |
| Finance Authority | | | | | | |
2.256%, 09/01/2033 |
| 12,000,000 | |
| 9,868,617 | |
| | | | | | | | |
| Baldwin County Public | | | | | | |
| Building Authority | | | | | | |
2.000%, 03/01/2046 | | 1,070,000 | | | 670,265 | |
| | | | | | | 10,538,882 | |
| Alaska – 0.32% | | | | | | |
| | | | | | | | |
| Alaska Municipal Bond | | | | | | |
| Bank Authority | | | | | | |
2.122%, 12/01/2031 | | 7,710,000 | | | 6,474,865 | |
| | | | | | | | |
| Municipality of Anchorage, AK | | | | | | |
1.896%, 09/01/2028 | | 1,685,000 | | | 1,483,809 | |
1.896%, 09/01/2028 | | 1,525,000 | | | 1,343,659 | |
5.000%, 12/01/2050 | | 8,000,000 | | | 8,365,986 | |
| | | | | | | 17,668,319 | |
| Arizona – 0.43% | | | | | | |
| | | | | | | | |
| City of Phoenix, | | | | | | |
| Civic Improvement Corp. | | | | | | |
5.000%, 07/01/2049 | | 11,055,000 | | | 11,427,097 | |
| | | | | | | | |
| City of Tucson, AZ | | | | | | |
2.232%, 07/01/2034 | | 11,605,000 | | | 8,995,702 | |
| | | | | | | | |
| Glendale Municipal | | | | | | |
| Property Corp. | | | | | | |
6.157%, 07/01/2033 | | 3,050,000 | | | 3,451,019 | |
| | | | | | | 23,873,818 | |
| California – 6.00% | | | | | | |
| | | | | | | | |
| Alvord Unified School District | | | | | | |
0.000%, 08/01/2046 (h) | | 1,975,000 | | | 2,073,485 | |
| | | | | | | | |
| California State University | | | | | | |
2.534%, 11/01/2033 | | 4,265,000 | | | 3,552,043 | |
| | | | | | | | |
| California Statewide Communities | | | | | | |
| Development Authority | | | | | | |
6.076%, 06/01/2034 | | 10,000,000 | | | 10,774,689 | |
| | | | | | | | |
| Chaffey Joint Union | | | | | | |
| High School District | | | | | | |
3.143%, 08/01/2043 | | 2,620,000 | | | 2,075,609 | |
| | | | | | | | |
| City of Chula Vista, CA | | | | | | |
1.728%, 06/01/2030 | | 2,235,000 | | | 1,830,747 | |
1.828%, 06/01/2031 | | 2,000,000 | | | 1,607,330 | |
| | | | | | | | |
| City of Corona, CA | | | | | | |
1.863%, 05/01/2028 | | 4,515,000 | | | 3,927,248 | |
| | | | | | | | |
| City of Huntington Beach, CA | | | | | | |
2.453%, 06/15/2031 | | 4,000,000 | | | 3,425,604 | |
Percentages are stated as a percent of net assets.The accompanying notes are an integral part of these financial statements.
PERFORMANCE TRUST MUTUAL FUNDS (PTIAX, PTAOX, PTCOX, PTIMX, PTRMX, PTCRX)
PERFORMANCE TRUST STRATEGIC BOND FUND — SCHEDULE OF INVESTMENTS (CONT.)
August 31, 2022
| | PRINCIPAL | | | | |
| | AMOUNT | | | VALUE | |
| | | | | | | |
| California – 6.00% (Cont.) | | | | | | |
| | | | | | | |
| City of Industry, CA | | | | | | |
4.000%, 01/01/2028 | | $ | 2,885,000 | | | $ | 2,904,445 | |
| | | | | | | | | |
| City of Los Angeles | | | | | | | | |
| Department of Airports | | | | | | | | |
1.876%, 05/15/2030 | | | 2,000,000 | | | | 1,665,851 | |
5.000%, 05/15/2046 | | | 15,000,000 | | | | 15,765,870 | |
6.582%, 05/15/2039 | | | 5,085,000 | | | | 5,825,733 | |
| | | | | | | | | |
| City of Los Angeles, CA | | | | | | | | |
3.550%, 09/01/2031 | | | 3,000,000 | | | | 2,886,391 | |
| | | | | | | | | |
| City of Montebello, CA | | | | | | | | |
3.393%, 06/01/2032 | | | 2,825,000 | | | | 2,479,359 | |
| | | | | | | | | |
| City of Ontario, CA | | | | | | | | |
3.779%, 06/01/2038 | | | 3,000,000 | | | | 2,734,052 | |
| | | | | | | | | |
| City of Orange, CA | | | | | | | | |
2.220%, 06/01/2030 | | | 7,500,000 | | | | 6,498,698 | |
2.270%, 06/01/2031 | | | 12,370,000 | | | | 10,541,392 | |
| | | | | | | | | |
| City of Sacramento, CA | | | | | | | | |
| Transient Occupancy Tax Revenue | | | | | | | | |
3.858%, 06/01/2025 | | | 3,320,000 | | | | 3,310,636 | |
| | | | | | | | | |
| City of San Francisco, CA | | | | | | | | |
| Public Utilities Commission | | | | | | | | |
| Water Revenue | | | | | | | | |
2.845%, 11/01/2041 | | | 2,000,000 | | | | 1,537,159 | |
| | | | | | | | | |
| City of Santa Ana, CA | | | | | | | | |
1.665%, 08/01/2028 | | | 5,500,000 | | | | 4,680,780 | |
1.869%, 08/01/2029 | | | 4,430,000 | | | | 3,705,758 | |
2.089%, 08/01/2030 | | | 1,860,000 | | | | 1,538,313 | |
| | | | | | | | | |
| City of South Lake Tahoe, CA | | | | | | | | |
4.000%, 06/01/2027 | | | 1,600,000 | | | | 1,593,110 | |
| | | | | | | | | |
| City of Union City, CA | | | | | | | | |
0.000%, 07/01/2025 (h) | | | 2,105,000 | | | | 1,872,053 | |
| | | | | | | | | |
| City of Whittier, CA | | | | | | | | |
1.566%, 06/01/2028 | | | 1,085,000 | | | | 923,366 | |
1.724%, 06/01/2029 | | | 1,685,000 | | | | 1,403,655 | |
| | | | | | | | | |
| Coachella Valley | | | | | | | | |
| Unified School District, CA | | | | | | | | |
0.000%, 08/01/2034 (h) | | | 1,100,000 | | | | 703,813 | |
| | | | | | | | | |
| Coast Community | | | | | | | | |
| College District | | | | | | | | |
2.957%, 08/01/2038 | | | 15,000,000 | | | | 12,257,764 | |
| | | | | | | | | |
| County of San Diego, CA | | | | | | | | |
6.029%, 08/15/2026 | | | 590,000 | | | | 626,620 | |
| | | | | | | | | |
| County of Santa Cruz, CA | | | | | | | | |
1.444%, 06/01/2028 | | | 3,385,000 | | | | 2,954,248 | |
1.661%, 06/01/2029 | | | 2,965,000 | | | | 2,561,008 | |
1.811%, 06/01/2030 | | | 3,900,000 | | | | 3,321,620 | |
| | | | | | | | | |
| East Side Union | | | | | | | | |
| High School District | | | | | | | | |
5.320%, 04/01/2036 | | | 6,765,000 | | | | 7,004,225 | |
| | | | | | | | | |
| Fullerton Public | | | | | | | | |
| Financing Authority | | | | | | | | |
7.750%, 05/01/2031 | |
| 1,265,000 | | |
| 1,456,201 | |
| | | | | | | | | |
| Gateway Unified | | | | | | | | |
| School District, CA | | | | | | | | |
0.000%, 08/01/2033 (h) | | | 2,315,000 | | | | 1,519,314 | |
0.000%, 08/01/2035 (h) | | | 2,315,000 | | | | 1,377,025 | |
0.000%, 08/01/2036 (h) | | | 2,315,000 | | | | 1,311,569 | |
| | | | | | | | | |
| Golden State Tobacco | | | | | | | | |
| Securitization Corp. | | | | | | | | |
2.787%, 06/01/2031 | | | 15,930,000 | | | | 13,571,618 | |
3.000%, 06/01/2046 | | | 12,145,000 | | | | 10,681,473 | |
| | | | | | | | | |
| Hayward Unified School District | | | | | | | | |
4.000%, 08/01/2030 | | | 2,400,000 | | | | 2,354,503 | |
| | | | | | | | | |
| Hercules Redevelopment | | | | | | | | |
| Agency Successor Agency | | | | | | | | |
4.913%, 08/01/2033 | | | 5,460,000 | | | | 5,567,450 | |
| | | | | | | | | |
| Inland Empire Tobacco | | | | | | | | |
| Securitization Corp. | | | | | | | | |
3.678%, 06/01/2038 | | | 14,415,000 | | | | 13,645,980 | |
| | | | | | | | | |
| Los Angeles County | | | | | | | | |
| Metropolitan Transportation | | | | | | | | |
| Authority Sales Tax Revenue | | | | | | | | |
5.735%, 06/01/2039 | | | 12,795,000 | | | | 14,150,588 | |
| | | | | | | | | |
| Los Angeles Housing Authority | | | | | | | | |
5.000%, 06/01/2044 | | | 6,510,000 | | | | 6,779,347 | |
| | | | | | | | | |
| Northern California Power Agency | | | | | | | | |
5.679%, 06/01/2035 | | | 9,765,000 | | | | 10,452,098 | |
| | | | | | | | | |
| Norwalk-La Mirada | | | | | | | | |
| Unified School District | | | | | | | | |
0.000%, 08/01/2038 (h) | | | 4,400,000 | | | | 2,209,140 | |
| | | | | | | | | |
| Palmdale Elementary | | | | | | | | |
| School District | | | | | | | | |
0.000%, 08/01/2029 (h) | | | 540,000 | | | | 425,987 | |
| | | | | | | | | |
| Pasadena Unified School District | | | | | | | | |
2.881%, 05/01/2037 | | | 6,030,000 | | | | 5,110,254 | |
| | | | | | | | | |
| Peralta Community | | | | | | | | |
| College District | | | | | | | | |
0.000%, 08/05/2031 (h) | | | 12,350,000 | | | | 11,078,894 | |
| | | | | | | | | |
| Placentia-Yorba Linda | | | | | | | | |
| Unified School District | | | | | | | | |
0.000%, 08/01/2035 (h) | | | 7,600,000 | | | | 4,654,299 | |
| | | | | | | | | |
| San Diego Unified School District | | | | | | | | |
0.000%, 07/01/2036 (h) | | | 7,895,000 | | | | 4,740,120 | |
| | | | | | | | | |
| San Francisco City & County | | | | | | | | |
| Airport Comm-San Francisco | | | | | | | | |
| International Airport | | | | | | | | |
5.000%, 05/01/2052 | | | 10,450,000 | | | | 10,894,150 | |
Percentages are stated as a percent of net assets.The accompanying notes are an integral part of these financial statements.
PERFORMANCE TRUST MUTUAL FUNDS (PTIAX, PTAOX, PTCOX, PTIMX, PTRMX, PTCRX)
PERFORMANCE TRUST STRATEGIC BOND FUND — SCHEDULE OF INVESTMENTS (CONT.)
August 31, 2022
| | | PRINCIPAL | | | | |
| | | AMOUNT | | | VALUE | |
| | | | | | | |
| California – 6.00% (Cont.) | | | | | | |
| | | | | | | |
| San Francisco City & | | | | | | |
| County Redevelopment Agency | | | | | | |
| Successor Agency | | | | | | |
2.743%, 08/01/2032 | | $ | 5,000,000 | | | $ | 4,232,425 | |
| | | | | | | | | |
| San Francisco City & County | | | | | | | | |
| Redevelopment Financing Authority | | | | | | | | |
0.000%, 08/01/2036 (h) | | | 5,240,000 | | | | 2,702,203 | |
5.750%, 08/01/2037 | | | 19,400,000 | | | | 21,070,352 | |
8.406%, 08/01/2039 | | | 4,820,000 | | | | 6,483,569 | |
| | | | | | | | | |
| Santa Ana Unified School District | | | | | | | | |
0.000%, 08/01/2037 (h) | | | 3,955,000 | | | | 2,146,949 | |
| | | | | | | | | |
| State of California | | | | | | | | |
7.550%, 04/01/2039 | | | 25,000,000 | | | | 33,282,390 | |
| | | | | | | | | |
| West Contra Costa | | | | | | | | |
| Unified School District | | | | | | | | |
0.000%, 08/01/2036 (h) | | | 5,000,000 | | | | 2,939,045 | |
| | | | | | | | | |
| West Sonoma County Union | | | | | | | | |
| High School District | | | | | | | | |
0.000%, 08/01/2037 (h) | | | 1,840,000 | | | | 997,375 | |
| | | | | | | | | |
| William S. Hart Union | | | | | | | | |
| High School District | | | | | | | | |
0.000%, 08/01/2036 (h) | | | 1,050,000 | | | | 630,833 | |
| | | | | | | | | |
| Yosemite Community | | | | | | | | |
| College District | | | | | | | | |
0.000%, 08/01/2038 (h) | | | 6,110,000 | | | | 3,237,240 | |
| | | | | | | | | |
| Yuba Community College District | | | | | | | | |
0.000%, 08/01/2038 (h) | | | 5,055,000 | | | | 2,653,326 | |
| | | | | | | | 332,918,391 | |
| | | | | | | | | |
| Colorado – 0.38% | | | | | | | | |
| | | | | | | | | |
| Board of Governors of Colorado | | | | | | | | |
| State University System | | | | | | | | |
2.644%, 03/01/2034 | | | 6,275,000 | | | | 5,288,180 | |
| | | | | | | | | |
| City of Fruita, CO | | | | | | | | |
| Healthcare Revenue | | | | | | | | |
5.000%, 01/01/2028 | | | 2,650,000 | | | | 2,553,366 | |
| | | | | | | | | |
| Colorado Health | | | | | | | | |
| Facilities Authority | | | | | | | | |
3.696%, 11/01/2039 | | | 4,825,000 | | | | 4,129,575 | |
3.796%, 11/01/2044 | | | 10,815,000 | | | | 8,961,431 | |
| | | | | | | | 20,932,552 | |
| | | | | | | | | |
| Connecticut – 0.45% | | | | | | | | |
| | | | | | | | | |
| State of Connecticut | | | | | | | | |
3.000%, 01/15/2037 | | | 7,075,000 | | | | 6,311,991 | |
5.850%, 03/15/2032 | | | 11,785,000 | | | | 13,041,583 | |
| | | | | | | | | |
| Town of West Hartford, CT | | | | | | | | |
2.764%, 07/01/2041 | | | 7,000,000 | | | | 5,444,215 | |
| | | | | | | | 24,797,789 | |
| | | | | | | | | |
| District of Columbia – 0.25% | | | | | | | | |
| | | | | | | | | |
| Metropolitan Washington | | | | | | | | |
| Airports Authority Dulles | | | | | | | | |
| Toll Road Revenue | | | | | | | | |
8.000%, 10/01/2047 | | | 10,310,000 | | | | 14,008,010 | |
| | | | | | | | | |
| Florida – 2.29% | | | | | | | | |
| | | | | | | | | |
| City of Gainesville, FL | | | | | | | | |
0.000%, 10/01/2027 (h) | | | 4,610,000 | | | | 3,692,843 | |
0.000%, 10/01/2028 (h) | | | 1,400,000 | | | | 1,068,992 | |
| | | | | | | | | |
| County of Lee, FL | | | | | | | | |
| Airport Revenue | | | | | | | | |
5.000%, 10/01/2046 | | | 22,760,000 | | | | 23,615,539 | |
| | | | | | | | | |
| County of Miami-Dade, FL | | | | | | | | |
6.875%, 10/01/2034 | | | 1,550,000 | | | | 1,948,315 | |
| | | | | | | | | |
| County of Miami-Dade, FL | | | | | | | | |
| Aviation Revenue | | | | | | | | |
3.275%, 10/01/2029 | | | 5,435,000 | | | | 5,053,846 | |
| | | | | | | | | |
| County of Miami-Dade, FL | | | | | | | | |
| Seaport Department | | | | | | | | |
1.862%, 10/01/2029 | | | 11,500,000 | | | | 9,690,443 | |
1.962%, 10/01/2031 | | | 4,235,000 | | | | 3,432,385 | |
2.012%, 10/01/2031 | | | 6,940,000 | | | | 5,618,551 | |
| | | | | | | | | |
| County of Miami-Dade, FL | | | | | | | | |
| Transit System | | | | | | | | |
1.650%, 07/01/2030 | | | 16,095,000 | | | | 13,305,347 | |
| | | | | | | | | |
| Florida Development | | | | | | | | |
| Finance Corp. | | | | | | | | |
7.375%, 01/01/2049 (a) | | | 7,000,000 | | | | 6,677,549 | |
| | | | | | | | | |
| JEA Water & Sewer | | | | | | | | |
| System Revenue | | | | | | | | |
3.000%, 10/01/2040 | | | 7,495,000 | | | | 6,218,630 | |
3.000%, 10/01/2041 | | | 5,045,000 | | | | 4,124,023 | |
| | | | | | | | | |
| Reedy Creek | | | | | | | | |
| Improvement District | | | | | | | | |
2.497%, 06/01/2034 | | | 4,500,000 | | | | 3,572,366 | |
2.547%, 06/01/2035 | | | 4,500,000 | | | | 3,527,221 | |
2.731%, 06/01/2038 | | | 18,500,000 | | | | 14,171,246 | |
| | | | | | | | | |
| State Board of Administration | | | | | | | | |
| Finance Corp. | | | | | | | | |
2.154%, 07/01/2030 | | | 15,537,000 | | | | 13,304,085 | |
| | | | | | | | | |
| Tampa-Hillsborough County | | | | | | | | |
| Expressway Authority | | | | | | | | |
1.892%, 07/01/2029 | | | 4,750,000 | | | | 4,127,217 | |
1.942%, 07/01/2030 | | | 4,655,000 | | | | 3,963,025 | |
| | | | | | | | 127,111,623 | |
| | | | | | | | | |
| Georgia – 0.22% | | | | | | | | |
| | | | | | | | | |
| Municipal Electric | | | | | | | | |
| Authority of Georgia | | | | | | | | |
2.497%, 01/01/2031 | | | 10,355,000 | | | | 8,684,435 | |
Percentages are stated as a percent of net assets.The accompanying notes are an integral part of these financial statements.
PERFORMANCE TRUST MUTUAL FUNDS (PTIAX, PTAOX, PTCOX, PTIMX, PTRMX, PTCRX)
PERFORMANCE TRUST STRATEGIC BOND FUND — SCHEDULE OF INVESTMENTS (CONT.)
August 31, 2022
| | | PRINCIPAL | | | | |
| | | AMOUNT | | | VALUE | |
| | | | | | | |
| Georgia – 0.22% (Cont.) | | | | | | |
| | | | | | | |
| Valdosta & Lowndes | | | | | | |
| County Hospital Authority | | | | | | |
2.604%, 10/01/2030 | | $ | 2,000,000 | | | $ | 1,814,305 | |
3.000%, 10/01/2029 | | | 2,000,000 | | | | 1,890,746 | |
| | | | | | | | 12,389,486 | |
| | | | | | | | | |
| Hawaii – 0.51% | | | | | | | | |
| | | | | | | | | |
| State of Hawaii | | | | | | | | |
2.532%, 10/01/2036 | | | 2,500,000 | | | | 2,003,382 | |
| | | | | | | | | |
| State of Hawaii | | | | | | | | |
| Airports System Revenue | | | | | | | | |
5.000%, 07/01/2047 | | | 25,000,000 | | | | 26,179,817 | |
| | | | | | | | 28,183,199 | |
| | | | | | | | | |
| Illinois – 0.31% | | | | | | | | |
| | | | | | | | | |
| Chicago O’Hare | | | | | | | | |
| International Airport | | | | | | | | |
2.316%, 01/01/2029 | | | 1,500,000 | | | | 1,346,236 | |
2.446%, 01/01/2031 | | | 8,500,000 | | | | 7,348,435 | |
| | | | | | | | | |
| Illinois Finance Authority | | | | | | | | |
3.510%, 05/15/2041 | | | 7,000,000 | | | | 5,291,943 | |
| | | | | | | | | |
| State of Illinois | | | | | | | | |
5.750%, 01/01/2037 | | | 3,000,000 | | | | 3,118,697 | |
| | | | | | | | 17,105,311 | |
| | | | | | | | | |
| Indiana – 0.22% | | | | | | | | |
| | | | | | | | | |
| Indiana Finance Authority | | | | | | | | |
3.000%, 10/01/2039 | | | 1,975,000 | | | | 1,641,102 | |
4.807%, 07/15/2035 | | | 3,000,000 | | | | 3,188,273 | |
| | | | | | | | | |
| Indianapolis Local Public | | | | | | | | |
| Improvement Bond Bank | | | | | | | | |
2.473%, 01/01/2040 | | | 9,500,000 | | | | 7,465,829 | |
| | | | | | | | 12,295,204 | |
| | | | | | | | | |
| Kansas – 0.07% | | | | | | | | |
| | | | | | | | | |
| State of Kansas | | | | | | | | |
| Department of Transportation | | | | | | | | |
4.596%, 09/01/2035 | | | 3,480,000 | | | | 3,625,953 | |
| | | | | | | | | |
| Kentucky – 0.28% | | | | | | | | |
| | | | | | | | | |
| County of Warren, KY | | | | | | | | |
3.921%, 12/01/2031 | | | 825,000 | | | | 808,248 | |
4.397%, 12/01/2038 | | | 1,540,000 | | | | 1,509,042 | |
| | | | | | | | | |
| Kentucky State Property & | | | | | | | | |
| Building Commission | | | | | | | | |
2.123%, 09/01/2030 | | | 2,755,000 | | | | 2,300,855 | |
2.223%, 09/01/2031 | | | 3,350,000 | | | | 2,769,865 | |
| | | | | | | | | |
| Kentucky Turnpike Authority | | | | | | | | |
1.968%, 07/01/2031 | | | 5,495,000 | | | | 4,549,806 | |
| | | | | | | | | |
| Louisville and Jefferson County | | | | | | | | |
| Metropolitan Sewer District | | | | | | | | |
2.250%, 05/15/2044 | | | 4,880,000 | | | | 3,446,437 | |
| | | | | | | | 15,384,253 | |
| | | | | | | | | |
| Louisiana – 0.66% | | | | | | | | |
| | | | | | | | | |
| City of New Orleans, LA | | | | | | | | |
2.220%, 09/01/2029 | | | 6,400,000 | | | | 5,674,441 | |
| | | | | | | | | |
| City of New Orleans, LA | | | | | | | | |
| Sewerage Service Revenue | | | | | | | | |
1.791%, 06/01/2030 | | | 1,000,000 | | | | 812,576 | |
1.891%, 06/01/2031 | | | 1,575,000 | | | | 1,253,184 | |
| | | | | | | | | |
| City of New Orleans, LA | | | | | | | | |
| Water System Revenue | | | | | | | | |
1.691%, 12/01/2029 | | | 1,800,000 | | | | 1,477,851 | |
1.841%, 12/01/2030 | | | 3,120,000 | | | | 2,511,067 | |
1.941%, 12/01/2031 | | | 1,635,000 | | | | 1,291,397 | |
| | | | | | | | | |
| East Baton Rouge | | | | | | | | |
| Sewerage Commission | | | | | | | | |
2.437%, 02/01/2039 | | | 2,500,000 | | | | 1,930,937 | |
| | | | | | | | | |
| State of Louisiana | | | | | | | | |
1.792%, 06/15/2033 | | | 1,900,000 | | | | 1,472,275 | |
| | | | | | | | | |
| State of Louisiana Gasoline | | | | | | | | |
| & Fuels Tax Revenue | | | | | | | | |
2.230%, 05/01/2036 | | | 8,000,000 | | | | 6,263,688 | |
2.530%, 05/01/2041 | | | 10,445,000 | | | | 7,900,300 | |
2.830%, 05/01/2043 | | | 8,135,000 | | | | 6,102,420 | |
| | | | | | | | 36,690,136 | |
| | | | | | | | | |
| Maine – 0.19% | | | | | | | | |
| | | | | | | | | |
| Maine Health & Higher | | | | | | | | |
| Educational Facilities Authority | | | | | | | | |
3.118%, 07/01/2043 | | | 14,250,000 | | | | 10,808,494 | |
| | | | | | | | | |
| Maryland – 0.13% | | | | | | | | |
| | | | | | | | | |
| Maryland Stadium Authority | | | | | | | | |
2.805%, 05/01/2040 | | | 7,000,000 | | | | 5,474,902 | |
| | | | | | | | | |
| State of Maryland | | | | | | | | |
| Department of Transportation | | | | | | | | |
1.686%, 08/01/2030 | | | 2,110,000 | | | | 1,726,437 | |
| | | | | | | | 7,201,339 | |
| | | | | | | | | |
| Massachusetts – 0.31% | | | | | | | | |
| | | | | | | | | |
| City of Worcester, MA | | | | | | | | |
6.250%, 01/01/2028 | | | 2,875,000 | | | | 3,062,438 | |
| | | | | | | | | |
| Commonwealth of Massachusetts | | | | | | | | |
2.375%, 09/01/2043 | | | 3,250,000 | | | | 2,358,753 | |
| | | | | | | | | |
| Commonwealth of Massachusetts | | | | | | | | |
| Transportation Fund Revenue | | | | | | | | |
5.631%, 06/01/2030 | | | 1,050,000 | | | | 1,115,964 | |
| | | | | | | | | |
| Massachusetts Bay Transportation | | | | | | | | |
| Authority Sales Tax Revenue | | | | | | | | |
2.235%, 07/01/2031 | | | 8,795,000 | | | | 7,588,188 | |
| | | | | | | | | |
| Massachusetts Educational | | | | | | | | |
| Financing Authority | | | | | | | | |
3.455%, 07/01/2028 | | | 2,000,000 | | | | 1,883,406 | |
3.831%, 07/01/2024 | | | 450,000 | | | | 446,947 | |
Percentages are stated as a percent of net assets.The accompanying notes are an integral part of these financial statements.
PERFORMANCE TRUST MUTUAL FUNDS (PTIAX, PTAOX, PTCOX, PTIMX, PTRMX, PTCRX)
PERFORMANCE TRUST STRATEGIC BOND FUND — SCHEDULE OF INVESTMENTS (CONT.)
August 31, 2022
| | | PRINCIPAL | | | | |
| | | AMOUNT | | | VALUE | |
| Massachusetts – 0.31% (Cont.) | | | | | | |
| | | | | | | |
| Massachusetts State College | | | | | | |
| Building Authority | | | | | | |
5.932%, 05/01/2040 | | $ | 550,000 | | | $ | 612,222 | |
| | | | | | | | 17,067,918 | |
| | | | | | | | | |
| Michigan – 1.45% | | | | | | | | |
| | | | | | | | | |
| City of Detroit, MI | | | | | | | | |
4.000%, 04/01/2044 | | | 8,700,000 | | | | 6,909,110 | |
| | | | | | | | | |
| Detroit City School District | | | | | | | | |
7.747%, 05/01/2039 | | | 10,300,000 | | | | 12,966,836 | |
| | | | | | | | | |
| Great Lakes Water Authority | | | | | | | | |
| Sewage Disposal System Revenue | | | | | | | | |
5.250%, 07/01/2047 | | | 23,090,000 | | | | 25,404,542 | |
2.615%, 07/01/2036 | | | 1,000,000 | | | | 810,825 | |
3.056%, 07/01/2039 | | | 13,365,000 | | | | 10,988,228 | |
| | | | | | | | | |
| Michigan Finance Authority | | | | | | | | |
3.084%, 12/01/2034 | | | 5,095,000 | | | | 4,515,551 | |
3.267%, 06/01/2039 | | | 19,000,000 | | | | 16,046,996 | |
3.610%, 11/01/2032 | | | 3,000,000 | | | | 2,852,767 | |
| | | | | | | | 80,494,855 | |
| | | | | | | | | |
| Minnesota – 0.47% | | | | | | | | |
| | | | | | | | | |
| Minneapolis-St Paul Metropolitan | | | | | | | | |
| Airports Commission | | | | | | | | |
5.250%, 01/01/2047 | | | 3,925,000 | | | | 4,189,058 | |
| | | | | | | | | |
| Western Minnesota | | | | | | | | |
| Municipal Power Agency | | | | | | | | |
3.156%, 01/01/2039 | | | 17,500,000 | | | | 14,936,647 | |
| | | | | | | | | |
| White Bear Lake Independent | | | | | | | | |
| School District No. 624 | | | | | | | | |
3.000%, 02/01/2044 | | | 8,330,000 | | | | 6,695,943 | |
| | | | | | | | 25,821,648 | |
| | | | | | | | | |
| Mississippi – 0.11% | | | | | | | | |
| | | | | | | | | |
| Mississippi Development Bank | | | | | | | | |
5.460%, 10/01/2036 | | | 5,505,000 | | | | 5,854,197 | |
| | | | | | | | | |
| Missouri – 0.13% | | | | | | | | |
| | | | | | | | | |
| Kansas City Land Clearance | | | | | | | | |
| Redevelopment Authority | | | | | | | | |
6.400%, 10/15/2040 (a) | | | 7,970,000 | | | | 7,469,081 | |
| | | | | | | | | |
| Nebraska – 0.04% | | | | | | | | |
| | | | | | | | | |
| District Energy Corp. | | | | | | | | |
2.390%, 07/01/2036 | | | 2,830,000 | | | | 2,316,523 | |
| | | | | | | | | |
| Nevada – 0.26% | | | | | | | | |
| | | | | | | | | |
| City of North Las Vegas, NV | | | | | | | | |
6.572%, 06/01/2040 | | | 12,330,000 | | | | 14,523,713 | |
| | | | | | | | | |
| | | | | | | | | |
| New Hampshire – 0.06% | | | | | | | | |
| | | | | | | | | |
| New Hampshire Business | | | | | | | | |
| Finance Authority | | | | | | | | |
3.278%, 10/01/2037 | | | 4,910,000 | | | | 3,544,746 | |
| | | | | | | | | |
| New Jersey – 1.29% | | | | | | | | |
| | | | | | | | | |
| City of Newark, NJ | | | | | | | | |
4.100%, 11/01/2028 | | | 2,830,000 | | | | 2,841,282 | |
| | | | | | | | | |
| County of Essex, NJ | | | | | | | | |
2.000%, 09/01/2044 | | | 3,560,000 | | | | 2,260,124 | |
| | | | | | | | | |
| County of Hudson, NJ | | | | | | | | |
2.250%, 11/15/2038 | | | 5,000,000 | | | | 3,657,323 | |
| | | | | | | | | |
| Mercer County | | | | | | | | |
| Improvement Authority | | | | | | | | |
8.270%, 12/01/2034 | | | 14,455,000 | | | | 18,236,402 | |
| | | | | | | | | |
| New Jersey Economic | | | | | | | | |
| Development Authority | | | | | | | | |
0.000%, 02/15/2025 (h) | | | 20,188,000 | | | | 18,297,638 | |
7.425%, 02/15/2029 | | | 10,000,000 | | | | 11,093,591 | |
| | | | | | | | | |
| New Jersey Institute | | | | | | | | |
| of Technology | | | | | | | | |
3.323%, 07/01/2024 | | | 1,540,000 | | | | 1,518,880 | |
3.415%, 07/01/2042 | | | 3,500,000 | | | | 2,746,101 | |
| | | | | | | | | |
| New Jersey Turnpike Authority | | | | | | | | |
2.113%, 01/01/2033 | | | 6,250,000 | | | | 5,015,860 | |
7.102%, 01/01/2041 | | | 4,500,000 | | | | 5,697,761 | |
| | | | | | | | 71,364,962 | |
| | | | | | | | | |
| New York – 1.51% | | | | | | | | |
| | | | | | | | | |
| New York City Industrial | | | | | | | | |
| Development Agency | | | | | | | | |
2.436%, 01/01/2036 | | | 5,850,000 | | | | 4,331,912 | |
| | | | | | | | | |
| New York City Transitional | | | | | | | | |
| Finance Authority Future | | | | | | | | |
| Tax Secured Revenue | | | | | | | | |
2.580%, 02/01/2033 | | | 10,000,000 | | | | 8,383,586 | |
4.200%, 11/01/2030 | | | 20,000,000 | | | | 19,857,714 | |
| | | | | | | | | |
| New York Liberty | | | | | | | | |
| Development Corp. | | | | | | | | |
2.250%, 02/15/2041 | | | 13,595,000 | | | | 9,496,975 | |
3.000%, 02/15/2042 | | | 5,500,000 | | | | 4,542,373 | |
| | | | | | | | | |
| New York State | | | | | | | | |
| Dormitory Authority | | | | | | | | |
2.152%, 03/15/2031 | | | 20,000,000 | | | | 16,961,706 | |
2.746%, 07/01/2030 | | | 6,430,000 | | | | 5,704,955 | |
5.096%, 08/01/2034 | | | 3,125,000 | | | | 3,053,187 | |
| | | | | | | | | |
| New York State | | | | | | | | |
| Environmental Facilities Corp. | | | | | | | | |
3.000%, 06/15/2040 | | | 3,000,000 | | | | 2,607,071 | |
Percentages are stted as a percent of net assets.The accompanying notes are an integral part of these financial statements.
PERFORMANCE TRUST MUTUAL FUNDS (PTIAX, PTAOX, PTCOX, PTIMX, PTRMX, PTCRX)
PERFORMANCE TRUST STRATEGIC BOND FUND — SCHEDULE OF INVESTMENTS (CONT.)
August 31, 2022
| | | PRINCIPAL | | | | |
| | | AMOUNT | | | VALUE | |
| | | | | | | |
| New York – 1.51% (Cont.) | | | | | | |
| | | | | | | |
| New York State | | | | | | |
| Thruway Authority | | | | | | |
2.900%, 01/01/2035 | | $ | 8,445,000 | | | $ | 7,395,629 | |
| | | | | | | | | |
| Western Nassau County | | | | | | | | |
| Water Authority | | | | | | | | |
2.958%, 04/01/2041 | | | 1,500,000 | | | | 1,161,161 | |
| | | | | | | | 83,496,269 | |
| | | | | | | | | |
| Ohio – 0.96% | | | | | | | | |
| | | | | | | | | |
| American Municipal Power, Inc. | | | | | | | | |
7.499%, 02/15/2050 | | | 3,520,000 | | | | 4,526,416 | |
7.834%, 02/15/2041 | | | 4,670,000 | | | | 6,104,278 | |
| | | | | | | | | |
| County of Hamilton, OH | | | | | | | | |
3.374%, 06/01/2034 | | | 285,000 | | | | 258,686 | |
3.756%, 06/01/2042 | | | 8,000,000 | | | | 6,821,552 | |
| | | | | | | | | |
| Franklin County Convention | | | | | | | | |
| Facilities Authority | | | | | | | | |
2.022%, 12/01/2030 | | | 5,485,000 | | | | 4,687,082 | |
2.472%, 12/01/2034 | | | 22,100,000 | | | | 18,406,977 | |
| | | | | | | | | |
| JobsOhio Beverage System | | | | | | | | |
2.833%, 01/01/2038 | | | 7,235,000 | | | | 6,030,069 | |
| | | | | | | | | |
| Ohio Higher Educational | | | | | | | | |
| Facility Commission | | | | | | | | |
4.500%, 12/01/2026 | | | 4,025,000 | | | | 3,939,611 | |
| | | | | | | | | |
| South-Western City | | | | | | | | |
| School District | | | | | | | | |
0.000%, 12/01/2028 (h) | | | 2,735,000 | | | | 2,088,325 | |
| | | | | | | | | |
| Sycamore Community | | | | | | | | |
| City School District | | | | | | | | |
5.850%, 12/01/2028 | | | 605,000 | | | | 670,212 | |
| | | | | | | | 53,533,208 | |
| | | | | | | | | |
| Oklahoma – 0.60% | | | | | | | | |
| | | | | | | | | |
| Oklahoma City Economic | | | | | | | | |
| Development Trust | | | | | | | | |
1.471%, 03/01/2028 | | | 1,200,000 | | | | 1,057,820 | |
1.791%, 03/01/2030 | | | 1,455,000 | | | | 1,246,033 | |
1.891%, 03/01/2031 | | | 1,545,000 | | | | 1,303,334 | |
| | | | | | | | | |
| Oklahoma Development | | | | | | | | |
| Finance Authority | | | | | | | | |
4.600%, 06/01/2044 | | | 5,000,000 | | | | 4,973,400 | |
5.450%, 08/15/2028 | | | 5,520,000 | | | | 4,917,831 | |
| | | | | | | | | |
| Oklahoma Municipal | | | | | | | | |
| Power Authority | | | | | | | | |
2.431%, 01/01/2034 | | | 3,870,000 | | | | 3,155,992 | |
2.501%, 01/01/2035 | | | 3,475,000 | | | | 2,803,838 | |
2.551%, 01/01/2036 | | | 2,390,000 | | | | 1,903,781 | |
2.803%, 01/01/2041 | | | 15,500,000 | | | | 11,954,913 | |
| | | | | | | | 33,316,942 | |
| | | | | | | | | |
| Oregon – 0.06% | | | | | | | | |
| | | | | | | | | |
| Hospital Facilities Authority of | | | | | | | | |
| Multnomah County Oregon | | | | | | | | |
1.250%, 06/01/2026 | |
| 2,610,000 | | |
| 2,395,795 | |
| | | | | | | | | |
| Oregon Health & | | | | | | | | |
| Science University | | | | | | | | |
2.850%, 07/01/2030 | | | 1,000,000 | | | | 919,627 | |
| | | | | | | | 3,315,422 | |
| | | | | | | | | |
| Pennsylvania – 0.82% | | | | | | | | |
| | | | | | | | | |
| Berks County Industrial | | | | | | | | |
| Development Authority | | | | | | | | |
3.950%, 05/15/2024 | | | 490,000 | | | | 483,776 | |
4.450%, 05/15/2027 | | | 800,000 | | | | 777,619 | |
| | | | | | | | | |
| City of Philadelphia, PA | | | | | | | | |
1.618%, 07/15/2029 | | | 2,505,000 | | | | 2,132,941 | |
1.738%, 07/15/2030 | | | 2,250,000 | | | | 1,882,505 | |
1.838%, 07/15/2031 | | | 2,500,000 | | | | 2,058,104 | |
| | | | | | | | | |
| Commonwealth | | | | | | | | |
| Financing Authority | | | | | | | | |
2.758%, 06/01/2030 | | | 1,040,000 | | | | 923,124 | |
3.657%, 06/01/2038 | | | 5,820,000 | | | | 5,344,295 | |
3.807%, 06/01/2041 | | | 6,110,000 | | | | 5,410,421 | |
4.014%, 06/01/2033 | | | 2,750,000 | | | | 2,658,298 | |
| | | | | | | | | |
| Montgomery County Industrial | | | | | | | | |
| Development Authority | | | | | | | | |
3.150%, 11/15/2028 | | | 10,000,000 | | | | 9,227,146 | |
| | | | | | | | | |
| Pennsylvania Economic | | | | | | | | |
| Development Financing Authority | | | | | | | | |
3.143%, 06/15/2042 | | | 7,600,000 | | | | 6,199,653 | |
| | | | | | | | | |
| Pennsylvania | | | | | | | | |
| Turnpike Commission | | | | | | | | |
3.000%, 12/01/2042 | | | 9,070,000 | | | | 7,137,699 | |
| | | | | | | | | |
| Union County Hospital Authority | | | | | | | | |
3.800%, 08/01/2023 | | | 295,000 | | | | 294,764 | |
4.400%, 08/01/2028 | | | 1,060,000 | | | | 1,066,429 | |
| | | | | | | | 45,596,774 | |
| | | | | | | | | |
| Puerto Rico – 0.37% | | | | | | | | |
| | | | | | | | | |
| Children’s Trust Fund | | | | | | | | |
5.375%, 05/15/2033 | | | 275,000 | | | | 281,985 | |
| | | | | | | | | |
| Commonwealth of Puerto Rico | | | | | | | | |
0.000%, 07/01/2024 (h) | | | 153,671 | | | | 142,030 | |
0.000%, 07/01/2033 (h) | | | 592,257 | | | | 337,052 | |
0.000%, 11/01/2043 (h) | | | 2,291,998 | | | | 1,183,244 | |
4.000%, 07/01/2033 | | | 460,219 | | | | 431,233 | |
4.000%, 07/01/2035 | | | 413,675 | | | | 380,355 | |
4.000%, 07/01/2037 | | | 355,042 | | | | 318,151 | |
4.000%, 07/01/2041 | | | 482,722 | | | | 421,567 | |
4.000%, 07/01/2046 | | | 502,024 | | | | 426,325 | |
5.250%, 07/01/2023 | | | 255,706 | | | | 259,577 | |
Percentages are stated as a percent of net assets.
The accompanying notes are an integral part of these financial statements.
PERFORMANCE TRUST MUTUAL FUNDS (PTIAX, PTAOX, PTCOX, PTIMX, PTRMX, PTCRX)
PERFORMANCE TRUST STRATEGIC BOND FUND — SCHEDULE OF INVESTMENTS (CONT.)
August 31, 2022
| | | PRINCIPAL | | | | |
| | | AMOUNT | | | VALUE | |
| | | | | | | |
| Puerto Rico – 0.37% (Cont.) | | | | | | |
| | | | | | | |
| Commonwealth of | | | | | | |
| Puerto Rico (Cont.) | | | | | | |
5.375%, 07/01/2025 | | $ | 512,555 | | | $ | 528,992 | |
5.625%, 07/01/2027 | | | 507,913 | | | | 539,000 | |
5.625%, 07/01/2029 | | | 499,673 | | | | 538,162 | |
5.750%, 07/01/2031 | | | 485,328 | | | | 532,437 | |
| | | | | | | | | |
| GDB Debt Recovery | | | | | | | | |
| Authority of Puerto Rico | | | | | | | | |
7.500%, 08/20/2040 | | | 9,487,657 | | | | 8,491,453 | |
| | | | | | | | | |
| Puerto Rico Highway & | | | | | | | | |
| Transportation Authority | | | | | | | | |
0.000%, 07/01/2026 (d)(h) | | | 7,000,000 | | | | 5,541,666 | |
| | | | | | | | 20,353,229 | |
| | | | | | | | | |
| South Carolina – 0.12% | | | | | | | | |
| | | | | | | | | |
| Commission of Public Works, | | | | | | | | |
| City of Greer | | | | | | | | |
5.500%, 09/01/2032 | | | 2,000,000 | | | | 2,326,658 | |
| | | | | | | | | |
| South Carolina Jobs-Economic | | | | | | | | |
| Development Authority | | | | | | | | |
2.729%, 07/01/2030 | | | 5,015,000 | | | | 4,524,524 | |
| | | | | | | | 6,851,182 | |
| | | | | | | | | |
| Tennessee – 0.18% | | | | | | | | |
| | | | | | | | | |
| Memphis-Shelby County | | | | | | | | |
| Airport Authority | | | | | | | | |
5.000%, 07/01/2045 | | | 3,000,000 | | | | 3,110,618 | |
5.000%, 07/01/2049 | | | 5,000,000 | | | | 5,164,523 | |
| | | | | | | | | |
| New Memphis Arena | | | | | | | | |
| Public Building Authority | | | | | | | | |
0.000%, 04/01/2044 (h) | | | 1,800,000 | | | | 647,234 | |
0.000%, 04/01/2045 (h) | | | 2,000,000 | | | | 682,457 | |
0.000%, 04/01/2046 (h) | | | 1,700,000 | | | | 551,579 | |
| | | | | | | | 10,156,411 | |
| | | | | | | | | |
| Texas – 4.16% | | | | | | | | |
| | | | | | | | | |
| Argyle Independent | | | | | | | | |
| School District | | | | | | | | |
5.000%, 08/15/2047 | | | 8,000,000 | | | | 8,864,362 | |
| | | | | | | | | |
| Board of Regents of the | | | | | | | | |
| University of Texas System | | | | | | | | |
5.134%, 08/15/2042 | | | 2,500,000 | | | | 2,766,082 | |
| | | | | | | | | |
| Bullard Independent | | | | | | | | |
| School District | | | | | | | | |
5.000%, 02/15/2047 | | | 5,000,000 | | | | 5,496,572 | |
| | | | | | | | | |
| City of Austin, TX | | | | | | | | |
| Airport System Revenue | | | | | | | | |
5.250%, 11/15/2047 | | | 5,000,000 | | | | 5,344,886 | |
5.000%, 11/15/2052 | | | 11,750,000 | | | | 12,251,852 | |
| | | | | | | | | |
| City of Dallas, TX | | | | | | | | |
0.000%, 02/15/2031 (h) | |
| 10,000,000 | | |
| 6,664,728 | |
0.000%, 02/15/2032 (h) | | | 15,000,000 | | | | 9,486,913 | |
| | | | | | | | | |
| City of El Paso, TX | | | | | | | | |
6.018%, 08/15/2035 | | | 3,000,000 | | | | 3,392,389 | |
| | | | | | | | | |
| City of Houston, TX | | | | | | | | |
3.961%, 03/01/2047 | | | 5,800,000 | | | | 5,429,420 | |
5.508%, 03/01/2036 | | | 5,400,000 | | | | 5,956,986 | |
5.538%, 03/01/2037 | | | 4,100,000 | | | | 4,494,849 | |
6.290%, 03/01/2032 | | | 860,000 | | | | 942,112 | |
| | | | | | | | | |
| City of Houston, TX | | | | | | | | |
| Airport System Revenue | | | | | | | | |
2.385%, 07/01/2031 | | | 26,835,000 | | | | 22,947,172 | |
6.880%, 01/01/2028 | | | 2,025,000 | | | | 2,158,926 | |
| | | | | | | | | |
| City of Irving, TX | | | | | | | | |
7.375%, 08/15/2044 | | | 3,500,000 | | | | 3,570,001 | |
| | | | | | | | | |
| City of San Antonio, TX | | | | | | | | |
| Electric & Gas Systems Revenue | | | | | | | | |
5.000%, 02/01/2049 | | | 5,000,000 | | | | 5,331,023 | |
5.718%, 02/01/2041 | | | 5,645,000 | | | | 6,429,515 | |
5.985%, 02/01/2039 | | | 13,030,000 | | | | 15,246,511 | |
| | | | | | | | | |
| Colony Economic | | | | | | | | |
| Development Corp. | | | | | | | | |
7.250%, 10/01/2042 | | | 5,000,000 | | | | 5,120,897 | |
| | | | | | | | | |
| Dallas Fort Worth | | | | | | | | |
| International Airport | | | | | | | | |
2.994%, 11/01/2038 | | | 15,980,000 | | | | 13,796,737 | |
| | | | | | | | | |
| Downtown Dallas | | | | | | | | |
| Development Authority | | | | | | | | |
0.000%, 08/15/2036 (h) | | | 6,730,000 | | | | 3,285,807 | |
| | | | | | | | | |
| Fredericksburg Independent | | | | | | | | |
| School District | | | | | | | | |
5.000%, 02/15/2047 | | | 4,000,000 | | | | 4,438,690 | |
| | | | | | | | | |
| Lower Colorado River Authority | | | | | | | | |
5.000%, 05/15/2045 | | | 5,160,000 | | | | 5,457,731 | |
5.000%, 05/15/2050 | | | 10,310,000 | | | | 10,852,484 | |
| | | | | | | | | |
| Metropolitan Transit | | | | | | | | |
| Authority of Harris County | | | | | | | | |
| Sales & Use Tax Revenue | | | | | | | | |
2.599%, 11/01/2037 | | | 17,015,000 | | | | 13,414,874 | |
| | | | | | | | | |
| New Hope Cultural | | | | | | | | |
| Education Facilities Corp. | | | | | | | | |
4.000%, 08/01/2020 (d)(g) | | | 220,000 | | | | 52,800 | |
| | | | | | | | | |
| North Texas Tollway Authority | | | | | | | | |
8.410%, 02/01/2030 | | | 5,090,000 | | | | 5,923,217 | |
| | | | | | | | | |
| Port of Beaumont Industrial | | | | | | | | |
| Development Authority | | | | | | | | |
4.100%, 01/01/2028 (a) | | | 6,000,000 | | | | 4,808,081 | |
Percentages are stated as a percent of net assets.The accompanying notes are an integral part of these financial statements.
PERFORMANCE TRUST MUTUAL FUNDS (PTIAX, PTAOX, PTCOX, PTIMX, PTRMX, PTCRX)
PERFORMANCE TRUST STRATEGIC BOND FUND — SCHEDULE OF INVESTMENTS (CONT.)
August 31, 2022
| | | PRINCIPAL | | | | |
| | | AMOUNT | | | VALUE | |
| | | | | | | |
| Texas – 4.16% (Cont.) | | | | | | |
| | | | | | | |
| Pottsboro Independent | | | | | | |
| School District, TX | | | | | | |
5.000%, 02/15/2047 | | $ | 6,000,000 | | | $ | 6,595,887 | |
| | | | | | | | | |
| San Antonio Independent | | | | | | | | |
| School District, TX | | | | | | | | |
5.000%, 08/15/2047 | | | 15,000,000 | | | | 16,633,868 | |
| | | | | | | | | |
| Stafford Municipal | | | | | | | | |
| School District | | | | | | | | |
3.084%, 08/15/2041 | | | 1,525,000 | | | | 1,264,128 | |
| | | | | | | | | |
| Texas Transportation | | | | | | | | |
| Commission | | | | | | | | |
2.013%, 10/01/2037 | | | 6,295,000 | | | | 4,656,559 | |
| | | | | | | | | |
| White Settlement Independent | | | | | | | | |
| School District | | | | | | | | |
5.000%, 08/15/2047 | | | 7,000,000 | | | | 7,654,372 | |
| | | | | | | | 230,730,431 | |
| | | | | | | | | |
| Utah – 0.49% | | | | | | | | |
| | | | | | | | | |
| City of Salt Lake City, UT | | | | | | | | |
| Airport Revenue | | | | | | | | |
5.250%, 07/01/2048 | | | 7,000,000 | | | | 7,287,000 | |
| | | | | | | | | |
| County of Salt Lake, UT | | | | | | | | |
| Convention Hotel Revenue | | | | | | | | |
5.750%, 10/01/2047 (a)(d) | | | 5,000,000 | | | | 4,560,742 | |
| | | | | | | | | |
| Salt Lake City Corp. | | | | | | | | |
| Airport Revenue | | | | | | | | |
5.000%, 07/01/2046 | | | 14,725,000 | | | | 15,342,019 | |
| | | | | | | | 27,189,761 | |
| | | | | | | | | |
| Virginia – 0.31% | | | | | | | | |
| | | | | | | | | |
| County of Botetourt, VA | | | | | | | | |
6.000%, 07/01/2044 | | | 4,485,000 | | | | 4,627,110 | |
| | | | | | | | | |
| University of Virginia | | | | | | | | |
6.200%, 09/01/2039 | | | 10,180,000 | | | | 12,310,074 | |
| | | | | | | | 16,937,184 | |
| | | | | | | | | |
| Washington – 0.84% | | | | | | | | |
| | | | | | | | | |
| King County Housing Authority | | | | | | | | |
3.000%, 06/01/2040 | | | 3,005,000 | | | | 2,454,420 | |
| | | | | | | | | |
| NJB Properties | | | | | | | | |
5.510%, 12/01/2036 | | | 7,665,000 | | | | 8,254,926 | |
| | | | | | | | | |
| Pierce County School | | | | | | | | |
| District No. 10 Tacoma | | | | | | | | |
2.357%, 12/01/2039 | | | 14,560,000 | | | | 10,819,881 | |
| | | | | | | | | |
| Port of Seattle, WA | | | | | | | | |
5.000%, 08/01/2046 | | | 13,000,000 | | | | 13,558,971 | |
5.500%, 08/01/2047 | | | 7,250,000 | | | | 7,993,576 | |
| | | | | | | | | |
| Spokane Public Facilities District | | | | | | | | |
1.996%, 12/01/2030 | | | 3,950,000 | | | | 3,363,264 | |
| | | | | | | | 46,445,038 | |
| | | | | | | | | |
| West Virginia – 0.07% | | | | | | | | |
| | | | | | | | | |
| Tobacco Settlement | | | | | | | | |
| Finance Authority | | | | | | | | |
2.701%, 06/01/2030 | | | 4,770,000 | | | | 4,094,477 | |
| | | | | | | | | |
| Wisconsin – 0.20% | | | | | | | | |
| | | | | | | | | |
| Milwaukee Redevelopment | | | | | | | | |
| Authority | | | | | | | | |
0.000%, 04/01/2039 (h) | | | 1,000,000 | | | | 418,100 | |
| | | | | | | | | |
| Public Finance Authority | | | | | | | | |
4.153%, 05/15/2031 | | | 3,635,000 | | | | 3,611,982 | |
5.000%, 05/15/2032 (a) | | | 1,275,000 | | | | 1,234,901 | |
7.500%, 06/01/2029 (a) | | | 5,750,000 | | | | 5,802,797 | |
| | | | | | | | 11,067,780 | |
| TOTAL MUNICIPAL BONDS | | | | | | | | |
| (Cost $1,722,685,393) | | | | | | | 1,537,074,510 | |
| | | | | | | | | |
| GOVERNMENT SECURITIES | | | | | | | | |
| & AGENCY ISSUES – 0.08% | | | | | | | | |
United States International | | | | | | | | |
Development Finance Corp. | | | | | | | | |
1.320%, 03/15/2035 | | | 5,000,000 | | | | 4,178,707 | |
| | | | | | | | | |
| TOTAL GOVERNMENT | | | | | | | | |
| SECURITIES & AGENCY ISSUES | | | | | | | | |
| (Cost $5,000,000) | | | | | | | 4,178,707 | |
| | | | | | | | | |
| US GOVERNMENT NOTES/BONDS – 5.10% | | | | | | | | |
United States Treasury | | | | | | | | |
Notes/Bonds | | | | | | | | |
1.500%, 02/29/2024 | | | 64,750,000 | | | | 62,928,906 | |
1.750%, 03/15/2025 | | | 90,000,000 | | | | 86,301,563 | |
2.625%, 04/15/2025 | | | 50,000,000 | | | | 48,953,125 | |
1.875%, 02/15/2041 | | | 25,000,000 | | | | 19,248,047 | |
2.375%, 02/15/2042 | | | 50,000,000 | | | | 41,648,437 | |
3.250%, 05/15/2042 | | | 25,000,000 | | | | 24,011,719 | |
| TOTAL US GOVERNMENT | | | | | | | | |
| NOTES/BONDS | | | | | | | | |
| (Cost $296,106,982) | | | | | | | 283,091,797 | |
Percentages are stated as a percent of net assets.The accompanying notes are an integral part of these financial statements.
PERFORMANCE TRUST MUTUAL FUNDS (PTIAX, PTAOX, PTCOX, PTIMX, PTRMX, PTCRX)
PERFORMANCE TRUST STRATEGIC BOND FUND — SCHEDULE OF INVESTMENTS (CONT.)
August 31, 2022
| | | PRINCIPAL | | | | |
| | | AMOUNT | | | VALUE | |
| | | | | | | |
| SHORT-TERM INVESTMENTS – 0.18% | | | | | | |
First American Government | | | | | | |
Obligations Fund – | | | | | | |
Class X, 2.039% (l) | | $ | 9,772,118 | | | $ | 9,772,118 | |
| TOTAL SHORT-TERM | | | | | | | | |
| INVESTMENTS | | | | | | | | |
| (Cost $9,772,118) | | | | | | | 9,772,118 | |
| | | | | | | | | |
| Total Investments | | | | | | | | |
| (Cost $6,264,324,842) – 99.52% | | | | | | | 5,519,501,022 | |
| | | | | | | | | |
| Other Assets in Excess | | | | | | | | |
| of Liabilities – 0.48% | | | | | | | 26,805,001 | |
| | | | | | | | | |
| TOTAL NET ASSETS – 100.00% | | | | | | $ | 5,546,306,023 | |
Percentages are stated as a percent of net assets.| (a) | Securities issued pursuant to Rule 144A under the Securities Act of 1933. |
| (b) | Variable rate security; the rate shown represents the rate at August 31, 2022. |
| (c) | Foreign issued security. |
| (d) | Represents an illiquid security. The total market value of these securities was $54,962,492, representing 0.99% of net assets as of August 31, 2022. |
| (e) | Perpetual maturity. The date referenced is the next call date. |
| (f) | Variable rate security; the rate shown represents the rate at August 31, 2022. The coupon is based on an underlying pool of loans. |
| (g) | Default or other conditions existed at August 31, 2022. |
| (h) | Represents a principal-only security that entitles holders to receive only principal payments on underlying mortgages. |
| (i) | Step-up bond; the rate shown represents the rate at August 31, 2022. |
| (j) | Inverse floating rate security whose interest rate moves in opposite direction of reference interest rates. Reference interest rates are typically based on a negative multiplier slope. |
| (k) | Represents an interest-only security that entitles holders to receive only interest payments on underlying mortgages. |
| (l) | Seven day yield at August 31, 2022. |
| Abbreviations: |
| AG | Aktiengesellschaft is a German term that refers to a corporation that is limited by shares, i.e. owned by shareholders. |
| CMT | Constant Maturity Rate. |
| LIBOR | London Interbank Offered Rate. |
| PLC | Public Limited Company. |
| TSFR3M | 3 Month Term Secured Overnight Financing Rate |
The Schedule of Investments incorporates the Global Industry Classification Standard (GICS®). GICS was developed by and/or is the exclusive property of MSCI, Inc. and Standard & Poor’s Financial Services LLC (“S&P”). GICS is a service mark of MSCI and S&P and has been licensed for use by U.S. Bancorp Fund Services, LLC.
The accompanying notes are an integral part of these financial statements.
PERFORMANCE TRUST MUTUAL FUNDS (PTIAX, PTAOX, PTCOX, PTIMX, PTRMX, PTCRX)
PERFORMANCE TRUST MUNICIPAL BOND FUND — SCHEDULE OF INVESTMENTS
August 31, 2022
| | | PRINCIPAL | | | | |
| | | AMOUNT | | | VALUE | |
| | | | | | | |
| AGENCY COMMERCIAL MORTGAGE | | | | | | |
| BACKED SECURITIES – 2.58% | | | | | | |
| | | | | | | |
| Freddie Mac Multifamily ML Certificates | | | | | | |
2020-ML07, 2.015%, | | | | | | |
10/25/2036 (a)(b)(c) | | $ | 15,395,617 | | | $ | 2,542,432 | |
2019-ML06, 1.132%, | | | | | | | | |
06/25/2037 (a)(b) | | | 10,795,000 | | | | 975,652 | |
2021-ML08, 1.869%, | | | | | | | | |
07/25/2037 (a)(b) | | | 18,203,673 | | | | 2,799,179 | |
2.126%, 01/25/2038 (a)(b) | | | 14,326,393 | | | | 2,573,736 | |
0.771%, 03/25/2038 (a)(b)(c) | | | 34,431,238 | | | | 2,055,889 | |
1.578%, 06/25/2038 (a)(b) | | | 15,216,201 | | | | 2,011,430 | |
1.552%, 02/25/2040 (a)(b)(c) | | | 25,282,757 | | | | 3,435,674 | |
1.300%, 07/25/2041 (a)(b) | | | 19,352,183 | | | | 2,113,065 | |
| TOTAL AGENCY COMMERCIAL | | | | | | | | |
| MORTGAGE BACKED SECURITIES | | | | | | | | |
| (Cost $19,106,977) | | | | | | | 18,507,057 | |
| | | | | | | | | |
| NON-AGENCY COMMERCIAL | | | | | | | | |
| MORTGAGE BACKED | | | | | | | | |
| SECURITIES – 1.30% | | | | | | | | |
| | | | | | | | | |
| California Housing Finance Agency | | | | | | | | |
0.844%, 03/25/2035 (a)(b) | | | 32,142,065 | | | | 1,878,704 | |
0.796%, 11/20/2035 (a)(b) | | | 42,697,708 | | | | 2,467,501 | |
2021-3, 0.788%, 08/20/2036 (a)(b) | | | 26,004,105 | | | | 1,636,958 | |
| | | | | | | | | |
| Washington State Housing | | | | | | | | |
| Finance Commission | | | | | | | | |
0.725%, 12/20/2035 (b) | | | 62,688,354 | | | | 3,315,587 | |
| TOTAL NON-AGENCY COMMERCIAL | | | | | | | | |
| MORTGAGE BACKED SECURITIES | | | | | | | | |
| (Cost $9,678,801) | | | | | | | 9,298,750 | |
| | | | | | | | | |
| MUNICIPAL BONDS – 96.51% | | | | | | | | |
| | | | | | | | | |
| Alabama – 1.20% | | | | | | | | |
| | | | | | | | | |
| Black Belt Energy Gas District | | | | | | | | |
4.000%, 06/01/2028 | | | 2,450,000 | | | | 2,514,203 | |
4.000%, 06/01/2051 (a) | | | 5,000,000 | | | | 4,971,884 | |
| | | | | | | | | |
| Lower Alabama Gas District | | | | | | | | |
5.000%, 09/01/2031 | | | 1,005,000 | | | | 1,077,323 | |
| | | | | | | | 8,563,410 | |
| | | | | | | | | |
| Alaska – 0.63% | | | | | | | | |
| | | | | | | | | |
| Alaska Industrial Development | | | | | | | | |
| & Export Authority | | | | | | | | |
5.250%, 06/01/2045 | | | 2,735,000 | | | | 2,731,608 | |
| | | | | | | | | |
| CIVIC Ventures, AK | | | | | | | | |
5.000%, 09/01/2033 | | | 1,750,000 | | | | 1,785,239 | |
| | | | | | | | 4,516,847 | |
| Arizona – 5.19% | | | | | | | | |
| | | | | | | | | |
| Arizona Industrial | | | | | | | | |
| Development Authority | | | | | | | | |
1.500%, 07/01/2023 | |
| 150,000 | | |
| 145,720 | |
1.800%, 07/01/2024 | | | 175,000 | | | | 164,785 | |
3.250%, 07/01/2031 | | | 2,000,000 | | | | 1,757,678 | |
4.000%, 11/01/2045 | | | 2,000,000 | | | | 1,842,801 | |
4.000%, 11/01/2050 | | | 2,500,000 | | | | 2,257,657 | |
5.000%, 02/01/2037 | | | 1,500,000 | | | | 1,620,489 | |
| | | | | | | | | |
| City of Phoenix Civic | | | | | | | | |
| Improvement Corp. | | | | | | | | |
5.000%, 07/01/2043 | | | 7,645,000 | | | | 8,459,118 | |
5.500%, 07/01/2038 | | | 2,000,000 | | | | 2,435,957 | |
5.500%, 07/01/2042 | | | 1,545,000 | | | | 1,876,298 | |
| | | | | | | | | |
| Florence Town, Inc. | | | | | | | | |
| Industrial Development Authority | | | | | | | | |
5.000%, 07/01/2023 (c) | | | 100,000 | | | | 101,956 | |
| | | | | | | | | |
| Industrial Development Authority | | | | | | | | |
| of the City of Phoenix | | | | | | | | |
4.000%, 07/01/2026 (c) | | | 2,475,000 | | | | 2,471,408 | |
5.000%, 07/01/2045 (c) | | | 4,000,000 | | | | 4,021,726 | |
6.750%, 07/01/2044 (c) | | | 3,000,000 | | | | 3,156,498 | |
| | | | | | | | | |
| Park Central Community | | | | | | | | |
| Facilities District | | | | | | | | |
4.375%, 07/01/2024 | | | 820,000 | | | | 816,824 | |
| | | | | | | | | |
| Town of Queen Creek AZ | | | | | | | | |
| Excise Tax Revenue | | | | | | | | |
5.000%, 08/01/2034 | | | 3,925,000 | | | | 4,545,065 | |
5.000%, 08/01/2037 | | | 1,300,000 | | | | 1,479,802 | |
| | | | | | | | 37,153,782 | |
| Arkansas – 0.31% | | | | | | | | |
| | | | | | | | | |
| County of Saline, AR | | | | | | | | |
3.550%, 06/01/2042 | | | 20,000 | | | | 17,775 | |
| | | | | | | | | |
| University of Arkansas | | | | | | | | |
5.000%, 04/01/2047 | | | 2,000,000 | | | | 2,168,977 | |
| | | | | | | | 2,186,752 | |
| California – 9.45% | | | | | | | | |
| | | | | | | | | |
| California Community | | | | | | | | |
| Choice Financing Authority | | | | | | | | |
4.000%, 05/01/2053 (a) | | | 3,000,000 | | | | 3,053,459 | |
| | | | | | | | | |
| California County Tobacco | | | | | | | | |
| Securitization Agency | | | | | | | | |
5.000%, 06/01/2033 | | | 1,950,000 | | | | 2,120,310 | |
| | | | | | | | | |
| California Educational | | | | | | | | |
| Facilities Authority | | | | | | | | |
5.000%, 03/15/2039 | | | 1,015,000 | | | | 1,194,270 | |
Percentages are stated as a percent of net assets.The accompanying notes are an integral part of these financial statements.
PERFORMANCE TRUST MUTUAL FUNDS (PTIAX, PTAOX, PTCOX, PTIMX, PTRMX, PTCRX)
PERFORMANCE TRUST MUNICIPAL BOND FUND — SCHEDULE OF INVESTMENTS (CONT.)
August 31, 2022
| | | PRINCIPAL | | | | |
| | | AMOUNT | | | VALUE | |
| | | | | | | |
| California – 9.45% (Cont.) | | | | | | |
| | | | | | | |
| California Municipal | | | | | | |
| Finance Authority | | | | | | |
4.000%, 12/01/2026 (c) | | $ | 1,750,000 | | | $ | 1,691,161 | |
5.000%, 12/01/2054 (c) | | | 1,000,000 | | | | 1,008,452 | |
5.000%, 12/01/2046 (c) | | | 750,000 | | | | 758,999 | |
| | | | | | | | | |
| California Public Finance Authority | | | | | | | | |
2.875%, 05/15/2027 (c) | | | 1,125,000 | | | | 1,048,180 | |
| | | | | | | | | |
| California Statewide Communities | | | | | | | | |
| Development Authority | | | | | | | | |
6.400%, 06/01/2039 | | | 2,340,000 | | | | 2,538,966 | |
| | | | | | | | | |
| City of San Diego, CA Tobacco | | | | | | | | |
| Settlement Revenue Funding Corp. | | | | | | | | |
4.000%, 06/01/2032 | | | 1,230,000 | | | | 1,216,240 | |
| | | | | | | | | |
| Coachella Valley | | | | | | | | |
| Unified School District/CA | | | | | | | | |
0.000%, 08/01/2034 (e) | | | 1,145,000 | | | | 732,606 | |
0.000%, 08/01/2035 (e) | | | 515,000 | | | | 313,796 | |
0.000%, 08/01/2043 (e) | | | 1,015,000 | | | | 397,952 | |
| | | | | | | | | |
| Encinitas Union School District | | | | | | | | |
6.750%, 08/01/2035 | | | 1,070,000 | | | | 1,367,061 | |
| | | | | | | | | |
| Fowler Unified School District | | | | | | | | |
5.500%, 08/01/2053 | | | 4,945,000 | | | | 5,698,158 | |
| | | | | | | | | |
| Freddie Mac Multifamily | | | | | | | | |
| ML Certificates | | | | | | | | |
0.247%, 11/25/2033 (a)(b) | | | 46,754,926 | | | | 850,472 | |
| | | | | | | | | |
| Golden State Tobacco | | | | | | | | |
| Securitization Corp. | | | | | | | | |
3.000%, 06/01/2046 | | | 3,865,000 | | | | 3,399,250 | |
| | | | | | | | | |
| Inland Empire Tobacco | | | | | | | | |
| Securitization Corp. | | | | | | | | |
3.678%, 06/01/2038 | | | 2,945,000 | | | | 2,787,888 | |
| | | | | | | | | |
| Los Angeles Housing Authority | | | | | | | | |
5.000%, 06/01/2044 | | | 2,200,000 | | | | 2,291,024 | |
| | | | | | | | | |
| Low Income Investment Fund | | | | | | | | |
3.711%, 07/01/2029 | | | 1,000,000 | | | | 967,545 | |
| | | | | | | | | |
| Manteca Redevelopment | | | | | | | | |
| Agency Successor Agency | | | | | | | | |
2.393%, 10/01/2030 | | | 500,000 | | | | 431,826 | |
| | | | | | | | | |
| M-S-R Energy Authority | | | | | | | | |
6.500%, 11/01/2039 | | | 2,350,000 | | | | 2,839,415 | |
7.000%, 11/01/2034 | | | 1,160,000 | | | | 1,420,070 | |
| | | | | | | | | |
| Poway Unified School District | | | | | | | | |
0.000%, 08/01/2046 (e) | | | 10,000,000 | | | | 3,389,877 | |
| | | | | | | | | |
| Riverside County Redevelopment | | | | | | | | |
| Successor Agency | | | | | | | | |
5.000%, 10/01/2031 | | | 840,000 | | | | 912,674 | |
| | | | | | | | | |
| San Diego Public Facilities | | | | | | | | |
| Financing Authority | | | | | | | | |
5.000%, 05/15/2047 | | | 5,000,000 | | | | 5,584,950 | |
| | | | | | | | | |
| San Diego Unified School District | | | | | | | | |
0.000%, 07/01/2041 (e) | | | 2,065,000 | | | | 1,824,143 | |
| | | | | | | | | |
| San Leandro Unified School District | | | | | | | | |
0.000%, 08/01/2039 (e) | | | 2,175,000 | | | | 1,988,741 | |
| | | | | | | | | |
| San Mateo Union | | | | | | | | |
| High School District | | | | | | | | |
0.000%, 09/01/2041 (e) | | | 1,285,000 | | | | 1,196,943 | |
| | | | | | | | | |
| Santa Barbara Secondary | | | | | | | | |
| High School District | | | | | | | | |
0.000%, 08/01/2040 (e) | | | 1,400,000 | | | | 639,804 | |
| | | | | | | | | |
| St. Helena Unified School District | | | | | | | | |
0.000%, 06/01/2036 (e) | | | 2,805,000 | | | | 3,133,794 | |
| | | | | | | | | |
| University of California | | | | | | | | |
5.000%, 05/15/2046 | | | 5,000,000 | | | | 5,479,287 | |
5.500%, 05/15/2058 | | | 3,720,000 | | | | 4,092,680 | |
| | | | | | | | | |
| West Contra Costa | | | | | | | | |
| Unified School District | | | | | | | | |
0.000%, 08/01/2036 (e) | | | 2,220,000 | | | | 1,304,936 | |
| | | | | | | | 67,674,929 | |
| | | | | | | | | |
| Colorado – 3.78% | | | | | | | | |
| | | | | | | | | |
| City & County of Denver CO | | | | | | | | |
| Airport System Revenue | | | | | | | | |
5.500%, 11/15/2053 | | | 4,000,000 | | | | 4,333,224 | |
| | | | | | | | | |
| City & County of Denver, CO | | | | | | | | |
| Airport System Revenue | | | | | | | | |
5.000%, 12/01/2034 | | | 2,500,000 | | | | 2,753,217 | |
| | | �� | | | | | | |
| City of Fruita, CO | | | | | | | | |
| Healthcare Revenue | | | | | | | | |
5.000%, 01/01/2028 | | | 800,000 | | | | 770,828 | |
| | | | | | | | | |
| Colorado Health | | | | | | | | |
| Facilities Authority | | | | | | | | |
5.000%, 08/01/2044 | | | 2,410,000 | | | | 2,492,951 | |
5.000%, 05/15/2047 | | | 6,000,000 | | | | 6,537,376 | |
| | | | | | | | | |
| CommonSpirit Health | | | | | | | | |
2.950%, 11/01/2022 | | | 1,725,000 | | | | 1,723,916 | |
| | | | | | | | | |
| Public Authority for | | | | | | | | |
| Colorado Energy | | | | | | | | |
6.500%, 11/15/2038 | | | 3,845,000 | | | | 4,691,789 | |
| | | | | | | | | |
| Vauxmont Metropolitan District | | | | | | | | |
5.000%, 12/01/2050 | | | 3,450,000 | | | | 3,725,036 | |
| | | | | | | | 27,028,337 | |
| | | | | | | | | |
| Delaware – 0.50% | | | | | | | | |
| | | | | | | | | |
| University of Delaware | | | | | | | | |
5.000%, 11/01/2038 | | | 1,595,000 | | | | 1,853,617 | |
5.000%, 11/01/2039 | | | 1,510,000 | | | | 1,754,378 | |
| | | | | | | | 3,607,995 | |
Percentages are stated as a percent of net assets.The accompanying notes are an integral part of these financial statements.
PERFORMANCE TRUST MUTUAL FUNDS (PTIAX, PTAOX, PTCOX, PTIMX, PTRMX, PTCRX)
PERFORMANCE TRUST MUNICIPAL BOND FUND — SCHEDULE OF INVESTMENTS (CONT.)
August 31, 2022
| | | PRINCIPAL | | | | |
| | | AMOUNT | | | VALUE | |
| | | | | | | |
| District of Columbia – 1.05% | | | | | | |
| | | | | | | |
| District of Columbia | | | | | | |
5.000%, 06/01/2055 | | $ | 2,000,000 | | | $ | 1,976,579 | |
5.500%, 07/01/2047 | | | 4,750,000 | | | | 5,515,903 | |
| | | | | | | | 7,492,482 | |
| | | | | | | | | |
| Florida – 7.01% | | | | | | | | |
| | | | | | | | | |
| Bay County School Board | | | | | | | | |
5.500%, 07/01/2041 | | | 1,300,000 | | | | 1,458,657 | |
5.500%, 07/01/2042 | | | 1,300,000 | | | | 1,453,299 | |
| | | | | | | | | |
| Capital Trust Agency, Inc. | | | | | | | | |
5.000%, 08/01/2040 | | | 300,000 | | | | 307,656 | |
5.000%, 08/01/2055 | | | 800,000 | | | | 805,516 | |
| | | | | | | | | |
| City of Belle Isle, FL | | | | | | | | |
5.500%, 10/01/2022 | | | 120,000 | | | | 120,215 | |
| | | | | | | | | |
| City of Tampa FL Water & | | | | | | | | |
| Wastewater System Revenue | | | | | | | | |
5.000%, 10/01/2047 | | | 5,280,000 | | | | 5,894,167 | |
| | | | | | | | | |
| County of Lake, FL | | | | | | | | |
3.375%, 08/15/2026 | | | 500,000 | | | | 500,195 | |
| | | | | | | | | |
| County of Lee, FL Airport Revenue | | | | | | | | |
5.000%, 10/01/2046 | | | 3,000,000 | | | | 3,112,769 | |
| | | | | | | | | |
| County of Miami-Dade FL | | | | | | | | |
0.000%, 10/01/2041 (e) | | | 1,375,000 | | | | 569,383 | |
0.000%, 10/01/2042 (e) | | | 985,000 | | | | 385,074 | |
0.000%, 10/01/2045 (e) | | | 4,500,000 | | | | 1,530,133 | |
| | | | | | | | | |
| County of Miami-Dade, FL | | | | | | | | |
| Aviation Revenue | | | | | | | | |
5.000%, 10/01/2038 | | | 3,250,000 | | | | 3,367,858 | |
| | | | | | | | | |
| County of Pasco FL | | | | | | | | |
| Sales Tax Revenue | | | | | | | | |
5.000%, 10/01/2042 | | | 4,240,000 | | | | 4,624,696 | |
| | | | | | | | | |
| Florida Development Finance Corp. | | | | | | | | |
5.000%, 09/15/2040 (c) | | | 2,050,000 | | | | 2,040,317 | |
5.500%, 09/15/2025 (c) | | | 1,260,000 | | | | 1,246,341 | |
6.500%, 01/01/2049 (a)(c) | | | 2,735,000 | | | | 2,483,791 | |
7.375%, 01/01/2049 (c) | | | 3,000,000 | | | | 2,861,807 | |
| | | | | | | | | |
| Greater Orlando Aviation Authority | | | | | | | | |
5.000%, 10/01/2046 | | | 1,500,000 | | | | 1,555,862 | |
| | | | | | | | | |
| Palm Beach County, FL | | | | | | | | |
| School District | | | | | | | | |
5.250%, 08/01/2040 | | | 3,500,000 | | | | 3,923,500 | |
| | | | | | | | | |
| Sarasota County | | | | | | | | |
| Public Hospital District | | | | | | | | |
5.000%, 07/01/2052 | | | 4,000,000 | | | | 4,195,096 | |
| | | | | | | | | |
| School District of | | | | | | | | |
| Broward County/FL | | | | | | | | |
5.000%, 07/01/2047 | | | 7,000,000 | | | | 7,748,377 | |
| | | | | | | | 50,184,709 | |
| | | | | | | | | |
| Georgia – 4.47% | | | | | | | | |
| | | | | | | | | |
| Americus & Sumter County | | | | | | | | |
| Hospital Authority | | | | | | | | |
5.125%, 05/15/2023 | |
| 90,000 | | |
| 90,733 | |
| | | | | | | | | |
| City of Atlanta, GA | | | | | | | | |
| Water & Wastewater Revenue | | | | | | | | |
5.500%, 11/01/2027 | | | 1,550,000 | | | | 1,701,509 | |
| | | | | | | | | |
| City of Conyers, GA | | | | | | | | |
4.300%, 03/01/2031 (d) | | | 1,185,000 | | | | 1,030,890 | |
| | | | | | | | | |
| Cobb County Kennestone | | | | | | | | |
| Hospital Authority | | | | | | | | |
5.000%, 04/01/2050 | | | 5,000,000 | | | | 5,193,587 | |
| | | | | | | | | |
| Georgia Ports Authority | | | | | | | | |
5.000%, 07/01/2047 | | | 7,500,000 | | | | 8,211,139 | |
| | | | | | | | | |
| Macon-Bibb County | | | | | | | | |
| Housing Authority | | | | | | | | |
1.400%, 11/01/2024 (a) | | | 1,200,000 | | | | 1,197,205 | |
1.625%, 10/01/2024 (a) | | | 3,250,000 | | | | 3,239,331 | |
| | | | | | | | | |
| Main Street Natural Gas, Inc. | | | | | | | | |
5.000%, 05/15/2029 | | | 1,250,000 | | | | 1,331,331 | |
5.000%, 12/01/2052 (a) | | | 5,000,000 | | | | 5,252,610 | |
| | | | | | | | | |
| Municipal Electric | | | | | | | | |
| Authority of Georgia | | | | | | | | |
5.000%, 01/01/2045 | | | 1,000,000 | | | | 1,040,789 | |
| | | | | | | | | |
| Paulding County | | | | | | | | |
| Hospital Authority/GA | | | | | | | | |
5.000%, 04/01/2042 | | | 3,500,000 | | | | 3,706,878 | |
| | | | | | | | 31,996,002 | |
| | | | | | | | | |
| Hawaii – 1.82% | | | | | | | | |
| | | | | | | | | |
| City & County Honolulu HI | | | | | | | | |
| Wastewater System Revenue | | | | | | | | |
5.000%, 07/01/2042 | | | 6,855,000 | | | | 7,775,559 | |
| | | | | | | | | |
| State of Hawaii Airports | | | | | | | | |
| System Revenue | | | | | | | | |
5.000%, 07/01/2047 | | | 5,000,000 | | | | 5,235,963 | |
| | | | | | | | 13,011,522 | |
| | | | | | | | | |
| Idaho – 1.35% | | | | | | | | |
| | | | | | | | | |
| City of Boise City ID | | | | | | | | |
| Water Renewal Revenue | | | | | | | | |
5.000%, 09/01/2047 | | | 1,650,000 | | | | 1,834,799 | |
| | | | | | | | | |
| Idaho Housing & | | | | | | | | |
| Finance Association | | | | | | | | |
5.000%, 08/15/2047 | | | 7,040,000 | | | | 7,825,435 | |
| | | | | | | | 9,660,234 | |
| | | | | | | | | |
| Illinois – 3.44% | | | | | | | | |
| | | | | | | | | |
| Chicago Board of Education | | | | | | | | |
0.000%, 12/01/2022 (e) | | | 840,000 | | | | 834,289 | |
Percentages are stated as a percent of net assets.The accompanying notes are an integral part of these financial statements.
PERFORMANCE TRUST MUTUAL FUNDS (PTIAX, PTAOX, PTCOX, PTIMX, PTRMX, PTCRX)
PERFORMANCE TRUST MUNICIPAL BOND FUND — SCHEDULE OF INVESTMENTS (CONT.)
August 31, 2022
| | | PRINCIPAL | | | | |
| | | AMOUNT | | | VALUE | |
| | | | | | | |
| Illinois – 3.44% (Cont.) | | | | | | |
| | | | | | | |
| Chicago O’Hare | | | | | | |
| International Airport | | | | | | |
5.000%, 01/01/2037 | | $ | 2,000,000 | | | $ | 2,060,351 | |
5.000%, 01/01/2042 | | | 510,000 | | | | 521,062 | |
| | | | | | | | | |
| Cook County | | | | | | | | |
| School District No. 103 | | | | | | | | |
0.000%, 12/01/2022 (e) | | | 850,000 | | | | 844,180 | |
| | | | | | | | | |
| County of Cook IL | | | | | | | | |
| Sales Tax Revenue | | | | | | | | |
5.250%, 11/15/2045 | | | 5,000,000 | | | | 5,497,619 | |
| | | | | | | | | |
| Illinois Finance Authority | | | | | | | | |
5.000%, 08/15/2047 | | | 5,000,000 | | | | 5,321,448 | |
| | | | | | | | | |
| Macon County | | | | | | | | |
| School District No. 61 | | | | | | | | |
5.000%, 12/01/2040 | | | 1,000,000 | | | | 1,081,083 | |
| | | | | | | | | |
| Metropolitan Pier & | | | | | | | | |
| Exposition Authority | | | | | | | | |
0.000%, 12/15/2036 (e) | | | 2,500,000 | | | | 1,309,136 | |
| | | | | | | | | |
| Regional Transportation Authority | | | | | | | | |
5.750%, 06/01/2034 | | | 3,000,000 | | | | 3,546,620 | |
| | | | | | | | | |
| Sales Tax Securitization Corp. | | | | | | | | |
5.000%, 01/01/2027 | | | 1,700,000 | | | | 1,839,264 | |
| State of Illinois Sales Tax Revenue | | | | | | | | |
6.000%, 06/15/2026 | | | 1,575,000 | | | | 1,744,705 | |
| | | | | | | | 24,599,757 | |
| | | | | | | | | |
| Indiana – 5.84% | | | | | | | | |
| | | | | | | | | |
| Avon Community | | | | | | | | |
| School Building Corp. | | | | | | | | |
5.000%, 07/15/2038 | | | 1,000,000 | | | | 1,105,324 | |
5.000%, 07/15/2039 | | | 2,990,000 | | | | 3,296,754 | |
5.000%, 01/15/2041 | | | 3,065,000 | | | | 3,367,576 | |
| | | | | | | | | |
| City of Valparaiso, IN | | | | | | | | |
6.750%, 01/01/2034 | | | 500,000 | | | | 518,663 | |
| | | | | | | | | |
| Fort Wayne | | | | | | | | |
| Redevelopment Authority | | | | | | | | |
5.000%, 12/15/2041 | | | 2,040,000 | | | | 2,249,539 | |
| | | | | | | | | |
| Franklin Township-Marion County | | | | | | | | |
| Multiple School Building Corp. | | | | | | | | |
5.000%, 07/15/2040 | | | 4,520,000 | | | | 5,001,615 | |
| | | | | | | | | |
| Greater Clark Building Corp. | | | | | | | | |
6.000%, 07/15/2038 | | | 1,000,000 | | | | 1,213,438 | |
6.000%, 01/15/2042 | | | 5,250,000 | | | | 6,331,116 | |
| | | | | | | | | |
| Indiana Finance Authority | | | | | | | | |
5.000%, 01/01/2042 | | | 1,000,000 | | | | 1,063,374 | |
5.000%, 09/01/2036 | | | 1,000,000 | | | | 1,056,715 | |
| | | | | | | | | |
| Indiana Health Facility | | | | | | | | |
| Financing Authority | | | | | | | | |
5.000%, 11/15/2034 | | | 1,350,000 | | | | 1,425,595 | |
| | | | | | | | | |
| Merrillville Multi School | | | | | | | | |
| Building Corp. | | | | | | | | |
5.000%, 01/15/2042 | |
| 8,890,000 | | |
| 9,751,323 | |
| | | | | | | | | |
| Tippecanoe County | | | | | | | | |
| School Building Corp. | | | | | | | | |
6.000%, 01/15/2042 | | | 4,500,000 | | | | 5,439,208 | |
| | | | | | | | 41,820,240 | |
| | | | | | | | | |
| Iowa – 0.72% | | | | | | | | |
| | | | | | | | | |
| Iowa Tobacco Settlement Authority | | | | | | | | |
4.000%, 06/01/2049 | | | 5,435,000 | | | | 5,152,202 | |
| | | | | | | | | |
| Kansas – 0.46% | | | | | | | | |
| | | | | | | | | |
| Wyandotte County Unified | | | | | | | | |
| School District No 203 Piper | | | | | | | | |
5.250%, 09/01/2052 | | | 3,000,000 | | | | 3,316,099 | |
| | | | | | | | | |
| Kentucky – 0.52% | | | | | | | | |
| | | | | | | | | |
| County of Trimble, KY | | | | | | | | |
1.300%, 09/01/2044 (a) | | | 3,500,000 | | | | 2,935,158 | |
| | | | | | | | | |
| Kentucky Economic | | | | | | | | |
| Development Finance Authority | | | | | | | | |
5.000%, 05/15/2026 | | | 815,000 | | | | 819,117 | |
| | | | | | | | 3,754,275 | |
| | | | | | | | | |
| Louisiana – 0.09% | | | | | | | | |
| | | | | | | | | |
| Tobacco Settlement Financing Corp. | | | | | | | | |
5.250%, 05/15/2033 | | | 645,000 | | | | 658,606 | |
| | | | | | | | | |
| Maryland – 0.75% | | | | | | | | |
| | | | | | | | | |
| Maryland Stadium Authority | | | | | | | | |
5.000%, 05/01/2050 | | | 2,500,000 | | | | 2,737,059 | |
| | | | | | | | | |
| State of Maryland | | | | | | | | |
| Department of Transportation | | | | | | | | |
5.000%, 12/01/2029 | | | 2,250,000 | | | | 2,593,307 | |
| | | | | | | | 5,330,366 | |
| | | | | | | | | |
| Michigan – 8.12% | | | | | | | | |
| | | | | | | | | |
| City of Detroit, MI | | | | | | | | |
4.000%, 04/01/2044 (a) | | | 3,000,000 | | | | 2,382,452 | |
5.000%, 04/01/2046 | | | 1,850,000 | | | | 1,863,938 | |
| | | | | | | | | |
| Garden City School District/MI | | | | | | | | |
5.000%, 05/01/2046 | | | 1,505,000 | | | | 1,652,304 | |
5.000%, 05/01/2048 | | | 1,640,000 | | | | 1,797,463 | |
| | | | | | | | | |
| Great Lakes Water Authority | | | | | | | | |
| Sewage Disposal System Revenue | | | | | | | | |
5.250%, 07/01/2042 | | | 9,905,000 | | | | 11,025,553 | |
| | | | | | | | | |
| Great Lakes Water Authority | | | | | | | | |
| Water Supply System Revenue | | | | | | | | |
5.250%, 07/01/2042 | | | 3,000,000 | | | | 3,339,390 | |
| | | | | | | | | |
| Hemlock Public School District | | | | | | | | |
5.000%, 05/01/2045 | | | 1,200,000 | | | | 1,313,593 | |
Percentages are stated as a percent of net assets.The accompanying notes are an integral part of these financial statements.
PERFORMANCE TRUST MUTUAL FUNDS (PTIAX, PTAOX, PTCOX, PTIMX, PTRMX, PTCRX)
PERFORMANCE TRUST MUNICIPAL BOND FUND — SCHEDULE OF INVESTMENTS (CONT.)
August 31, 2022
| | | PRINCIPAL | | | | |
| | | AMOUNT | | | VALUE | |
| | | | | | | |
| Michigan – 8.12% (Cont.) | | | | | | |
| | | | | | | |
| Holly Area School District | | | | | | |
5.250%, 05/01/2048 | | $ | 8,235,000 | | | $ | 9,233,318 | |
| | | | | | | | | |
| Kalamazoo Economic | | | | | | | | |
| Development Corp. | | | | | | | | |
2.625%, 05/15/2025 | | | 1,150,000 | | | | 1,104,705 | |
| | | | | | | | | |
| Michigan Finance Authority | | | | | | | | |
3.267%, 06/01/2039 | | | 6,000,000 | | | | 5,067,472 | |
3.875%, 10/01/2023 | | | 250,000 | | | | 250,496 | |
5.000%, 12/01/2041 | | | 1,990,000 | | | | 2,134,128 | |
| | | | | | | | | |
| Michigan State Building Authority | | | | | | | | |
5.000%, 10/15/2047 | | | 3,795,000 | | | | 4,143,576 | |
| | | | | | | | | |
| Schoolcraft Community Schools | | | | | | | | |
5.000%, 05/01/2046 | | | 2,000,000 | | | | 2,208,413 | |
| | | | | | | | | |
| Thornapple Kellogg School District | | | | | | | | |
5.000%, 05/01/2043 | | | 2,360,000 | | | | 2,596,474 | |
| | | | | | | | | |
| Walled Lake | | | | | | | | |
| Consolidated School District | | | | | | | | |
5.000%, 05/01/2045 | | | 2,300,000 | | | | 2,522,150 | |
5.000%, 05/01/2047 | | | 4,950,000 | | | | 5,475,973 | |
| | | | | | | | 58,111,398 | |
| | | | | | | | | |
| Minnesota – 1.08% | | | | | | | | |
| | | | | | | | | |
| City of Minneapolis, MN | | | | | | | | |
5.000%, 03/01/2029 | | | 450,000 | | | | 452,595 | |
5.750%, 07/01/2055 | | | 2,000,000 | | | | 2,054,554 | |
| | | | | | | | | |
| City of St. Anthony, MN | | | | | | | | |
6.000%, 12/01/2030 | | | 1,000,000 | | | | 1,021,176 | |
| | | | | | | | | |
| Minneapolis-St Paul | | | | | | | | |
| Metropolitan Airports Commission | | | | | | | | |
5.250%, 01/01/2047 | | | 3,925,000 | | | | 4,189,058 | |
| | | | | | | | 7,717,383 | |
| | | | | | | | | |
| Missouri – 0.77% | | | | | | | | |
| | | | | | | | | |
| City of Kansas City MO | | | | | | | | |
5.000%, 09/01/2033 | | | 1,000,000 | | | | 1,128,978 | |
| | | | | | | | | |
| Metropolitan St Louis | | | | | | | | |
| Sewer District | | | | | | | | |
5.000%, 05/01/2047 | | | 2,875,000 | | | | 3,210,228 | |
| | | | | | | | | |
| St. Louis County | | | | | | | | |
| Industrial Development Authority | | | | | | | | |
5.125%, 09/01/2048 | | | 1,250,000 | | | | 1,156,335 | |
| | | | | | | | 5,495,541 | |
| Nebraska – 1.03% | | | | | | | | |
| Central Plains Energy Project | | | | | | | | |
5.000%, 09/01/2034 | | | 2,000,000 | | | | 2,143,932 | |
5.000%, 05/01/2053 (a) | | | 5,000,000 | | | | 5,244,755 | |
| | | | | | | | 7,388,687 | |
| New Jersey – 0.78% | | | | | | | | |
| | | | | | | | | |
| Garden State Preservation Trust | | | | | | | | |
5.750%, 11/01/2028 | |
| 965,000 | | |
| 1,078,871 | |
| | | | | | | | | |
| New Jersey Economic | | | | | | | | |
| Development Authority | | | | | | | | |
3.375%, 07/01/2030 | | | 1,000,000 | | | | 965,012 | |
5.500%, 01/01/2027 | | | 300,000 | | | | 309,363 | |
| | | | | | | | | |
| New Jersey Transportation | | | | | | | | |
| Trust Fund Authority | | | | | | | | |
0.000%, 12/15/2037 (e) | | | 395,000 | | | | 207,418 | |
0.000%, 12/15/2038 (e) | | | 1,000,000 | | | | 496,035 | |
0.000%, 12/15/2030 (e) | | | 1,870,000 | | | | 1,433,359 | |
| | | | | | | | | |
| Tobacco Settlement | | | | | | | | |
| Financing Corp. | | | | | | | | |
5.000%, 06/01/2033 | | | 1,035,000 | | | | 1,105,461 | |
| | | | | | | | 5,595,519 | |
| | | | | | | | | |
| New York – 3.58% | | | | | | | | |
| | | | | | | | | |
| Build NYC Resource Corp. | | | | | | | | |
4.000%, 06/15/2031 | | | 600,000 | | | | 575,446 | |
4.000%, 06/15/2041 | | | 1,350,000 | | | | 1,186,687 | |
| | | | | | | | | |
| New York City Transitional | | | | | | | | |
| Finance Authority Future | | | | | | | | |
| Tax Secured Revenue | | | | | | | | |
5.250%, 08/01/2042 | | | 5,000,000 | | | | 5,593,062 | |
| | | | | | | | | |
| New York State | | | | | | | | |
| Dormitory Authority | | | | | | | | |
2.692%, 07/01/2035 | | | 1,000,000 | | | | 821,097 | |
2.742%, 07/01/2036 | | | 1,205,000 | | | | 978,960 | |
2.792%, 07/01/2037 | | | 1,200,000 | | | | 964,049 | |
2.842%, 07/01/2038 | | | 1,100,000 | | | | 871,638 | |
5.000%, 03/15/2046 | | | 2,650,000 | | | | 2,855,983 | |
| | | | | | | | | |
| New York Transportation | | | | | | | | |
| Development Corp. | | | | | | | | |
5.000%, 12/01/2037 | | | 1,280,000 | | | | 1,335,376 | |
5.000%, 12/01/2032 | | | 3,900,000 | | | | 4,223,184 | |
| | | | | | | | | |
| Port Authority of | | | | | | | | |
| New York & New Jersey | | | | | | | | |
5.000%, 09/01/2032 | | | 1,525,000 | | | | 1,573,917 | |
| | | | | | | | | |
| Triborough Bridge & | | | | | | | | |
| Tunnel Authority | | | | | | | | |
5.000%, 05/15/2041 | | | 4,245,000 | | | | 4,660,530 | |
| | | | | | | | 25,639,929 | |
| | | | | | | | | |
| North Carolina – 1.90% | | | | | | | | |
| | | | | | | | | |
| City of Charlotte NC | | | | | | | | |
| Airport Revenue | | | | | | | | |
5.000%, 07/01/2042 | | | 5,035,000 | | | | 5,534,204 | |
| | | | | | | | | |
| City of Charlotte NC Water & | | | | | | | | |
| Sewer System Revenue | | | | | | | | |
5.000%, 07/01/2035 | | | 2,625,000 | | | | 3,114,732 | |
Percentages are stated as a percent of net assets.The accompanying notes are an integral part of these financial statements.
PERFORMANCE TRUST MUTUAL FUNDS (PTIAX, PTAOX, PTCOX, PTIMX, PTRMX, PTCRX)
PERFORMANCE TRUST MUNICIPAL BOND FUND — SCHEDULE OF INVESTMENTS (CONT.)
August 31, 2022
| | | PRINCIPAL | | | | |
| | | AMOUNT | | | VALUE | |
| | | | | | | |
| North Carolina – 1.90% (Cont.) | | | | | | |
| | | | | | | |
| North Carolina Medical | | | | | | |
| Care Commission | | | | | | |
2.500%, 10/01/2024 | | $ | 740,000 | | | $ | 719,476 | |
| | | | | | | | | |
| University of North Carolina | | | | | | | | |
| at Chapel Hill | | | | | | | | |
5.000%, 02/01/2049 | | | 3,700,000 | | | | 4,258,493 | |
| | | | | | | | 13,626,905 | |
| | | | | | | | | |
| North Dakota – 0.29% | | | | | | | | |
| | | | | | | | | |
| City of Larimore, ND | | | | | | | | |
0.850%, 05/01/2024 | | | 2,000,000 | | | | 1,902,684 | |
| | | | | | | | | |
| City of Mandan, ND | | | | | | | | |
2.750%, 09/01/2041 | | | 225,000 | | | | 202,061 | |
| | | | | | | | 2,104,745 | |
| | | | | | | | | |
| Ohio – 1.93% | | | | | | | | |
| | | | | | | | | |
| County of Cuyahoga, OH | | | | | | | | |
5.500%, 02/15/2052 | | | 1,300,000 | | | | 1,349,071 | |
| | | | | | | | | |
| County of Hamilton, OH | | | | | | | | |
3.374%, 06/01/2034 | | | 3,020,000 | | | | 2,741,166 | |
5.000%, 11/15/2049 | | | 7,500,000 | | | | 8,529,647 | |
| | | | | | | | | |
| Ohio Higher Educational | | | | | | | | |
| Facility Commission | | | | | | | | |
3.750%, 12/01/2023 | | | 1,215,000 | | | | 1,201,365 | |
| | | | | | | | 13,821,249 | |
| | | | | | | | | |
| Oregon – 0.24% | | | | | | | | |
| | | | | | | | | |
| Clackamas County | | | | | | | | |
| Hospital Facility Authority | | | | | | | | |
2.750%, 11/15/2025 | | | 375,000 | | | | 364,763 | |
| | | | | | | | | |
| Hospital Facilities Authority of | | | | | | | | |
| Multnomah County Oregon | | | | | | | | |
0.950%, 06/01/2027 | | | 1,000,000 | | | | 884,890 | |
| | | | | | | | | |
| Medford Hospital | | | | | | | | |
| Facilities Authority | | | | | | | | |
5.000%, 10/01/2024 | | | 450,000 | | | | 459,597 | |
| | | | | | | | 1,709,250 | |
| | | | | | | | | |
| Pennsylvania – 2.07% | | | | | | | | |
| | | | | | | | | |
| City of Philadelphia PA Water | | | | | | | | |
| & Wastewater Revenue | | | | | | | | |
5.500%, 06/01/2047 | | | 5,000,000 | | | | 5,650,738 | |
| | | | | | | | | |
| Commonwealth Financing Authority | | | | | | | | |
5.000%, 06/01/2034 | | | 1,750,000 | | | | 1,891,890 | |
5.000%, 06/01/2035 | | | 730,000 | | | | 787,029 | |
| | | | | | | | | |
| Delaware Valley Regional | | | | | | | | |
| Finance Authority | | | | | | | | |
2.470% (1 Month LIBOR | | | | | | | | |
USD + 0.880%), 09/01/2048 (a) | | | 1,000,000 | | | | 995,326 | |
| | | | | | | | | |
| Pennsylvania Economic | | | | | | | | |
| Development Financing Authority | | | | | | | | |
5.000%, 06/30/2028 | |
| 750,000 | | |
| 788,129 | |
| | | | | | | | | |
| Pennsylvania State University/The | | | | | | | | |
5.000%, 09/01/2038 | | | 1,500,000 | | | | 1,696,317 | |
| | | | | | | | | |
| Pennsylvania Turnpike Commission | | | | | | | | |
6.000%, 12/01/2030 | | | 625,000 | | | | 725,529 | |
6.375%, 12/01/2038 | | | 2,000,000 | | | | 2,316,761 | |
| | | | | | | | 14,851,719 | |
| | | | | | | | | |
| Puerto Rico – 1.25% | | | | | | | | |
| | | | | | | | | |
| Children’s Trust Fund | | | | | | | | |
5.375%, 05/15/2033 | | | 125,000 | | | | 128,175 | |
| | | | | | | | | |
| Commonwealth of Puerto Rico | | | | | | | | |
0.000%, 07/01/2024 (e) | | | 49,219 | | | | 45,490 | |
0.000%, 07/01/2033 (e) | | | 189,697 | | | | 107,956 | |
0.000%, 11/01/2043 (a) | | | 734,362 | | | | 379,114 | |
4.000%, 07/01/2033 | | | 147,407 | | | | 138,123 | |
4.000%, 07/01/2035 | | | 132,497 | | | | 121,825 | |
4.000%, 07/01/2037 | | | 113,718 | | | | 101,902 | |
4.000%, 07/01/2041 | | | 154,613 | | | | 135,026 | |
4.000%, 07/01/2046 | | | 160,797 | | | | 136,551 | |
5.250%, 07/01/2023 | | | 81,902 | | | | 83,142 | |
5.375%, 07/01/2025 | | | 164,169 | | | | 169,433 | |
5.625%, 07/01/2027 | | | 162,682 | | | | 172,639 | |
5.625%, 07/01/2029 | | | 160,042 | | | | 172,370 | |
5.750%, 07/01/2031 | | | 155,448 | | | | 170,537 | |
| | | | | | | | | |
| GDB Debt Recovery | | | | | | | | |
| Authority of Puerto Rico | | | | | | | | |
7.500%, 08/20/2040 | | | 3,164,947 | | | | 2,832,628 | |
| | | | | | | | | |
| Puerto Rico Highway & | | | | | | | | |
| Transportation Authority | | | | | | | | |
5.850%, 03/01/2027 (d) | | | 1,395,000 | | | | 1,397,790 | |
| | | | | | | | | |
| Puerto Rico Sales Tax Financing | | | | | | | | |
| Corp. Sales Tax Revenue | | | | | | | | |
0.000%, 07/01/2024 (e) | | | 1,543,000 | | | | 1,447,839 | |
0.000%, 07/01/2029 (e) | | | 1,589,000 | | | | 1,217,131 | |
| | | | | | | | 8,957,671 | |
| | | | | | | | | |
| South Carolina – 0.93% | | | | | | | | |
| | | | | | | | | |
| Commission of Public Works, | | | | | | | | |
| City of Greer | | | | | | | | |
5.500%, 09/01/2032 | | | 1,000,000 | | | | 1,163,329 | |
| | | | | | | | | |
| University of South Carolina | | | | | | | | |
5.000%, 05/01/2046 | | | 4,970,000 | | | | 5,471,717 | |
| | | | | | | | 6,635,046 | |
| | | | | | | | | |
| Tennessee – 0.81% | | | | | | | | |
| | | | | | | | | |
| New Memphis Arena | | | | | | | | |
| Public Building Authority | | | | | | | | |
0.000%, 04/01/2030 (e) | | | 750,000 | | | | 685,989 | |
0.000%, 04/01/2031 (e) | | | 1,500,000 | | | | 1,372,298 | |
Percentages are stated as a percent of net assets.The accompanying notes are an integral part of these financial statements.
PERFORMANCE TRUST MUTUAL FUNDS (PTIAX, PTAOX, PTCOX, PTIMX, PTRMX, PTCRX)
PERFORMANCE TRUST MUNICIPAL BOND FUND — SCHEDULE OF INVESTMENTS (CONT.)
August 31, 2022
| | | PRINCIPAL | | | | |
| | | AMOUNT | | | VALUE | |
| | | | | | | |
| Tennessee – 0.81% (Cont.) | | | | | | |
| | | | | | | |
| Tennergy Corp/TN | | | | | | |
4.000%, 12/01/2051 (a) | | $ | 3,775,000 | | | $ | 3,768,432 | |
| | | | | | | | 5,826,719 | |
| | | | | | | | | |
| Texas – 15.67% | | | | | | | | |
| | | | | | | | | |
| Alvarado Independent | | | | | | | | |
| School District/TX | | | | | | | | |
5.000%, 02/15/2047 | | | 8,000,000 | | | | 8,761,155 | |
| | | | | | | | | |
| Argyle Independent School District | | | | | | | | |
5.000%, 08/15/2047 | | | 8,000,000 | | | | 8,864,362 | |
| | | | | | | | | |
| Barbers Hill Independent | | | | | | | | |
| School District | | | | | | | | |
5.000%, 02/15/2042 | | | 5,000,000 | | | | 5,585,324 | |
| | | | | | | | | |
| Bullard Independent School District | | | | | | | | |
5.000%, 02/15/2047 | | | 5,405,000 | | | | 5,941,795 | |
| | | | | | | | | |
| Celina Independent School District | | | | | | | | |
5.000%, 02/15/2047 | | | 5,000,000 | | | | 5,535,833 | |
| | | | | | | | | |
| City of Austin TX | | | | | | | | |
| Airport System Revenue | | | | | | | | |
5.000%, 11/15/2043 | | | 3,685,000 | | | | 3,890,555 | |
5.250%, 11/15/2047 | | | 2,410,000 | | | | 2,576,235 | |
| | | | | | | | | |
| City of Fort Worth, TX | | | | | | | | |
5.250%, 03/01/2036 | | | 1,800,000 | | | | 1,858,967 | |
| | | | | | | | | |
| City of Midland TX | | | | | | | | |
5.000%, 03/01/2047 | | | 5,000,000 | | | | 5,489,599 | |
| | | | | | | | | |
| Clifton Higher Education | | | | | | | | |
| Finance Corp. | | | | | | | | |
6.000%, 03/01/2029 (a) | | | 2,915,000 | | | | 2,994,636 | |
| | | | | | | | | |
| Colony Economic | | | | | | | | |
| Development Corp. | | | | | | | | |
7.250%, 10/01/2042 | | | 1,500,000 | | | | 1,536,269 | |
| | | | | | | | | |
| Colony Local Development Corp. | | | | | | | | |
7.250%, 10/01/2033 | | | 700,000 | | | | 718,182 | |
| | | | | | | | | |
| County of Harris, TX | | | | | | | | |
2.616% (3 Month LIBOR | | | | | | | | |
USD + 0.670%), 08/15/2035 (a) | | | 1,020,000 | | | | 937,700 | |
| | | | | | | | | |
| Deer Park Independent | | | | | | | | |
| School District | | | | | | | | |
5.000%, 08/15/2047 | | | 1,230,000 | | | | 1,372,667 | |
| | | | | | | | | |
| Fredericksburg Independent | | | | | | | | |
| School District | | | | | | | | |
5.000%, 02/15/2047 | | | 4,195,000 | | | | 4,655,076 | |
| | | | | | | | | |
| Melissa Independent | | | | | | | | |
| School District | | | | | | | | |
5.000%, 02/01/2047 | | | 6,000,000 | | | | 6,667,153 | |
| | | | | | | | | |
| Pasadena Independent | | | | | | | | |
| School District | | | | | | | | |
5.000%, 02/15/2047 | | | 4,165,000 | | | | 4,564,131 | |
| | | | | | | | | |
| Port of Beaumont Industrial | | | | | | | | |
| Development Authority | | | | | | | | |
4.100%, 01/01/2028 (c) | |
| 3,000,000 | | |
| 2,404,040 | |
| | | | | | | | | |
| Pottsboro Higher Education | | | | | | | | |
| Finance Corp. | | | | | | | | |
2.000%, 08/15/2040 | | | 775,000 | | | | 540,673 | |
| | | | | | | | | |
| Pottsboro Independent | | | | | | | | |
| School District/TX | | | | | | | | |
5.000%, 02/15/2047 | | | 6,695,000 | | | | 7,359,911 | |
| | | | | | | | | |
| State of Texas | | | | | | | | |
4.000%, 08/01/2033 | | | 1,315,000 | | | | 1,385,632 | |
4.000%, 08/01/2034 | | | 1,350,000 | | | | 1,410,774 | |
| | | | | | | | | |
| Tarrant County Cultural Education | | | | | | | | |
| Facilities Finance Corp. | | | | | | | | |
5.000%, 10/01/2040 | | | 1,350,000 | | | | 1,472,140 | |
5.000%, 07/01/2036 | | | 1,500,000 | | | | 1,612,333 | |
5.000%, 07/01/2053 | | | 4,000,000 | | | | 4,204,889 | |
| | | | | | | | | |
| University of Houston | | | | | | | | |
5.000%, 02/15/2042 | | | 5,000,000 | | | | 5,559,832 | |
| | | | | | | | | |
| Van Alstyne Independent | | | | | | | | |
| School District | | | | | | | | |
5.000%, 02/15/2047 | | | 5,935,000 | | | | 6,597,153 | |
| | | | | | | | | |
| White Settlement Independent | | | | | | | | |
| School District | | | | | | | | |
5.000%, 08/15/2047 | | | 7,035,000 | | | | 7,692,644 | |
| | | | | | | | 112,189,660 | |
| | | | | | | | | |
| Utah – 1.57% | | | | | | | | |
| | | | | | | | | |
| City of Salt Lake City UT | | | | | | | | |
| Airport Revenue | | | | | | | | |
5.250%, 07/01/2048 | | | 2,260,000 | | | | 2,352,660 | |
| | | | | | | | | |
| County of Utah, UT | | | | | | | | |
5.000%, 05/15/2041 | | | 1,500,000 | | | | 1,572,404 | |
| | | | | | | | | |
| Utah Associated Municipal | | | | | | | | |
| Power Systems | | | | | | | | |
5.000%, 09/01/2037 | | | 2,030,000 | | | | 2,168,654 | |
| | | | | | | | | |
| Utah Charter School | | | | | | | | |
| Finance Authority | | | | | | | | |
5.000%, 10/15/2035 | | | 1,500,000 | | | | 1,568,688 | |
5.000%, 04/15/2039 | | | 700,000 | | | | 753,997 | |
| | | | | | | | | |
| Wildflower Improvement Association | | | | | | | | |
6.625%, 03/01/2031 (c)(d) | | | 2,895,549 | | | | 2,814,740 | |
| | | | | | | | 11,231,143 | |
| | | | | | | | | |
| Virginia – 0.36% | | | | | | | | |
| | | | | | | | | |
| Arlington County Industrial | | | | | | | | |
| Development Authority | | | | | | | | |
5.000%, 07/01/2037 | | | 500,000 | | | | 533,351 | |
| | | | | | | | | |
| County of Botetourt, VA | | | | | | | | |
6.000%, 07/01/2044 | | | 2,000,000 | | | | 2,063,371 | |
| | | | | | | | 2,596,722 | |
Percentages are stated as a percent of net assets.The accompanying notes are an integral part of these financial statements.
PERFORMANCE TRUST MUTUAL FUNDS (PTIAX, PTAOX, PTCOX, PTIMX, PTRMX, PTCRX)
PERFORMANCE TRUST MUNICIPAL BOND FUND — SCHEDULE OF INVESTMENTS (CONT.)
August 31, 2022
| | | PRINCIPAL | | | | |
| | | AMOUNT | | | VALUE | |
| | | | | | | |
| Washington – 4.57% | | | | | | |
| | | | | | | |
| City of Seattle WA Municipal | | | | | | |
| Light & Power Revenue | | | | | | |
5.000%, 07/01/2047 | | $ | 8,000,000 | | | $ | 8,883,163 | |
| | | | | | | | | |
| Port of Seattle WA | | | | | | | | |
5.500%, 08/01/2047 | | | 5,000,000 | | | | 5,512,811 | |
| | | | | | | | | |
| Port of Seattle, WA | | | | | | | | |
5.000%, 04/01/2034 | | | 1,500,000 | | | | 1,546,023 | |
| | | | | | | | | |
| State of Washington | | | | | | | | |
5.000%, 08/01/2046 | | | 4,875,000 | | | | 5,344,248 | |
5.000%, 02/01/2046 | | | 5,000,000 | | | | 5,508,056 | |
5.000%, 08/01/2047 | | | 5,000,000 | | | | 5,525,289 | |
| | | | | | | | | |
| Washington State Housing | | | | | | | | |
| Finance Commission | | | | | | | | |
5.000%, 01/01/2055 (c) | | | 500,000 | | | | 428,949 | |
| | | | | | | | 32,748,539 | |
| | | | | | | | | |
| Wisconsin – 0.98% | | | | | | | | |
| | | | | | | | | |
| Public Finance Authority | | | | | | | | |
5.000%, 10/01/2044 | | | 1,000,000 | | | | 1,035,876 | |
5.000%, 07/01/2038 | | | 2,550,000 | | | | 2,733,132 | |
7.500%, 06/01/2029 (c) | | | 2,000,000 | | | | 2,018,364 | |
| | | | | | | | | |
| Wisconsin Health & | | | | | | | | |
| Educational Facilities Authority | | | | | | | | |
5.000%, 08/15/2034 | | | 1,180,000 | | | | 1,255,072 | |
| | | | | | | | 7,042,444 | |
| TOTAL MUNICIPAL BONDS | | | | | | | | |
| (Cost $720,438,388) | | | | | | | 690,998,815 | |
| | | | | | | | | |
| SHORT-TERM INVESTMENT – 4.43% | | | | | | | | |
First American Government | | | | | | | | |
Obligations Fund – | | | | | | | | |
Class X, 2.039% (f) | | | 31,741,058 | | |
| 31,741,058 | |
| TOTAL SHORT-TERM INVESTMENT | | | | | | | | |
| (Cost $31,741,058) | | | | | | | 31,741,058 | |
| | | | | | | | | |
| Total Investments | | | | | | | | |
| (Cost $780,965,224) – 104.83% | | | | | | | 750,545,680 | |
| | | | | | | | | |
| Liabilities in Excess | | | | | | | | |
| of Other Assets – (4.83)% | | | | | | | (34,607,920 | ) |
| | | | | | | | | |
| TOTAL NET ASSETS – 100.00% | | | | | | $ | 715,937,760 | |
Percentages are stated as a percent of net assets.| (a) | Variable rate security; the rate shown represents the rate at August 31, 2022. The coupon is based on an underlying pool of loans. |
| (b) | Represents an interest-only security that entitles holders to receive only interest payments on underlying mortgages. |
| (c) | Securities issued pursuant to Rule 144A under the Securities Act of 1933. |
| (d) | Represents an illiquid security. The total market value of these securities was $5,243,420, representing 0.73% of net assets as of August 31, 2022. |
| (e) | Represents a security issued at a discount to its face value but pays no interest. |
| (f) | Seven day yield at August 31, 2022. |
The accompanying notes are an integral part of these financial statements.
PERFORMANCE TRUST MUTUAL FUNDS (PTIAX, PTAOX, PTCOX, PTIMX, PTRMX, PTCRX)
PERFORMANCE TRUST CREDIT FUND — SCHEDULE OF INVESTMENTS
August 31, 2022
| | PRINCIPAL | | | |
| | AMOUNT | | VALUE | |
| | | | | |
| ASSET BACKED SECURITIES – 7.35% | | | | |
| | | | | |
| American Credit Acceptance | | | | |
| Receivables Trust | | | | |
2022-2, 4.410%, 06/13/2028 (a) | $ | 600,000 | | $ | 585,048 | |
2022-3, 4.860%, 10/13/2028 (a) | | 1,000,000 | | | 996,437 | |
| | | | | | | |
| Exeter Automobile | | | | | | |
| Receivables Trust | | | | | | |
2022-2A, 3.650%, 10/15/2026 | | 500,000 | | | 490,480 | |
2022-2A, 3.850%, 07/17/2028 | | 1,000,000 | | | 970,595 | |
2022-4A, 4.920%, 12/15/2028 | | 1,000,000 | | | 995,705 | |
| | | | | | | |
| Flagship Credit Auto Trust | | | | | | |
2022-3, 0.000%, 04/15/2027 (a) | | 1,000,000 | | | 996,160 | |
| | | | | | | |
| Santander Drive Auto | | | | | | |
| Receivables Trust | | | | | | |
2022-5, 4.740%, 10/16/2028 | | 1,000,000 | | | 995,933 | |
| | | | | | | |
| TOTAL ASSET BACKED | | | | | | |
| SECURITIES | | | | | | |
| (Cost $6,076,906) | | | | | 6,030,358 | |
| | | | | | | |
| COLLATERALIZED LOAN | | | | | | |
| OBLIGATIONS – 14.02% | | | | | | |
| | | | | | | |
| Apidos CLO XI | | | | | | |
| | 2012-11A, 6.490% | | | | | | |
| (3 Month LIBOR USD + 3.750%), | | | | | | |
| 04/17/2034 (a)(b)(c) | | 500,000 | | | 474,819 | |
| | | | | | | | |
| Apidos CLO XII | | | | | | |
| | 2013-12A, 7.912% | | | | | | |
| (3 Month LIBOR USD + 5.400%), | | | | | | |
| 04/15/2031 (a)(b)(c) | | 350,000 | | | 289,155 | |
| | | | | | | | |
| Apidos CLO XXXII | | | | | | |
| | 2019-32A, 9.460% | | | | | | |
| (3 Month LIBOR USD + 6.750%), | | | | | | |
| 01/20/2033 (a)(b)(c) | | 500,000 | | | 450,575 | |
| | | | | | | | |
| Ares XXXIX CLO Ltd. | | | | | | |
| | 2016-39A, 6.090% | | | | | | |
(3 Month LIBOR USD + 3.350%), | | | | | | |
04/18/2031 (a)(b)(c) | | 1,000,000 | | | 926,220 | |
| | | | | | | | |
| Ares XXXVII CLO Ltd. | | | | | | |
| | 2015-4A, 5.162% | | | | | | |
| (3 Month LIBOR USD + 2.650%), | | | | | | |
| 10/15/2030 (a)(b)(c) | | 1,000,000 | | | 909,116 | |
| | | | | | | | |
| Burnham Park CLO Ltd. | | | | | | |
| | 2016-1A, 5.560 | | | | | | |
| (3 Month LIBOR USD + 2.850%), | | | | | | |
| 10/20/2029 (a)(b)(c) | | 1,000,000 | | | 934,161 | |
| | | | | | | | |
| Buttermilk Park CLO Ltd. | | | | | | |
| | 2018-1A, 5.612% | | | | | | |
| (3 Month LIBOR USD + 3.100%), | | | | | | |
| 10/15/2031 (a)(b)(c) | | 1,000,000 | | | 938,132 | |
| | | | | | | | |
| Cayuga Park CLO Ltd. | | | | | | |
| | 2020-1A, 8.740% | | | | | | |
| (3 Month LIBOR USD + 6.000%), | | | | | | |
| 07/17/2034 (a)(b)(c) |
| 1,250,000 | |
| 1,117,661 | |
| | | | | | | | |
| Goldentree Loan | | | | | | |
| Management US CLO 2 Ltd. | | | | | | |
| | 2017-2A, 7.410% | | | | | | |
| (3 Month LIBOR USD + 4.700%), | | | | | | |
| 11/28/2030 (a)(b)(c) | | 700,000 | | | 589,645 | |
| | | | | | | | |
| Goldentree Loan | | | | | | |
| Management US CLO 4 Ltd. | | | | | | |
| | 2019-4A, 7.533% | | | | | | |
(3 Month LIBOR USD + 4.750%), | | | | | | |
04/24/2031 (a)(b)(c) | | 350,000 | | | 290,760 | |
| | | | | | | | |
| GoldentTree Loan | | | | | | |
| Management US CLO 1 Ltd. | | | | | | |
| | 2021-9A, 5.610 | | | | | | |
| (3 Month LIBOR USD + 2.900%), | | | | | | |
| 01/20/2033 (a)(b)(c) | | 500,000 | | | 444,439 | |
| | | | | | | | |
| LCM Loan Income Fund I | | | | | | |
| Income Note Issuer Ltd. | | | | | | |
| | 27A, 8.340% | | | | | | |
| (3 Month LIBOR USD + 5.600%), | | | | | | |
| 07/16/2031 (a)(b)(c) | | 500,000 | | | 364,906 | |
| | | | | | | | |
| LCM XVIII LP | | | | | | |
| | 18A, 8.660% | | | | | | |
| (3 Month LIBOR USD + 5.950%), | | | | | | |
| 04/20/2031 (a)(b)(c) | | 650,000 | | | 484,696 | |
| | | | | | | |
| LCM XXII Ltd. | | | | | | |
| | 22A, 5.510% | | | | | | |
| (3 Month LIBOR USD + 2.800%), | | | | | | |
| 10/20/2028 (a)(b)(c) | | 895,000 | | | 788,412 | |
| | | | | | | | |
| Neuberger Berman Loan | | | | | | |
| Advisers CLO 33 Ltd. | | | | | | |
| | 2019-33A, 5.640% | | | | | | |
| (3 Month LIBOR USD + 2.900%), | | | | | | |
| 10/16/2033 (a)(b)(c) | | 1,000,000 | | | 936,155 | |
| | | | | | | | |
| Neuberger Berman Loan | | | | | | |
| Advisers CLO 35 Ltd. | | | | | | |
| | 2019-35A, 9.738% | | | | | | |
| (3 Month LIBOR USD + 7.000%), | | | | | | |
| 01/19/2033 (a)(b)(c) | | 1,000,000 | | | 951,496 | |
| | | | | | | | |
| Peace Park CLO Ltd. | | | | | | |
| | 2021-1A, 5.660 | | | | | | |
| (3 Month LIBOR USD + 2.950%), | | | | | | |
| 10/20/2034 (a)(b)(c) | | 665,000 | | | 611,141 | |
| | | | | | | | |
| TOTAL COLLATERALIZED | | | | | | |
| LOAN OBLIGATIONS | | | | | | |
| (Cost $11,855,146) | | | | | 11,501,489 | |
Percentages are stated as a percent of net assets.The accompanying notes are an integral part of these financial statements.
PERFORMANCE TRUST MUTUAL FUNDS (PTIAX, PTAOX, PTCOX, PTIMX, PTRMX, PTCRX)
PERFORMANCE TRUST CREDIT FUND — SCHEDULE OF INVESTMENTS (CONT.)
August 31, 2022
| | | PRINCIPAL | | | | |
| | | AMOUNT | | | VALUE | |
| | | | | | | |
| CORPORATE BONDS – 34.49% | | | | | | |
| | | | | | | |
| Diversified Consumer | | | | | | |
| Services – 0.42% | | | | | | |
| | | | | | | |
| Prime Security Services Borrower, LLC | | | | | | |
3.375%, 08/31/2027 | | $ | 400,000 | | | $ | 343,756 | |
| | | | | | | | | |
| Diversified Financial Services – 0.24% | | | | | | | | |
| | | | | | | | | |
| Compeer Financial FLCA | | | | | | | | |
3.375% (SOFR + 1.965%), | | | | | | | | |
06/01/2036 (b) | | | 250,000 | | | | 200,309 | |
| | | | | | | | | |
| Aerospace & Defense – 1.03% | | | | | | | | |
| | | | | | | | | |
| Howmet Aerospace, Inc. | | | | | | | | |
3.000%, 01/15/2029 | | | 1,000,000 | | | | 845,940 | |
| | | | | | | | | |
| Banks – 7.41% | | | | | | | | |
| | | | | | | | | |
| Barclays PLC | | | | | | | | |
6.125% (5 Year CMT Rate + | | | | | | | | |
5.867%), 09/15/2166 (b) | | | 250,000 | | | | 230,613 | |
| | | | | | | | | |
| First Foundation, Inc. | | | | | | | | |
3.500% (SOFR + 2.040%), | | | | | | | | |
02/01/2032 (b) | | | 500,000 | | | | 438,146 | |
| | | | | | | | | |
| First-Citizens Bank & Trust Co. | | | | | | | | |
6.125%, 03/09/2028 | | | 1,000,000 | | | | 1,034,524 | |
| | | | | | | | | |
| HomeStreet, Inc. | | | | | | | | |
3.500% (TSFR3M + 2.150%), | | | | | | | | |
01/30/2032 (b) | | | 500,000 | | | | 450,139 | |
| | | | | | | | | |
| National Australia Bank Ltd. | | | | | | | | |
3.347% (5 Year CMT Rate + | | | | | | | | |
1.700%), 01/12/2037 (b) | | | 500,000 | | | | 415,039 | |
| | | | | | | | | |
| Renasant Corp. | | | | | | | | |
3.000% (TSFR3M + 1.910%), | | | | | | | | |
12/01/2031 (b) | | | 750,000 | | | | 650,188 | |
| | | | | | | | | |
| Synovus Financial Corp. | | | | | | | | |
5.900% (5 Year Swap Rate USD + | | | | | | | | |
3.379%), 02/07/2029 (b) | | | 1,000,000 | | | | 991,563 | |
| | | | | | | | | |
| Texas Capital Bancshares, Inc. | | | | | | | | |
4.000% (5 Year CMT Rate + | | | | | | | | |
3.150%), 05/06/2031 (b) | | | 1,000,000 | | | | 884,519 | |
| | | | | | | | | |
| Western Alliance Bank | | | | | | | | |
5.250% (TSFR3M + 5.120%), | | | | | | | | |
06/01/2030 (b) | | | 1,000,000 | | | | 982,975 | |
| | | | | | | | | |
| Building Products – 0.25% | | | | | | | | |
| | | | | | | | | |
| Masonite International Corp. | | | | | | | | |
3.500%, 02/15/2030 | | | 250,000 | | | | 201,339 | |
| | | | | | | | | |
| Capital Markets – 2.30% | | | | | | | | |
| | | | | | | | | |
| Ares Capital Corp. | | | | | | | | |
3.200%, 11/15/2031 | | | 1,080,000 | | | | 845,359 | |
| | | | | | | | | |
| MSCI, Inc. | | | | | | | | |
3.625%, 11/01/2031 | | | 1,250,000 | | | | 1,043,365 | |
| | | | | | | | | |
| Chemicals – 0.87% | | | | | | | | |
| | | | | | | | | |
| Axalta Coating Systems, LLC | | | | | | | | |
3.375%, 02/15/2029 | |
| 400,000 | | |
| 331,150 | |
| | | | | | | | | |
| Scotts Miracle-Gro Co. | | | | | | | | |
4.375%, 02/01/2032 | | | 500,000 | | | | 376,830 | |
| | | | | | | | | |
| Consumer Finance – 1.01% | | | | | | | | |
| | | | | | | | | |
| OneMain Finance Corp. | | | | | | | | |
5.375%, 11/15/2029 | | | 1,000,000 | | | | 829,855 | |
| | | | | | | | | |
| Containers & Packaging – 1.22% | | | | | | | | |
| | | | | | | | | |
| Ball Corp. | | | | | | | | |
2.875%, 08/15/2030 | | | 1,000,000 | | | | 812,490 | |
| | | | | | | | | |
| Graphic Packaging International, LLC | | | | | | | | |
4.750%, 07/15/2027 | | | 200,000 | | | | 190,733 | |
| | | | | | | | | |
| Distributors – 0.25% | | | | | | | | |
| | | | | | | | | |
| Genuine Parts Co. | | | | | | | | |
2.750%, 02/01/2032 | | | 250,000 | | | | 208,071 | |
| | | | | | | | | |
| Electronic Equipment, | | | | | | | | |
| Instruments & Components – 1.06% | | | | | | | | |
| | | | | | | | | |
| CDW Finance Corp. | | | | | | | | |
3.250%, 02/15/2029 | | | 1,000,000 | | | | 869,640 | |
| | | | | | | | | |
| Equity Real Estate | | | | | | | | |
| Investment Trusts (REITs) – 0.49% | | | | | | | | |
| | | | | | | | | |
| American Finance Trust, Inc. | | | | | | | | |
4.500%, 09/30/2028 | | | 500,000 | | | | 400,513 | |
| | | | | | | | | |
| Health Care Providers | | | | | | | | |
| & Services – 0.51% | | | | | | | | |
| | | | | | | | | |
| Centene Corp. | | | | | | | | |
3.000%, 10/15/2030 | | | 500,000 | | | | 416,465 | |
| | | | | | | | | |
| Hotels, Restaurants & Leisure – 1.04% | | | | | | | | |
| | | | | | | | | |
| Papa John’s International, Inc. | | | | | | | | |
3.875%, 09/15/2029 | | | 1,000,000 | | | | 856,340 | |
| | | | | | | | | |
| Household Durables – 2.83% | | | | | | | | |
| | | | | | | | | |
| KB Home | | | | | | | | |
4.800%, 11/15/2029 | | | 1,000,000 | | | | 861,417 | |
| | | | | | | | | |
| M/I Homes, Inc. | | | | | | | | |
3.950%, 02/15/2030 | | | 750,000 | | | | 602,078 | |
| | | | | | | | | |
| Meritage Homes Corp. | | | | | | | | |
3.875%, 04/15/2029 | | | 1,000,000 | | | | 851,095 | |
| | | | | | | | | |
| IT Services – 2.26% | | | | | | | | |
| | | | | | | | | |
| Gartner, Inc. | | | | | | | | |
3.625%, 06/15/2029 | | | 1,000,000 | | | | 861,335 | |
| | | | | | | | | |
| Global Payments, Inc. | | | | | | | | |
5.300%, 08/15/2029 | | | 1,000,000 | | | | 992,091 | |
| | | | | | | | | |
| Machinery – 1.24% | | | | | | | | |
| | | | | | | | | |
| Allison Transmission, Inc. | | | | | | | | |
3.750%, 01/30/2031 | | | 1,250,000 | | | | 1,012,906 | |
Percentages are stated as a percent of net assets.The accompanying notes are an integral part of these financial statements.
PERFORMANCE TRUST MUTUAL FUNDS (PTIAX, PTAOX, PTCOX, PTIMX, PTRMX, PTCRX)
PERFORMANCE TRUST CREDIT FUND — SCHEDULE OF INVESTMENTS (CONT.)
August 31, 2022
| | PRINCIPAL | | | |
| | AMOUNT | | VALUE | |
| | | | | |
| Media – 1.52% | | | | |
| | | | | |
| CCO Holdings Capital Corp. | | | | |
| 4.750%, 02/01/2032 | $ | 1,500,000 | | $ | 1,243,455 | |
| | | | | | | |
| Professional Services – 2.20% | | | | | | |
| | | | | | | |
| Booz Allen Hamilton, Inc. | | | | | | |
| 3.875%, 09/01/2028 | | 1,250,000 | | | 1,113,938 | |
| | | | | | | |
| Science Applications | | | | | | |
| International Corp. | | | | | | |
| 4.875%, 04/01/2028 | | 750,000 | | | 692,688 | |
| | | | | | | |
| Road & Rail – 1.39% | | | | | | |
| | | | | | | |
| ERAC USA Finance, LLC | | | | | | |
| 7.000%, 10/15/2037 | | 1,000,000 | | | 1,136,574 | |
| | | | | | | |
| Software – 1.70% | | | | | | |
| | | | | | | |
| Open Text Holdings, Inc. | | | | | | |
| 4.125%, 12/01/2031 | | 750,000 | | | 591,251 | |
| | | | | | | |
| Oracle Corp. | | | | | | |
| 3.850%, 07/15/2036 | | 1,000,000 | | | 802,746 | |
| | | | | | | |
| Specialty Retail – 2.20% | | | | | | |
| | | | | | | |
| Asbury Automotive Group, Inc. | | | | | | |
| 5.000%, 02/15/2032 | | 600,000 | | | 500,094 | |
| | | | | | | |
| Group 1 Automotive, Inc. | | | | | | |
| 4.000%, 08/15/2028 | | 500,000 | | | 426,378 | |
| | | | | | | |
| Lithia Motors, Inc. | | | | | | |
| 4.375%, 01/15/2031 | | 1,000,000 | | | 881,385 | |
| | | | | | | |
| Telecommunication Services – 1.05% | | | | | | |
| | | | | | | |
| T-Mobile USA, Inc. | | | | | | |
| 2.625%, 02/15/2029 | | 1,000,000 | | | 863,704 | |
| | | | | | | |
| TOTAL CORPORATE BONDS | | | | | | |
| (Cost $30,658,620) | | | | | 28,282,996 | |
| | | | | | | |
| NON-AGENCY RESIDENTIAL | | | | | | |
| MORTGAGE BACKED | | | | | | |
| SECURITIES – 4.98% | | | | | | |
| | | | | | | |
| Alternative Loan Trust | | | | | | |
2006-J5, 6.500%, 09/25/2036 | | 249,842 | | | 155,784 | |
2006-31CB, 6.000%, 11/25/2036 | | 217,240 | | | 142,029 | |
| | | | | | | |
| CHL Mortgage Pass-Through Trust | | | | | | |
2006-17, 6.000% (1 Month LIBOR | | | | | | |
| USD + 0.550%), 12/25/2036 (b) | | 362,208 | | | 178,245 | |
2007-HY5, 3.902%, 09/25/2037 (e) | | 233,474 | | | 215,564 | |
| | | | | | | |
| Citicorp Mortgage Securities Trust | | | | | | |
2006-3, 6.000%, 06/25/2036 | | 241,928 | | | 219,884 | |
| | | | | | | |
| Credit Suisse First Boston | | | | | | |
| Mortgage Securities Corp. | | | | | | |
2005-11, 5.500%, 12/25/2035 | | 355,650 | | | 187,665 | |
| | | | | | | |
| | | | | | | |
| First Horizon Alternative | | | | | | |
| Mortgage Securities Trust | | | | | | |
2005-FA11, 5.750%, 02/25/2036 |
| 249,295 | |
| 135,299 | |
| | | | | | | |
| Freddie Mac STACR REMIC Trust | | | | | | |
2021-DNA5, 5.233% (SOFR30A + | | | | | | |
3.050%), 01/25/2034 (a)(b) | | 1,000,000 | | | 925,511 | |
| | | | | | | |
| Volt, LLC | | | | | | |
2021-NPL4, 4.949%, 03/27/2051 (a)(f) | | 350,000 | | | 314,612 | |
| | | | | | | |
| WaMu Mortgage Pass-Through | | | | | | |
| Certificates Series Trust | | | | | | |
2006-AR12, 3.055%, 10/25/2036 (e) | | 1,715,351 | | | 1,606,746 | |
| | | | | | | |
| TOTAL NON-AGENCY RESIDENTIAL | | | | | | |
| MORTGAGE BACKED SECURITIES | | | | | | |
| (Cost $4,509,633) | | | | | 4,081,339 | |
| | | | | | | |
| NON-AGENCY COMMERCIAL | | | | | | |
| MORTGAGE BACKED | | | | | | |
| SECURITIES – 17.35% | | | | | | |
| | | | | | | |
| 225 Liberty Street Trust | | | | | | |
| | 2016-225L, 4.803%, | | | | | | |
02/10/2036 (a)(e) | | 500,000 | | | 441,749 | |
| | | | | | | |
| BANK | | | | | | |
2020-BNK29, 2.500%, | | | | | | |
| 11/15/2053 (a) | | 850,000 | | | 590,151 | |
2022-BNK40, 2.500%, | | | | | | |
| 03/15/2064 (a) | | 500,000 | | | 332,471 | |
| 2021-BNK35, 2.902%, | | | | | | |
06/15/2 064 (e) | | 1,000,000 | | | 781,712 | |
| | | | | | | |
| BBCMS Mortgage Trust | | | | | | |
| | 2021-C11, 1.083%, | | | | | | |
| 09/15/2054 (e)(g) | | 4,500,000 | | | 312,366 | |
| | 2021-C12, 2.500%, | | | | | | |
| 11/15/2054 (a) | | 750,000 | | | 494,543 | |
| | 2022-C17, 1.152%, | | | | | | |
| 09/15/2055 (e)(g) | | 15,000,000 | | | 1,298,304 | |
| | | | | | | |
| Benchmark Mortgage Trust | | | | | | |
| | 2021-B23, 1.380%, | | | | | | |
| 02/15/2054 (e)(g) | | 14,917,431 | | | 1,083,529 | |
| | 2021-B26, 1.481%, | | | | | | |
| 06/15/2054 (a)(e)(g) | | 2,300,000 | | | 212,029 | |
| | 2021-B27, 1.385%, | | | | | | |
| 07/15/2054 (e)(g) | | 3,237,012 | | | 247,553 | |
| | 2021-B29, 1.417%, | | | | | | |
| 09/15/2054 (a)(e)(g) | | 3,000,000 | | | 262,098 | |
| | 2021-B30, 1.410%, | | | | | | |
| 11/15/2054 (a)(e)(g) | | 4,600,000 | | | 404,517 | |
| | | | | | | |
| BMO Mortgage Trust | | | | | | |
| | 2022-C1, 1.892%, | | | | | | |
| 02/15/2055 (a)(e)(g) | | 5,000,000 | | | 618,347 | |
Percentages are stated as a percent of net assets.The accompanying notes are an integral part of these financial statements.
PERFORMANCE TRUST MUTUAL FUNDS (PTIAX, PTAOX, PTCOX, PTIMX, PTRMX, PTCRX)
PERFORMANCE TRUST CREDIT FUND — SCHEDULE OF INVESTMENTS (CONT.)
August 31, 2022
| | PRINCIPAL | | | |
| | AMOUNT | | VALUE | |
| | | | | |
| Citigroup Commercial | | | | |
| Mortgage Trust | | | | |
| | 2016-C1, 5.107%, | | | | |
| 05/10/2049 (e) | $ | 690,000 | | $ | 652,347 | |
| | | | | | | |
| Freddie Mac Multifamily | | | | | | |
| Structured Credit Risk | | | | | | |
2021-MN3, 6.183% (SOFR30A + | | | | | | |
| 4.000%), 11/25/2051 (a)(b) | | 1,000,000 | | | 898,553 | |
| | | | | | | |
| GS Mortgage Securities Corp. II | | | | | | |
2012-BWTR, 3.255%, | | | | | | |
| 11/05/2034 (a)(h) | | 478,000 | | | 439,296 | |
| | | | | | | |
| GS Mortgage Securities Trust | | | | | | |
2019-GC42, 2.800%, | | | | | | |
| 09/01/2052 (a) | | 450,000 | | | 326,693 | |
| | | | | | | |
| Morgan Stanley Bank of | | | | | | |
| America Merrill Lynch Trust | | | | | | |
| | 2017-C34, 2.700%, | | | | | | |
| 11/15/2052 (a) | | 1,000,000 | | | 727,959 | |
| | | | | | | |
| Morgan Stanley Capital I Trust | | | | | | |
| | 2017-H1, 4.281%, | | | | | | |
| 06/15/2050 (e) | | 1,000,000 | | | 922,816 | |
| | 2019-H7, 3.000%, | | | | | | |
| 07/15/2052 (a) | | 1,000,000 | | | 765,070 | |
| | | | | | | |
| Wells Fargo Commercial | | | | | | |
| Mortgage Trust | | | | | | |
| | 2015-C28, 4.219%, | | | | | | |
| 05/15/2048 (e) | | 1,000,000 | | | 884,897 | |
| | 2016-C37, 3.338%, | | | | | | |
| 12/15/2049 (a)(e) | | 1,000,000 | | | 799,346 | |
| | 2019-C52, 1.256%, | | | | | | |
| 08/15/2052 (e)(g) | | 7,000,000 | | | 432,616 | |
| | 2021-C59, 1.582%, | | | | | | |
| 04/15/2054 (a)(e)(g) | | 3,250,000 | | | 304,166 | |
| | | | | | | |
| TOTAL NON-AGENCY COMMERCIAL | | | | | | |
| MORTGAGE BACKED SECURITIES | | | | | | |
| (Cost $15,543,778) | | | | | 14,233,128 | |
| | | | | | | | |
| AGENCY COMMERCIAL MORTGAGE | | | | | | |
| BACKED SECURITIES – 5.38% | | | | | | |
| | | | | | | |
| Freddie Mac Multifamily Structured | | | | | | |
| Pass Through Certificates | | | | | | |
| | K072, 0.493%, | | | | | | |
| 12/25/2027 (e)(g) |
| 72,456,592 | | $ | 1,210,859 | |
| | K098, 1.517%, | | | | | | |
| 08/25/2029 (e)(g) | | 6,000,000 | | | 487,715 | |
| | K118, 1.053%, | | | | | | |
| 09/25/2030 (e)(g) | | 17,934,129 | | | 1,083,203 | |
| | K130, 1.144%, | | | | | | |
| 06/25/2031 (e)(g) | | 14,987,573 | | | 1,070,320 | |
| | K141, 0.407%, | | | | | | |
| 02/25/2032 (e)(g) | | 22,199,023 | | | 557,846 | |
| | | | | | | |
| TOTAL AGENCY COMMERCIAL | | | | | | |
| MORTGAGE BACKED SECURITIES | | | | | | |
| (Cost $4,551,963) | | | | | 4,409,943 | |
| | | | | | | | |
| MUNICIPAL BONDS – 8.22% | | | | | | |
| | | | | | | |
| California – 3.04% | | | | | | |
| | | | | | | |
| City of Los Angeles | | | | | | |
| Department of Airports | | | | | | |
| 6.582%, 05/15/2039 | | 490,000 | | | 555,184 | |
| | | | | | | |
| City of Santa Ana, CA | | | | | | |
| 1.869%, 08/01/2029 | | 500,000 | | | 417,200 | |
| | | | | | | |
| East Side Union | | | | | | |
| High School District | | | | | | |
| 5.320%, 04/01/2036 | | 230,000 | | | 222,792 | |
| | | | | | | |
| Golden State Tobacco | | | | | | |
| Securitization Corp. | | | | | | |
| 3.000%, 06/01/2046 | | 685,000 | | | 601,132 | |
| | | | | | | |
| Newport Mesa Unified | | | | | | |
| School District | | | | | | |
| 6.300%, 08/01/2042 | | 200,000 | | | 245,441 | |
| | | | | | | |
| Peralta Community College District | | | | | | |
| 0.000%, 08/05/2031 (i) | | 500,000 | | | 447,766 | |
| | | | | | | 2,489,515 | |
| | | | | | | |
| Florida – 0.58% | | | | | | |
| | | | | | | |
| Florida Development Finance Corp. | | | | | | |
| 7.375%, 01/01/2049 (a) | | 500,000 | | | 473,762 | |
| | | | | | | |
| Illinois – 1.08% | | | | | | |
| | | | | | | |
| Metropolitan Pier & | | | | | | |
| Exposition Authority | | | | | | |
| 0.000%, 06/15/2038 (i) | | 1,860,000 | | | 888,995 | |
| | | | | | | |
| New York – 0.76% | | | | | | |
| | | | | | | |
| New York Liberty | | | | | | |
| Development Corp. | | | | | | |
| 2.250%, 02/15/2041 | | 900,000 | | | 626,940 | |
Percentages are stated as a percent of net assets.The accompanying notes are an integral part of these financial statements.
PERFORMANCE TRUST MUTUAL FUNDS (PTIAX, PTAOX, PTCOX, PTIMX, PTRMX, PTCRX)
PERFORMANCE TRUST CREDIT FUND — SCHEDULE OF INVESTMENTS (CONT.)
August 31, 2022
| | | PRINCIPAL | | | | |
| | | AMOUNT | | | VALUE | |
| | | | | | | |
| Pennsylvania – 0.96% | | | | | | |
| | | | | | | |
| Pennsylvania Turnpike Commission | | | | | | |
3.000%, 12/01/2042 | | $ | 1,000,000 | | | $ | 786,957 | |
| | | | | | | | | |
| Puerto Rico – 0.53% | | | | | | | | |
| | | | | | | | | |
| GDB Debt Recovery | | | | | | | | |
| Authority of Puerto Rico | | | | | | | | |
7.500%, 08/20/2040 | | | 485,913 | | | | 434,892 | |
| | | | | | | | | |
| Tennessee – 0.75% | | | | | | | | |
| | | | | | | | | |
| New Memphis Arena | | | | | | | | |
| Public Building Authority | | | | | | | | |
0.000%, 04/01/2043 (i) | | | 1,625,000 | | | | 616,220 | |
| | | | | | | | | |
| Texas – 0.21% | | | | | | | | |
| | | | | | | | | |
| Clifton Higher Education | | | | | | | | |
| Finance Corp. | | | | | | | | |
6.125%, 08/15/2048 | | | 165,000 | | | | 170,947 | |
| | | | | | | | | |
| Wisconsin – 0.31% | | | | | | | | |
| | | | | | | | | |
| Public Finance Authority | | | | | | | | |
7.500%, 06/01/2029 (a) | | | 250,000 | | | | 251,808 | |
| TOTAL MUNICIPAL BONDS | | | | | | | | |
| (Cost $6,911,864) | | | | | | | 6,740,036 | |
| | | | | | | | | |
| US GOVERNMENT | | | | | | | | |
| NOTES/BONDS – 5.40% | | | | | | | | |
| | | | | | | | | |
| United States Treasury Notes/Bonds | | | | | | | | |
2.500%, 05/31/2024 | | | 1,750,000 | | | | 1,721,904 | |
1.750%, 08/15/2041 | | | 500,000 | | | | 373,398 | |
2.375%, 02/15/2042 | | | 500,000 | | | | 416,484 | |
3.250%, 05/15/2042 | | | 2,000,000 | | | | 1,920,939 | |
| | | | | | | | | |
| TOTAL US GOVERNMENT | | | | | | | | |
| NOTES/BONDS | | | | | | | | |
| (Cost $4,651,022) | | | | | | | 4,432,725 | |
| | | | | | | | | |
| | | | | | | | | |
| SHORT-TERM INVESTMENTS – 3.56% | | | | | | | | |
First American Government | | | | | | | | |
Obligations Fund – | | | | | | | | |
Class X, 2.039% (j) | | | 2,920,001 | | | $ | 2,920,001 | |
| TOTAL SHORT-TERM | | | | | | | | |
| INVESTMENTS | | | | | | | | |
| (Cost $2,920,001) | | | | | | | 2,920,001 | |
| | | | | | | | | |
| Total Investments | | | | | | | | |
| (Cost $87,678,933) – 100.75% | | | | | | | 82,632,015 | |
| | | | | | | | | |
| | | | | | | | | |
| Liabilities in Excess | | | | | | | | |
| of Other Assets – (0.75)% | | | | | | | (616,934 | ) |
| | | | | | | | | |
| TOTAL NET ASSETS – 100.00% | | | | | | $ | 82,015,081 | |
Percentages are stated as a percent of net assets.| (a) | Securities issued pursuant to Rule 144A under the Securities Act of 1933. |
| (b) | Variable rate security; the rate shown represents the rate at August 31, 2022. |
| (c) | Foreign issued security. |
| (d) | Perpetual maturity. The date referenced is the next call date. |
| (e) | Variable rate security; the rate shown represents the rate at August 31, 2022. The coupon is based on an underlying pool of loans. |
| (f) | Step-up bond; the rate shown represents the rate at August 31, 2022. |
| (g) | Represents an interest-only security that entitles holders to receive only interest payments on underlying mortgages. |
| (h) | Represents an illiquid security. The total market value of these securities was $439,296, representing 0.54% of net assets as of August 31, 2022. |
| (i) | Represents a principal-only security that entitles holders to receive only principal payments on underlying mortgages. |
| (j) | Seven day yield at August 31, 2022. |
| Abbreviations: | |
| PLC | Public Limited Company. |
| CMT | Constant Maturity Treasury Rate |
| LIBOR | London Interbank Offered Rate |
| SOFR | Secured Overnight Financing Rate |
The Schedule of Investments incorporates the Global Industry Classification Standard (GICS®). GICS was developed by and/or is the exclusive property of MSCI, Inc. and Standard & Poor’s Financial Services LLC (“S&P”). GICS is a service mark of MSCI and S&P and has been licensed for use by U.S. Bancorp Fund Services, LLC.
The accompanying notes are an integral part of these financial statements.
PERFORMANCE TRUST MUTUAL FUNDS (PTIAX, PTAOX, PTCOX, PTIMX, PTRMX, PTCRX)
STATEMENTS OF OPERATIONS
For the Year Ended August 31, 2022
| | | Performance Trust | | | Performance Trust | | | | |
| | | Strategic | | | Municipal | | | Performance Trust | |
| | | Bond Fund | | | Bond Fund | | | Credit Fund | |
| Investment Income | | | | | | | | | |
Interest income | | $ | 257,214,595 | | | $ | 21,336,144 | | | $ | 2,083,940 | |
Dividend income | | | 4,147 | | | | — | | | | — | |
| Total Investment Income | | | 257,218,742 | | | | 21,336,144 | | | | 2,083,940 | |
| | | | | | | | | | | | | |
| Expenses | | | | | | | | | | | | |
Advisory fees | | | 37,731,112 | | | | 3,408,100 | | | | 322,295 | |
Transfer agent fees and expenses | | | 6,242,651 | | | | 108,638 | | | | 13,993 | |
Administration and accounting fees | | | 2,196,061 | | | | 326,023 | | | | 23,277 | |
Reports to shareholders | | | 428,564 | | | | 51,062 | | | | 920 | |
Distribution fees – Class C | | | 411,554 | | | | — | | | | — | |
Custody fees | | | 277,473 | | | | 36,334 | | | | 6,223 | |
Federal and state registration fees | | | 203,936 | | | | 69,504 | | | | 43,925 | |
Service fees – Class C | | | 137,185 | | | | — | | | | — | |
Distribution fees – Class A | | | 84,010 | | | | 132,436 | | | | — | |
Audit and tax fees | | | 40,503 | | | | 21,004 | | | | 20,495 | |
Insurance expense | | | 38,088 | | | | 7,417 | | | | 2,583 | |
Legal fees | | | 26,302 | | | | 15,522 | | | | 13,941 | |
Trustees’ fees | | | 17,744 | | | | 17,744 | | | | 17,745 | |
Chief Compliance Officer fees | | | 11,665 | | | | 11,665 | | | | 11,670 | |
Other expenses | | | 39,474 | | | | 7,832 | | | | 3,436 | |
| Total Expenses | | | 47,886,322 | | | | 4,213,281 | | | | 480,503 | |
Expense Reimbursement by Adviser | | | — | | | | — | | | | (81,663 | ) |
| Net Expenses | | | 47,886,322 | | | | 4,213,281 | | | | 398,840 | |
| | | | | | | | | | | | | |
| Net Investment Income | | | 209,332,420 | | | | 17,122,863 | | | | 1,685,100 | |
| | | | | | | | | | | | | |
| Realized and Unrealized Loss on Investments | | | | | | | | | | | | |
Net realized loss from: | | | | | | | | | | | | |
Investments | | | (132,925,876 | ) | | | (50,813,393 | ) | | | (418,213 | ) |
Change in net unrealized | | | | | | | | | | | | |
appreciation/(depreciation) from investments | | | (826,306,858 | ) | | | (69,361,094 | ) | | | (5,054,533 | ) |
| Net Realized and Unrealized Loss on Investments | | | (959,232,734 | ) | | | (120,174,487 | ) | | | (5,472,746 | ) |
| | | | | | | | | | | | | |
| Net Decrease in Net Assets from Operations | | $ | (749,900,314 | ) | | $ | (103,051,624 | ) | | $ | (3,787,646 | ) |
The accompanying notes are an integral part of these financial statements.
PERFORMANCE TRUST MUTUAL FUNDS (PTIAX, PTAOX, PTCOX, PTIMX, PTRMX, PTCRX)
STATEMENTS OF CHANGES IN NET ASSETS
Performance Trust Strategic Bond Fund
| | | Year Ended | | | Year Ended | |
| | | August 31, 2022 | | | August 31, 2021 | |
| From Operations | | | | | | |
Net investment income | | $ | 209,332,420 | | | $ | 178,890,831 | |
Net realized gain (loss) from investments | | | (132,925,876 | ) | | | 25,835,812 | |
Change in net unrealized appreciation/(depreciation) from investments | | | (826,306,858 | ) | | | 29,142,563 | |
| Net increase (decrease) in net assets from operations | | | (749,900,314 | ) | | | 233,869,206 | |
| | | | | | | | | |
| From Distributions | | | | | | | | |
Net Distributions | | | | | | | | |
Institutional Class | | | (222,486,617 | ) | | | (185,602,038 | ) |
Class A | | | (1,124,676 | ) | | | (952,554 | ) |
Class C | | | (1,457,632 | ) | | | (1,139,603 | ) |
| Net decrease in net assets resulting from distributions paid | | | (225,068,925 | ) | | | (187,694,195 | ) |
| | | | | | | | | |
| From Capital Share Transactions | | | | | | | | |
Proceeds from shares sold | | | | | | | | |
Institutional Class | | | 2,660,072,549 | | | | 3,055,779,908 | |
Class A | | | 20,808,513 | | | | 24,607,234 | |
Class C | | | 12,717,654 | | | | 32,976,293 | |
Shares issued in reinvestment of distributions declared | | | | | | | | |
Institutional Class | | | 197,355,016 | | | | 162,114,245 | |
Class A | | | 1,117,606 | | | | 949,912 | |
Class C | | | 1,455,550 | | | | 1,137,047 | |
Cost for shares redeemed | | | | | | | | |
Institutional Class | | | (2,757,178,671 | ) | | | (1,200,615,875 | ) |
Class A | | | (16,977,659 | ) | | | (12,222,134 | ) |
Class C | | | (15,319,692 | ) | | | (9,003,791 | ) |
| Net increase in net assets from capital share transactions | | | 104,050,866 | | | | 2,055,722,839 | |
| | | | | | | | | |
| Total Increase (Decrease) in Net Assets | | | (870,918,373 | ) | | | 2,101,897,850 | |
| | | | | | | | | |
| Net Assets | | | | | | | | |
Beginning of year | | | 6,417,224,397 | | | | 4,315,326,547 | |
| End of year | | $ | 5,546,306,024 | | | $ | 6,417,224,397 | |
The accompanying notes are an integral part of these financial statements.
PERFORMANCE TRUST MUTUAL FUNDS (PTIAX, PTAOX, PTCOX, PTIMX, PTRMX, PTCRX)
STATEMENTS OF CHANGES IN NET ASSETS
Performance Trust Municipal Bond Fund
| | | Year Ended | | | Year Ended | |
| | | August 31, 2022 | | | August 31, 2021 | |
| From Operations | | | | | | |
Net investment income | | $ | 17,122,863 | | | $ | 13,558,043 | |
Net realized gain (loss) from investments | | | (50,813,393 | ) | | | 2,284,058 | |
Change in net unrealized appreciation/(depreciation) from investments | | | (69,361,094 | ) | | | 13,396,446 | |
| Net increase (decrease) in net assets from operations | | | (103,051,624 | ) | | | 29,238,547 | |
| | | | | | | | | |
| From Distributions | | | | | | | | |
Net Distributions | | | | | | | | |
Institutional Class | | | (15,488,839 | ) | | | (15,224,038 | ) |
Class A | | | (891,864 | ) | | | (1,101,862 | ) |
Return of capital | | | | | | | | |
Institutional Class | | | — | | | | (2,045,478 | ) |
Class A | | | — | | | | (146,419 | ) |
| Net decrease in net assets resulting from distributions paid | | | (16,380,703 | ) | | | (18,517,797 | ) |
| | | | | | | | | |
| From Capital Share Transactions | | | | | | | | |
Proceeds from shares sold | | | | | | | | |
Institutional Class | | | 418,242,304 | | | | 412,357,191 | |
Class A | | | 28,238,385 | | | | 31,022,237 | |
Shares issued in reinvestment of distributions declared | | | | | | | | |
Institutional Class | | | 13,947,716 | | | | 15,363,740 | |
Class A | | | 836,833 | | | | 1,152,135 | |
Cost for shares redeemed | | | | | | | | |
Institutional Class | | | (468,786,042 | ) | | | (118,952,857 | ) |
Class A | | | (31,852,481 | ) | | | (19,646,947 | ) |
| Net increase (decrease) in net assets | | | | | | | | |
| from capital share transactions | | | (39,373,285 | ) | | | 321,295,499 | |
| | | | | | | | | |
| Total Increase (Decrease) in Net Assets | | | (158,805,612 | ) | | | 332,016,249 | |
| | | | | | | | | |
| Net Assets | | | | | | | | |
Beginning of year | | | 874,743,372 | | | | 542,727,123 | |
| End of year | | $ | 715,937,760 | | | $ | 874,743,372 | |
The accompanying notes are an integral part of these financial statements.
PERFORMANCE TRUST MUTUAL FUNDS (PTIAX, PTAOX, PTCOX, PTIMX, PTRMX, PTCRX)
STATEMENTS OF CHANGES IN NET ASSETS
Performance Trust Credit Fund
| | | Year Ended | | | Period Ended | |
| | | August 31, 2022 | | | August 31, 2021(1) | |
| From Operations | | | | | | |
Net investment income | | $ | 1,685,100 | | | $ | 403,221 | |
Net realized gain (loss) from investments | | | (418,213 | ) | | | 50,384 | |
Change in net unrealized appreciation/(depreciation) from investments | | | (5,054,533 | ) | | | 7,615 | |
| Net increase (decrease) in net assets from operations | | | (3,787,646 | ) | | | 461,220 | |
| | | | | | | | | |
| From Distributions | | | | | | | | |
Net distributions – Institutional Class | | | (1,579,174 | ) | | | (360,597 | ) |
| Net decrease in net assets resulting from distributions paid | | | (1,579,174 | ) | | | (360,597 | ) |
| | | | | | | | | |
| From Capital Share Transactions | | | | | | | | |
Proceeds from shares sold – Institutional Class | | | 87,543,695 | | | | 12,771,622 | |
Shares issued in reinvestment of distributions declared – | | | | | | | | |
Institutional Class | | | 1,567,536 | | | | 355,596 | |
Cost for shares redeemed – Institutional Class | | | (14,754,428 | ) | | | (202,743 | ) |
| Net increase in net assets from capital share transactions | | | 74,356,803 | | | | 12,924,475 | |
| | | | | | | | | |
| Total Increase in Net Assets | | | 68,989,983 | | | | 13,025,098 | |
| | | | | | | | | |
| Net Assets | | | | | | | | |
Beginning of year/period | | | 13,025,098 | | | | — | |
| End of year/period | | $ | 82,015,081 | | | $ | 13,025,098 | |
| (1) | The inception date for the Fund was December 31, 2020 and investment operations commenced January 4, 2021. |
The accompanying notes are an integral part of these financial statements.
PERFORMANCE TRUST MUTUAL FUNDS (PTIAX, PTAOX, PTCOX, PTIMX, PTRMX, PTCRX)
PERFORMANCE TRUST STRATEGIC BOND FUND — FINANCIAL HIGHLIGHTS
Per Share Data for a Share Outstanding Throughout Each Year
| | | Year | | | Year | | | Year | | | Year | | | Year | |
| | | Ended | | | Ended | | | Ended | | | Ended | | | Ended | |
| | | August 31, | | | August 31, | | | August 31, | | | August 31, | | | August 31, | |
| | | 2022 | | | 2021 | | | 2020 | | | 2019 | | | 2018 | |
| Institutional Class Shares | | | | | | | | | | | | | | | |
| | | | | | | | | | | | | | | | |
| Net Asset Value, Beginning of Year | | $ | 23.17 | | | $ | 22.99 | | | $ | 23.22 | | | $ | 22.21 | | | $ | 22.84 | |
| | | | | | | | | | | | | | | | | | | | | |
| Income (loss) from investment operations: | | | | | | | | | | | | | | | | | | | | |
Net investment income(1) | | | 0.72 | | | | 0.78 | | | | 0.82 | | | | 0.83 | | | | 0.94 | |
Net realized and unrealized | | | | | | | | | | | | | | | | | | | | |
gain (loss) on investments(2) | | | (3.22 | ) | | | 0.23 | | | | (0.18 | ) | | | 1.07 | | | | (0.50 | ) |
| Total from investment operations | | | (2.50 | ) | | | 1.01 | | | | 0.64 | | | | 1.90 | | | | 0.44 | |
| | | | | | | | | | | | | | | | | | | | | |
| Less distributions paid: | | | | | | | | | | | | | | | | | | | | |
From net investment income | | | (0.70 | ) | | | (0.83 | ) | | | (0.87 | ) | | | (0.89 | ) | | | (1.07 | ) |
From net realized gain on investments | | | (0.08 | ) | | | — | | | | — | | | | — | | | | — | |
| Total distributions paid | | | (0.78 | ) | | | (0.83 | ) | | | (0.87 | ) | | | (0.89 | ) | | | (1.07 | ) |
| | | | | | | | | | | | | | | | | | | | | |
Paid-in capital from | | | | | | | | | | | | | | | | | | | | |
redemption fees (Note 2) | | | — | | | | — | | | | 0.00 | (3) | | | 0.00 | (3) | | | 0.00 | (3) |
| | | | | | | | | | | | | | | | | | | | | |
| Net Asset Value, End of Year | | $ | 19.89 | | | $ | 23.17 | | | $ | 22.99 | | | $ | 23.22 | | | $ | 22.21 | |
| | | | | | | | | | | | | | | | | | | | | |
| Total Return | | | -11.00 | % | | | 4.49 | % | | | 2.87 | % | | | 8.79 | % | | | 2.00 | % |
| | | | | | | | | | | | | | | | | | | | | |
| Supplemental Data and Ratios: | | | | | | | | | | | | | | | | | | | | |
Net assets at end of Year (000’s) | | $ | 5,466,750 | | | $ | 6,327,797 | | | $ | 4,264,846 | | | $ | 2,836,855 | | | $ | 1,559,737 | |
| | | | | | | | | | | | | | | | | | | | | |
| Ratio of expenses to average net assets | | | 0.75 | % | | | 0.76 | % | | | 0.78 | % | | | 0.80 | % | | | 0.81 | % |
| | | | | | | | | | | | | | | | | | | | | |
| Ratio of net investment income | | | | | | | | | | | | | | | | | | | | |
| to average net assets | | | 3.34 | % | | | 3.39 | % | | | 3.64 | % | | | 3.68 | % | | | 4.19 | % |
| | | | | | | | | | | | | | | | | | | | | |
Portfolio turnover rate(4) | | | 53.11 | % | | | 30.80 | % | | | 41.75 | % | | | 40.59 | % | | | 37.99 | % |
| (1) | Per share net investment income was calculated using the average shares outstanding method. |
| (2) | Realized gains and losses per share in the caption are balancing amounts necessary to reconcile the change in net asset value per share for the period, and may not reconcile with the aggregate gains and losses in the Statement of Operations due to share transactions for the period. |
| (3) | Rounds to less than $0.005 per share. |
| (4) | Portfolio turnover rates are calculated at the Fund level (not by individual share class). |
The accompanying notes are an integral part of these financial statements
PERFORMANCE TRUST MUTUAL FUNDS (PTIAX, PTAOX, PTCOX, PTIMX, PTRMX, PTCRX)
PERFORMANCE TRUST STRATEGIC BOND FUND — FINANCIAL HIGHLIGHTS
Per Share Data for a Share Outstanding Throughout Each Year/Period
| | | Year | | | Year | | | Year | | | Period | |
| | | Ended | | | Ended | | | Ended | | | Ended | |
| | | August 31, | | | August 31, | | | August 31, | | | August 31, | |
| | | 2022 | | | 2021 | | | 2020 | | | 2019(1) | |
| Class A Shares | | | | | | | | | | | | |
| | | | | | | | | | | | | |
| Net Asset Value, Beginning of Year/Period | | $ | 23.18 | | | $ | 22.99 | | | $ | 23.23 | | | $ | 22.13 | |
| | | | | | | | | | | | | | | | | |
| Income (loss) from investment operations: | | | | | | | | | | | | | | | | |
Net investment income(2) | | | 0.67 | | | | 0.72 | | | | 0.76 | | | | 0.58 | |
Net realized and unrealized | | | | | | | | | | | | | | | | |
gain (loss) on investments(3) | | | (3.23 | ) | | | 0.24 | | | | (0.18 | ) | | | 1.08 | |
| Total from investment operations | | | (2.56 | ) | | | 0.96 | | | | 0.58 | | | | 1.66 | |
| | | | | | | | | | | | | | | | | |
| Less distributions paid: | | | | | | | | | | | | | | | | |
From net investment income | | | (0.65 | ) | | | (0.77 | ) | | | (0.82 | ) | | | (0.57 | ) |
From net realized gain on investments | | | (0.08 | ) | | | — | | | | — | | | | — | |
| Total distributions paid | | | (0.73 | ) | | | (0.77 | ) | | | (0.82 | ) | | | (0.57 | ) |
| | | | | | | | | | | | | | | | | |
Paid-in capital from redemption fees (Note 2) | | | — | | | | — | | | | 0.00 | (4) | | | 0.01 | |
| | | | | | | | | | | | | | | | | |
| Net Asset Value, End of Year/Period | | $ | 19.89 | | | $ | 23.18 | | | $ | 22.99 | | | $ | 23.23 | |
| | | | | | | | | | | | | | | | | |
Total Return(5)(6) | | | -11.26 | % | | | 4.28 | % | | | 2.60 | % | | | 7.67 | % |
| | | | | | | | | | | | | | | | | |
| Supplemental Data and Ratios: | | | | | | | | | | | | | | | | |
Net assets at end of Year/Period (000’s) | | $ | 32,476 | | | $ | 32,802 | | | $ | 19,297 | | | $ | 7,549 | |
| | | | | | | | | | | | | | | | | |
Ratio of expenses to average net assets(7) | | | 1.00 | % | | | 1.01 | % | | | 1.03 | % | | | 1.05 | % |
| | | | | | | | | | | | | | | | | |
| Ratio of net investment income | | | | | | | | | | | | | | | | |
to average net assets(7) | | | 3.12 | % | | | 3.12 | % | | | 3.40 | % | | | 3.80 | % |
| | | | | | | | | | | | | | | | | |
Portfolio turnover rate(6)(8) | | | 53.11 | % | | | 30.80 | % | | | 41.75 | % | | | 40.59 | % |
| (1) | The Class A shares commenced operations on January 2, 2019. |
| (2) | Per share net investment income was calculated using the average shares outstanding method. |
| (3) | Realized gains and losses per share in the caption are balancing amounts necessary to reconcile the change in net asset value per share for the period, and may not reconcile with the aggregate gains and losses in the Statement of Operations due to share transactions for the period. |
| (4) | Rounds to less than $0.005 per share. |
| (5) | Based on net asset value, which does not reflect sales charge. |
| (6) | Not annualized for periods less than one year. |
| (7) | Annualized for periods less than one year. |
| (8) | Portfolio turnover rates are calculated at the Fund level (not by individual share class). |
The accompanying notes are an integral part of these financial statements.
PERFORMANCE TRUST MUTUAL FUNDS (PTIAX, PTAOX, PTCOX, PTIMX, PTRMX, PTCRX)
PERFORMANCE TRUST STRATEGIC BOND FUND — FINANCIAL HIGHLIGHTS
Per Share Data for a Share Outstanding Throughout Each Year/Period
| | | Year | | | Year | | | Year | | | Period | |
| | | Ended | | | Ended | | | Ended | | | Ended | |
| | | August 31, | | | August 31, | | | August 31, | | | August 31, | |
| | | 2022 | | | 2021 | | | 2020 | | | 2019(1) | |
| Class C Shares | | | | | | | | | | | | |
| | | | | | | | | | | | | |
| Net Asset Value, Beginning of Year/Period | | $ | 23.10 | | | $ | 22.92 | | | $ | 23.18 | | | $ | 22.13 | |
| | | | | | | | | | | | | | | | | |
| Income (loss) from investment operations: | | | | | | | | | | | | | | | | |
Net investment income(2) | | | 0.52 | | | | 0.55 | | | | 0.59 | | | | 0.46 | |
Net realized and unrealized | | | | | | | | | | | | | | | | |
gain (loss) on investments(3) | | | (3.23 | ) | | | 0.24 | | | | (0.18 | ) | | | 1.09 | |
| Total from investment operations | | | (2.71 | ) | | | 0.79 | | | | 0.41 | | | | 1.55 | |
| | | | | | | | | | | | | | | | | |
| Less distributions paid: | | | | | | | | | | | | | | | | |
From net investment income | | | (0.50 | ) | | | (0.61 | ) | | | (0.67 | ) | | | (0.50 | ) |
From net realized gain on investments | | | (0.08 | ) | | | — | | | | — | | | | — | |
| Total distributions paid | | | (0.58 | ) | | | (0.61 | ) | | | (0.67 | ) | | | (0.50 | ) |
| | | | | | | | | | | | | | | | | |
Paid-in capital from redemption fees (Note 2) | | | — | | | | — | | | | 0.00 | (4) | | | 0.00 | (4) |
| | | | | | | | | | | | | | | | | |
| Net Asset Value, End of Year/Period | | $ | 19.81 | | | $ | 23.10 | | | $ | 22.92 | | | $ | 23.18 | |
| | | | | | | | | | | | | | | | | |
Total Return(5) | | | -11.92 | % | | | 3.49 | % | | | 1.83 | % | | | 7.10 | % |
| | | | | | | | | | | | | | | | | |
| Supplemental Data and Ratios: | | | | | | | | | | | | | | | | |
Net assets at end of Year/Period (000’s) | | $ | 47,081 | | | $ | 56,625 | | | $ | 31,184 | | | $ | 7,418 | |
| | | | | | | | | | | | | | | | | |
Ratio of expenses to average net assets(6) | | | 1.75 | % | | | 1.76 | % | | | 1.78 | % | | | 1.80 | % |
| | | | | | | | | | | | | | | | | |
| Ratio of net investment income | | | | | | | | | | | | | | | | |
to average net assets(6) | | | 2.33 | % | | | 2.37 | % | | | 2.66 | % | | | 3.04 | % |
| | | | | | | | | | | | | | | | | |
Portfolio turnover rate(5)(7) | | | 53.11 | % | | | 30.80 | % | | | 41.75 | % | | | 40.59 | % |
| (1) | The Class C shares commenced operations on January 2, 2019. |
| (2) | Per share net investment income was calculated using the average shares outstanding method. |
| (3) | Realized gains and losses per share in the caption are balancing amounts necessary to reconcile the change in net asset value per share for the period, and may not reconcile with the aggregate gains and losses in the Statement of Operations due to share transactions for the period. |
| (4) | Rounds to less than $0.005 per share. |
| (5) | Not annualized for periods less than one year. |
| (6) | Annualized for periods less than one year. |
| (7) | Portfolio turnover rates are calculated at the Fund level (not by individual share class). |
The accompanying notes are an integral part of these financial statements.
PERFORMANCE TRUST MUTUAL FUNDS (PTIAX, PTAOX, PTCOX, PTIMX, PTRMX, PTCRX)
PERFORMANCE TRUST MUNICIPAL BOND FUND — FINANCIAL HIGHLIGHTS
Per Share Data for a Share Outstanding Throughout Each Year
| | | Year | | | Year | | | Year | | | Year | | | Year | |
| | | Ended | | | Ended | | | Ended | | | Ended | | | Ended | |
| | | August 31, | | | August 31, | | | August 31, | | | August 31, | | | August 31, | |
| | | 2022 | | | 2021 | | | 2020 | | | 2019 | | | 2018 | |
| Institutional Class Shares | | | | | | | | | | | | | | | |
| | | | | | | | | | | | | | | | |
| Net Asset Value, Beginning of Year | | $ | 25.94 | | | $ | 25.52 | | | $ | 25.49 | | | $ | 23.79 | | | $ | 24.34 | |
| | | | | | | | | | | | | | | | | | | | | |
| Income (loss) from investment operations: | | | | | | | | | | | | | | | | | | | | |
Net investment income(1) | | | 0.50 | | | | 0.49 | | | | 0.54 | | | | 0.72 | | | | 0.67 | |
Net realized and unrealized | | | | | | | | | | | | | | | | | | | | |
gain (loss) on investments | | | (3.31 | ) | | | 0.61 | | | | 0.22 | | | | 1.69 | | | | (0.55 | ) |
| Total from investment operations | | | (2.81 | ) | | | 1.10 | | | | 0.76 | | | | 2.41 | | | | 0.12 | |
| | | | | | | | | | | | | | | | | | | | | |
| Less distributions paid: | | | | | | | | | | | | | | | | | | | | |
From net investment income | | | (0.48 | ) | | | (0.58 | ) | | | (0.66 | ) | | | (0.71 | ) | | | (0.67 | ) |
From return of capital | | | — | | | | (0.06 | ) | | | — | | | | — | | | | — | |
From net realized gain on investments | | | — | | | | (0.04 | ) | | | (0.07 | ) | | | — | | | | — | |
| Total distributions paid | | | (0.48 | ) | | | (0.68 | ) | | | (0.73 | ) | | | (0.71 | ) | | | (0.67 | ) |
| | | | | | | | | | | | | | | | | | | | | |
Paid-in capital from | | | | | | | | | | | | | | | | | | | | |
redemption fees (Note 2) | | | — | | | | — | | | | 0.00 | (2) | | | 0.00 | (2) | | | 0.00 | (2) |
| | | | | | | | | | | | | | | | | | | | | |
| Net Asset Value, End of Year | | $ | 22.65 | | | $ | 25.94 | | | $ | 25.52 | | | $ | 25.49 | | | $ | 23.79 | |
| | | | | | | | | | | | | | | | | | | | | |
| Total Return | | | -10.96 | % | | | 4.35 | % | | | 3.07 | % | | | 10.31 | % | | | 0.46 | % |
| | | | | | | | | | | | | | | | | | | | | |
| Supplemental Data and Ratios: | | | | | | | | | | | | | | | | | | | | |
Net assets at end of Year (000’s) | | $ | 670,095 | | | $ | 818,825 | | | $ | 500,176 | | | $ | 307,384 | | | $ | 208,325 | |
| | | | | | | | | | | | | | | | | | | | | |
| Ratio of expenses to average net assets: | | | | | | | | | | | | | | | | | | | | |
Before waiver, expense | | | | | | | | | | | | | | | | | | | | |
reimbursements and recoupments | | | 0.48 | % | | | 0.49 | % | | | 0.53 | % | | | 0.57 | % | | | 0.60 | % |
After waiver, expense | | | | | | | | | | | | | | | | | | | | |
reimbursements and recoupments | | | 0.48 | % | | | 0.50 | % | | | 0.55 | % | | | 0.55 | % | | | 0.55 | % |
| | | | | | | | | | | | | | | | | | | | | |
| Ratio of net investment income | | | | | | | | | | | | | | | | | | | | |
| to average net assets: | | | | | | | | | | | | | | | | | | | | |
Before waiver, expense | | | | | | | | | | | | | | | | | | | | |
reimbursements and recoupments | | | 2.02 | % | | | 1.92 | % | | | 2.19 | % | | | 2.94 | % | | | 2.76 | % |
After waiver, expense | | | | | | | | | | | | | | | | | | | | |
reimbursements and recoupments | | | 2.02 | % | | | 1.91 | % | | | 2.17 | % | | | 2.96 | % | | | 2.81 | % |
| | | | | | | | | | | | | | | | | | | | | |
Portfolio turnover rate(3) | | | 81.53 | % | | | 15.91 | % | | | 27.12 | % | | | 35.29 | % | | | 28.49 | % |
| (1) | Per share net investment income was calculated using the average shares outstanding method. |
| (2) | Rounds to less than $0.005 per share. |
| (3) | Portfolio turnover rates are calculated at the Fund level (not by individual share class). |
The accompanying notes are an integral part of these financial statements.
PERFORMANCE TRUST MUTUAL FUNDS (PTIAX, PTAOX, PTCOX, PTIMX, PTRMX, PTCRX)
PERFORMANCE TRUST MUNICIPAL BOND FUND — FINANCIAL HIGHLIGHTS
Per Share Data for a Share Outstanding Throughout Each Year
| | | Year | | | Year | | | Year | | | Year | | | Year | |
| | | Ended | | | Ended | | | Ended | | | Ended | | | Ended | |
| | | August 31, | | | August 31, | | | August 31, | | | August 31, | | | August 31, | |
| | | 2022 | | | 2021 | | | 2020 | | | 2019 | | | 2018 | |
| Class A Shares | | | | | | | | | | | | | | | |
| | | | | | | | | | | | | | | | |
| Net Asset Value, Beginning of Year | | $ | 25.96 | | | $ | 25.54 | | | $ | 25.51 | | | $ | 23.81 | | | $ | 24.36 | |
| | | | | | | | | | | | | | | | | | | | | |
| Income (loss) from investment operations: | | | | | | | | | | | | | | | | | | | | |
Net investment income(1) | | | 0.44 | | | | 0.42 | | | | 0.48 | | | | 0.66 | | | | 0.61 | |
Net realized and unrealized | | | | | | | | | | | | | | | | | | | | |
gain (loss) on investments | | | (3.31 | ) | | | 0.61 | | | | 0.22 | | | | 1.69 | | | | (0.55 | ) |
| Total from investment operations | | | (2.87 | ) | | | 1.03 | | | | 0.70 | | | | 2.35 | | | | 0.06 | |
| | | | | | | | | | | | | | | | | | | | | |
| Less distributions paid: | | | | | | | | | | | | | | | | | | | | |
From net investment income | | | (0.42 | ) | | | (0.50 | ) | | | (0.60 | ) | | | (0.65 | ) | | | (0.61 | ) |
From return of capital | | | — | | | | (0.07 | ) | | | — | | | | — | | | | — | |
From net realized gain on investments | | | — | | | | (0.04 | ) | | | (0.07 | ) | | | — | | | | — | |
| Total distributions paid | | | (0.42 | ) | | | (0.61 | ) | | | (0.67 | ) | | | (0.65 | ) | | | (0.61 | ) |
| | | | | | | | | | | | | | | | | | | | | |
Paid-in capital from | | | | | | | | | | | | | | | | | | | | |
redemption fees (Note 2) | | | — | | | | — | | | | 0.00 | (2) | | | 0.00 | (2) | | | 0.00 | (2) |
| | | | | | | | | | | | | | | | | | | | | |
| Net Asset Value, End of Year | | $ | 22.67 | | | $ | 25.96 | | | $ | 25.54 | | | $ | 25.51 | | | $ | 23.81 | |
| | | | | | | | | | | | | | | | | | | | | |
Total Return(3) | | | -11.17 | % | | | 4.09 | % | | | 2.83 | % | | | 10.02 | % | | | 0.25 | % |
| | | | | | | | | | | | | | | | | | | | | |
| Supplemental Data and Ratios: | | | | | | | | | | | | | | | | | | | | |
Net assets at end of Year (000’s) | | $ | 45,843 | | | $ | 55,918 | | | $ | 42,552 | | | $ | 22,141 | | | $ | 22,807 | |
| | | | | | | | | | | | | | | | | | | | | |
| Ratio of expenses to average net assets: | | | | | | | | | | | | | | | | | | | | |
Before waiver, expense | | | | | | | | | | | | | | | | | | | | |
reimbursements and recoupments | | | 0.73 | % | | | 0.74 | % | | | 0.78 | % | | | 0.82 | % | | | 0.85 | % |
After waiver, expense | | | | | | | | | | | | | | | | | | | | |
reimbursements and recoupments | | | 0.73 | % | | | 0.77 | % | | | 0.80 | % | | | 0.80 | % | | | 0.80 | % |
| | | | | | | | | | | | | | | | | | | | | |
| Ratio of net investment income | | | | | | | | | | | | | | | | | | | | |
| to average net assets: | | | | | | | | | | | | | | | | | | | | |
Before waiver, expense | | | | | | | | | | | | | | | | | | | | |
reimbursements and recoupments | | | 1.78 | % | | | 1.67 | % | | | 1.93 | % | | | 2.69 | % | | | 2.50 | % |
After waiver, expense | | | | | | | | | | | | | | | | | | | | |
reimbursements and recoupments | | | 1.78 | % | | | 1.64 | % | | | 1.91 | % | | | 2.71 | % | | | 2.55 | % |
| | | | | | | | | | | | | | | | | | | | | |
Portfolio turnover rate(4) | | | 81.53 | % | | | 15.91 | % | | | 27.12 | % | | | 35.29 | % | | | 28.49 | % |
| (1) | Per share net investment income was calculated using the average shares outstanding method. |
| (2) | Rounds to less than 0.5 cent per share. |
| (3) | Based on net asset value, which does not reflect sales charge. |
| (4) | Portfolio turnover rates are calculated at the Fund level (not by individual share class). |
The accompanying notes are an integral part of these financial statements.
PERFORMANCE TRUST MUTUAL FUNDS (PTIAX, PTAOX, PTCOX, PTIMX, PTRMX, PTCRX)
PERFORMANCE TRUST CREDIT FUND — FINANCIAL HIGHLIGHTS
Per Share Data for a Share Outstanding Throughout Each Year/Period
| | | Year | | | Period | |
| | | Ended | | | Ended | |
| | | August 31, | | | August 31, | |
| | | 2022 | | | 2021(1) | |
| Institutional Class Shares | | | | | | |
| | | | | | | |
| Net Asset Value, Beginning of Year/Period | | $ | 10.07 | | | $ | 10.00 | |
| | | | | | | | | |
| Income (loss) from investment operations: | | | | | | | | |
Net investment income(2) | | | 0.38 | | | | 0.39 | |
Net realized and unrealized gain (loss) on investments(3) | | | (1.33 | ) | | | 0.01 | |
| Total from investment operations | | | (0.95 | ) | | | 0.40 | |
| | | | | | | | | |
| Less distributions paid: | | | | | | | | |
From net investment income | | | (0.39 | ) | | | (0.33 | ) |
From net realized gain on investments | | | (0.01 | ) | | | — | |
| Total distributions paid | | | (0.40 | ) | | | (0.33 | ) |
| | | | | | | | | |
| Net Asset Value, End of Year/Period | | $ | 8.72 | | | $ | 10.07 | |
| | | | | | | | | |
Total Return(4) | | | -9.66 | % | | | 4.06 | % |
| | | | | | | | | |
| Supplemental Data and Ratios: | | | | | | | | |
Net assets at end of Year/Period (000’s) | | $ | 82,015 | | | $ | 13,025 | |
| | | | | | | | | |
| Ratio of expenses to average net assets: | | | | | | | | |
Before waiver and expense reimbursement(5) | | | 1.19 | % | | | 2.47 | % |
After waiver and expense reimbursement(5) | | | 0.99 | % | | | 0.99 | % |
| | | | | | | | | |
| Ratio of net investment income to average net assets: | | | | | | | | |
Before waiver and expense reimbursement(5) | | | 3.98 | % | | | 4.34 | % |
After waiver and expense reimbursement(5) | | | 4.18 | % | | | 5.82 | % |
| | | | | | | | | |
Portfolio turnover rate(4) | | | 59.74 | % | | | 109.25 | % |
| (1) | The inception date for the Fund was December 31, 2020 and investment operations commenced January 4, 2021. |
| (2) | Per share net investment income was calculated using the average shares outstanding method. |
| (3) | Realized gains and losses per share in the caption are balancing amounts necessary to reconcile the change in net asset value per share for the period, and may not reconcile with the aggregate gains and losses in the Statement of Operations due to share transactions for the period. |
| (4) | Not annualized for periods less than one year. |
| (5) | Annualized for periods less than one year. |
The accompanying notes are an integral part of these financial statements.
PERFORMANCE TRUST MUTUAL FUNDS (PTIAX, PTAOX, PTCOX, PTIMX, PTRMX, PTCRX)
PERFORMANCE TRUST MUTUAL FUNDS – NOTES TO FINANCIAL STATEMENTS
August 31, 2022
| 1. | Organization |
| | |
| | Trust for Professional Managers (the “Trust”) was organized as a Delaware statutory trust under a Declaration of Trust dated May 29, 2001. The Trust is registered under the Investment Company Act of 1940, as amended (the “1940 Act”), as an open-end management investment company. The Performance Trust Mutual Funds (the “Funds”) are comprised of the Performance Trust Strategic Bond Fund (the “Strategic Bond Fund”), the Performance Trust Municipal Bond Fund (the “Municipal Bond Fund”), and the Performance Trust Credit Fund (the “Credit Fund”), each representing a distinct diversified series with its own investment objective and policies within the Trust. The investment objective of the Strategic Bond Fund is to purchase undervalued fixed-income assets and achieve investment returns through interest income and potential capital appreciation. The investment objective of the Municipal Bond Fund is to provide a high level of current interest income that is substantially exempt from regular federal income taxes and is consistent with preservation of capital. The investment objective of the Credit Fund is to achieve long-term investment returns primarily by investing in a portfolio of income producing securities that may have the potential for capital appreciation. The Trust may issue an unlimited number of shares of beneficial interest at $0.001 par value. The assets of the Funds are segregated, and a shareholder’s interest is limited to the Fund in which shares are held. The Institutional Class shares of the Strategic Bond Fund commenced investment operations on September 1, 2010. The Class A and Class C shares of the Strategic Bond Fund commenced investment operations on January 2, 2019. The Municipal Bond Fund commenced investment operations on June 30, 2011 and September 28, 2012 for the Institutional Class and Class A shares, respectively. The Institutional Class shares of the Credit Fund commenced investment operations on January 4, 2021. Effective January 2, 2019, the Retail Class shares of the Municipal Bond Fund were redesignated as Class A shares. Class A shares are subject to an initial maximum sales charge of 2.25% imposed at the time of purchase. The sales charge declines as the amount purchased increases in accordance with the Funds’ current prospectus. Class A shares are subject to a 0.25% Rule 12b-1 distribution and service fee. Class C shares are subject to a 1.00% Rule 12b-1 distribution and service fee. Each class of shares has identical rights and privileges except with respect to distribution fees, and voting rights on matters affecting a single class of shares. Costs incurred by the Funds in connection with the organization and the initial public offering of shares were paid by PT Asset Management, LLC (the “Adviser”), the Funds’ investment adviser. The Funds are investment companies and accordingly follow the investment company accounting and reporting guidance of the Financial Accounting Standards Board (“FASB”) Accounting Standards Codification Topic 946 Financial Services—Investment Companies. |
| | |
| 2. | Significant Accounting Policies |
| | |
| | The following is a summary of significant accounting policies consistently followed by the Funds in the preparation of the financial statements. These policies are in conformity with generally accepted accounting principles in the United States of America (“GAAP”). |
| | |
| a. | Investment Valuation |
| | |
| | Each equity security owned by a Fund that is listed on a securities exchange, except securities listed on the NASDAQ Stock Market, LLC (“NASDAQ”), is valued at its last sale price at the close of that exchange on the date as of which assets are valued. If the security is listed on more than one exchange, a Fund will use the price of the exchange that the Fund generally considers to be the principal exchange on which the security is traded. Portfolio securities listed on NASDAQ will be valued at the NASDAQ Official Closing Price, which may not necessarily represent the last sale price. If there has been no sale on such exchange or on NASDAQ on such day, the security is valued at the mean between the most recent quoted bid and asked prices on such day or the security shall be valued at the latest sales price on the “composite market” for the day such security is being valued. The composite market is defined as a consolidation of the trade information provided by national securities and foreign exchanges and over-the-counter markets as published by an approved independent pricing service (a “Pricing Service”). |
| | |
| | Debt securities, such as U.S. government securities, corporate securities, municipal securities, collateralized loan obligations and asset-backed and mortgage-backed securities, including short-term debt instruments having a maturity of 60 days or less, are valued at the mean in accordance with prices supplied by a Pricing Service. Pricing Services may use various valuation methodologies such as the mean between the bid and the asked prices, matrix pricing and other analytical pricing models as well as market transactions and dealer quotations. If a price is not available from a Pricing Service, the most recent quotation obtained from one or more broker-dealers known to follow the issue will be obtained. Quotations will be valued at the mean between the bid and the offer. In the absence of available quotations, the securities will be priced at fair value. Any discount or premium is accreted or amortized over the expected life of the respective security using the constant yield to maturity method. Pricing Services generally value debt securities assuming orderly transactions of an institutional round lot size, but such securities may be held or transactions may be conducted in such securities in smaller, odd lot sizes. Odd lots often trade at lower prices than institutional round lots. |
| | |
| | Money market funds, demand notes and repurchase agreements are valued at cost. If cost does not represent current market value the securities will be priced at fair value. |
| | |
| | Redeemable securities issued by open-end, registered investment companies are valued at the net asset value (“NAV”) of such companies for purchase and/or redemption orders placed on that day. If, on a particular day, a share of an investment company is not listed on NASDAQ, such security’s fair value will be determined. All exchange-traded funds are valued at the last reported sale price on the exchange on which the security is principally traded. In the event market quotations are not readily available, such security will be valued at its fair value, discussed below. |
| | |
| | If market quotations are not readily available, a security or other asset will be valued at its fair value as determined under fair value pricing procedures approved by the Board of Trustees. These fair value pricing procedures will also be used to price a security when corporate events, events in the securities market and/or world events cause the Adviser to believe that a security’s last sale price may not reflect its actual market value. The intended effect of using fair value pricing procedures is to ensure that the Funds are accurately priced. The Board of Trustees will regularly evaluate whether the Funds’ fair value pricing procedures continue to be appropriate in light of the specific circumstances of the Funds and the quality of prices obtained through the application of such procedures by the Trust’s valuation committee. |
| | |
| | FASB Accounting Standards Codification, Fair Value Measurements and Disclosures Topic 820 (“ASC 820”), establishes an authoritative definition of fair value and sets out a hierarchy for measuring fair value. ASC 820 requires an entity to evaluate certain factors to determine whether there has been a significant decrease in volume and level of activity for the security such that recent transactions and quoted |
PERFORMANCE TRUST MUTUAL FUNDS (PTIAX, PTAOX, PTCOX, PTIMX, PTRMX, PTCRX)
PERFORMANCE TRUST MUTUAL FUNDS – NOTES TO FINANCIAL STATEMENTS (CONT.)
August 31, 2022
| | prices may not be determinative of fair value and further analysis and adjustment may be necessary to estimate fair value. ASC 820 also requires enhanced disclosure regarding the inputs and valuation techniques used to measure fair value as well as expanded disclosure of valuation levels for each class of investments. These inputs are summarized in the three broad levels listed below: |
| | » Level 1: | Quoted prices in active markets for identical securities. |
| | | |
| | » Level 2: | Other significant observable inputs (including quoted prices for similar securities, interest rates, prepayment speeds, credit risk, etc.). |
| | | |
| | » Level 3: | Significant unobservable inputs (including a Fund’s own assumptions in determining the fair value of investments). |
| | The inputs or methodology used for valuing securities are not necessarily an indication of the risk associated with investing in those securities. The following is a summary of the inputs used to value the Funds’ investments carried at fair value as of August 31, 2022: |
| | Performance Trust Strategic Bond Fund | | | | | | | | | | | | |
| | | | Level 1 | | | Level 2 | | | Level 3 | | | Total | |
| | Fixed Income: | | | | | | | | | | | | |
| | Asset Backed | | | | | | | | | | | | |
| | Securities | | $ | — | | | $ | 80,410,125 | | | $ | — | | | $ | 80,410,125 | |
| | Collateralized | | | | | | | | | | | | | | | | |
| | Loan | | | | | | | | | | | | | | | | |
| | Obligations | | | — | | | | 329,180,733 | | | | — | | | | 329,180,733 | |
| | Corporate | | | | | | | | | | | | | | | | |
| | Bonds | | | — | | | | 1,229,516,844 | | | | — | | | | 1,229,516,844 | |
| | Non – Agency | | | | | | | | | | | | | | | | |
| | Residential | | | | | | | | | | | | | | | | |
| | Mortgage | | | | | | | | | | | | | | | | |
| | Backed | | | | | | | | | | | | | | | | |
| | Securities | | | — | | | | 582,620,323 | | | | — | | | | 582,620,323 | |
| | Non – Agency | | | | | | | | | | | | | | | | |
| | Commercial | | | | | | | | | | | | | | | | |
| | Mortgage | | | | | | | | | | | | | | | | |
| | Backed | | | | | | | | | | | | | | | | |
| | Securities | | | — | | | | 1,017,240,876 | | | | — | | | | 1,017,240,876 | |
| | Agency | | | | | | | | | | | | | | | | |
| | Commercial | | | | | | | | | | | | | | | | |
| | Mortgage | | | | | | | | | | | | | | | | |
| | Backed | | | | | | | | | | | | | | | | |
| | Securities | | | — | | | | 446,414,989 | | | | — | | | | 446,414,989 | |
| | Municipal | | | | | | | | | | | | | | | | |
| | Bonds | | | — | | | | 1,537,074,510 | | | | — | | | | 1,537,074,510 | |
| | Government | | | | | | | | | | | | | | | | |
| | Security & | | | | | | | | | | | | | | | | |
| | Agency Issues | | | — | | | | 4,178,707 | | | | — | | | | 4,178,707 | |
| | US | | | | | | | | | | | | | | | | |
| | Government | | | | | | | | | | | | | | | | |
| | Notes/Bonds | | | — | | | | 283,091,797 | | | | — | | | | 283,091,797 | |
| | Total Fixed | | | | | | | | | | | | | | | | |
| | Income: | | | — | | | | 5,509,728,904 | | | | — | | | | 5,509,728,904 | |
| | Equity: | | | | | | | | | | | | | | | | |
| | Short-Term | | | | | | | | | | | | | | | | |
| | Investments | | | 9,772,118 | | | | — | | | | — | | | | 9,772,118 | |
| | Total | | | | | | | | | | | | | | | | |
| | Short-Term | | | | | | | | | | | | | | | | |
| | Investments | | | 9,772,118 | | | | — | | | | — | | | | 9,772,118 | |
| | Total | | | | | | | | | | | | | | | | |
| | Investments | | | | | | | | | | | | | | | | |
| | in Securities | | $ | 9,772,118 | | | $ | 5,509,728,904 | | | $ | — | | | $ | 5,519,501,022 | |
| | | | | | | | | | | | | | | | | | |
| Performance Trust Municipal Bond Fund | | | | | | | | | | | | | | | | |
| | | | Level 1 | | | Level 2 | | | Level 3 | | | Total | |
| | Fixed Income: | | | | | | | | | | | | | | | | |
| | Agency | | | | | | | | | | | | | | | | |
| | Commercial | | | | | | | | | | | | | | | | |
| | Mortgage | | | | | | | | | | | | | | | | |
| | Backed | | | | | | | | | | | | | | | | |
| | Securities | | $ | — | | | $ | 18,507,057 | | | $ | — | | | $ | 18,507,057 | |
| | Non-Agency | | | | | | | | | | | | | | | | |
| | Commercial | | | | | | | | | | | | | | | | |
| | Mortgage | | | | | | | | | | | | | | | | |
| | Backed | | | | | | | | | | | | | | | | |
| | Securities | | | — | | | | 9,298,750 | | | | — | | | | 9,298,750 | |
| | Municipal | | | | | | | | | | | | | | | | |
| | Bonds | | | — | | | | 690,998,815 | | | | — | | | | 690,998,815 | |
| | Total Fixed | | | | | | | | | | | | | | | | |
| | Income: | | | — | | | | 718,804,622 | | | | — | | | | 718,804,622 | |
| | Short-Term | | | | | | | | | | | | | | | | |
| | Investments | | | 31,741,058 | | | | — | | | | — | | | | 31,741,058 | |
| | Total | | | | | | | | | | | | | | | | |
| | Short-Term | | | | | | | | | | | | | | | | |
| | Investments | | | 31,741,058 | | | | — | | | | — | | | | 31,741,058 | |
| | Total | | | | | | | | | | | | | | | | |
| | Investments | | | | | | | | | | | | | | | | |
| | in Securities | | $ | 31,741,058 | | | $ | 718,804,622 | | | $ | — | | | $ | 750,545,680 | |
| | | | | | | | | | | | | | | | | |
| Performance Trust Credit Fund | | | | | | | | | | | | | | | | |
| | | | Level 1 | | | Level 2 | | | Level 3 | | | Total | |
| | Fixed Income: | | | | | | | | | | | | | | | | |
| | Asset Backed | | | | | | | | | | | | | | | | |
| | Securities | | $ | — | | | $ | 6,030,358 | | | $ | — | | | $ | 6,030,358 | |
| | Collateralized | | | | | | | | | | | | | | | | |
| | Loan | | | | | | | | | | | | | | | | |
| | Obligations | | | — | | | | 11,501,489 | | | | — | | | | 11,501,489 | |
| | Corporate | | | | | | | | | | | | | | | | |
| | Bonds | | | — | | | | 28,282,996 | | | | — | | | | 28,282,996 | |
| | Non – Agency | | | | | | | | | | | | | | | | |
| | Residential | | | | | | | | | | | | | | | | |
| | Mortgage | | | | | | | | | | | | | | | | |
| | Backed | | | | | | | | | | | | | | | | |
| | Securities | | | — | | | | 4,081,339 | | | | — | | | | 4,081,339 | |
| | Non – Agency | | | | | | | | | | | | | | | | |
| | Commercial | | | | | | | | | | | | | | | | |
| | Mortgage | | | | | | | | | | | | | | | | |
| | Backed | | | | | | | | | | | | | | | | |
| | Securities | | | — | | | | 14,233,128 | | | | — | | | | 14,233,128 | |
| | Agency | | | | | | | | | | | | | | | | |
| | Commercial | | | | | | | | | | | | | | | | |
| | Mortgage | | | | | | | | | | | | | | | | |
| | Backed | | | | | | | | | | | | | | | | |
| | Securities | | | — | | | | 4,409,943 | | | | — | | | | 4,409,943 | |
| | Municipal | | | | | | | | | | | | | | | | |
| | Bonds | | | — | | | | 6,740,036 | | | | — | | | | 6,740,036 | |
| | US | | | | | | | | | | | | | | | | |
| | Government | | | | | | | | | | | | | | | | |
| | Notes/Bonds | | | — | | | | 4,432,725 | | | | — | | | | 4,432,725 | |
| | Total Fixed | | | | | | | | | | | | | | | | |
| | Income: | | | — | | | | 79,712,014 | | | | — | | | | 79,712,014 | |
| | Short-Term | | | | | | | | | | | | | | | | |
| | Investments | | | 2,920,001 | | | | — | | | | — | | | | 2,920,001 | |
| | Total | | | | | | | | | | | | | | | | |
| | Short-Term | | | | | | | | | | | | | | | | |
| | Investments | | | 2,920,001 | | | | — | | | | — | | | | 2,920,001 | |
| | Total | | | | | | | | | | | | | | | | |
| | Investments | | | | | | | | | | | | | | | | |
| | in Securities | | $ | 2,920,001 | | | $ | 79,712,014 | | | $ | — | | | $ | 82,632,015 | |
PERFORMANCE TRUST MUTUAL FUNDS (PTIAX, PTAOX, PTCOX, PTIMX, PTRMX, PTCRX)
PERFORMANCE TRUST MUTUAL FUNDS – NOTES TO FINANCIAL STATEMENTS (CONT.)
August 31, 2022
| | The Funds did not hold any Level 3 securities during the year ended August 31, 2022. |
| | |
| | The Funds did not hold any financial derivative instruments during the year ended August 31, 2022. |
| | |
| b. | Short Positions |
| | |
| | The Funds may sell a security they do not own in anticipation of a decline in the fair value of that security. When a Fund sells a security short, it must borrow the security sold short and deliver it to the broker-dealer through which it made the short sale. A gain, limited to the price at which a Fund sold the security short, or a loss, unlimited in size, will be recognized upon the termination of a short sale. The Funds are liable for any dividends or interest payable on securities while those securities are in a short position. Such amounts are recorded on the ex-dividend date as a dividend expense. As collateral for its short positions, the Funds are required under the 1940 Act to maintain segregated assets consisting of cash, cash equivalents or liquid securities. The segregated assets are valued consistent with Note 2a above. The amount of segregated assets are required to be adjusted daily to reflect changes in the fair value of the securities sold short. As of August 31, 2022, the Funds did not have any open short positions and accordingly did not have securities or cash held as collateral. |
| | |
| c. | Federal Income Taxes |
| | |
| | Each Fund intends to comply with the requirements of Subchapter M of the Internal Revenue Code of 1986, as amended (the “Code”) necessary to qualify as a regulated investment company and to make the requisite distributions of income and capital gains to their shareholders sufficient to relieve them from all or substantially all federal income taxes. Therefore, no federal income tax provision has been provided. |
| | |
| | As of and during the year ended August 31, 2022, the Funds did not have a liability for any unrecognized tax benefits. The Funds recognize interest and penalties, if any, related to uncertain tax benefits as income tax expense in the Statements of Operations. During the year ended August 31, 2022, the Funds did not incur any interest or penalties. The Funds are not subject to examination by U.S. taxing authorities for the tax periods prior to the year ended August 31, 2019. |
| | |
| d. | Distributions to Shareholders |
| | |
| | The Funds will distribute any net investment income monthly. The Funds will distribute any net realized long- or short-term capital gains at least annually. Distributions from net realized gains for book purposes may include short-term capital gains. All short-term capital gains are included in ordinary income for tax purposes. Distributions to shareholders are recorded on the ex-dividend date. The Funds may also pay a special distribution at the end of the calendar year to comply with federal tax requirements. Income and capital gain distributions may differ from GAAP, primarily due to timing differences in the recognition of income, gains and losses by the Funds. To the extent that these differences are attributable to permanent book and tax accounting differences, the components of net assets have been adjusted. |
| | |
| e. | Use of Estimates |
| | |
| | The preparation of financial statements in conformity with GAAP requires management to make estimates and assumptions that affect the reported amounts of assets and liabilities and disclosure of contingent assets and liabilities at the date of the financial statements and the reported amounts of revenues and expenses during the reporting period. Actual results could differ from those estimates. |
| | |
| f. | Share Valuation |
| | |
| | The NAV per share of a Fund is calculated by dividing the sum of the value of the securities held by the Fund, plus cash or other assets, minus all liabilities (including estimated accrued expenses) by the total number of shares outstanding for the Fund, rounded to the nearest cent. The Funds’ shares will not be priced on the days on which the New York Stock Exchange (“NYSE”) is closed for trading. The Strategic Bond Fund and the Municipal Bond Fund charged a 2.00% redemption fee on shares redeemed within sixty days of purchase through December 28, 2019. These fees were deducted from the redemption proceeds otherwise payable to the shareholder. Effective December 29, 2019, the Strategic Bond Fund and the Municipal Bond Fund eliminated the redemption fees. |
| | |
| g. | Allocation of Income, Expenses and Gains/Losses |
| | |
| | Income, expenses (other than those deemed attributable to a specific share class), and gains and losses of each Fund are allocated daily to each class of shares based upon the ratio of net assets represented by each class as a percentage of the net assets of the Fund. Expenses deemed directly attributable to a class of shares are recorded by the specific class. Most expenses are allocated by class based on relative net assets. Distribution and service (Rule 12b-1) fees are expensed at 0.25% of average daily net assets of the Class A shares of the Strategic Bond Fund and the Municipal Bond Fund and 0.75% of average daily net assets of the Class C shares of the Strategic Bond Fund. Shareholder servicing fees are expensed at 0.25% of average daily net assets of Class C shares of the Strategic Bond Fund. Expenses associated with a specific fund in the Trust are charged to that fund. Common expenses of the Trust are typically allocated evenly between the funds of the Trust, or by other equitable means. |
| | |
| h. | Other |
| | |
| | Investment transactions are recorded on the trade date. The Funds determine the gain or loss from investment transactions on an identified cost basis by comparing the original cost of the security lot sold with the net sale proceeds. Dividend income, less foreign withholding tax, is recognized on the ex-dividend date and interest income is recognized on an accrual basis. Discounts, premiums and interest only strips are accreted or amortized over the expected life of the respective securities using the constant yield method. Gains and losses on principal payments and short-falls of mortgage backed securities (paydown gains and losses) are included as an adjustment to interest income in the Statements of Operations. |
| | |
| 3. | Federal Tax Matters |
| | |
| | The tax character of distributions paid during the years ended August 31, 2022 and August 31, 2021 was as follows: |
| | PERFORMANCE TRUST STRATEGIC BOND FUND | |
| | | | | | | | |
| | | | YEAR ENDED | | | YEAR ENDED | |
| | | | AUGUST 31, 2022 | | | AUGUST 31, 2021 | |
| | Ordinary Income | | $ | 208,508,008 | | | $ | 187,694,195 | |
| | Tax-Exempt Income | | | — | | | | — | |
| | Long-Term Capital Gain | | | 16,560,917 | | | | — | |
| | Return of Capital | | | — | | | | — | |
PERFORMANCE TRUST MUTUAL FUNDS (PTIAX, PTAOX, PTCOX, PTIMX, PTRMX, PTCRX)
PERFORMANCE TRUST MUTUAL FUNDS – NOTES TO FINANCIAL STATEMENTS (CONT.)
August 31, 2022
| | PERFORMANCE TRUST MUNICIPAL BOND FUND | | | | | | |
| | | | YEAR ENDED | | | YEAR ENDED | |
| | | | AUGUST 31, 2022 | | | AUGUST 31, 2021 | |
| | Ordinary Income | | $ | 3,026,501 | | | $ | 3,035,732 | |
| | Tax-Exempt Income | | | 13,354,202 | | | | 11,352,033 | |
| | Long-Term Capital Gain | | | — | | | | 1,938,135 | |
| | Return of Capital | | | — | | | | 2,191,897 | |
| | | | | | | | | | |
| | PERFORMANCE TRUST CREDIT FUND | | | | | | | | |
| | | | YEAR ENDED | | | YEAR ENDED | |
| | | | AUGUST 31, 2022 | | | AUGUST 31, 2021 | |
| | Ordinary Income | | $ | 1,579,174 | | | $ | 360,597 | |
| | Tax-Exempt Income | | | — | | | | — | |
| | Long-Term Capital Gain | | | — | | | | — | |
| | Return of Capital | | | — | | | | — | |
| | As of August 31, 2022, the components of distributable earnings (accumulated losses) on a tax basis were as follows: |
| | PERFORMANCE TRUST STRATEGIC BOND FUND | | | |
| | Cost basis of investments for federal | | | |
| | income tax purposes | | $ | 6,257,144,361 | |
| | Gross tax unrealized appreciation | | $ | 24,278,946 | |
| | Gross tax unrealized depreciation | | | (761,922,285 | ) |
| | Net tax unrealized appreciation | | | (737,643,339 | ) |
| | Undistributed ordinary income | | | 13,523,941 | |
| | Undistributed long-term capital gain | | | — | |
| | Total distributable earnings | | | 13,523,941 | |
| | Other accumulated losses | | | (149,651,430 | ) |
| | Total accumulated losses | | $ | (873,770,828 | ) |
| | | | | | |
| | PERFORMANCE TRUST MUNICIPAL BOND FUND | | | | |
| | Cost basis of investments for federal | | | | |
| | income tax purposes | | $ | 781,065,877 | |
| | Gross tax unrealized appreciation | | $ | 5,307,821 | |
| | Gross tax unrealized depreciation | | | (35,828,018 | ) |
| | Net tax unrealized appreciation | | | (30,520,197 | ) |
| | Undistributed ordinary income | | | 742,160 | |
| | Undistributed long-term capital gain | | | — | |
| | Total distributable earnings | | | 742,160 | |
| | Other accumulated losses | | | (51,070,689 | ) |
| | Total accumulated losses | | $ | (80,848,726 | ) |
| | | | | | |
| | PERFORMANCE TRUST CREDIT BOND FUND | | | | |
| | Cost basis of investments for federal | | | | |
| | income tax purposes | | $ | 87,678,933 | |
| | Gross tax unrealized appreciation | | $ | 331,572 | |
| | Gross tax unrealized depreciation | | | (5,378,490 | ) |
| | Net tax unrealized appreciation | | | (5,046,918 | ) |
| | Undistributed ordinary income | | | 211,410 | |
| | Undistributed long-term capital gain | | | — | |
| | Total distributable earnings | | | 211,410 | |
| | Other accumulated losses | | | (430,689 | ) |
| | Total accumulated losses | | $ | (5,266,197 | ) |
| | The difference between book-basis and tax-basis unrealized appreciation (depreciation) is attributable primarily to the tax deferral of losses on wash sale and amortization adjustments. |
| | |
| | At August 31, 2022, the Funds had capital loss carryovers as follows: |
| | | | SHORT-TERM | | | LONG-TERM | |
| | Strategic Bond Fund | | $ | — | | | $ | — | |
| | Municipal Bond Fund | | | 25,983,535 | | | | 25,087,155 | |
| | Credit Fund | | | 371,517 | | | | 59,172 | |
| | |
| | At August 31, 2022, the Strategic Bond Fund deferred, on tax basis, post October losses of $149,651,430. |
| | |
| | GAAP requires that certain components of net assets relating to permanent differences be reclassified between financial and tax reporting. These reclassifications are due to equalization and book versus tax treatment of callable bonds and have no effect on net assets or NAV per share. For the year ended August 31, 2022, the following reclassifications were made for permanent tax differences on the Statements of Assets and Liabilities: |
| | | | STRATEGIC | | | MUNICIPAL | | | CREDIT | |
| | | | BOND FUND | | | BOND FUND | | | FUND | |
| | Total | | | | | | | | | |
| | distributable | | | | | | | | | |
| | earnings | | $ | — | | | $ | 1 | | | $ | — | |
| | Paid-in capital | | $ | — | | | $ | (1 | ) | | $ | — | |
| 4. | Investment Adviser |
| | |
| | The Trust has an Investment Advisory Agreement (the “Agreement”) with the Adviser to furnish investment advisory services to the Funds. Under the terms of the Agreement, the Funds compensate the Adviser for its management services at the annual rate of 0.60% for the Strategic Bond Fund, 0.40% for the Municipal Bond Fund, and 0.80% for the Credit Fund of the respective Fund’s average daily net assets. |
| | |
| | The Adviser has contractually agreed to waive its management fee and/or reimburse Fund expenses at the discretion of the Adviser and the Board of Trustees, to the extent necessary to ensure that the total annual Fund operating expenses (exclusive of front-end or contingent deferred sales loads, Rule 12b-1 plan fees, shareholder servicing plan fees, taxes, leverage (i.e., any expenses incurred in connection with borrowings made by a Fund), interest (including interest incurred in connection with bank and custody overdrafts), brokerage commissions and other transactional expenses, expenses incurred in connection with any merger or reorganization, dividends or interest expense on short positions, acquired fund fees and expenses and extraordinary expenses such as litigation) do not exceed 0.95%, 0.55%, and 0.99% (the “Expense Limitation Cap”) of the average daily net assets of the Strategic Bond Fund, Municipal Bond Fund, and Credit Fund, respectively. The operating expense limitation agreement is in place at least through December 29, 2023 for the Strategic Bond Fund and Municipal Bond Fund and at least through December 31, 2023 for the Credit Fund. Any such waiver or reimbursement is subject to later adjustment to allow the Adviser to recover amounts waived or reimbursed to the extent actual fees and expenses for a fiscal period do not exceed the lesser of: (1) the Expense Limitation Cap in place at the time of the waiver and/or reimbursement; or (2) the Expense Limitation Cap in place at the time of recovery; provided, however, that the Adviser shall only be entitled to recover such amounts for a period of up to three years from the date such amount was waived or reimbursed. |
| | |
| | The following table shows the remaining waived or reimbursed expenses subject to potential recovery expiring by: |
| | | | STRATEGIC | | | MUNICIPAL | | | CREDIT | |
| | | | BOND FUND | | | BOND FUND | | | FUND | |
| | August 31, 2023 | | $ | — | | | $ | — | | | $ | — | |
| | August 31, 2024 | | $ | — | | | $ | — | | | $ | 102,789 | |
| | August 31, 2025 | | $ | — | | | $ | — | | | $ | 81,663 | |
PERFORMANCE TRUST MUTUAL FUNDS (PTIAX, PTAOX, PTCOX, PTIMX, PTRMX, PTCRX)
PERFORMANCE TRUST MUTUAL FUNDS – NOTES TO FINANCIAL STATEMENTS (CONT.)
August 31, 2022
| 5. | Distribution and Shareholder Servicing Plan |
| | |
| | The Trust has adopted a plan pursuant to Rule 12b-1 under the 1940 Act (the “12b-1 Plan”) on behalf of the Strategic Bond Fund and the Municipal Bond Fund, which authorize the Funds to pay Foreside Fund Services, LLC (the “Distributor”) a distribution fee of 0.25% of each Fund’s average daily net assets of Class A shares and 0.75% of the Strategic Bond Fund’s average daily net assets for Class C shares, for services to prospective Fund shareholders and distribution of Fund shares, and 0.25% of the Strategic Bond Fund’s average daily net assets of Class C shares for shareholder servicing, as applicable. During the year ended August 31, 2022, the Funds accrued expenses pursuant to the 12b-1 Plan as follows: |
| | | | | | | Shareholder | |
| | | | 12b-1 Fees | | | Servicing Fees | |
| | Strategic Bond Fund | | | | | | |
| | Class A | | $ | 84,010 | | | | N/A | |
| | Class C | | $ | 411,554 | | | $ | 137,185 | |
| | Municipal Bond Fund | | | | | | | | |
| | Class A | | $ | 132,436 | | | | N/A | |
| 6. | Related Party Transactions |
| | |
| | U.S. Bancorp Fund Services, LLC (doing business as U.S. Bank Global Fund Services (“Fund Services”)) acts as the Funds’ administrator and fund accountant under an Administration Agreement. Fund Services performs various administrative and accounting services including: preparing various federal and state regulatory filings, reports and returns for the Funds; preparing reports and materials to be supplied to the Trustees; monitoring the activities of the Funds’ custodian, transfer agent and accountants; coordinating the preparation and payment of the Funds’ expenses; and reviewing the Funds’ expense accruals. Fund Services also serves as the transfer agent to the Funds. U.S. Bank, N.A. (“U.S. Bank”), an affiliate of Fund Services, serves as each Fund’s custodian. Fees incurred for the year ended August 31, 2022, and owed as of August 31, 2022 are as follows: |
| | Administration | | | | | | |
| | and Accounting | | Incurred | | | Owed | |
| | Strategic Bond Fund | | $ | 2,196,061 | | | $ | 346,247 | |
| | Municipal Bond Fund | | | 326,023 | | | | 52,273 | |
| | Credit Fund | | | 23,277 | | | | 5,510 | |
| | | | | | | | |
| | Transfer Agency | | Incurred | | | Owed | |
| | Strategic Bond Fund | | $ | 741,926 | (1) | | $ | 132,024 | (1) |
| | Municipal Bond Fund | | | 108,638 | | | | 18,341 | |
| | Credit Fund | | | 13,993 | | | | 2,629 | |
| | (1) | This amount does not include sub-transfer agency fees. |
| | Custody | | Incurred | | | Owed | |
| | Strategic Bond Fund | | $ | 277,473 | | | $ | 42,845 | |
| | Municipal Bond Fund | | | 36,334 | | | | 5,496 | |
| | Credit Fund | | | 6,223 | | | | 1,064 | |
| | The Funds each have a line of credit with US Bank (see Note 10). |
| | |
| | Certain officers of the Funds are also employees of Fund Services. A Trustee of the Trust is affiliated with Fund Services and U.S. Bank. |
| | |
| | The Trust’s Chief Compliance Officer is also an employee of Fund Services. Each Fund’s allocation of the Trust’s Chief Compliance Officer fee incurred for the year ended August 31, 2022, and owed as of August 31, 2022, are as follows: |
| | | | Incurred | | | Owed | |
| | Strategic Bond Fund | | $ | 11,665 | | | $ | 1,946 | |
| | Municipal Bond Fund | | | 11,665 | | | | 1,946 | |
| | Credit Fund | | | 11,670 | | | | 1,946 | |
| 7. | Capital Share Transactions |
| | |
| | Transactions in shares of the Funds were as follows: |
| | STRATEGIC BOND FUND – INSTITUTIONAL CLASS | | | | | | |
| | | | YEAR ENDED | | | YEAR ENDED | |
| | | | AUGUST 31, 2022 | | | AUGUST 31, 2021 | |
| | Shares sold | | | 122,458,153 | | | | 132,683,016 | |
| | Shares issued | | | | | | | | |
| | to holders in | | | | | | | | |
| | reinvestment | | | | | | | | |
| | of distributions | | | 9,155,853 | | | | 7,046,695 | |
| | Shares redeemed | | | (129,826,449 | ) | | | (52,194,718 | ) |
| | Net increase | | | 1,787,557 | | | | 87,534,993 | |
| | | | | | | | | | |
| | STRATEGIC BOND FUND – CLASS A | | | | | | | | |
| | | | YEAR ENDED | | | YEAR ENDED | |
| | | | AUGUST 31, 2022 | | | AUGUST 31, 2021 | |
| | Shares sold | | | 953,439 | | | | 1,066,414 | |
| | Shares issued | | | | | | | | |
| | to holders in | | | | | | | | |
| | reinvestment | | | | | | | | |
| | of distributions | | | 52,014 | | | | 41,290 | |
| | Shares redeemed | | | (788,198 | ) | | | (531,640 | ) |
| | Net increase | | | 217,255 | | | | 576,064 | |
| | | | | | | | | | |
| | STRATEGIC BOND FUND – CLASS C | | | | | | | | |
| | | | YEAR ENDED | | | YEAR ENDED | |
| | | | AUGUST 31, 2022 | | | AUGUST 31, 2021 | |
| | Shares sold | | | 570,173 | | | | 1,434,889 | |
| | Shares issued | | | | | | | | |
| | to holders in | | | | | | | | |
| | reinvestment | | | | | | | | |
| | of distributions | | | 67,724 | | | | 49,565 | |
| | Shares redeemed | | | (713,115 | ) | | | (393,333 | ) |
| | Net increase (decrease) | | | (75,218 | ) | | | 1,091,121 | |
| | | | | | | | | | |
| | MUNICIPAL BOND FUND – INSTITUTIONAL CLASS | | | | | | | | |
| | | | YEAR ENDED | | | YEAR ENDED | |
| | | | AUGUST 31, 2022 | | | AUGUST 31, 2021 | |
| | Shares sold | | | 17,207,506 | | | | 15,992,833 | |
| | Shares issued | | | | | | | | |
| | to holders in | | | | | | | | |
| | reinvestment | | | | | | | | |
| | of distributions | | | 572,826 | | | | 595,759 | |
| | Shares redeemed | | | (19,762,459 | ) | | | (4,622,606 | ) |
| | Net increase (decrease) | | | (1,982,127 | ) | | | 11,965,986 | |
| | | | | | | | | | |
| | MUNICIPAL BOND FUND – CLASS A | | | | | | | | |
| | | | YEAR ENDED | | | YEAR ENDED | |
| | | | AUGUST 31, 2022 | | | AUGUST 31, 2021 | |
| | Shares sold | | | 1,148,257 | | | | 1,203,433 | |
| | Shares issued | | | | | | | | |
| | to holders in | | | | | | | | |
| | reinvestment | | | | | | | | |
| | of distributions | | | 34,305 | | | | 44,651 | |
| | Shares redeemed | | | (1,314,288 | ) | | | (759,937 | ) |
| | Net increase (decrease) | | | (131,726 | ) | | | 488,147 | |
PERFORMANCE TRUST MUTUAL FUNDS (PTIAX, PTAOX, PTCOX, PTIMX, PTRMX, PTCRX)
PERFORMANCE TRUST MUTUAL FUNDS – NOTES TO FINANCIAL STATEMENTS (CONT.)
August 31, 2022
| | CREDIT FUND – INSTITUTIONAL CLASS | | | | | | |
| | | | | | | | |
| | | | YEAR ENDED | | | PERIOD ENDED | |
| | | | AUGUST 31, 2022 | | | AUGUST 31, 2021(1) | |
| | Shares sold | | | 9,583,852 | | | | 1,277,485 | |
| | Shares issued | | | | | | | | |
| | to holders in | | | | | | | | |
| | reinvestment | | | | | | | | |
| | of distributions | | | 170,652 | | | | 35,675 | |
| | Shares redeemed | | | (1,646,506 | ) | | | (20,093 | ) |
| | Net increase | | | 8,107,998 | | | | 1,293,067 | |
| | (1) | The inception date for the Fund was December 31, 2020 and investment operations commenced January 4, 2021. |
| 8. | Investment Transactions |
| | |
| | The aggregate purchases and sales of securities, excluding short-term investments, for the Funds for the year ended August 31, 2022, are summarized below. |
| | | | STRATEGIC | | | MUNICIPAL | | | CREDIT | |
| | | | BOND FUND | | | BOND FUND | | | FUND | |
| | Purchases | | | | | | | | | |
| | U.S. | | | | | | | | | |
| | Government | | $ | 502,474,327 | | | $ | — | | | $ | 16,745,322 | |
| | Other | | | 3,123,950,697 | | | | 684,132,646 | | | | 79,216,068 | |
| | Sales | | | | | | | | | | | | |
| | U.S. | | | | | | | | | | | | |
| | Government | | $ | 287,739,822 | | | $ | — | | | $ | 5,684,869 | |
| | Other | | | 2,985,444,587 | | | | 679,755,219 | | | | 17,782,833 | |
| 9. | Beneficial Ownership |
| | |
| | The beneficial ownership, either directly or indirectly, of more than 25% of the voting securities of a fund creates a presumption of control of a fund, under Section 2(a)(9) of the 1940 Act. At August 31, 2022, Raymond James and Morgan Stanley Smith Barney, LLC held 35.81% and 32.74%, respectively, of the Strategic Bond Fund’s outstanding Class A shares for the benefit of their customers. At August 31, 2022, Morgan Stanley Smith Barney, LLC and Raymond James held 44.38% and 36.22%, respectively, of the Strategic Bond Fund’s outstanding Class C shares for the benefit of their customers. At August 31, 2022, Charles Schwab & Company, Inc. held 26.07% of the Strategic Bond Fund’s outstanding Institutional Class shares for the benefit of its customers. At August 31, 2022, Charles Schwab & Company, Inc. held 55.35% of the Municipal Bond Fund’s outstanding Class A shares for the benefit of its customers. |
| | |
| | At August 31, 2022, Charles Schwab & Company, Inc. held 73.09% of the Credit Fund’s outstanding Institutional Class shares for the benefit of its customers. |
| | |
| 10. | Line of Credit |
| | |
| | At August 31, 2022, the Strategic Bond Fund and the Municipal Bond Fund each had an unsecured line of credit which matures on August 5, 2023 with a maximum borrowing equal to the lesser of $250,000,000 and $35,000,000, respectively, or 20% and 33.33% respectively, of gross market value of unencumbered assets of each Fund. The Credit Fund has a secured line of credit which matures on August 5, 2023 with a maximum borrowing equal to the lesser of $4,000,000 or 20% of gross market value of unencumbered assets of the Fund. These lines of credit are intended to provide short-term financing, if necessary, subject to certain restrictions, in connection with shareholder redemptions. The credit facility is with the Funds’ custodian, U.S. Bank. Interest will be accrued at the prime rate (5.50% as of August 31, 2022). The Funds did not utilize their lines of credit during the year ended August 31, 2022. The Funds did not have any outstanding balances on the lines of credit at August 31, 2022. |
| | |
| 11. | Recent Market Events |
| | |
| | U.S. and international markets have experienced volatility in recent months and years due to a number of economic, political and global macro factors including the impact of the coronavirus (COVID-19) as a global pandemic, uncertainties regarding interest rates, rising inflation, trade tensions, and the threat of tariffs imposed by the U.S. and other countries. The recovery from COVID-19 is proceeding at slower than expected rates and may last for a prolonged period of time. As a result of continuing political tensions and armed conflicts, including the war between Ukraine and Russia, the U.S. and the European Union imposed sanctions on certain Russian individuals and companies, including certain financial institutions, and have limited certain exports and imports to and from Russia. The war has contributed to recent market volatility and may continue to do so. Continuing market volatility as a result of recent market conditions or other events may have an adverse effect on the performance of the Funds. |
| | |
| 12. | LIBOR |
| | |
| | The London Interbank Offered Rate (“LIBOR”) is an interest rate average calculated from estimates submitted by the leading banks in London. Most maturities and currencies of LIBOR were phased out at the end of 2021, with the remaining ones to be phased out on June 30, 2023. There remains uncertainty regarding the nature of any replacement rate and the impact of the transition from LIBOR on the Funds and the financial markets generally. The Secured Overnight Funding Rate (“SOFR”) has been selected by a committee established by the Board of Governors of the Federal Reserve System and the Federal Reserve Bank of New York to replace LIBOR as a reference rate in the United States. Other countries have undertaken similar initiatives to identify replacement reference rates in their respective markets. The transition from LIBOR could have a significant impact on the financial markets, including increased volatility and illiquidity in markets for instruments that currently rely on LIBOR to determine interest rates and a reduction in the values of some LIBOR-based investments. The transition to an alternative interest rate may not be orderly, may occur over various time periods or may have unintended consequences. |
PERFORMANCE TRUST MUTUAL FUNDS (PTIAX, PTAOX, PTCOX, PTIMX, PTRMX, PTCRX)
PERFORMANCE TRUST MUTUAL FUNDS – NOTES TO FINANCIAL STATEMENTS (CONT.)
August 31, 2022
| 13. | Subsequent Events |
| | |
| | On September 15, 2022, the Funds declared and paid distributions from ordinary income to shareholders of record as of September 14, 2022, as follows: |
| | | | Ordinary | |
| | | | Income | |
| | Strategic Bond Fund | | | |
| | Institutional Class | | $ | 20,315,027 | |
| | Class A | | $ | 115,850 | |
| | Class C | | $ | 132,452 | |
| | Municipal Bond Fund | | | | |
| | Institutional Class | | $ | 1,712,854 | |
| | Class A | | $ | 110,149 | |
| | Credit Fund | | | | |
| | Institutional Class | | $ | 324,930 | |
| | On October 14, 2022, the Funds declared and paid distributions from ordinary income to shareholders of record as of October 13, 2022, as follows: |
| | | | Ordinary | |
| | | | Income | |
| | Strategic Bond Fund | | | |
| | Institutional Class | | $ | 17,268,532 | |
| | Class A | | $ | 99,483 | |
| | Class C | | $ | 114,584 | |
| | Municipal Bond Fund | | | | |
| | Institutional Class | | $ | 1,674,530 | |
| | Class A | | $ | 107,779 | |
| | Credit Fund | | | | |
| | Institutional Class | | $ | 354,077 | |
| | The Funds have evaluated events and transactions that have occurred subsequent to August 31, 2022 through the date the financial statements were issued and determined there were no other subsequent events that would require disclosure in the financial statements. |
PERFORMANCE TRUST MUTUAL FUNDS (PTIAX, PTAOX, PTCOX, PTIMX, PTRMX, PTCRX)
REPORT OF INDEPENDENT REGISTERED PUBLIC ACCOUNTING FIRM
To the Shareholders of Performance Trust Mutual Funds and
Board of Trustees of Trust for Professional Managers
Opinion on the Financial Statements
We have audited the accompanying statements of assets and liabilities, including the schedules of investments, of Performance Trust Mutual Funds comprising the funds listed below (the “Funds”), each a series of Trust for Professional Managers, as of August 31, 2022, the related statements of operations, the statements of changes in net assets, the related notes, and the financial highlights for each of the periods indicated below (collectively referred to as the “financial statements”). In our opinion, the financial statements present fairly, in all material respects, the financial position of each of the Funds as of August 31, 2022, the results of their operations, the changes in net assets, and the financial highlights for each of the periods indicated below in conformity with accounting principles generally accepted in the United States of America.
| | Statements of | Statements of | Financial |
| Fund Name | Operations | Changes in Net Assets | Highlights |
Performance Trust Strategic Bond Fund | For the year ended | For the years ended | For the years ended August 31, 2022, |
| | August 31, 2022 | August 31, 2022 and 2021 | 2021, 2020, 2019, and 2018 |
Performance Trust Municipal Bond Fund | For the year ended | For the years ended | For the years ended August 31, 2022, |
| | August 31, 2022 | August 31, 2022 and 2021 | 2021, 2020, 2019, and 2018 |
Performance Trust Credit Fund | For the year ended | For the year ended August 31, 2022 and for the period |
| | August 31, 2022 | from January 4, 2021 (commencement of operations) |
| | | through August 31, 2021 |
Basis for Opinion
These financial statements are the responsibility of the Funds’ management. Our responsibility is to express an opinion on the Funds’ financial statements based on our audits. We are a public accounting firm registered with the Public Company Accounting Oversight Board (United States) (“PCAOB”) and are required to be independent with respect to the Funds in accordance with the U.S. federal securities laws and the applicable rules and regulations of the Securities and Exchange Commission and the PCAOB.
We conducted our audits in accordance with the standards of the PCAOB. Those standards require that we plan and perform the audit to obtain reasonable assurance about whether the financial statements are free of material misstatement whether due to error or fraud.
Our audits included performing procedures to assess the risks of material misstatement of the financial statements, whether due to error or fraud, and performing procedures that respond to those risks. Such procedures included examining, on a test basis, evidence regarding the amounts and disclosures in the financial statements. Our procedures included confirmation of securities owned as of August 31, 2022, by correspondence with the custodian and brokers; when replies were not received from brokers, we performed other auditing procedures. Our audits also included evaluating the accounting principles used and significant estimates made by management, as well as evaluating the overall presentation of the financial statements. We believe that our audits provide a reasonable basis for our opinion.
We have served as the Funds’ auditor since 2011.
COHEN & COMPANY, LTD.
Milwaukee, Wisconsin
October 28, 2022
PERFORMANCE TRUST MUTUAL FUNDS (PTIAX, PTAOX, PTCOX, PTIMX, PTRMX, PTCRX)
STATEMENT REGARDING LIQUIDITY RISK MANAGEMENT PROGRAM
In accordance with Rule 22e-4 under the Investment Company Act of 1940, as amended, Trust for Professional Managers (the “Trust”) has adopted and implemented a liquidity risk management program (the “Trust Program”). As required under the Trust Program, PT Asset Management, LLC (“PTAM”), the investment adviser to the Performance Trust Strategic Bond Fund, Performance Trust Municipal Bond Fund and Performance Trust Credit Fund (the “Funds”), each a series of the Trust, has adopted and implemented a liquidity risk management program tailored specifically to each Fund (the “Adviser Program”). The Adviser Program seeks to promote effective liquidity risk management for each Fund and to protect Fund shareholders from dilution of their interests. The Board of Trustees (the “Board”) of the Trust has approved PTAM as the administrator for the Adviser Program (the “Program Administrator”). The Program Administrator has further delegated administration of the Adviser Program to its Trading and Oversight Committee. The Program Administrator is required to provide a written annual report to the Board and the Trust’s chief compliance officer regarding the adequacy and effectiveness of the Adviser Program, including the operation of each Fund’s highly liquid investment minimum, if applicable, and any material changes to the Adviser Program.
On April 13, 2022, the Board reviewed the Program Administrator’s written annual report for the period January 1, 2021 through December 31, 2021 (the “Report”). The Report provided an assessment of each Fund’s liquidity risk: the risk that a Fund could not meet requests to redeem shares issued by the Fund without significant dilution of the remaining investors’ interests in the Fund. The Adviser Program assesses liquidity risk under both normal and reasonably foreseeable stressed market conditions. The Program Administrator has retained ICE Data Services, Inc., a third party vendor, to provide portfolio investment classification services, and the Report noted that each Fund primarily held investments that were classified as highly liquid during the review period. The Report noted that each Fund’s portfolio is expected to continue to primarily hold highly liquid investments and the determination that each Fund be designated as a “primarily highly liquid fund” (as defined in Rule 22e-4) remains appropriate. Each Fund can therefore continue to rely on the exclusion in Rule 22e-4 from the requirements to determine and review a highly liquid investment minimum for the Fund and to adopt policies and procedures for responding to a highly liquid investment minimum shortfall. The Report noted that there were no breaches of a Fund’s restriction on holding illiquid investments exceeding 15% of its net assets during the review period. The Report confirmed that each Fund’s investment strategy was appropriate for an open-end management investment company. The Report also indicated that no material changes had been made to the Adviser Program during the review period.
The Program Administrator determined that each Fund is reasonably likely to be able to meet redemption requests without adversely affecting non-redeeming Fund shareholders through significant dilution. The Program Administrator concluded that the Adviser Program was adequately designed and effectively implemented during the review period.
PERFORMANCE TRUST MUTUAL FUNDS (PTIAX, PTAOX, PTCOX, PTIMX, PTRMX, PTCRX)
NOTICE OF PRIVACY POLICY & PRACTICES
We collect non-public personal information about you from the following sources:
» | information we receive about you on applications or other forms; |
| | |
» | information you give us orally; and |
| | |
» | information about your transactions with us or others. |
We do not disclose any non-public personal information about our shareholders or former shareholders without the shareholder’s authorization, except as permitted by law or in response to inquiries from governmental authorities. We may share information with affiliated parties and unaffiliated third parties with whom we have contracts for servicing the Funds. We will provide unaffiliated third
parties with only the information necessary to carry out their assigned responsibility. All shareholder records will be disposed of in accordance with applicable law. We maintain physical, electronic and procedural safeguards to protect your non-public personal information and require third parties to treat your nonpublic personal information with the same high degree of confidentiality.
In the event that you hold shares of the Funds through a financial intermediary, including, but not limited to, a broker-dealer, bank or trust company, the privacy policy of your financial intermediary would govern how your non-public personal information would be shared with unaffiliated third parties.
PERFORMANCE TRUST MUTUAL FUNDS (PTIAX, PTAOX, PTCOX, PTIMX, PTRMX, PTCRX)
EXPENSE EXAMPLE
Period Ended August 31, 2022 (Unaudited)
As a shareholder of the Funds, you incur two types of costs: (1) transaction costs, including sales charge (loads) on purchase payments (Class A shares only) and (2) ongoing costs, including management fees, distribution 12b-1 and service fees (Class A and Class C shares only) and other Fund expenses. This example is intended to help you understand your ongoing costs (in dollars) of investing in the Funds and to compare these costs with the ongoing costs of investing in other mutual funds.
The Example is based on an investment of $1,000 invested at the beginning of the period and held for the entire period (3/1/22 – 8/31/22).
Actual Expenses
The first line of the following tables provides information about actual account values and actual expenses for each Fund. If you purchase Class A shares of a Fund you will pay an initial sales charge of 2.25% when you invest. The tables do not include shareholder specific fees, such as the $15.00 fee charged to IRA accounts, or the $15.00 fee charged for wire redemptions. The tables also do not include portfolio trading commissions and related trading costs. You may use the information in this line, together with the amount you invested, to estimate the expenses that you paid over the period. Simply divide your account value by $1,000 (for example, an $8,600 account value divided by $1,000 = 8.6), then multiply the result by the number in the first line under the heading entitled “Expenses Paid During Period” to estimate the expenses you paid on your account during this period.
Hypothetical Example for Comparison Purposes
The second line of the following tables provides information about hypothetical account values and hypothetical expenses based on the actual expense ratios for each Fund and an assumed rate of return of 5% per year before expenses, which is not the Fund’s actual returns. The hypothetical account values and expenses may not be used to estimate the actual ending account balance or expenses you paid for the period. You may use this information to compare the ongoing costs of investing in the Funds and other funds. To do so, compare this 5% hypothetical example with the 5% hypothetical examples that appear in the shareholder reports of the other funds.
Please note that the expenses shown in the tables are meant to highlight your ongoing costs only and do not reflect any transactional costs, such as sales charges (loads), redemption fees, or exchange fees. Therefore, the second line of each of the tables is useful in comparing ongoing costs only, and will not help you determine the relative total cost of owning different funds. In addition, if these transactional costs were included, your costs would have been higher.
| | | | EXPENSES PAID |
| PERFORMANCE TRUST | | | DURING PERIOD |
| STRATEGIC BOND FUND – | BEGINNING ACCOUNT VALUE | ENDING ACCOUNT VALUE | MARCH 1, 2022 – |
| INSTITUTIONAL CLASS | MARCH 1, 2022 | AUGUST 31, 2022 | AUGUST 31, 2022* |
Actual | $1,000.00 | $ 917.90 | $3.67 |
Hypothetical | | | |
| (5% annual return before expenses) | $1,000.00 | $1,021.37 | $3.87 |
*
| Expenses are equal to the Fund’s annualized expense ratio of 0.76%, multiplied by the average account value over the period, multiplied by 184/365 to reflect the one-half year period. |
| | | | EXPENSES PAID |
| PERFORMANCE TRUST | | | DURING PERIOD |
| STRATEGIC BOND FUND – | BEGINNING ACCOUNT VALUE | ENDING ACCOUNT VALUE | MARCH 1, 2022 – |
| CLASS A | MARCH 1, 2022 | AUGUST 31, 2022 | AUGUST 31, 2022* |
Actual | $1,000.00 | $ 916.70 | $4.88 |
Hypothetical | | | |
| (5% annual return before expenses) | $1,000.00 | $1,020.11 | $5.14 |
*
| Expenses are equal to the Fund’s annualized expense ratio of 1.01%, multiplied by the average account value over the period, multiplied by 184/365 to reflect the one-half year period. |
| | | | EXPENSES PAID |
| PERFORMANCE TRUST | | | DURING PERIOD |
| STRATEGIC BOND FUND – | BEGINNING ACCOUNT VALUE | ENDING ACCOUNT VALUE | MARCH 1, 2022 – |
| CLASS C | MARCH 1, 2022 | AUGUST 31, 2022 | AUGUST 31, 2022* |
Actual | $1,000.00 | $ 913.10 | $8.49 |
Hypothetical | | | |
| (5% annual return before expenses) | $1,000.00 | $1,016.33 | $8.94 |
*
| Expenses are equal to the Fund’s annualized expense ratio of 1.76%, multiplied by the average account value over the period, multiplied by 184/365 to reflect the one-half year period. |
PERFORMANCE TRUST MUTUAL FUNDS (PTIAX, PTAOX, PTCOX, PTIMX, PTRMX, PTCRX)
EXPENSE EXAMPLE (CONT.)
Period Ended August 31, 2022 (Unaudited)
| | | | EXPENSES PAID |
| PERFORMANCE TRUST | | | DURING PERIOD |
| MUNICIPAL BOND FUND – | BEGINNING ACCOUNT VALUE | ENDING ACCOUNT VALUE | MARCH 1, 2022 – |
| INSTITUTIONAL CLASS | MARCH 1, 2022 | AUGUST 31, 2022 | AUGUST 31, 2022* |
Actual | $1,000.00 | $ 919.30 | $4.70 |
Hypothetical | | | |
| (5% annual return before expenses) | $1,000.00 | $1,045.10 | $5.01 |
*
| Expenses are equal to the Fund’s annualized expense ratio of 0.49%, multiplied by the average account value over the period, multiplied by 184/365 to reflect the one-half year period. |
| | | | EXPENSES PAID |
| PERFORMANCE TRUST | | | DURING PERIOD |
| MUNICIPAL BOND FUND – | BEGINNING ACCOUNT VALUE | ENDING ACCOUNT VALUE | MARCH 1, 2022 – |
| CLASS A | MARCH 1, 2022 | AUGUST 31, 2022 | AUGUST 31, 2022* |
Actual | $1,000.00 | $ 918.20 | $7.10 |
Hypothetical | | | |
| (5% annual return before expenses) | $1,000.00 | $1,042.60 | $7.56 |
*
| Expenses are equal to the Fund’s annualized expense ratio of 0.74%, multiplied by the average account value over the period, multiplied by 184/365 to reflect the one-half year period. |
| | | | EXPENSES PAID |
| PERFORMANCE TRUST | | | DURING PERIOD |
| CREDIT FUND – | BEGINNING ACCOUNT VALUE | ENDING ACCOUNT VALUE | MARCH 1, 2022 – |
| INSTITUTIONAL CLASS | MARCH 1, 2022 | AUGUST 31, 2022 | AUGUST 31, 2022* |
Actual | $1,000.00 | $ 927.30 | $9.54 |
Hypothetical | | | |
| (5% annual return before expenses) | $1,000.00 | $1,040.10 | $10.10 |
*
| Expenses are equal to the Fund’s annualized expense ratio of 0.99%, multiplied by the average account value over the period, multiplied by 184/365 to reflect the one-half year period. |
PERFORMANCE TRUST MUTUAL FUNDS (PTIAX, PTAOX, PTCOX, PTIMX, PTRMX, PTCRX)
BASIS FOR TRUSTEES’ APPROVAL OF INVESTMENT ADVISORY AGREEMENT
(Unaudited)
The Board of Trustees (the “Trustees”) of Trust for Professional Managers (the “Trust”) met on August 26, 2022 to consider the renewal of the Investment Advisory Agreement (the “Agreement”) between the Trust, on behalf of the Performance Trust Municipal Bond Fund, the Performance Trust Strategic Bond Fund and the Performance Trust Credit Fund (each, a “Fund,” and together, the “Funds”), each a series of the Trust, and PT Asset Management, LLC, the Funds’ investment adviser (the “Adviser”). The Trustees also met at a prior meeting held on June 13, 2022 (the “June 13, 2022 meeting”) to review materials related to the renewal of the Agreement. Prior to these meetings, the Trustees requested and received materials to assist them in considering the renewal of the Agreement. The materials provided contained information with respect to the factors enumerated below, including a copy of the Agreement, a memorandum prepared by the Trust’s outside legal counsel discussing in detail the Trustees’ fiduciary obligations and the factors they should assess in considering the renewal of the Agreement, detailed comparative information relating to the Funds’ performance, as well as the management fees and other expenses of the Funds, due diligence materials relating to the Adviser (including a due diligence questionnaire completed on behalf of the Funds by the Adviser, the Adviser’s Form ADV, select financial statements of the Adviser, biographical information of the Adviser’s key management and compliance personnel, comparative fee information for the Funds and the Adviser’s other separately-managed accounts and a summary detailing key provisions of the Adviser’s written compliance program, including its code of ethics) and other pertinent information. The Trustees also received information periodically throughout the year that was relevant to the Agreement renewal process, including performance, management fee and other expense information. Based on their evaluation of the information provided by the Adviser, in conjunction with the Funds’ other service providers, the Trustees, by a unanimous vote (including a separate vote of the Trustees who are not “interested persons,” as that term is defined in the Investment Company Act of 1940, as amended (the “Independent Trustees”)), approved the continuation of the Agreement for an additional one-year term ending August 31, 2022.
DISCUSSION OF FACTORS CONSIDERED
In considering the renewal of the Agreement and reaching their conclusions, the Trustees reviewed and analyzed various factors that they determined were relevant, including the factors enumerated below.
| 1. | NATURE, EXTENT AND QUALITY OF SERVICES PROVIDED TO THE FUNDS |
| | The Trustees considered the nature, extent and quality of services provided by the Adviser to the Funds and the amount of time devoted to the Funds’ operations by the Adviser’s staff. The Trustees considered the Adviser’s specific responsibilities in all aspects of day-to-day management of the Funds, including the investment strategies implemented by the Adviser, as well as the qualifications, experience and responsibilities of G. Michael Plaiss, co-portfolio manager for the Performance Trust Municipal Bond Fund, Performance Trust Strategic Bond Fund and Performance Trust Credit Fund, Anthony J. Harris, co-portfolio manager for the Performance Trust Strategic Bond Fund and Performance Trust Credit Fund, Mark Peiler, co-portfolio manager for the Performance Trust Municipal Bond Fund, and Lars Anderson, co-portfolio manager for the Performance Trust Credit Fund, and other key personnel at the Adviser involved in the day-to-day activities of the Funds. The Trustees reviewed information provided by the Adviser in a due diligence questionnaire, including the structure of the Adviser’s compliance program and its continuing commitment to the Funds. The Trustees noted that during the course of the prior year the Adviser had participated in a Trust board meeting to discuss the Funds’ performance and outlook, along with the compliance efforts made by the Adviser. The Trustees also noted any services that extended beyond portfolio management, and they considered the brokerage practices of the Adviser. The Trustees discussed the Adviser’s handling of compliance matters, including the reports of the Trust’s chief compliance officer to the Trustees on the effectiveness of the Adviser’s compliance program. The Trustees also considered the Adviser’s overall financial condition, as well as the implementation and operational effectiveness of the Adviser’s business continuity plan in response to the COVID-19 pandemic. The Trustees concluded that the Adviser had sufficient quality and depth of personnel, resources, investment methods and compliance policies and procedures essential to performing its duties under the Advisory Agreement and that the nature, overall quality and extent of the management services provided to the Funds, as well as the Adviser’s compliance program, were satisfactory and reliable. |
| | |
| 2. | INVESTMENT PERFORMANCE OF THE FUNDS AND THE ADVISER |
| | The Trustees discussed the performance of the Institutional Class shares of the Performance Trust Municipal Bond Fund, the Institutional Class and Class A shares of the Performance Trust Strategic Bond Fund, and the Institutional Class shares of the Performance Trust Credit Fund for the quarter, one-year, three-year, five-year, ten-year and since inception periods ended March 31, 2022, as applicable. In assessing the quality of the portfolio management services delivered by the Adviser, the Trustees also compared the short-term and longer-term performance of the Funds on both an absolute basis and in comparison to a benchmark index (the Bloomberg U.S. Aggregate Bond Index for both the Performance Trust Strategic Bond Fund and Performance Trust Credit Fund, and the Bloomberg Municipal Bond Index for the Performance Trust Municipal Bond Fund) and in comparison to a peer group of funds as constructed using publicly-available data provided by Morningstar, Inc. and presented by Barrington Financial Group, LLC d/b/a Barrington Partners, an independent third-party benchmarking firm, through its cohort selection process (a peer group of U.S. open-end intermediate core-plus bond, intermediate core bond and non-traditional bond funds for the Performance Trust Strategic Bond Fund, a peer group of U.S. open-end multisector bond and non-traditional bond funds for the Performance Trust Credit Fund, and a peer group of U.S. open-end municipal national intermediate-term bond and municipal national long-term bond funds for the Performance Trust Municipal Bond Fund) (each, a “Barrington Cohort”). The Trustees noted the Adviser’s representation that it does not calculate composite performance for its separately-managed accounts and as such the Adviser could not provide composite performance information for those accounts. |
PERFORMANCE TRUST MUTUAL FUNDS (PTIAX, PTAOX, PTCOX, PTIMX, PTRMX, PTCRX)
BASIS FOR TRUSTEES’ APPROVAL OF INVESTMENT ADVISORY AGREEMENT (CONT.)
(Unaudited)
| | The Trustees noted that for each of the one-year, three-year, five-year, and ten-year periods ended March 31, 2022, the Performance Trust Municipal Bond Fund’s performance for Institutional Class shares was above the Barrington Cohort average. The Trustees noted that for the one-year, three-year, five-year, ten-year, and since inception periods ended March 31, 2022, the Institutional Class shares of the Performance Trust Municipal Bond Fund had outperformed the Bloomberg Municipal Bond Index. The Trustees noted that for the quarter ended March 31, 2022, the Institutional Class shares of the Performance Trust Municipal Bond Fund had underperformed the Bloomberg Municipal Bond Index. |
| | |
| | The Trustees noted the Performance Trust Strategic Bond Fund’s performance for Class A shares for the three-year period ended March 31, 2022 was below the Barrington Cohort average. The Trustees also noted that the Performance Trust Strategic Bond Fund’s performance for Class A shares for the one-year period ended March 31, 2022 was above the Barrington Cohort average. The Trustees noted that for each of the quarter, one-year, three-year, five-year, ten-year, and since inception periods ended March 31, 2022, the Institutional Class shares of the Performance Trust Strategic Bond Fund had outperformed the Bloomberg U.S. Aggregate Bond Index. |
| | |
| | The Trustees noted that for the one-year period ended March 31, 2022, the Performance Trust Credit Fund’s performance for Institutional Class shares was above the Barrington Cohort average. The Trustees noted that for the quarter, one-year, and since inception periods ended March 31, 2022, the Institutional Class shares of the Performance Trust Credit Fund had outperformed the Bloomberg U.S. Aggregate Bond Index. |
| | |
| | After considering all of the information, the Trustees concluded that the performance obtained by the Adviser for each Fund was satisfactory under current market conditions. Although past performance is not a guarantee or indication of future results, the Trustees determined that each Fund and its shareholders were likely to benefit from the Adviser’s continued management. |
| | |
| 3. | COSTS OF SERVICES PROVIDED AND PROFITS REALIZED BY THE ADVISER |
| | The Trustees considered the cost of services and the structure of the Adviser’s fees, including a review of the expense analyses and other pertinent material with respect to the Funds. The Trustees reviewed the related statistical information and other materials provided, including the comparative expenses and Barrington Cohort comparisons. The Trustees considered the cost structure of each Fund relative to its Barrington Cohort and the Adviser’s separately-managed accounts, as well as any applicable fee waivers and expense reimbursements of the Adviser. |
| | |
| | The Trustees also considered the overall profitability of the Adviser and reviewed the Adviser’s financial information, noting that the Adviser had provided subsidies for each Fund’s operations beginning with each Fund’s inception and had not fully recouped those subsidies for the Performance Trust Credit Fund. The Trustees also examined the level of profits that could be expected to accrue to the Adviser from the fees payable under the Advisory Agreement and the expense subsidizations undertaken by the Adviser with respect to the Performance Trust Credit Fund, as well as the Funds’ brokerage practices, noting that the Adviser makes no effort to seek soft dollar arrangements. These considerations were based on materials requested by the Trustees and the Funds’ administrator specifically for the June 13, 2022 meeting and the August 26, 2022 meeting at which the Advisory Agreement was formally considered, as well as the reports prepared by the Adviser over the course of the year. |
| | |
| | The Trustees noted that the Performance Trust Municipal Bond Fund’s contractual management fee of 0.40% was above the Barrington Cohort average of 0.38%. The Trustees noted that the Performance Trust Municipal Bond Fund was operating below its expense cap of 0.55% for Institutional Class shares. The Trustees observed that the Performance Trust Municipal Bond Fund’s total expense ratio of 0.50% for Institutional Class shares was above the Barrington Cohort average of 0.46%. The Trustees also compared the fees paid by the Performance Trust Municipal Bond Fund to the fees paid by separately-managed accounts of the Adviser. |
| | |
| | The Trustees noted that the Performance Trust Strategic Bond Fund’s contractual management fee of 0.60% was above the Barrington Cohort average of 0.51%. The Trustees noted that the Performance Trust Strategic Bond Fund was operating below its expense cap of 1.20% (including Rule 12b-1 plan fees) for Class A shares. The Trustees observed that the Performance Trust Strategic Bond Fund’s total expense ratio (including Rule 12b-1 plan fees) of 1.01% for Class A shares was above the Barrington Cohort average of 0.91%. The Trustees also compared the fees paid by the Performance Trust Strategic Bond Fund to the fees paid by separately-managed accounts of the Adviser. |
| | |
| | The Trustees noted that the Performance Trust Credit Fund’s contractual management fee of 0.80% was above the Barrington Cohort average of 0.55%. The Trustees noted that the Performance Trust Credit Fund was operating above its expense cap of 0.99% for Institutional Class shares. The Trustees observed that the Performance Trust Credit Fund’s total expense ratio (net of fee waivers and expense reimbursements) of 0.99% for Institutional Class shares was above the Barrington Cohort average of 0.71%. The Trustees also compared the fees paid by the Performance Trust Credit Fund to the fees paid by separately-managed accounts of the Adviser. |
| | |
| | The Trustees concluded that the Funds’ expenses and the management fees paid to the Adviser were fair and reasonable in light of the comparative performance, expense and management fee information. The Trustees further concluded, based on a profitability analysis prepared by the Adviser, that the Adviser’s profits from sponsoring the Performance Trust Strategic Bond Fund and Performance Trust Municipal Bond Fund were not excessive, and while the Performance Trust Credit Fund was not yet profitable to the Adviser, the Adviser maintained adequate profit levels to support the services to the Funds from the revenues of its overall investment advisory business, despite its subsidies to support the operations of the Performance Trust Credit Fund. |
| | |
| 4. | EXTENT OF ECONOMIES OF SCALE AS THE FUNDS GROW |
| | The Trustees compared each Fund’s expenses relative to its peer group and discussed realized and potential economies of scale. The Trustees also reviewed the structure of each |
PERFORMANCE TRUST MUTUAL FUNDS (PTIAX, PTAOX, PTCOX, PTIMX, PTRMX, PTCRX)
| | Fund’s management fee and whether each Fund was large enough to generate economies of scale for shareholders or whether economies of scale would be expected to be realized as Fund assets grow (and if so, how those economies of scale were being or would be shared with shareholders). The Trustees reviewed all fee waivers, expense reimbursements and potential recoupments by the Adviser with respect to the Performance Trust Credit Fund. The Trustees noted that the Funds’ management fee structures did not contain any breakpoint reductions as the Funds’ assets grow in size, but that the feasibility of incorporating breakpoints would continue to be reviewed on a regular basis. With respect to the Adviser’s fee structures, the Trustees concluded that the current fee structures were reasonable and reflected a sharing of economies of scale between the Adviser and each Fund at the Fund’s current asset level. |
| | |
| 5. | BENEFITS DERIVED FROM THE RELATIONSHIP WITH THE FUNDS |
| | The Trustees considered the direct and indirect benefits that could be received by the Adviser from its association with the Funds. The Trustees examined the brokerage practices of the Adviser with respect to the Funds. The Trustees noted that the Adviser receives no soft dollar benefits with respect to its management of the Funds. The Trustees concluded that the benefits the Adviser may receive, such as greater name recognition and increased ability to attract additional investor assets, appear to be reasonable, and in many cases may benefit the Funds. |
CONCLUSIONS
The Trustees considered all of the foregoing factors. In considering the renewal of the Advisory Agreement, the Trustees did not identify any one factor as all-important, but rather considered these factors collectively in light of each Fund’s surrounding circumstances. Based on this review, the Trustees, including a majority of the Independent Trustees, approved the continuation of the Advisory Agreement for an additional one-year term ending August 31, 2023 as being in the best interests of each Fund and its shareholders.
PERFORMANCE TRUST MUTUAL FUNDS (PTIAX, PTAOX, PTCOX, PTIMX, PTRMX, PTCRX)
ADDITIONAL INFORMATION
(Unaudited)
Tax Information
For the year ended August 31, 2022, taxable ordinary income distributions are designed as short-term capital gain distributions under Section 871(k)(2)(c) of the Code for the Funds as follows:
Strategic Bond Fund | 2.64% |
Municipal Bond Fund | 0.00% |
Credit Fund | 2.75% |
Availability of Proxy Voting Information
The Funds have adopted proxy voting policies and procedures that delegate to the Adviser the authority to vote proxies. A description of the Funds’ proxy voting policies and procedures is available without charge, upon request, by calling the Funds toll free at 1 (877) 738-9095. A description of these policies and procedures is also included in the Funds’ Statement of Additional Information, which is available on the SEC’s website at http://www.sec.gov.
The Funds’ proxy voting record for the most recent 12-month period ended June 30 is available without charge, upon request, by calling toll free, 1 (877) 738-9095, or by accessing the SEC’s website at http://www.sec.gov.
Portfolio Holdings
The Funds file a complete schedule of portfolio holdings with the U.S. Securities and Exchange Commission (the “SEC”) for the first and third quarters of each fiscal year on Part F of Form N-PORT. The Funds’ Form N-PORT filings are available on the SEC’s website at www.sec.gov.
Householding
In an effort to decrease costs, the Funds intend to reduce the number of duplicate prospectuses and certain other shareholder documents you receive by sending only one copy of each to those addresses shared by two or more accounts and to shareholders the Funds reasonably believe are from the same family or household. Once implemented, if you would like to discontinue householding for your accounts, please call toll-free at 1 (877) 738-9095 to request individual copies of these documents. Once the Funds receive notice to stop householding, the Funds will begin sending individual copies 30 days after receiving your request. This policy does not apply to account statements.
Forward Looking Statements
Except for historical information contained in this report for the Funds, the matters discussed in this report may constitute forward-looking statements made pursuant to the safe-harbor provisions of the Private Securities Litigation Reform Act of 1995. These include any Adviser or portfolio manager predictions, assessments, analyses or outlooks for individual securities, industries, market sectors and/or markets. These statements involve risks and uncertainties. In addition to the general risks described for the Funds in the most recent prospectus, other factors bearing on this report include the accuracy of the Adviser’s or portfolio manager’s data, forecasts and predictions, and the appropriateness of the investment programs designed by the Adviser or portfolio manager to implement their strategies efficiently and effectively. Any one or more of these factors, as well as other risks affecting the securities markets and investment instruments generally, could cause the actual results of the Funds to differ materially as compared to benchmarks associated with the Funds.
Indemnification
Under the Trust’s organizational documents, its officers and Trustees are indemnified against certain liabilities arising out of the performance of their duties to the Funds. In addition, in the normal course of business, the Funds enter into contracts that provide general indemnification to other parties. The Funds’ maximum exposure under these arrangements is unknown as this would involve future claims that may be made against the Funds that have not yet occurred. However, the Funds have not had prior claims or losses pursuant to these contracts and expect the risk of loss to be remote.
Information About Trustees
The business and affairs of the Trust are managed under the direction of the Trust’s Board of Trustees. Information pertaining to the Trustees of the Trust is set forth below. The Funds’ Statement of Additional Information includes additional information about the Trustees and is available, without charge, upon request by calling 1 (877) 738-9095.
PERFORMANCE TRUST MUTUAL FUNDS (PTIAX, PTAOX, PTCOX, PTIMX, PTRMX, PTCRX)
INDEPENDENT TRUSTEES
(Unaudited)
| | | | NUMBER OF | | OTHER |
| | | | PORTFOLIOS | PRINCIPAL | DIRECTORSHIPS |
| NAME, | POSITION(S) | TERM OF OFFICE | IN THE TRUST | OCCUPATION(S) | HELD BY TRUSTEE |
| ADDRESS, AND | HELD WITH | AND LENGTH OF | OVERSEEN BY | DURING THE | DURING THE PAST |
| YEAR OF BIRTH | THE TRUST | TIME SERVED | THE TRUSTEE | PAST FIVE YEARS | FIVE YEARS |
| Independent Trustees | | | | | |
| | | | | | |
Michael D. Akers, Ph.D. | Trustee | Indefinite Term; | 22 | Professor Emeritus, | Independent |
615 E. Michigan St. | | Since August 22, | | Department of Accounting | Trustee, USA |
Milwaukee, WI 53202 | | 2001 | | (June 2019-present), | MUTUALS |
Year of Birth: 1955 | | | | Professor, Department of | (an open-end |
| | | | | Accounting (2004-2019), | investment |
| | | | | Chair, Department of | company) |
| | | | | Accounting (2004-2017), | (2001-2021). |
| | | | | Marquette University. | |
| | | | | | |
Gary A. Drska | Trustee | Indefinite Term; | 22 | Retired; Pilot, | Independent |
615 E. Michigan St. | | Since August 22, | | Frontier/Midwest Airlines, | Trustee, USA |
Milwaukee, WI 53202 | | 2001 | | Inc. (airline company) | MUTUALS |
Year of Birth: 1956 | | | | (1986-2021). | (an open-end |
| | | | | | investment |
| | | | | | company) |
| | | | | | (2001-2021). |
| | | | | | |
Vincent P. Lyles | Trustee | Indefinite Term; | 22 | System Vice President | Independent |
615 E. Michigan St. | | Since April 6, | | of Community Relations, | Director, BMO |
Milwaukee, WI 53202 | | 2022 | | Advocate Aurora Health | Funds, Inc. |
Year of Birth: 1961 | | | | Care (health care provider) | (an open-end |
| | | | | (2019-present); President | investment |
| | | | | and Chief Executive Officer, | company) |
| | | | | Boys & Girls Club of Greater | (2017-2022). |
| | | | | Milwaukee (2012-2018). | |
| | | | | | |
Erik K. Olstein | Trustee | Indefinite Term; | 22 | Retired; President and | Trustee, The Olstein |
615 E. Michigan St. | | Since April 6, | | Chief Operating Officer | Funds (an open-end |
Milwaukee, WI 53202 | | 2022 | | (2000-2020), Vice | investment |
Year of Birth: 1967 | | | | President of Sales and | company) |
| | | | | Chief Operating Officer | (1995-2018). |
| | | | | (1995-2000), Olstein Capital | |
| | | | | Management, L.P. (asset | |
| | | | | management firm); Secretary | |
| | | | | and Assistant Treasurer, | |
| | | | | The Olstein Funds | |
| | | | | (1995-2018). | |
| | | | | | |
Lisa Zúñiga Ramírez | Trustee | Indefinite Term; | 22 | Retired; Principal and | N/A |
615 E. Michigan St. | | Since April 6, | | Senior Portfolio Manager, | |
Milwaukee, WI 53202 | | 2022 | | Segall, Bryant & Hamill, LLC | |
Year of Birth: 1969 | | | | (asset management firm) | |
| | | | | (2018-2020); Partner and | |
| | | | | Senior Portfolio Manager, | |
| | | | | Denver Investments LLC | |
| | | | | (asset management firm) | |
| | | | | (2009-2018). | |
| | | | | | |
Gregory M. Wesley | Trustee | Indefinite Term; | 22 | Senior Vice President of | N/A |
615 E. Michigan St. | | Since April 6, | | Strategic Alliances and | |
Milwaukee, WI 53202 | | 2022 | | Business Development, | |
Year of Birth: 1969 | | | | Medical College of Wisconsin | |
| | | | | (2016-present). | |
PERFORMANCE TRUST MUTUAL FUNDS (PTIAX, PTAOX, PTCOX, PTIMX, PTRMX, PTCRX)
INTERESTED TRUSTEE AND OFFICERS
(Unaudited)
| | | | NUMBER OF | | OTHER |
| | | | PORTFOLIOS | PRINCIPAL | DIRECTORSHIPS |
| NAME, | POSITION(S) | TERM OF OFFICE | IN THE TRUST | OCCUPATION(S) | HELD BY TRUSTEE |
| ADDRESS, AND | HELD WITH | AND LENGTH OF | OVERSEEN BY | DURING THE | DURING THE PAST |
| YEAR OF BIRTH | THE TRUST | TIME SERVED | THE TRUSTEE | PAST FIVE YEARS | FIVE YEARS |
| Interested Trustee and Officers | | | | | |
| | | | | | |
Joseph C. Neuberger* | Chairperson | Indefinite Term; | 22 | President (2017-present), | Trustee, Buffalo |
615 E. Michigan St. | and Trustee | Since August 22, | | Chief Operating Officer | Funds (an open-end |
Milwaukee, WI 53202 | | 2001 | | (2016-2020), Executive | investment |
Year of Birth: 1962 | | | | Vice President (1994-2017), | company) (2003- |
| | | | | U.S. Bancorp Fund | 2017); Trustee, |
| | | | | Services, LLC. | USA MUTUALS |
| | | | | | (an open-end |
| | | | | | investment |
| | | | | | company) |
| | | | | | (2001-2018). |
| | | | | | |
John P. Buckel | President | Indefinite Term; | N/A | Vice President,U.S. Bancorp | N/A |
615 E. Michigan St. | and Principal | Since January 24, | | Fund Services, LLC | |
Milwaukee, WI 53202 | Executive | 2013 | | (2004-present). | |
Year of Birth: 1957 | Officer | | | | |
| | | | | | |
Jennifer A. Lima | Vice | Indefinite Term; | N/A | Vice President, U.S. Bancorp | N/A |
615 E. Michigan St. | President, | Since January 24, | | Fund Services, LLC | |
Milwaukee, WI 53202 | Treasurer | 2013 | | (2002-present). | |
Year of Birth: 1974 | and Principal | | | | |
| | Financial and | | | | |
| | Accounting | | | | |
| | Officer | | | | |
| | | | | | |
Deanna B. Marotz | Chief | Indefinite Term; | N/A | Senior Vice President, | N/A |
615 E. Michigan St. | Compliance | Since October 21, | | U.S. Bancorp Fund Services, | |
Milwaukee, WI 53202 | Officer, Vice | 2021 | | LLC (2021-present); Chief | |
Year of Birth: 1965 | President | | | Compliance Officer of | |
| | and Anti- | | | Keeley-Teton Advisors, LLC | |
| | Money | | | and Teton Advisors, Inc. | |
| | Laundering | | | (2017-2021); Chief | |
| | Officer | | | Compliance Officer of | |
| | | | | Keeley Asset Management | |
| | | | | Corp. (2015-2017). | |
| | | | | | |
Jay S. Fitton | Secretary | Indefinite Term; | N/A | Assistant Vice President, | N/A |
615 E. Michigan St. | | Since July 22, | | U.S. Bancorp Fund | |
Milwaukee, WI 53202 | | 2019 | | Services, LLC | |
Year of Birth: 1970 | | | | (2019-present); Partner, | |
| | | | | Practus, LLP (2018-2019); | |
| | | | | Counsel, Drinker Biddle & | |
| | | | | Reath (2016-2018). | |
| * | Mr. Neuberger is deemed to be an “interested person” of the Trust as defined by the 1940 Act due to his position and material business relationship with the Trust. |
PERFORMANCE TRUST MUTUAL FUNDS (PTIAX, PTAOX, PTCOX, PTIMX, PTRMX, PTCRX)
INTERESTED TRUSTEE AND OFFICERS
(Unaudited)
| | | | NUMBER OF | | OTHER |
| | | | PORTFOLIOS | PRINCIPAL | DIRECTORSHIPS |
| NAME, | POSITION(S) | TERM OF OFFICE | IN THE TRUST | OCCUPATION(S) | HELD BY TRUSTEE |
| ADDRESS, AND | HELD WITH | AND LENGTH OF | OVERSEEN BY | DURING THE | DURING THE PAST |
| YEAR OF BIRTH | THE TRUST | TIME SERVED | THE TRUSTEE | PAST FIVE YEARS | FIVE YEARS |
| Officers | | | | | |
| | | | | | |
Kelly A. Strauss | Assistant | Indefinite Term; | N/A | Assistant Vice President, | N/A |
615 E. Michigan St. | Treasurer | Since April 23, | | U.S. Bancorp Fund | |
Milwaukee, WI 53202 | | 2015 | | Services, LLC | |
Year of Birth: 1987 | | | | (2011-present). | |
| | | | | | |
| | | | | | |
Shannon Coyle | Assistant | Indefinite Term; | N/A | Officer, U.S. Bancorp | N/A |
615 E. Michigan St. | Treasurer | Since August 26, | | Fund Services, LLC | |
Milwaukee, WI 53202 | | 2022 | | (2015-present). | |
Year of Birth: 1990 | | | | | |
| | | | | | |
Laura A. Carroll | Assistant | Indefinite Term; | N/A | Assistant Vice President, | N/A |
615 E. Michigan St. | Treasurer | Since August 20, | | U.S. Bancorp Fund | |
Milwaukee, WI 53202 | | 2018 | | Services, LLC | |
Year of Birth: 1985 | | | | (2007-present). | |
| | | | | | |
PERFORMANCE TRUST MUTUAL FUNDS (PTIAX, PTAOX, PTCOX, PTIMX, PTRMX, PTCRX)
Investment Adviser
PT Asset Management, LLC
500 West Madison, Suite 470
Chicago, IL 60661
888.282.3220
www.PTAM.com
Fund Administrator, Transfer Agent,
and Fund Accountant
U.S. Bancorp Fund Services, LLC
615 East Michigan Street
Milwaukee, WI 53202
Custodian
U.S. Bank, N.A.
Custody Operations
1555 North RiverCenter Drive, Suite 302
Milwaukee, WI 53212
Legal Counsel
Godfrey & Kahn, S.C.
833 East Michigan Street, Suite 1800
Milwaukee, WI 53202
Independent Registered
Public Accounting Firm
Cohen & Company, Ltd.
342 North Water Street, Suite 830
Milwaukee, WI 53202
Distributor
Foreside Fund Services, LLC
3 Canal Plaza, Suite 100
Portland, ME 04101
This report has been prepared for shareholders
and may be distributed to others only if preceded
or accompanied by a current prospectus.
The Performance Trust Mutual Funds are distributed
by Foreside Fund Services, LLC

Item 2. Code of Ethics.
The registrant has adopted a code of ethics that applies to the registrant’s principal executive officer and principal financial officer. The registrant has not made any amendments to its code of ethics during the period covered by this report. The registrant has not granted any waivers from any provisions of the code of ethics during the period covered by this report. A copy of the registrant’s Code of Ethics is incorporated by reference to the Registrant’s Form N-CSR filed on November 7, 2011.
Item 3. Audit Committee Financial Expert.
The registrant’s board of trustees has determined that there is at least one audit committee financial expert serving on its audit committee. Dr. Michael Akers is the “audit committee financial expert” and is considered to be “independent” as each term is defined in Item 3 of Form N‑CSR. Dr. Akers holds a Ph.D. in accountancy and is a professor Emeritus of accounting at Marquette University in Milwaukee, Wisconsin.
Item 4. Principal Accountant Fees and Services.
The registrant has engaged its principal accountant to perform audit services, audit-related services, tax services and other services during the past two fiscal years. “Audit services” refer to performing an audit of the registrant's annual financial statements or services that are normally provided by the accountant in connection with statutory and regulatory filings or engagements for those fiscal years. “Audit-related services” refer to the assurance and related services by the principal accountant that are reasonably related to the performance of the audit. “Tax services” refer to professional services rendered by the principal accountant for tax compliance, tax advice, and tax planning. The following table details the aggregate fees billed or expected to be billed for each of the last two fiscal years for audit fees, audit-related fees, tax fees and other fees by the principal accountant.
| | FYE 8/31/2022 | FYE 8/31/2021 |
Audit Fees | $73,500 | $73,500 |
Audit-Related Fees | 0 | 0 |
Tax Fees | 9,000 | 9,000 |
All Other Fees | 0 | 0 |
(e)(1) The audit committee has adopted pre-approval policies and procedures that require the audit committee to pre‑approve all audit and non‑audit services of the registrant, including services provided to any entity affiliated with the registrant.
(e)(2)The percentage of fees billed by Cohen & Company, Ltd. applicable to non-audit services pursuant to waiver of pre-approval requirement were as follows:
| | FYE 8/31/2022 | FYE 8/31/2021 |
Audit-Related Fees | 0% | 0% |
Tax Fees | 0% | 0% |
All Other Fees | 0% | 0% |
(f)All of the principal accountant’s hours spent on auditing the registrant’s financial statements were attributed to work performed by full‑time permanent employees of the principal accountant.
(g)The following table indicates the non-audit fees billed or expected to be billed by the registrant’s accountant for services to the registrant and to the registrant’s investment adviser (and any other controlling entity, etc.—not sub-adviser) for the last two years. The audit committee of the board of trustees/directors has considered whether the provision of non-audit services that were rendered to the registrant's investment adviser is compatible with maintaining the principal accountant's independence and has concluded that the provision of such non-audit services by the accountant has not compromised the accountant’s independence.
Non-Audit Related Fees | FYE 8/31/2022 | FYE 8/31/2021 |
Registrant | $0 | $0 |
Registrant’s Investment Adviser | $0 | $4,413 |
(h) The audit committee of the board of trustees/directors has considered whether the provision of non-audit services that were rendered to the registrant's investment adviser is compatible with maintaining the principal accountant's independence and has concluded that the provision of such non-audit services by the accountant has not compromised the accountant’s independence.
(i) Not applicable.
(j) Not applicable.
Item 5. Audit Committee of Listed Registrants.
Not applicable to registrants who are not listed issuers (as defined in Rule 10A-3 under the Securities Exchange Act of 1934).
Item 6. Investments.
| (a) | Schedule of Investments is included as part of the report to shareholders filed under Item 1 of this Form. |
Item 7. Disclosure of Proxy Voting Policies and Procedures for Closed-End Management Investment Companies.
Not applicable to open-end investment companies.
Item 8. Portfolio Managers of Closed-End Management Investment Companies.
Not applicable to open-end investment companies.
Item 9. Purchases of Equity Securities by Closed‑End Management Investment Company and Affiliated Purchasers.
Not applicable to open-end investment companies.
Item 10. Submission of Matters to a Vote of Security Holders.
There have been no material changes to the procedures by which shareholders may recommend nominees to the registrant’s board of trustees.
Item 11. Controls and Procedures.
| (a) | The Registrant’s President and Treasurer have reviewed the Registrant's disclosure controls and procedures (as defined in Rule 30a-3(c) under the Investment Company Act of 1940 (the “Act”)) as of a date within 90 days of the filing of this report, as required by Rule 30a-3(b) under the Act and Rules 13a-15(b) or 15d‑15(b) under the Securities Exchange Act of 1934. Based on their review, such officers have concluded that the disclosure controls and procedures are effective in ensuring that information required to be disclosed in this report is appropriately recorded, processed, summarized and reported and made known to them by others within the Registrant and by the Registrant’s service provider. |
| (b) | There were no changes in the Registrant's internal control over financial reporting (as defined in Rule 30a-3(d) under the Act) that occurred during the period covered by this report that has materially affected, or is reasonably likely to materially affect, the Registrant's internal control over financial reporting. |
Item 12. Disclosure of Securities Lending Activities for Closed-End Management Investment Companies
Not applicable to open-end investment companies.
Item 13. Exhibits.
(3) Any written solicitation to purchase securities under Rule 23c‑1 under the Act sent or given during the period covered by the report by or on behalf of the registrant to 10 or more persons. Not applicable to open-end investment companies.
(4) Change in the registrant’s independent public accountant. There was no change in the registrant’s independent public accountant for the period covered by this report.
SIGNATURES
Pursuant to the requirements of the Securities Exchange Act of 1934 and the Investment Company Act of 1940, the registrant has duly caused this report to be signed on its behalf by the undersigned, thereunto duly authorized.
(Registrant) Trust for Professional Managers
By (Signature and Title)* /s/ John Buckel
John Buckel, President
Date 10/31/2022
Pursuant to the requirements of the Securities Exchange Act of 1934 and the Investment Company Act of 1940, this report has been signed below by the following persons on behalf of the registrant and in the capacities and on the dates indicated.
By (Signature and Title)* /s/ John Buckel
John Buckel, President
Date 10/31/2022
By (Signature and Title)* /s/ Jennifer Lima
Jennifer Lima, Treasurer
Date 10/31/2022
* Print the name and title of each signing officer under his or her signature.