BARRETT GROWTH FUND
Annual Report
May 31, 2022
BARRETT
GROWTH FUND
| | |
| Letter to | Dear Shareholders, |
| Shareholders | |
| May 31, 2022 | The Twelve-Month Period in Review |
| | |
| | Against a backdrop of stubbornly high inflation, geopolitical warfare, rising interest rates and growing fears that the U.S. will slip into a recession, domestic stocks (using the S&P 500 Index as a proxy) suffered a major setback at the start of 2022. |
| | |
| | Year-to-date, as of May 31, 2022, the above index declined 12.79%. Considering last year’s strong performance, the benchmark produced flat results of -0.30% when measured over a twelve-month period ending in May. To put this into perspective, the latest drawdown of stocks represents one of the worst starts to the year in nearly half a century. |
| | |
| | Inflation is proving stickier than originally anticipated. The impact from rapidly rising prices has become very real for the average American, who is now paying about $4.90 per gallon of gasoline and witnessing an annual 8.6% surge in prices for everyday goods and services. This ‘double whammy’ – inflated expenses coupled with a steep decline in stock prices – has left many Americans concerned that they will soon fall behind. |
| | |
| | In assessing the macro risks above, we believe the crux of today’s market uncertainty centers around inflation spiking with seemingly no end in sight. World events such as Russia’s conflict with Ukraine have exacerbated the situation since both countries are now supplying fewer key commodities into the Western world. Additionally, China’s decision to fully lock down key cities has created another speedbump within the global manufacturing process. Accordingly, investors are looking for signs of peak inflation, which will influence the Federal Reserve’s (Fed) policy as well as future growth of our economy. Until then we should expect market volatility to stay elevated. As it relates to peak inflation, it is important to note that the level and volatility of inflation are critical. To be clear, inflation needs to peak and subside meaningfully before investors are willing to reward stocks again. The pace of moderation won’t be a straight line and we should anticipate inflation metrics to ebb and flow in the coming quarters. |
| | |
| | The Fed has turned more aggressive in recent months to fight inflation. The Central Bank has few tools to improve supply chain issues, but it does have several options to manipulate consumer demand and, indirectly, final prices of goods and services. We should expect Chairman Jerome Powell to steer rates higher until inflation data clearly shows a downtrend. Some economists have argued that the Fed often ‘works with a lag’ and will eventually push the U.S. economy into a recession. We do not deny this risk and acknowledge the increasing probability of an economic contraction next year. However, we are encouraged by the strength of consumers and corporations as well as the robustness of the labor market. In fact, according to Pantheon Macroeconomics, U.S. households and corporations are sitting on approximately $4 trillion of excess cash, representing about 17% U.S. Gross Domestic Product (GDP). Further, stock market history tells us that strong labor markets and recessions are an unusual pairing. All in all, the data remains conflicting on the topic of recession, and we continue to watch for |
BARRETT
GROWTH FUND
| | red flags. We also are in the camp that even if a recession were to transpire it will likely not resemble what we experienced during the 2009 Great Financial Crisis. The reason for this is simple: U.S. banks have been stress tested for the past decade and remain in good shape. These financial centers have sufficient capital to manage through a serious downturn. Ultimately, recessions are not welcome, but sometimes they are a by-product of aggressive monetary policy. |
| | |
| | Investment Outlook |
| | |
| | Eventually, we expect slowing growth to start to reduce pressure on global inflation, but this could take another few quarters. Powell has warned the path towards equilibrium won’t be easy or straight forward. The recent market slump has been a “Fed-driven” setback thus it will take appropriate Fed action to reverse the damage. An interesting observation is that capital markets have somewhat tightened solely based on the expectation of higher rates. The national average for mortgage rates approaching 6% (against a backdrop of three actual rate hikes so far) is a good example of this phenomenon. Said differently, it is possible the Fed could slow down its pace of rate hikes if the economy can achieve price stabilization on its own. |
| | |
| | Our discipline remains to find investments that can produce positive ‘inflation-adjusted’ returns. Stocks are still attractive over the long run but we are more selective than ever before. We are keen on companies that: |
| | 1) | can outright benefit from rising interest rates, |
| | 2) | can pass on higher expenses to its customers (i.e. pricing power) |
| | 3) | have the flexibility to spend less when needed (i.e. asset light models), and/or |
| | 4) | are altering their capital allocation strategies (dividends, buy backs, spin-offs, mergers & acquisitions) to manage margins and earnings growth through time. |
| | Performance |
| | |
| | The Barrett Growth Fund (the “Fund”) generated a total return of -7.25% for the twelve-month fiscal period ended May 31, 2022. In contrast, the S&P 500 Index declined -0.30%. The Lipper Large-Cap Growth Fund Index depreciated -14.30% during the same time period. |
| | |
| | For the quarter ended May 31, 2022, the Fund returned -7.61% versus the S&P 500 Index benchmark down -5.20% and the Lipper Large Cap Growth Fund Index down -12.79%. |
| | |
| | The Fund has an emphasis on growth-oriented companies, which are more apparent in technology, consumer discretionary and communication services sectors. There is also an underweight of energy stocks in the Fund’s portfolio. Accordingly, the Fund lagged the S&P 500 Index in the past year considering investor preference has leaned toward oil stocks and less on technology plays. However, the Fund does have exposure to certain defensive sectors, such as healthcare, which partially offset the underperformance from tech. |
| | |
| | Portfolio |
| | |
| | We continue to rebalance the Fund’s holdings in a post-COVID-19, and now higher inflation world. To this point, we trimmed several higher growth tech names such as |
BARRETT
GROWTH FUND
| | Microsoft, Alphabet and Apple over the past year. Proceeds were deployed into companies that should benefit from rising interest rates and/or have the flexibility to pass on higher costs to its end customers. Specifically, we increased our exposure to existing positions Ares Management and Sysco. We also initiated positions in Crown Castle, a leading player in the cell tower industry, and BlackRock, a global asset management firm with clear leadership in the exchange traded funds business. The above names all have higher than average dividend yields, which we think is attractive in today’s market. |
| | |
| | In our opinion, the Fund consists of high-quality names. There is reasonable diversification across sectors and geographies. Compared to the S&P 500 Index, the Fund was relatively overweight in the following areas: information technology, healthcare, and consumer discretionary. Conversely, the Fund’s portfolio was underweight financials, consumer staples and energy. |
| | |
| | Thank you for your continued interest in the Barrett Growth Fund. |
| |  |  |
| | | |
| | Amy Kong | E. Wells Beck, CFA |
| | Portfolio Manager | Portfolio Manager |
| | The outlook, views, and opinions presented are those of the Adviser as of 05/31/2022. These are not intended to be a forecast of future events, a guarantee of future results, or investment advice. |
| | |
| | Past performance does not guarantee future results. |
| | |
| | Earnings growth is not representative of the Fund’s future performance. |
| | |
| | Price-to-earnings ratio is the ratio for valuing a company that measures its current share price relative to its per-share earnings. |
| | |
| | Must be preceded or accompanied by a prospectus. |
| | |
| | Mutual fund investing involves risk. Principal loss is possible. Foreign investments are subject to special risks not ordinarily associated with U.S. securities including currency fluctuations and social, economic and political uncertainties, which could increase volatility. These risks are magnified in emerging markets. The Fund may also invest in derivatives, such as options and futures, which can be illiquid, may disproportionately increase losses, and have a potentially large impact on Fund performance. |
| | |
| | The S&P 500 Index is a capitalization-weighted index of five hundred large capitalization stocks, which is designed to measure broad domestic securities markets. The performance of the S&P 500 Index reflects the reinvestment of dividends and capital gains, but does not reflect the deduction of any investment advisory fees. The Lipper Large-Cap Growth Fund Index is an equally-weighted performance index, adjusted for capital gains distributions and income dividends, of the 30 largest mutual funds within the Lipper Growth Funds category. An index is unmanaged. Investors cannot invest directly in an index. |
| | |
| | Fund holdings and sector allocations are subject to change and should not be considered a recommendation to buy or sell any security. For a complete list of portfolio holdings, please refer to the Schedule of Investments provided in this report. |
| | |
| | The Barrett Growth Fund is distributed by Quasar Distributors, LLC. |
BARRETT
GROWTH FUND
Fund at a Glance (Unaudited)
Top Ten Holdings – as of 5/31/2022
(Percent of Net Assets)*
| | Microsoft Corp. | | | 5.47 | % |
| | Visa, Inc. - Class A | | | 5.23 | % |
| | Apple, Inc. | | | 4.58 | % |
| | Alphabet, Inc. - Class C | | | 4.27 | % |
| | Amazon.com, Inc. | | | 4.26 | % |
| | NVIDIA Corp. | | | 4.05 | % |
| | Costco Wholesale Corp. | | | 3.72 | % |
| | Accenture PLC - Class A | | | 3.53 | % |
| | Tetra Tech, Inc. | | | 3.41 | % |
| | Progressive Corp. | | | 3.06 | % |
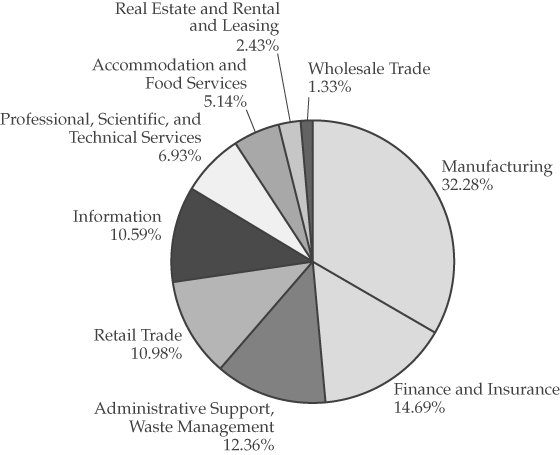
Sector Weightings – as of 5/31/2022
(Percent of Total Investments)*
* Portfolio characteristics are as of May 31, 2022, and are subject to change at any time.
BARRETT
GROWTH FUND
Expense Example – May 31, 2022 (Unaudited)
As a shareholder of the Fund, you incur ongoing costs, including: investment advisory fees; distribution and service (12b-1) fees; and other Fund expenses. This example is intended to help you understand your ongoing costs (in dollars) of investing in the Fund and to compare these costs with the ongoing costs of investing in other mutual funds.
The example is based on an investment of $1,000 invested at the beginning of the period and held for the entire six-month period (December 1, 2021 – May 31, 2022).
Actual Expenses
The first line of the table below provides information about actual account values and actual expenses. However, the table does not include shareholder specific fees such as the $15.00 fee charged for wire redemptions. The table also does not include portfolio trading commissions and related trading costs, which are included in the Fund’s net asset value. You may use the information in this line, together with the amount you invested, to estimate the expenses that you paid over the period. Simply divide your account value by $1,000 (for example, an $8,600 account value divided by $1,000 = 8.6), then multiply the result by the number in the first line under the heading entitled “Expenses Paid During the Period” to estimate the expenses you paid on your account during this period.
Hypothetical Example for Comparison Purposes
The second line of the table below provides information about hypothetical account values and hypothetical expenses based on the Fund’s actual net expense ratio and an assumed rate of return of 5% per year before expenses, which is not the Fund’s actual return. The hypothetical account values and expenses may not be used to estimate the actual ending account balance or expenses you paid for the period. You may use this information to compare the ongoing costs of investing in the Fund with other funds. To do so, compare this 5% hypothetical example with the 5% hypothetical examples that appear in the shareholder reports of the other funds.
Please note that the expenses shown in the table are meant to highlight your ongoing costs only and do not reflect any transactional costs, such as sales charges (loads), redemption fees, or exchange fees, which, although not charged by the Fund, may be charged by other funds. Therefore, the second line of the table is useful in comparing ongoing costs only, and will not help you determine the relative costs of owning different funds.
| | | | Expenses Paid |
| | Beginning | Ending | During the Period* |
| | Account Value | Account Value | December 1, 2021 to |
| | December 1, 2021 | May 31, 2022 | May 31, 2022 |
Actual | $1,000.00 | $ 837.40 | $5.18 |
Hypothetical | | | |
(5% return before expenses) | $1,000.00 | $1,019.30 | $5.69 |
* | Expenses are equal to the Fund’s annualized expense ratio of 1.13% (which reflects the effect of the Adviser’s fee waiver and expense limitation agreement), multiplied by the average account value over the period, multiplied by 182/365 (to reflect the one-half year period). |
BARRETT
GROWTH FUND
(Unaudited)
This chart assumes an initial gross investment of $10,000 made on May 31, 2012.
The S&P 500® Index is a capitalization-weighted index of five hundred large capitalization stocks, which is designed to measure broad domestic securities markets.
The Lipper Large-Cap Growth Funds Index® (“Lipper”) is an equally-weighted performance index, adjusted for capital gains distributions and income dividends, of the 30 largest mutual funds within the Lipper Growth Funds category.
| | | Average Annual Total Returns as of May 31, 2022 |
| | | | | | |
| | | One Year | Three Year | Five Year | Ten Year |
–●– | Barrett Growth Fund | -7.25% | 13.90% | 13.01% | 12.83% |
--■-- | S&P 500® Index | -0.30% | 16.44% | 13.38% | 14.40% |
| –◆– | Lipper Large-Cap | | | | |
| | Growth Funds Index® | -14.30% | 14.40% | 13.78% | 14.38% |
RETURNS SHOWN INCLUDE THE REINVESTMENT OF ALL DIVIDENDS AND DISTRIBUTIONS. RETURNS SHOWN DO NOT REFLECT THE DEDUCTION OF TAXES THAT A SHAREHOLDER WOULD PAY ON FUND DISTRIBUTIONS OR THE REDEMPTION OF FUND SHARES. IN THE ABSENCE OF FEE WAIVERS AND REIMBURSEMENTS, TOTAL RETURN WOULD BE REDUCED. PAST PERFORMANCE IS NOT PREDICTIVE OF FUTURE PERFORMANCE. INVESTMENT RETURN AND PRINCIPAL VALUE WILL FLUCTUATE, SO THAT YOUR SHARES, WHEN REDEEMED, MAY BE WORTH MORE OR LESS THAN THEIR ORIGINAL COST.
BARRETT
GROWTH FUND
Schedule of Investments
May 31, 2022
| Shares | | | | Value | |
| | | COMMON STOCKS - 94.39% | | | |
| | | | | | |
| | | Administrative and | | | |
| | | Support Services - 4.67% | | | |
| | 5,750 | | PayPal Holdings, Inc. (a) | | $ | 489,958 | |
| | 8,000 | | TransUnion | | | 694,480 | |
| | | | | | | 1,184,438 | |
| | | | Amusement, Gambling, | | | | |
| | | | and Recreation | | | | |
| | | | Industries - 2.18% | | | | |
| | 5,000 | | The Walt Disney Co. (a) | | | 552,200 | |
| | | | | | | | |
| | | | Chemical | | | | |
| | | | Manufacturing - 8.84% | | | | |
| | 3,000 | | Ecolab, Inc. | | | 491,730 | |
| | 4,000 | | Merck & Co., Inc. | | | 368,120 | |
| | 1,000 | | Regeneron | | | | |
| | | | Pharmaceuticals, Inc. (a) | | | 664,740 | |
| | 4,200 | | Zoetis, Inc. | | | 717,906 | |
| | | | | | | 2,242,496 | |
| | | | Clothing and Clothing | | | | |
| | | | Accessories Stores - 3.01% | | | | |
| | 12,000 | | The TJX Companies, Inc. | | | 762,840 | |
| | | | | | | | |
| | | | Computer and | | | | |
| | | | Electronic Product | | | | |
| | | | Manufacturing - 20.09% | | | | |
| | 475 | | Alphabet, Inc. - Class C (a) | | | 1,083,370 | |
| | 7,800 | | Apple, Inc. | | | 1,160,952 | |
| | 2,750 | | Danaher Corp. | | | 725,505 | |
| | 5,500 | | NVIDIA Corp. | | | 1,026,960 | |
| | 850 | | Roper Technologies, Inc. | | | 376,074 | |
| | 1,275 | | Thermo Fisher Scientific, Inc. | | | 723,652 | |
| | | | | | | 5,096,513 | |
| | | | Credit Intermediation and | | | | |
| | | | Related Activities - 10.74% | | | | |
| | 4,500 | | First Republic Bank | | | 697,635 | |
| | 5,300 | | JPMorgan Chase & Co. | | | 700,819 | |
| | 6,250 | | Visa, Inc. - Class A | | | 1,326,063 | |
| | | | | | | 2,724,517 | |
| | | | Data Processing, | | | | |
| | | | Hosting and | | | | |
| | | | Related Services - 2.47% | | | | |
| | 6,000 | | Fidelity National Information | | | | |
| | | | Services, Inc. | | | 627,000 | |
| | | | | | | | |
| | | | Electrical Equipment, | | | | |
| | | | Appliance, and Component | | | | |
| | | | Manufacturing - 1.07% | | | | |
| | 4,000 | | EnerSys, Inc. | | | 270,880 | |
| | | | | | | | |
| | | | Food Services and | | | | |
| | | | Drinking Places - 5.15% | | | | |
| | 3,000 | | McDonald’s Corp. | | | 756,630 | |
| | 7,000 | | Starbucks Corp. | | | 549,500 | |
| | | | | | | 1,306,130 | |
| | | | General Merchandise | | | | |
| | | | Stores - 3.72% | | | | |
| | 2,025 | | Costco Wholesale Corp. | | | 944,095 | |
| | | | | | | | |
| | | | Insurance Carriers and | | | | |
| | | | Related Activities - 6.00% | | | | |
| | 6,500 | | Progressive Corp. | | | 775,970 | |
| | 1,500 | | UnitedHealth Group, Inc. | | | 745,170 | |
| | | | | | | 1,521,140 | |
The accompanying notes are an integral part of these financial statements.
BARRETT
GROWTH FUND
Schedule of Investments (Cont’d)
May 31, 2022
| Shares | | | | Value | |
| | | | | | |
| | | Merchant Wholesalers, | | | |
| | | Nondurable Goods - 1.33% | | | |
| | 4,000 | | Sysco Corp. | | $ | 336,720 | |
| | | | | | | | |
| | | | Miscellaneous | | | | |
| | | �� | Manufacturing - 2.31% | | | | |
| | 2,500 | | Stryker Corp. | | | 586,250 | |
| | | | | | | | |
| | | | Nonstore Retailers - 4.26% | | | | |
| | 450 | | Amazon, Inc. (a) | | | 1,081,885 | |
| | | | | | | | |
| | | | Professional, Scientific, and | | | | |
| | | | Technical Services - 6.94% | | | | |
| | 3,000 | | Accenture PLC - Class A (b) | | | 895,380 | |
| | 6,400 | | Tetra Tech, Inc. | | | 863,808 | |
| | | | | | | 1,759,188 | |
| | | | | | | | |
| | | | Publishing Industries | | | | |
| | | | (except Internet) - 8.42% | | | | |
| | 1,800 | | Adobe Systems, Inc. (a) | | | 749,664 | |
| | 5,100 | | Microsoft Corp. | | | 1,386,537 | |
| | | | | | | 2,136,201 | |
| | | | | | | | |
| | | | Securities, Commodity | | | | |
| | | | Contracts, and Other | | | | |
| | | | Financial Investments and | | | | |
| | | | Related Activities - 3.19% | | | | |
| | 9,500 | | Ares Management Corp. | | | 676,115 | |
| | 200 | | BlackRock, Inc. | | | 133,816 | |
| | | | | | | 809,931 | |
| | | | Total Common Stocks | | | | |
| | | | (Cost $8,979,341) | | | 23,942,424 | |
| | | | | | | | |
| | | | REAL ESTATE | | | | |
| | | | INVESTMENT | | | | |
| | | | TRUSTS - 2.43% | | | | |
| | | | | | | | |
| | | | Lessors of Real Estate - 2.43% | | | | |
| | 3,250 | | Crown Castle | | | | |
| | | | International Corp. | |
| 616,363 | |
| | | | | | | | |
| | | | Total Real Estate | | | | |
| | | | Investment Trusts | | | | |
| | | | (Cost $589,507) | | | 616,363 | |
| | | | | | | | |
| | | | SHORT-TERM | | | | |
| | | | INVESTMENTS - 3.27% | | | | |
| | | | | | | | |
| | | | Money Market Funds - 3.27% | | | | |
| | 829,476 | | Fidelity Investments | | | | |
| | | | Government Portfolio - | | | | |
| | | | Class I, 0.580% (c) | | | 829,476 | |
| | | | Total Short-Term Investments | | | | |
| | | | (Cost $829,476) | | | 829,476 | |
| | | | Total Investments | | | | |
| | | | (Cost $10,398,324) - 100.09% | | | 25,388,263 | |
| | | | Liabilities in Excess | | | | |
| | | | of Other Assets - (0.09)% | | | (24,034 | ) |
| | | | Total Net Assets - 100.00% | | $ | 25,364,229 | |
PLC | Public Limited Company |
| (a) | Non-income producing security. |
| (b) | Foreign issued security. |
| (c) | Seven day yield as of May 31, 2022. |
The accompanying notes are an integral part of these financial statements.
BARRETT
GROWTH FUND
Statement of Assets and Liabilities
May 31, 2022
| ASSETS | | | |
| Investments, at value (cost $10,398,324) | | $ | 25,388,263 | |
| Dividends and interest receivable | | | 11,557 | |
| Other assets | | | 20,712 | |
| Total assets | | | 25,420,532 | |
| | | | | |
| LIABILITIES | | | | |
| Payable for distribution fees | | | 5,761 | |
| Payable to affiliates | | | 19,399 | |
| Payable to Adviser | | | 1,514 | |
| Accrued expenses and other liabilities | | | 29,629 | |
| Total liabilities | | | 56,303 | |
| | | | | |
| NET ASSETS | | $ | 25,364,229 | |
| | | | | |
| NET ASSETS CONSIST OF: | | | | |
| Paid-in capital | | $ | 6,347,997 | |
| Total distributable earnings | | | 19,016,232 | |
| Net Assets | | $ | 25,364,229 | |
| | | | | |
| Shares of beneficial interest outstanding | | | | |
| (unlimited number of shares authorized, $0.001 par value) | | | 1,014,526 | |
| | | | | |
Net asset value, redemption price and offering price per share | | $ | 25.00 | |
The accompanying notes are an integral part of these financial statements.
BARRETT
GROWTH FUND
Statement of Operations
For the Year Ended May 31, 2022
| INVESTMENT INCOME | | | |
| Dividend income | | $ | 252,125 | |
| Interest income | | | 570 | |
| Total Investment Income | | | 252,695 | |
| | | | | |
| EXPENSES | | | | |
| Advisory fees | | | 334,790 | |
| Administration fees | | | 53,813 | |
| Distribution fees | | | 43,146 | |
| Fund accounting fees | | | 27,903 | |
| Legal fees | | | 22,531 | |
| Transfer agent fees and expenses | | | 21,589 | |
| Federal and state registration fees | | | 22,398 | |
| Audit and tax fees | | | 17,496 | |
| Chief Compliance Officer fees and expenses | | | 15,009 | |
| Trustees’ fees and related expenses | | | 11,071 | |
| Reports to shareholders | | | 9,442 | |
| Custody fees | | | 5,310 | |
| Insurance fees | | | 2,863 | |
| Other expenses | | | 2,653 | |
| Total expenses | | | 590,014 | |
| Less waivers and reimbursement by Adviser (Note 4) | | | (212,078 | ) |
| Net expenses | | | 377,936 | |
| | | | | |
Net Investment Loss | | | (125,241 | ) |
| | | | | |
| REALIZED AND UNREALIZED GAIN/(LOSS) ON INVESTMENTS | | | | |
| Net realized gain from investments | | | 4,933,291 | |
| Change in net unrealized appreciation/depreciation on investments | | | (6,336,676 | ) |
| Net realized and unrealized loss on investments | | | (1,403,385 | ) |
| Net decrease in net assets from operations | | $ | (1,528,626 | ) |
The accompanying notes are an integral part of these financial statements.
BARRETT
GROWTH FUND
Statements of Changes in Net Assets
| | | Year Ended | | | Year Ended | |
| | | May 31, 2022 | | | May 31, 2021 | |
| FROM OPERATIONS | | | | | | |
| Net investment loss | | $ | (125,241 | ) | | $ | (116,285 | ) |
| Net realized gain on investments | | | 4,933,291 | | | | 4,592,344 | |
| Net change in unrealized appreciation/depreciation | | | | | | | | |
| on investments | | | (6,336,676 | ) | | | 4,665,849 | |
| Net increase/(decrease) in net assets from operations | | | (1,528,626 | ) | | | 9,141,908 | |
| | | | | | | | | |
| FROM DISTRIBUTIONS | | | | | | | | |
| Net dividends and distributions | | | (3,831,341 | ) | | | (2,195,275 | ) |
| Net decrease in net assets resulting from distributions paid | | | (3,831,341 | ) | | | (2,195,275 | ) |
| | | | | | | | | |
| FROM CAPITAL SHARE TRANSACTIONS | | | | | | | | |
| Proceeds from shares sold | | | 600,581 | | | | 1,592,804 | |
| Net asset value of shares issued to shareholders | | | | | | | | |
| in payment of distributions declared | | | 3,831,341 | | | | 2,195,275 | |
| Cost of shares redeemed | | | (8,551,451 | ) | | | (6,455,995 | ) |
| Net decrease in net assets resulting | | | | | | | | |
| from capital share transactions | | | (4,119,529 | ) | | | (2,667,916 | ) |
| | | | | | | | | |
| TOTAL INCREASE/(DECREASE) IN NET ASSETS | | | (9,479,496 | ) | | | 4,278,717 | |
| | | | | | | | | |
| NET ASSETS | | | | | | | | |
| Beginning of year | | | 34,843,725 | | | | 30,565,008 | |
| End of year | | $ | 25,364,229 | | | $ | 34,843,725 | |
The accompanying notes are an integral part of these financial statements.
BARRETT
GROWTH FUND
Financial Highlights
Per share data for a share of capital stock outstanding for the entire period and selected information for each period are as follows:
| | | Years Ended May 31, | |
| | | 2022 | | | 2021 | | | 2020 | | | 2019 | | | 2018 | |
| NET ASSET VALUE | | | | | | | | | | | | | | | |
| Beginning of year | | $ | 30.29 | | | $ | 24.34 | | | $ | 20.81 | | | $ | 20.30 | | | $ | 18.10 | |
| | | | | | | | | | | | | | | | | | | | | |
| OPERATIONS | | | | | | | | | | | | | | | | | | | | |
Net investment income (loss)(1) | | | (0.11 | ) | | | (0.10 | ) | | | (0.05 | ) | | | (0.02 | ) | | | (0.01 | ) |
| Net realized and unrealized | | | | | | | | | | | | | | | | | | | | |
| gains (losses) on securities | | | (1.49 | ) | | | 7.99 | | | | 4.15 | | | | 1.17 | | | | 3.12 | |
| Total from investment operations | | | (1.60 | ) | | | 7.89 | | | | 4.10 | | | | 1.15 | | | | 3.11 | |
| | | | | | | | | | | | | | | | | | | | | |
| LESS DISTRIBUTIONS | | | | | | | | | | | | | | | | | | | | |
| Distributions from net investment income | | | — | | | | — | | | | — | | | | — | | | | (0.05 | ) |
| Distributions from net realized | | | | | | | | | | | | | | | | | | | | |
| gains on investments | | | (3.69 | ) | | | (1.94 | ) | | | (0.57 | ) | | | (0.64 | ) | | | (0.86 | ) |
| Total distributions paid | | | (3.69 | ) | | | (1.94 | ) | | | (0.57 | ) | | | (0.64 | ) | | | (0.91 | ) |
| | | | | | | | | | | | | | | | | | | | | |
| NET ASSET VALUE | | | | | | | | | | | | | | | | | | | | |
| End of year | | $ | 25.00 | | | $ | 30.29 | | | $ | 24.34 | | | $ | 20.81 | | | $ | 20.30 | |
Total return | | | -7.25 | % | | | 32.96 | % | | | 19.82 | % | | | 6.17 | % | | | 17.51 | % |
Net assets at end of period (000s omitted) | | $ | 25,364 | | | $ | 34,844 | | | $ | 30,565 | | | $ | 26,179 | | | $ | 25,753 | |
| | | | | | | | | | | | | | | | | | | | | |
| RATIO OF EXPENSES TO | | | | | | | | | | | | | | | | | | | | |
| AVERAGE NET ASSETS | | | | | | | | | | | | | | | | | | | | |
| Before expense reimbursement | | | 1.76 | % | | | 1.78 | % | | | 1.81 | % | | | 1.81 | % | | | 1.90 | % |
| After expense reimbursement | | | 1.13 | % | | | 1.24 | %(2) | | | 1.25 | % | | | 1.25 | % | | | 1.25 | % |
| | | | | | | | | | | | | | | | | | | | | |
| RATIO OF NET INVESTMENT INCOME | | | | | | | | | | | | | | | | | | | | |
| (LOSS) TO AVERAGE NET ASSETS | | | | | | | | | | | | | | | | | | | | |
| Before expense reimbursement | | | (0.99 | )% | | | (0.89 | )% | | | (0.77 | )% | | | (0.64 | )% | | | (0.71 | )% |
| After expense reimbursement | | | (0.36 | )% | | | (0.35 | )% | | | (0.21 | )% | | | (0.08 | )% | | | (0.06 | )% |
| Portfolio turnover rate | | | 5 | % | | | 6 | % | | | 20 | % | | | 16 | % | | | 20 | % |
(1) | Net investment income (loss) per share represents net investment income (loss) divided by the daily average shares of beneficial interest outstanding throughout each period. |
(2) | Effective April 30, 2021, the expense cap was decreased from 1.25% to 1.00%, excluding 12b-1 fees. |
The accompanying notes are an integral part of these financial statements.
BARRETT
GROWTH FUND
Notes to the Financial Statements
May 31, 2022
| 1. | Organization | Trust for Professional Managers (the “Trust”) was organized as a Delaware statutory trust under a Declaration of Trust dated May 29, 2001. The Trust is registered under the Investment Company Act of 1940, as amended (the “1940 Act”), as an open-end, management investment company. The Barrett Growth Fund (the “Fund”) represents a distinct diversified series with its own investment objective and policies within the Trust. The investment objective of the Fund is to seek to achieve long-term capital appreciation and to maximize after-tax returns. The Trust may issue an unlimited number of shares of beneficial interest at $0.001 par value. The assets of the Fund are segregated, and a shareholder’s interest is limited to the fund in which shares are held. The Fund commenced operations on December 29, 1998 as a series of The Barrett Funds. On March 30, 2010, the Fund reorganized as a series of the Trust and changed its fiscal year end from June 30th to May 31st. Effective April 29, 2011, Barrett Asset Management, LLC (the “Adviser”) began serving as the investment adviser to the Fund. Prior to April 29, 2011, Barrett Associates, Inc., a wholly-owned subsidiary of Legg Mason, Inc., a financial services holding company, served as the investment adviser to the Fund. |
| | | |
| | | The Fund is an investment company and accordingly follows the investment company accounting and reporting guidance of the Financial Accounting Standards Board (“FASB”) Accounting Standards Codification (“ASC”) Topic 946 “Financial Services — Investment Companies”. |
| | | |
| 2. | Significant | The following is a summary of significant accounting policies consistently followed by the Fund in the preparation of the financial statements. |
| | Accounting | These policies are in conformity with generally accepted accounting principles in the United States of America (“GAAP”). |
| | Policies |
|
| | | a) Investment Valuation |
| | | |
| | | Each security owned by the Fund that is listed on a securities exchange, except for securities listed on the NASDAQ Stock Market LLC (“NASDAQ”), is valued at its last sale price on the exchange on the date as of which assets are valued. When the security is listed on more than one exchange, the Fund will use the price of the exchange that the Fund generally considers to be the principal exchange on which the security is traded. |
| | | |
| | | Fund securities listed on NASDAQ will be valued at the NASDAQ Official Closing Price (“NOCP”), which may not necessarily represent the last sale price. If the NOCP is not available, such securities shall be valued at the last sale price on the day of valuation. If there has been no sale on such exchange or on NASDAQ on such day, the security is valued at (i) the mean between the most recent quoted bid and asked prices at the close of the exchange on such day or |
BARRETT
GROWTH FUND
| | | (ii) the latest sales price on the Composite Market for the day such security is being valued. “Composite Market” means a consolidation of the trade information provided by national securities and foreign exchanges and over-the-counter markets as published by a pricing service. When market quotations are not readily available, any security or other asset is valued at its fair value as determined under procedures approved by the Trust’s Board of Trustees. These fair value procedures will also be used to price a security when corporate events, events in the securities market or world events cause the Adviser to believe that a security’s last sale price may not reflect its actual fair market value. The intended effect of using fair value pricing procedures is to ensure that the Fund is accurately priced. The Board of Trustees will regularly evaluate whether the Fund’s fair value pricing procedures continue to be appropriate in light of the specific circumstances of the Fund and the quality of prices obtained through their application by the Trust’s valuation committee. |
| | | |
| | | In the case of foreign securities, the occurrence of certain events after the close of foreign markets, but prior to the time the Fund’s net asset value (“NAV”) is calculated (such as a significant surge or decline in the U.S. or other markets) often will result in an adjustment to the trading prices of foreign securities when foreign markets open on the following business day. If such events occur, the Fund will value foreign securities at fair value, taking into account such events, in calculating the NAV. In such cases, use of fair valuation can reduce an investor’s ability to seek to profit by estimating the Fund’s NAV in advance of the time the NAV is calculated. |
| | | |
| | | Exchange traded options are valued at the composite price, using the National Best Bid and Offer quotes (“NBBO”). NBBO consists of the highest bid price and lowest ask price across any of the exchanges on which an option is quoted, thus providing a view across the entire U.S. options marketplace. Specifically, composite pricing looks at the last trades on the exchanges where the options are traded. If there are no trades for the option on a given business day, composite option pricing calculates the mean of the highest bid price and lowest ask price across the exchanges where the option is traded. Option contracts on securities, currencies and other financial instruments traded in the OTC market with less than 180 days remaining until their expiration are valued at the evaluated price provided by the broker-dealer with which the option was traded. Option contracts on securities, currencies and other financial instruments traded in the OTC market with 180 days or more remaining until their expiration are valued at the prices provided by a recognized independent broker-dealer. |
| | | |
| | | Redeemable securities issued by open-end, registered investment companies, including money market mutual funds, are valued at the NAVs of such companies for purchase and/or redemption orders placed on that day. If, on a particular day, a share of an investment company is not listed on NASDAQ, such security’s fair value will be determined. |
BARRETT
GROWTH FUND
| | | FASB ASC Topic 820, “Fair Value Measurements and Disclosures” (“ASC 820”), establishes an authoritative definition of fair value and sets out a hierarchy for measuring fair value. ASC 820 requires an entity to evaluate certain factors to determine whether there has been a significant decrease in volume and level of activity for the security such that recent transactions and quoted prices may not be determinative of fair value and further analysis and adjustment may be necessary to estimate fair value. ASC 820 also requires enhanced disclosure regarding the inputs and valuation techniques used to measure fair value in those instances as well as expanded disclosure of valuation levels for each class of investments. These inputs are summarized in the three broad levels listed below: |
| | | Level 1 – | Quoted prices in active markets for identical securities. |
| | | | |
| | | Level 2 – | Other significant observable inputs (including quoted prices for similar securities, interest rates, prepayment speeds, credit risk, etc.). |
| | | | |
| | | Level 3 – | Significant unobservable inputs (including the Fund’s own assumptions in determining the fair value of investments). |
| | | The inputs or methodology used for valuing securities are not necessarily an indication of the risk associated with investing in those securities. The following is a summary of the inputs used to value the Fund’s investments carried at fair value as of May 31, 2022: |
| | | | | Level 1 | | | Level 2 | | | Level 3 | | | Total | |
| | | Assets: | | | | | | | | | | | | |
| | | Equity | | | | | | | | | | | | |
| | | Common Stocks(1) | | $ | 23,942,424 | | | $ | — | | | $ | — | | | $ | 23,942,424 | |
| | | Real Estate Investment Trusts | | | 616,363 | | | | — | | | | — | | | | 616,363 | |
| | | Short-Term Investments | | | 829,476 | | | | — | | | | — | | | | 829,476 | |
| | | Total Investments in Securities | | $ | 25,388,263 | | | $ | — | | | $ | — | | | $ | 25,388,263 | |
| | | (1) | See the Schedule of Investments for industry classifications. |
| | | The Fund measures Level 3 activity as of the end of the year. For the year ended May 31, 2022, the Fund did not have any significant unobservable inputs (Level 3 securities) used in determining fair value. Therefore, a reconciliation of assets in which significant unobservable inputs (Level 3) were used in determining fair value is not applicable. |
| | | |
| | | b) Federal Income Taxes |
| | | |
| | | The Fund intends to comply with the requirements of Subchapter M of the Internal Revenue Code of 1986 (the “Code”), as amended, necessary to qualify as a regulated investment company and to make the requisite distributions of income and capital gains to its shareholders sufficient to relieve it from all or substantially all federal income taxes. Therefore, no federal income tax provision has been provided. |
BARRETT
GROWTH FUND
| | | As of and during the year ended May 31, 2022, the Fund did not have a liability for any unrecognized tax benefits. The Fund recognizes interest and penalties, if any, related to uncertain tax benefits as income tax expense in the Statement of Operations. During the fiscal year, the Fund did not incur any interest or penalties. The Fund is not subject to examination by U.S. taxing authorities for tax periods prior to the year ended May 31, 2019. |
| | | |
| | | c) Distributions to Shareholders |
| | | |
| | | The Fund will distribute any net investment income and any net capital gains, if any, at least annually typically during the month of December. Distributions from net realized gains for book purposes may include short-term capital gains. All short-term capital gains are included in ordinary income for tax purposes. Distributions to shareholders are recorded on the ex-dividend date. The Fund may also pay a special distribution at the end of the calendar year to comply with federal tax requirements. The Fund may make additional distributions if it deems it desirable at another time during the year. |
| | | |
| | | d) Use of Estimates |
| | | |
| | | The preparation of financial statements in conformity with GAAP requires management to make estimates and assumptions that affect the reported amounts of assets and liabilities and disclosure of contingent assets and liabilities at the date of the financial statements and the reported amounts of revenues and expenses during the reporting period. Actual results could differ from those estimates. |
| | | |
| | | e) Share Valuation |
| | | |
| | | The NAV per share of the Fund is calculated by dividing the sum of the value of the securities held by the Fund, plus cash or other assets, minus all liabilities (including estimated accrued expenses) by the total number of shares outstanding for the Fund, rounded to the nearest cent. The Fund’s shares will not be priced on the days on which the New York Stock Exchange (“NYSE”) is closed for trading. |
| | | |
| | | f) Expenses |
| | | |
| | | Expenses associated with a specific series in the Trust are charged to that series. Common expenses are typically allocated evenly between the series of the Trust, or by other equitable means. |
| | | |
| | | g) Other |
| | | |
| | | Investment transactions are recorded on the trade date. The Fund determines the gain or loss from investment transactions on the identified cost basis by comparing the cost of the security lot sold with the net sales proceeds. Dividend income, less foreign withholding tax, is recognized on the ex-dividend date and interest income is recognized on an accrual basis. Withholding taxes on foreign dividends and interest, net of any reclaims, have been provided for in accordance with the Fund’s understanding of the applicable country’s tax rules and rates. |
BARRETT
GROWTH FUND
| 3. | Federal Tax | The tax character of distributions paid by the Fund during the years ended May 31, 2022 and May 31, 2021 was as follows: |
| | Matters |
|
| | | | | May 31, 2022 | | | May 31, 2021 | |
| | | Ordinary Income | | $ | — | | | $ | — | |
| | | Long-Term Capital Gain | | | 3,831,341 | | | | 2,195,275 | |
| | | The components of distributable earnings on a tax basis as of May 31, 2022 were as follows: |
| | | Cost basis of investments for federal | | | |
| | | income tax purposes | | $ | 10,398,324 | |
| | | Gross tax unrealized appreciation | | $ | 14,992,436 | |
| | | Gross tax unrealized depreciation | | | (2,497 | ) |
| | | Net tax unrealized appreciation | | | 14,989,939 | |
| | | Undistributed ordinary income | | | — | |
| | | Undistributed long-term capital gain | | | 4,071,915 | |
| | | Distributable earnings | | | 4,071,915 | |
| | | Other accumulated losses | | | (45,622 | ) |
| | | Total distributable earnings | | $ | 19,016,232 | |
| | | At May 31, 2022, the Fund deferred, on a tax basis, late year losses of $45,622. |
| | | |
| | | GAAP requires that certain components of net assets relating to permanent differences be reclassified between financial and tax reporting. These reclassifications have no effect on net assets or NAV per share. The permanent tax differences relate to net operating losses. For the year ended May 31, 2022, the following reclassifications were made for permanent tax differences on the Statement of Assets and Liabilities: |
| | | Total Distributable Earnings | | $ | 123,683 | |
| | | Paid-In Capital | | $ | (123,683 | ) |
| 4. | Investment | The Trust has an Investment Advisory Agreement (the “Agreement”) with the Adviser to furnish investment advisory services to the Fund. |
| | Adviser | Under the terms of the Agreement, the Trust, on behalf of the Fund, compensates the Adviser for its management services at the annual rate of 1.00% |
| | | of the Fund’s average daily net assets. |
| |
|
|
| | | The Adviser has contractually agreed to waive its management fee and/or reimburse the Fund’s other expenses at least through August 11, 2023, at the discretion of the Adviser and the Board of Trustees, to the extent necessary to ensure that the Fund’s Total Annual Operating Expenses (exclusive of front-end or contingent deferred sales loads, Rule 12b-1 plan fees, shareholder servicing plan fees, taxes, leverage (i.e., any expenses incurred in connection with borrowings made by the Fund), interest (including interest incurred in |
BARRETT
GROWTH FUND
| | | connection with bank and custody overdrafts), brokerage commissions and other transactional expenses, expenses incurred in connection with any merger or reorganization, dividends or interest on short positions, acquired fund fees and expenses and extraordinary expenses such as litigation) (collectively, “Excluded Expenses”) do not exceed 1.00% (the “Expense Limitation Cap”) of the Fund’s average daily net assets. Prior to April 30, 2021, the Adviser had agreed to waive its management fees and/or reimburse the Fund’s other expenses to the extent necessary to ensure that the Fund’s Total Annual Operating Expenses (exclusive of Excluded Expenses, Rule 12b-1 plan fees and shareholder servicing plan fees), did not exceed 1.25% of the Fund’s average daily net assets. For the year ended May 31, 2022, the Fund waived expenses of $212,078 which were reimbursed by the Adviser. Any such waiver or reimbursement is subject to later adjustment to allow the Adviser to recoup amounts waived or reimbursed; provided, however, that the Adviser shall only be entitled to recoup such amounts for up to three years from the date such fees and expenses were waived or reimbursed, if such recoupment will not cause the Fund to exceed the lesser of: (1) the expense limitation in place at the time of the waiver and/or expense payment; or (2) the expense limitation in place at the time of the recoupment. During the year ended May 31, 2022, $145,867 of previously waived expenses subject to recovery expired. |
| | | |
| | | The following table shows the remaining waived or reimbursed expenses subject to potential recovery expiring during the fiscal year ending: |
| | | May 31, 2023 | | $ | 163,293 | |
| | | May 31, 2024 | | $ | 179,335 | |
| | | May 31, 2025 | | $ | 212,078 | |
| 5. | Distribution | The Trust adopted a plan pursuant to Rule 12b-1 (the “12b-1 Plan”), on behalf of the Fund, which authorizes it to pay Quasar Distributors, LLC |
| | Plan | (“Quasar “ or the “Distributor”) a distribution fee of up to 0.25% of the Fund’s average daily net assets for services to prospective Fund shareholders and distribution of Fund shares. During the year ended May 31, 2022, the Fund incurred expenses of $43,146 pursuant to the 12b-1 Plan. As of May 31, 2022, the Fund owed the Distributor $5,761 in fees. The Distributor acts as the Fund’s principal underwriter in a continuous public offering of the Fund’s shares. |
BARRETT
GROWTH FUND
| 6. | Related Party | U.S. Bancorp Fund Services, LLC, doing business as U.S. Bank Global Fund Services (“Fund Services” or the “Administrator”), acts as the Fund’s |
| | Transactions | administrator under an Administration Agreement. The Administrator prepares various federal and state regulatory filings, reports and returns for the Fund; prepares reports and materials to be supplied to the Trustees; monitors the activities of the Fund’s custodian, transfer agent and fund accountant; coordinates the preparation and payment of the Fund’s expenses; and reviews the Fund’s expense accruals. Fund Services also serves as the fund accountant and transfer agent to the Fund. U.S. Bank, an affiliate of Fund Services, serves as the Fund’s custodian. Fees and expenses incurred for the year ended May 31, 2022, and owed as of May 31, 2022 were as follows: |
| | | | | Incurred | | | Owed | |
| | | Administration | | $ | 53,813 | | | $ | 7,944 | |
| | | Fund accounting | | $ | 27,903 | | | $ | 4,633 | |
| | | Transfer agency | | $ | 21,589 | | | $ | 3,401 | |
| | | Custody | | $ | 5,310 | | | $ | 911 | |
| | | Certain officers of the Fund are also employees of Fund Services. A Trustee of the Trust is affiliated with Fund Services and U.S. Bank. |
| | | |
| | | The Trust’s Chief Compliance Officer is also an employee of Fund Services. For the year ended May 31, 2022, the Fund was allocated $15,009 of the Trust’s Chief Compliance Officer fee. At May 31, 2022, the Fund owed fees of $2,510 for the Chief Compliance Officer’s services. |
| 7. | Capital Share | Transactions in shares of the Fund were as follows: |
| | Transactions | |
| | | | | Year Ended | | | Year Ended | |
| | | | | May 31, 2022 | | | May 31, 2021 | |
| | | Shares Sold | | | 18,776 | | | | 57,322 | |
| | | Shares Reinvested | | | 128,353 | | | | 77,544 | |
| | | Shares Redeemed | | | (282,764 | ) | | | (240,689 | ) |
| | | Net Decrease | | | (135,635 | ) | | | (105,823 | ) |
| 8. | Investment | The aggregate purchases and sales of securities, excluding short-term investments, for the Fund for the year ended May 31, 2022, were |
| | Transactions | $1,530,483 and $9,562,945, respectively. For the year ended May 31, 2022, there were no purchases or sales of U.S. government securities for the Fund. |
| | | |
| 9. | Beneficial | The beneficial ownership, either directly or indirectly, of more than 25% of the voting securities of a fund creates a presumption of control of the fund, |
| | Ownership | under Section 2(a)(9) of the 1940 Act. At May 31, 2022, Charles Schwab & Co., Inc., held 48.53% of the Barrett Growth Fund’s outstanding shares. |
BARRETT
GROWTH FUND
| 10. | Recent Market | U.S. and international markets have experienced significant periods of volatility in recent years and months due to a number of economic, political and
|
| | Events | global macro factors including the impact of COVID-19 as a global pandemic and related public health crisis, growth concerns in the U.S. and overseas, uncertainties regarding interest rates, rising inflation, trade tensions, and the threat of tariffs imposed by the U.S. and other countries. In particular, the global spread of COVID-19 has resulted in disruptions to business operations and supply chains, stress on the global healthcare system, growth concerns in the U.S. and overseas, staffing shortages and the inability to meet consumer demand, and widespread concern and uncertainty. The global recovery from COVID-19 is proceeding at slower than expected rates due to the emergence of variant strains and may last for an extended period of time. Health crises and related political, social and economic disruptions caused by the spread of COVID-19 may also exacerbate other pre-existing political, social and economic risks in certain countries. As a result of continuing political tensions and armed conflicts, including the war between Ukraine and Russia, the U.S. and the European Union imposed sanctions on certain Russian individuals and companies, including certain financial institutions, and have limited certain exports and imports to and from Russia. The war has contributed to recent market volatility and may continue to do so. These developments, as well as other events, could result in further market volatility and negatively affect financial asset prices, the liquidity of certain securities and the normal operations of securities exchanges and other markets, despite government efforts to address market disruptions. Continuing market volatility as a result of recent market conditions or other events may have adverse effects on your account. |
| | | |
| 11. | Subsequent | The Fund has evaluated events and transactions that have occurred subsequent to May 31, 2022 through the date the financial statements were issued |
| | Event | and determined there were no subsequent events that would require disclosure in financial statements. |
BARRETT
GROWTH FUND
| Report of | To the Shareholders of Barrett Growth Fund and |
| Independent | Board of Trustees of Trust for Professional Managers |
| Registered | |
| Public | Opinion on the Financial Statements |
| Accounting | |
Firm
| We have audited the accompanying statement of assets and liabilities, including the schedule of investments, of Barrett Growth Fund (the “Fund”), a series of Trust for Professional Managers, as of May 31, 2022, the related statement of operations for the year then ended, the statements of changes in net assets for each of the two years in the period then ended, the related notes, and the financial highlights for each of the five years in the period then ended (collectively referred to as the “financial statements”). In our opinion, the financial statements present fairly, in all material respects, the financial position of the Fund as of May 31, 2022, the results of its operations for the year then ended, the changes in net assets for each of the two years in the period then ended, and the financial highlights for each of the five years in the period then ended, in conformity with accounting principles generally accepted in the United States of America. |
| | | |
| | | Basis for Opinion |
| | | |
| | | These financial statements are the responsibility of the Fund’s management. Our responsibility is to express an opinion on the Fund’s financial statements based on our audits. We are a public accounting firm registered with the Public Company Accounting Oversight Board (United States) (“PCAOB”) and are required to be independent with respect to the Fund in accordance with the U.S. federal securities laws and the applicable rules and regulations of the Securities and Exchange Commission and the PCAOB. |
| | | |
| | | We conducted our audits in accordance with the standards of the PCAOB. Those standards require that we plan and perform the audit to obtain reasonable assurance about whether the financial statements are free of material misstatement whether due to error or fraud. |
| | | |
| | | Our audits included performing procedures to assess the risks of material misstatement of the financial statements, whether due to error or fraud, and performing procedures that respond to those risks. Such procedures included examining, on a test basis, evidence regarding the amounts and disclosures in the financial statements. Our procedures included confirmation of securities owned as of May 31, 2022, by correspondence with the custodian. Our audits also included evaluating the accounting principles used and significant estimates made by management, as well as evaluating the overall presentation of the financial statements. We believe that our audits provide a reasonable basis for our opinion. |
| | | |
| | | We have served as the Fund’s auditor since 2010. |
| | |  |
| | | |
| | | COHEN & COMPANY, LTD. |
| | | Milwaukee, Wisconsin |
| | | July 28, 2022 |
BARRETT
GROWTH FUND
STATEMENT REGARDING LIQUIDITY RISK MANAGEMENT PROGRAM (Unaudited)
In accordance with Rule 22e-4 under the Investment Company Act of 1940, as amended, Trust for Professional Managers (the “Trust”) has adopted and implemented a liquidity risk management program (the “Trust Program”). As required under the Trust Program, Barrett Asset Management, LLC (“Barrett”), the investment adviser to the Barrett Growth Fund (the “Fund”), a series of the Trust, has adopted and implemented a liquidity risk management program tailored specifically to the Fund (the “Adviser Program”). The Adviser Program seeks to promote effective liquidity risk management for the Fund and to protect Fund shareholders from dilution of their interests. The Board of Trustees (the “Board”) of the Trust has approved Barrett as the administrator for the Adviser Program (the “Program Administrator”). The Program Administrator has further delegated administration of the Adviser Program to its Chief Compliance Officer, Head Trader and Associate Managing Director. The Program Administrator is required to provide a written annual report to the Board and the Trust’s chief compliance officer regarding the adequacy and effectiveness of the Adviser Program, including the operation of the Fund’s highly liquid investment minimum, if applicable, and any material changes to the Adviser Program.
On April 13, 2022, the Board reviewed the Program Administrator’s written annual report for the period January 1, 2021 through December 31, 2021 (the “Report”). The Report provided an assessment of the Fund’s liquidity risk: the risk that the Fund could not meet requests to redeem shares issued by the Fund without significant dilution of the remaining investors’ interests in the Fund. The Adviser Program assesses liquidity risk under both normal and reasonably foreseeable stressed market conditions. The Program Administrator has retained ICE Data Services, Inc., a third party vendor, to provide portfolio investment classification services, and the Report noted that the Fund primarily held investments that were classified as highly liquid during the review period. The Report noted that the Fund’s portfolio is expected to continue to primarily hold highly liquid investments and the determination that the Fund be designated as a “primarily highly liquid fund” (as defined in Rule 22e-4) remains appropriate and the Fund can therefore continue to rely on the exclusion in Rule 22e-4 from the requirements to determine and review a highly liquid investment minimum for the Fund and to adopt policies and procedures for responding to a highly liquid investment minimum shortfall. The Report noted that there were no breaches of the Fund’s restriction on holding illiquid investments exceeding 15% of its net assets during the review period. The Report confirmed that the Fund’s investment strategy was appropriate for an open-end management investment company. The Report also indicated that no material changes had been made to the Adviser Program during the review period.
The Program Administrator determined that the Fund is reasonably likely to be able to meet redemption requests without adversely affecting non-redeeming Fund shareholders through significant dilution. The Program Administrator concluded that the Adviser Program was adequately designed and effectively implemented during the review period.
BARRETT
GROWTH FUND
NOTICE OF PRIVACY POLICY & PRACTICES (Unaudited)
We collect non-public personal information about you from the following sources:
| | • | information we receive about you on applications or other forms; |
| | | |
| | • | information you give us orally; and |
| | | |
| | • | information about your transactions with us or others. |
We do not disclose any non-public personal information about our shareholders or former shareholders without the shareholder’s authorization, except as permitted by law or in response to inquiries from governmental authorities. We may share information with affiliated parties and unaffiliated third parties with whom we have contracts for servicing the Fund. We will provide unaffiliated third parties with only the information necessary to carry out their assigned responsibility. All shareholder records will be disposed of in accordance with applicable law. We maintain physical, electronic and procedural safeguards to protect your non-public personal information and require third parties to treat your non-public personal information with the same high degree of confidentiality.
In the event that you hold shares of the Fund through a financial intermediary, including, but not limited to, a broker-dealer, bank or trust company, the privacy policy of your financial intermediary would govern how your non-public personal information would be shared with unaffiliated third parties.
BARRETT
GROWTH FUND
Additional Information
(Unaudited)
RESULTS OF SHAREHOLDER MEETING
A Special Joint Meeting of Shareholders (the “Meeting”) took place on April 6, 2022. The Meeting was held for all series in the Trust. All Trust shareholders of record, in the aggregate across all series of the Trust, were entitled to attend or submit proxies. As of the record date, February 7, 2022, the Trust had 534,673,511 shares outstanding. The results of the voting for the proposals were as follows:
Proposal 1: To approve the election of four Trustees to the Board of Trustees of the Trust to serve until his or her successor is elected and qualified.
| | For Votes | Votes Withheld | Broker Non-Vote |
Vincent P. Lyles | 465,453,094 | 2,962,687 | 15,025,189 |
Erik K. Olstein | 465,703,874 | 2,711,906 | 15,025,189 |
Lisa Zúñiga Ramírez | 465,728,682 | 2,662,552 | 15,025,189 |
Gregory M. Wesley | 465,394,219 | 2,984,741 | 15,025,189 |
Accordingly, effective April 6, 2022, the Board of Trustees of Trust for Professional Managers consists of the following individuals, each of whom have been elected by shareholders:
Michael D. Akers, Independent Trustee
Gary A. Drska, Independent Trustee
Vincent P. Lyles, Independent Trustee
Erik K. Olstein, Independent Trustee
Lisa Zúñiga Ramírez, Independent Trustee
Gregory M. Wesley, Independent Trustee
Joseph C. Neuberger, Interested Trustee
Proposal 2: To approve one or more adjournments of the Special Meeting to a later date to solicit additional proxies.
| | For Votes | Votes Against | Votes Abstained |
| | 476,848,750 | 2,932,139 | 3,647,484 |
TAX INFORMATION
The Fund designated 0.00% of its ordinary income distribution for the year ended May 31, 2022, as qualified dividend income under the Jobs and Growth Tax Relief Reconciliation Act of 2003.
For the year ended May 31, 2022, 0.00% of dividends paid from net ordinary income qualified for the dividends received deduction available to corporate shareholders.
The percentage of taxable ordinary income distributions that are designated as short-term capital gain distributions under Section 871(k)(2)(C) of the Code for the Fund was 0.00%.
INDEMNIFICATIONS
Under the Trust’s organizational documents, its officers and Trustees are indemnified against certain liabilities arising out of the performance of their duties to the Fund. In addition, in the normal course of business, the Fund enters into contracts that provide general indemnifications to other parties. The
BARRETT
GROWTH FUND
Fund’s maximum exposure under these arrangements is unknown as this would involve future claims that may be made against the Fund that have not yet occurred. However, the Fund has not had prior claims or losses pursuant to these contracts and expects the risk of loss to be remote.
INFORMATION ABOUT TRUSTEES
The business and affairs of the Trust are managed under the direction of the Board of Trustees. Information pertaining to the Trustees of the Trust is set forth below. The Statement of Additional Information includes additional information about the Trustees and is available, without charge, upon request by calling 1-877-363-6333.
| | | | Number of | | Other |
| | | Term of | Portfolios | Principal | Directorships |
| Name, | Position(s) | Office and | in Trust | Occupation(s) | Held by Trustee |
| Address and | Held with | Length of | Overseen | During the Past | During the Past |
Year of Birth | the Trust | Time Served | by Trustee | Five Years | Five Years |
| |
| INDEPENDENT TRUSTEES |
| | | | | | |
Michael D. Akers, Ph.D. | Trustee | Indefinite | 26 | Professor Emeritus, | Independent |
615 E. Michigan St. | | Term; Since | | Department of Accounting | Trustee, USA |
Milwaukee, WI 53202 | | August 22, | | (June 2019–present), | MUTUALS |
Year of Birth: 1955 | | 2001 | | Professor, Department | (an open-end |
| | | | | of Accounting | investment |
| | | | | (2004–2019), Chair, | company) |
| | | | | Department of | (2001–2021). |
| | | | | Accounting (2004–2017), | |
| | | | | Marquette University. | |
| | | | | | |
Gary A. Drska | Trustee | Indefinite | 26 | Retired; Former | Independent |
615 E. Michigan St. | | Term; Since | | Pilot, Frontier/Midwest | Trustee, USA |
Milwaukee, WI 53202 | | August 22, | | Airlines, Inc. (airline | MUTUALS |
Year of Birth: 1956 | | 2001 | | company) (1986–2021). | (an open-end |
| | | | |
| investment |
| | | | |
| company) |
| | | | |
| (2001–2021). |
| | | | | | |
Vincent P. Lyles | Trustee | Indefinite | 26 | System Vice President of | Independent |
615 E. Michigan St. | | Term; Since | | Community Relations, | Director, BMO |
Milwaukee, WI 53202 | | April 6, | | Advocate Aurora Health | Funds, Inc. |
Year of Birth: 1961 | | 2022 | | Care (health care provider) | (an open-end |
| | | | | (2019–present); President | investment |
| | | | | and Chief Executive Officer, | company) |
| | | | | Boys & Girls Club of Greater | (2017–2022). |
| | | | | Milwaukee (2012–2018). | |
| | | | | | |
Erik K. Olstein | Trustee | Indefinite | 26 | Retired; President and Chief | Trustee, The |
615 E. Michigan St. | | Term; Since | | Operating Officer (2000–2020), | Olstein Funds |
Milwaukee, WI 53202 | | April 6, | | Vice President of Sales and | (an open-end |
Year of Birth: 1967 | | 2022 | | Chief Operating Officer | investment |
| | | | | (1995–2000), Olstein Capital | company) |
| | | | | Management, L.P. (asset | (1995–2018). |
| | | | | management firm); Secretary | |
| | | | | and Assistant Treasurer, | |
| | | | | The Olstein Funds (1995–2018). | |
BARRETT
GROWTH FUND
| | | | Number of | | Other |
| | | Term of | Portfolios | Principal | Directorships |
| Name, | Position(s) | Office and | in Trust | Occupation(s) | Held by Trustee |
| Address and | Held with | Length of | Overseen | During the Past | During the Past |
Year of Birth | the Trust | Time Served | by Trustee | Five Years | Five Years |
| |
| INDEPENDENT TRUSTEES (Continued) |
| | | | | | |
Lisa Zúñiga Ramírez | Trustee | Indefinite | 26 | Retired; Principal and Senior | N/A |
615 E. Michigan St. | | Term; Since | | Portfolio Manager, Segall, | |
Milwaukee, WI 53202 | | April 6, | | Bryant & Hamill, LLC (asset | |
Year of Birth: 1969 | | 2022 | | management firm) (2018–2020); | |
| | | | | Partner and Senior Portfolio | |
| | | | | Manager, Denver Investments | |
| | | | | LLC (asset management firm) | |
| | | | | (2009–2018). | |
| | | | | | |
Gregory M. Wesley | Trustee | Indefinite | 26 | Senior Vice President of | N/A |
615 E. Michigan St. | | Term; Since | | Strategic Alliances and | |
Milwaukee, WI 53202 | | April 6, | | Business Development, | |
Year of Birth: 1969 | | 2022 | | Medical College of Wisconsin | |
| | | | | (2016–present). | |
| |
| INTERESTED TRUSTEE AND OFFICERS |
| | | | | | |
Joseph C. Neuberger* | Chairperson | Indefinite | 26 | President (2017–present), | Trustee, Buffalo |
615 E. Michigan St. | and | Term; Since | | Chief Operating Officer | Funds (an open- |
Milwaukee, WI 53202 | Trustee | August 22, | | (2016–2020), Executive | end investment |
Year of Birth: 1962 | | 2001 | | Vice President | company) |
| | | | | (1994–2017), U.S. Bancorp | (2003–2017); |
| | | | | Fund Services, LLC. | Trustee, USA |
| | | | | | MUTUALS |
| | | | | | (an open-end |
| | | | | | investment |
| | | | | | company) |
| | | | | | (2001–2018). |
| | | | | | |
John P. Buckel | President | Indefinite | N/A | Vice President, U.S. Bancorp | N/A |
615 E. Michigan St. | and | Term; Since | | Fund Services, LLC | |
Milwaukee, WI 53202 | Principal | January 24, | | (2004–present). | |
Year of Birth: 1957 | Executive | 2013 | | | |
| | Officer | | | | |
| | | | | | |
Jennifer A. Lima | Vice | Indefinite | N/A | Vice President, U.S. Bancorp | N/A |
615 E. Michigan St. | President, | Term; Since | | Fund Services, LLC | |
Milwaukee, WI 53202 | Treasurer | January 24, | | (2002–present). | |
Year of Birth: 1974 | and Principal | 2013 | | | |
| | Financial and | | | | |
| | Accounting | | | | |
| | Officer | | | | |
________
* | Mr. Neuberger is an “interested person” of the Trust as defined by the 1940 Act due to his position and material business relationship with the Trust. |
BARRETT
GROWTH FUND
| | | | Number of | | Other |
| | | Term of | Portfolios | Principal | Directorships |
| Name, | Position(s) | Office and | in Trust | Occupation(s) | Held by Trustee |
| Address and | Held with | Length of | Overseen | During the Past | During the Past |
Year of Birth | the Trust | Time Served | by Trustee | Five Years | Five Years |
| |
| INTERESTED TRUSTEE AND OFFICERS (Continued) |
| | | | | | |
Deanna B. Marotz | Chief | Indefinite | N/A | Senior Vice President, | N/A |
615 E. Michigan St. | Compliance | Term; Since | | U.S. Bancorp Fund Services, | |
Milwaukee, WI 53202 | Officer, | October 21, | | LLC (2021–present); Chief | |
Year of Birth: 1965 | Vice | 2021 | | Compliance Officer of | |
| | President | | | Keeley-Teton Advisors, LLC | |
| | and Anti- | | | and Teton Advisors, Inc | |
| | Money | | | (2017–2021); Chief | |
| | Laundering | | | Compliance Officer of | |
| | Officer | | | Keeley Asset Management | |
| | |
| | Corp. (2015–2017). | |
| | | | | | |
Jay S. Fitton | Secretary | Indefinite | N/A | Assistant Vice President, | N/A |
615 E. Michigan St. | | Term; Since | | U.S. Bancorp Fund Services, | |
Milwaukee, WI 53202 | | July 22, | | LLC (2019–present); Partner, | |
Year of Birth: 1970 | | 2019 | | Practus, LLP (2018–2019); | |
| | | | | Counsel, Drinker Biddle & | |
| | | | | Reath LLP (2016–2018). | |
| | | | | | |
Kelly A. Strauss | Assistant | Indefinite | N/A | Assistant Vice President, | N/A |
615 E. Michigan St. | Treasurer | Term; Since | | U.S. Bancorp Fund | |
Milwaukee, WI 53202 | | April 23, | | Services, LLC | |
Year of Birth: 1987 | | 2015 | | (2011–present). | |
| | | | | | |
Melissa Aguinaga | Assistant | Indefinite | N/A | Assistant Vice President, | N/A |
615 E. Michigan St. | Treasurer | Term; Since | | U.S. Bancorp Fund | |
Milwaukee, WI 53202 | | July 1, | | Services, LLC | |
Year of Birth: 1987 | | 2015 | | (2010–present). | |
| | | | | | |
Laura A. Caroll | Assistant | Indefinite | N/A | Assistant Vice President, | N/A |
615 E. Michigan St. | Treasurer | Term; Since | | U.S. Bancorp Fund | |
Milwaukee, WI 53202 | | August 20, | | Services, LLC | |
Year of Birth: 1985 | | 2018 | | (2007–present). | |
BARRETT
GROWTH FUND
A NOTE ON FORWARD LOOKING STATEMENTS (Unaudited)
Except for historical information contained in this report for the Fund, the matters discussed in this report may constitute forward-looking statements made pursuant to the safe-harbor provisions of the Securities Litigation Reform Act of 1995. These include any adviser or portfolio manager predictions, assessments, analyses or outlooks for individual securities, industries, market sectors and/or markets. These statements involve risks and uncertainties. In addition to the general risks described for the Fund in the current Prospectus, other factors bearing on this report include the accuracy of the Adviser’s or portfolio managers’ forecasts and predictions, and the appropriateness of the investment programs designed by the Adviser or portfolio managers to implement their strategies efficiently and effectively. Any one or more of these factors, as well as other risks affecting the securities markets and investment instruments generally, could cause the actual results of the Fund to differ materially as compared to benchmarks associated with the Fund.
ADDITIONAL INFORMATION (Unaudited)
The Fund has adopted proxy voting policies and procedures that delegate to the Adviser the authority to vote proxies. A description of the Fund’s proxy voting policies and procedures is available without charge, upon request, by calling the Fund toll free at 1-877-363-6333. A description of these policies and procedures is also included in the Fund’s Statement of Additional Information, which is available on the SEC’s website at http://www.sec.gov.
The Fund’s proxy voting record for the most recent 12-month period ended June 30, is available without charge, either upon request by calling the Fund toll free at 1-877-363-6333 or by accessing the SEC’s website at http://www.sec.gov.
The Fund files a complete schedule of its portfolio holdings with the SEC for the first and third quarter of each fiscal year on Part F of Form N-PORT. Shareholders may view the Part F of Form N-PORT reports on the SEC’s website at http://www.sec.gov.
HOUSEHOLDING (Unaudited)
In an effort to decrease costs, the Fund intends to reduce the number of duplicate prospectuses, supplements and certain other shareholder documents you receive by sending only one copy of each to those addresses shared by two or more accounts and to shareholders the Fund reasonably believes are from the same family or household. Once implemented, if you would like to discontinue householding for your accounts, please call toll-free at 1-877-363-6333 to request individual copies of these documents. Once the Fund receives notice to stop householding, the Fund will begin sending individual copies 30 days after receiving your request. This policy does not apply to account statements.
(This Page Intentionally Left Blank.)
BARRETT GROWTH FUND
c/o U.S. Bank Global Fund Services
615 East Michigan Street
Milwaukee, Wisconsin 53202
INVESTMENT ADVISER
Barrett Asset Management, LLC
90 Park Avenue, 34th Floor
New York, New York 10016
DISTRIBUTOR
Quasar Distributors, LLC
111 East Kilbourn Avenue, Suite 2200
Milwaukee, Wisconsin 53202
ADMINISTRATOR, FUND ACCOUNTANT
& TRANSFER AGENT
U.S. Bancorp Fund Services, LLC
615 East Michigan Street
Milwaukee, Wisconsin 53202
CUSTODIAN
U.S. Bank National Association
Custody Operations
1555 North RiverCenter Drive, Suite 302
Milwaukee, Wisconsin 53212
LEGAL COUNSEL
Godfrey & Kahn, S.C.
833 East Michigan Street, Suite 1800
Milwaukee, Wisconsin 53202
INDEPENDENT REGISTERED PUBLIC ACCOUNTING FIRM
Cohen & Company, Ltd.
342 North Water Street, Suite 830
Milwaukee, Wisconsin 53202
This report is intended for shareholders of the Fund and may not be used as sales literature unless preceded or accompanied by a current prospectus.
Item 2. Code of Ethics.
The registrant has adopted a code of ethics that applies to the registrant’s principal executive officer and principal financial officer. The registrant has not made any substantive amendments to its code of ethics during the period covered by this report. The registrant has not granted any waivers from any provisions of the code of ethics during the period covered by this report. A copy of the registrant’s Code of Ethics is incorporated by reference to the Registrant’s Form N-CSR filed on August 6, 2010.
Item 3. Audit Committee Financial Expert.
The registrant’s board of trustees has determined that there is at least one audit committee financial expert serving on its audit committee. Dr. Michael Akers is the “audit committee financial expert” and is considered to be “independent” as each term is defined in Item 3 of Form N‑CSR. Dr. Akers holds a Ph.D. in accountancy and is a professor Emeritus of accounting at Marquette University in Milwaukee, Wisconsin.
Item 4. Principal Accountant Fees and Services.
The registrant has engaged its principal accountant to perform audit services, audit-related services, tax services and other services during the past two fiscal years. “Audit services” refer to performing an audit of the registrant's annual financial statements or services that are normally provided by the accountant in connection with statutory and regulatory filings or engagements for those fiscal years. “Audit-related services” refer to the assurance and related services by the principal accountant that are reasonably related to the performance of the audit. “Tax services” refer to professional services rendered by the principal accountant for tax compliance, tax advice, and tax planning. The following table details the aggregate fees billed or expected to be billed for each of the last two fiscal years for audit fees, audit-related fees, tax fees and other fees by the principal accountant.
| | FYE 5/31/2022 | FYE 5/31/2021 |
| (a) Audit Fees | $14,500 | $14,500 |
| (b) Audit-Related Fees | $0 | $0 |
| (c) Tax Fees | $3,000 | $3,000 |
| (d) All Other Fees | $0 | $0 |
(e)(1) The audit committee has adopted pre-approval policies and procedures that require the audit committee to pre‑approve all audit and non‑audit services of the registrant, including services provided to any entity affiliated with the registrant.
(e)(2) The percentage of fees billed by Cohen & Company Ltd. applicable to non-audit services pursuant to waiver of pre-approval requirement were as follows:
| | FYE 5/31/2022 | FYE 5/31/2021 |
Audit-Related Fees | 0% | 0% |
Tax Fees | 0% | 0% |
All Other Fees | 0% | 0% |
(f) All of the principal accountant’s hours spent on auditing the registrant’s financial statements were attributed to work performed by full‑time permanent employees of the principal accountant.
(g) The following table indicates the non-audit fees billed or expected to be billed by the registrant’s accountant for services to the registrant and to the registrant’s investment adviser (and any other controlling entity, etc.—not sub-adviser) for the last two years.
Non-Audit Related Fees | FYE 5/31/2022 | FYE 5/31/2021 |
Registrant | $0 | $0 |
Registrant’s Investment Adviser | $0 | $0 |
(h) The audit committee of the board of trustees/directors has considered whether the provision of non-audit services that were rendered to the registrant's investment adviser is compatible with maintaining the principal accountant's independence and has concluded that the provision of such non-audit services by the accountant has not compromised the accountant’s independence.
(i) Not applicable
(j) Not applicable
Item 5. Audit Committee of Listed Registrants.
Not applicable to registrants who are not listed issuers (as defined in Rule 10A-3 under the Securities Exchange Act of 1934).
Item 6. Investments.
(a) | Schedule of Investments is included as part of the report to shareholders filed under Item 1 of this Form. |
Item 7. Disclosure of Proxy Voting Policies and Procedures for Closed-End Management Investment Companies.
Not applicable to open-end investment companies.
Item 8. Portfolio Managers of Closed-End Management Investment Companies.
Not applicable to open-end investment companies.
Item 9. Purchases of Equity Securities by Closed‑End Management Investment Company and Affiliated Purchasers.
Not applicable to open-end investment companies.
Item 10. Submission of Matters to a Vote of Security Holders.
There have been no material changes to the procedures by which shareholders may recommend nominees to the registrant’s board of trustees.
Item 11. Controls and Procedures.
(a) | The Registrant’s President and Treasurer have reviewed the Registrant's disclosure controls and procedures (as defined in Rule 30a-3(c) under the Investment Company Act of 1940 (the “Act”)) as of a date within 90 days of the filing of this report, as required by Rule 30a-3(b) under the Act and Rules 13a-15(b) or 15d‑15(b) under the Securities Exchange Act of 1934. Based on their review, such officers have concluded that the disclosure controls and procedures are effective in ensuring that information required to be disclosed in this report is appropriately recorded, processed, summarized and reported and made known to them by others within the Registrant and by the Registrant’s service provider. |
(b) | There were no changes in the Registrant's internal control over financial reporting (as defined in Rule 30a-3(d) under the Act) that occurred during the period covered by this report that have materially affected, or are reasonably likely to materially affect, the Registrant's internal control over financial reporting. |
Item 12. Disclosure of Securities Lending Activities for Closed-End Management Investment Companies
Not applicable to open-end investment companies.
Item 13. Exhibits.
(3) Any written solicitation to purchase securities under Rule 23c‑1 under the Act sent or given during the period covered by the report by or on behalf of the registrant to 10 or more persons. Not applicable to open-end investment companies.
(4) Change in the registrant’s independent public accountant. There was no change in the registrant’s independent public accountant for the period covered by this report.
SIGNATURES
Pursuant to the requirements of the Securities Exchange Act of 1934 and the Investment Company Act of 1940, the registrant has duly caused this report to be signed on its behalf by the undersigned, thereunto duly authorized.
(Registrant) Trust for Professional Managers
By (Signature and Title) /s/John Buckel
John Buckel, President
Date �� August 1, 2022
Pursuant to the requirements of the Securities Exchange Act of 1934 and the Investment Company Act of 1940, this report has been signed below by the following persons on behalf of the registrant and in the capacities and on the dates indicated.
By (Signature and Title) /s/John Buckel
John Buckel, President
Date August 1, 2022
By (Signature and Title) /s/Jennifer Lima
Jennifer Lima, Treasurer
Date August 1, 2022