UNITED STATES
SECURITIES AND EXCHANGE COMMISSION
Washington, D.C. 20549
FORM N-CSR
CERTIFIED SHAREHOLDER REPORT OF REGISTERED
MANAGEMENT INVESTMENT COMPANIES
Investment Company Act file number 811-10401
Trust for Professional Managers
(Exact name of registrant as specified in charter)
615 East Michigan Street
Milwaukee, WI 53202
(Address of principal executive offices) (Zip code)
Jay S. Fitton
U.S. Bancorp Fund Services, LLC
615 East Michigan Street
Milwaukee, WI 53202
(Name and address of agent for service)
(513)-629-8104
Registrant’s telephone number, including area code
Date of fiscal year end: August 31, 2022
Date of reporting period: August 31, 2022
Item 1. Reports to Stockholders.
(a)
PMC Funds
PMC Core Fixed Income Fund
Advisor Class Shares: (PMFIX)
Institutional Class Shares: (PMFQX)
PMC Diversified Equity Fund
Advisor Class Shares: (PMDEX)
Institutional Class Shares: (PMDQX)
Annual Report
August 31, 2022
Table of Contents
PMC Funds
Letter to Shareholders
To our Shareholders:
We are pleased to present you with the Annual Report for the PMC Funds mutual fund family. This report covers both the fiscal quarter and one-year period ended August 31, 2022.
The table below presents the standardized performance of the PMC Funds relative to their respective benchmarks. The past twelve month period has been one in which the global economy has been grappling with levels of inflation last seen more than 40 years ago, the Russia-Ukraine war, and continued aftershocks of the pandemic related lockdowns. The primary drivers of the significant inflation levels the economy is now experiencing are the trillions of dollars of Covid related stimulus coursing through the system which was legislated by Congress, and soaring energy prices in part a result of the Biden administration’s desire to force an abrupt transition to a green economy. Far from being a “transitory” blip, as U.S. Treasury Secretary Janet Yellen and Federal Reserve Chairman Jay Powell indicated it would be a year ago, the rise in inflation has jumped to more than 8%, a level last seen in the Carter administration in the 1970s. Since the beginning of 2022, the Fed has been very hawkish in trying to douse inflation’s flames, raising the fed funds rate three percentage points to a range of 3%-3.25%. The high inflation rate, and the Fed’s attempts to corral it, have conspired to send bond yields surging, stock prices plummeting, and tip the U.S. economy toward recession. Also negatively impacting the economy has been ongoing supply chain issues related to the pandemic lockdowns. Many goods reliant on the supply chain – such as automobile parts - remain scarce. The Russia-Ukraine war has also been an economic growth inhibitor, affecting everything from food to energy, and there is currently little expectation the war will end in the near term. The U.S. economy has struggled over the past six months in particular, posting negative growth of -1.6% and 0.6% in this year’s first and second calendar quarters, respectively. The unemployment rate, which had surged to about 15% at the height of the pandemic in 2020, has consistently trended down over the past year, with the latest reading as of August 31 coming in at 3.7%. Stock prices have stumbled over the past year, with investors being hurt by an unfavorable environment that includes slumping economic growth, surging interest rates, and a poor performance in most other major asset classes. The political environment also created concerns for investors, with the midterm elections approaching in November. There are a number of hot-button issues that may determine the composition of the next Congress, including the Biden administration’s handling of the border crisis and abortion.
The Bureau of Economic Analysis reported its second estimate of second quarter 2022 gross domestic product (GDP) of -0.6%, slightly better than the prior estimate, and also modestly less negative than the first quarter 2022 reading. The employment situation continued to improve over the past three months, with employers adding 293,000, 526,000 and 315,000 jobs in June, July and August, respectively. The August report showed an average of approximately 378,000 jobs added each month of the quarter, and that the unemployment rate fell to 3.7%. The Federal Open Market Committee (FOMC) turned hawkish, ratcheting up the fed funds rate target range to 3% to 3.25%, due to the significant rise in inflation. The central bank also began to unwind its balance sheet in 2022.
In general, financial markets have generated poor results over the past year, with broad-based stock indexes declining due to the surge in inflation and attendant rise in bond yields. The S&P 500 Index declined more than 11% over the twelve months ended August 31, 2022. The yield on the 10-year U.S. Treasury climbed from 1.3% to 3.2% over the twelve months ended August 31, 2022.
3
Total Returns as of August 31, 2022*
*Periods of Less than 1-Year Are Unannualized
| | | | | | | | | | | | | | | | | | | | | | | | | | | | | | | | |
Fund
| | Three
Months
| | | Six
Months
| | | One
Year
| | | Five
Year
| | | Ten
Year
| | | Since
Inception
| | | Inception
Date
| | | Gross
Expense
Ratio***
| |
PMC Diversified Equity Fund (Advisor Class) | | | -6.78 | % | | | -11.39 | % | | | -15.34 | % | | | 5.17 | % | | | 7.68 | % | | | 8.26 | % | | | 8-26-09 | | | | 0.97 | % |
PMC Diversified Equity Fund (Inst. Class) | | | -6.74 | % | | | -11.24 | % | | | -15.13 | % | | | NA | | | | NA | | | | 5.25 | %** | | | 7-1-19 | | | | 0.68 | % |
MSCI World Index Net Return | | | -5.53 | % | | | -10.94 | % | | | -15.08 | % | | | 7.85 | % | | | 9.47 | % | | | 9.09 | % | | | | | | | | |
| | | | | | | | |
PMC Core Fixed Income Fund (Advisor Class) | | | -2.19 | % | | | -7.89 | % | | | -12.20 | % | | | 0.65 | % | | | 1.24 | % | | | 3.49 | % | | | 9-28-07 | | | | 1.21 | % |
PMC Core Fixed Income Fund (Inst. Class) | | | -2.07 | % | | | -7.75 | % | | | -11.95 | % | | | NA | | | | NA | | | | -0.36 | %** | | | 7-1-19 | | | | 0.95 | % |
Bloomberg U.S. Aggregate Bond Index | | | -2.01 | % | | | -7.76 | % | | | -11.52 | % | | | 0.52 | % | | | 1.35 | % | | | 3.05 | % | | | | | | | | |
| ** | | Performance shown as of Institutional Class inception date of 7-1-19. |
| *** | | Per the Prospectus dated 12-29-21. |
The S&P 500 Index represents a broad cross-section of the U.S. equity market, including common stocks traded on U.S. exchanges. The MSCI World Index Net Return captures large and mid-cap representation across 23 Developed Markets countries. The Bloomberg U.S. Aggregate Bond Index is a broad-based flagship benchmark that measures the investment grade, U.S. dollar-denominated, fixed-rate taxable bond market. An investor cannot invest directly in an index.
Past performance is no guarantee of future returns. Current performance may be higher or lower than the performance data shown. Investment return and principal value will fluctuate so that an investor’s shares, when redeemed, may be worth more or less than original cost. For the most recent month-end performance, please visit the Funds’ website at www.investpmc.com or by calling 866-762-7338. Performance results reflect contractual expense subsidies and waivers in effect until December 29, 2022; without these waivers, returns would have been less favorable.
PMC Diversified Equity Fund
The PMC Diversified Equity Fund was launched on August 26, 2009, and provides broad equity asset class exposure, diversified globally. The Fund’s investment objective is long-term capital appreciation.
One of the primary drivers of the Fund’s performance is its exposure to the well-known value, momentum and quality asset pricing factors. Over the past year asset pricing factors on balance have performed well. The one significant exception is the so-called “size” factor, which is the tendency for stocks with smaller market capitalizations within an index to outperform those with larger market capitalizations. In market environments in which stock prices are volatile and declining, smaller cap stocks typically underperform larger cap issues. The mixed factor performance translated into Fund performance that was in line with the benchmark over the twelve-month period ending August 31, 2022. For the most recent three-month period, the Advisor Class of the Fund generated a return of -6.78%, underperforming the -5.53% return of the MSCI World Index Net Return, the Fund’s benchmark index. For the twelve months ended August 31, 2022, the Advisor Class of the Fund generated a total return of -15.34%, in line with the -15.08% return of the benchmark. The primary driver of the Fund’s performance during the year was the aggregate performance of the asset pricing factors toward which the portfolio is tilted. The Fund has maintained positive tilts to the size, value, momentum and quality factors. The Fund’s orientation toward value stocks was a key positive contributor to the performance relative to the benchmark, and its exposure to the momentum and quality factors was also additive to relative performance. However, performance was negatively impacted by having a lower weighted average market capitalization than the benchmark, as stocks of smaller companies significantly underperformed stocks of larger companies. Relative performance was also disadvantaged during both the most recent three- and six-month periods ended August 31, 2022 from an underweight to domestic equities relative to European equities. Among the positive contributors to performance during the year were modest underweights to the information technology and communications services sectors. Security selection in the communications services, information technology, and materials sectors also contributed positively to performance during the year. Among the detractors from performance was security selection in the health care, energy and financials sectors. As is typically the case, the Fund’s factor orientation resulted in over- or
4
underweights to specific stocks that have a meaningful impact on performance. Over the past twelve months underweights to well-known companies such as Apple, Inc. (AAPL) and Chevron Corp. (CVX) resulted in underperformance. However, underweights to Meta Platforms, Inc. (META), Amazon, Inc. (AMZN) and PayPal Holdings, Inc. (PYPL) benefited performance.
In addition to the risk that the investment strategy employed in the Fund will underperform the benchmark index generally, the primary risks continue to primarily involve systematic risk. Because the Adviser controls the risk of the portfolio relative to the benchmark, the overall portfolio should track the Fund’s benchmark fairly closely on a relative basis. However, in general market declines the Fund’s fully invested strategy would incur a setback commensurate with the decline in the benchmark.
PMC Core Fixed Income Fund
The PMC Core Fixed Income Fund provides broad exposure to the core segments of the domestic fixed income market. The Fund’s investment objective is to provide current income consistent with low volatility of principal, and in addition to the Adviser, one sub-adviser manages a portion of the Fund assets: Neuberger Berman Investment Advisers LLC.
Over the past 12 months the environment for fixed income securities has been one of significantly rising yields resulting from the FOMC’s decision to aggressively raise short-term interest rates in an effort to combat decades-high inflation. The FOMC recently raised the fed funds rate to a range of 3.0%-3.25%, up a full three percentage points over the year-ago level. In addition, economists expect the FOMC to raise rates twice more in the remainder of 2022 by an aggregate of more than one percentage point. Against this backdrop, the Fund generated negative returns for the three-month and one-year periods ended August 31, 2022. For the most recent three-month period, the Advisor Class of the Fund generated a return of -2.19%, slightly underperforming the benchmark Bloomberg U.S. Aggregate Bond Index return of -2.01%. For the twelve months ended August 31, 2022, the Advisor Class of the Fund posted a return of -12.20%, underperforming the benchmark return of -11.52%. The primary factors positively impacting performance over the past 12-month period were an overweight to cash and security selection within the securitized note segment. The primary detractors from performance included the Fund’s aggregate underweight to U.S. Treasury securities, and an overweight to corporate securities, as well as security selection in the U.S. Treasury and government-related securities areas.
The primary risks to the strategies employed by the Fund’s sub-adviser remain in place, and exist at both the macro level and in individual security selection. Due to the Fund’s aggregate overweight exposure to credit securities, the Fund remains likely to underperform the benchmark somewhat if the Federal Reserve makes a policy misstep, and U.S. Treasury securities consequently rise relative to credits. In addition, if the general level of interest rates continues to rise rapidly, the Fund will not be immune to further losses. Similarly, if certain of the individual credits currently owned by the Fund are adversely affected by economic events, the Fund itself will also be affected.
Remarks
U.S. consumers and investors have become increasingly pessimistic this year as a result of historically high inflation, the FOMC’s aggressive interest rate increases, and the war in Ukraine, among other things. High inflation continues to be the biggest challenge confronting the world’s policymakers. As a result, world central banks have begun to tighten monetary policy after more than a decade of quantitative easing. Restrictive monetary policy is not always an effective tool to dampen inflation resulting from supply-side pressures, and a primary concern with rising interest rates and tighter monetary policy is recession. Many economists believe that if the U.S. economy is not currently in a recession, it is only a matter of time, and the FOMC seems willing to accept that outcome. Nervous consumers and investors waylaid by the combination of rising interest rates and high inflation could see additional asset valuation erosion. There are a number of potential downside risks outlined by economists, including a continuation of the negative supply shock resulting in part from the war in Ukraine; the potential for spread of future Covid variants; the global semiconductor shortage; and property market weakness in countries where real estate valuations have been surging.
5
As always, we appreciate your continued trust and confidence in the PMC Funds. We will continue to do all we can to ensure that such trust and confidence are well placed, and will manage the PMC Funds with that goal clearly in mind.

Brandon R. Thomas
Co-Founder and Chief Investment Officer
Envestnet
6
Envestnet Asset Management
The views in this report were those of the Funds’ investment adviser and the PMC Core Fixed Income Fund’s sub-adviser as of the date of this report, and may not reflect their views on the date the report is first published or anytime thereafter. These views are intended to assist the shareholders of the Funds in understanding their investments in the Funds and do not constitute investment advice.
Quantitative easing is a monetary policy strategy used by central banks to keep credit flowing to the economy.
Diversification neither assures a profit nor guarantees against loss in a declining market.
Holdings are subject to change and are not a recommendation to buy or sell any security. Please see the schedule of holdings for a full list of fund holdings.
Investments in smaller companies carry greater risk than is customarily associated with larger companies for various reasons such as volatility of earnings and prospects, higher failure rates, and limited markets, product lines or financial resources. Investing overseas involves special risks, including the volatility of currency exchange rates and, in some cases, limited geographic focus, political and economic instability, and relatively illiquid markets. Income (bond) funds are subject to interest rate risk, which is the risk that debt securities in a fund’s portfolio will decline in value because of increases in market interest rates. Please see the prospectus (https://www.investpmc.com/sites/default/files/documents/PMC%20Statutory%20Prospectus%202021%20%2812.29.21%29.pdf) for a complete description of the risks associated with investing in the PMC Funds.
PMC Funds are distributed by Foreside Fund Services, LLC.
7
PMC FUNDS
Expense Examples
(Unaudited)
As a shareholder of the PMC Core Fixed Income Fund or the PMC Diversified Equity Fund (each a “Fund”, and together the “Funds”), you incur two types of costs: (1) transaction costs and (2) ongoing costs, including management fees, distribution (12b-1) fees (Advisor Class shares only) and other Fund expenses. This Example is intended to help you understand your ongoing costs (in dollars) of investing in the Funds, and to compare these costs with the ongoing costs of investing in other mutual funds. The Example is based on an investment of $1,000 invested at the beginning of the period and held for the entire period (March 1, 2022 - August 31, 2022).
The first lines of the following tables provide information about actual account values and actual expenses. Although the Funds do not charge a sales load, you will be assessed fees for outgoing wire transfers, returned checks and stop payment orders at prevailing rates charged by U.S. Bancorp Fund Services, LLC, the Funds’ transfer agent. Individual Retirement Accounts (“IRA”) will be charged a $15.00 annual maintenance fee. To the extent the Funds invest in shares of exchange-traded funds or other investment companies as part of their investment strategy, you will indirectly bear your proportionate share of any fees and expenses charged by the underlying funds in which the Funds invest in addition to the direct expenses of the Funds. Actual expenses of the underlying funds are expected to vary among the various underlying funds. These expenses are not included in the Example. The Example includes, but is not limited to, management fees, distribution (12b-1) fees, fund administration and accounting, custody and transfer agent fees. You may use the information in this line, together with the amount you invested, to estimate the expenses that you paid over the period. Simply divide your account value by $1,000 (for example, an $8,600 account value divided by $1,000 = 8.6), then multiply the result by the number in the first line under the heading entitled “Expenses Paid During Period” to estimate the expenses you paid on your account during this period.
| | Hypothetical | | Example for Comparison Purposes |
The second lines of the following tables provide information about hypothetical account values and hypothetical expenses based on the Funds’ actual expense ratio and an assumed rate of return of 5% per year before expenses, which is not the Funds’ actual returns. The hypothetical account values and expenses may not be used to estimate the actual ending account balance or expenses you paid for the period. You may use this information to compare the ongoing costs of investing in the Funds and other funds. To do so, compare this 5% hypothetical example with the 5% hypothetical examples that appear in the shareholder reports of other funds. Please note that the expenses shown in the table are meant to highlight your ongoing costs only and do not reflect any transactional costs, such as sales charges (loads), or exchange fees. Therefore, the second lines of the tables are useful in comparing ongoing costs only, and will not help you determine the relative total costs of owning different funds. In addition, if these transactional costs were included, your costs would have been higher.
| | | | | | | | | | | | |
| | | Beginning
Account Value
3/1/22
| | | Ending
Account Value
8/31/22
| | | Expenses Paid
During Period
3/1/22-8/31/22*
| |
PMC Core Fixed Income Fund–Advisor Class | | | | | | | | | | | | |
Actual | | $ | 1,000.00 | | | $ | 921.10 | | | $ | 4.12 | |
Hypothetical (5% return before expenses) | | | 1,000.00 | | | | 1,020.92 | | | | 4.33 | |
| * | | Expenses are equal to the Fund’s annualized expense ratio of 0.85%, multiplied by the average account value over the period, multiplied by 184/365 to reflect the one-half year period. |
| | | | | | | | | | | | |
| | | Beginning
Account Value
3/1/22
| | | Ending
Account Value
8/31/22
| | | Expenses Paid
During Period
3/1/22-8/31/22*
| |
PMC Core Fixed Income Fund–Institutional Class | | | | | | | | | | | | |
Actual | | $ | 1,000.00 | | | $ | 922.50 | | | $ | 2.91 | |
Hypothetical (5% return before expenses) | | | 1,000.00 | | | | 1,022.18 | | | | 3.06 | |
| * | | Expenses are equal to the Fund’s annualized expense ratio of 0.60%, multiplied by the average account value over the period, multiplied by 184/365 to reflect the one-half year period. |
8
| | | | | | | | | | | | |
| | | Beginning
Account Value
3/1/22
| | | Ending
Account Value
8/31/22
| | | Expenses Paid
During Period
3/1/22-8/31/22*
| |
PMC Diversified Equity Fund–Advisor Class | | | | | | | | | | | | |
Actual | | $ | 1,000.00 | | | $ | 886.10 | | | $ | 4.42 | |
Hypothetical (5% return before expenses) | | | 1,000.00 | | | | 1,020.52 | | | | 4.74 | |
| * | | Expenses are equal to the Fund’s annualized expense ratio of 0.93%, multiplied by the average account value over the period, multiplied by 184/365 to reflect the one-half year period. |
| | | | | | | | | | | | |
| | | Beginning
Account Value
3/1/22
| | | Ending
Account Value
8/31/22
| | | Expenses Paid
During Period
3/1/22-8/31/22*
| |
PMC Diversified Equity Fund–Institutional Class | | | | | | | | | | | | |
Actual | | $ | 1,000.00 | | | $ | 887.60 | | | $ | 3.24 | |
Hypothetical (5% return before expenses) | | | 1,000.00 | | | | 1,021.78 | | | | 3.47 | |
| * | | Expenses are equal to the Fund’s annualized expense ratio of 0.68%, multiplied by the average account value over the period, multiplied by 184/365 to reflect the one-half year period. |
9
PMC CORE FIXED INCOME FUND (PMFIX, PMFQX)
Investment Highlights (Unaudited)
The investment objective of the Fund is to provide current income consistent with low volatility of principal. The Fund’s allocation of portfolio holdings as of August 31, 2022 is shown below.
Allocation of Portfolio Holdings
% of Net assets
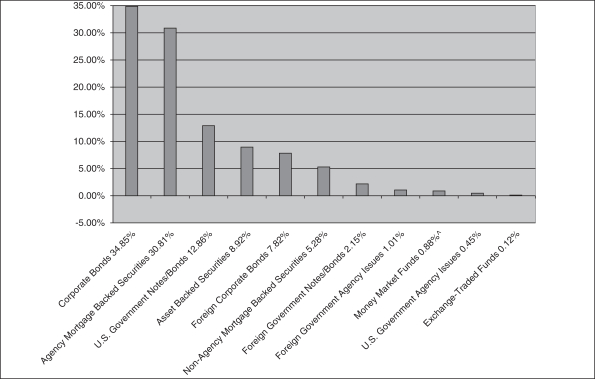
| ^ | | Excludes securities lending collateral. |
10
PMC CORE FIXED INCOME FUND–ADVISOR CLASS (PMFIX)
Investment Highlights (Unaudited) (Continued)
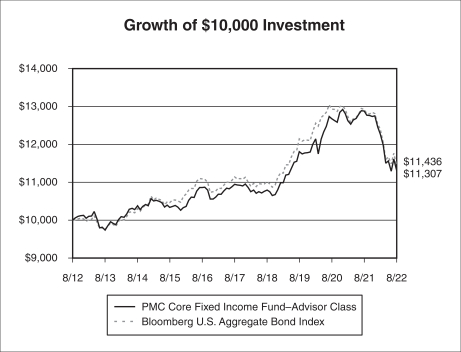
Average Annual Returns as of August 31, 2022
| | | | | | | | |
| | | PMC Core
Fixed Income
Fund–Advisor
Class
| | | Bloomberg U.S.
Aggregate Bond
Index
| |
One Year | | | -12.20 | % | | | -11.52 | % |
Five Year | | | 0.65 | % | | | 0.52 | % |
Ten Year | | | 1.24 | % | | | 1.35 | % |
Since Inception (9/28/07) | | | 3.49 | % | | | 3.05 | % |
| | |
|
|
| |
|
|
|
Performance data quoted represents past performance and does not guarantee future results. The investment return and principal value of an investment will fluctuate so that an investor’s shares, when redeemed, may be worth more or less than their original cost. Current performance of the Fund may be lower or higher than the performance quoted. Performance data current to the most recent month end may be obtained by calling the Fund (toll free) at (866) PMC-7338.
Short-term performance, in particular, is not a good indication of the Fund’s future performance, and an investment should not be made based solely on historical returns.
Investment performance reflects fee waivers in effect. In the absence of such waivers, total return would be reduced.
The returns shown assume reinvestment of Fund distributions and do not reflect the deduction of taxes that a shareholder would pay on Fund distributions or the redemption of Fund shares. The graph illustrates performance of a hypothetical investment made in the Fund and a broad-based securities index on August 31, 2012. The graph does not reflect any future performance.
The Bloomberg U.S. Aggregate Bond Index is an index composed of U.S. securities in Treasury, Government-Related, Corporate and Securitized Sectors. It includes securities that are of investment-grade quality or better, have at least one year to maturity and have an outstanding par value of at least $250 million.
One cannot invest directly in an index.
11
PMC CORE FIXED INCOME FUND–INSTITUTIONAL CLASS (PMFQX)
Investment Highlights (Unaudited) (Continued)
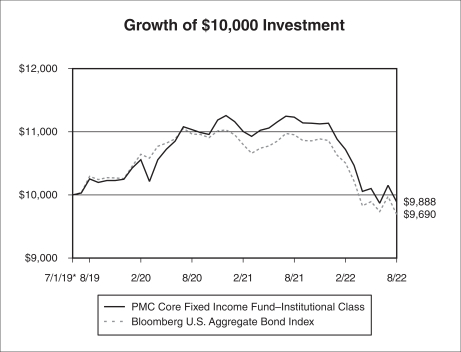
Average Annual Returns as of August 31, 2022
| | | | | | | | |
| | | PMC Core
Fixed Income
Fund–Institutional
Class
| | | Bloomberg U.S.
Aggregate Bond
Index
| |
One Year | | | -11.95 | % | | | -11.52 | % |
Since Inception (7/1/19) | | | -0.36 | % | | | -0.99 | % |
| | |
|
|
| |
|
|
|
Performance data quoted represents past performance and does not guarantee future results. The investment return and principal value of an investment will fluctuate so that an investor’s shares, when redeemed, may be worth more or less than their original cost. Current performance of the Fund may be lower or higher than the performance quoted. Performance data current to the most recent month end may be obtained by calling the Fund (toll free) at (866) PMC-7338.
Short-term performance, in particular, is not a good indication of the Fund’s future performance, and an investment should not be made based solely on historical returns.
Investment performance reflects fee waivers in effect. In the absence of such waivers, total return would be reduced.
The returns shown assume reinvestment of Fund distributions and do not reflect the deduction of taxes that a shareholder would pay on Fund distributions or the redemption of Fund shares. The graph illustrates performance of a hypothetical investment made in the Fund and a broad-based securities index on July 1, 2019, the inception date of the Institutional Class. The graph does not reflect any future performance.
The Bloomberg U.S. Aggregate Bond Index is an index composed of U.S. securities in Treasury, Government-Related, Corporate and Securitized Sectors. It includes securities that are of investment-grade quality or better, have at least one year to maturity and have an outstanding par value of at least $250 million.
One cannot invest directly in an index.
12
PMC DIVERSIFIED EQUITY FUND (PMDEX, PMDQX)
Investment Highlights (Unaudited)
The investment objective of the Fund is long-term capital appreciation. The Fund’s allocation of portfolio holdings as of August 31, 2022 is shown below.
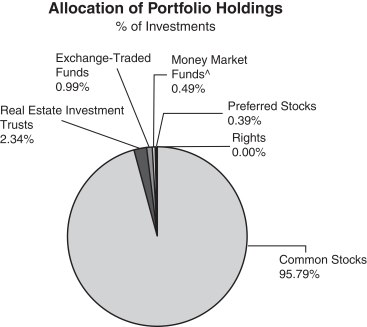
| | ^ | | Excludes securities lending collateral. |
13
PMC DIVERSIFIED EQUITY FUND–ADVISOR CLASS (PMDEX)
Investment Highlights (Unaudited) (Continued)
Average Annual Returns as of August 31, 2022
| | | | | | | | |
| | | PMC Diversified
Equity Fund–
Advisor Class
| | | MSCI
World Index
Net Return
| |
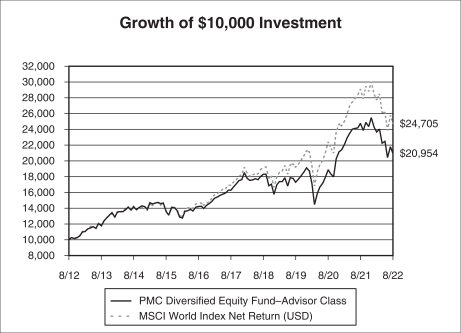
One Year | | | -15.34 | % | | | -15.08 | % |
Five Year | | | 5.17 | % | | | 7.85 | % |
Ten Year | | | 7.68 | % | | | 9.47 | % |
Since Inception (8/26/09) | | | 8.26 | % | | | 9.09 | % |
| | |
|
|
| |
|
|
|
On May 25, 2018, Envestnet Asset Management, Inc. (the “Adviser”), the Fund’s investment adviser, assumed all responsibilities for selecting investments in the Fund’s portfolio in connection with a change to the Fund’s investment strategies. The Fund’s performance prior to this date reflects the Fund’s returns achieved when the Adviser actively managed a portion of the Fund’s portfolio and used a “manager of managers” investment strategy by engaging sub-advisers to manage other portions of the Fund’s portfolio.
Performance data quoted represents past performance and does not guarantee future results. The investment return and principal value of an investment will fluctuate so that an investor’s shares, when redeemed, may be worth more or less than their original cost. Current performance of the Fund may be lower or higher than the performance quoted. Performance data current to the most recent month end may be obtained by calling the Fund (toll free) at (866) PMC-7338.
Short-term performance, in particular, is not a good indication of the Fund’s future performance, and an investment should not be made based solely on historical returns.
Investment performance reflects fee waivers in effect. In the absence of such waivers, total return would be reduced.
The returns shown assume reinvestment of Fund distributions and do not reflect the deduction of taxes that a shareholder would pay on Fund distributions or the redemption of Fund shares. The graph illustrates performance of a hypothetical investment made in the Fund and a broad-based securities index on August 31, 2012. The graph does not reflect any future performance.
The MSCI World Index Net Return is a free float-adjusted market capitalization weighted index that is designed to measure the equity market performance of developed markets. Net return indices reinvest dividends after the deduction of taxes, using a tax rate applicable to non-resident investors who do not benefit from table taxation treaties. The MSCI World Index consists of the following 23 developed market country indices: Australia, Austria, Belgium, Canada, Denmark, Finland, France, Germany, Hong Kong, Ireland, Israel, Italy, Japan, Netherlands, New Zealand, Norway, Portugal, Singapore, Spain, Sweden, Switzerland, the United Kingdom, and the United States.
One cannot invest directly in an index.
Continued
14
PMC DIVERSIFIED EQUITY FUND–ADVISOR CLASS (PMDEX)
Investment Highlights (Unaudited) (Continued)
15
PMC DIVERSIFIED EQUITY FUND–INSTITUTIONAL CLASS (PMDQX)
Investment Highlights (Unaudited) (Continued)
Average Annual Returns as of August 31, 2022
| | | | | | | | |
| | | PMC Diversified
Equity Fund–
Institutional Class
| | | MSCI
World Index
Net Return
| |
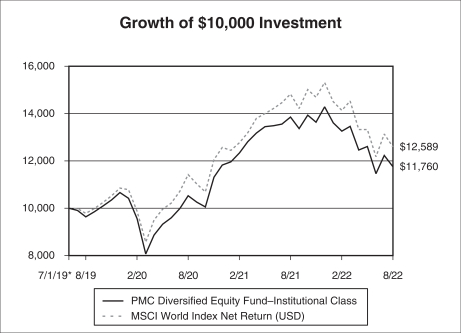
One Year | | | -15.13 | % | | | -15.08 | % |
Since Inception (7/1/19) | | | 5.25 | % | | | 7.54 | % |
| | |
|
|
| |
|
|
|
Performance data quoted represents past performance and does not guarantee future results. The investment return and principal value of an investment will fluctuate so that an investor’s shares, when redeemed, may be worth more or less than their original cost. Current performance of the Fund may be lower or higher than the performance quoted. Performance data current to the most recent month end may be obtained by calling the Fund (toll free) at (866) PMC-7338.
Short-term performance, in particular, is not a good indication of the Fund’s future performance, and an investment should not be made based solely on historical returns.
Investment performance reflects fee waivers in effect. In the absence of such waivers, total return would be reduced.
The returns shown assume reinvestment of Fund distributions and do not reflect the deduction of taxes that a shareholder would pay on Fund distributions or the redemption of Fund shares. The graph illustrates performance of a hypothetical investment made in the Fund and a broad-based securities index on July 1, 2019, the inception date of the Institutional Class. The graph does not reflect any future performance.
The MSCI World Index Net Return is a free float-adjusted market capitalization weighted index that is designed to measure the equity market performance of developed markets. Net return indices reinvest dividends after the deduction of taxes, using a tax rate applicable to non-resident investors who do not benefit from table taxation treaties. The MSCI World Index consists of the following 23 developed market country indices: Australia, Austria, Belgium, Canada, Denmark, Finland, France, Germany, Hong Kong, Ireland, Israel, Italy, Japan, Netherlands, New Zealand, Norway, Portugal, Singapore, Spain, Sweden, Switzerland, the United Kingdom, and the United States.
One cannot invest directly in an index.
16
PMC CORE FIXED INCOME FUND | Schedule of Investments |
August 31, 2022
| | | | | | | | |
| | |
| | | Principal
Amount
| | | Value
| |
| ASSET BACKED SECURITIES—8.92% | | | | | | | | |
37 Capital CLO I | | | | | |
2021-1, 3.712% (3 Month LIBOR USD + 1.200%), 10/15/2034(b)(c) | | $ | 1,000,000 | | | $ | 976,805 | |
AM Capital Funding LLC | | | | | |
2018-1, 4.980%, 12/15/2023(b) | | | 760,000 | | | | 753,240 | |
Angel Oak Mortgage Trust | | | | | |
2021-3, 1.068%, 05/25/2066(b)(d) | | | 712,416 | | | | 635,859 | |
Aqua Finance Trust | | | | | |
2021-A, 1.540%, 07/17/2046(b) | | | 580,627 | | | | 538,714 | |
Avis Budget Rental Car Funding AESOP LLC | | | | | |
2021-2A A, 1.660%, 02/20/2028(b) | | | 2,191,000 | | | | 1,959,634 | |
2021-2A B, 1.900%, 02/20/2028(b) | | | 495,000 | | | | 431,528 | |
Beacon Container Finance II LLC | | | | | |
2021-1A, 2.250%, 10/22/2046(b) | | | 973,500 | | | | 866,735 | |
BlueMountain CLO Ltd. | | | | | |
2013-2R, 3.939% (3 Month LIBOR USD + 1.180%), 10/22/2030(b)(c) | | | 362,743 | | | | 359,297 | |
Cedar Funding VI CLO Ltd. | | | | | |
2016-6A, 3.760% (3 Month LIBOR USD + 1.050%), 04/20/2034(b)(c) | | | 1,480,000 | | | | 1,432,647 | |
Crown Castle Towers LLC | | | | | |
4.241%, 07/15/2048(b) | | | 439,000 | | | | 417,503 | |
Dryden 75 CLO Ltd. | | | | | |
2019-75R2, 3.552% (3 Month LIBOR USD + 1.040%), 04/15/2034(b)(c) | | | 850,000 | | | | 832,465 | |
Fort Washington CLO Ltd. | | | | | |
2021-2A, 3.930% (3 Month LIBOR USD + 1.220%), 10/20/2034(b)(c) | | | 2,000,000 | | | | 1,952,268 | |
GCAT Trust | | | | | |
2019-NQM3, 2.686%, 11/25/2059(b)(d) | | | 128,221 | | | | 122,757 | |
2021-NQM5, 1.262%, 07/25/2066(b)(d) | | | 950,166 | | | | 803,866 | |
JPMorgan Chase Bank NA—CACLN | | | | | |
2021-3, 0.760%, 02/26/2029(b) | | | 1,244,313 | | | | 1,196,989 | |
Madison Park Funding XXVI Ltd. | | | | | |
2007-26, 4.006% (3 Month LIBOR USD + 1.200%), 07/29/2030(b)(c) | | | 2,295,000 | | | | 2,276,893 | |
Magnetite XXIII Ltd. | | | | | |
2019-23R, 3.913% (3 Month LIBOR USD + 1.130%), 01/25/2035(b)(c) | | | 1,000,000 | | | | 976,834 | |
MVW LLC | | | | | |
2021-2A A, 1.430%, 05/20/2039(b) | | | 867,879 | | | | 783,151 | |
2021-2A B, 1.830%, 05/20/2039(b) | | | 708,092 | | | | 639,949 | |
2022-1, 4.400%, 11/21/2039(b) | | | 319,638 | | | | 316,567 | |
2021-1W, 1.440%, 01/22/2041(b) | | | 387,716 | | | | 360,236 | |
Navient Private Education Refi Loan Trust | | | | | |
2021-B, 0.940%, 07/15/2069(b) | | | 1,000,552 | | | | 884,412 | |
2021-C, 1.060%, 10/15/2069(b) | | | 633,928 | | | | 568,865 | |
2021-E, 0.970%, 12/16/2069(b) | | | 1,500,313 | | | | 1,318,495 | |
Navient Student Loan Trust | | | | | |
2019-7, 2.944% (1 Month LIBOR USD + 0.500%), 01/25/2068(b)(c) | | | 278,345 | | | | 277,194 | |
PFS Financing Corp. | | | | | |
2021-B, 0.770%, 08/15/2026(b) | | | 1,890,000 | | | | 1,761,585 | |
Prestige Auto Receivables Trust | | | | | |
2021-1, 1.530%, 02/15/2028(b) | | | 599,000 | | | | 555,094 | |
RASC Trust | | | | | |
2005-KS12, 3.134% (1 Month LIBOR USD + 0.460%), 01/25/2036(c) | | | 100,557 | | | | 100,114 | |
SBA Tower Trust | | | | | |
2020-1-2, 2.328%, 01/15/2028(b) | | | 618,000 | | | | 540,215 | |
2021-3, 2.593%, 10/15/2056(b) | | | 1,243,000 | | | | 1,039,474 | |
The accompanying notes are an integral part of these financial statements.
17
PMC CORE FIXED INCOME FUND | Schedule of Investments |
August 31, 2022 (Continued)
| | | | | | | | |
| | |
| | | Principal
Amount
| | | Value
| |
Sierra Timeshare Receivables Funding LLC | | | | | |
2019-2, 2.590%, 05/20/2036(b) | | $ | 389,086 | | | $ | 379,273 | |
2020-2, 3.510%, 07/20/2037(b) | | | 456,544 | | | | 433,727 | |
2021-2, 1.350%, 09/20/2038(b) | | | 357,995 | | | | 339,231 | |
Starwood Mortgage Residential Trust | | | | | |
2021-3, 1.127%, 06/25/2056(b)(d) | | | 591,245 | | | | 488,415 | |
2021-6, 1.920%, 11/25/2066(b)(d) | | | 925,929 | | | | 825,574 | |
Taco Bell Funding LLC | | | | | |
2021-1, 1.946%, 08/25/2051(b) | | | 1,387,515 | | | | 1,212,376 | |
Thayer Park CLO Ltd. | | | | | |
2017-1, 3.750% (3 Month LIBOR USD + 1.040%), 04/20/2034(b)(c) | | | 500,000 | | | | 486,959 | |
Towd Point Mortgage Trust | | | | | |
2017-5, 3.044% (1 Month LIBOR USD + 0.600%), 02/25/2057(b)(c) | | | 200,426 | | | | 198,814 | |
2017-2, 2.750%, 04/25/2057(b)(d) | | | 14,638 | | | | 14,537 | |
2017-4, 2.750%, 06/25/2057(b)(d) | | | 112,673 | | | | 109,458 | |
2017-3, 2.750%, 07/25/2057(b)(d) | | | 134,636 | | | | 132,825 | |
TRESTLES CLO Ltd. | | | | | |
2017-1, 3.773% (3 Month LIBOR USD + 0.990%), 04/25/2032(b)(c) | | | 500,000 | | | | 490,227 | |
TRESTLES CLO V Ltd. | | | | | |
2021-5, 3.880% (3 Month LIBOR USD + 1.170%), 10/20/2034(b)(c) | | | 1,000,000 | | | | 975,923 | |
United Airlines Pass Through Trust | | | | | |
2020-1, 5.875%, 10/15/2027 | | | 1,109,220 | | | | 1,112,302 | |
Vantage Data Centers Issuer LLC | | | | | |
2019-1, 3.188%, 07/15/2044(b) | | | 1,276,520 | | | | 1,234,175 | |
2021-1, 2.165%, 10/15/2046(b) | | | 1,078,000 | | | | 955,366 | |
Verus Securitization Trust | | | | | |
2021-3, 1.046%, 06/25/2066(b)(d) | | | 781,703 | | | | 696,487 | |
2021-6, 1.630%, 10/25/2066(b)(d) | | | 1,223,700 | | | | 1,067,805 | |
Voya CLO Ltd. | | | | | |
2014-2A, 3.760% (3 Month LIBOR USD + 1.020%), 04/17/2030(b)(c) | | | 1,727,813 | | | | 1,701,707 | |
| | | | | | |
|
|
|
TOTAL ASSET BACKED SECURITIES (Cost $41,468,424) | | | | | | | 38,534,566 | |
| | | | | | |
|
|
|
| CORPORATE BONDS—34.85% | | | | | | | | |
Accommodation—0.11% | | | | | | | | |
Wyndham Hotels & Resorts, Inc. | | | | | |
4.375%, 08/15/2028(b) | | | 285,000 | | | | 255,277 | |
Wynn Las Vegas LLC | | | | | |
5.500%, 03/01/2025(b) | | | 210,000 | | | | 201,364 | |
| | | | | | |
|
|
|
| | | | | | | | 456,641 | |
| | | | | | |
|
|
|
Administrative and Support Services—1.09% | | | | | | | | |
ASGN, Inc. | | | | | |
4.625%, 05/15/2028(b) | | | 595,000 | | | | 527,105 | |
Booking Holdings, Inc. | | | | | |
3.550%, 03/15/2028 | | | 1,097,000 | | | | 1,057,708 | |
Korn Ferry | | | | | |
4.625%, 12/15/2027(b) | | | 170,000 | | | | 158,001 | |
Live Nation Entertainment, Inc. | | | | | |
4.750%, 10/15/2027(b) | | | 250,000 | | | | 227,916 | |
PayPal Holdings, Inc. | | | | | |
2.400%, 10/01/2024 | | | 1,110,000 | | | | 1,081,340 | |
Visa, Inc. | | | | | |
2.800%, 12/14/2022 | | | 1,639,000 | | | | 1,637,575 | |
| | | | | | |
|
|
|
| | | | | | | | 4,689,645 | |
| | | | | | |
|
|
|
The accompanying notes are an integral part of these financial statements.
18
PMC CORE FIXED INCOME FUND | Schedule of Investments |
August 31, 2022 (Continued)
| | | | | | | | |
| | |
| | | Principal
Amount
| | | Value
| |
Air Transportation—0.27% | | | | | | | | |
Mileage Plus Holdings LLC / Mileage Plus Intellectual Property Assets Ltd. | | | | | |
6.500%, 06/20/2027(b) | | $ | 345,000 | | | $ | 346,297 | |
Southwest Airlines Co. | | | | | |
5.250%, 05/04/2025 | | | 800,000 | | | | 822,351 | |
| | | | | | |
|
|
|
| | | | | | | | 1,168,648 | |
| | | | | | |
|
|
|
Ambulatory Health Care Services—0.07% | | | | | | | | |
Acadia Healthcare Co, Inc. | | | | | |
5.000%, 04/15/2029(b) | | | 335,000 | | | | 310,678 | |
| | | | | | |
|
|
|
Beverage and Tobacco Product Manufacturing—1.48% | | | | | | | | |
Anheuser-Busch InBev Worldwide, Inc. | | | | | |
4.700%, 02/01/2036 | | | 1,435,000 | | | | 1,387,350 | |
4.350%, 06/01/2040 | | | 1,006,000 | | | | 919,491 | |
4.600%, 04/15/2048 | | | 720,000 | | | | 656,267 | |
4.750%, 04/15/2058 | | | 510,000 | | | | 468,060 | |
5.800%, 01/23/2059 | | | 400,000 | | | | 429,155 | |
Philip Morris International, Inc. | | | | | |
3.125%, 08/17/2027 | | | 2,654,000 | | | | 2,535,546 | |
| | | | | | |
|
|
|
| | | | | | | | 6,395,869 | |
| | | | | | |
|
|
|
Broadcasting (except Internet)—1.79% | | | | | | | | |
CCO Holdings LLC / CCO Holdings Capital Corp. | | | | | |
4.250%, 02/01/2031(b)(f) | | | 513,000 | | | | 419,224 | |
Comcast Corp. | | | | | |
3.150%, 02/15/2028(f) | | | 405,000 | | | | 385,587 | |
4.150%, 10/15/2028 | | | 1,708,000 | | | | 1,694,521 | |
CSC Holdings LLC | | | | | |
4.625%, 12/01/2030(b) | | | 435,000 | | | | 317,226 | |
3.375%, 02/15/2031(b) | | | 264,000 | | | | 198,193 | |
Discovery Communications LLC | | | | | |
2.950%, 03/20/2023(f) | | | 566,000 | | | | 563,474 | |
DISH DBS Corp. | | | | | |
5.875%, 11/15/2024 | | | 185,000 | | | | 167,649 | |
Fox Corp. | | | | | |
5.576%, 01/25/2049 | | | 770,000 | | | | 753,961 | |
Magallanes, Inc. | | | | | |
5.050%, 03/15/2042(b) | | | 1,545,000 | | | | 1,274,482 | |
5.141%, 03/15/2052(b) | | | 925,000 | | | | 748,496 | |
Paramount Global | | | | | |
4.200%, 05/19/2032(f) | | | 970,000 | | | | 858,076 | |
Sirius XM Radio, Inc. | | | | | |
4.125%, 07/01/2030(b) | | | 425,000 | | | | 360,604 | |
| | | | | | |
|
|
|
| | | | | | | | 7,741,493 | |
| | | | | | |
|
|
|
Building Material and Garden Equipment and Supplies Dealers—0.28% | | | | | | | | |
Home Depot, Inc. | | | | | |
2.700%, 04/01/2023 | | | 1,202,000 | | | | 1,196,218 | |
| | | | | | |
|
|
|
Chemical Manufacturing—1.46% | | | | | | | | |
AbbVie, Inc. | | | | | |
4.050%, 11/21/2039 | | | 270,000 | | | | 239,030 | |
4.700%, 05/14/2045 | | | 710,000 | | | | 664,370 | |
4.250%, 11/21/2049 | | | 485,000 | | | | 426,892 | |
The accompanying notes are an integral part of these financial statements.
19
PMC CORE FIXED INCOME FUND | Schedule of Investments |
August 31, 2022 (Continued)
| | | | | | | | |
| | |
| | | Principal
Amount
| | | Value
| |
Biogen, Inc. | | | | | |
2.250%, 05/01/2030 | | $ | 2,894,000 | | | $ | 2,373,360 | |
Bristol-Myers Squibb Co. | | | | | |
2.950%, 03/15/2032(f) | | | 785,000 | | | | 714,780 | |
3.550%, 03/15/2042 | | | 300,000 | | | | 258,491 | |
Merck & Co, Inc. | | | | | |
2.750%, 12/10/2051 | | | 615,000 | | | | 447,588 | |
Roche Holdings, Inc. | | | | | |
2.607%, 12/13/2051(b) | | | 615,000 | | | | 439,449 | |
Viatris, Inc. | | | | | |
4.000%, 06/22/2050 | | | 1,140,000 | | | | 739,794 | |
| | | | | | |
|
|
|
| | | | | | | | 6,303,754 | |
| | | | | | |
|
|
|
Computer and Electronic Product Manufacturing—2.29% | | | | | | | | |
Apple, Inc. | | | | | |
1.800%, 09/11/2024 | | | 2,818,000 | | | | 2,733,703 | |
Broadcom, Inc. | | | | | |
4.926%, 05/15/2037(b) | | | 665,000 | | | | 596,245 | |
Dell International LLC / EMC Corp. | | | | | |
5.450%, 06/15/2023 | | | 289,000 | | | | 292,073 | |
6.200%, 07/15/2030(f) | | | 1,140,000 | | | | 1,188,865 | |
Intel Corp. | | | | | |
3.750%, 03/25/2027(f) | | | 1,144,000 | | | | 1,132,184 | |
4.900%, 08/05/2052 | | | 1,650,000 | | | | 1,607,569 | |
Marvell Technology, Inc. | | | | | |
2.950%, 04/15/2031 | | | 2,035,000 | | | | 1,675,635 | |
Microchip Technology, Inc. | | | | | |
4.333%, 06/01/2023 | | | 690,000 | | | | 691,263 | |
| | | | | | |
|
|
|
| | | | | | | | 9,917,537 | |
| | | | | | |
|
|
|
Construction of Buildings—0.05% | | | | | | | | |
Shea Homes LP / Shea Homes Funding Corp. | | | | | |
4.750%, 02/15/2028(b) | | | 255,000 | | | | 212,630 | |
| | | | | | |
|
|
|
Credit Intermediation and Related Activities—5.88% | | | | | | | | |
Bank of America Corp. | | | | | |
3.875%, 08/01/2025(f) | | | 1,591,000 | | | | 1,582,760 | |
3.559% to 04/23/2026, then 3 Month LIBOR USD + 1.060%, 04/23/2027(a) | | | 1,610,000 | | | | 1,539,583 | |
3.705% to 04/24/2027, then 3 Month LIBOR USD + 1.512%, 04/24/2028(a) | | | 660,000 | | | | 628,306 | |
3.970% to 03/05/2028, then 3 Month LIBOR USD + 1.070%, 03/05/2029(a) | | | 630,000 | | | | 597,896 | |
2.884% to 10/22/2029, then 3 Month LIBOR USD + 1.190%, 10/22/2030(a) | | | 743,000 | | | | 647,375 | |
2.496% to 02/13/2030, then 3 Month LIBOR USD + 0.990%, 02/13/2031(a) | | | 785,000 | | | | 660,778 | |
4.571% to 04/27/2032, then SOFR + 1.830%, 04/27/2033(a) | | | 725,000 | | | | 694,705 | |
Citigroup, Inc. | | | | | |
3.200%, 10/21/2026 | | | 1,115,000 | | | | 1,067,107 | |
4.300%, 11/20/2026(f) | | | 890,000 | | | | 879,574 | |
1.122% to 01/28/2026, then SOFR + 0.765%, 01/28/2027(a) | | | 1,610,000 | | | | 1,424,657 | |
3.887% to 01/10/2027, then 3 Month LIBOR USD + 1.563%, 01/10/2028(a)(f) | | | 835,000 | | | | 801,285 | |
3.520% to 10/27/2027, then 3 Month LIBOR USD + 1.151%, 10/27/2028(a) | | | 455,000 | | | | 423,270 | |
2.976% to 11/05/2029, then SOFR + 1.422%, 11/05/2030(a) | | | 495,000 | | | | 433,079 | |
Ford Motor Credit Co. LLC | | | | | |
5.113%, 05/03/2029 | | | 310,000 | | | | 288,763 | |
General Motors Financial Co., Inc. | | | | | |
5.100%, 01/17/2024 | | | 370,000 | | | | 373,454 | |
3.600%, 06/21/2030 | | | 700,000 | | | | 608,048 | |
The accompanying notes are an integral part of these financial statements.
20
PMC CORE FIXED INCOME FUND | Schedule of Investments |
August 31, 2022 (Continued)
| | | | | | | | |
| | |
| | | Principal
Amount
| | | Value
| |
GSK Consumer Healthcare Capital US LLC | | | | | |
3.375%, 03/24/2029(b)(f) | | $ | 920,000 | | | $ | 838,380 | |
3.625%, 03/24/2032(b) | | | 1,040,000 | | | | 925,721 | |
JPMorgan Chase & Co. | | | | | |
2.700%, 05/18/2023 | | | 480,000 | | | | 477,464 | |
2.950%, 10/01/2026 | | | 1,658,000 | | | | 1,579,414 | |
2.580% to 04/22/2031, then SOFR + 1.250%, 04/22/2032(a) | | | 1,535,000 | | | | 1,272,483 | |
OneMain Finance Corp. | | | | | |
3.500%, 01/15/2027(f) | | | 435,000 | | | | 359,849 | |
Synchrony Financial | | | | | |
2.875%, 10/28/2031 | | | 920,000 | | | | 711,850 | |
US Bancorp | | | | | |
4.967% to 07/22/2032, then SOFR + 2.110%, 07/22/2033(a) | | | 1,040,000 | | | | 1,028,918 | |
Wells Fargo & Co. | | | | | |
2.406% to 10/30/2024, then SOFR + 1.087%, 10/30/2025(a) | | | 900,000 | | | | 860,697 | |
2.393% to 06/02/2027, then SOFR + 2.100%, 06/02/2028(a) | | | 1,020,000 | | | | 915,654 | |
4.150%, 01/24/2029 | | | 1,563,000 | | | | 1,519,465 | |
2.572% to 02/11/2030, then SOFR + 1.262%, 02/11/2031(a) | | | 1,045,000 | | | | 888,471 | |
4.897% to 07/25/2032, then SOFR + 2.100%, 07/25/2033(a) | | | 1,025,000 | | | | 1,010,133 | |
5.013% to 04/04/2050, then SOFR + 4.502%, 04/04/2051(a) | | | 365,000 | | | | 358,454 | |
| | | | | | |
|
|
|
| | | | | | | | 25,397,593 | |
| | | | | | |
|
|
|
Electrical Equipment, Appliance, and Component Manufacturing—0.08% | | | | | | | | |
Energizer Holdings, Inc. | | | | | |
4.375%, 03/31/2029(b)(f) | | | 430,000 | | | | 349,769 | |
| | | | | | |
|
|
|
Electronics and Appliance Stores—0.03% | | | | | | | | |
AMC Networks, Inc. | | | | | |
4.250%, 02/15/2029 | | | 175,000 | | | | 143,080 | |
| | | | | | |
|
|
|
Food Manufacturing—0.05% | | | | | | | | |
Post Holdings, Inc. | | | | | |
4.625%, 04/15/2030(b) | | | 255,000 | | | | 221,771 | |
| | | | | | |
|
|
|
Food Services and Drinking Places—0.56% | | | | | | | | |
Aramark Services, Inc. | | | | | |
5.000%, 02/01/2028(b) | | | 400,000 | | | | 368,582 | |
McDonald’s Corp. | | | | | |
3.500%, 07/01/2027 | | | 1,622,000 | | | | 1,581,314 | |
Starbucks Corp. | | | | | |
2.550%, 11/15/2030 | | | 530,000 | | | | 455,506 | |
| | | | | | |
|
|
|
| | | | | | | | 2,405,402 | |
| | | | | | |
|
|
|
General Merchandise Stores—0.26% | | | | | | | | |
Walmart, Inc. | | | | | |
2.350%, 12/15/2022 | | | 1,142,000 | | | | 1,139,301 | |
| | | | | | |
|
|
|
Health and Personal Care Stores—0.26% | | | | | | | | |
CVS Health Corp. | | | | | |
4.125%, 04/01/2040(f) | | | 560,000 | | | | 491,636 | |
5.050%, 03/25/2048 | | | 650,000 | | | | 628,230 | |
| | | | | | |
|
|
|
| | | | | | | | 1,119,866 | |
| | | | | | |
|
|
|
Hospitals—0.28% | | | | | | | | |
HCA, Inc. | | | | | |
5.250%, 06/15/2049 | | | 870,000 | | | | 779,441 | |
The accompanying notes are an integral part of these financial statements.
21
PMC CORE FIXED INCOME FUND | Schedule of Investments |
August 31, 2022 (Continued)
| | | | | | | | |
| | |
| | | Principal
Amount
| | | Value
| |
Tenet Healthcare Corp. | | | | | |
6.125%, 10/01/2028(b)(f) | | $ | 455,000 | | | $ | 418,038 | |
| | | | | | |
|
|
|
| | | | | | | | 1,197,479 | |
| | | | | | |
|
|
|
Insurance Carriers and Related Activities—1.40% | | | | | | | | |
Berkshire Hathaway, Inc. | | | | | |
2.750%, 03/15/2023 | | | 2,543,000 | | | | 2,539,280 | |
Cigna Corp. | | | | | |
3.200%, 03/15/2040 | | | 690,000 | | | | 544,749 | |
Equitable Holdings, Inc. | | | | | |
5.000%, 04/20/2048 | | | 545,000 | | | | 512,071 | |
MetLife, Inc. | | | | | |
6.500%, 12/15/2032 | | | 2,137,000 | | | | 2,438,529 | |
| | | | | | |
|
|
|
| | | | | | | | 6,034,629 | |
| | | | | | |
|
|
|
Machinery Manufacturing—0.24% | | | | | | | | |
Deere & Co. | | | | | |
5.375%, 10/16/2029 | | | 983,000 | | | | 1,054,903 | |
| | | | | | |
|
|
|
Management of Companies and Enterprises—0.33% | | | | | | | | |
Abbott Laboratories | | | | | |
3.400%, 11/30/2023 | | | 1,128,000 | | | | 1,127,403 | |
Park Intermediate Holdings LLC / PK Domestic Property LLC | | | | | |
5.875%, 10/01/2028(b) | | | 335,000 | | | | 308,307 | |
| | | | | | |
|
|
|
| | | | | | | | 1,435,710 | |
| | | | | | |
|
|
|
Merchant Wholesalers, Durable Goods—0.51% | | | | | | | | |
CDW LLC / CDW Finance Corp. | | | | | |
2.670%, 12/01/2026 | | | 328,000 | | | | 295,793 | |
3.276%, 12/01/2028 | | | 1,915,000 | | | | 1,689,986 | |
3.569%, 12/01/2031 | | | 265,000 | | | | 223,080 | |
| | | | | | |
|
|
|
| | | | | | | | 2,208,859 | |
| | | | | | |
|
|
|
Merchant Wholesalers, Nondurable Goods—0.47% | | | | | | | | |
Energy Transfer LP | | | | | |
3.600%, 02/01/2023 | | | 600,000 | | | | 599,351 | |
Performance Food Group, Inc. | | | | | |
5.500%, 10/15/2027(b)(f) | | | 155,000 | | | | 145,860 | |
Sysco Corp. | | | | | |
6.600%, 04/01/2050 | | | 764,000 | | | | 890,616 | |
Univar Solutions USA, Inc. | | | | | |
5.125%, 12/01/2027(b) | | | 425,000 | | | | 395,922 | |
| | | | | | |
|
|
|
| | | | | | | | 2,031,749 | |
| | | | | | |
|
|
|
Mining (except Oil and Gas)—0.16% | | | | | | | | |
Freeport-McMoRan, Inc. | | | | | |
5.450%, 03/15/2043 | | | 760,000 | | | | 686,577 | |
| | | | | | |
|
|
|
Nonstore Retailers—0.71% | | | | | | | | |
Amazon.com, Inc. | | | | | |
3.800%, 12/05/2024 | | | 1,637,000 | | | | 1,646,185 | |
eBay, Inc. | | | | | |
2.600%, 05/10/2031 | | | 1,680,000 | | | | 1,408,437 | |
| | | | | | |
|
|
|
| | | | | | | | 3,054,622 | |
| | | | | | |
|
|
|
The accompanying notes are an integral part of these financial statements.
22
PMC CORE FIXED INCOME FUND | Schedule of Investments |
August 31, 2022 (Continued)
| | | | | | | | |
| | |
| | | Principal
Amount
| | | Value
| |
Oil and Gas Extraction—0.74% | | | | | | | | |
CQP Holdco LP / BIP-V Chinook Holdco LLC | | | | | |
5.500%, 06/15/2031(b) | | $ | 315,000 | | | $ | 279,119 | |
Dominion Energy, Inc. | | | | | |
4.350%, 08/15/2032 | | | 1,415,000 | | | | 1,369,789 | |
Occidental Petroleum Corp. | | | | | |
4.300%, 08/15/2039 | | | 260,000 | | | | 224,848 | |
Phillips 66 | | | | | |
1.300%, 02/15/2026 | | | 1,290,000 | | | | 1,169,691 | |
Venture Global Calcasieu Pass LLC | | | | | |
3.875%, 08/15/2029(b)(f) | | | 180,000 | | | | 157,302 | |
| | | | | | |
|
|
|
| | | | | | | | 3,200,749 | |
| | | | | | |
|
|
|
Other Information Services—0.17% | | | | | | | | |
Meta Platforms, Inc. | | | | | |
4.450%, 08/15/2052(b) | | | 815,000 | | | | 742,940 | |
| | | | | | |
|
|
|
Petroleum and Coal Products Manufacturing—0.18% | | | | | | | | |
Marathon Petroleum Corp. | | | | | |
4.700%, 05/01/2025 | | | 775,000 | | | | 780,734 | |
| | | | | | |
|
|
|
Pipeline Transportation—1.03% | | | | | | | | |
Antero Midstream Partners LP / Antero Midstream Finance Corp. | | | | | |
5.375%, 06/15/2029(b) | | | 385,000 | | | | 353,467 | |
Buckeye Partners LP | | | | | |
3.950%, 12/01/2026 | | | 130,000 | | | | 115,622 | |
DT Midstream, Inc. | | | | | |
4.125%, 06/15/2029(b) | | | 215,000 | | | | 189,179 | |
Energy Transfer LP | | | | | |
6.625% to 02/15/2028, then 3 Month LIBOR USD + 4.155%(a)(h) | | | 785,000 | | | | 636,566 | |
7.125% to 05/15/2030, then 5 Year CMT Rate + 5.306%(a)(h) | | | 1,055,000 | | | | 962,966 | |
EQM Midstream Partners LP | | | | | |
5.500%, 07/15/2028 | | | 600,000 | | | | 549,549 | |
MPLX LP | | | | | |
4.700%, 04/15/2048 | | | 815,000 | | | | 699,061 | |
Plains All American Pipeline LP / PAA Finance Corp. | | | | | |
4.650%, 10/15/2025(f) | | | 780,000 | | | | 772,424 | |
Tallgrass Energy Partners LP / Tallgrass Energy Finance Corp. | | | | | |
6.000%, 09/01/2031(b) | | | 185,000 | | | | 162,121 | |
| | | | | | |
|
|
|
| | | | | | | | 4,440,955 | |
| | | | | | |
|
|
|
Plastics and Rubber Products Manufacturing—0.04% | | | | | | | | |
Goodyear Tire & Rubber Co. | | | | | |
5.250%, 04/30/2031(f) | | | 215,000 | | | | 187,773 | |
| | | | | | |
|
|
|
Professional, Scientific, and Technical Services—0.49% | | | | | | | | |
Nielsen Finance LLC / Nielsen Finance Co. | | | | | |
5.625%, 10/01/2028(b) | | | 115,000 | | | | 115,418 | |
5.875%, 10/01/2030(b) | | | 340,000 | | | | 340,519 | |
Presidio Holdings, Inc. | | | | | |
4.875%, 02/01/2027(b) | | | 205,000 | | | | 192,111 | |
ServiceNow, Inc. | | | | | |
1.400%, 09/01/2030 | | | 1,894,000 | | | | 1,490,940 | |
| | | | | | |
|
|
|
| | | | | | | | 2,138,988 | |
| | | | | | |
|
|
|
The accompanying notes are an integral part of these financial statements.
23
PMC CORE FIXED INCOME FUND | Schedule of Investments |
August 31, 2022 (Continued)
| | | | | | | | |
| | |
| | | Principal
Amount
| | | Value
| |
Publishing Industries (except Internet)—1.00% | | | | | | | | |
Microsoft Corp. | | | | | |
3.125%, 11/03/2025 | | $ | 2,676,000 | | | $ | 2,629,658 | |
Oracle Corp. | | | | | |
2.875%, 03/25/2031(f) | | | 1,045,000 | | | | 869,406 | |
4.000%, 07/15/2046 | | | 615,000 | | | | 452,154 | |
Ziff Davis, Inc. | | | | | |
4.625%, 10/15/2030(b) | | | 435,000 | | | | 371,825 | |
| | | | | | |
|
|
|
| | | | | | | | 4,323,043 | |
| | | | | | |
|
|
|
Real Estate—0.68% | | | | | | | | |
Public Storage | | | | | |
2.300%, 05/01/2031 | | | 2,787,000 | | | | 2,384,875 | |
RHP Hotel Properties LP / RHP Finance Corp. | | | | | |
4.750%, 10/15/2027 | | | 240,000 | | | | 218,556 | |
Uniti Group LP / Uniti Fiber Holdings Inc / CSL Capital LLC | | | | | |
7.875%, 02/15/2025(b) | | | 325,000 | | | | 321,487 | |
| | | | | | |
|
|
|
| | | | | | | | 2,924,918 | |
| | | | | | |
|
|
|
Rental and Leasing Services—0.17% | | | | | | | | |
Air Lease Corp. | | | | | |
2.300%, 02/01/2025 | | | 655,000 | | | | 614,350 | |
Harsco Corp. | | | | | |
5.750%, 07/31/2027(b)(f) | | | 185,000 | | | | 131,484 | |
| | | | | | |
|
|
|
| | | | | | | | 745,834 | |
| | | | | | |
|
|
|
Securities, Commodity Contracts, and Other Financial Investments and Related Activities—4.30% | | | | | | | | |
BAT Capital Corp. | | | | | |
3.222%, 08/15/2024 | | | 222,000 | | | | 217,019 | |
3.557%, 08/15/2027 | | | 220,000 | | | | 202,542 | |
3.734%, 09/25/2040 | | | 665,000 | | | | 467,697 | |
Charles Schwab Corp. | | | | | |
2.300%, 05/13/2031 | | | 1,725,000 | | | | 1,467,389 | |
CME Group, Inc. | | | | | |
3.000%, 03/15/2025 | | | 1,085,000 | | | | 1,065,775 | |
CommScope, Inc. | | | | | |
8.250%, 03/01/2027(b) | | | 642,000 | | | | 551,317 | |
Goldman Sachs Group, Inc. | | | | | |
3.850%, 01/26/2027 | | | 1,375,000 | | | | 1,334,909 | |
3.800%, 03/15/2030 | | | 1,450,000 | | | | 1,341,431 | |
2.615% to 04/22/2031, then SOFR + 1.281%, 04/22/2032(a) | | | 1,040,000 | | | | 858,909 | |
2.383% to 07/21/2031, then SOFR + 1.248%, 07/21/2032(a) | | | 1,315,000 | | | | 1,068,159 | |
4.017% to 10/31/2037, then 3 Month LIBOR USD + 1.373%, 10/31/2038(a) | | | 250,000 | | | | 219,046 | |
Morgan Stanley | | | | | |
0.791% to 01/22/2024, then SOFR + 0.509%, 01/22/2025(a)(f) | | | 1,300,000 | | | | 1,234,071 | |
6.250%, 08/09/2026 | | | 2,436,000 | | | | 2,597,091 | |
3.950%, 04/23/2027 | | | 935,000 | | | | 908,051 | |
3.591% to 07/22/2027, then 3 Month LIBOR USD + 1.340%, 07/22/2028(a) | | | 1,625,000 | | | | 1,537,492 | |
2.699% to 01/22/2030, then SOFR + 1.143%, 01/22/2031(a) | | | 1,190,000 | | | | 1,032,796 | |
2.239% to 07/21/2031, then SOFR + 1.178%, 07/21/2032(a) | | | 1,670,000 | | | | 1,351,951 | |
5.297% to 04/20/2032, then SOFR + 2.620%, 04/20/2037(a) | | | 480,000 | | | | 460,592 | |
MPH Acquisition Holdings LLC | | | | | |
5.500%, 09/01/2028(b) | | | 350,000 | | | | 298,944 | |
The accompanying notes are an integral part of these financial statements.
24
PMC CORE FIXED INCOME FUND | Schedule of Investments |
August 31, 2022 (Continued)
| | | | | | | | |
| | |
| | | Principal
Amount
| | | Value
| |
Prime Security Services Borrower LLC / Prime Finance, Inc. | | | | | |
5.750%, 04/15/2026(b) | | $ | 395,000 | | | $ | 380,657 | |
| | | | | | |
|
|
|
| | | | | | | | 18,595,838 | |
| | | | | | |
|
|
|
Support Activities for Mining—0.06% | | | | | | | | |
Hilcorp Energy I LP / Hilcorp Finance Co. | | | | | |
6.250%, 11/01/2028(b) | | | 275,000 | | | | 260,232 | |
| | | | | | |
|
|
|
Telecommunications—2.51% | | | | | | | | |
AT&T, Inc. | | | | | |
2.550%, 12/01/2033 | | | 1,100,000 | | | | 880,216 | |
3.650%, 06/01/2051 | | | 845,000 | | | | 649,859 | |
3.500%, 09/15/2053 | | | 265,000 | | | | 196,398 | |
3.550%, 09/15/2055 | | | 184,000 | | | | 135,421 | |
3.650%, 09/15/2059 | | | 1,018,000 | | | | 741,945 | |
Frontier Communications Holdings LLC | | | | | |
5.875%, 10/15/2027(b) | | | 400,000 | | | | 373,848 | |
Lumen Technologies, Inc. | | | | | |
4.500%, 01/15/2029(b) | | | 360,000 | | | | 269,100 | |
T-Mobile USA, Inc. | | | | | |
2.875%, 02/15/2031 | | | 215,000 | | | | 182,039 | |
4.375%, 04/15/2040 | | | 550,000 | | | | 487,683 | |
3.000%, 02/15/2041 | | | 1,186,000 | | | | 872,472 | |
4.500%, 04/15/2050 | | | 645,000 | | | | 564,706 | |
3.300%, 02/15/2051 | | | 350,000 | | | | 252,140 | |
Verizon Communications, Inc. | | | | | |
4.329%, 09/21/2028 | | | 2,494,000 | | | | 2,465,495 | |
4.016%, 12/03/2029 | | | 400,000 | | | | 384,984 | |
2.355%, 03/15/2032(f) | | | 2,360,000 | | | | 1,943,308 | |
2.987%, 10/30/2056 | | | 660,000 | | | | 446,251 | |
| | | | | | |
|
|
|
| | | | | | | | 10,845,865 | |
| | | | | | |
|
|
|
Transportation Equipment Manufacturing—1.84% | | | | | | | | |
Boeing Co. | | | | | |
4.875%, 05/01/2025(f) | | | 1,371,000 | | | | 1,376,127 | |
3.900%, 05/01/2049 | | | 185,000 | | | | 135,508 | |
5.805%, 05/01/2050 | | | 1,750,000 | | | | 1,671,694 | |
Ford Motor Co. | | | | | |
4.750%, 01/15/2043 | | | 150,000 | | | | 112,382 | |
General Motors Co. | | | | | |
6.125%, 10/01/2025 | | | 1,448,000 | | | | 1,492,086 | |
Raytheon Technologies Corp. | | | | | |
7.500%, 09/15/2029 | | | 2,213,000 | | | | 2,587,447 | |
Spirit AeroSystems, Inc. | | | | | |
5.500%, 01/15/2025(b) | | | 115,000 | | | | 112,764 | |
TransDigm, Inc. | | | | | |
6.250%, 03/15/2026(b) | | | 470,000 | | | | 462,351 | |
| | | | | | |
|
|
|
| | | | | | | | 7,950,359 | |
| | | | | | |
|
|
|
Utilities—1.36% | | | | | | | | |
Calpine Corp. | | | | | |
4.500%, 02/15/2028(b)(f) | | | 530,000 | | | | 485,541 | |
DTE Energy Co. | | | | | |
3.400%, 06/15/2029 | | | 607,000 | | | | 555,593 | |
The accompanying notes are an integral part of these financial statements.
25
PMC CORE FIXED INCOME FUND | Schedule of Investments |
August 31, 2022 (Continued)
| | | | | | | | |
| | |
| | | Principal
Amount
| | | Value
| |
Exelon Corp. | | | | | |
4.700%, 04/15/2050 | | $ | 475,000 | | | $ | 449,047 | |
Kinder Morgan Energy Partners LP | | | | | |
4.150%, 02/01/2024 | | | 755,000 | | | | 755,255 | |
Kinder Morgan, Inc. | | | | | |
5.550%, 06/01/2045(f) | | | 1,745,000 | | | | 1,706,122 | |
New Fortress Energy, Inc. | | | | | |
6.500%, 09/30/2026(b) | | | 160,000 | | | | 150,942 | |
Pacific Gas and Electric Co. | | | | | |
2.500%, 02/01/2031 | | | 1,405,000 | | | | 1,077,330 | |
Southern Co. | | | | | |
2.950%, 07/01/2023 | | | 313,000 | | | | 310,838 | |
Vistra Operations Co. LLC | | | | | |
4.375%, 05/01/2029(b)(f) | | | 455,000 | | | | 397,467 | |
| | | | | | |
|
|
|
| | | | | | | | 5,888,135 | |
| | | | | | |
|
|
|
Warehousing and Storage—0.15% | | | | | | | | |
Iron Mountain, Inc. | | | | | |
5.250%, 03/15/2028(b) | | | 80,000 | | | | 73,524 | |
4.875%, 09/15/2029(b) | | | 410,000 | | | | 356,249 | |
5.250%, 07/15/2030(b)(f) | | | 260,000 | | | | 230,406 | |
| | | | | | |
|
|
|
| | | | | | | | 660,179 | |
| | | | | | |
|
|
|
Wood Product Manufacturing—0.02% | | | | | | | | |
Standard Industries, Inc. | | | | | |
4.750%, 01/15/2028(b)(f) | | | 110,000 | | | | 96,357 | |
| | | | | | |
|
|
|
TOTAL CORPORATE BONDS (Cost $170,311,148) | | | | | | | 150,657,322 | |
| | | | | | |
|
|
|
FOREIGN CORPORATE BONDS—7.82% | | | | | |
Air Transportation—0.79% | | | | | | | | |
Delta Air Lines, Inc. / SkyMiles IP Ltd. | | | | | |
4.500%, 10/20/2025(b) | | | 3,500,000 | | | | 3,431,709 | |
| | | | | | |
|
|
|
Chemical Manufacturing—0.07% | | | | | |
NOVA Chemicals Corp. | | | | | |
4.875%, 06/01/2024(b) | | | 205,000 | | | | 196,539 | |
5.250%, 06/01/2027(b) | | | 130,000 | | | | 114,969 | |
| | | | | | |
|
|
|
| | | | | | | | 311,508 | |
| | | | | | |
|
|
|
Computer and Electronic Product Manufacturing—0.38% | | | | | | | | |
AerCap Ireland Capital DAC / AerCap Global Aviation Trust | | | | | |
4.450%, 10/01/2025 | | | 800,000 | | | | 775,655 | |
NXP BV / NXP Funding LLC / NXP USA, Inc. | | | | | |
5.000%, 01/15/2033 | | | 905,000 | | | | 874,040 | |
| | | | | | |
|
|
|
| | | | | | | | 1,649,695 | |
| | | | | | |
|
|
|
Credit Intermediation and Related Activities—4.06% | | | | | | | | |
ABN AMRO Bank NV | | | | | |
3.324% to 03/13/2032, then 5 Year CMT Rate + 1.900%, 03/13/2037(a)(b) | | | 600,000 | | | | 468,152 | |
AerCap Ireland Capital DAC / AerCap Global Aviation Trust | | | | | |
3.300%, 01/30/2032 | | | 880,000 | | | | 712,536 | |
Banco Santander SA | | | | | |
1.849%, 03/25/2026 | | | 1,600,000 | | | | 1,426,418 | |
5.294%, 08/18/2027 | | | 1,400,000 | | | | 1,374,976 | |
3.490%, 05/28/2030 | | | 400,000 | | | | 343,673 | |
The accompanying notes are an integral part of these financial statements.
26
PMC CORE FIXED INCOME FUND | Schedule of Investments |
August 31, 2022 (Continued)
| | | | | | | | |
| | |
| | | Principal
Amount
| | | Value
| |
Barclays PLC | | | | | |
2.852% to 05/07/2025, then SOFR + 2.714%, 05/07/2026(a) | | $ | 2,145,000 | | | $ | 2,011,835 | |
3.564% to 09/23/2030, then 5 Year CMT Rate + 2.900%, 09/23/2035(a) | | | 1,000,000 | | | | 804,186 | |
BAT International Finance PLC | | | | | |
1.668%, 03/25/2026 | | | 1,590,000 | | | | 1,422,857 | |
BNP Paribas SA | | | | | |
2.219% to 06/09/2025, then SOFR + 2.074%, 06/09/2026(a)(b) | | | 1,015,000 | | | | 936,564 | |
3.052% to 01/13/2030, then SOFR + 1.507%, 01/13/2031(a)(b) | | | 615,000 | | | | 521,399 | |
Credit Suisse Group AG | | | | | |
3.800%, 06/09/2023 | | | 860,000 | | | | 856,165 | |
6.537% to 08/12/2032, then SOFR + 3.920%, 08/12/2033(a)(b)(f) | | | 950,000 | | | | 910,227 | |
HSBC Holdings PLC | | | | | |
2.633% to 11/07/2024, then SOFR + 1.402%, 11/07/2025(a) | | | 1,417,000 | | | | 1,343,528 | |
2.099% to 06/04/2025, then SOFR + 1.929%, 06/04/2026(a) | | | 200,000 | | | | 184,491 | |
4.950%, 03/31/2030(f) | | | 285,000 | | | | 277,384 | |
6.000% to 05/22/2027, then 5 Year Mid Swap Rate USD + 3.746%(a)(h) | | | 910,000 | | | | 838,249 | |
Intesa Sanpaolo SpA | | | | | |
4.198% to 06/01/2031, then 1 Year CMT Rate + 2.600%, 06/01/2032(a)(b) | | | 770,000 | | | | 559,982 | |
UBS Group AG | | | | | |
4.751% to 05/12/2027, then 1 Year CMT Rate + 1.750%, 05/12/2028(a)(b) | | | 1,170,000 | | | | 1,150,403 | |
Virgin Media Vendor Financing Notes IV DAC | | | | | |
5.000%, 07/15/2028(b) | | | 350,000 | | | | 299,478 | |
Westpac Banking Corp. | | | | | |
2.668% to 11/15/2030, then 5 Year CMT Rate + 1.750%, 11/15/2035(a) | | | 1,370,000 | | | | 1,081,985 | |
| | | | | | |
|
|
|
| | | | | | | | 17,524,488 | |
| | | | | | |
|
|
|
Food Manufacturing—0.16% | | | | | | | | |
Grupo Bimbo SAB de CV | | | | | |
4.700%, 11/10/2047(b) | | | 730,000 | | | | 687,931 | |
| | | | | | |
|
|
|
Management of Companies and Enterprises—1.28% | | | | | | | | |
Altice France SA | | | | | |
5.500%, 01/15/2028(b) | | | 405,000 | | | | 330,233 | |
Carnival Corp. | | | | | |
10.500%, 02/01/2026(b) | | | 160,000 | | | | 165,008 | |
7.625%, 03/01/2026(b)(f) | | | 580,000 | | | | 493,783 | |
Credit Suisse Group AG | | | | | |
2.997% to 12/14/2022, then 3 Month LIBOR USD + 1.200%, 12/14/2023(a)(b) | | | 1,145,000 | | | | 1,137,224 | |
3.869% to 01/12/2028, then 3 Month LIBOR USD + 1.410%, 01/12/2029(a)(b) | | | 250,000 | | | | 217,146 | |
4.194% to 04/01/2030, then SOFR + 3.730%, 04/01/2031(a)(b) | | | 560,000 | | | | 471,937 | |
3.091% to 05/14/2031, then SOFR + 1.730%, 05/14/2032(a)(b) | | | 830,000 | | | | 629,334 | |
Lloyds Banking Group PLC | | | | | |
1.627% to 05/11/2026, then 1 Year CMT Rate + 0.850%, 05/11/2027(a)(f) | | | 1,610,000 | | | | 1,425,009 | |
3.369% to 12/14/2041, then 5 Year CMT Rate + 1.500%, 12/14/2046(a) | | | 920,000 | | | | 639,220 | |
| | | | | | |
|
|
|
| | | | | | | | 5,508,894 | |
| | | | | | |
|
|
|
Mining (except Oil and Gas)—0.04% | | | | | | | | |
Hudbay Minerals, Inc. | | | | | |
6.125%, 04/01/2029(b) | | | 210,000 | | | | 185,172 | |
| | | | | | |
|
|
|
Oil and Gas Extraction—0.21% | | | | | | | | |
Canadian Natural Resources Ltd. | | | | | |
6.250%, 03/15/2038 | | | 850,000 | | | | 890,251 | |
| | | | | | |
|
|
|
The accompanying notes are an integral part of these financial statements.
27
PMC CORE FIXED INCOME FUND | Schedule of Investments |
August 31, 2022 (Continued)
| | | | | | | | |
| | |
| | | Principal
Amount
| | | Value
| |
Securities, Commodity Contracts, and Other Financial Investments and Related Activities—0.58% | | | | | | | | |
Natwest Group PLC | | | | | |
3.032% to 11/28/2030, then 5 Year CMT Rate + 2.350%, 11/28/2035(a)(f) | | $ | 2,170,000 | | | $ | 1,700,787 | |
Societe Generale SA | | | | | |
3.337% to 01/21/2032, then 1 Year CMT Rate + 1.600%, 01/21/2033(a)(b) | | | 975,000 | | | | 787,288 | |
| | | | | | |
|
|
|
| | | | | | | | 2,488,075 | |
| | | | | | |
|
|
|
Support Activities for Transportation—0.09% | | | | | | | | |
American Airlines Inc/AAdvantage Loyalty IP Ltd. | | | | | |
5.500%, 04/20/2026(b)(f) | | | 405,000 | | | | 385,827 | |
| | | | | | |
|
|
|
Telecommunications—0.10% | | | | | | | | |
Vodafone Group PLC | | | | | |
4.875%, 06/19/2049 | | | 500,000 | | | | 451,319 | |
| | | | | | |
|
|
|
Water Transportation—0.06% | | | | | | | | |
Royal Caribbean Cruises Ltd. | | | | | |
5.500%, 04/01/2028(b)(f) | | | 350,000 | | | | 269,619 | |
| | | | | | |
|
|
|
TOTAL FOREIGN CORPORATE BONDS (Cost $37,967,565) | | | | | | | 33,784,488 | |
| | | | | | |
|
|
|
FOREIGN GOVERNMENT AGENCY ISSUES—1.01% | | | | | |
Asian Development Bank | | | | | |
3.125%, 04/27/2032 | | | 960,000 | | | | 944,186 | |
Development Bank of Japan, Inc. | | | | | |
1.000%, 08/27/2030(b) | | | 260,000 | | | | 211,908 | |
European Investment Bank | | | | | |
3.250%, 11/15/2027 | | | 235,000 | | | | 233,414 | |
1.750%, 03/15/2029 | | | 115,000 | | | | 104,354 | |
International Bank for Reconstruction & Development | | | | | |
3.125%, 06/15/2027 | | | 640,000 | | | | 631,806 | |
Japan International Cooperation Agency | | | | | |
3.250%, 05/25/2027 | | | 790,000 | | | | 770,718 | |
Kreditanstalt fuer Wiederaufbau | | | | | |
3.000%, 05/20/2027 | | | 740,000 | | | | 726,822 | |
Province of Ontario Canada | | | | | |
2.125%, 01/21/2032 | | | 865,000 | | | | 755,149 | |
| | | | | | |
|
|
|
TOTAL FOREIGN GOVERNMENT AGENCY ISSUES (Cost $4,596,842) | | | | | | | 4,378,357 | |
| | | | | | |
|
|
|
FOREIGN GOVERNMENT NOTES/BONDS—2.15% | | | | | |
Brazilian Government International Bond | | | | | |
5.625%, 02/21/2047 | | | 515,000 | | | | 427,766 | |
Colombia Government International Bond | | | | | |
4.000%, 02/26/2024 | | | 590,000 | | | | 578,588 | |
3.875%, 04/25/2027 | | | 150,000 | | | | 134,730 | |
3.000%, 01/30/2030(f) | | | 570,000 | | | | 441,708 | |
Dominican Republic International Bond | | | | | |
6.875%, 01/29/2026(b) | | | 330,000 | | | | 338,524 | |
6.850%, 01/27/2045(b) | | | 560,000 | | | | 476,915 | |
Hungary Government International Bond | | | | | |
7.625%, 03/29/2041(f) | | | 560,000 | | | | 648,571 | |
Indonesia Government International Bond | | | | | |
4.350%, 01/08/2027(b) | | | 550,000 | | | | 556,589 | |
5.250%, 01/17/2042(b) | | | 410,000 | | | | 411,551 | |
Mexico Government International Bond | | | | | |
4.350%, 01/15/2047 | | | 740,000 | | | | 582,064 | |
The accompanying notes are an integral part of these financial statements.
28
PMC CORE FIXED INCOME FUND | Schedule of Investments |
August 31, 2022 (Continued)
| | | | | | | | |
| | |
| | | Principal
Amount
| | | Value
| |
Paraguay Government International Bond | | | | | |
4.700%, 03/27/2027(b)(f) | | $ | 715,000 | | | $ | 707,756 | |
Peruvian Government International Bond | | | | | |
2.392%, 01/23/2026 | | | 480,000 | | | | 449,862 | |
8.750%, 11/21/2033(f) | | | 380,000 | | | | 489,625 | |
Philippine Government International Bond | | | | | |
3.950%, 01/20/2040 | | | 640,000 | | | | 584,694 | |
Republic of Azerbaijan International Bond | | | | | |
4.750%, 03/18/2024(b) | | | 720,000 | | | | 720,112 | |
Republic of South Africa Government International Bond | | | | | |
5.000%, 10/12/2046 | | | 150,000 | | | | 101,830 | |
Romanian Government International Bond | | | | | |
6.125%, 01/22/2044(b) | | | 975,000 | | | | 926,253 | |
Saudi Government International Bond | | | | | |
4.500%, 10/26/2046(b) | | | 755,000 | | | | 706,879 | |
| | | | | | |
|
|
|
TOTAL FOREIGN GOVERNMENT NOTES/BONDS (Cost $10,913,850) | | | | | | | 9,284,017 | |
| | | | | | |
|
|
|
NON-AGENCY MORTGAGE BACKED SECURITIES—5.28% | | | | | |
Angel Oak Mortgage Trust | | | | | |
2019-6, 2.620%, 11/25/2059(b)(d) | | | 94,427 | | | | 92,657 | |
Bank | | | | | |
2021-BNK31, 1.739%, 02/15/2054 | | | 454,000 | | | | 397,096 | |
2022-BNK39, 2.928%, 02/15/2055 | | | 179,000 | | | | 159,453 | |
BBCMS Mortgage Trust | | | | | |
2021-C11, 1.504%, 09/15/2054(d)(e) | | | 7,975,801 | | | | 655,901 | |
BB-UBS Trust | | | | | |
2012-SHOW, 3.430%, 11/05/2036(b) | | | 1,646,000 | | | | 1,574,250 | |
Benchmark Mortgage Trust | | | | | |
2020-B21, 1.978%, 12/17/2053 | | | 251,000 | | | | 209,314 | |
2021-B23, 1.766%, 02/15/2054 | | | 612,000 | | | | 534,298 | |
2021-B26, 0.999%, 06/15/2054(d)(e) | | | 9,538,801 | | | | 504,073 | |
2021-B29, 2.388%, 09/15/2054 | | | 301,000 | | | | 256,362 | |
2021-B31 D, 2.250%, 12/15/2054(b) | | | 278,000 | | | | 177,155 | |
2021-B31, 2.669%, 12/15/2054 | | | 262,716 | | | | 228,513 | |
2021-B31 C, 3.195%, 12/15/2054(d) | | | 415,000 | | | | 329,229 | |
2022-B34, 3.786%, 04/15/2055(d) | | | 231,021 | | | | 220,044 | |
BX Commercial Mortgage Trust | | | | | |
2021-VOLT, 4.041% (1 Month LIBOR USD + 1.650%), 09/15/2036(b)(c) | | | 1,085,000 | | | | 1,039,364 | |
BX Trust | | | | | |
2021-SDMF, 3.978% (1 Month LIBOR USD + 1.587%), 09/15/2034(b)(c) | | | 653,000 | | | | 618,772 | |
2019-OC11, 3.202%, 12/09/2041(b) | | | 971,000 | | | | 862,138 | |
BXP Trust | | | | | |
2017-GM, 3.379%, 06/13/2039(b) | | | 331,000 | | | | 309,929 | |
CAMB Commercial Mortgage Trust | | | | | |
2019-LIFE, 3.641% (1 Month LIBOR USD + 1.250%), 12/15/2037(b)(c) | | | 978,000 | | | | 957,827 | |
Citigroup Commercial Mortgage Trust | | | | | |
2013-GCJ11, 3.732%, 04/10/2046(d) | | | 455,000 | | | | 449,050 | |
2013-GC17, 5.095%, 11/10/2046(d) | | | 145,000 | | | | 143,258 | |
2014-GC25, 1.098%, 10/10/2047(d)(e) | | | 1,294,446 | | | | 19,932 | |
2015-GC27, 1.470%, 02/10/2048(d)(e) | | | 935,444 | | | | 22,963 | |
2022-GC48, 4.743%, 05/15/2054(d) | | | 238,407 | | | | 245,272 | |
2019-GC41, 2.869%, 08/10/2056 | | | 346,000 | | | | 314,827 | |
COMM Mortgage Trust | | | | | | | | |
2012-CCRE4, 3.251%, 10/15/2045 | | | 476,000 | | | | 468,662 | |
The accompanying notes are an integral part of these financial statements.
29
PMC CORE FIXED INCOME FUND | Schedule of Investments |
August 31, 2022 (Continued)
| | | | | | | | |
| | |
| | | Principal
Amount
| | | Value
| |
2014-UBS2, 3.472%, 03/10/2047 | | $ | 232,540 | | | $ | 230,865 | |
2014-CR16, 1.105%, 04/10/2047(d)(e) | | | 1,225,496 | | | | 14,890 | |
2014-LC15, 1.220%, 04/10/2047(d)(e) | | | 1,200,766 | | | | 14,042 | |
2014-CR17, 1.113%, 05/10/2047(d)(e) | | | 1,037,349 | | | | 12,142 | |
2014-UBS3, 1.218%, 06/10/2047(d)(e) | | | 867,131 | | | | 11,569 | |
2014-UBS6, 1.000%, 12/10/2047(d)(e) | | | 1,473,589 | | | | 21,991 | |
2014-CCRE21, 3.987%, 12/10/2047 | | | 281,514 | | | | 273,190 | |
Connecticut Avenue Securities Trust | | | | | | | | |
2021-R01, 3.733% (SOFR30A + 1.550%), 10/25/2041(b)(c) | | | 480,000 | | | | 464,773 | |
2022-R01, 4.083% (SOFR30A + 1.900%), 12/25/2041(b)(c) | | | 1,070,000 | | | | 1,000,132 | |
2022-R03, 5.683% (SOFR30A + 3.500%), 03/25/2042(b)(c) | | | 1,065,000 | | | | 1,079,016 | |
2022-R07, 5.158% (SOFR30A + 2.950%), 06/25/2042(b)(c) | | | 635,305 | | | | 649,133 | |
CSAIL Commercial Mortgage Trust | | | | | | | | |
2019-C17, 3.016%, 09/15/2029 | | | 850,000 | | | | 770,186 | |
2015-C1, 4.044%, 04/15/2050(d) | | | 450,000 | | | | 418,387 | |
2015-C2, 0.859%, 06/15/2057(d)(e) | | | 1,418,532 | | | | 21,049 | |
GS Mortgage Securities Trust | | | | | | | | |
2012-GCJ9, 3.747%, 11/10/2045(b) | | | 345,000 | | �� | | 344,173 | |
2014-GC18, 1.201%, 01/10/2047(d)(e) | | | 3,271,470 | | | | 34,289 | |
2014-GC26, 1.088%, 11/10/2047(d)(e) | | | 1,817,700 | | | | 30,210 | |
2015-GC34, 3.278%, 10/10/2048 | | | 91,479 | | | | 89,911 | |
2020-GC47, 2.377%, 05/12/2053 | | | 73,000 | | | | 63,508 | |
Hilton USA Trust | | | | | | | | |
2016-HHV, 3.719%, 11/05/2038(b) | | | 283,000 | | | | 267,605 | |
Hudson Yards Mortgage Trust | | | | | | | | |
2019-55HY, 3.041%, 12/10/2041(b)(d) | | | 865,000 | | | | 770,737 | |
J.P. Morgan Chase Commercial Mortgage Securities Trust | | | | | | | | |
2022-OPO, 3.377%, 01/05/2039(b) | | | 501,000 | | | | 451,470 | |
Morgan Stanley Bank of America Merrill Lynch Trust | | | | | | | | |
2013-C9, 2.657%, 05/15/2046 | | | 64,826 | | | | 64,592 | |
Morgan Stanley Capital I Trust | | | | | | | | |
2015-MS1, 3.779%, 05/15/2048(d) | | | 200,000 | | | | 195,596 | |
2018-L1, 4.880%, 10/15/2051(d) | | | 325,000 | | | | 311,777 | |
2020-HR8, 2.041%, 07/15/2053 | | | 335,000 | | | | 282,306 | |
New Residential Mortgage Loan Trust | | | | | | | | |
2019-NQM5, 2.710%, 11/25/2059(b)(d) | | | 156,546 | | | | 148,478 | |
OBX Trust | | | | | | | | |
2021-NQM3, 1.054%, 07/25/2061(b)(d) | | | 805,213 | | | | 667,611 | |
Taubman Centers Commercial Mortgage Trust | | | | | | | | |
2022-DPM, 5.239% (TSFR1M + 2.932%), 05/15/2037(b)(c) | | | 1,045,000 | | | | 1,024,798 | |
UBS Commercial Mortgage Trust | | | | | | | | |
2017-C2, 3.487%, 08/15/2050 | | | 1,025,000 | | | | 979,604 | |
2017-C4 AS, 3.836%, 10/15/2050(d) | | | 200,000 | | | | 188,530 | |
2018-C14, 3.379%, 12/15/2051 | | | 9,278 | | | | 9,263 | |
UBS-Barclays Commercial Mortgage Trust | | | | | | | | |
2013-C6, 2.788%, 04/10/2046 | | | 15,497 | | | | 15,476 | |
Verus Securitization Trust | | | | | | | | |
2019-4, 2.642%, 11/25/2059(b) | | | 48,773 | | | | 47,999 | |
Wells Fargo Commercial Mortgage Trust | | | | | | | | |
2015-C29, 3.637%, 06/15/2048 | | | 130,000 | | | | 127,074 | |
2018-C48, 4.302%, 01/15/2052 | | | 625,000 | | | | 617,708 | |
WFRBS Commercial Mortgage Trust | | | | | | | | |
2014-LC14, 1.419%, 03/15/2047(d)(e) | | | 659,765 | | | | 8,176 | |
2014-C22, 0.940%, 09/15/2057(d)(e) | | | 2,926,523 | | | | 34,798 | |
The accompanying notes are an integral part of these financial statements.
30
PMC CORE FIXED INCOME FUND | Schedule of Investments |
August 31, 2022 (Continued)
| | | | | | | | |
| | |
| | | Principal
Amount
| | | Value
| |
2014-C22, 4.069%, 09/15/2057(d) | | $ | 290,000 | | | $ | 283,777 | |
| | | | | | |
|
|
|
TOTAL NON-AGENCY MORTGAGE BACKED SECURITIES (Cost $25,747,535) | | | | | | | 22,831,170 | |
| | | | | | |
|
|
|
| AGENCY MORTGAGE BACKED SECURITIES — 30.81% | | | | | | | | |
Fannie Mae Connecticut Avenue Securities | | | | | | | | |
2017-C03, 5.444% (1 Month LIBOR USD + 3.000%), 10/25/2029(c) | | | 1,095,677 | | | | 1,122,302 | |
2017-C04, 5.294% (1 Month LIBOR USD + 2.850%), 11/25/2029(c) | | | 252,894 | | | | 259,341 | |
2017-C05, 4.644% (1 Month LIBOR USD + 2.200%), 01/25/2030(c) | | | 554,988 | | | | 546,762 | |
2017-C06, 5.244% (1 Month LIBOR USD + 2.800%), 02/25/2030(c) | | | 1,201,007 | | | | 1,192,512 | |
2017-C07 1M2, 4.844% (1 Month LIBOR USD + 2.400%), 05/25/2030(c) | | | 562,423 | | | | 556,948 | |
2017-C07 2M2, 4.944% (1 Month LIBOR USD + 2.500%), 05/25/2030(c) | | | 540,150 | | | | 549,718 | |
2018-C01, 4.694% (1 Month LIBOR USD + 2.250%), 07/25/2030(c) | | | 1,251,495 | | | | 1,259,728 | |
2018-C02, 4.644% (1 Month LIBOR USD + 2.200%), 08/25/2030(c) | | | 1,199,510 | | | | 1,200,634 | |
2018-C03, 4.594% (1 Month LIBOR USD + 2.150%), 10/25/2030(c) | | | 837,585 | | | | 849,320 | |
2018-C04, 4.994% (1 Month LIBOR USD + 2.550%), 12/25/2030(c) | | | 1,725,424 | | | | 1,750,011 | |
Fannie Mae Interest Strip | | | | | |
#TBA, 4.000%, 08/25/2043(e) | | | 1,344,204 | | | | 237,742 | |
Fannie Mae Pool | | | | | |
MA0096, 4.500%, 06/01/2029 | | | 3,099 | | | | 3,150 | |
AB3000, 4.500%, 05/01/2031 | | | 8,729 | | | | 8,811 | |
AB1389, 4.500%, 08/01/2040 | | | 26,122 | | | | 26,718 | |
#TBA, 4.000%, 09/01/2040 | | | 3,410,000 | | | | 3,334,341 | |
MA0510, 4.500%, 09/01/2040 | | | 287 | | | | 294 | |
AE8714, 3.500%, 11/01/2040 | | | 10,573 | | | | 10,327 | |
890310, 4.500%, 12/01/2040 | | | 6,137 | | | | 6,277 | |
AH3952, 4.000%, 01/01/2041 | | | 76,444 | | | | 76,671 | |
AL0791, 4.000%, 02/01/2041 | | | 27,134 | | | | 27,214 | |
AE0954, 4.500%, 02/01/2041 | | | 21,693 | | | | 22,188 | |
AS7001, 3.000%, 04/01/2041 | | | 535,202 | | | | 509,985 | |
AL0245, 4.000%, 04/01/2041 | | | 5,698 | | | | 5,704 | |
AL0065, 4.500%, 04/01/2041 | | | 10,318 | | | | 10,554 | |
AB3194, 4.500%, 06/01/2041 | | | 7,547 | | | | 7,719 | |
AH7395, 4.500%, 06/01/2041 | | | 2,322 | | | | 2,329 | |
#TBA, 5.000%, 09/15/2041 | | | 1,695,000 | | | | 1,713,388 | |
FM0040, 3.000%, 10/01/2041 | | | 96,026 | | | | 91,562 | |
AL1547, 4.500%, 11/01/2041 | | | 4,027 | | | | 4,119 | |
AJ9278, 3.500%, 12/01/2041 | | | 5,204 | | | | 5,066 | |
AJ6346, 3.500%, 12/01/2041 | | | 16,952 | | | | 16,549 | |
AK6744, 4.000%, 03/01/2042 | | | 32,702 | | | | 32,721 | |
AK9393, 3.500%, 04/01/2042 | | | 10,319 | | | | 10,041 | |
AO1214, 3.500%, 04/01/2042 | | | 60,088 | | | | 58,617 | |
AK6568, 3.500%, 04/01/2042 | | | 21,553 | | | | 21,025 | |
AL4029, 4.500%, 04/01/2042 | | | 30,480 | | | | 31,178 | |
AL7306, 4.500%, 09/01/2042 | | | 17,409 | | | | 17,636 | |
AP8743, 3.500%, 10/01/2042 | | | 162,017 | | | | 158,063 | |
AL3714, 3.500%, 01/01/2043 | | | 15,089 | | | | 14,720 | |
AL2897, 3.500%, 01/01/2043 | | | 23,219 | | | | 22,650 | |
AQ9330, 3.500%, 01/01/2043 | | | 20,429 | | | | 19,879 | |
AB7965, 3.500%, 02/01/2043 | | | 13,412 | | | | 13,084 | |
AB9046, 3.500%, 04/01/2043 | | | 40,775 | | | | 39,775 | |
AT2021, 3.500%, 04/01/2043 | | | 13,760 | | | | 13,390 | |
AT1001, 3.500%, 04/01/2043 | | | 15,104 | | | | 14,799 | |
AB9260, 3.500%, 05/01/2043 | | | 38,139 | | | | 37,204 | |
AS0212, 3.500%, 08/01/2043 | | | 35,599 | | | | 34,727 | |
The accompanying notes are an integral part of these financial statements.
31
PMC CORE FIXED INCOME FUND | Schedule of Investments |
August 31, 2022 (Continued)
| | | | | | | | |
| | |
| | | Principal
Amount
| | | Value
| |
AU0949, 3.500%, 08/01/2043 | | $ | 32,810 | | | $ | 32,377 | |
AU3751, 4.000%, 08/01/2043 | | | 67,808 | | | | 67,799 | |
AU6857, 4.000%, 09/01/2043 | | | 29,692 | | | | 29,753 | |
AS0531, 4.000%, 09/01/2043 | | | 31,266 | | | | 31,271 | |
AU4658, 4.500%, 09/01/2043 | | | 5,618 | | | | 5,641 | |
MA1600, 3.500%, 10/01/2043 | | | 15,832 | | | | 15,444 | |
AS1042, 4.000%, 11/01/2043 | | | 26,189 | | | | 26,186 | |
AS1333, 4.500%, 12/01/2043 | | | 11,307 | | | | 11,566 | |
AL4450, 4.500%, 12/01/2043 | | | 12,615 | | | | 12,904 | |
AS1559, 4.000%, 01/01/2044 | | | 17,656 | | | | 17,686 | |
AS2516, 4.500%, 05/01/2044 | | | 12,346 | | | | 12,628 | |
AS2751, 4.500%, 06/01/2044 | | | 15,097 | | | | 15,443 | |
MA1926, 4.500%, 06/01/2044 | | | 12,771 | | | | 12,997 | |
AL6223, 4.500%, 08/01/2044 | | | 14,891 | | | | 15,232 | |
AX0118, 4.000%, 09/01/2044 | | | 116,313 | | | | 115,750 | |
AX2491, 4.000%, 10/01/2044 | | | 7,603 | | | | 7,591 | |
AS3467, 4.000%, 10/01/2044 | | | 9,674 | | | | 9,672 | |
AL6432, 4.000%, 01/01/2045 | | | 24,509 | | | | 24,506 | |
AL6520, 4.000%, 02/01/2045 | | | 85,469 | | | | 85,512 | |
AZ0862, 3.500%, 07/01/2045 | | | 46,565 | | | | 45,150 | |
AZ0814, 3.500%, 07/01/2045 | | | 27,712 | | | | 26,878 | |
BM1953, 3.500%, 08/01/2045 | | | 58,977 | | | | 57,534 | |
AZ4775, 3.500%, 10/01/2045 | | | 11,718 | | | | 11,354 | |
AZ4788, 4.000%, 10/01/2045 | | | 242,871 | | | | 242,261 | |
CA2929, 3.500%, 12/01/2045 | | | 96,453 | | | | 93,481 | |
AS6311, 3.500%, 12/01/2045 | | | 16,922 | | | | 16,426 | |
AS6405, 4.000%, 12/01/2045 | | | 198,701 | | | | 198,231 | |
AS6464, 3.500%, 01/01/2046 | | | 22,373 | | | | 21,719 | |
BC4114, 3.500%, 02/01/2046 | | | 131,763 | | | | 127,900 | |
AL8219, 4.000%, 02/01/2046 | | | 207,284 | | | | 208,000 | |
BC0305, 4.000%, 03/01/2046 | | | 48,818 | | | | 48,633 | |
AS6795, 4.000%, 03/01/2046 | | | 44,424 | | | | 44,253 | |
AL8387, 4.000%, 03/01/2046 | | | 498,959 | | | | 499,088 | |
FM1370, 3.000%, 04/01/2046 | | | 33,691 | | | | 31,979 | |
BC0793, 3.500%, 04/01/2046 | | | 113,277 | | | | 110,010 | |
BC0835, 4.000%, 04/01/2046 | | | 104,835 | | | | 104,371 | |
AS7248, 4.000%, 05/01/2046 | | | 56,703 | | | | 56,528 | |
AS7200, 4.500%, 05/01/2046 | | | 6,482 | | | | 6,516 | |
AS7388, 3.500%, 06/01/2046 | | | 471,226 | | | | 459,217 | |
AS7401, 4.000%, 06/01/2046 | | | 42,498 | | | | 42,345 | |
AL9282, 4.000%, 06/01/2046 | | | 79,837 | | | | 79,632 | |
AL8735, 4.000%, 06/01/2046 | | | 117,074 | | | | 116,941 | |
AS7580, 3.000%, 07/01/2046 | | | 107,903 | | | | 102,159 | |
AS7492, 4.000%, 07/01/2046 | | | 20,182 | | | | 20,137 | |
AS7801, 3.500%, 08/01/2046 | | | 103,297 | | | | 100,272 | |
MA2737, 3.000%, 09/01/2046 | | | 599,702 | | | | 567,545 | |
MA2771, 3.000%, 10/01/2046 | | | 90,988 | | | | 86,071 | |
AS8056, 3.000%, 10/01/2046 | | | 59,216 | | | | 55,966 | |
BM3932, 3.500%, 10/01/2046 | | | 84,090 | | | | 81,567 | |
AS8269, 3.000%, 11/01/2046 | | | 76,269 | | | | 72,052 | |
AS8699, 4.000%, 01/01/2047 | | | 21,099 | | | | 20,980 | |
BE2975, 4.000%, 01/01/2047 | | | 103,359 | | | | 102,375 | |
AS8661, 4.000%, 01/01/2047 | | | 70,913 | | | | 70,512 | |
AS8659, 4.000%, 01/01/2047 | | | 26,664 | | | | 26,537 | |
The accompanying notes are an integral part of these financial statements.
32
PMC CORE FIXED INCOME FUND | Schedule of Investments |
August 31, 2022 (Continued)
| | | | | | | | |
| | |
| | | Principal
Amount
| | | Value
| |
AS8700, 4.500%, 01/01/2047 | | $ | 25,289 | | | $ | 25,632 | |
MA2872, 4.500%, 01/01/2047 | | | 60,586 | | | | 61,351 | |
AL9879, 3.500%, 02/01/2047 | | | 1,418,725 | | | | 1,377,047 | |
BE5475, 3.500%, 02/01/2047 | | | 37,388 | | | | 36,247 | |
AL9916, 4.000%, 02/01/2047 | | | 119,226 | | | | 118,919 | |
AS8966, 4.000%, 03/01/2047 | | | 20,304 | | | | 20,202 | |
FM4894, 4.000%, 03/01/2047 | | | 445,226 | | | | 444,628 | |
AS8982, 4.500%, 03/01/2047 | | | 8,406 | | | | 8,506 | |
FM1000, 3.000%, 04/01/2047 | | | 216,020 | | | | 203,703 | |
CA5843, 3.000%, 04/01/2047 | | | 122,906 | | | | 115,755 | |
MA2959, 3.500%, 04/01/2047 | | | 82,039 | | | | 79,229 | |
BM5348, 3.500%, 05/01/2047 | | | 46,367 | | | | 45,017 | |
BM5784, 3.500%, 05/01/2047 | | | 105,026 | | | | 101,964 | |
AS9536, 3.500%, 05/01/2047 | | | 41,652 | | | | 40,431 | |
BM5347, 3.500%, 05/01/2047 | | | 93,049 | | | | 90,334 | |
BE3619, 4.000%, 05/01/2047 | | | 90,320 | | | | 89,672 | |
MA3008, 4.500%, 05/01/2047 | | | 17,510 | | | | 17,584 | |
AS9829, 3.500%, 06/01/2047 | | | 37,844 | | | | 36,727 | |
AS9664, 4.000%, 06/01/2047 | | | 22,913 | | | | 22,804 | |
BE3702, 4.000%, 06/01/2047 | | | 50,111 | | | | 49,697 | |
AS9831, 4.000%, 06/01/2047 | | | 55,511 | | | | 55,197 | |
BM5179, 3.000%, 07/01/2047 | | | 68,996 | | | | 65,406 | |
BE3767, 3.500%, 07/01/2047 | | | 48,209 | | | | 46,712 | |
CA0062, 4.000%, 07/01/2047 | | | 44,615 | | | | 44,390 | |
MA3121, 4.000%, 09/01/2047 | | | 520,405 | | | | 517,158 | |
FM4019, 3.500%, 10/01/2047 | | | 439,614 | | | | 424,336 | |
CA0559, 4.500%, 10/01/2047 | | | 53,347 | | | | 53,985 | |
FM1467, 3.000%, 12/01/2047 | | | 68,201 | | | | 64,994 | |
BH7058, 3.500%, 12/01/2047 | | | 122,819 | | | | 118,659 | |
MA3210, 3.500%, 12/01/2047 | | | 113,094 | | | | 109,375 | |
FM2897, 3.000%, 02/01/2048 | | | 214,300 | | | | 202,775 | |
CA4140, 3.000%, 02/01/2048 | | | 68,332 | | | | 64,345 | |
CA1535, 3.500%, 02/01/2048 | | | 23,240 | | | | 22,517 | |
BJ8783, 3.500%, 02/01/2048 | | | 83,813 | | | | 81,185 | |
CA1218, 4.500%, 02/01/2048 | | | 38,724 | | | | 38,837 | |
MA3278, 4.500%, 02/01/2048 | | | 225,816 | | | | 227,030 | |
BJ0650, 3.500%, 03/01/2048 | | | 51,067 | | | | 49,398 | |
BJ0648, 3.500%, 03/01/2048 | | | 48,229 | | | | 46,653 | |
BM3590, 3.500%, 03/01/2048 | | | 98,843 | | | | 95,700 | |
FM5923, 3.500%, 03/01/2048 | | | 608,502 | | | | 589,920 | |
BM3900, 4.000%, 04/01/2048 | | | 94,362 | | | | 93,699 | |
CA1710, 4.500%, 05/01/2048 | | | 66,205 | | | | 66,772 | |
FM2385, 3.000%, 09/01/2048 | | | 131,168 | | | | 123,505 | |
FM1572, 3.000%, 09/01/2048 | | | 216,356 | | | | 204,798 | |
BM5024, 3.000%, 11/01/2048 | | | 57,584 | | | | 54,129 | |
FM2915, 3.000%, 11/01/2048 | | | 469,209 | | | | 446,907 | |
FM5108, 3.500%, 11/01/2048 | | | 621,788 | | | | 603,640 | |
FM1239, 3.500%, 11/01/2048 | | | 76,471 | | | | 74,059 | |
FM2239, 3.000%, 12/01/2048 | | | 115,770 | | | | 109,310 | |
CA2922, 3.000%, 12/01/2048 | | | 193,364 | | | | 181,607 | |
FM1051, 4.500%, 05/01/2049 | | | 155,936 | | | | 156,956 | |
FM4895, 4.000%, 06/01/2049 | | | 398,138 | | | | 395,904 | |
CA3683, 4.500%, 06/01/2049 | | | 60,614 | | | | 61,057 | |
BO2201, 3.000%, 09/01/2049 | | | 162,763 | | | | 151,436 | |
The accompanying notes are an integral part of these financial statements.
33
PMC CORE FIXED INCOME FUND | Schedule of Investments |
August 31, 2022 (Continued)
| | | | | | | | |
| | |
| | | Principal
Amount
| | | Value
| |
CA4571, 4.000%, 11/01/2049 | | $ | 401,636 | | | $ | 396,209 | |
BO6164, 3.000%, 01/01/2050 | | | 68,799 | | | | 64,072 | |
BO8947, 3.000%, 01/01/2050 | | | 87,426 | | | | 81,283 | |
FM3619, 4.500%, 01/01/2050 | | | 102,384 | | | | 102,084 | |
BP2099, 3.000%, 02/01/2050 | | | 360,211 | | | | 335,379 | |
BP1424, 3.000%, 03/01/2050 | | | 132,625 | | | | 123,293 | |
FM7592, 3.500%, 03/01/2050 | | | 605,981 | | | | 584,417 | |
CA5519, 3.000%, 04/01/2050 | | | 77,297 | | | | 71,946 | |
FM4334, 3.000%, 04/01/2050 | | | 186,657 | | | | 174,089 | |
MA3992, 3.500%, 04/01/2050 | | | 152,657 | | | | 147,095 | |
CA5559, 3.500%, 04/01/2050 | | | 625,142 | | | | 602,007 | |
CA5670, 3.000%, 05/01/2050 | | | 124,044 | | | | 115,337 | |
CA5668, 3.000%, 05/01/2050 | | | 295,318 | | | | 274,861 | |
CA6086, 3.000%, 06/01/2050 | | | 1,222,707 | | | | 1,139,969 | |
BP6466, 3.000%, 07/01/2050 | | | 192,619 | | | | 179,257 | |
CA6291, 3.000%, 07/01/2050 | | | 87,192 | | | | 81,193 | |
BP6481, 4.500%, 07/01/2050 | | | 34,967 | | | | 35,085 | |
BQ0239, 2.500%, 08/01/2050 | | | 200,399 | | | | 180,886 | |
BQ0188, 3.000%, 08/01/2050 | | | 106,758 | | | | 99,341 | |
BP6716, 2.500%, 09/01/2050 | | | 354,221 | | | | 318,090 | |
BK3044, 2.500%, 09/01/2050 | | | 336,345 | | | | 302,061 | |
MA4121, 3.000%, 09/01/2050 | | | 578,904 | | | | 540,157 | |
FM9143, 4.500%, 09/01/2050 | | | 144,278 | | | | 145,189 | |
MA4160, 3.000%, 10/01/2050 | | | 488,801 | | | | 454,853 | |
MA4170, 4.500%, 10/01/2050 | | | 337,139 | | | | 336,850 | |
FM7475, 4.500%, 10/01/2050 | | | 23,758 | | | | 23,912 | |
MA4208, 2.000%, 12/01/2050 | | | 2,467,403 | | | | 2,138,047 | |
FM5316, 2.000%, 12/01/2050 | | | 198,725 | | | | 171,932 | |
MA4237, 2.000%, 01/01/2051 | | | 207,024 | | | | 179,228 | |
BR1269, 2.500%, 01/01/2051 | | | 783,338 | | | | 705,541 | |
MA4256, 2.500%, 02/01/2051 | | | 700,443 | | | | 628,874 | |
FM6289, 3.000%, 02/01/2051 | | | 549,403 | | | | 511,158 | |
MA4282, 2.500%, 03/01/2051 | | | 445,840 | | | | 400,311 | |
MA4306, 2.500%, 04/01/2051 | | | 286,524 | | | | 257,070 | |
BR7795, 2.500%, 04/01/2051 | | | 716,561 | | | | 642,513 | |
MA4307, 3.000%, 04/01/2051 | | | 843,920 | | | | 784,814 | |
MA4325, 2.000%, 05/01/2051 | | | 714,652 | | | | 617,589 | |
MA4326, 2.500%, 05/01/2051 | | | 472,997 | | | | 423,646 | |
BT2488, 2.500%, 05/01/2051 | | | 446,568 | | | | 400,320 | |
FM7189, 2.500%, 05/01/2051 | | | 502,373 | | | | 450,530 | |
MA4356, 2.500%, 06/01/2051 | | | 938,741 | | | | 843,493 | |
BT0417, 2.500%, 06/01/2051 | | | 308,937 | | | | 276,905 | |
FM7738, 2.500%, 06/01/2051 | | | 509,071 | | | | 456,311 | |
MA4357, 3.000%, 06/01/2051 | | | 681,224 | | | | 633,228 | |
MA4378, 2.000%, 07/01/2051 | | | 671,959 | | | | 581,397 | |
FS1550, 2.500%, 07/01/2051 | | | 358,399 | | | | 322,032 | |
BT1339, 2.500%, 07/01/2051 | | | 777,826 | | | | 697,315 | |
CB1027, 2.500%, 07/01/2051 | | | 267,075 | | | | 239,318 | |
MA4379, 2.500%, 07/01/2051 | | | 370,750 | | | | 332,376 | |
CB1038, 2.500%, 07/01/2051 | | | 333,386 | | | | 298,778 | |
FM8178, 2.500%, 07/01/2051 | | | 809,600 | | | | 725,334 | |
MA4380, 3.000%, 07/01/2051 | | | 938,747 | | | | 872,510 | |
MA4399, 2.500%, 08/01/2051 | | | 2,457,304 | | | | 2,202,498 | |
FM8360, 2.500%, 08/01/2051 | | | 376,124 | | | | 337,801 | |
The accompanying notes are an integral part of these financial statements.
34
PMC CORE FIXED INCOME FUND | Schedule of Investments |
August 31, 2022 (Continued)
| | | | | | | | |
| | |
| | | Principal
Amount
| | | Value
| |
FM8422, 2.500%, 08/01/2051 | | $ | 781,964 | | | $ | 700,961 | |
BT3273, 2.500%, 08/01/2051 | | | 781,668 | | | | 700,567 | |
MA4401, 3.500%, 08/01/2051 | | | 247,838 | | | | 237,331 | |
BT7263, 2.500%, 09/01/2051 | | | 472,527 | | | | 423,575 | |
FM8821, 3.000%, 09/01/2051 | | | 446,676 | | | | 415,067 | |
MA4437, 2.000%, 10/01/2051 | | | 353,664 | | | | 305,550 | |
MA4465, 2.000%, 11/01/2051 | | | 95,208 | | | | 82,269 | |
CB2852, 2.000%, 11/01/2051 | | | 1,371,162 | | | | 1,185,713 | |
MA4493, 2.500%, 12/01/2051 | | | 449,795 | | | | 402,885 | |
FS0121, 2.000%, 01/01/2052 | | | 789,824 | | | | 683,051 | |
CB2548, 2.500%, 01/01/2052 | | | 144,141 | | | | 129,340 | |
FS1027, 3.000%, 02/01/2052 | | | 819,713 | | | | 762,402 | |
BV4139, 2.500%, 03/01/2052 | | | 219,409 | | | | 196,968 | |
BV2859, 3.000%, 03/01/2052 | | | 793,846 | | | | 736,495 | |
MA4600, 3.500%, 05/01/2052 | | | 1,569,255 | | | | 1,500,033 | |
BU8667, 4.000%, 05/01/2052 | | | 572,381 | | | | 562,207 | |
MA4625, 3.500%, 06/01/2052 | | | 640,451 | | | | 612,366 | |
BU8725, 3.500%, 06/01/2052 | | | 249,254 | | | | 238,321 | |
MA4626, 4.000%, 06/01/2052 | | | 713,668 | | | | 698,941 | |
CB3914, 4.000%, 06/01/2052 | | | 539,988 | | | | 528,978 | |
BV2634, 4.000%, 07/01/2052 | | | 548,960 | | | | 537,256 | |
MA4655, 4.000%, 07/01/2052 | | | 494,310 | | | | 484,129 | |
MA4656, 4.500%, 07/01/2052 | | | 345,720 | | | | 344,708 | |
BV2623, 4.500%, 07/01/2052 | | | 272,617 | | | | 271,819 | |
FS2603, 4.500%, 08/01/2052 | | | 725,000 | | | | 722,877 | |
MA4731, 3.500%, 09/01/2052 | | | 350,000 | | | | 334,488 | |
Fannie Mae Principal Strip | | | | | |
#TBA, 0.000%, 07/15/2037 | | | 1,370,000 | | | | 780,948 | |
Fannie Mae REMICS | | | | | |
2012-70, 3.556% (1 Month LIBOR USD + 6.000%), 07/25/2042(c)(e) | | | 969,183 | | | | 121,564 | |
2012-68, 3.606% (1 Month LIBOR USD + 6.050%), 07/25/2042(c)(e) | | | 1,632,896 | | | | 215,699 | |
2013-6, 3.656% (1 Month LIBOR USD + 6.100%), 02/25/2043(c)(e) | | | 1,023,655 | | | | 125,056 | |
2013-18, 3.656% (1 Month LIBOR USD + 6.100%), 03/25/2043(c)(e) | | | 1,088,696 | | | | 141,372 | |
2014-90, 3.706% (1 Month LIBOR USD + 6.150%), 01/25/2045(c)(e) | | | 1,562,584 | | | | 202,440 | |
2015-32, 3.756% (1 Month LIBOR USD + 6.200%), 05/25/2045(c)(e) | | | 998,792 | | | | 127,707 | |
2016-03, 4.000%, 02/25/2046(e) | | | 464,283 | | | | 83,055 | |
2016-40, 3.406% (1 Month LIBOR USD + 5.850%), 07/25/2046(c)(e) | | | 632,400 | | | | 81,870 | |
2018-07, 4.000%, 02/25/2048(e) | | | 1,285,049 | | | | 246,996 | |
2020-52, 4.500%, 08/25/2050(e) | | | 1,167,025 | | | | 248,260 | |
Freddie Mac Gold Pool | | | | | |
G1-3122, 5.000%, 04/01/2023 | | | 47 | | | | 48 | |
G1-4953, 3.500%, 01/01/2029 | | | 16,299 | | | | 16,154 | |
A8-6315, 4.500%, 05/01/2039 | | | 14,482 | | | | 14,792 | |
A8-6521, 4.500%, 05/01/2039 | | | 28,836 | | | | 29,524 | |
A9-3617, 4.500%, 08/01/2040 | | | 2,436 | | | | 2,494 | |
Q0-0285, 4.500%, 04/01/2041 | | | 3,810 | | | | 3,901 | |
Q0-0876, 4.500%, 05/01/2041 | | | 24,277 | | | | 24,858 | |
Q0-2173, 4.500%, 07/01/2041 | | | 16,368 | | | | 16,759 | |
Q0-3705, 4.000%, 10/01/2041 | | | 17,066 | | | | 16,862 | |
C0-3795, 3.500%, 04/01/2042 | | | 118,248 | | | | 115,459 | |
Q0-9004, 3.500%, 06/01/2042 | | | 11,082 | | | | 10,794 | |
C0-9004, 3.500%, 07/01/2042 | | | 11,633 | | | | 11,359 | |
Q0-9896, 3.500%, 08/01/2042 | | | 15,237 | | | | 14,877 | |
Q1-1348, 3.500%, 09/01/2042 | | | 31,880 | | | | 31,129 | |
The accompanying notes are an integral part of these financial statements.
35
PMC CORE FIXED INCOME FUND | Schedule of Investments |
August 31, 2022 (Continued)
| | | | | | | | |
| | |
| | | Principal
Amount
| | | Value
| |
Q1-8305, 3.500%, 05/01/2043 | | $ | 12,812 | | | $ | 12,509 | |
Q1-9475, 3.500%, 06/01/2043 | | | 21,882 | | | | 21,372 | |
G6-0030, 3.500%, 07/01/2043 | | | 68,802 | | | | 67,229 | |
Q2-0780, 3.500%, 08/01/2043 | | | 27,163 | | | | 26,640 | |
Q2-0857, 3.500%, 08/01/2043 | | | 17,123 | | | | 16,835 | |
G0-7459, 3.500%, 08/01/2043 | | | 13,840 | | | | 13,513 | |
G0-8541, 3.500%, 08/01/2043 | | | 24,311 | | | | 23,737 | |
V8-0509, 4.000%, 10/01/2043 | | | 14,337 | | | | 14,356 | |
G0-8558, 4.000%, 11/01/2043 | | | 16,128 | | | | 16,141 | |
Q2-6367, 4.000%, 05/01/2044 | | | 4,392 | | | | 4,387 | |
Q2-6513, 4.500%, 06/01/2044 | | | 11,984 | | | | 12,040 | |
Q2-9916, 4.000%, 11/01/2044 | | | 19,065 | | | | 19,052 | |
Q4-5219, 3.500%, 01/01/2045 | | | 82,340 | | | | 80,296 | |
G0-7961, 3.500%, 03/01/2045 | | | 18,840 | | | | 18,395 | |
G0-8633, 4.000%, 03/01/2045 | | | 36,512 | | | | 36,541 | |
G0-8636, 3.500%, 04/01/2045 | | | 22,070 | | | | 21,459 | |
G0-8637, 4.000%, 04/01/2045 | | | 18,217 | | | | 18,231 | |
Q3-3869, 4.000%, 06/01/2045 | | | 11,867 | | | | 11,877 | |
Q3-5225, 3.500%, 08/01/2045 | | | 10,864 | | | | 10,554 | |
G0-8659, 3.500%, 08/01/2045 | | | 60,260 | | | | 58,541 | |
G0-8660, 4.000%, 08/01/2045 | | | 72,017 | | | | 72,031 | |
V8-1873, 4.000%, 08/01/2045 | | | 16,177 | | | | 16,180 | |
V8-1992, 4.000%, 10/01/2045 | | | 220,063 | | | | 218,631 | |
G0-8672, 4.000%, 10/01/2045 | | | 12,047 | | | | 12,042 | |
G0-8676, 3.500%, 11/01/2045 | | | 26,141 | | | | 25,417 | |
G6-0480, 4.500%, 11/01/2045 | | | 10,849 | | | | 11,119 | |
G0-8681, 3.500%, 12/01/2045 | | | 19,451 | | | | 18,896 | |
G0-8682, 4.000%, 12/01/2045 | | | 24,408 | | | | 24,388 | |
Q3-8470, 4.000%, 01/01/2046 | | | 13,728 | | | | 13,696 | |
Q3-8473, 4.000%, 01/01/2046 | | | 24,211 | | | | 24,158 | |
G0-8694, 4.000%, 02/01/2046 | | | 14,000 | | | | 13,983 | |
Q3-9434, 3.500%, 03/01/2046 | | | 4,063 | | | | 3,945 | |
Q3-9644, 3.500%, 03/01/2046 | | | 88,086 | | | | 85,572 | |
G0-8693, 3.500%, 03/01/2046 | | | 4,367 | | | | 4,242 | |
Q3-9438, 4.000%, 03/01/2046 | | | 77,287 | | | | 77,015 | |
G0-8699, 4.000%, 03/01/2046 | | | 37,981 | | | | 37,926 | |
G0-8702, 3.500%, 04/01/2046 | | | 44,886 | | | | 43,605 | |
Q4-0375, 3.500%, 05/01/2046 | | | 29,177 | | | | 28,345 | |
G0-8706, 3.500%, 05/01/2046 | | | 20,587 | | | | 20,163 | |
Q4-0718, 3.500%, 05/01/2046 | | | 126,088 | | | | 122,492 | |
G0-8708, 4.500%, 05/01/2046 | | | 29,707 | | | | 30,296 | |
Q4-1208, 3.500%, 06/01/2046 | | | 63,387 | | | | 61,583 | |
Q4-5458, 4.000%, 08/01/2046 | | | 61,953 | | | | 61,875 | |
G0-8721, 3.000%, 09/01/2046 | | | 43,495 | | | | 41,190 | |
G0-8735, 4.500%, 10/01/2046 | | | 42,209 | | | | 42,796 | |
G0-8741, 3.000%, 01/01/2047 | | | 797,205 | | | | 753,319 | |
G0-8743, 4.000%, 01/01/2047 | | | 35,904 | | | | 35,770 | |
Q4-6279, 3.500%, 02/01/2047 | | | 50,810 | | | | 49,286 | |
Q4-6283, 4.000%, 02/01/2047 | | | 40,692 | | | | 40,461 | |
G0-8752, 4.000%, 03/01/2047 | | | 17,523 | | | | 17,574 | |
Q4-6539, 4.500%, 03/01/2047 | | | 3,476 | | | | 3,487 | |
G0-8757, 3.500%, 04/01/2047 | | | 8,257 | | | | 8,022 | |
G0-8759, 4.500%, 04/01/2047 | | | 13,590 | | | | 13,767 | |
V8-3204, 4.500%, 05/01/2047 | | | 32,782 | | | | 33,027 | |
The accompanying notes are an integral part of these financial statements.
36
PMC CORE FIXED INCOME FUND | Schedule of Investments |
August 31, 2022 (Continued)
| | | | | | | | |
| | |
| | | Principal
Amount
| | | Value
| |
Q4-9100, 4.000%, 07/01/2047 | | $ | 79,618 | | | $ | 79,178 | |
Q4-9394, 4.500%, 07/01/2047 | | | 68,046 | | | | 68,943 | |
Q4-9888, 3.500%, 08/01/2047 | | | 43,205 | | | | 41,972 | |
Q5-0035, 3.500%, 08/01/2047 | | | 62,213 | | | | 60,437 | |
Q5-0109, 3.500%, 08/01/2047 | | | 8,735 | | | | 8,472 | |
G6-1228, 4.000%, 08/01/2047 | | | 120,324 | | | | 119,827 | |
G0-8779, 3.500%, 09/01/2047 | | | 177,868 | | | | 172,647 | |
G0-8785, 4.000%, 10/01/2047 | | | 91,473 | | | | 90,735 | |
Q5-2319, 3.500%, 11/01/2047 | | | 135,794 | | | | 131,723 | |
G6-1631, 3.500%, 11/01/2047 | | | 159,459 | | | | 154,946 | |
G6-1467, 4.000%, 11/01/2047 | | | 118,515 | | | | 118,026 | |
G6-1281, 3.500%, 01/01/2048 | | | 77,013 | | | | 74,768 | |
G0-8800, 3.500%, 02/01/2048 | | | 104,627 | | | | 101,406 | |
Q5-4463, 4.000%, 02/01/2048 | | | 58,385 | | | | 58,108 | |
G6-7710, 3.500%, 03/01/2048 | | | 145,543 | | | | 141,237 | |
Freddie Mac Multifamily Structured Pass Through Certificates | | | | | |
K-098, 1.517%, 08/25/2029(d)(e) | | | 1,985,000 | | | | 161,803 | |
Freddie Mac Pool | | | | | |
ZS-9972, 3.000%, 03/01/2042 | | | 740,882 | | | | 705,495 | |
ZM-0630, 4.000%, 01/01/2046 | | | 242,376 | | | | 241,669 | |
ZT-0390, 4.000%, 03/01/2046 | | | 95,642 | | | | 95,632 | |
ZM-1590, 3.000%, 08/01/2046 | | | 534,884 | | | | 504,940 | |
SD-0035, 3.000%, 04/01/2047 | | | 475,830 | | | | 452,264 | |
ZM-4908, 3.500%, 11/01/2047 | | | 217,270 | | | | 210,558 | |
ZA-5250, 4.000%, 01/01/2048 | | | 201,841 | | | | 201,436 | |
ZS-4759, 3.500%, 03/01/2048 | | | 133,400 | | | | 129,198 | |
ZM-6197, 4.000%, 04/01/2048 | | | 477,027 | | | | 475,973 | |
SD-0298, 3.000%, 11/01/2048 | | | 336,608 | | | | 318,104 | |
ZN-2103, 4.500%, 12/01/2048 | | | 34,368 | | | | 34,552 | |
ZA-7141, 3.000%, 06/01/2049 | | | 65,622 | | | | 61,123 | |
SD-8005, 3.500%, 08/01/2049 | | | 622,028 | | | | 599,727 | |
SD-8013, 4.500%, 09/01/2049 | | | 96,309 | | | | 96,968 | |
SI-2009, 3.000%, 10/01/2049 | | | 412,771 | | | | 384,681 | |
QA-5549, 3.000%, 12/01/2049 | | | 226,175 | | | | 210,495 | |
QA-6750, 3.000%, 02/01/2050 | | | 127,951 | | | | 119,514 | |
QA-7325, 3.000%, 02/01/2050 | | | 169,419 | | | | 158,007 | |
QA-8311, 3.000%, 03/01/2050 | | | 196,586 | | | | 184,437 | |
SD-8068, 3.000%, 06/01/2050 | | | 558,788 | | | | 519,709 | |
RA-2970, 2.500%, 07/01/2050 | | | 185,905 | | | | 167,390 | |
SD-8074, 3.000%, 07/01/2050 | | | 82,285 | | | | 76,469 | |
SD-8075, 3.500%, 07/01/2050 | | | 470,623 | | | | 453,288 | |
QB-2682, 2.500%, 08/01/2050 | | | 136,394 | | | | 122,454 | |
SD-8084, 3.000%, 08/01/2050 | | | 240,716 | | | | 223,801 | |
SD-8086, 4.000%, 08/01/2050 | | | 187,429 | | | | 184,863 | |
RA-3484, 3.000%, 09/01/2050 | | | 283,722 | | | | 263,858 | |
SD-8098, 2.000%, 10/01/2050 | | | 2,397,635 | | | | 2,075,849 | |
QB-4785, 2.500%, 10/01/2050 | | | 198,310 | | | | 178,037 | |
QB-6037, 2.500%, 11/01/2050 | | | 142,735 | | | | 128,136 | |
SD-8122, 2.500%, 01/01/2051 | | | 418,752 | | | | 375,932 | |
SD-8123, 3.000%, 01/01/2051 | | | 576,994 | | | | 536,771 | |
SD-8129, 2.500%, 02/01/2051 | | | 563,821 | | | | 506,083 | |
RA-4527, 2.500%, 02/01/2051 | | | 288,608 | | | | 258,972 | |
SD-8135, 2.500%, 03/01/2051 | | | 202,388 | | | | 181,690 | |
QC-0945, 2.500%, 04/01/2051 | | | 813,041 | | | | 729,176 | |
The accompanying notes are an integral part of these financial statements.
37
PMC CORE FIXED INCOME FUND | Schedule of Investments |
August 31, 2022 (Continued)
| | | | | | | | |
| | |
| | | Principal
Amount
| | | Value
| |
SD-8147, 2.500%, 05/01/2051 | | $ | 471,913 | | | $ | 423,162 | |
QC-2565, 2.000%, 06/01/2051 | | | 548,789 | | | | 474,662 | |
SD-8156, 2.500%, 07/01/2051 | | | 437,625 | | | | 392,279 | |
QC-3907, 2.500%, 07/01/2051 | | | 464,297 | | | | 416,041 | |
QC-4235, 2.500%, 07/01/2051 | | | 722,094 | | | | 646,908 | |
SD-8160, 2.000%, 08/01/2051 | | | 833,037 | | | | 720,472 | |
QC-6209, 2.500%, 08/01/2051 | | | 396,753 | | | | 355,569 | |
QC-5978, 2.500%, 08/01/2051 | | | 636,073 | | | | 570,822 | |
SD-8167, 2.500%, 09/01/2051 | | | 1,137,598 | | | | 1,019,369 | |
RA-5855, 2.500%, 09/01/2051 | | | 748,293 | | | | 670,291 | |
SD-8169, 3.500%, 09/01/2051 | | | 113,953 | | | | 109,202 | |
SD-0780, 2.500%, 12/01/2051 | | | 516,391 | | | | 462,654 | |
SD-8184, 3.000%, 12/01/2051 | | | 208,490 | | | | 193,558 | |
SD-8189, 2.500%, 01/01/2052 | | | 811,374 | | | | 726,543 | |
RA-6686, 4.000%, 01/01/2052 | | | 236,406 | | | | 231,708 | |
QD-7594, 2.500%, 02/01/2052 | | | 688,474 | | | | 618,443 | |
SD-1011, 2.500%, 04/01/2052 | | | 407,811 | | | | 365,442 | |
SD-8214, 3.500%, 05/01/2052 | | | 1,127,652 | | | | 1,077,911 | |
QE-5474, 4.000%, 07/01/2052 | | | 348,991 | | | | 341,824 | |
SD-1060, 4.000%, 07/01/2052 | | | 349,088 | | | | 341,805 | |
SD-8231, 4.500%, 07/01/2052 | | | 346,320 | | | | 345,306 | |
QE-6058, 4.500%, 07/01/2052 | | | 784,680 | | | | 782,383 | |
SD-8233, 5.000%, 07/01/2052 | | | 689,492 | | | | 698,777 | |
SD-1382, 4.000%, 08/01/2052 | | | 849,072 | | | | 832,110 | |
Freddie Mac REMICS | | | | | |
4121, 3.809% (1 Month LIBOR USD + 6.200%), 10/15/2042(c)(e) | | | 973,685 | | | | 132,106 | |
4122, 4.000%, 10/15/2042(e) | | | 1,022,366 | | | | 195,020 | |
4159, 3.759% (1 Month LIBOR USD + 6.150%), 01/15/2043(c)(e) | | | 1,368,610 | | | | 201,858 | |
4459, 4.000%, 08/15/2043(e) | | | 2,018,085 | | | | 375,530 | |
4385, 4.500%, 09/15/2044(e) | | | 199,895 | | | | 36,015 | |
4572, 3.659% (1 Month LIBOR USD + 6.050%), 04/15/2046(c)(e) | | | 446,262 | | | | 58,345 | |
4583, 3.609% (1 Month LIBOR USD + 6.000%), 05/15/2046(c)(e) | | | 457,459 | | | | 56,622 | |
4616, 3.609% (1 Month LIBOR USD + 6.000%), 09/15/2046(c)(e) | | | 1,097,894 | | | | 153,302 | |
4623, 3.609% (1 Month LIBOR USD + 6.000%), 10/15/2046(c)(e) | | | 994,171 | | | | 147,979 | |
4648, 3.609% (1 Month LIBOR USD + 6.000%), 01/15/2047(c)(e) | | | 428,768 | | | | 56,622 | |
Freddie Mac STACR REMIC Trust | | | | | |
2022-HQA1, 5.683% (SOFR30A + 3.500%), 03/25/2042(b)(c) | | | 309,000 | | | | 309,013 | |
2022-DNA3, 5.083% (SOFR30A + 2.900%), 04/25/2042(b)(c) | | | 506,000 | | | | 501,294 | |
Freddie Mac Structured Agency Credit Risk Debt Notes | | | | | |
2017-HQA3, 4.794% (1 Month LIBOR USD + 2.350%), 04/25/2030(c) | | | 735,362 | | | | 737,932 | |
2018-DNA1, 4.244% (1 Month LIBOR USD + 1.800%), 07/25/2030(c) | | | 332,458 | | | | 331,623 | |
2018-HQA1, 4.744% (1 Month LIBOR USD + 2.300%), 09/25/2030(c) | | | 690,193 | | | | 694,349 | |
2019-CS03, 2.444% (1 Month LIBOR USD + 0.000%), 10/25/2032(b)(c) | | | 390,219 | | | | 389,057 | |
2021-DNA7, 3.033% (SOFR30A + 0.850%), 11/25/2041(b)(c) | | | 1,987,000 | | | | 1,967,811 | |
2022-DNA2, 4.583% (SOFR30A + 2.400%), 02/25/2042(b)(c) | | | 1,650,000 | | | | 1,611,135 | |
Ginnie Mae | | | | | |
#TBA, 4.000%, 09/15/2041 | | | 3,620,000 | | | | 3,573,195 | |
#TBA, 4.500%, 09/15/2041 | | | 6,585,000 | | | | 6,597,587 | |
#TBA, 5.000%, 09/15/2048 | | | 890,000 | | | | 903,271 | |
Ginnie Mae II Pool | | | | | |
MA0699M, 3.500%, 01/20/2043 | | | 25,098 | | | | 24,617 | |
MA0783M, 3.500%, 02/20/2043 | | | 34,173 | | | | 33,598 | |
MA0934M, 3.500%, 04/20/2043 | | | 24,319 | | | | 23,905 | |
MA3663M, 3.500%, 05/20/2046 | | | 42,253 | | | | 41,399 | |
The accompanying notes are an integral part of these financial statements.
38
PMC CORE FIXED INCOME FUND | Schedule of Investments |
August 31, 2022 (Continued)
| | | | | | | | |
| | |
| | | Principal
Amount
| | | Value
| |
MA3803M, 3.500%, 07/20/2046 | | $ | 16,401 | | | $ | 16,067 | |
MA4510M, 3.500%, 06/20/2047 | | | 66,911 | | | | 65,491 | |
MA4586M, 3.500%, 07/20/2047 | | | 92,245 | | | | 90,240 | |
MA4652M, 3.500%, 08/20/2047 | | | 62,064 | | | | 60,695 | |
MA4900M, 3.500%, 12/20/2047 | | | 47,023 | | | | 45,941 | |
MA6542M, 3.500%, 03/20/2050 | | | 255,633 | | | | 249,021 | |
MA6600M, 3.500%, 04/20/2050 | | | 18,877 | | | | 18,345 | |
MA6601M, 4.000%, 04/20/2050 | | | 85,174 | | | | 84,817 | |
MA7138M, 3.500%, 01/20/2051 | | | 243,467 | | | | 236,487 | |
MA7192M, 2.000%, 02/20/2051 | | | 302,208 | | | | 269,324 | |
MA7193M, 2.500%, 02/20/2051 | | | 306,245 | | | | 280,984 | |
MA7254M, 2.000%, 03/20/2051 | | | 307,891 | | | | 274,331 | |
MA7255M, 2.500%, 03/20/2051 | | | 758,694 | | | | 696,094 | |
MA7311M, 2.000%, 04/20/2051 | | | 877,292 | | | | 781,467 | |
MA7312M, 2.500%, 04/20/2051 | | | 836,527 | | | | 768,038 | |
MA7367M, 2.500%, 05/20/2051 | | | 307,351 | | | | 281,880 | |
MA7418M, 2.500%, 06/20/2051 | | | 641,013 | | | | 587,557 | |
MA7472M, 2.500%, 07/20/2051 | | | 420,106 | | | | 384,921 | |
MA7589M, 2.500%, 09/20/2051 | | | 939,870 | | | | 860,816 | |
MA7648M, 2.000%, 10/20/2051 | | | 305,438 | | | | 271,465 | |
MA7766M, 2.000%, 12/20/2051 | | | 505,163 | | | | 448,765 | |
MA7828M, 3.000%, 01/20/2052 | | | 860,751 | | | | 810,179 | |
MA7935M, 2.000%, 03/20/2052 | | | 53,937 | | | | 47,872 | |
MA7938M, 3.500%, 03/20/2052 | | | 103,313 | | | | 99,904 | |
MA8043M, 3.000%, 05/20/2052 | | | 741,107 | | | | 697,381 | |
MA8045M, 4.000%, 05/20/2052 | | | 669,824 | | | | 662,061 | |
MA8099M, 3.500%, 06/20/2052 | | | 795,384 | | | | 769,084 | |
MA8200M, 4.000%, 08/20/2052 | | | 600,000 | | | | 593,746 | |
Government National Mortgage Association | | | | | |
2013-23, 3.500%, 02/20/2043(e) | | | 608,100 | | | | 111,814 | |
2015-162, 4.382% (1 Month LIBOR USD + 6.750%), 11/20/2045(c)(e) | | | 915,347 | | | | 146,909 | |
2018-007, 3.832% (1 Month LIBOR USD + 6.200%), 01/20/2048(c)(e) | | | 1,036,861 | | | | 130,836 | |
2020-173, 2.500%, 11/20/2050(e) | | | 2,409,304 | | | | 310,647 | |
2021-116, 2.500%, 06/20/2051(e) | | | 2,657,519 | | | | 335,022 | |
Uniform Mortgage Backed Securities | | | | | |
#TBA, 4.500%, 09/15/2041 | | | 3,795,000 | | | | 3,779,721 | |
| | | | | | |
|
|
|
TOTAL AGENCY MORTGAGE BACKED SECURITIES (Cost $142,029,776) | | | | | | | 133,161,760 | |
| | | | | | |
|
|
|
| U.S. GOVERNMENT AGENCY ISSUES—0.45% | | | | | | | | |
Federal Home Loan Mortgage Corp. | | | | | |
0.375%, 09/23/2025 | | | 225,000 | | | | 205,137 | |
Federal National Mortgage Association | | | | | |
0.500%, 11/07/2025 | | | 255,000 | | | | 232,296 | |
0.750%, 10/08/2027 | | | 745,000 | | | | 656,137 | |
0.875%, 08/05/2030 | | | 575,000 | | | | 474,266 | |
Tennessee Valley Authority | | | | | |
5.250%, 09/15/2039 | | | 320,000 | | | | 362,328 | |
| | | | | | |
|
|
|
TOTAL U.S. GOVERNMENT AGENCY ISSUES (Cost $2,181,277) | | | | | | | 1,930,164 | |
| | | | | | |
|
|
|
U.S. GOVERNMENT NOTES/BONDS—12.86% | | | | | |
United States Treasury Inflation Indexed Bonds | | | | | |
0.375%, 01/15/2027 | | | 8,862,619 | | | | 8,755,621 | |
0.125%, 01/15/2032 | | | 4,168,827 | | | | 3,964,827 | |
The accompanying notes are an integral part of these financial statements.
39
PMC CORE FIXED INCOME FUND | Schedule of Investments |
August 31, 2022 (Continued)
| | | | | | | | |
| | |
| | | Principal
Amount
| | | Value
| |
United States Treasury Note/Bond | | | | | |
2.750%, 11/15/2023 | | $ | 1,910,000 | | | $ | 1,894,854 | |
0.250%, 05/15/2024 | | | 425,000 | | | | 402,671 | |
2.750%, 07/31/2027 | | | 12,805,000 | | | | 12,483,374 | |
2.625%, 07/31/2029 | | | 3,140,000 | | | | 3,018,570 | |
3.125%, 08/31/2029 | | | 1,835,000 | | | | 1,821,810 | |
2.750%, 08/15/2032 | | | 1,040,000 | | | | 1,006,363 | |
4.375%, 02/15/2038 | | | 195,000 | | | | 223,382 | |
4.250%, 11/15/2040 | | | 775,000 | | | | 864,670 | |
1.750%, 08/15/2041 | | | 500,000 | | | | 373,399 | |
3.000%, 05/15/2042 | | | 175,000 | | | | 161,602 | |
3.250%, 05/15/2042(f) | | | 4,235,000 | | | | 4,067,585 | |
3.625%, 02/15/2044 | | | 1,440,000 | | | | 1,451,419 | |
3.125%, 08/15/2044 | | | 1,255,000 | | | | 1,166,415 | |
3.000%, 11/15/2044 | | | 1,003,300 | | | | 912,102 | |
2.500%, 02/15/2045 | | | 1,390,000 | | | | 1,155,220 | |
3.000%, 02/15/2047 | | | 2,250,000 | | | | 2,052,290 | |
3.000%, 05/15/2047 | | | 2,420,000 | | | | 2,210,802 | |
2.750%, 08/15/2047 | | | 240,000 | | | | 209,709 | |
3.375%, 11/15/2048 | | | 1,745,000 | | | | 1,737,570 | |
2.375%, 11/15/2049 | | | 210,000 | | | | 173,997 | |
2.250%, 02/15/2052 | | | 6,435,000 | | | | 5,166,098 | |
3.000%, 08/15/2052 | | | 305,000 | | | | 290,274 | |
| | | | | | |
|
|
|
TOTAL U.S. GOVERNMENT NOTES/BONDS (Cost $57,430,474) | | | | | | | 55,564,624 | |
| | | | | | |
|
|
|
| | |
| | | Shares
| | | | |
| EXCHANGE-TRADED FUNDS—0.12% | | | | | | | | |
iShares Core U.S. Aggregate Bond ETF(f) | | | 5,234 | | | | 527,116 | |
| | | | | | |
|
|
|
TOTAL EXCHANGE-TRADED FUNDS (Cost $544,939) | | | | | | | 527,116 | |
| | | | | | |
|
|
|
| INVESTMENTS PURCHASED WITH COLLATERAL FROM SECURITIES LENDING—5.49% | | | | | | | | |
Money Market Fund—5.49% | | | | | | | | |
Mount Vernon Liquid Assets Portfolio, LLC, 2.440%(g) | | | 23,745,201 | | | | 23,745,201 | |
| | | | | | |
|
|
|
TOTAL INVESTMENTS PURCHASED WITH COLLATERAL FROM SECURITIES LENDING (Cost $23,745,201) | | | | | | | 23,745,201 | |
| | | | | | |
|
|
|
| SHORT-TERM INVESTMENTS—0.88% | | | | | | | | |
First American Government Obligations Fund, Class X, 2.039%(g) | | | 3,784,768 | | | | 3,784,768 | |
| | | | | | |
|
|
|
| SHORT-TERM INVESTMENTS (Cost $3,784,768) | | | | | | | 3,784,768 | |
| | | | | | |
|
|
|
| Total Investments (Cost $520,721,799)—110.64% | | | | | | | 478,183,553 | |
Liabilities in Excess of Other Assets—(10.64)% | | | | (45,980,386 | ) |
| | | | | | |
|
|
|
| TOTAL NET ASSETS—100.00% | | | | | | $ | 432,203,167 | |
| | | | | | |
|
|
|
Percentages are stated as a percent of net assets.
| (a) | | Variable rate security; the rate shown represents the rate at August 31, 2022. |
| (b) | | Securities issued under Rule 144A under the Securities Act of 1933. Such securities are deemed to be liquid. |
| (c) | | Floating rate security; the rate shown represents the rate at August 31, 2022. The coupon is based on an underlying pool of loans and other conditions at the time the loans are securitized. |
| (d) | | Variable rate security; the rate shown represents the rate at August 31, 2022. The coupon is based on an underlying pool of loans and other conditions at the time the loans are securitized. |
| (e) | | Represents an interest-only security that entitles holders to receive only interest payments on underlying mortgages. |
The accompanying notes are an integral part of these financial statements.
40
PMC CORE FIXED INCOME FUND | Schedule of Investments |
August 31, 2022 (Continued)
| (f) | | All or portion of this security is out on loan as of August 31, 2022. Total value of securities out on loan is $23,131,553. |
| (g) | | The rate shown represents the seven day yield at August 31, 2022. |
| (h) | | Perpetual maturity. The date referenced is the next call date. |
Abbreviations
| # | | TBA Pool number to be announced |
The accompanying notes are an integral part of these financial statements.
41
PMC DIVERSIFIED EQUITY FUND | Schedule of Investments |
August 31, 2022
| | | | | | | | |
| | |
| | | Shares
| | | Value
| |
| COMMON STOCKS—95.47% | | | | | | | | |
Accommodation—0.27% | | | | | | | | |
Las Vegas Sands Corp.(a) | | | 9,379 | | | $ | 352,932 | |
Marriott International, Inc. | | | 3,880 | | | | 596,511 | |
MGM Resorts International | | | 31,165 | | | | 1,017,225 | |
Red Rock Resorts, Inc.(c) | | | 4,176 | | | | 159,607 | |
Sodexo SA—ADR | | | 22,286 | | | | 341,199 | |
Vail Resorts, Inc. | | | 193 | | | | 43,363 | |
| | | | | | |
|
|
|
| | | | | | | | 2,510,837 | |
| | | | | | |
|
|
|
Administration of Housing Programs, Urban Planning, and Community Development—0.05% | | | | | | | | |
Ferrovial SA—ADR(a) | | | 18,655 | | | | 467,121 | |
| | | | | | |
|
|
|
Administrative and Support Services—1.65% | | | | | | | | |
9F, Inc.—ADR(a) | | | 1 | | | | 0 | |
ABM Industries, Inc. | | | 6,173 | | | | 286,427 | |
Alibaba Group Holding Ltd.—ADR(a) | | | 8,821 | | | | 841,612 | |
AMN Healthcare Services, Inc.(a) | | | 3,103 | | | | 318,492 | |
AMTD IDEA Group—ADR(a) | | | 21,946 | | | | 39,064 | |
ASGN, Inc.(a)(c) | | | 2,866 | | | | 277,142 | |
Atlas Copco AB—Class B—ADR | | | 37,997 | | | | 345,013 | |
Booking Holdings, Inc.(a) | | | 211 | | | | 395,796 | |
Brambles Ltd.—ADR | | | 27,708 | | | | 465,771 | |
Broadridge Financial Solutions, Inc. | | | 1,949 | | | | 333,610 | |
Cloudflare, Inc.—Class A(a) | | | 2,863 | | | | 179,138 | |
Coinbase Global, Inc.(a)(c) | | | 5,045 | | | | 337,006 | |
Criteo SA—ADR(a) | | | 20,735 | | | | 560,260 | |
Evolent Health, Inc.—Class A(a) | | | 6,767 | | | | 248,687 | |
Expedia Group, Inc.(a) | | | 2,612 | | | | 268,122 | |
Fortum OYJ—ADR | | | 6,906 | | | | 14,088 | |
Global Payments, Inc. | | | 5,123 | | | | 636,430 | |
HeadHunter Group PLC—ADR(e) | | | 3,254 | | | | 48,908 | |
Hillenbrand, Inc. | | | 7,163 | | | | 298,482 | |
HUYA, Inc.—ADR(a)(c) | | | 102,149 | | | | 336,070 | |
Jiayin Group, Inc.—ADR(a) | | | 15,958 | | | | 43,406 | |
Kforce, Inc. | | | 8,370 | | | | 458,006 | |
Korn Ferry | | | 4,817 | | | | 293,452 | |
Live Nation Entertainment, Inc.(a)(c) | | | 6,509 | | | | 588,153 | |
loanDepot, Inc. | | | 43,860 | | | | 72,369 | |
ManpowerGroup, Inc. | | | 5,688 | | | | 417,044 | |
MasterCard, Inc.—Class A | | | 5,832 | | | | 1,891,726 | |
nCino, Inc.(a)(c) | | | 4,201 | | | | 132,500 | |
PayPal Holdings, Inc.(a) | | | 7,602 | | | | 710,331 | |
Robert Half International, Inc. | | | 7,316 | | | | 563,112 | |
ROBLOX Corp.(a)(c) | | | 9,484 | | | | 370,919 | |
Secom Co. Ltd.—ADR | | | 52,764 | | | | 837,365 | |
Sprout Social, Inc.(a) | | | 3,390 | | | | 203,536 | |
Telia Co. AB—ADR | | | 56,428 | | | | 394,996 | |
TrueBlue, Inc.(a) | | | 12,517 | | | | 257,099 | |
Tuniu Corp.—ADR(a) | | | 1 | | | | 1 | |
Upstart Holdings, Inc.(a)(c) | | | 2,133 | | | | 55,245 | |
Visa, Inc.(c) | | | 9,426 | | | | 1,873,040 | |
| | | | | | |
|
|
|
| | | | | | | | 15,392,418 | |
| | | | | | |
|
|
|
The accompanying notes are an integral part of these financial statements.
42
PMC DIVERSIFIED EQUITY FUND | Schedule of Investments |
August 31, 2022 (Continued)
| | | | | | | | |
| | |
| | | Shares
| | | Value
| |
Air Transportation—0.14% | | | | | | | | |
Air France-KLM—ADR | | | 60,499 | | | $ | 90,144 | |
Atlas Air Worldwide Holdings, Inc.(a)(c) | | | 4,001 | | | | 399,780 | |
Cathay Pacific Airways Ltd.—ADR (a) | | | 67,078 | | | | 342,768 | |
Controladora Vuela Cia de Aviacion SAB de CV—ADR(a) | | | 1 | | | | 9 | |
Deutsche Lufthansa AG—ADR | | | 7,601 | | | | 45,446 | |
Southwest Airlines Co.(a) | | | 2,252 | | | | 82,648 | |
Swire Pacific Ltd.—Class A—ADR(c) | | | 48,128 | | | | 334,490 | |
| | | | | | |
|
|
|
| | | | | | | | 1,295,285 | |
| | | | | | |
|
|
|
Ambulatory Health Care Services—0.67% | | | | | | | | |
Acadia Healthcare Co., Inc.(a) | | | 4,526 | | | | 370,815 | |
Aesthetic Medical International Holdings Group Ltd.—ADR(a) | | | 1,724 | | | | 3,551 | |
Apollo Medical Holdings, Inc.(a) | | | 2,586 | | | | 111,534 | |
CareDx, Inc.(a) | | | 4,585 | | | | 89,820 | |
DBV Technologies SA—ADR(a)(c) | | | 22,084 | | | | 44,389 | |
Laboratory Corp. of America Holdings | | | 4,777 | | | | 1,076,115 | |
Molina Healthcare, Inc.(a) | | | 2,292 | | | | 773,252 | |
Option Care Health, Inc.(a) | | | 8,789 | | | | 272,107 | |
Premier, Inc.(c) | | | 14,011 | | | | 493,748 | |
Progyny, Inc.(a) | | | 3,341 | | | | 134,342 | |
Quest Diagnostics, Inc.(c) | | | 11,842 | | | | 1,483,921 | |
Signify Health, Inc.(a) | | | 14,867 | | | | 414,790 | |
Sonic Healthcare Ltd.—ADR(c) | | | 41,730 | | | | 975,230 | |
| | | | | | |
|
|
|
| | | | | | | | 6,243,614 | |
| | | | | | |
|
|
|
Animal Production and Aquaculture—0.01% | | | | | | | | |
Mowi ASA—ADR | | | 5,848 | | | | 119,358 | |
| | | | | | |
|
|
|
Apparel Manufacturing—0.23% | | | | | | | | |
Fast Retailing Co. Ltd.—ADR | | | 12,985 | | | | 761,960 | |
HUGO BOSS AG—ADR | | | 34,542 | | | | 379,617 | |
Lululemon Athletica, Inc.(a) | | | 1,340 | | | | 401,946 | |
Ralph Lauren Corp.(c) | | | 1,916 | | | | 174,988 | |
VF Corp.(c) | | | 9,477 | | | | 392,822 | |
| | | | | | |
|
|
|
| | | | | | | | 2,111,333 | |
| | | | | | |
|
|
|
Beverage and Tobacco Product Manufacturing—1.59% | | | | | | | | |
Altria Group, Inc. | | | 11,041 | | | | 498,170 | |
Anheuser-Busch InBev SA/NV—ADR | | | 4,760 | | | | 230,194 | |
Coca-Cola Co. | | | 18,793 | | | | 1,159,716 | |
Coca-Cola Consolidated, Inc. | | | 599 | | | | 284,124 | |
Coca-Cola Femsa SAB de CV—ADR | | | 11,731 | | | | 718,289 | |
Diageo PLC—ADR | | | 13,216 | | | | 2,331,171 | |
Embotelladora Andina SA—Class A—ADR | | | 5,773 | | | | 55,552 | |
Embotelladora Andina SA—Class B—ADR | | | 4,613 | | | | 54,710 | |
Japan Tobacco, Inc.—ADR | | | 196,970 | | | | 1,654,548 | |
Keurig Dr Pepper, Inc. | | | 24,851 | | | | 947,320 | |
Kirin Holdings Co. Ltd.—ADR(c) | | | 43,214 | | | | 713,895 | |
Molson Coors Brewing Co.—Class B | | | 12,509 | | | | 646,340 | |
National Beverage Corp. | | | 2,144 | | | | 118,906 | |
PepsiCo, Inc. | | | 12,509 | | | | 2,154,925 | |
Philip Morris International, Inc. | | | 20,490 | | | | 1,956,590 | |
Swedish Match AB—ADR | | | 68,379 | | | | 683,106 | |
Treasury Wine Estates Ltd.—ADR(c) | | | 39,453 | | | | 355,077 | |
Vector Group Ltd. | | | 26,275 | | | | 257,495 | |
| | | | | | |
|
|
|
| | | | | | | | 14,820,128 | |
| | | | | | |
|
|
|
The accompanying notes are an integral part of these financial statements.
43
PMC DIVERSIFIED EQUITY FUND | Schedule of Investments |
August 31, 2022 (Continued)
| | | | | | | | |
| | |
| | | Shares
| | | Value
| |
Broadcasting (except Internet)—1.06% | | | | | | | | |
Comcast Corp.—Class A | | | 53,913 | | | $ | 1,951,112 | |
DISH Network Corp.—Class A(a)(c) | | | 33,424 | | | | 579,907 | |
Fox Corp.—Class A(c) | | | 42,477 | | | | 1,451,864 | |
Fox Corp.—Class B | | | 48,083 | | | | 1,520,385 | |
Grupo Televisa SAB—ADR | | | 1 | | | | 6 | |
Liberty Media Corp-Liberty SiriusXM—Class A(a)(c) | | | 8,491 | | | | 352,716 | |
Liberty Media Corp-Liberty SiriusXM—Class C(a) | | | 12,051 | | | | 498,429 | |
Nexstar Media Group, Inc.—Class A(c) | | | 3,535 | | | | 676,316 | |
Paramount Global—Class A(c) | | | 22,180 | | | | 585,996 | |
Paramount Global—Class B(c) | | | 36,247 | | | | 847,817 | |
ProSiebenSat.1 Media SE—ADR | | | 80,962 | | | | 151,399 | |
Sirius XM Holdings, Inc.(c) | | | 135,710 | | | | 826,474 | |
Warner Bros Discovery, Inc.(a) | | | 15,892 | | | | 210,410 | |
WideOpenWest, Inc.(a) | | | 10,933 | | | | 194,607 | |
| | | | | | |
|
|
|
| | | | | | | | 9,847,438 | |
| | | | | | |
|
|
|
Building Material and Garden Equipment and Supplies Dealers—0.83% | | | | | | | | |
Home Depot, Inc. | | | 13,016 | | | | 3,754,076 | |
Lowe’s Companies, Inc. | | | 13,903 | | | | 2,699,128 | |
Snap-on, Inc. | | | 5,897 | | | | 1,284,720 | |
| | | | | | |
|
|
|
| | | | | | | | 7,737,924 | |
| | | | | | |
|
|
|
Chemical Manufacturing—8.10% | | | | | | | | |
AbbVie, Inc. | | | 14,792 | | | | 1,988,932 | |
Air Liquide SA—ADR | | | 7,951 | | | | 199,332 | |
Albemarle Corp. | | | 478 | | | | 128,085 | |
Alkermes PLC(b) | | | 13,250 | | | | 313,628 | |
Amgen, Inc. | | | 3,101 | | | | 745,170 | |
Arcus Biosciences, Inc.(a) | | | 7,613 | | | | 183,321 | |
Arkema SA—ADR | | | 8,071 | | | | 683,775 | |
Asahi Kasei Corp.—ADR | | | 11,172 | | | | 162,664 | |
Astellas Pharma, Inc.—ADR | | | 77,997 | | | | 1,100,538 | |
AstraZeneca PLC—ADR | | | 50,280 | | | | 3,136,466 | |
Bayer AG—ADR | | | 123,923 | | | | 1,635,784 | |
Bicycle Therapeutics PLC—ADR(a) | | | 2,017 | | | | 53,350 | |
Biogen, Inc.(a) | | | 3,478 | | | | 679,532 | |
BioLine RX Ltd.—ADR(a) | | | 19,489 | | | | 29,623 | |
BioMarin Pharmaceutical, Inc.(a) | | | 2,351 | | | | 209,709 | |
Biondvax Pharmaceuticals Ltd.—ADR(a)(c) | | | 163,423 | | | | 179,765 | |
Bio-Techne Corp.(c) | | | 1,298 | | | | 430,689 | |
Bristol-Myers Squibb Co. | | | 35,269 | | | | 2,377,483 | |
Celanese Corp. | | | 2,499 | | | | 277,039 | |
Cellectis SA—ADR(a) | | | 15,899 | | | | 52,626 | |
CF Industries Holdings, Inc. | | | 8,862 | | | | 916,862 | |
Chemomab Therapeutics Ltd.—ADR(a) | | | 1,811 | | | | 5,994 | |
Chugai Pharmaceutical Co. Ltd.—ADR | | | 60,969 | | | | 786,500 | |
Clinuvel Pharmaceuticals Ltd.—ADR | | | 1,166 | | | | 15,974 | |
Corcept Therapeutics, Inc.(a)(c) | | | 7,399 | | | | 191,042 | |
CSL Ltd.—ADR | | | 12,264 | | | | 1,231,306 | |
Daiichi Sankyo Co. Ltd.—ADR | | | 44,545 | | | | 1,339,468 | |
Dow, Inc. | | | 18,155 | | | | 925,905 | |
Dr Reddy’s Laboratories Ltd.—ADR | | | 2,642 | | | | 138,150 | |
DuPont de Nemours, Inc. | | | 2,048 | | | | 113,951 | |
Editas Medicine, Inc.(a) | | | 3,930 | | | | 57,771 | |
The accompanying notes are an integral part of these financial statements.
44
PMC DIVERSIFIED EQUITY FUND | Schedule of Investments |
August 31, 2022 (Continued)
| | | | | | | | |
| | |
| | | Shares
| | | Value
| |
Eisai Co. Ltd.—ADR | | | 9,234 | | | $ | 376,932 | |
Eli Lilly & Co. | | | 8,427 | | | | 2,538,465 | |
Emergent BioSolutions, Inc.(a) | | | 3,477 | | | | 83,518 | |
Fate Therapeutics, Inc.(a) | | | 2,116 | | | | 55,312 | |
Gilead Sciences, Inc. | | | 27,602 | | | | 1,751,899 | |
GSK PLC—ADR(c) | | | 54,236 | | | | 1,761,585 | |
Halozyme Therapeutics, Inc.(a)(c) | | | 9,117 | | | | 371,335 | |
Harmony Biosciences Holdings, Inc.(a) | | | 5,843 | | | | 256,566 | |
Horizon Therapeutics PLC(a)(b) | | | 5,493 | | | | 325,241 | |
Huntsman Corp. | | | 15,839 | | | | 443,809 | |
Hypera SA—ADR | | | 48,329 | | | | 397,748 | |
Incitec Pivot Ltd.—ADR | | | 37,689 | | | | 100,064 | |
Indivior PLC—ADR(a) | | | 14,325 | | | | 240,087 | |
Innoviva, Inc.(a)(c) | | | 17,143 | | | | 225,602 | |
Inter Parfums, Inc. | | | 2,269 | | | | 178,162 | |
Ipsen SA—ADR | | | 20,384 | | | | 490,847 | |
Ironwood Pharmaceuticals, Inc.(a)(c) | | | 28,195 | | | | 303,378 | |
JSR Corp.—ADR | | | 323 | | | | 7,316 | |
Kazia Therapeutics Ltd.—ADR(a) | | | 26,411 | | | | 40,145 | |
Kose Corp.—ADR | | | 19,516 | | | | 369,438 | |
Linde PLC(b) | | | 3,037 | | | | 859,046 | |
Maravai LifeSciences Holdings, Inc.—Class A(a)(c) | | | 6,833 | | | | 142,605 | |
Merck & Co., Inc. | | | 41,076 | | | | 3,506,247 | |
Merck KGaA—ADR | | | 34,616 | | | | 1,191,137 | |
Moderna, Inc.(a) | | | 10,038 | | | | 1,327,726 | |
Mosaic Co.(c) | | | 13,670 | | | | 736,403 | |
Myriad Genetics, Inc.(a) | | | 6,464 | | | | 144,406 | |
Neurocrine Biosciences, Inc.(a)(c) | | | 5,297 | | | | 554,225 | |
Novartis AG—ADR | | | 88,987 | | | | 7,165,234 | |
Novo Nordisk A/S—ADR | | | 45,244 | | | | 4,800,389 | |
Novozymes A/S—ADR | | | 3,363 | | | | 192,498 | |
Nu Skin Enterprises, Inc.—Class A | | | 1,949 | | | | 79,792 | |
Olin Corp. | | | 7,026 | | | | 384,041 | |
Ono Pharmaceutical Co. Ltd.—ADR | | | 118,074 | | | | 929,242 | |
OPKO Health, Inc.(a)(c) | | | 50,152 | | | | 109,331 | |
Organon & Co. | | | 14,950 | | | | 426,524 | |
Otsuka Holdings Co. Ltd.—ADR | | | 45,063 | | | | 735,428 | |
Pfizer, Inc. | | | 101,293 | | | | 4,581,483 | |
Prestige Consumer Healthcare, Inc.(a) | | | 6,616 | | | | 334,637 | |
Procter & Gamble Co. | | | 16,438 | | | | 2,267,457 | |
QuidelOrtho Corp.(a) | | | 1,999 | | | | 158,441 | |
Regeneron Pharmaceuticals, Inc.(a) | | | 3,845 | | | | 2,234,176 | |
REGENXBIO, Inc.(a) | | | 10,142 | | | | 299,189 | |
Sanofi—ADR | | | 61,566 | | | | 2,526,053 | |
Santen Pharmaceutical Co. Ltd.—ADR | | | 19,039 | | | | 135,938 | |
Shin-Etsu Chemical Co. Ltd.—ADR | | | 66,206 | | | | 1,925,932 | |
Shionogi & Co Ltd.—ADR | | | 66,007 | | | | 800,665 | |
Sumitomo Chemical Co. Ltd.—ADR | | | 18,886 | | | | 370,354 | |
Supernus Pharmaceuticals, Inc.(a) | | | 10,658 | | | | 364,823 | |
Takeda Pharmaceutical Co. Ltd.—ADR | | | 88,094 | | | | 1,211,293 | |
Teva Pharmaceutical Industries Ltd.—ADR(a) | | | 56,810 | | | | 513,562 | |
Trinity Biotech PLC—ADR(a) | | | 98,067 | | | | 121,603 | |
Twist Bioscience Corp.(a) | | | 3,295 | | | | 132,195 | |
United Therapeutics Corp.(a) | | | 2,159 | | | | 489,273 | |
The accompanying notes are an integral part of these financial statements.
45
PMC DIVERSIFIED EQUITY FUND | Schedule of Investments |
August 31, 2022 (Continued)
| | | | | | | | |
| | |
| | | Shares
| | | Value
| |
Veracyte, Inc.(a)(c) | | | 12,742 | | | $ | 259,937 | |
Vertex Pharmaceuticals, Inc.(a) | | | 2,942 | | | | 828,938 | |
Viatris, Inc. | | | 37,588 | | | | 358,965 | |
Westlake Corp. | | | 9,231 | | | | 910,454 | |
XTL Biopharmaceuticals Ltd.—ADR(a) | | | 5,461 | | | | 7,809 | |
Yara International ASA—ADR | | | 33,630 | | | | 710,266 | |
| | | | | | |
|
|
|
| | | | | | | | 75,435,600 | |
| | | | | | |
|
|
|
Clothing and Clothing Accessories Stores—0.61% | | | | | | | | |
Abercrombie & Fitch Co.—Class A(a)(c) | | | 12,320 | | | | 177,285 | |
Academy Sports & Outdoors, Inc.(c) | | | 9,790 | | | | 421,753 | |
American Eagle Outfitters, Inc.(c) | | | 11,404 | | | | 128,409 | |
Bath & Body Works, Inc. | | | 19,881 | | | | 742,158 | |
Buckle, Inc.(c) | | | 8,625 | | | | 278,415 | |
Caleres, Inc. | | | 4,927 | | | | 125,737 | |
Designer Brands, Inc. | | | 5,811 | | | | 99,136 | |
Foot Locker, Inc.(c) | | | 7,403 | | | | 272,727 | |
Genesco, Inc.(a) | | | 5,209 | | | | 294,724 | |
H & M Hennes & Mauritz AB—ADR | | | 9,572 | | | | 19,527 | |
Pandora A/S—ADR | | | 35,064 | | | | 528,415 | |
Scholastic Corp.(c) | | | 6,720 | | | | 308,515 | |
Signet Jewelers Ltd.(b) | | | 3,655 | | | | 238,927 | |
TJX Cos., Inc. | | | 29,839 | | | | 1,860,462 | |
Zumiez, Inc.(a)(c) | | | 7,340 | | | | 190,546 | |
| | | | | | |
|
|
|
| | | | | | | | 5,686,736 | |
| | | | | | |
|
|
|
Computer and Electronic Product Manufacturing—13.07% | | | | | | | | |
ADTRAN Holdings, Inc. | | | 577 | | | | 13,409 | |
Advanced Micro Devices, Inc.(a) | | | 8,967 | | | | 761,029 | |
Advantest Corp.—ADR | | | 14,545 | | | | 831,189 | |
Agilent Technologies, Inc. | | | 3,582 | | | | 459,392 | |
Allegro MicroSystems, Inc.(a)(c) | | | 7,978 | | | | 186,047 | |
Alphabet, Inc.—Class A(a) | | | 62,909 | | | | 6,808,011 | |
Alphabet, Inc.—Class C(a) | | | 56,320 | | | | 6,147,327 | |
Amkor Technology, Inc. | | | 11,437 | | | | 230,227 | |
Amphenol Corp.—Class A | | | 17,790 | | | | 1,308,099 | |
Analog Devices, Inc. | | | 1,406 | | | | 213,051 | |
Apple, Inc. | | | 130,453 | | | | 20,509,821 | |
Arista Networks, Inc.(a) | | | 7,949 | | | | 952,926 | |
AUO Corp.—ADR | | | 33,995 | | | | 223,687 | |
Avanos Medical, Inc.(a) | | | 5,574 | | | | 137,288 | |
Avantor, Inc.(a)(c) | | | 7,224 | | | | 179,950 | |
Brainsway Ltd.—ADR(a) | | | 3,523 | | | | 14,955 | |
Broadcom, Inc. | | | 6,288 | | | | 3,138,403 | |
Bruker Corp. | | | 6,144 | | | | 344,064 | |
Calix, Inc.(a)(c) | | | 4,435 | | | | 261,000 | |
Canaan, Inc.—ADR(a)(c) | | | 234,007 | | | | 821,365 | |
Casio Computer Co. Ltd.—ADR | | | 1,072 | | | | 104,252 | |
ChipMOS Technologies, Inc.—ADR | | | 31,584 | | | | 731,801 | |
Ciena Corp.(a) | | | 8,156 | | | | 413,835 | |
Cirrus Logic, Inc.(a) | | | 7,184 | | | | 550,941 | |
Cisco Systems, Inc. | | | 73,019 | | | | 3,265,410 | |
Corsair Gaming, Inc.(a)(c) | | | 6,149 | | | | 94,633 | |
Danaher Corp. | | | 7,161 | | | | 1,932,826 | |
Dell Technologies, Inc.—Class C | | | 33,389 | | | | 1,278,465 | |
The accompanying notes are an integral part of these financial statements.
46
PMC DIVERSIFIED EQUITY FUND | Schedule of Investments |
August 31, 2022 (Continued)
| | | | | | | | |
| | |
| | | Shares
| | | Value
| |
Diodes, Inc.(a) | | | 5,158 | | | $ | 367,095 | |
Enphase Energy, Inc.(a) | | | 2,246 | | | | 643,344 | |
FormFactor, Inc.(a)(c) | | | 7,746 | | | | 226,803 | |
Fortinet, Inc.(a) | | | 20,858 | | | | 1,015,576 | |
Himax Technologies, Inc.—ADR(c) | | | 65,322 | | | | 406,956 | |
Hologic, Inc.(a) | | | 14,133 | | | | 954,825 | |
HP, Inc. | | | 58,770 | | | | 1,687,287 | |
Intel Corp. | | | 58,699 | | | | 1,873,672 | |
InterDigital, Inc. | | | 5,744 | | | | 288,119 | |
International Business Machines Corp. | | | 19,445 | | | | 2,497,710 | |
Jabil, Inc. | | | 12,796 | | | | 771,599 | |
JinkoSolar Holding Co. Ltd.—ADR(a) | | | 4,473 | | | | 272,272 | |
Juniper Networks, Inc.(c) | | | 64,206 | | | | 1,824,735 | |
Keysight Technologies, Inc.(a) | | | 13,890 | | | | 2,276,431 | |
Knowles Corp.(a)(c) | | | 14,481 | | | | 219,387 | |
Kyocera Corp.—ADR | | | 10,961 | | | | 611,295 | |
L3Harris Technologies, Inc. | | | 4,223 | | | | 963,646 | |
Lam Research Corp. | | | 3,020 | | | | 1,322,488 | |
Lasertec Corp.—ADR | | | 10,744 | | | | 299,543 | |
Lattice Semiconductor Corp.(a) | | | 6,376 | | | | 343,666 | |
LG Display Co. Ltd.—ADR | | | 1 | | | | 6 | |
Lumentum Holdings, Inc.(a)(c) | | | 3,401 | | | | 284,154 | |
MACOM Technology Solutions Holdings, Inc.(a)(c) | | | 2,752 | | | | 151,773 | |
MaxLinear, Inc.(a)(c) | | | 3,850 | | | | 138,331 | |
Medtronic PLC(b) | | | 10,140 | | | | 891,509 | |
Methode Electronics, Inc. | | | 5,181 | | | | 209,623 | |
Microchip Technology, Inc. | | | 12,954 | | | | 845,249 | |
Micron Technology, Inc. | | | 27,990 | | | | 1,582,275 | |
MKS Instruments, Inc. | | | 3,042 | | | | 303,014 | |
Monolithic Power Systems, Inc. | | | 1,439 | | | | 652,126 | |
Motorola Solutions, Inc. | | | 7,938 | | | | 1,932,189 | |
NetApp, Inc. | | | 17,697 | | | | 1,276,485 | |
Nidec Corp.—ADR | | | 9,481 | | | | 157,195 | |
Nitto Denko Corp.—ADR | | | 36,692 | | | | 1,125,711 | |
Northrop Grumman Corp. | | | 3,652 | | | | 1,745,619 | |
NVIDIA Corp. | | | 21,346 | | | | 3,221,965 | |
Olink Holding AB—ADR(a) | | | 8,608 | | | | 130,325 | |
ON Semiconductor Corp.(a) | | | 33,039 | | | | 2,272,092 | |
Onto Innovation, Inc.(a) | | | 5,170 | | | | 367,018 | |
OSI Systems, Inc.(a) | | | 3,811 | | | | 317,533 | |
Otis Worldwide Corp. | | | 2,954 | | | | 213,338 | |
PerkinElmer, Inc. | | | 2,851 | | | | 385,056 | |
Power Integrations, Inc.(c) | | | 4,461 | | | | 319,095 | |
Pure Storage, Inc.(a) | | | 10,693 | | | | 309,776 | |
Qorvo, Inc.(a) | | | 12,383 | | | | 1,111,746 | |
QUALCOMM, Inc. | | | 23,618 | | | | 3,123,953 | |
Rambus, Inc.(a) | | | 11,762 | | | | 303,342 | |
Renesas Electronics Corp.—ADR(a) | | | 6,599 | | | | 31,147 | |
Ricoh Co Ltd.—ADR(c) | | | 54,500 | | | | 445,265 | |
Rohm Co. Ltd.—ADR(c) | | | 17,305 | | | | 665,031 | |
Sanmina Corp.(a)(c) | | | 14,008 | | | | 679,668 | |
Seagate Technology Holdings PLC(b) | | | 14,055 | | | | 941,123 | |
Seer, Inc.(a) | | | 16,419 | | | | 165,832 | |
Seiko Epson Corp.—ADR(c) | | | 116,712 | | | | 916,189 | |
Semtech Corp.(a) | | | 4,102 | | | | 189,471 | |
The accompanying notes are an integral part of these financial statements.
47
PMC DIVERSIFIED EQUITY FUND | Schedule of Investments |
August 31, 2022 (Continued)
| | | | | | | | |
| | |
| | | Shares
| | | Value
| |
Sharp Corp.—ADR | | | 73,466 | | | $ | 128,198 | |
Silicon Laboratories, Inc.(a)(c) | | | 2,558 | | | | 320,594 | |
Silicon Motion Technology Corp.—ADR | | | 3,426 | | | | 264,179 | |
SiTime Corp.(a) | | | 732 | | | | 77,892 | |
Skyworks Solutions, Inc. | | | 9,107 | | | | 897,495 | |
Sony Group Corp.—ADR | | | 36,904 | | | | 2,928,333 | |
STMicroelectronics NV(b) | | | 85,898 | | | | 2,997,840 | |
Sumitomo Electric Industries Ltd.—ADR | | | 33,970 | | | | 388,617 | |
Super Micro Computer, Inc.(a) | | | 5,363 | | | | 349,024 | |
Synaptics, Inc.(a)(c) | | | 1,875 | | | | 216,769 | |
Sysmex Corp.—ADR | | | 17,115 | | | | 525,259 | |
Taiwan Semiconductor Manufacturing Co. Ltd.—ADR | | | 46,275 | | | | 3,857,021 | |
TDK Corp.—ADR(c) | | | 35,057 | | | | 1,229,449 | |
Teradata Corp.(a) | | | 5,547 | | | | 182,496 | |
Teradyne, Inc.(c) | | | 11,295 | | | | 956,009 | |
Texas Instruments, Inc. | | | 12,520 | | | | 2,068,429 | |
Thermo Fisher Scientific, Inc. | | | 3,605 | | | | 1,965,878 | |
Trimble, Inc.(a) | | | 9,148 | | | | 578,611 | |
United Microelectronics Corp.—ADR | | | 127,585 | | | | 845,889 | |
Varex Imaging Corp.(a) | | | 7,155 | | | | 150,899 | |
Vishay Intertechnology, Inc. | | | 15,240 | | | | 299,771 | |
voxeljet AG—ADR(a) | | | 1,393 | | | | 6,672 | |
VTech Holdings Ltd.—ADR | | | 36,503 | | | | 248,403 | |
Waters Corp.(a) | | | 726 | | | | 216,784 | |
Western Digital Corp.(a) | | | 27,099 | | | | 1,145,204 | |
Xperi Holding Corp. | | | 11,625 | | | | 184,954 | |
Zebra Technologies Corp.—Class A(a) | | | 1,794 | | | | 541,142 | |
| | | | | | |
|
|
|
| | | | | | | | 121,755,887 | |
| | | | | | |
|
|
|
Construction of Buildings—0.81% | | | | | | | | |
ACS Actividades de Construccion y Servicios SA—ADR | | | 125,030 | | | | 548,883 | |
Barratt Developments PLC—ADR | | | 18,359 | | | | 181,754 | |
DR Horton, Inc. | | | 20,174 | | | | 1,435,380 | |
Lennar Corp.—Class A(c) | | | 17,256 | | | | 1,336,477 | |
Lennar Corp.—Class B | | | 20,418 | | | | 1,259,382 | |
MDC Holdings, Inc. | | | 6,460 | | | | 200,777 | |
Mitie Group PLC—ADR | | | 55,799 | | | | 190,554 | |
NVR, Inc.(a) | | | 166 | | | | 687,250 | |
PulteGroup, Inc. | | | 30,114 | | | | 1,224,435 | |
Toll Brothers, Inc. | | | 4,615 | | | | 202,091 | |
Tri Pointe Homes, Inc.(a) | | | 13,361 | | | | 231,546 | |
Tutor Perini Corp.(a) | | | 4,962 | | | | 33,642 | |
| | | | | | |
|
|
|
| | | | | | | | 7,532,171 | |
| | | | | | |
|
|
|
Couriers and Messengers—0.35% | | | | | | | | |
Air Transport Services Group, Inc.(a) | | | 7,993 | | | | 240,829 | |
FedEx Corp. | | | 3,457 | | | | 728,770 | |
United Parcel Service, Inc.—Class B | | | 11,837 | | | | 2,302,416 | |
| | | | | | |
|
|
|
| | | | | | | | 3,272,015 | |
| | | | | | |
|
|
|
Credit Intermediation and Related Activities—3.35% | | | | | | | | |
ABN AMRO Bank NV—ADR | | | 66,207 | | | | 633,601 | |
Affirm Holdings, Inc.(a)(c) | | | 6,647 | | | | 155,739 | |
Ally Financial, Inc. | | | 11,910 | | | | 395,412 | |
American Express Co. | | | 7,194 | | | | 1,093,488 | |
Associated Banc-Corp(c) | | | 9,559 | | | | 191,562 | |
B&M European Value Retail SA—ADR | | | 472 | | | | 8,066 | |
The accompanying notes are an integral part of these financial statements.
48
PMC DIVERSIFIED EQUITY FUND | Schedule of Investments |
August 31, 2022 (Continued)
| | | | | | | | |
| | |
| | | Shares
| | | Value
| |
BAC Holding International Corp.(a)(e)(g) | | | 1,597,640 | | | $ | 15,976 | |
Banco Bilbao Vizcaya Argentaria SA—ADR | | | 214,715 | | | | 953,335 | |
Banco do Brasil SA—ADR | | | 36,152 | | | | 286,143 | |
Banco Macro SA—ADR | | | 47,245 | | | | 666,627 | |
Banco Santander Mexico SA Institucion de Banca Multiple Grupo Financiero Santand—ADR | | | 35,066 | | | | 194,266 | |
Bank Hapoalim BM—ADR(c) | | | 3,937 | | | | 208,858 | |
Bank Mandiri Persero Tbk PT—ADR | | | 90,634 | | | | 1,056,339 | |
Bank of China Ltd.—ADR | | | 152,904 | | | | 1,325,678 | |
Bank of East Asia Ltd.—ADR | | | 222,611 | | | | 272,698 | |
Bank of New York Mellon Corp. | | | 2,217 | | | | 92,072 | |
Bank OZK | | | 5,429 | | | | 220,037 | |
Bank Rakyat Indonesia Persero Tbk PT—ADR(c) | | | 58,364 | | | | 846,278 | |
Barclays PLC—ADR | | | 44,216 | | | | 344,443 | |
Citigroup, Inc. | | | 23,311 | | | | 1,137,810 | |
Commerzbank AG—ADR(a) | | | 19,153 | | | | 126,601 | |
Credit Acceptance Corp.(a)(c) | | | 228 | | | | 121,314 | |
Danske Bank A/S—ADR | | | 43,642 | | | | 288,037 | |
DBS Group Holdings Ltd.—ADR | | | 24,440 | | | | 2,274,143 | |
Discover Financial Services | | | 1,611 | | | | 161,889 | |
DNB Bank ASA—ADR(c) | | | 7,674 | | | | 145,806 | |
Encore Capital Group, Inc.(a)(c) | | | 5,874 | | | | 321,190 | |
Erste Group Bank AG—ADR | | | 18,509 | | | | 209,152 | |
Fifth Third Bancorp | | | 503 | | | | 17,177 | |
FinVolution Group—ADR | | | 67,030 | | | | 329,788 | |
Grupo Financiero Galicia SA—ADR(c) | | | 51,350 | | | | 416,449 | |
HSBC Holdings PLC—ADR | | | 35,260 | | | | 1,087,066 | |
ICICI Bank Ltd.—ADR | | | 100,926 | | | | 2,204,225 | |
JPMorgan Chase & Co. | | | 1,212 | | | | 137,841 | |
KeyCorp | | | 10,006 | | | | 177,006 | |
LendingClub Corp.(a) | | | 10,114 | | | | 132,190 | |
Malayan Banking Bhd—ADR | | | 100 | | | | 434 | |
Mr Cooper Group, Inc.(a) | | | 11,316 | | | | 478,667 | |
Nedbank Group Ltd.—ADR | | | 856 | | | | 10,452 | |
Nelnet, Inc.—Class A | | | 5,244 | | | | 441,755 | |
New York Community Bancorp, Inc.(c) | | | 29,289 | | | | 286,739 | |
OneMain Holdings, Inc.(c) | | | 8,618 | | | | 301,027 | |
PennyMac Financial Services, Inc. | | | 4,718 | | | | 250,620 | |
Popular, Inc.(b) | | | 5,796 | | | | 447,567 | |
Rocket Cos, Inc.—Class A(c) | | | 76,772 | | | | 606,499 | |
Sberbank of Russia PJSC—ADR(a)(e)(g) | | | 119,989 | | | | 0 | |
Smith & Wesson Brands, Inc.(c) | | | 9,326 | | | | 124,036 | |
Standard Bank Group Ltd.—ADR | | | 3,525 | | | | 31,337 | |
Standard Chartered PLC—ADR(c) | | | 66,192 | | | | 931,983 | |
Sumitomo Mitsui Trust Holdings, Inc.—ADR | | | 68,773 | | | | 215,947 | |
Svenska Handelsbanken AB—ADR | | | 69,097 | | | | 278,461 | |
Swedbank AB—ADR | | | 38,458 | | | | 496,108 | |
Synchrony Financial | | | 13,635 | | | | 446,546 | |
UBS Group AG(b) | | | 276,094 | | | | 4,376,090 | |
UniCredit SpA—ADR | | | 84,615 | | | | 412,921 | |
United Overseas Bank Ltd.—ADR | | | 22,800 | | | | 886,236 | |
Wells Fargo & Co. | | | 32,020 | | | | 1,399,594 | |
Zions Bancorp NA | | | 9,296 | | | | 511,559 | |
| | | | | | |
|
|
|
| | | | | | | | 31,182,880 | |
| | | | | | |
|
|
|
The accompanying notes are an integral part of these financial statements.
49
PMC DIVERSIFIED EQUITY FUND | Schedule of Investments |
August 31, 2022 (Continued)
| | | | | | | | |
| | |
| | | Shares
| | | Value
| |
Data Processing, Hosting and Related Services—0.46% | | | | | | | | |
Airbnb, Inc.(a) | | | 4,101 | | | $ | 463,905 | |
Automatic Data Processing, Inc. | | | 2,629 | | | | 642,554 | |
CSG Systems International, Inc.(c) | | | 10,613 | | | | 613,962 | |
FactSet Research Systems, Inc.(c) | | | 1,187 | | | | 514,375 | |
Fiserv, Inc.(a) | | | 14,206 | | | | 1,437,505 | |
Mercury Fintech Holding, Inc.—ADR(a) | | | 7,050 | | | | 6,765 | |
Sciplay Corp.—Class A(a) | | | 12,638 | | | | 154,057 | |
Sohu.com Ltd.—ADR(a) | | | 24,876 | | | | 443,290 | |
Trivago NV—ADR(a) | | | 29,631 | | | | 42,965 | |
| | | | | | |
|
|
|
| | | | | | | | 4,319,378 | |
| | | | | | |
|
|
|
Educational Services—0.07% | | | | | | | | |
Adtalem Global Education, Inc.(a)(c) | | | 4,975 | | | | 187,508 | |
ATA Creativity Global—ADR(a) | | | 1 | | | | 2 | |
China Online Education Group—ADR(a) | | | 857 | | | | 1,429 | |
Grand Canyon Education, Inc.(a) | | | 2,290 | | | | 186,360 | |
Laureate Education, Inc.—Class A | | | 17,334 | | | | 191,021 | |
Strategic Education, Inc.(c) | | | 1,551 | | | | 100,350 | |
Sunlands Technology Group—ADR | | | 954 | | | | 3,682 | |
TAL Education Group—ADR(a) | | | 1,374 | | | | 7,942 | |
| | | | | | |
|
|
|
| | | | | | | | 678,294 | |
| | | | | | |
|
|
|
Electrical Equipment, Appliance, and Component Manufacturing—1.11% | | | | | | | | |
ABB Ltd.—ADR | | | 22,278 | | | | 614,204 | |
Acuity Brands, Inc. | | | 2,071 | | | | 339,499 | |
Arcelik AS—ADR | | | 15,512 | | | | 296,047 | |
AZZ, Inc. | | | 4,363 | | | | 185,907 | |
BYD Co. Ltd.—ADR | | | 3,883 | | | | 239,931 | |
Omron Corp.—ADR | | | 12,425 | | | | 655,916 | |
Hitachi Ltd.—ADR | | | 25,786 | | | | 2,568,801 | |
Mitsubishi Electric Corp.—ADR(c) | | | 23,270 | | | | 469,356 | |
Murata Manufacturing Co. Ltd.—ADR | | | 126,843 | | | | 1,706,039 | |
Panasonic Holdings Corp.—ADR | | | 112,812 | | | | 917,161 | |
Plug Power, Inc.(a)(c) | | | 1,887 | | | | 52,911 | |
Resideo Technologies, Inc.(a)(c) | | | 5,449 | | | | 113,448 | |
Schneider Electric SE—ADR | | | 57,669 | | | | 1,369,062 | |
Taiyo Yuden Co Ltd.—ADR | | | 1,683 | | | | 215,424 | |
Viomi Technology Co. Ltd.—ADR(a) | | | 58,963 | | | | 76,652 | |
Whirlpool Corp.(c) | | | 1,828 | | | | 286,265 | |
Yaskawa Electric Corp.—ADR | | | 3,765 | | | | 246,608 | |
| | | | | | |
|
|
|
| | | | | | | | 10,353,231 | |
| | | | | | |
|
|
|
Electronics and Appliance Stores—0.11% | | | | | | | | |
Best Buy Co., Inc. | | | 9,779 | | | | 691,277 | |
Sega Sammy Holdings, Inc.—ADR | | | 95,010 | | | | 350,587 | |
| | | | | | |
|
|
|
| | | | | | | | 1,041,864 | |
| | | | | | |
|
|
|
Fabricated Metal Product Manufacturing—0.51% | | | | | | | | |
Assa Abloy AB—ADR | | | 90,080 | | | | 907,106 | |
Atkore, Inc.(a)(c) | | | 4,845 | | | | 408,966 | |
Emerson Electric Co. | | | 14,859 | | | | 1,214,575 | |
Griffon Corp. | | | 2,149 | | | | 67,371 | |
Mueller Industries, Inc.(c) | | | 5,151 | | | | 325,389 | |
Nucor Corp. | | | 10,660 | | | | 1,417,141 | |
The accompanying notes are an integral part of these financial statements.
50
PMC DIVERSIFIED EQUITY FUND | Schedule of Investments |
August 31, 2022 (Continued)
| | | | | | | | |
| | |
| | | Shares
| | | Value
| |
Valmont Industries, Inc. | | | 669 | | | $ | 185,193 | |
Vista Outdoor, Inc.(a)(c) | | | 8,279 | | | | 232,805 | |
| | | | | | |
|
|
|
| | | | | | | | 4,758,546 | |
| | | | | | |
|
|
|
Food and Beverage Stores—0.99% | | | | | | | | |
Albertsons Cos, Inc. | | | 40,425 | | | | 1,112,092 | |
Carrefour SA—ADR | | | 232,864 | | | | 789,409 | |
J Sainsbury PLC—ADR | | | 49,766 | | | | 478,251 | |
Jeronimo Martins SGPS SA—ADR(c) | | | 11,462 | | | | 507,194 | |
Koninklijke Ahold Delhaize NV—ADR | | | 70,188 | | | | 1,935,785 | |
Kroger Co.(c) | | | 30,936 | | | | 1,483,071 | |
Shoprite Holdings Ltd.—ADR | | | 33,762 | | | | 458,488 | |
Sprouts Farmers Market, Inc.(a)(c) | | | 8,873 | | | | 256,430 | |
Tesco PLC—ADR | | | 179,229 | | | | 1,544,057 | |
Weis Markets, Inc. | | | 8,429 | | | | 655,018 | |
| | | | | | |
|
|
|
| | | | | | | | 9,219,795 | |
| | | | | | |
|
|
|
Food Manufacturing—2.19% | | | | | | | | |
Ajinomoto Co., Inc.—ADR | | | 91,978 | | | | 2,537,673 | |
Archer-Daniels-Midland Co. | | | 29,689 | | | | 2,609,366 | |
Bunge Ltd.—ADR(b) | | | 7,146 | | | | 708,669 | |
Campbell Soup Co. | | | 11,871 | | | | 598,061 | |
Conagra Foods, Inc. | | | 9,219 | | | | 316,949 | |
General Mills, Inc. | | | 19,257 | | | | 1,478,938 | |
HelloFresh SE—ADR(a) | | | 1,416 | | | | 8,397 | |
Hershey Co. | | | 3,798 | | | | 853,296 | |
Industrias Bachoco SAB de CV—ADR | | | 655 | | | | 31,001 | |
Ingredion, Inc. | | | 5,081 | | | | 442,403 | |
JBS SA—ADR | | | 13,666 | | | | 156,612 | |
JM Smucker Co. | | | 5,979 | | | | 837,000 | |
Kellogg Co.(c) | | | 5,687 | | | | 413,672 | |
Marfrig Global Foods SA—ADR | | | 42,523 | | | | 114,812 | |
Medifast, Inc. | | | 11 | | | | 1,380 | |
Mondelez International, Inc.—Class A | | | 9,040 | | | | 559,214 | |
Nestle SA—ADR | | | 45,137 | | | | 5,283,737 | |
Post Holdings, Inc.(a) | | | 4,830 | | | | 428,711 | |
Tate & Lyle PLC—ADR | | | 5,886 | | | | 210,984 | |
Tyson Foods, Inc.—Class A | | | 37,431 | | | | 2,821,549 | |
| | | | | | |
|
|
|
| | | | | | | | 20,412,424 | |
| | | | | | |
|
|
|
Food Services and Drinking Places—0.46% | | | | | | | | |
Chipotle Mexican Grill, Inc.(a) | | | 578 | | | | 922,950 | |
Cintas Corp. | | | 1,275 | | | | 518,721 | |
Darden Restaurants, Inc.(c) | | | 6,834 | | | | 845,434 | |
Dave & Buster’s Entertainment, Inc.(a) | | | 4,227 | | | | 174,744 | |
McDonald’s Corp. | | | 3,470 | | | | 875,412 | |
Texas Roadhouse, Inc. | | | 2,264 | | | | 200,953 | |
Yelp, Inc.(a) | | | 6,008 | | | | 205,293 | |
Yum! Brands, Inc. | | | 5,003 | | | | 556,534 | |
| | | | | | |
|
|
|
| | | | | | | | 4,300,041 | |
| | | | | | |
|
|
|
Funds, Trusts, and Other Financial Vehicles—0.99% | | | | | | | | |
Coca-Cola Bottlers Japan Holdings, Inc.—ADR | | | 626 | | | | 3,208 | |
Daiwa Securities Group, Inc.—ADR | | | 83,530 | | | | 356,673 | |
Dentsu Group, Inc.—ADR(c) | | | 3,278 | | | | 108,240 | |
The accompanying notes are an integral part of these financial statements.
51
PMC DIVERSIFIED EQUITY FUND | Schedule of Investments |
August 31, 2022 (Continued)
| | | | | | | | |
| | |
| | | Shares
| | | Value
| |
FUJIFILM Holdings Corp.—ADR | | | 31,721 | | | $ | 1,611,109 | |
Garmin Ltd.(b) | | | 9,606 | | | | 850,035 | |
Lonza Group AG—ADR | | | 17,750 | | | | 944,478 | |
Mitsubishi UFJ Financial Group, Inc.—ADR | | | 193,572 | | | | 996,896 | |
Mizuho Financial Group, Inc.—ADR | | | 449,499 | | | | 1,029,353 | |
Nitori Holdings Co. Ltd.—ADR | | | 11,259 | | | | 107,411 | |
Nomura Holdings, Inc.—ADR | | | 45,550 | | | | 165,347 | |
Seven & i Holdings Co. Ltd.—ADR | | | 111,701 | | | | 2,217,264 | |
Straumann Holding AG—ADR | | | 32,875 | | | | 361,296 | |
Woolworths Holdings Ltd.(b) | | | 156,203 | | | | 521,718 | |
| | | | | | |
|
|
|
| | | | | | | | 9,273,028 | |
| | | | | | |
|
|
|
Furniture and Home Furnishings Stores—0.08% | | | | | | | | |
Ryohin Keikaku Co. Ltd.—ADR | | | 27,819 | | | | 256,213 | |
Williams-Sonoma, Inc.(c) | | | 3,107 | | | | 462,166 | |
| | | | | | |
|
|
|
| | | | | | | | 718,379 | |
| | | | | | |
|
|
|
Furniture and Related Product Manufacturing—0.00% | | | | | | | | |
Natuzzi SpA—ADR(a) | | | 3,961 | | | | 33,748 | |
| | | | | | |
|
|
|
Gasoline Stations—0.31% | | | | | | | | |
Cango, Inc.—ADR(c) | | | 57,752 | | | | 139,760 | |
Chevron Corp. | | | 15,904 | | | | 2,513,786 | |
Magnolia Oil & Gas Corp.—Class A | | | 9,468 | | | | 226,001 | |
| | | | | | |
|
|
|
| | | | | | | | 2,879,547 | |
| | | | | | |
|
|
|
General Merchandise Stores—1.16% | | | | | | | | |
BJ’s Wholesale Club Holdings, Inc.(a) | | | 4,348 | | | | 323,883 | |
Costco Wholesale Corp. | | | 4,933 | | | | 2,575,518 | |
Dillard’s, Inc.—Class A(c) | | | 953 | | | | 282,317 | |
Dollar General Corp. | | | 7,668 | | | | 1,820,537 | |
Dollar Tree, Inc.(a) | | | 7,407 | | | | 1,004,982 | |
Dufry AG—ADR(a) | | | 26,998 | | | | 99,434 | |
Kohl’s Corp. | | | 8,263 | | | | 234,834 | |
Macy’s, Inc.(c) | | | 22,553 | | | | 390,618 | |
Marks & Spencer Group PLC—ADR(a) | | | 174,295 | | | | 500,227 | |
Pan Pacific International Holdings Corp.—ADR | | | 29,781 | | | | 533,676 | |
PriceSmart, Inc. | | | 2,098 | | | | 132,740 | |
Target Corp. | | | 9,561 | | | | 1,533,011 | |
Walmart, Inc. | | | 10,112 | | | | 1,340,345 | |
| | | | | | |
|
|
|
| | | | | | | | 10,772,122 | |
| | | | | | |
|
|
|
Health and Personal Care Stores—0.64% | | | | | | | | |
Aspen Pharmacare Holdings Ltd.—ADR | | | 9,350 | | | | 79,382 | |
CVS Health Corp. | | | 31,851 | | | | 3,126,175 | |
Forward Pharma A/S—ADR(a) | | | 1,451 | | | | 5,398 | |
Ulta Beauty, Inc.(a) | | | 5,188 | | | | 2,178,285 | |
Walgreens Boots Alliance, Inc. | | | 15,879 | | | | 556,718 | |
| | | | | | |
|
|
|
| | | | | | | | 5,945,958 | |
| | | | | | |
|
|
|
Heavy and Civil Engineering Construction—0.10% | | | | | | | | |
Atlantia SpA—ADR | | | 22,508 | | | | 257,041 | |
Fluor Corp.(a)(c) | | | 7,331 | | | | 193,832 | |
Granite Construction, Inc. | | | 148 | | | | 4,437 | |
Primoris Services Corp. | | | 3,663 | | | | 74,249 | |
The accompanying notes are an integral part of these financial statements.
52
PMC DIVERSIFIED EQUITY FUND | Schedule of Investments |
August 31, 2022 (Continued)
| | | | | | | | |
| | |
| | | Shares
| | | Value
| |
Skanska AB—ADR | | | 27,318 | | | $ | 402,940 | |
| | | | | | |
|
|
|
| | | | | | | | 932,499 | |
| | | | | | |
|
|
|
Hospitals—0.19% | | | | | | | | |
HCA Healthcare, Inc. | | | 7,245 | | | | 1,433,568 | |
Universal Health Services, Inc.—Class B(c) | | | 3,157 | | | | 308,881 | |
| | | | | | |
|
|
|
| | | | | | | | 1,742,449 | |
| | | | | | |
|
|
|
Insurance Carriers and Related Activities—7.99% | | | | | | | | |
Admiral Group PLC—ADR(c) | | | 8,912 | | | | 224,404 | |
Aegon NV(b) | | | 697,786 | | | | 3,133,059 | |
Aflac, Inc.(c) | | | 25,646 | | | | 1,523,885 | |
AIA Group Ltd.—ADR | | | 48,329 | | | | 1,849,580 | |
Allstate Corp. | | | 5,278 | | | | 635,999 | |
American Equity Invesment Life Holding Co. | | | 5,392 | | | | 204,896 | |
American Financial Group, Inc. | | | 4,114 | | | | 525,276 | |
American International Group, Inc. | | | 36,662 | | | | 1,897,259 | |
Arch Capital Group Ltd.(a)(b) | | | 16,045 | | | | 733,577 | |
Assicurazioni Generali SpA—ADR(c) | | | 3,970 | | | | 29,180 | |
Assurant, Inc. | | | 5,207 | | | | 825,257 | |
Assured Guaranty Ltd.(b) | | | 5,356 | | | | 273,531 | |
Aviva PLC—ADR | | | 90,468 | | | | 871,207 | |
AXA SA—ADR | | | 285,791 | | | | 6,756,099 | |
Axis Capital Holdings Ltd.(b) | | | 9,268 | | | | 492,594 | |
Berkshire Hathaway, Inc.—Class A(a) | | | 13 | | | | 5,477,004 | |
Berkshire Hathaway, Inc.—Class B(a) | | | 27,038 | | | | 7,592,269 | |
Centene Corp.(a) | | | 14,388 | | | | 1,291,179 | |
Chubb Ltd.(b) | | | 7,853 | | | | 1,484,610 | |
Cigna Corp. | | | 5,665 | | | | 1,605,744 | |
CNO Financial Group, Inc. | | | 9,156 | | | | 168,562 | |
Elevance Health, Inc. | | | 5,749 | | | | 2,788,897 | |
Employers Holdings, Inc. | | | 2,294 | | | | 89,833 | |
Equitable Holdings, Inc. | | | 2,143 | | | | 63,754 | |
Everest Re Group Ltd.(b) | | | 5,971 | | | | 1,606,498 | |
Fidelity National Financial, Inc. | | | 22,127 | | | | 865,166 | |
First American Financial Corp. | | | 7,683 | | | | 411,041 | |
Genworth Financial, Inc.—Class A(a) | | | 47,494 | | | | 200,425 | |
Gjensidige Forsikring ASA—ADR | | | 24,174 | | | | 480,434 | |
Hanover Insurance Group, Inc. | | | 4,334 | | | | 560,776 | |
Hartford Financial Services Group, Inc. | | | 23,019 | | | | 1,480,352 | |
Horace Mann Educators Corp. | | | 448 | | | | 16,025 | |
Humana, Inc. | | | 2,182 | | | | 1,051,244 | |
Lincoln National Corp. | | | 5,971 | | | | 275,024 | |
Loews Corp. | | | 11,323 | | | | 626,275 | |
Markel Corp.(a) | | | 225 | | | | 268,675 | |
Marsh & McLennan Companies, Inc. | | | 6,579 | | | | 1,061,653 | |
MGIC Investment Corp. | | | 21,692 | | | | 309,979 | |
MS&AD Insurance Group Holdings, Inc.—ADR | | | 95,321 | | | | 1,419,330 | |
Muenchener Rueckversicherungs-Gesellschaft AG—ADR | | | 6,511 | | | | 155,613 | |
National Western Life Group, Inc.—Class A | | | 382 | | | | 72,698 | |
NN Group NV—ADR | | | 151,572 | | | | 3,098,131 | |
Old Republic International Corp. | | | 23,260 | | | | 507,998 | |
Oscar Health, Inc.(a) | | | 15,260 | | | | 101,174 | |
Principal Financial Group, Inc.(c) | | | 10,834 | | | | 809,950 | |
ProAssurance Corp. | | | 9,124 | | | | 195,162 | |
The accompanying notes are an integral part of these financial statements.
53
PMC DIVERSIFIED EQUITY FUND | Schedule of Investments |
August 31, 2022 (Continued)
| | | | | | | | |
| | |
| | | Shares
| | | Value
| |
Prudential Financial, Inc. | | | 10,224 | | | $ | 978,948 | |
QBE Insurance Group Ltd.—ADR | | | 105,537 | | | | 868,570 | |
Radian Group, Inc. | | | 11,765 | | | | 248,359 | |
Safety Insurance Group, Inc. | | | 2,502 | | | | 225,305 | |
Sampo OYJ—ADR | | | 45,768 | | | | 1,031,611 | |
Selective Insurance Group, Inc. | | | 6,706 | | | | 532,591 | |
Suncorp Group Ltd.—ADR | | | 45,779 | | | | 329,151 | |
T&D Holdings, Inc.—ADR | | | 97,227 | | | | 510,442 | |
Tokio Marine Holdings, Inc.—ADR | | | 48,463 | | | | 2,682,912 | |
Travelers Companies, Inc. | | | 7,949 | | | | 1,284,876 | |
United Fire Group, Inc. | | | 1,942 | | | | 57,153 | |
UnitedHealth Group, Inc. | | | 9,985 | | | | 5,185,510 | |
Unum Group | | | 10,622 | | | | 402,043 | |
Voya Financial, Inc. | | | 4,039 | | | | 248,520 | |
W.R. Berkley Corp. | | | 13,647 | | | | 884,326 | |
Willis Towers Watson PLC(b) | | | 4,363 | | | | 902,399 | |
Zurich Insurance Group AG—ADR | | | 44,652 | | | | 1,978,084 | |
| | | | | | |
|
|
|
| | | | | | | | 74,462,078 | |
| | | | | | |
|
|
|
Leather and Allied Product Manufacturing—0.12% | | | | | | | | |
NIKE, Inc.—Class B | | | 1,786 | | | | 190,120 | |
Skechers U.S.A., Inc.—Class A(a) | | | 5,952 | | | | 224,986 | |
Steven Madden Ltd.(c) | | | 12,217 | | | | 355,636 | |
Tapestry, Inc. | | | 10,833 | | | | 376,230 | |
| | | | | | |
|
|
|
| | | | | | | | 1,146,972 | |
| | | | | | |
|
|
|
Machinery Manufacturing—2.46% | | | | | | | | |
AGCO Corp. | | | 1,173 | | | | 127,517 | |
Applied Materials, Inc. | | | 20,179 | | | | 1,898,239 | |
ASML Holding NV(b) | | | 5,210 | | | | 2,552,586 | |
Azenta, Inc.(c) | | | 4,943 | | | | 260,546 | |
Canon, Inc.—ADR | | | 127,008 | | | | 3,032,951 | |
Carrier Global Corp. | | | 12,205 | | | | 477,460 | |
Caterpillar, Inc. | | | 2,278 | | | | 420,769 | |
Cummins, Inc. | | | 1,027 | | | | 221,185 | |
Daikin Industries Ltd.—ADR | | | 19,329 | | | | 337,871 | |
Deere & Co. | | | 1,449 | | | | 529,247 | |
Disco Corp.—ADR | | | 1,240 | | | | 60,698 | |
Dover Corp. | | | 9,848 | | | | 1,230,606 | |
Fabrinet(a)(b) | | | 6,501 | | | | 668,563 | |
General Electric Co. | | | 3,368 | | | | 247,346 | |
Hexagon AB—ADR | | | 4,696 | | | | 47,805 | |
Hoya Corp.—ADR | | | 8,513 | | | | 868,837 | |
Husqvarna AB—ADR(c) | | | 37,162 | | | | 503,545 | |
KLA Corp. | | | 4,890 | | | | 1,682,796 | |
Komatsu Ltd.—ADR | | | 26,266 | | | | 546,596 | |
Konica Minolta, Inc.—ADR | | | 23,286 | | | | 161,023 | |
Makita Corp.—ADR | | | 18,509 | | | | 433,666 | |
Mettler-Toledo International, Inc.(a) | | | 336 | | | | 407,387 | |
Nikon Corp.—ADR | | | 36,660 | | | | 413,891 | |
NOW, Inc.(a) | | | 9,903 | | | | 120,024 | |
NSK Ltd.—ADR | | | 5,895 | | | | 63,548 | |
Olympus Corp.—ADR | | | 59,194 | | | | 1,301,676 | |
Rheinmetall AG—ADR | | | 20,465 | | | | 648,331 | |
The accompanying notes are an integral part of these financial statements.
54
PMC DIVERSIFIED EQUITY FUND | Schedule of Investments |
August 31, 2022 (Continued)
| | | | | | | | |
| | |
| | | Shares
| | | Value
| |
SMC Corp.—ADR | | | 63,287 | | | $ | 1,506,863 | |
Tokyo Electron Ltd.—ADR | | | 27,698 | | | | 2,175,955 | |
| | | | | | |
|
|
|
| | | | | | | | 22,947,527 | |
| | | | | | |
|
|
|
Management of Companies and Enterprises—2.72% | | | | | | | | |
Abbott Laboratories | | | 18,884 | | | | 1,938,443 | |
Aeon Co. Ltd.—ADR(c) | | | 7,950 | | | | 155,741 | |
Alfa Laval AB—ADR | | | 35,928 | | | | 958,379 | |
America Movil SAB de CV—Class A—ADR | | | 3,135 | | | | 53,828 | |
America Movil SAB de CV—Class L—ADR | | | 58,297 | | | | 991,049 | |
ASMPT Ltd.—ADR | | | 25,390 | | | | 587,779 | |
BNP Paribas SA—ADR | | | 99,586 | | | | 2,312,387 | |
Capital One Financial Corp. | | | 8,869 | | | | 938,518 | |
Capri Holdings Ltd.(a)(b) | | | 5,142 | | | | 242,600 | |
Carnival Corp.(a)(b) | | | 2,289 | | | | 21,654 | |
Cie Financiere Richemont SA—ADR | | | 77,023 | | | | 858,806 | |
Citizens Financial Group, Inc. | | | 1,487 | | | | 54,543 | |
Cushman & Wakefield PLC(a)(b) | | | 21,599 | | | | 323,121 | |
Direct Line Insurance Group PLC—ADR | | | 18,133 | | | | 174,621 | |
Four Seasons Education Cayman, Inc.—ADR(a) | | | 289 | | | | 4,263 | |
Grupo Aeroportuario del Sureste SAB de CV—ADR | | | 2,008 | | | | 424,632 | |
Hawaiian Electric Industries, Inc. | | | 3,194 | | | | 124,949 | |
Henderson Land Development Co. Ltd.—ADR | | | 38,824 | | | | 132,778 | |
JGC Holdings Corp.—ADR | | | 18,384 | | | | 501,056 | |
Jupai Holdings Ltd.—ADR(a) | | | 33,900 | | | | 1,695 | |
K+S AG—ADR | | | 27,180 | | | | 305,231 | |
KB Financial Group, Inc.—ADR | | | 1 | | | | 37 | |
KE Holdings, Inc.—ADR(a)(c) | | | 14,603 | | | | 263,438 | |
KOC Holding AS—ADR | | | 13,703 | | | | 173,501 | |
Koninklijke Philips NV(b) | | | 6,945 | | | | 115,148 | |
Kuehne + Nagel International AG—ADR | | | 11,087 | | | | 510,445 | |
LightInTheBox Holding Co. Ltd.—ADR(a) | | | 4,267 | | | | 4,224 | |
LVMH Moet Hennessy Louis Vuitton SE—ADR | | | 21,123 | | | | 2,734,585 | |
LyondellBasell Industries NV—Class A(b) | | | 11,358 | | | | 942,714 | |
PRA Group, Inc.(a)(c) | | | 5,100 | | | | 188,394 | |
Purple Biotech Ltd.—ADR(a) | | | 4,003 | | | | 9,447 | |
Puxin Ltd.—ADR(a)(g) | | | 387 | | | | 31 | |
QIWI PLC—ADR(e) | | | 29,317 | | | | 166,227 | |
Recruit Holdings Co. Ltd.—ADR | | | 138,169 | | | | 874,610 | |
ReneSola Ltd.—ADR(a) | | | 1 | | | | 6 | |
Shinhan Financial Group Co. Ltd.—ADR | | | 7,927 | | | | 211,730 | |
Sonova Holding AG—ADR | | | 17,473 | | | | 919,953 | |
Telefonica SA—ADR | | | 348,260 | | | | 1,420,901 | |
Thales SA—ADR | | | 2,034 | | | | 48,961 | |
thyssenkrupp AG—ADR(a) | | | 23,779 | | | | 133,400 | |
Vinci SA—ADR | | | 76,715 | | | | 1,766,746 | |
Vivendi SE—ADR | | | 301,514 | | | | 2,722,671 | |
Wilmar International Ltd.—ADR | | | 14,504 | | | | 419,528 | |
Woori Financial Group, Inc.—ADR | | | 19,747 | | | | 527,245 | |
Xunlei Ltd.—ADR(a) | | | 31,268 | | | | 50,341 | |
| | | | | | |
|
|
|
| | | | | | | | 25,310,356 | |
| | | | | | |
|
|
|
The accompanying notes are an integral part of these financial statements.
55
PMC DIVERSIFIED EQUITY FUND | Schedule of Investments |
August 31, 2022 (Continued)
| | | | | | | | |
| | |
| | | Shares
| | | Value
| |
Merchant Wholesalers, Durable Goods—2.23% | | | | | | | | |
Arrow Electronics, Inc.(a) | | | 5,634 | | | $ | 590,500 | |
Avnet, Inc.(c) | | | 10,901 | | | | 478,445 | |
Cie de Saint-Gobain—ADR | | | 161,672 | | | | 1,296,609 | |
Coloplast A/S—ADR(c) | | | 60,174 | | | | 690,196 | |
Cricut, Inc.(a)(c) | | | 7,528 | | | | 46,975 | |
Genuine Parts Co. | | | 7,400 | | | | 1,154,474 | |
Glencore PLC—ADR | | | 79,877 | | | | 871,458 | |
Global Industrial Co. | | | 2,311 | | | | 69,515 | |
GMS, Inc.(a) | | | 6,168 | | | | 297,297 | |
GoPro, Inc.(a) | | | 26,002 | | | | 158,352 | |
Henry Schein, Inc.(a) | | | 11,902 | | | | 873,726 | |
ITOCHU Corp.—ADR | | | 50,769 | | | | 2,786,710 | |
Johnson Controls International PLC(b) | | | 8,345 | | | | 451,798 | |
LKQ Corp. | | | 37,702 | | | | 2,006,500 | |
Mitsui & Co. Ltd.—ADR | | | 4,783 | | | | 2,228,304 | |
ODP Corp.(a) | | | 2,221 | | | | 79,401 | |
Owens & Minor, Inc.(c) | | | 3,967 | | | | 117,066 | |
Pool Corp. | | | 1,242 | | | | 421,274 | |
Prysmian SpA—ADR | | | 48,434 | | | | 740,072 | |
Reliance Steel & Aluminum Co. | | | 5,694 | | | | 1,070,358 | |
Rexel SA—ADR | | | 34,073 | | | | 540,398 | |
Rush Enterprises, Inc.—Class A | | | 10,785 | | | | 507,542 | |
Rush Enterprises, Inc.—Class B | | | 1,868 | | | | 94,596 | |
ScanSource, Inc.(a) | | | 2,394 | | | | 69,354 | |
Schnitzer Steel Industries, Inc.—Class A | | | 4,453 | | | | 147,127 | |
Sims Ltd.—ADR | | | 45,505 | | | | 482,353 | |
Smiths Group PLC—ADR | | | 36,367 | | | | 629,149 | |
TE Connectivity Ltd.(b) | | | 10,131 | | | | 1,278,633 | |
Travis Perkins PLC—ADR | | | 663 | | | | 6,544 | |
Unicharm Corp.—ADR | | | 25,076 | | | | 174,027 | |
Volkswagen AG—ADR | | | 4,991 | | | | 92,383 | |
WESCO International, Inc.(a) | | | 2,677 | | | | 352,507 | |
| | | | | | |
|
|
|
| | | | | | | | 20,803,643 | |
| | | | | | |
|
|
|
Merchant Wholesalers, Nondurable Goods—1.70% | | | | | | | | |
AmerisourceBergen Corp. | | | 2,141 | | | | 313,785 | |
Atea Pharmaceuticals, Inc.(a) | | | 16,807 | | | | 126,053 | |
Bunzl PLC—ADR | | | 4,532 | | | | 150,281 | |
Cardinal Health, Inc. | | | 2,411 | | | | 170,506 | |
CSPC Pharmaceutical Group Ltd.—ADR | | | 70,782 | | | | 284,721 | |
ENN Energy Holdings Ltd.—ADR | | | 5,975 | | | | 345,176 | |
Gazprom Neft PJSC—ADR(e)(g) | | | 6,793 | | | | 0 | |
Genfit—ADR(a)(c) | | | 10,493 | | | | 45,225 | |
Imperial Brands PLC—ADR | | | 62,564 | | | | 1,395,178 | |
Industria de Diseno Textil SA—ADR | | | 2,348 | | | | 25,218 | |
Koppers Holdings, Inc.(c) | | | 326 | | | | 7,443 | |
Kunlun Energy Co. Ltd.—ADR | | | 17,341 | | | | 151,387 | |
LUKOIL PJSC—ADR(e) | | | 10,626 | | | | 0 | |
Marubeni Corp.—ADR | | | 14,494 | | | | 1,505,927 | |
McKesson Corp. | | | 2,602 | | | | 954,934 | |
Orkla ASA—ADR | | | 145,853 | | | | 1,225,165 | |
Reckitt Benckiser Group PLC—ADR | | | 4,511 | | | | 70,507 | |
Roche Holding AG—ADR | | | 136,800 | | | | 5,532,191 | |
The accompanying notes are an integral part of these financial statements.
56
PMC DIVERSIFIED EQUITY FUND | Schedule of Investments |
August 31, 2022 (Continued)
| | | | | | | | |
| | |
| | | Shares
| | | Value
| |
Sinopharm Group Co. Ltd.—ADR(c) | | | 41,164 | | | $ | 455,685 | |
Suntory Beverage & Food Ltd.—ADR | | | 52,786 | | | | 961,233 | |
Sysco Corp. | | | 3,786 | | | | 311,285 | |
UCB SA—ADR | | | 20,575 | | | | 721,977 | |
United Natural Foods, Inc.(a) | | | 6,087 | | | | 268,315 | |
Univar Solutions, Inc.(a) | | | 15,901 | | | | 401,023 | |
Universal Corp. | | | 4,894 | | | | 249,790 | |
Vibra Energia SA—ADR | | | 1 | | | | 7 | |
World Fuel Services Corp. | | | 5,808 | | | | 149,846 | |
| | | | | | |
|
|
|
| | | | | | | | 15,822,858 | |
| | | | | | |
|
|
|
Mining (except Oil and Gas)—0.56% | | | | | | | | |
Alpha Metallurgical Resources, Inc. | | | 837 | | | | 131,535 | |
Anglo American Platinum Ltd.—ADR | | | 7,102 | | | | 83,662 | |
Anglo American PLC—ADR | | | 130,293 | | | | 2,099,020 | |
Arch Resources, Inc.(c) | | | 1,869 | | | | 272,089 | |
Cia de Minas Buenaventura SAA—ADR | | | 1 | | | | 5 | |
Freeport-McMoRan, Inc. | | | 21,701 | | | | 642,350 | |
Harmony Gold Mining Co. Ltd.—ADR | | | 28,546 | | | | 74,505 | |
Kumba Iron Ore Ltd.—ADR | | | 1 | | | | 8 | |
Lynas Rare Earths Ltd.—ADR(a)(c) | | | 97,718 | | | | 591,194 | |
Newmont Corp. | | | 4,575 | | | | 189,222 | |
Peabody Energy Corp.(a)(c) | | | 7,182 | | | | 177,108 | |
Vale SA—ADR | | | 54,491 | | | | 676,777 | |
Warrior Met Coal, Inc. | | | 7,042 | | | | 229,217 | |
| | | | | | |
|
|
|
| | | | | | | | 5,166,692 | |
| | | | | | |
|
|
|
Miscellaneous Manufacturing—1.98% | | | | | | | | |
3M Co.(c) | | | 8,694 | | | | 1,081,099 | |
Acushnet Holdings Corp.(c) | | | 5,167 | | | | 246,208 | |
Bandai Namco Holdings, Inc.—ADR | | | 1,466 | | | | 54,843 | |
Becton Dickinson & Co. | | | 2,327 | | | | 587,381 | |
British American Tobacco PLC—ADR | | | 123,925 | | | | 4,963,196 | |
Chow Tai Fook Jewellery Group Ltd.—ADR(c) | | | 7,979 | | | | 160,853 | |
DENTSPLY SIRONA, Inc. | | | 10,084 | | | | 330,453 | |
Edwards Lifesciences Corp.(a) | | | 6,120 | | | | 551,412 | |
Envista Holdings Corp.(a)(c) | | | 10,743 | | | | 398,458 | |
EssilorLuxottica SA—ADR | | | 10,164 | | | | 759,759 | |
Getinge AB—ADR | | | 28,702 | | | | 530,987 | |
Haemonetics Corp.(a) | | | 4,480 | | | | 336,134 | |
Integra LifeSciences Holdings Corp.(a)(c) | | | 6,084 | | | | 290,268 | |
iRhythm Technologies, Inc.(a) | | | 765 | | | | 112,799 | |
Johnson & Johnson | | | 29,322 | | | | 4,730,812 | |
Mattel, Inc.(a) | | | 15,252 | | | | 337,374 | |
Medigus Ltd.—ADR(a) | | | 53,015 | | | | 32,594 | |
Merit Medical Systems, Inc.(a) | | | 3,997 | | | | 236,742 | |
Nintendo Co., Ltd.—ADR | | | 2,283 | | | | 116,661 | |
Shockwave Medical, Inc.(a) | | | 1,411 | | | | 418,869 | |
Siemens Healthineers AG—ADR(c) | | | 18,235 | | | | 446,210 | |
STAAR Surgical Co.(a) | | | 3,099 | | | | 293,134 | |
Terumo Corp.—ADR | | | 30,533 | | | | 981,637 | |
Tiger Brands Ltd.—ADR | | | 5,821 | | | | 57,628 | |
Yamaha Corp.—ADR | | | 10,780 | | | | 419,450 | |
| | | | | | |
|
|
|
| | | | | | | | 18,474,961 | |
| | | | | | |
|
|
|
The accompanying notes are an integral part of these financial statements.
57
PMC DIVERSIFIED EQUITY FUND | Schedule of Investments |
August 31, 2022 (Continued)
| | | | | | | | |
| | |
| | | Shares
| | | Value
| |
Miscellaneous Store Retailers—0.12% | | | | | | | | |
Mr Price Group Ltd.—ADR | | | 31,434 | | | $ | 339,173 | |
Tractor Supply Co. | | | 4,312 | | | | 798,367 | |
| | | | | | |
|
|
|
| | | | | | | | 1,137,540 | |
| | | | | | |
|
|
|
Motion Picture and Sound Recording Industries—0.05% | | | | | | | | |
AMC Entertainment Holdings, Inc.—Class A(a)(c) | | | 16,676 | | | | 152,085 | |
World Wrestling Entertainment, Inc. (c) | | | 4,019 | | | | 273,332 | |
| | | | | | |
|
|
|
| | | | | | | | 425,417 | |
| | | | | | |
|
|
|
Motor Vehicle and Parts Dealers—0.70% | | | | | | | | |
Advance Auto Parts, Inc. | | | 5,191 | | | | 875,410 | |
Asbury Automotive Group, Inc.(a)(c) | | | 1,885 | | | | 328,895 | |
AutoNation, Inc. (a)(c) | | | 5,078 | | | | 632,719 | |
AutoZone, Inc.(a) | | | 705 | | | | 1,494,044 | |
Group 1 Automotive, Inc.(c) | | | 2,123 | | | | 379,147 | |
Lithia Motors, Inc.—Class A(c) | | | 1,215 | | | | 322,510 | |
Murphy USA, Inc. | | | 837 | | | | 242,872 | |
O’Reilly Automotive, Inc.(a) | | | 1,916 | | | | 1,335,682 | |
Penske Automotive Group, Inc.(c) | | | 5,932 | | | | 699,441 | |
Sonic Automotive, Inc.—Class A(c) | | | 3,116 | | | | 165,740 | |
| | | | | | |
|
|
|
| | | | | | | | 6,476,460 | |
| | | | | | |
|
|
|
National Security and International Affairs—0.06% | | | | | | | | |
Leidos Holdings, Inc. | | | 5,985 | | | | 568,874 | |
| | | | | | |
|
|
|
Nonmetallic Mineral Product Manufacturing—0.28% | | | | | | | | |
AGC, Inc.—ADR | | | 93,740 | | | | 634,151 | |
Corning, Inc.(c) | | | 27,676 | | | | 949,840 | |
CRH PLC—ADR | | | 6,583 | | | | 243,505 | |
Mohawk Industries, Inc.(a)(c) | | | 4,673 | | | | 515,712 | |
Quanex Building Products Corp. | | | 11,715 | | | | 261,245 | |
| | | | | | |
|
|
|
| | | | | | | | 2,604,453 | |
| | | | | | |
|
|
|
Nonstore Retailers—0.65% | | | | | | | | |
Baozun, Inc.—ADR(a) | | | 17,065 | | | | 145,053 | |
Box, Inc.(a)(c) | | | 7,548 | | | | 194,361 | |
Compass Group PLC—ADR | | | 16,790 | | | | 363,504 | |
DoorDash, Inc.(a) | | | 8,962 | | | | 536,823 | |
Grupo Aval Acciones y Valores SA—ADR | | | 1 | | | | 3 | |
JD.com, Inc.—ADR | | | 23,443 | | | | 1,488,396 | |
Jumia Technologies AG—ADR(a)(c) | | | 28,873 | | | | 213,371 | |
MonotaRO Co. Ltd.—ADR | | | 12,512 | | | | 225,216 | |
Overstock.com, Inc.(a) | | | 4,536 | | | | 118,390 | |
Pinduoduo, Inc.—ADR(a)(c) | | | 35,512 | | | | 2,532,006 | |
ZOZO, Inc.—ADR(c) | | | 57,111 | | | | 251,288 | |
| | | | | | |
|
|
|
| | | | | | | | 6,068,411 | |
| | | | | | |
|
|
|
Nursing and Residential Care Facilities—0.05% | | | | | | | | |
Ensign Group, Inc. | | | 3,787 | | | | 323,031 | |
National HealthCare Corp. | | | 2,337 | | | | 162,305 | |
| | | | | | |
|
|
|
| | | | | | | | 485,336 | |
| | | | | | |
|
|
|
Oil and Gas Extraction—2.98% | | | | | | | | |
AP Moeller—Maersk A/S—ADR | | | 120,902 | | | | 1,450,824 | |
APA Corp. | | | 15,187 | | | | 593,964 | |
The accompanying notes are an integral part of these financial statements.
58
PMC DIVERSIFIED EQUITY FUND | Schedule of Investments |
August 31, 2022 (Continued)
| | | | | | | | |
| | |
| | | Shares
| | | Value
| |
Chesapeake Energy Corp.(c) | | | 5,664 | | | $ | 569,175 | |
Continental Resources, Inc. | | | 4,267 | | | | 297,965 | |
Coterra Energy, Inc.(c) | | | 15,068 | | | | 465,752 | |
Devon Energy Corp. | | | 16,366 | | | | 1,155,767 | |
Eni SpA—ADR | | | 75,968 | | | | 1,794,364 | |
EOG Resources, Inc. | | | 5,569 | | | | 675,520 | |
Gazprom PJSC—ADR(e)(g) | | | 186,205 | | | | 0 | |
Marathon Oil Corp. | | | 80,728 | | | | 2,065,830 | |
Matador Resources Co.(c) | | | 6,807 | | | | 405,697 | |
Occidental Petroleum Corp. | | | 17,650 | | | | 1,253,150 | |
Ovintiv, Inc. | | | 12,012 | | | | 638,318 | |
Pampa Energia SA—ADR(a)(c) | | | 8,675 | | | | 211,583 | |
PDC Energy, Inc. | | | 5,797 | | | | 393,674 | |
Petroleo Brasileiro SA—ADR(c) | | | 70,192 | | | | 1,003,044 | |
Pioneer Natural Resources Co.(c) | | | 4,703 | | | | 1,190,894 | |
Range Resources Corp.(a) | | | 6,833 | | | | 224,532 | |
Repsol SA—ADR | | | 66,292 | | | | 860,470 | |
Shell PLC—ADR | | | 153,792 | | | | 8,147,901 | |
SM Energy Co. | | | 9,521 | | | | 419,590 | |
Surgutneftegas PJSC—ADR(e) | | | 15,549 | | | | 0 | |
TotalEnergies SE—ADR | | | 74,195 | | | | 3,747,589 | |
Woodside Energy Group Ltd.—ADR(c) | | | 8,498 | | | | 193,839 | |
| | | | | | |
|
|
|
| | | | | | | | 27,759,442 | |
| | | | | | |
|
|
|
Other Information Services—0.44% | | | | | | | | |
Amadeus IT Group SA—ADR(a) | | | 6,298 | | | | 330,141 | |
Meta Platforms, Inc.—Class A(a) | | | 21,444 | | | | 3,493,871 | |
Pinterest, Inc. (a) | | | 11,693 | | | | 269,407 | |
| | | | | | |
|
|
|
| | | | | | | | 4,093,419 | |
| | | | | | |
|
|
|
Paper Manufacturing—0.13% | | | | | | | | |
Boise Cascade Co. | | | 3,147 | | | | 196,153 | |
International Paper Co. | | | 10,912 | | | | 454,157 | |
Packaging Corp. of America | | | 1,659 | | | | 227,150 | |
WestRock Co. | | | 8,850 | | | | 359,222 | |
| | | | | | |
|
|
|
| | | | | | | | 1,236,682 | |
| | | | | | |
|
|
|
Performing Arts, Spectator Sports, and Related Industries—0.07% | | | | | | | | |
Endeavor Group Holdings, Inc.(a) | | | 15,320 | | | | 346,538 | |
Entain PLC—ADR(c) | | | 15,637 | | | | 230,724 | |
OPAP SA—ADR | | | 17,498 | | | | 113,387 | |
| | | | | | |
|
|
|
| | | | | | | | 690,649 | |
| | | | | | |
|
|
|
Personal and Laundry Services—0.05% | | | | | | | | |
Kingfisher PLC—ADR | | | 79,052 | | | | 429,055 | |
| | | | | | |
|
|
|
Petroleum and Coal Products Manufacturing—1.08% | | | | | | | | |
BP PLC—ADR | | | 267 | | | | 8,234 | |
Equinor ASA—ADR | | | 36,926 | | | | 1,432,360 | |
Exxon Mobil Corp. | | | 54,411 | | | | 5,201,147 | |
Marathon Petroleum Corp. | | | 11,797 | | | | 1,188,548 | |
OMV AG—ADR | | | 10,221 | | | | 409,760 | |
PBF Energy, Inc.—Class A(a) | | | 10,664 | | | | 364,282 | |
Valero Energy Corp. | | | 12,221 | | | | 1,431,324 | |
| | | | | | |
|
|
|
| | | | | | | | 10,035,655 | |
| | | | | | |
|
|
|
The accompanying notes are an integral part of these financial statements.
59
PMC DIVERSIFIED EQUITY FUND | Schedule of Investments |
August 31, 2022 (Continued)
| | | | | | | | |
| | |
| | | Shares
| | | Value
| |
Pipeline Transportation—0.03% | | | | | | | | |
Naturgy Energy Group SA—ADR | | | 47,213 | | | $ | 256,839 | |
| | | | | | |
|
|
|
Plastics and Rubber Products Manufacturing—0.27% | | | | | | | | |
Berry Global Group, Inc.(a) | | | 3,663 | | | | 199,011 | |
Bridgestone Corp.—ADR | | | 82,963 | | | | 1,586,253 | |
Entegris, Inc. | | | 4,912 | | | | 466,050 | |
Goodyear Tire & Rubber Co.(a) | | | 15,309 | | | | 214,785 | |
| | | | | | |
|
|
|
| | | | | | | | 2,466,099 | |
| | | | | | |
|
|
|
Postal Service—0.04% | | | | | | | | |
Royal Mail PLC—ADR | | | 62,007 | | | | 401,805 | |
| | | | | | |
|
|
|
Primary Metal Manufacturing—1.03% | | | | | | | | |
Alcoa Corp. | | | 7,350 | | | | 363,678 | |
APERAM SA(b) | | | 14,895 | | | | 405,665 | |
ArcelorMittal SA(b) | | | 78,374 | | | | 1,848,844 | |
Commercial Metals Co. | | | 12,839 | | | | 520,108 | |
Encore Wire Corp.(c) | | | 4,545 | | | | 591,305 | |
Grupo Simec SAB de CV—ADR(a) | | | 1 | | | | 30 | |
Kubota Corp.—ADR | | | 7,117 | | | | 550,215 | |
Mechel PJSC—ADR(a)(e) | | | 59,509 | | | | 133,895 | |
Nippon Steel Corp.—ADR | | | 72,051 | | | | 1,150,654 | |
Norsk Hydro ASA—ADR | | | 224,612 | | | | 1,547,577 | |
Steel Dynamics, Inc.(c) | | | 10,174 | | | | 821,246 | |
Sumitomo Metal Mining Co. Ltd.—ADR | | | 85,741 | | | | 670,494 | |
Ternium SA—ADR | | | 22,814 | | | | 702,899 | |
United States Steel Corp.(c) | | | 11,565 | | | | 264,492 | |
Usinas Siderurgicas de Minas Gerais SA Usiminas—ADR | | | 13,517 | | | | 21,762 | |
| | | | | | |
|
|
|
| | | | | | | | 9,592,864 | |
| | | | | | |
|
|
|
Printing and Related Support Activities—0.15% | | | | | | | | |
Dai Nippon Printing Co. Ltd.—ADR | | | 60,977 | | | | 643,917 | |
TOPPAN, Inc.—ADR | | | 99,079 | | | | 780,743 | |
| | | | | | |
|
|
|
| | | | | | | | 1,424,660 | |
| | | | | | |
|
|
|
Professional, Scientific, and Technical Services—3.61% | | | | | | | | |
Accenture PLC—Class A(b) | | | 17,570 | | | | 5,068,242 | |
AECOM | | | 1,443 | | | | 105,555 | |
Alector, Inc.(a) | | | 9,391 | | | | 97,197 | |
Allscripts Healthcare Solutions, Inc.(a)(c) | | | 7,881 | | | | 133,977 | |
Alterity Therapeutics Ltd.—ADR(a) | | | 78,065 | | | | 46,058 | |
BioNTech SE—ADR(c) | | | 4,382 | | | | 633,812 | |
CACI International, Inc.—Class A(a) | | | 2,090 | | | | 587,018 | |
Capgemini SE—ADR | | | 30,987 | | | | 1,073,700 | |
Carlsberg AS—ADR | | | 54,979 | | | | 1,420,658 | |
CDW Corp. | | | 5,203 | | | | 888,152 | |
Cheetah Mobile, Inc.—ADR(a) | | | 1 | | | | 1 | |
Clear Channel Outdoor Holdings, Inc.(a) | | | 27,483 | | | | 43,973 | |
Cognizant Technology Solutions Corp.—Class A | | | 29,682 | | | | 1,875,012 | |
Commonwealth Bank of Australia—ADR(c) | | | 28,703 | | | | 1,902,722 | |
Concentrix Corp. | | | 2,326 | | | | 292,564 | |
ContextLogic, Inc.(a)(c) | | | 59,277 | | | | 77,060 | |
DXC Technology Co.(a) | | | 8,976 | | | | 222,425 | |
Ebix, Inc.(c) | | | 5,961 | | | | 155,105 | |
EPAM Systems, Inc.(a) | | | 250 | | | | 106,625 | |
F5, Inc.(a) | | | 2,006 | | | | 315,062 | |
The accompanying notes are an integral part of these financial statements.
60
PMC DIVERSIFIED EQUITY FUND | Schedule of Investments |
August 31, 2022 (Continued)
| | | | | | | | |
| | |
| | | Shares
| | | Value
| |
FTI Consulting, Inc.(a)(c) | | | 2,124 | | | $ | 341,114 | |
Galapagos NV—ADR(a) | | | 4,274 | | | | 213,956 | |
Gartner, Inc.(a) | | | 4,692 | | | | 1,338,722 | |
Genmab A/S—ADR(a) | | | 8,139 | | | | 288,853 | |
GoDaddy, Inc.(a) | | | 9,356 | | | | 709,372 | |
Gravity Co. Ltd.—ADR(a) | | | 7,526 | | | | 370,053 | |
Immutep Ltd.—ADR(a)(c) | | | 65,834 | | | | 132,985 | |
Indra Sistemas SA—ADR(c) | | | 144,619 | | | | 549,552 | |
Insight Enterprises, Inc.(a)(c) | | | 6,480 | | | | 590,458 | |
Interpublic Group of Companies, Inc.(c) | | | 42,419 | | | | 1,172,462 | |
Jacobs Solutions, Inc. | | | 3,965 | | | | 493,960 | |
Jardine Matheson Holdings Ltd.—ADR | | | 11,819 | | | | 626,525 | |
Lizhi, Inc.—ADR(a) | | | 11,609 | | | | 10,981 | |
Lyell Immunopharma, Inc.(a) | | | 12,118 | | | | 81,191 | |
Materialise NV—ADR(a)(c) | | | 8,221 | | | | 96,103 | |
Maxar Technologies, Inc. | | | 3,959 | | | | 94,343 | |
Medpace Holdings, Inc.(a) | | | 2,731 | | | | 403,123 | |
Mereo Biopharma Group PLC—ADR(a) | | | 37,367 | | | | 44,840 | |
NetScout Systems, Inc.(a) | | | 7,381 | | | | 234,273 | |
NortonLifeLock, Inc. | | | 73,478 | | | | 1,659,868 | |
Omnicom Group, Inc.(c) | | | 17,399 | | | | 1,163,993 | |
Palantir Technologies, Inc.(a)(c) | | | 28,080 | | | | 216,778 | |
Palo Alto Networks, Inc.(a) | | | 1,288 | | | | 717,171 | |
Paychex, Inc. | | | 6,164 | | | | 760,268 | |
Paylocity Holding Corp.(a) | | | 1,974 | | | | 475,734 | |
Pintec Technology Holdings Ltd.—ADR(a) | | | 1 | | | | 1 | |
Publicis Groupe SA—ADR | | | 20,301 | | | | 248,687 | |
PubMatic, Inc.—Class A(a) | | | 6,733 | | | | 131,765 | |
Riot Blockchain, Inc.(a)(c) | | | 6,955 | | | | 49,867 | |
Sage Group PLC—AD(c) | | | 7,196 | | | | 242,505 | |
Science Applications International Corp. | | | 6,370 | | | | 580,116 | |
SecureWorks Corp.(a) | | | 2,371 | | | | 24,658 | |
Skillz, Inc.(a)(c) | | | 11,020 | | | | 14,657 | |
Snowflake, Inc.(a)(c) | | | 2,839 | | | | 513,717 | |
Sumitomo Corp.—ADR(c) | | | 33,560 | | | | 470,847 | |
Swatch Group AG—ADR | | | 47,600 | | | | 575,008 | |
Syneos Health, Inc.(a) | | | 4,906 | | | | 294,900 | |
TC Biopharm Holdings PLC—ADR(a) | | | 19,068 | | | | 6,292 | |
Teledyne Technologies, Inc.(a) | | | 2,751 | | | | 1,013,359 | |
Trade Desk, Inc.—Class A(a)(c) | | | 1,306 | | | | 81,886 | |
TuSimple Holdings, Inc.(a) | | | 11,943 | | | | 85,870 | |
Unity Software, Inc.(a)(c) | | | 1,033 | | | | 44,130 | |
Verint Systems, Inc.(a) | | | 9,359 | | | | 453,818 | |
Vir Biotechnology, Inc.(a)(c) | | | 8,415 | | | | 199,856 | |
Virtu Financial, Inc.—Class A | | | 14,285 | | | | 327,984 | |
VMware, Inc.—Class A | | | 3,513 | | | | 407,613 | |
Vodacom Group Ltd.—ADR | | | 1 | | | | 7 | |
X Financial—ADR(a) | | | 944 | | | | 2,464 | |
Yiren Digital Ltd.—ADR(a) | | | 14,631 | | | | 15,948 | |
| | | | | | |
|
|
|
| | | | | | | | 33,617,551 | |
| | | | | | |
|
|
|
Publishing Industries (except Internet)—4.01% | | | | | | | | |
3D Systems Corp.(a)(c) | | | 12,269 | | | | 124,285 | |
Activision Blizzard, Inc. | | | 7,415 | | | | 582,003 | |
Akamai Technologies, Inc.(a) | | | 9,208 | | | | 831,298 | |
The accompanying notes are an integral part of these financial statements.
61
PMC DIVERSIFIED EQUITY FUND | Schedule of Investments |
August 31, 2022 (Continued)
| | | | | | | | |
| | |
| | | Shares
| | | Value
| |
Cadence Design System, Inc.(a) | | | 4,083 | | | $ | 709,503 | |
Certara, Inc.(a) | | | 10,651 | | | | 166,901 | |
CommVault Systems, Inc.(a) | | | 3,704 | | | | 201,090 | |
Datadog, Inc.—Class A(a) | | | 4,009 | | | | 420,745 | |
Dropbox, Inc. (a) | | | 35,208 | | | | 753,099 | |
Dynatrace, Inc.(a) | | | 1,870 | | | | 71,397 | |
Foresight Autonomous Holdings Ltd.—ADR(a) | | | 19,714 | | | | 13,210 | |
Fujitsu Ltd.—ADR | | | 58,982 | | | | 1,388,436 | |
Gaotu Techedu, Inc.—ADR(a) | | | 626 | | | | 1,102 | |
Hello Group, Inc.—ADR | | | 2,387 | | | | 12,293 | |
Hewlett Packard Enterprise Co. | | | 98,249 | | | | 1,336,186 | |
HubSpot, Inc.(a) | | | 1,313 | | | | 442,534 | |
Intuit, Inc. | | | 1,958 | | | | 845,425 | |
Microsoft Corp. | | | 70,355 | | | | 18,395,722 | |
MongoDB, Inc.(a)(c) | | | 618 | | | | 199,527 | |
New York Times Co.—Class A | | | 5,977 | | | | 182,239 | |
News Corp.—Class B | | | 33,060 | | | | 569,954 | |
Nexon Co. Ltd.—ADR | | | 5,374 | | | | 106,566 | |
Oracle Corp. | | | 19,330 | | | | 1,433,320 | |
PTC, Inc.(a)(c) | | | 2,585 | | | | 296,991 | |
RELX PLC—ADR | | | 42,749 | | | | 1,119,169 | |
SPS Commerce, Inc.(a) | | | 1,675 | | | | 204,551 | |
SS&C Technologies Holdings, Inc. | | | 18,711 | | | | 1,043,325 | |
Synopsys, Inc.(a) | | | 6,319 | | | | 2,186,500 | |
Tarena International, Inc.—ADR(a) | | | 1 | | | | 8 | |
Trend Micro, Inc.—ADR | | | 13,125 | | | | 813,094 | |
Vipshop Holdings Ltd.—ADR(a) | | | 204,952 | | | | 2,379,493 | |
Vnet Group, Inc.—ADR(a) | | | 251 | | | | 1,343 | |
WM Technology, Inc.(a) | | | 16,640 | | | | 43,597 | |
Ziff Davis, Inc.(a)(c) | | | 4,730 | | | | 365,534 | |
ZoomInfo Technologies, Inc.(a) | | | 3,081 | | | | 139,939 | |
| | | | | | |
|
|
|
| | | | | | | | 37,380,379 | |
| | | | | | |
|
|
|
Rail Transportation—0.14% | | | | | | | | |
CSX Corp. | | | 15,060 | | | | 476,649 | |
Union Pacific Corp. | | | 3,840 | | | | 862,118 | |
| | | | | | |
|
|
|
| | | | | | | | 1,338,767 | |
| | | | | | |
|
|
|
Real Estate—0.74% | | | | | | | | |
CBRE Group, Inc.—Class A(a) | | | 8,210 | | | | 648,262 | |
Daiwa House Industry Co. Ltd.—ADR | | | 30,049 | | | | 670,694 | |
eXp World Holdings, Inc.(c) | | | 7,610 | | | | 98,397 | |
Forestar Group, Inc.(a) | | | 6,149 | | | | 76,494 | |
Jefferies Financial Group, Inc. | | | 19,771 | | | | 634,451 | |
Jones Lang LaSalle, Inc. (a) | | | 3,470 | | | | 600,310 | |
Marcus & Millichap, Inc. | | | 13,696 | | | | 511,956 | |
Mitsubishi Estate Co. Ltd.—ADR | | | 49,324 | | | | 660,941 | |
Mitsui Fudosan Co. Ltd.—ADR | | | 369 | | | | 22,369 | |
RMR Group, Inc.—Class A | | | 7,657 | | | | 199,388 | |
Sekisui House Ltd.—ADR | | | 67,765 | | | | 1,151,327 | |
Sun Hung Kai Properties Ltd.—ADR(c) | | | 116,400 | | | | 1,382,832 | |
Walker & Dunlop, Inc. | | | 1,915 | | | | 192,381 | |
| | | | | | |
|
|
|
| | | | | | | | 6,849,802 | |
| | | | | | |
|
|
|
The accompanying notes are an integral part of these financial statements.
62
PMC DIVERSIFIED EQUITY FUND | Schedule of Investments |
August 31, 2022 (Continued)
| | | | | | | | |
| | |
| | | Shares
| | | Value
| |
Rental and Leasing Services—0.70% | | | | | | | | |
Agiliti, Inc.(a) | | | 4,859 | | | $ | 78,036 | |
AMERCO(c) | | | 729 | | | | 383,214 | |
Ashtead Group PLC—ADR | | | 1,889 | | | | 374,853 | |
Avis Budget Group, Inc.(a) | | | 1,666 | | | | 278,855 | |
Cerence, Inc.(a) | | | 1,981 | | | | 39,640 | |
Hertz Global Holdings, Inc.(a)(c) | | | 11,631 | | | | 214,708 | |
Netflix, Inc.(a) | | | 2,215 | | | | 495,185 | |
ORIX Corp.—ADR | | | 35,249 | | | | 2,902,755 | |
Ryder System, Inc. | | | 4,841 | | | | 370,046 | |
Triton International Ltd.(b) | | | 10,725 | | | | 639,103 | |
United Rentals, Inc.(a) | | | 2,568 | | | | 749,959 | |
| | | | | | |
|
|
|
| | | | | | | | 6,526,354 | |
| | | | | | |
|
|
|
Repair and Maintenance—0.02% | | | | | | | | |
Valvoline, Inc. | | | 6,060 | | | | 176,164 | |
| | | | | | |
|
|
|
Securities, Commodity Contracts, and Other Financial Investments and Related
Activities—2.11% | | | | | | | | |
23andMe Holding Co.(a)(c) | | | 49,177 | | | | 165,726 | |
360 DigiTech, Inc.—ADR | | | 68,012 | | | | 1,086,832 | |
3i Group PLC—ADR(c) | | | 8,290 | | | | 59,522 | |
Affiliated Managers Group, Inc. | | | 507 | | | | 64,572 | |
Amarin Corp. PLC—ADR(a) | | | 17,904 | | | | 21,127 | |
Artisan Partners Asset Management, Inc.—Class A(c) | | | 2,756 | | | | 93,043 | |
Astra International, Tbk PT—ADR | | | 63,281 | | | | 591,677 | |
Bakkt Holdings, Inc.(a)(c) | | | 23,428 | | | | 60,679 | |
Bidvest Group Ltd.—ADR | | | 6,473 | | | | 161,825 | |
Blackstone, Inc. | | | 13,242 | | | | 1,243,952 | |
Carlyle Group, Inc. | | | 15,746 | | | | 512,217 | |
Cboe Global Markets, Inc.(c) | | | 3,278 | | | | 386,706 | |
Cerevel Therapeutics Holdings, Inc.(a)(c) | | | 4,263 | | | | 124,053 | |
Chemed Corp. | | | 668 | | | | 318,095 | |
Daqo New Energy Corp.—ADR(a) | | | 18,082 | | | | 1,205,527 | |
EDAP TMS SA—ADR(a) | | | 10,939 | | | | 92,435 | |
Evercore, Inc.—Class A(c) | | | 3,363 | | | | 315,079 | |
First Pacific Co. Ltd.—ADR | | | 412,961 | | | | 788,756 | |
Franklin Resources, Inc.(c) | | | 18,296 | | | | 476,977 | |
Futu Holdings Ltd.—ADR(a)(c) | | | 12,301 | | | | 603,856 | |
Ginkgo Bioworks Holdings, Inc.(a)(c) | | | 23,555 | | | | 63,363 | |
Goldman Sachs Group, Inc. | | | 3,624 | | | | 1,205,596 | |
Houlihan Lokey, Inc. | | | 3,539 | | | | 277,812 | |
Janus Henderson Group PLC(b) | | | 14,188 | | | | 331,999 | |
Keppel Corp Ltd.—ADR | | | 18,260 | | | | 191,365 | |
LATCH, Inc.(a) | | | 9,591 | | | | 10,262 | |
Leju Holdings Ltd.—ADR(a) | | | 1 | | | | 2 | |
Lixil Corp.—ADR | | | 19,439 | | | | 675,505 | |
LPL Financial Holdings, Inc. | | | 12 | | | | 2,656 | |
Lucid Group, Inc.(a)(c) | | | 18,538 | | | | 284,373 | |
Macquarie Group Ltd.—ADR | | | 10,412 | | | | 1,250,064 | |
Moelis & Co.—Class A | | | 4,527 | | | | 188,595 | |
NatWest Group PLC—ADR(a) | | | 50,450 | | | | 278,990 | |
Navient Corp.(c) | | | 14,481 | | | | 222,863 | |
Offerpad Solutions, Inc.(a)(c) | | | 46,624 | | | | 70,868 | |
Piper Jaffray Cos.(c) | | | 3,005 | | | | 344,283 | |
The accompanying notes are an integral part of these financial statements.
63
PMC DIVERSIFIED EQUITY FUND | Schedule of Investments |
August 31, 2022 (Continued)
| | | | | | | | |
| | |
| | | Shares
| | | Value
| |
Prosus NV—ADR | | | 71,362 | | | $ | 882,748 | |
Randstad NV—ADR | | | 4,546 | | | | 106,013 | |
Raymond James Financial, Inc. | | | 13,878 | | | | 1,448,446 | |
Sea Ltd.—ADR(a) | | | 2,790 | | | | 172,980 | |
Sibanye Stillwater Ltd.—ADR | | | 1 | | | | 9 | |
Societe Generale SA—ADR | | | 204,067 | | | | 893,813 | |
SOFI Technologies, Inc.(a)(c) | | | 20,417 | | | | 120,869 | |
StepStone Group, Inc.—Class A | | | 2,412 | | | | 65,823 | |
Stifel Financial Corp.(c) | | | 15,568 | | | | 923,338 | |
TechnoPro Holdings, Inc.—ADR (c) | | | 155,417 | | | | 695,957 | |
Uxin Ltd.—ADR(a) | | | 1 | | | | 1 | |
Verra Mobility Corp.(a) | | | 16,255 | | | | 259,105 | |
Virgin Galactic Holdings, Inc.(a)(c) | | | 6,594 | | | | 38,971 | |
Virtus Investment Partners, Inc. | | | 1,023 | | | | 195,649 | |
Vivid Seats, Inc.(c) | | | 12,412 | | | | 100,413 | |
| | | | | | |
|
|
|
| | | | | | | | 19,675,387 | |
| | | | | | |
|
|
|
Specialty Trade Contractors—0.19% | | | | | | | | |
Comfort Systems USA, Inc. | | | 4,335 | | | | 434,974 | |
EMCOR Group, Inc.(c) | | | 5,105 | | | | 607,087 | |
NetEase, Inc.—ADR | | | 3,573 | | | | 316,246 | |
Quanta Services, Inc. | | | 2,887 | | | | 407,933 | |
| | | | | | |
|
|
|
| | | | | | | | 1,766,240 | |
| | | | | | |
|
|
|
Sporting Goods, Hobby, Musical Instrument, and Book Stores—0.05% | | | | | | | | |
Dick’s Sporting Goods, Inc.(c) | | | 4,522 | | | | 481,005 | |
| | | | | | |
|
|
|
Support Activities for Agriculture and Forestry—0.18% | | | | | | | | |
Andersons, Inc. | | | 7,031 | | | | 260,358 | |
Corteva, Inc. | | | 22,842 | | | | 1,403,184 | |
| | | | | | |
|
|
|
| | | | | | | | 1,663,542 | |
| | | | | | |
|
|
|
Support Activities for Mining—1.25% | | | | | | | | |
BHP Group Ltd.—ADR | | | 46,252 | | | | 2,538,772 | |
California Resources Corp. | | | 6,805 | | | | 339,978 | |
China Shenhua Energy Co. Ltd.—ADR | | | 1 | | | | 13 | |
Cleveland-Cliffs, Inc.(a)(c) | | | 16,759 | | | | 289,428 | |
ConocoPhillips | | | 26,376 | | | | 2,886,852 | |
Diamondback Energy, Inc. | | | 5,100 | | | | 679,728 | |
Epiroc AB—ADR | | | 5,592 | | | | 85,054 | |
Fortescue Metals Group Ltd.—ADR | | | 35,329 | | | | 883,932 | |
Hess Corp.(c) | | | 110 | | | | 13,286 | |
Impala Platinum Holdings Ltd.—ADR | | | 11,084 | | | | 115,495 | |
Inpex Corp.—ADR | | | 90,991 | | | | 1,035,478 | |
Rio Tinto PLC—ADR | | | 27,823 | | | | 1,566,157 | |
South32 Ltd.—ADR | | | 51,532 | | | | 718,871 | |
Targa Resources Corp. | | | 6,530 | | | | 445,542 | |
Weir Group PLC—ADR | | | 8,075 | | | | 67,588 | |
| | | | | | |
|
|
|
| | | | | | | | 11,666,174 | |
| | | | | | |
|
|
|
Support Activities for Transportation—0.55% | | | | | | | | |
CH Robinson Worldwide, Inc.(c) | | | 7,782 | | | | 888,315 | |
CK Hutchison Holdings Ltd.—ADR | | | 62,224 | | | | 396,367 | |
Expeditors International of Washington, Inc.(c) | | | 19,872 | | | | 2,044,631 | |
Grupo Aeroportuario del Centro Norte SAB de CV—ADR | | | 1,933 | | | | 101,037 | |
Grupo Aeroportuario del Pacifico SAB de CV—ADR | | | 122 | | | | 17,394 | |
The accompanying notes are an integral part of these financial statements.
64
PMC DIVERSIFIED EQUITY FUND | Schedule of Investments |
August 31, 2022 (Continued)
| | | | | | | | |
| | |
| | | Shares
| | | Value
| |
Hub Group, Inc.—Class A(a) | | | 4,471 | | | $ | 356,831 | |
JB Hunt Transport Services, Inc. (c) | | | 4,753 | | | | 827,117 | |
Matson, Inc. | | | 5,028 | | | | 370,362 | |
XPO Logistics, Inc.(a) | | | 2,945 | | | | 154,377 | |
| | | | | | |
|
|
|
| | | | | | | | 5,156,431 | |
| | | | | | |
|
|
|
Telecommunications—2.50% | | | | | | | | |
Adyen NV—ADR(a) | | | 10,905 | | | | 169,137 | |
AT&T, Inc. | | | 172,656 | | | �� | 3,028,386 | |
Deutsche Telekom AG—ADR | | | 9,905 | | | | 187,502 | |
Eutelsat Communications SA—ADR | | | 101,546 | | | | 228,479 | |
Frontier Communications Parent, Inc.(a) | | | 10,789 | | | | 277,925 | |
Gogo, Inc.(a) | | | 4,822 | | | | 71,655 | |
JOYY, Inc.—ADR | | | 15 | | | | 455 | |
KDDI Corp.—ADR | | | 145,629 | | | | 2,220,842 | |
KT Corp.—ADR | | | 111,181 | | | | 1,525,403 | |
Lumen Technologies, Inc.(c) | | | 137,977 | | | | 1,374,251 | |
Magyar Telekom Telecommunications PLC—ADR | | | 35,539 | | | | 140,201 | |
Mobile TeleSystems PJSC—ADR(e)(g) | | | 46,068 | | | | 253,374 | |
MTN Group Ltd.—ADR | | | 112,003 | | | | 818,742 | |
Nippon Telegraph & Telephone Corp.—ADR | | | 110,396 | | | | 2,993,939 | |
Nokia Oyj—ADR | | | 225,693 | | | | 1,139,750 | |
Oxford Industries, Inc.(c) | | | 2,896 | | | | 309,090 | |
Partner Communications Co. Ltd.—ADR(a) | | | 7,078 | | | | 59,243 | |
PLDT, Inc.—ADR | | | 15,483 | | | | 450,246 | |
Rostelecom PJSC—ADR(e) | | | 24,510 | | | | 0 | |
SK Telecom Co. Ltd.—ADR | | | 8,580 | | | | 183,183 | |
SoftBank Corp.—ADR | | | 36,780 | | | | 401,270 | |
Swisscom AG—ADR | | | 7,152 | | | | 369,186 | |
Tele2 AB—ADR | | | 6,929 | | | | 37,209 | |
Telenor ASA—ADR | | | 20,472 | | | | 223,554 | |
Telkom Indonesia Persero Tbk PT—ADR | | | 55,153 | | | | 1,658,451 | |
The9 Ltd.—ADR(a) | | | 1 | | | | 1 | |
T-Mobile US, Inc.(a) | | | 7,918 | | | | 1,139,875 | |
United States Cellular Corp.(a) | | | 3,942 | | | | 112,702 | |
Verizon Communications, Inc. | | | 63,817 | | | | 2,668,188 | |
Vodafone Group PLC—ADR | | | 64,628 | | | | 867,308 | |
Zoom Video Communications, Inc.—Class A(a) | | | 4,410 | | | | 354,564 | |
| | | | | | |
|
|
|
| | | | | | | | 23,264,111 | |
| | | | | | |
|
|
|
Textile Mills—0.02% | | | | | | | | |
Dunxin Financial Holdings Ltd.—ADR(a) | | | 1 | | | | 0 | |
Teijin Ltd.—ADR | | | 16,822 | | | | 178,314 | |
| | | | | | |
|
|
|
| | | | | | | | 178,314 | |
| | | | | | |
|
|
|
Textile Product Mills—0.14% | | | | | | | | |
Hermes International—ADR | | | 9,193 | | | | 1,177,715 | |
Interface, Inc. | | | 12,319 | | | | 137,603 | |
| | | | | | |
|
|
|
| | | | | | | | 1,315,318 | |
| | | | | | |
|
|
|
Transit and Ground Passenger Transportation—0.03% | | | | | | | | |
Lyft, Inc.—Class A(a) | | | 1,540 | | | | 22,684 | |
Uber Technologies, Inc.(a) | | | 2,674 | | | | 76,904 | |
Yalla Group Ltd.—ADR(a)(c) | | | 36,950 | | | | 158,516 | |
| | | | | | |
|
|
|
| | | | | | | | 258,104 | |
| | | | | | |
|
|
|
The accompanying notes are an integral part of these financial statements.
65
PMC DIVERSIFIED EQUITY FUND | Schedule of Investments |
August 31, 2022 (Continued)
| | | | | | | | |
| | |
| | | Shares
| | | Value
| |
Transportation Equipment Manufacturing—5.24% | | | | | | | | |
AAR Corp.(a)(c) | | | 8,988 | | | $ | 385,405 | |
Airbus SE—ADR | | | 49,546 | | | | 1,211,895 | |
Aisin Corp.—ADR | | | 10,978 | | | | 329,340 | |
BAE Systems PLC—ADR | | | 49,778 | | | | 1,796,986 | |
Bayerische Motoren Werke AG—ADR | | | 110,279 | | | | 2,705,144 | |
BorgWarner, Inc. | | | 19,772 | | | | 745,404 | |
Brilliance China Automotive Holdings Ltd.—ADR(a)(e)(g) | | | 37,772 | | | | 173,751 | |
Denso Corp.—ADR | | | 48,910 | | | | 1,336,710 | |
Embraer SA—ADR(a) | | | 1 | | | | 11 | |
Ford Motor Co. | | | 126,172 | | | | 1,922,861 | |
General Dynamics Corp. | | | 10,670 | | | | 2,442,682 | |
General Motors Co. | | | 27,286 | | | | 1,042,598 | |
Honda Motor Co. Ltd.—ADR | | | 137,159 | | | | 3,637,457 | |
Huntington Ingalls Industries, Inc. | | | 2,158 | | | | 496,901 | |
Isuzu Motors Ltd.—ADR(c) | | | 65,708 | | | | 813,071 | |
Kawasaki Heavy Industries Ltd.—ADR | | | 28,284 | | | | 220,389 | |
Lear Corp.(c) | | | 4,766 | | | | 660,758 | |
Leonardo SpA—ADR | | | 302,398 | | | | 1,245,880 | |
Lockheed Martin Corp. | | | 4,051 | | | | 1,701,866 | |
Mazda Motor Corp.—ADR | | | 127,572 | | | | 557,490 | |
Mercedes-Benz Group AG—ADR(c) | | | 293,758 | | | | 4,124,362 | |
Nikola Corp.(a)(c) | | | 10,777 | | | | 57,765 | |
Nissan Motor Co. Ltd.—ADR | | | 46,625 | | | | 366,473 | |
Niu Technologies—ADR(a) | | | 43,498 | | | | 261,423 | |
PACCAR, Inc. | | | 4,600 | | | | 402,546 | |
Raytheon Technologies Corp. | | | 20,026 | | | | 1,797,334 | |
Shimano, Inc.—ADR | | | 51,617 | | | | 915,169 | |
Subaru Corp.—ADR | | | 29,328 | | | | 264,245 | |
Suzuki Motor Corp.—ADR | | | 156 | | | | 21,723 | |
Tata Motors Ltd.—ADR(a) | | | 30,262 | | | | 877,598 | |
Tesla, Inc.(a) | | | 22,662 | | | | 6,245,874 | |
Textron, Inc. | | | 19,892 | | | | 1,240,863 | |
Toyota Industries Corp.—ADR | | | 9,957 | | | | 556,049 | |
Toyota Motor Corp.—ADR | | | 46,300 | | | | 6,915,830 | |
Vitesco Technologies Group AG—ADR(a) | | | 286 | | | | 2,706 | |
Westinghouse Air Brake Technologies Corp. | | | 14,550 | | | | 1,275,308 | |
XL Fleet Corp.(a)(c) | | | 25,015 | | | | 28,017 | |
| | | | | | |
|
|
|
| | | | | | | | 48,779,884 | |
| | | | | | |
|
|
|
Truck Transportation—0.31% | | | | | | | | |
ArcBest Corp.(c) | | | 4,621 | | | | 372,129 | |
Knight-Swift Transportation Holdings, Inc.(c) | | | 11,133 | | | | 562,328 | |
Old Dominion Freight Lines, Inc. | | | 2,472 | | | | 670,925 | |
Saia, Inc.(a) | | | 1,012 | | | | 209,312 | |
Schneider National, Inc.—Class B(c) | | | 25,457 | | | | 581,947 | |
Werner Enterprises, Inc.(c) | | | 13,211 | | | | 525,666 | |
| | | | | | |
|
|
|
| | | | | | | | 2,922,307 | |
| | | | | | |
|
|
|
Utilities—2.72% | | | | | | | | |
American Electric Power Co., Inc. | | | 11,351 | | | | 1,137,370 | |
CenterPoint Energy, Inc. | | | 22,620 | | | | 713,209 | |
Centrica PLC—ADR(a) | | | 334,874 | | | | 1,165,362 | |
Cia Energetica de Minas Gerais—ADR(c) | | | 42,808 | | | | 164,383 | |
Clearway Energy, Inc. | | | 3,204 | | | | 110,474 | |
The accompanying notes are an integral part of these financial statements.
66
PMC DIVERSIFIED EQUITY FUND | Schedule of Investments |
August 31, 2022 (Continued)
| | | | | | | | |
| | |
| | | Shares
| | | Value
| |
CLP Holdings Ltd.—ADR(c) | | | 88,022 | | | $ | 767,112 | |
Consolidated Edison, Inc. | | | 19,027 | | | | 1,859,698 | |
Duke Energy Corp. | | | 8,706 | | | | 930,758 | |
Edison International | | | 7,915 | | | | 536,400 | |
Électricité de France SA—ADR | | | 10,978 | | | | 25,579 | |
Engie SA—ADR | | | 110,992 | | | | 1,325,243 | |
Entergy Corp. | | | 3,582 | | | | 413,005 | |
Evergy, Inc. | | | 25,849 | | | | 1,771,432 | |
Exelon Corp. | | | 40,880 | | | | 1,795,041 | |
First Solar, Inc.(a) | | | 4,320 | | | | 551,016 | |
FirstEnergy Corp. | | | 32,947 | | | | 1,303,054 | |
Iberdrola SA—ADR | | | 32,300 | | | | 1,341,096 | |
MDU Resources Group, Inc. | | | 23,652 | | | | 713,108 | |
National Fuel Gas Co. | | | 8,558 | | | | 609,929 | |
National Grid PLC—ADR(c) | | | 2,047 | | | | 129,350 | |
NiSource, Inc. | | | 24,734 | | | | 729,900 | |
NRG Energy, Inc.(c) | | | 10,623 | | | | 438,517 | |
OGE Energy Corp. | | | 18,047 | | | | 731,625 | |
Otter Tail Corp. | | | 9,526 | | | | 719,594 | |
PG&E Corp.(a) | | | 69,526 | | | | 857,256 | |
Portland General Electric Co. | | | 10,087 | | | | 521,195 | |
Power Assets Holdings Ltd.—ADR | | | 63,675 | | | | 382,050 | |
PPL Corp. | | | 4,614 | | | | 134,175 | |
Red Electrica Corp. SA—ADR | | | 68,013 | | | | 617,558 | |
Sempra Energy | | | 274 | | | | 45,202 | |
SSE PLC—ADR | | | 49,104 | | | | 938,868 | |
Terna—Rete Elettrica Nazionale—ADR | | | 15,079 | | | | 320,429 | |
Tokyo Gas Co. Ltd.—ADR(c) | | | 65,772 | | | | 620,230 | |
UGI Corp.(c) | | | 13,130 | | | | 518,635 | |
Vistra Corp. | | | 14,982 | | | | 370,805 | |
| | | | | | |
|
|
|
| | | | | | | | 25,308,658 | |
| | | | | | |
|
|
|
Waste Management and Remediation Services—0.40% | | | | | | | | |
Republic Sevices, Inc. | | | 15,261 | | | | 2,178,050 | |
Veolia Environnement SA—ADR | | | 39,446 | | | | 882,407 | |
Waste Management, Inc. | | | 3,787 | | | | 640,117 | |
| | | | | | |
|
|
|
| | | | | | | | 3,700,574 | |
| | | | | | |
|
|
|
Water Transportation—0.17% | | | | | | | | |
Central Puerto SA—ADR(a) | | | 13,146 | | | | 55,213 | |
Nippon Yusen KK—ADR | | | 99,331 | | | | 1,516,784 | |
| | | | | | |
|
|
|
| | | | | | | | 1,571,997 | |
| | | | | | |
|
|
|
Wood Product Manufacturing—0.29% | | | | | | | | |
Builders FirstSource, Inc.(a) | | | 9,258 | | | | 542,611 | |
Greif, Inc.—Class A | | | 6,611 | | | | 443,268 | |
Greif, Inc.—Class B(c) | | | 2,222 | | | | 145,030 | |
Louisiana-Pacific Corp.(c) | | | 4,213 | | | | 228,471 | |
Owens Corning | | | 5,867 | | | | 479,509 | |
Skyline Champion Corp.(a) | | | 3,090 | | | | 175,110 | |
UFP Industries, Inc. | | | 8,145 | | | | 646,632 | |
| | | | | | |
|
|
|
| | | | | | | | 2,660,631 | |
| | | | | | |
|
|
|
TOTAL COMMON STOCKS (Cost $809,798,760) | | | | | | | 889,338,489 | |
| | | | | | |
|
|
|
The accompanying notes are an integral part of these financial statements.
67
PMC DIVERSIFIED EQUITY FUND | Schedule of Investments |
August 31, 2022 (Continued)
| | | | | | | | |
| | |
| | | Shares
| | | Value
| |
| PREFERRED STOCKS—0.39% | | | | | | | | |
Chemical Manufacturing—0.01% | | | | | | | | |
Braskem SA—ADR, 26.273%(d) | | | 8,714 | | | $ | 102,999 | |
| | | | | | |
|
|
|
Credit Intermediation and Related Activities—0.07% | | | | | | | | |
Bancolombia SA—ADR, 5.262%(d) | | | 23,093 | | | | 633,903 | |
| | | | | | |
|
|
|
Management of Companies and Enterprises—0.03% | | | | | | | | |
Porsche Automobil Holding SE—ADR, 3.712%(d) | | | 44,857 | | | | 315,614 | |
| | | | | | |
|
|
|
Motion Picture and Sound Recording Industries—0.01% | | | | | | | | |
AMC Entertainment Holdings, Inc.(a)(d) | | | 16,676 | | | | 81,712 | |
| | | | | | |
|
|
|
Oil and Gas Extraction—0.12% | | | | | | | | |
Petroleo Brasileiro SA—ADR, 34.274%(d) | | | 87,362 | | | | 1,112,992 | |
Surgutneftegas PJSC—ADR, 178.798%(d)(e) | | | 47,748 | | | | 0 | |
| | | | | | |
|
|
|
| | | | | | | | 1,112,992 | |
| | | | | | |
|
|
|
Primary Metal Manufacturing—0.11% | | | | | | | | |
Gerdau SA—ADR, 16.522%(d) | | | 232,700 | | | | 1,049,478 | |
| | | | | | |
|
|
|
Utilities—0.04% | | | | | | | | |
Cia Energetica de Minas Gerais—ADR, 9.569%(d) | | | 127,167 | | | | 300,114 | |
Cia Paranaense de Energia—ADR, 16.012%(d) | | | 3,718 | | | | 24,390 | |
| | | | | | |
|
|
|
| | | | | | | | 324,504 | |
| | | | | | |
|
|
|
TOTAL PREFERRED STOCKS (Cost $4,225,023) | | | | | | | 3,621,202 | |
| | | | | | |
|
|
|
| EXCHANGE-TRADED FUNDS—0.99% | | | | | | | | |
iShares MSCI EAFE ETF(c) | | | 51,301 | | | | 3,165,272 | |
Vanguard FTSE Emerging Markets ETF(c) | | | 11,699 | | | | 481,180 | |
Vanguard Large-Cap ETF | | | 24,353 | | | | 4,405,457 | |
Vanguard Small-Cap ETF | | | 6,134 | | | | 1,163,681 | |
| | | | | | |
|
|
|
TOTAL EXCHANGE-TRADED FUNDS (Cost $9,079,601) | | | | | | | 9,215,590 | |
| | | | | | |
|
|
|
| REAL ESTATE INVESTMENT TRUSTS—2.33% | | | | | | | | |
Heavy and Civil Engineering Construction—0.05% | | | | | | | | |
British Land Co. PLC—ADR | | | 19,291 | | | | 95,876 | |
Cyrela Brazil Realty SA Empreendimentos e Participacoes—ADR | | | 65,373 | | | | 187,947 | |
Paramount Group, Inc.(c) | | | 30,811 | | | | 213,521 | |
| | | | | | |
|
|
|
| | | | | | | | 497,344 | |
| | | | | | |
|
|
|
Real Estate—1.94% | | | | | | | | |
Alexander & Baldwin, Inc. | | | 6,237 | | | | 116,819 | |
Annaly Capital Mangement, Inc.(c) | | | 80,357 | | | | 518,303 | |
Apple Hospitality REIT, Inc. | | | 27,450 | | | | 436,730 | |
AvalonBay Communities, Inc. | | | 2,600 | | | | 522,366 | |
Boston Properties, Inc. | | | 5,579 | | | | 443,140 | |
Brixmor Property Group, Inc. | | | 23,482 | | | | 504,393 | |
Broadstone Net Lease, Inc. | | | 31,436 | | | | 601,685 | |
CoreCivic, Inc.(a) | | | 20,254 | | | | 193,021 | |
Cousins Properties, Inc.(c) | | | 16,731 | | | | 449,227 | |
DiamondRock Hospitality Co.(a) | | | 27,325 | | | | 238,547 | |
EPR Properties (c) | | | 9,065 | | | | 394,237 | |
Equity Residential | | | 12,704 | | | | 929,679 | |
Franklin Street Properties Corp. | | | 45,626 | | | | 128,209 | |
Gaming and Leisure Properties, Inc. | | | 10,921 | | | | 527,157 | |
GEO Group, Inc.(a)(c) | | | 25,960 | | | | 212,353 | |
Getty Realty Corp. | | | 4,760 | | | | 143,181 | |
The accompanying notes are an integral part of these financial statements.
68
PMC DIVERSIFIED EQUITY FUND | Schedule of Investments |
August 31, 2022 (Continued)
| | | | | | | | |
| | |
| | | Shares
| | | Value
| |
Highwoods Properties, Inc. | | | 9,495 | | | $ | 288,743 | |
Host Hotels & Resorts, Inc.(c) | | | 91,972 | | | | 1,634,341 | |
iStar, Inc. | | | 16,430 | | | | 226,241 | |
Kimco Realty Corp. | | | 27,626 | | | | 582,356 | |
Mid-America Apartment Communities, Inc. | | | 8,619 | | | | 1,427,909 | |
Office Properties Income Trust(c) | | | 10,519 | | | | 184,819 | |
PotlatchDeltic Corp.(c) | | | 9,223 | | | | 428,132 | |
Public Storage | | | 1,132 | | | | 374,500 | |
Rayonier, Inc. | | | 13,465 | | | | 478,277 | |
Redwood Trust, Inc. | | | 809 | | | | 6,270 | |
Regency Centers Corp. | | | 33,410 | | | | 2,032,663 | |
Rithm Capital Corp.(c) | | | 83,202 | | | | 784,595 | |
RPT Realty | | | 9,758 | | | | 93,970 | |
Simon Property Group, Inc. | | | 9,033 | | | | 921,185 | |
SITE Centers Corp. | | | 33,532 | | | | 434,575 | |
Tanger Factory Outlet Centers, Inc.(c) | | | 5,731 | | | | 88,372 | |
Urstadt Biddle Properties, Inc.—Class A | | | 13,777 | | | | 230,351 | |
Ventas, Inc. | | | 506 | | | | 24,217 | |
VICI Properties, Inc.(c) | | | 584 | | | | 19,266 | |
Welltower, Inc.(c) | | | 5,204 | | | | 398,887 | |
WP Carey, Inc.(c) | | | 12,661 | | | | 1,063,904 | |
| | | | | | |
|
|
|
| | | | | | | | 18,082,620 | |
| | | | | | |
|
|
|
Securities, Commodity Contracts, and Other Financial Investments and Related
Activities—0.03% | | | | | | | | |
Medical Properties Trust, Inc.(c) | | | 20,137 | | | | 294,202 | |
| | | | | | |
|
|
|
Telecommunications—0.03% | | | | | | | | |
Uniti Group, Inc. | | | 33,576 | | | | 315,279 | |
| | | | | | |
|
|
|
Warehousing and Storage—0.17% | | | | | | | | |
Extra Space Storage, Inc. | | | 2,388 | | | | 474,567 | |
Iron Mountain, Inc.(c) | | | 20,074 | | | | 1,056,093 | |
| | | | | | |
|
|
|
| | | | | | | | 1,530,660 | |
| | | | | | |
|
|
|
Wood Product Manufacturing—0.11% | | | | | | | | |
Weyerhaeuser Co. | | | 28,593 | | | | 976,737 | |
| | | | | | |
|
|
|
TOTAL REAL ESTATE INVESTMENT TRUSTS (Cost $22,494,695) | | | | | | | 21,696,842 | |
| | | | | | |
|
|
|
| RIGHTS—0.00% | | | | | | | | |
Chemical Manufacturing—0.00% | | | | | | | | |
Cellect Biotechnology CVR(a)(e)(g) | | | 620,000 | | | | 0 | |
| | | | | | |
|
|
|
TOTAL RIGHTS (Cost $0) | | | | | | | 0 | |
| | | | | | |
|
|
|
| INVESTMENTS PURCHASED WITH COLLATERAL FROM SECURITIES LENDING—13.20% | | | | | | | | |
Money Market Fund—13.20% | | | | | | | | |
Mount Vernon Liquid Assets Portfolio, LLC, 2.440%(f) | | | 122,945,367 | | | | 122,945,367 | |
| | | | | | |
|
|
|
TOTAL INVESTMENTS PURCHASED WITH COLLATERAL FROM SECURITIES LENDING (Cost $122,945,367) | | | | | | | 122,945,367 | |
| | | | | | |
|
|
|
The accompanying notes are an integral part of these financial statements.
69
PMC DIVERSIFIED EQUITY FUND | Schedule of Investments |
August 31, 2022 (Continued)
| | | | | | | | |
| | |
| | | Shares
| | | Value
| |
| SHORT-TERM INVESTMENTS—0.49% | | | | | | | | |
First American Government Obligations Fund, Class X, 2.039%(f) | | | 4,542,948 | | | | 4,542,948 | |
| | | | | | |
|
|
|
TOTAL SHORT-TERM INVESTMENTS (Cost $4,542,948) | | | | | | | 4,542,948 | |
| | | | | | |
|
|
|
Total Investments (Cost $973,086,394)—112.87% | | | | | | | 1,051,360,438 | |
Liabilities in Excess of Other Assets—(12.87)% | | | | | | | (119,851,375 | ) |
| | | | | | |
|
|
|
TOTAL NET ASSETS—100.00% | | | | | | $ | 931,509,063 | |
| | | | | | |
|
|
|
Percentages are stated as a percent of net assets.
| (a) | | Non-income producing security. |
| (b) | | Foreign issued security. |
| (c) | | All or portion of this security is out on loan as of August 31, 2022. Total value of securities out on loan is $118,873,615. |
| (d) | | Perpetual preferred stock with no stated maturity. |
| (e) | | Represents an illiquid security. The total market value of these securities were $792,131, representing 0.09% of net assets. |
| (f) | | The rate shown represents the seven day yield at August 31, 2022. |
| (g) | | Fair valued security. Value determined using significant unobservable inputs. |
| | |
| | | Abbreviations |
| AB | | Aktiebolag is a Swedish term for a stock company. |
| ADR | | American Depositary Receipt |
| AG | | Aktiengesellschaft is a German term that refers to a corporation that is limited by shares, i.e. owned by shareholders. |
| A/S | | An abbreviation used by many countries to signify a stock company whereby shareholders have limited liability. |
| ASA | | Allmennaksjeselskap is a Norwegian term for a stock company. |
| KGaA | | Kommanditgesellschaft auf Aktien is a German term that refers to a Limited Partnership that has shares. |
| NV | | Naamloze Vennootschap is a Dutch term for publicly traded companies. |
| OYJ | | Julkinen osakeyhtio is a Finnish term for publicly-traded companies. |
| PJSC | | An abbreviation used by many countries to signify an open joint-stock company. |
| PLC | | Public Limited Company is a publicly traded company which signifies that shareholders have limited liability. |
| SA | | An abbreviation used by many countries to signify a publicly traded company. |
| SAB de CV | | Sociedad Anonima de Capital Variable is a Spanish term for an SA with variable capital. |
| SE | | Societas Europea is a term for a European Public Limited Liability Company. |
| SpA | | Soicieta per Azioni is an Italian term for limited share company. |
The accompanying notes are an integral part of these financial statements.
70
PMC Funds
August 31, 2022
| | | | | | | | |
| Statements of Assets and Liabilities | |
| | | Core Fixed
Income Fund
| | | Diversified
Equity Fund
| |
| Assets | | | | | | | | |
Investments, at value(1)(2) | | $ | 478,183,553 | | | $ | 1,051,360,438 | |
Cash | | | — | | | | 1,339 | |
Receivables: | | | | | | | | |
Investments sold | | | 2,555,166 | | | | — | |
Dividends and interest | | | 3,002,406 | | | | 3,614,655 | |
Fund shares sold | | | 234,513 | | | | 519,483 | |
Securities lending | | | 4,223 | | | | 107,143 | |
Other Assets | | | 26,759 | | | | 27,787 | |
| | |
|
|
| |
|
|
|
Total Assets | | | 484,006,620 | | | | 1,055,630,845 | |
| | |
|
|
| |
|
|
|
| Liabilities | | | | | | | | |
Payables: | | | | | | | | |
Investments purchased | | | 27,370,559 | | | | — | |
Fund shares redeemed | | | 351,158 | | | | 437,001 | |
Collateral on securities loaned | | | 23,745,201 | | | | 122,945,367 | |
Affiliates | | | 142,996 | | | | 210,155 | |
Adviser | | | 120,423 | | | | 438,444 | |
Distributor | | | 10,573 | | | | 24,093 | |
Accrued expenses and other liabilities | | | 62,543 | | | | 66,722 | |
| | |
|
|
| |
|
|
|
Total Liabilities | | | 51,803,453 | | | | 124,121,782 | |
| | |
|
|
| |
|
|
|
| Net Assets | | $ | 432,203,167 | | | $ | 931,509,063 | |
| | |
|
|
| |
|
|
|
| Net assets consist of: | | | | | | | | |
Paid-in capital | | $ | 483,402,395 | | | $ | 832,784,739 | |
Total distributable earnings (deficit) | | | (51,199,228 | ) | | | 98,724,324 | |
| | |
|
|
| |
|
|
|
| Net assets | | $ | 432,203,167 | | | $ | 931,509,063 | |
| | |
|
|
| |
|
|
|
| Advisor Class Shares | | | | | | | | |
Net assets | | | 48,722,652 | | | | 107,003,790 | |
Shares of beneficial interest outstanding (unlimited shares of $0.001 par value authorized) | | | 3,211,364 | | | | 4,141,962 | |
Net asset value and redemption price per share | | $ | 15.17 | | | $ | 25.83 | |
| | |
|
|
| |
|
|
|
| Institutional Class Shares | | | | | | | | |
Net assets | | | 383,480,515 | | | | 824,505,273 | |
Shares of beneficial interest outstanding (unlimited shares of $0.001 par value authorized) | | | 25,381,781 | | | | 32,019,676 | |
Net asset value and redemption price per share | | $ | 15.11 | | | $ | 25.75 | |
| | |
|
|
| |
|
|
|
(1) Cost of investments | | $ | 520,721,799 | | | $ | 973,086,394 | |
(2) Includes loaned securities with a value of | | $ | 23,131,553 | | | $ | 118,873,615 | |
The accompanying notes are an integral part of these financial statements.
71
PMC Funds
For the Year Ended August 31, 2022
| | | | | | | | |
| Statements of Operations | |
| | |
| | | Core Fixed
Income Fund
| | | Diversified
Equity Fund
| |
| Investment Income: | | | | | | | | |
Interest | | $ | 10,936,593 | | | $ | 20,549 | |
Dividends | | | — | | | | 23,833,717 | (1) |
Securities lending | | | 47,686 | | | | 1,426,002 | |
| | |
|
|
| |
|
|
|
| | | | 10,984,279 | | | | 25,280,268 | |
| | |
|
|
| |
|
|
|
| Expenses: | | | | | | | | |
Investment management fees | | | 3,011,835 | | | | 5,567,167 | |
Transfer agent fees and expenses | | | 325,485 | | | | 442,611 | |
Fund accounting fees | | | 233,920 | | | | 271,745 | |
Fund administration fees | | | 217,643 | | | | 457,461 | |
Distribution fees—Advisor Class | | | 142,117 | | | | 338,697 | |
Custody fees | | | 76,691 | | | | 109,294 | |
Reports to shareholders | | | 59,040 | | | | 81,270 | |
Federal and state registration fees | | | 55,785 | | | | 59,794 | |
Audit and tax fees | | | 41,399 | | | | 39,894 | |
Legal fees | | | 18,619 | | | | 23,090 | |
Trustees’ fees | | | 17,738 | | | | 17,748 | |
Chief Compliance Officer fees | | | 17,500 | | | | 12,496 | |
Insurance fees | | | 5,455 | | | | 8,559 | |
Other expenses | | | 9,229 | | | | 16,413 | |
| | |
|
|
| |
|
|
|
Total expenses before waiver or recoupment | | | 4,232,456 | | | | 7,446,239 | |
Recoupment or (waivers) by Adviser (Note 4) | | | (1,309,991 | ) | | | — | |
| | |
|
|
| |
|
|
|
Net expenses | | | 2,922,465 | | | | 7,446,239 | |
| | |
|
|
| |
|
|
|
| Net Investment Income | | | 8,061,814 | | | | 17,834,029 | |
| | |
|
|
| |
|
|
|
| Realized and Unrealized Gain (Loss): | | | | | | | | |
Net realized gain (loss) on: | | | | | | | | |
Investments | | | (13,664,537 | ) | | | 18,110,180 | |
Foreign currency translations | | | — | | | | 14 | |
| | |
|
|
| |
|
|
|
| | | | (13,664,537 | ) | | | 18,110,194 | |
| | |
|
|
| |
|
|
|
Net change in unrealized appreciation (depreciation) on: | | | | | | | | |
Investments | | | (53,405,265 | ) | | | (204,917,453 | ) |
Foreign currency translations | | | — | | | | (126 | ) |
| | |
|
|
| |
|
|
|
| | | | (53,405,265 | ) | | | (204,917,579 | ) |
| | |
|
|
| |
|
|
|
Net loss on investments and foreign currency | | | (67,069,802 | ) | | | (186,807,385 | ) |
| | |
|
|
| |
|
|
|
Net Decrease in Net Assets Resulting from Operations | | $ | (59,007,988 | ) | | $ | (168,973,356 | ) |
| | |
|
|
| |
|
|
|
| (1) | | Net of $2,415,822 in foreign withholding tax and ADR issuance fees. |
The accompanying notes are an integral part of these financial statements.
72
PMC Funds
| | | | | | | | |
| Statements of Changes in Net Assets | |
| |
| | | Core Fixed Income Fund
| |
| | |
| | | Year Ended
August 31,
2022
| | | Year Ended
August 31,
2021
| |
| Operations: | | | | | | | | |
Net investment income | | $ | 8,061,814 | | | $ | 7,110,881 | |
Net realized gain (loss) on investments, futures and foreign currency | | | (13,664,537 | ) | | | 7,477,962 | |
Net change in unrealized depreciation | | | (53,405,265 | ) | | | (7,198,752 | ) |
| | |
|
|
| |
|
|
|
Net increase (decrease) in net assets resulting from operations | | | (59,007,988 | ) | | | 7,390,091 | |
| | |
| Dividends and distributions to shareholders: | | | | | | | | |
Net dividends and distributions—Advisor Class | | | (1,595,925 | ) | | | (4,064,480 | ) |
Net dividends and distributions—Institutional Class | | | (12,321,690 | ) | | | (20,452,703 | ) |
| | |
|
|
| |
|
|
|
Net decrease in net assets resulting from distributions paid | | | (13,917,615 | ) | | | (24,517,183 | ) |
| | |
|
|
| |
|
|
|
| Fund share transactions: | | | | | | | | |
Shares sold—Advisor Class | | | 7,168,556 | | | | 4,134,908 | |
Shares issued to holders in reinvestment of dividends—Advisor Class | | | 1,491,948 | | | | 3,818,627 | |
Shares redeemed—Advisor Class | | | (14,596,658 | ) | | | (62,391,307 | ) |
Shares sold—Institutional Class | | | 86,898,216 | | | | 179,959,869 | |
Shares issued to holders in reinvestment of dividends—Institutional Class | | | 12,049,084 | | | | 20,024,965 | |
Shares redeemed—Institutional Class | | | (69,108,827 | ) | | | (53,069,953 | ) |
| | |
|
|
| |
|
|
|
Net increase in net assets from share transactions | | | 23,902,319 | | | | 92,477,109 | |
| | |
|
|
| |
|
|
|
Net increase (decrease) in net assets | | | (49,023,284 | ) | | | 75,350,017 | |
| | |
| Net Assets: | | | | | | | | |
Beginning of year | | | 481,226,451 | | | | 405,876,434 | |
| | |
|
|
| |
|
|
|
End of year | | $ | 432,203,167 | | | $ | 481,226,451 | |
| | |
|
|
| |
|
|
|
| Change in shares outstanding: | | | | | | | | |
Shares sold—Advisor Class | | | 441,871 | | | | 234,017 | |
Shares issued to holders in reinvestment of dividends—Advisor Class | | | 87,096 | | | | 215,498 | |
Shares redeemed—Advisor Class | | | (907,842 | ) | | | (3,414,719 | ) |
Shares sold—Institutional Class | | | 5,358,720 | | | | 10,068,312 | |
Shares issued to holders in reinvestment of dividends—Institutional Class | | | 707,521 | | | | 1,136,491 | |
Shares redeemed—Institutional Class | | | (4,317,982 | ) | | | (2,983,602 | ) |
| | |
|
|
| |
|
|
|
Net increase | | | 1,369,384 | | | | 5,255,997 | |
| | |
|
|
| |
|
|
|
The accompanying notes are an integral part of these financial statements.
73
PMC Funds
| | | | | | | | |
| Statements of Changes in Net Assets | |
| |
| | | Diversified Equity Fund
| |
| | |
| | | Year Ended
August 31,
2022
| | | Year Ended
August 31,
2021
| |
| Operations: | | | | | | | | |
Net investment income | | $ | 17,834,029 | | | $ | 13,959,216 | |
Net realized gain on investments and foreign currency | | | 18,110,194 | | | | 119,595,822 | |
Net change in unrealized appreciation (depreciation) | | | (204,917,579 | ) | | | 140,721,927 | |
| | |
|
|
| |
|
|
|
Net increase (decrease) in net assets resulting from operations | | | (168,973,356 | ) | | | 274,276,965 | |
| | |
| Dividends and distributions to shareholders: | | | | | | | | |
Net dividends and distributions—Advisor Class | | | (12,392,239 | ) | | | (1,540,826 | ) |
Net dividends and distributions—Institutional Class | | | (84,074,812 | ) | | | (10,631,418 | ) |
| | |
|
|
| |
|
|
|
Net decrease in net assets resulting from distributions paid | | | (96,467,051 | ) | | | (12,172,244 | ) |
| | |
|
|
| |
|
|
|
| Fund share transactions: | | | | | | | | |
Shares sold—Advisor Class | | | 7,572,421 | | | | 4,681,522 | |
Shares issued to holders in reinvestment of dividends—Advisor Class | | | 11,072,585 | | | | 1,380,271 | |
Shares redeemed—Advisor Class | | | (32,248,448 | ) | | | (125,342,856 | ) |
Shares sold—Institutional Class | | | 160,802,988 | | | | 231,207,438 | |
Shares issued to holders in reinvestment of dividends—Institutional Class | | | 81,786,080 | | | | 10,355,065 | |
Shares redeemed—Institutional Class | | | (134,799,799 | ) | | | (180,695,062 | ) |
| | |
|
|
| |
|
|
|
Net increase (decrease) in net assets from share transactions | | | 94,185,827 | | | | (58,413,622 | ) |
| | |
|
|
| |
|
|
|
Net increase (decrease) in net assets | | | (171,254,580 | ) | | | 203,691,099 | |
| | |
| Net Assets: | | | | | | | | |
Beginning of year | | | 1,102,763,643 | | | | 899,072,544 | |
| | |
|
|
| |
|
|
|
End of year | | $ | 931,509,063 | | | $ | 1,102,763,643 | |
| | |
|
|
| |
|
|
|
| Change in shares outstanding: | | | | | | | | |
Shares sold—Advisor Class | | | 250,610 | | | | 150,813 | |
Shares issued to holders in reinvestment of dividends—Advisor Class | | | 363,274 | | | | 48,842 | |
Shares redeemed—Advisor Class | | | (1,120,394 | ) | | | (4,727,688 | ) |
Shares sold—Institutional Class | | | 5,455,371 | | | | 8,270,058 | |
Shares issued to holders in reinvestment of dividends—Institutional Class | | | 2,696,541 | | | | 367,722 | |
Shares redeemed—Institutional Class | | | (4,671,737 | ) | | | (6,047,878 | ) |
| | |
|
|
| |
|
|
|
Net increase (decrease) | | | 2,973,665 | | | | (1,938,131 | ) |
| | |
|
|
| |
|
|
|
The accompanying notes are an integral part of these financial statements.
74
PMC Core Fixed Income Fund—Advisor Class
| | | | | | | | | | | | | | | | | | | | |
| Financial Highlights | | | | | | | | | | | | | | | |
| |
| | | Per Share Data for a Share Outstanding Throughout Each Year | |
| | | | | |
| | | Year
Ended
August 31,
2022
| | | Year
Ended
August 31,
2021
| | | Year
Ended
August 31,
2020
| | | Year
Ended
August 31,
2019
| | | Year
Ended
August 31,
2018
| |
Net asset value, beginning of year | | $ | 17.74 | | | $ | 18.50 | | | $ | 17.65 | | | $ | 16.53 | | | $ | 17.05 | |
| | |
|
|
| |
|
|
| |
|
|
| |
|
|
| |
|
|
|
| Income from investment operations: | | | | | | | | | | | | | | | | | | | | |
Net investment income(1) | | | 0.25 | | | | 0.27 | | | | 0.35 | | | | 0.42 | | | | 0.37 | |
Net realized and unrealized gain (loss) | | | (2.36 | ) | | | 0.01 | | | | 0.92 | | | | 1.09 | | | | (0.61 | ) |
| | |
|
|
| |
|
|
| |
|
|
| |
|
|
| |
|
|
|
Total from investment operations | | | (2.11 | ) | | | 0.28 | | | | 1.27 | | | | 1.51 | | | | (0.24 | ) |
| | |
|
|
| |
|
|
| |
|
|
| |
|
|
| |
|
|
|
| Less distributions paid: | | | | | | | | | | | | | | | | | | | | |
Dividends from net investment income | | | (0.24 | ) | | | (0.33 | ) | | | (0.40 | ) | | | (0.39 | ) | | | (0.28 | ) |
Distributions from net realized gains | | | (0.22 | ) | | | (0.71 | ) | | | (0.02 | ) | | | — | | | | 0.00 | (2) |
| | |
|
|
| |
|
|
| |
|
|
| |
|
|
| |
|
|
|
Total distributions paid | | | (0.46 | ) | | | (1.04 | ) | | | (0.42 | ) | | | (0.39 | ) | | | (0.28 | ) |
| | |
|
|
| |
|
|
| |
|
|
| |
|
|
| |
|
|
|
Net asset value, end of year | | $ | 15.17 | | | $ | 17.74 | | | $ | 18.50 | | | $ | 17.65 | | | $ | 16.53 | |
| | |
|
|
| |
|
|
| |
|
|
| |
|
|
| |
|
|
|
Total return | | | -12.20 | % | | | 1.53 | % | | | 7.39 | % | | | 9.37 | % | | | -1.42 | % |
| | | | | |
| Ratios / supplemental data | | | | | | | | | | | | | | | | | | | | |
Net assets, end of year (000’s) | | $ | 48,723 | | | $ | 63,678 | | | $ | 121,267 | | | $ | 399,389 | | | $ | 398,089 | |
Ratio of expenses to average net assets before waiver and reimbursements | | | 1.13 | % | | | 1.22 | % | | | 1.31 | % | | | 1.28 | % | | | 1.30 | % |
Ratio of expenses to average net assets after waiver and reimbursements | | | 0.85 | % | | | 0.92 | %(4) | | | 1.00 | % (3) | | | 1.00 | %(3) | | | 1.00 | %(3) |
Ratio of net investment income to average net assets before waiver and reimbursements | | | 1.22 | % | | | 1.22 | % | | | 1.72 | % | | | 2.22 | % | | | 1.91 | % |
Ratio of net investment income to average net assets after waiver and reimbursements | | | 1.50 | % | | | 1.52 | % | | | 2.03 | % | | | 2.50 | % | | | 2.21 | % |
Portfolio turnover rate | | | 201.7 | % | | | 227.0 | % | | | 180.7 | % | | | 144.3 | % | | | 160.1 | % |
| (1) | | Per share net investment income was calculated using average shares outstanding. |
| (2) | | Round to less than 0.5 cent per share. |
| (3) | | Reflects expense cap of 0.75% (plus Rule 12b-1 fees of 0.25%). |
| (4) | | Effective January 26, 2021, the expense limitation cap was reduced from 0.75% to 0.60% (plus Rule 12b-1 fees of 0.25%). |
The accompanying notes are an integral part of these financial statements.
75
PMC Core Fixed Income Fund—Institutional Class
| | | | | | | | | | | | | | | | |
| Financial Highlights | | | | | | | | | | | | |
|
| Per Share Data for a Share Outstanding Throughout Each Year/Period | |
| | | | |
| | | Year
Ended
August 31,
2022
| | | Year
Ended
August 31,
2021
| | | Year
Ended
August 31,
2020
| | | Period
Ended
August 31,
2019(1)
| |
Net asset value, beginning of year/period | | $ | 17.67 | | | $ | 18.47 | | | $ | 17.66 | | | $ | 17.23 | |
| | |
|
|
| |
|
|
| |
|
|
| |
|
|
|
| Income from investment operations: | | | | | | | | | | | | | | | | |
Net investment income(2) | | | 0.29 | | | | 0.30 | | | | 0.39 | | | | 0.07 | |
Net realized and unrealized gain (loss) | | | (2.35 | ) | | | 0.02 | | | | 0.92 | | | | 0.36 | |
| | |
|
|
| |
|
|
| |
|
|
| |
|
|
|
Total from investment operations | | | (2.06 | ) | | | 0.32 | | | | 1.31 | | | | 0.43 | |
| | |
|
|
| |
|
|
| |
|
|
| |
|
|
|
| Less distributions paid: | | | | | | | | | | | | | | | | |
Dividends from net investment income | | | (0.28 | ) | | | (0.41 | ) | | | (0.48 | ) | | | — | |
Distributions from net realized gains | | | (0.22 | ) | | | (0.71 | ) | | | (0.02 | ) | | | — | |
| | |
|
|
| |
|
|
| |
|
|
| |
|
|
|
Total distributions paid | | | (0.50 | ) | | | (1.12 | ) | | | (0.50 | ) | | | — | |
| | |
|
|
| |
|
|
| |
|
|
| |
|
|
|
Net asset value, end of year/period | | $ | 15.11 | | | $ | 17.67 | | | $ | 18.47 | | | $ | 17.66 | |
| | |
|
|
| |
|
|
| |
|
|
| |
|
|
|
Total return(3) | | | -11.95 | % | | | 1.77 | % | | | 7.65 | % | | | 2.50 | % |
| | | | |
| Ratios / supplemental data | | | | | | | | | | | | | | | | |
Net assets, end of year/period (000’s) | | $ | 383,481 | | | $ | 417,548 | | | $ | 284,610 | | | $ | 1 | |
Ratio of expenses to average net assets before waiver and reimbursements(4) | | | 0.88 | % | | | 0.96 | % | | | 1.06 | % | | | 0.75 | % |
Ratio of expenses to average net assets after waiver and reimbursements(4) | | | 0.60 | % | | | 0.66 | % (5) | | | 0.75 | % | | | 0.75 | % |
Ratio of net investment income to average net assets before waiver and reimbursements(4) | | | 1.49 | % | | | 1.42 | % | | | 1.87 | % | | | 2.33 | % |
Ratio of net investment income to average net assets after waiver and reimbursements(4) | | | 1.77 | % | | | 1.72 | % | | | 2.18 | % | | | 2.33 | % |
Portfolio turnover rate(3) | | | 201.7 | % | | | 227.0 | % | | | 180.7 | % | | | 144.3 | % |
| (1) | | Institutional Class shares commenced operations on July 1, 2019. |
| (2) | | Per share net investment income was calculated using average shares outstanding. |
| (3) | | Not annualized for periods less than one year. |
| (4) | | Annualized for periods less than one year. |
| (5) | | Effective January 26, 2021, the expense limitation cap was reduced from 0.75% to 0.60%. |
The accompanying notes are an integral part of these financial statements.
76
PMC Diversified Equity Fund—Advisor Class
| | | | | | | | | | | | | | | | | | | | |
| Financial Highlights | |
| |
| | | Per Share Data for a Share Outstanding Throughout Each Year | |
| | | | | |
| | | Year
Ended
August 31,
2022
| | | Year
Ended
August 31,
2021
| | | Year
Ended
August 31,
2020
| | | Year
Ended
August 31,
2019
| | | Year
Ended
August 31,
2018
| |
Net asset value, beginning of year | | $ | 33.27 | | | $ | 25.61 | | | $ | 23.77 | | | $ | 28.40 | | | $ | 26.68 | |
| | |
|
|
| |
|
|
| |
|
|
| |
|
|
| |
|
|
|
| Income (loss) from investment operations: | | | | | | | | | | | | | | | | | | | | |
Net investment income(1) | | | 0.43 | | | | 0.32 | | | | 0.29 | | | | 0.34 | | | | 0.19 | |
Net realized and unrealized gain (loss) | | | (5.10 | ) | | | 7.61 | | | | 1.86 | | | | (2.21 | ) | | | 3.08 | |
| | |
|
|
| |
|
|
| |
|
|
| |
|
|
| |
|
|
|
Total from investment operations | | | (4.67 | ) | | | 7.93 | | | | 2.15 | | | | (1.87 | ) | | | 3.27 | |
| | |
|
|
| |
|
|
| |
|
|
| |
|
|
| |
|
|
|
| Less distributions paid: | | | | | | | | | | | | | | | | | | | | |
Dividends from net investment income | | | (0.53 | ) | | | (0.27 | ) | | | (0.31 | ) | | | (0.17 | ) | | | (0.17 | ) |
Distributions from net realized gains | | | (2.24 | ) | | | — | | | | — | | | | (2.59 | ) | | | (1.38 | ) |
| | |
|
|
| |
|
|
| |
|
|
| |
|
|
| |
|
|
|
Total distributions paid | | | (2.77 | ) | | | (0.27 | ) | | | (0.31 | ) | | | (2.76 | ) | | | (1.55 | ) |
| | |
|
|
| |
|
|
| |
|
|
| |
|
|
| |
|
|
|
Net asset value, end of year | | $ | 25.83 | | | $ | 33.27 | | | $ | 25.61 | | | $ | 23.77 | | | $ | 28.40 | |
| | |
|
|
| |
|
|
| |
|
|
| |
|
|
| |
|
|
|
Total return | | | -15.34 | % | | | 31.20 | % | | | 9.01 | % | | | -5.54 | % | | | 12.50 | % |
| | | | | |
| Ratios / supplemental data | | | | | | | | | | | | | | | | | | | | |
Net assets, end of year (000’s) | | $ | 107,004 | | | $ | 154,671 | | | $ | 235,018 | | | $ | 818,269 | | | $ | 844,442 | |
Ratio of expenses to average net assets before waiver, expense reimbursements or recoupment | | | 0.93 | % | | | 0.93 | % | | | 0.95 | % | | | 0.94 | % | | | 1.26 | % |
Ratio of expenses to average net assets after waiver, expense reimbursements or recoupment | | | 0.93 | % | | | 0.97 | %(2) | | | 0.98 | %(2) | | | 0.98 | %(2) | | | 1.25 | %(3) |
Ratio of net investment income to average net assets before waiver, expense reimbursements or recoupment | | | 1.46 | % | | | 1.14 | % | | | 1.21 | % | | | 1.42 | % | | | 0.67 | % |
Ratio of net investment income to average net assets after waiver, expense reimbursements or recoupment | | | 1.46 | % | | | 1.10 | % | | | 1.18 | % | | | 1.38 | % | | | 0.68 | % |
Portfolio turnover rate | | | 59.6 | % | | | 72.3 | % | | | 55.1 | % | | | 111.4 | % | | | 104.3 | % |
| (1) | | Per share net investment income was calculated using average shares outstanding. |
| (2) | | Reflects expense cap of 0.73% (plus Rule 12b-1 fees of 0.25%). |
| (3) | | Effective June 1, 2018 the expense limitation cap was reduced from 1.35% to 0.98%. This reflects the expense limitation cap of 1.10% from September 1, 2017 through May 31, 2018 (plus Rule 12b-1 fees of 0.25%) and 0.73% from June 1, 2018 through August 31, 2018 (plus Rule 12b-1 fees of 0.25%). |
The accompanying notes are an integral part of these financial statements.
77
PMC Diversified Equity Fund—Institutional Class
| | | | | | | | | | | | | | | | |
| Financial Highlights | |
|
| Per Share Data for a Share Outstanding Throughout Each Year/Period | |
| | | | |
| | | Year
Ended
August 31,
2022
| | | Year
Ended
August 31,
2021
| | | Year
Ended
August 31,
2020
| | | Period
Ended
August 31,
2019(1)
| |
Net asset value, beginning of year/period | | $ | 33.22 | | | $ | 25.59 | | | $ | 23.78 | | | $ | 24.69 | |
| | |
|
|
| |
|
|
| |
|
|
| |
|
|
|
| Income from investment operations: | | | | | | | | | | | | | | | | |
Net investment income(2) | | | 0.51 | | | | 0.42 | | | | 0.39 | | | | 0.06 | |
Net realized and unrealized gain (loss) | | | (5.09 | ) | | | 7.58 | | | | 1.84 | | | | (0.97 | ) |
| | |
|
|
| |
|
|
| |
|
|
| |
|
|
|
Total from investment operations | | | (4.58 | ) | | | 8.00 | | | | 2.23 | | | | (0.91 | ) |
| | |
|
|
| |
|
|
| |
|
|
| |
|
|
|
| Less distributions paid: | | | | | | | | | | | | | | | | |
Dividends from net investment income | | | (0.65 | ) | | | (0.37 | ) | | | (0.42 | ) | | | — | |
Distributions from net realized gains | | | (2.24 | ) | | | — | | | | — | | | | — | |
| | |
|
|
| |
|
|
| |
|
|
| |
|
|
|
Total distributions paid | | | (2.89 | ) | | | (0.37 | ) | | | (0.42 | ) | | | — | |
| | |
|
|
| |
|
|
| |
|
|
| |
|
|
|
Net asset value, end of year/period | | $ | 25.75 | | | $ | 33.22 | | | $ | 25.59 | | | $ | 23.78 | |
| | |
|
|
| |
|
|
| |
|
|
| |
|
|
|
Total return(3) | | | -15.13 | % | | | 31.56 | % | | | 9.36 | % | | | -3.69 | % |
| | | | |
| Ratios / supplemental data | | | | | | | | | | | | | | | | |
Net assets, end of year/period (000’s) | | $ | 824,505 | | | $ | 948,092 | | | $ | 664,055 | | | $ | 1 | |
Ratio of expenses to average net assets(4) | | | 0.68 | % | | | 0.68 | % | | | 0.71 | % | | | 0.73 | % |
Ratio of net investment income to average net assets(4) | | | 1.73 | % | | | 1.43 | % | | | 1.64 | % | | | 1.42 | % |
Portfolio turnover rate(3) | | | 59.6 | % | | | 72.3 | % | | | 55.1 | % | | | 111.4 | % |
| (1) | | Institutional Class shares commenced operations on July 1, 2019. |
| (2) | | Per share net investment income was calculated using average shares outstanding. |
| (3) | | Not annualized for periods less than one year. |
| (4) | | Annualized for periods less than one year. |
The accompanying notes are an integral part of these financial statements.
78
PMC FUNDS
Notes to Financial Statements
August 31, 2022
Trust for Professional Managers (the “Trust”) was organized as a Delaware statutory trust under a Declaration of Trust dated May 29, 2001. The Trust is registered under the Investment Company Act of 1940, as amended (the “1940 Act”), as an open-end management investment company. Each of the PMC Funds (each, a “Fund” and together, the “Funds”) represents a distinct series with its own investment objective and policies within the Trust. The investment objective of the PMC Core Fixed Income Fund (the “Core Fixed Income Fund”) is to provide current income consistent with low volatility of principal. The investment objective of the PMC Diversified Equity Fund (the “Diversified Equity Fund”) is long-term capital appreciation. The Trust may issue an unlimited number of shares of beneficial interest at $0.001 par value. The Advisor Class of the Core Fixed Income Fund became effective and commenced operations on September 28, 2007. The Institutional Class of the Core Fixed Income Fund became effective and commenced operations on July 1, 2019. The Advisor Class of the Diversified Equity Fund became effective and commenced operations on August 26, 2009. The Institutional Class of the Diversified Equity Fund became effective and commenced operations on July 1, 2019. The Advisor Class shares are subject to a 0.25% Rule 12b-1 distribution fee. Each class of shares has identical rights and privileges except with respect to distribution fees and voting rights on matters affecting a single class of shares. Envestnet Asset Management, Inc. (the “Adviser”) serves as the Funds’ investment adviser. Neuberger Berman Investment Advisers LLC serves as the Core Fixed Income Fund’s sub-adviser.
The Funds are investment companies and accordingly follow the investment company accounting and reporting guidance of the Financial Accounting Standards Board (FASB) Accounting Standard Codification Topic 946 “Financial Services-Investment Companies”.
| (2) | | Significant Accounting Policies |
The following is a summary of significant accounting policies consistently followed by the Funds in the preparation of the financial statements. These policies are in conformity with accounting principles generally accepted in the United States of America (“GAAP”).
Each security owned by the Funds that is listed on a securities exchange, except for securities listed on the NASDAQ Stock Market, LLC (“NASDAQ”), is valued at its last sale price on that exchange on the date as of which assets are valued. If the security is listed on more than one exchange, the Funds will use the price of the exchange that the Funds generally consider to be the principal exchange on which the stock is traded.
Fund securities listed on the NASDAQ will be valued at the NASDAQ Official Closing Price, which may not necessarily represent the last sale price. If there has been no sale on such exchange or on NASDAQ on such day, the security is valued at the mean between the bid and asked prices on such day or at the latest sale price on the Composite Market (defined as the consolidation of the trade information provided by national securities and foreign exchanges and over-the-counter markets as published by an approved pricing service (“Pricing Service”)).
Debt securities, including short-term debt instruments having a maturity of 60 days or less, are valued at the mean in accordance with prices supplied by an approved Pricing Service. Pricing Services may use various valuation methodologies such as the mean between the bid and the asked prices, matrix pricing and other analytical pricing models as well as market transactions and dealer quotations. If a price is not available from a Pricing Service, the most recent quotation obtained from one or more broker-dealers know to follow the issue will be obtained. Quotations will be valued at the mean between the bid and the offer. Any discount or premium is accreted or amortized using the constant yield method over the life of the security, or where applicable, the first call date of the security.
Money market funds, demand notes and repurchase agreements are valued at cost. If cost does not represent current market value the securities will be priced at fair value.
Redeemable securities issued by open-end, registered investment companies are valued at the net asset values (“NAVs”) of such companies for purchase and/or redemption orders placed on that day. All exchange-traded funds are valued at the last reported sale price on the exchange on which the security is principally traded.
79
PMC FUNDS
Notes to Financial Statements, continued
August 31, 2022
Futures contracts are valued at the last settlement price at the close of trading on the relevant exchange or board of trade. Futures contracts for which reliable market quotations are not readily available shall each be valued at a price, supplied by a Pricing Service approved by the Trust’s Board of Trustees (the “Board”) which is in the opinion of such Pricing Service representative of the market value of such positions at the time of determination of the NAV, it being the opinion of the Board that the valuations supplied by such Pricing Service accurately reflect the fair value of such position.
Forward foreign currency contracts are valued at the mean between the bid and asked prices.
If market quotations are not readily available, any security or other financial instrument is valued at its fair value as determined under fair value pricing procedures approved by the Board. These fair value procedures will also be used to price a security when corporate events, events in the securities market and/or world events cause the Adviser to believe that a security’s last sale price may not reflect its actual market value. The intended effect of using fair value pricing procedures is to ensure that the Funds are accurately priced. The Board will regularly evaluate whether the Funds’ fair value pricing procedures continue to be appropriate in light of the specific circumstances of each Fund and the quality of prices obtained through application of such procedures by the Trust’s valuation committee.
FASB Accounting Standards Codification, “Fair Value Measurement” Topic 820 (“ASC 820”), establishes an authoritative definition of fair value and sets out a hierarchy for measuring fair value. ASC 820 requires an entity to evaluate certain factors to determine whether there has been a significant decrease in volume and level of activity for the security such that recent transactions and quoted prices may not be determinative of fair value and further analysis and adjustment may be necessary to estimate fair value. ASC 820 also requires enhanced disclosure regarding the inputs and valuation techniques used to measure fair value in those instances as well as expanded disclosure of valuation levels for major security types. These inputs are summarized in the three broad levels listed below:
| | • | | Level 1—Quoted prices in active markets for identical securities. |
| | • | | Level 2—Other significant observable inputs (including quoted prices for similar securities, interest rates, prepayment speeds, credit risk, etc.). |
| | • | | Level 3—Significant unobservable inputs (including the Funds’ own assumptions in determining the fair value of investments). |
The inputs or methodology used for valuing securities are not necessarily an indication of the risk associated with investing in those securities. The following is a summary of the inputs used to value the Funds’ investments carried at fair value as of August 31, 2022:
Core Fixed Income Fund
| | | | | | | | | | | | | | | | |
| | | Level 1
| | | Level 2
| | | Level 3
| | | Total
| |
| Fixed Income Securities | | | | | | | | | | | | | | | | |
Asset Backed Securities | | $ | — | | | $ | 38,534,566 | | | $ | — | | | $ | 38,534,566 | |
Corporate Bonds* | | | — | | | | 150,657,322 | | | | — | | | | 150,657,322 | |
Foreign Corporate Bonds* | | | — | | | | 33,784,488 | | | | — | | | | 33,784,488 | |
Foreign Government Agency Issues | | | — | | | | 4,378,357 | | | | — | | | | 4,378,357 | |
Foreign Government Notes/Bonds | | | — | | | | 9,284,017 | | | | — | | | | 9,284,017 | |
Non-Agency Mortgage Backed Securities | | | — | | | | 22,831,170 | | | | — | | | | 22,831,170 | |
Agency Mortgage Backed Securities | | | — | | | | 133,161,760 | | | | — | | | | 133,161,760 | |
U.S. Government Agency Issues | | | — | | | | 1,930,164 | | | | — | | | | 1,930,164 | |
U.S. Government Notes/Bonds | | | — | | | | 55,564,624 | | | | — | | | | 55,564,624 | |
| | |
|
|
| |
|
|
| |
|
|
| |
|
|
|
| Total Fixed Income Securities | | | — | | | | 450,126,468 | | | | — | | | | 450,126,468 | |
80
PMC FUNDS
Notes to Financial Statements, continued
August 31, 2022
| | | | | | | | | | | | | | | | |
| | | Level 1
| | | Level 2
| | | Level 3
| | | Total
| |
| Exchange-Traded Funds | | | 527,116 | | | | — | | | | — | | | | 527,116 | |
| Money Market Funds | | | 27,529,969 | | | | — | | | | — | | | | 27,529,969 | |
| | |
|
|
| |
|
|
| |
|
|
| |
|
|
|
| Total Investments in Securities | | $ | 28,057,085 | | | $ | 450,126,468 | | | $ | — | | | $ | 478,183,553 | |
| | |
|
|
| |
|
|
| |
|
|
| |
|
|
|
| | * | | For further breakdown by industry, please refer to the Schedule of Investments. |
The Fund did not hold any Level 3 securities during the year ended August 31, 2022.
Diversified Equity Fund
| | | | | | | | | | | | | | | | |
| | | Level 1
| | | Level 2
| | | Level 3^
| | | Total
| |
| Equity | | | | | | | | | | | | | | | | |
Common Stocks* | | $ | 885,034,922 | | | $ | 3,860,435 | | | $ | 443,132 | | | $ | 889,338,489 | |
Preferred Stocks* | | | 3,621,202 | | | | 0 | | | | — | | | | 3,621,202 | |
Exchange-Traded Funds | | | 9,215,590 | | | | — | | | | — | | | | 9,215,590 | |
Real Estate Investment Trusts* | | | 21,696,842 | | | | — | | | | — | | | | 21,696,842 | |
Rights* | | | — | | | | — | | | | 0 | | | | 0 | |
| | |
|
|
| |
|
|
| |
|
|
| |
|
|
|
| Total Equity | | | 919,568,556 | | | | 3,860,435 | | | | 443,132 | | | | 923,872,123 | |
| Money Market Funds | | | 127,488,315 | | | | — | | | | — | | | | 127,488,315 | |
| | |
|
|
| |
|
|
| |
|
|
| |
|
|
|
| Total Investments in Securities | | $ | 1,047,056,871 | | | $ | 3,860,435 | | | $ | 443,132 | | | $ | 1,051,360,438 | |
| | |
|
|
| |
|
|
| |
|
|
| |
|
|
|
| | * | | For further breakdown by industry, please refer to the Schedule of Investments. |
| | ^ | | The Fund measures Level 3 activity as of the end of each financial reporting period. |
As of August 31, 2022, the Fund held level 3 investments that were valued at the most recent trade price in an inactive market. The Level 3 investments in securities represented less than 1% of the Fund’s net assets and were not considered a significant portion of the Fund’s portfolio. As the Level 3 investments were not considered significant to the financial statements, a reconciliation of Level 3 investments for the year ended August 31, 2022 is not presented.
Foreign currencies and other assets denominated in foreign currencies are translated to U.S. dollars at the exchange rate of such currencies against the U.S. dollar using the applicable currency exchange rate as of the close of the New York Stock Exchange (“NYSE”), generally at 4:00 P.M., Eastern time.
The Funds may use certain options, futures and forward foreign currency contracts (collectively, “derivative instruments”) as a substitute for a comparable market position in the underlying security, to attempt to hedge or limit the exposure of a Fund’s position, to create a synthetic money market position, for certain tax-related purposes and to effect closing transactions.
Options and futures prices can diverge from the prices of their underlying instruments. Options and futures prices are affected by such factors as current and anticipated short-term interest rates, changes in volatility of the underlying instrument and the time remaining until expiration of the contract, which may not affect security prices the same way. Imperfect or no correlation also may result from differing levels of demand in the options and futures markets and the securities markets, from structural differences in how options and futures and securities are traded and from imposition of daily price fluctuation limits or trading halts.
The Funds did not hold derivative instruments during the year ended August 31, 2022.
| | (b) | | Foreign Securities and Currency |
Investment securities and other assets and liabilities denominated in foreign currencies are translated into U.S. dollar amounts at the date of valuation. Purchases and sales of investment securities and income and expense items denominated in foreign currencies are translated into U.S. dollar amounts on the respective dates of such transactions.
81
PMC FUNDS
Notes to Financial Statements, continued
August 31, 2022
The Funds isolate the portion of the results of operations from changes in foreign exchange rates on investments from those resulting from changes in market prices of securities held. Reported net realized foreign exchange gains or losses arise from sales of portfolio securities, sales and maturities of short-term securities, sales of foreign currencies, currency gains or losses realized between the trade and settlement dates on securities transactions, and the difference between the amounts of dividends, interest and foreign withholding taxes recorded on the Funds’ books, and the U.S. dollar equivalent of the amounts actually received or paid. Net unrealized foreign exchange gains and losses arise from changes in the values of assets and liabilities, including investments in securities at fiscal period end, resulting from changes in the exchange rate.
Investments in foreign securities entail certain risks. There may be a possibility of nationalization or expropriation of assets, confiscatory taxation, political or financial instability, and diplomatic developments that could affect the value of the Funds’ investments in certain foreign countries. Since foreign securities normally are denominated and traded in foreign currencies, the value of the Funds’ assets may be affected favorably or unfavorably by currency exchange rates, currency exchange control regulations, foreign withholding taxes, and restrictions or prohibitions on the repatriation of foreign currencies. There may be less information publicly available about a foreign issuer than about a U.S. issuer, and foreign issuers are not generally subject to accounting, auditing, and financial reporting standards and practices comparable to those in the United States. The securities of some foreign issuers are less liquid and at times more volatile than securities of comparable U.S. issuers.
The Funds may enter into futures contracts traded on domestic exchanges, including stock index futures contracts, as a substitute for a comparable market position in the underlying security, to attempt to hedge or limit the exposure of a Fund’s position, to create a synthetic money market position, for certain tax-related purposes and to effect closing transactions. Upon entering into a contract, the Funds deposit and maintain as collateral such initial margin as required by the exchange on which the transaction is effected. Pursuant to the contract, the Funds agree to receive from or pay to the broker an amount of cash equal to the daily fluctuation in value of the contract. Such receipts or payments are known as variation margin and are recorded by the Funds as unrealized gains and losses. When the contract is closed, the Funds record a realized gain or loss equal to the difference between the value of the contract at the time it was opened and the value at the time it was closed. A stock index futures contract does not involve the physical delivery of the underlying stocks in the index. As collateral for futures contracts, the Funds are required to maintain assets consisting of cash, cash equivalents or liquid securities. This collateral is required to be adjusted daily to reflect the market value of the purchase obligation for long futures contracts or the market value of the instrument underlying the contract, but not less than the market price at which the futures contract was established, for short futures contracts. The Funds did not enter into any futures contracts during the year ended August 31, 2022.
The risks inherent in the use of futures contracts include 1) adverse changes in the value of such instruments and 2) the possible absence of a liquid secondary market for any particular instrument at any time. Futures contracts may also expose the Funds to counterparty credit risk. The Funds will not enter into these contracts unless they own either 1) an offsetting position in the securities or 2) the position provides cash and liquid assets with a value marked-to-market daily, sufficient to cover the counter-party’s potential obligations.
| | (d) | | Forward Foreign Currency Contracts |
The Core Fixed Income Fund might purchase a particular currency or enter into a forward foreign currency contract to preserve the U.S. dollar price of securities it intends to or has contracted to purchase. Alternatively, it might sell a particular currency on either a spot or forward basis to hedge against an anticipated decline in the dollar value of securities it intends to or has contracted to sell. Although this strategy could minimize the risk of loss due to a decline in the value of the hedged currency, it could also
82
PMC FUNDS
Notes to Financial Statements, continued
August 31, 2022
limit any potential gain from an increase in the value of the currency. When entering into a forward foreign currency contract, the Fund agrees to receive or deliver a fixed quantity of foreign currency for an agreed-upon price at a future date. The market value of the contract fluctuates with changes in currency exchange rates. The contract is marked-to-market daily and the change in market value is recorded by the Fund as an unrealized gain or loss. The Fund records a realized gain or loss equal to the difference between the value of the contract at the time it was opened and the value at the time it was closed. The risks inherent in the use of currency forward exchange contracts include adverse changes in the value of such instruments and exposure to counterparty credit risk. Forward contracts are subject to the risks that the counterparty to such contract will default on its obligations. Since a forward foreign currency exchange contract is not guaranteed by an exchange or clearing house, a default on the contract would deprive the Fund of unrealized profits, transaction costs or the benefits of a currency hedge or force the Fund to cover its purchase or sale commitments, if any, at the current market price. The Fund did not enter into any forward foreign currency contracts during the year ended August 31, 2022.
The Core Fixed Income Fund may enter into written call options to hedge against changes in the value of equities. The writing of call options is intended to reduce the volatility of the portfolio and to earn premium income. Written call options expose the Fund to minimal counterparty credit risk since they are exchange traded and the exchange’s clearing house guarantees the options against default. The Fund may also purchase put options to provide protection against adverse price effects from anticipated changes in prices of securities. In addition, the Fund may enter into written put options to hedge against changes in the value of purchased put options.
The Fund may purchase and write call and put options on securities and indices and enter into related closing transactions.
When the Fund writes an option, an amount equal to the premium received by the Fund is recorded as a liability and is subsequently adjusted to the current fair value of the option written. Premiums received from writing options that expire unexercised are treated by the Fund on the expiration date as realized gains from options written. The difference between the premium and the amount paid on effecting a closing purchase transaction, including brokerage commissions, is also treated as a realized gain, or, if the premium is less than the amount paid for the closing purchase transaction, as a realized loss. If a call option is exercised, the premium is added to the proceeds from the sale of the underlying security or currency in determining whether the Fund has realized a gain or a loss. If a put option is exercised, the premium is deducted from the cost basis of the security purchased. The Fund, as writer of an option, bears the market risk of an unfavorable change in the price of the security underlying the written option.
When purchasing options, the Fund will recognize a realized loss equal to the premium paid to purchase the option, if the option expires unexercised. The difference between the proceeds received on effecting a closing sale transaction and the premium paid will be recognized as a realized gain or loss. If a put option is exercised, the premium paid is deducted from the proceeds on the sale of the underlying security in determining whether the Fund has a realized gain or loss.
When the Funds loan securities held in their portfolios, the Funds receive compensation in the form of fees, or retain a portion of the interest on the investment of any cash received as collateral. The loans are secured by collateral at least equal to: (i) 105% of the market value of the loaned securities that are foreign securities, or 102% of the market value of any other loaned securities, at the time the securities are loaned; and (ii) 100% of the market value of the loaned securities at all times. Gain or loss in the value of securities loaned that may occur during the term of the loan will be for the account of the Funds. The Funds have the right under the lending agreement to recover the securities from the borrower on demand.
83
PMC FUNDS
Notes to Financial Statements, continued
August 31, 2022
The Funds comply with the requirements of Subchapter M of the Internal Revenue Code of 1986, as amended (the “Code”), necessary to qualify as a regulated investment company and make the requisite distributions of income and capital gains to their shareholders sufficient to relieve them from all or substantially all federal income taxes. Therefore, no federal income tax provision has been provided.
| | (h) | | Distributions to Shareholders |
The Funds will distribute net investment income and net realized capital gains at least annually. Distributions from net realized gains for book purposes may include short-term capital gains. All short-term capital gains are included in ordinary income for tax purposes. Distributions to shareholders are recorded on the ex-dividend date. The Funds may also pay a special distribution at the end of the calendar year to comply with federal tax requirements.
The preparation of financial statements in conformity with GAAP requires management to make estimates and assumptions that affect the reported amounts of assets and liabilities and disclosure of contingent assets and liabilities at the date of the financial statements and the reported amounts of revenues and expenses during the reporting period. Actual results could differ from those estimates.
The NAV per share of a Fund is calculated by dividing the sum of the value of the securities held by the Fund, plus cash or other assets, minus all liabilities (including estimated accrued expenses) by the total number of shares outstanding for the Fund, rounded to the nearest cent. The Funds’ shares will not be priced on the days on which the NYSE is closed for trading. The Funds do not charge a redemption fee, therefore the offering and redemption price per share are equal to a Fund’s net asset value per share.
| | (k) | | Allocation of Income, Expenses and Gains/Losses |
Income, expenses (other than those deemed attributable to a specific share class), and gains and losses of each Fund are allocated daily to each class of shares based upon the ratio of net assets represented by each class as a percentage of the net assets of the Fund. Expenses deemed directly attributable to a class of shares are recorded by the specific class. Most expenses are allocated by class based on relative net assets. Distribution (Rule 12b-1) fees are expensed at 0.25% of average daily net assets of the Advisor Class shares of the Funds. Expenses associated with a specific fund in the Trust are charged to that fund. Common expenses are typically allocated evenly between the funds of the Trust or other equitable means.
Investment transactions are recorded on the trade date. The Funds determine the gain or loss from investment transactions on the identified cost basis by comparing the original cost of the security lot sold with the net sale proceeds. Dividend income is recognized on the ex-dividend date, and interest income is recognized on an accrual basis.
The London Interbank Offered Rate (“LIBOR”) is an interest-rate average calculated from estimates submitted by the leading banks in London. LIBOR represents the rate which banks may obtain short-term borrowings from each other. It is the primary interest rate benchmark for short-term interest rates around the world. The regulator of the LIBOR administrator phased out the use of LIBOR on December 30, 2021 such that the one-week and 2-month
84
PMC FUNDS
Notes to Financial Statements, continued
August 31, 2022
USD LIBOR settings ceased to be published or will no longer be representative. The remaining USD LIBOR settings will cease to be published or will no longer be representative after June 30, 2023. Because the usefulness of LIBOR as a reference rate could deteriorate during the transition from LIBOR to an alternative reference rate, these effects could occur prior to June 30, 2023. The expected discontinuation of LIBOR could have a significant impact on the financial markets, and may present a risk for certain market participants, including the risk that the transition from LIBOR to an alternative interest rate will not be orderly, will occur over various time periods or will have unintended consequences.
The tax character of distributions paid to shareholders were as follows:
| | | | | | | | |
Core Fixed Income Fund
| | Ordinary
Income
| | | Long-Term
Capital Gains
| |
Year Ended August 31, 2022 | | $ | 9,240,233 | | | $ | 4,677,382 | |
Year Ended August 31, 2021 | | $ | 18,061,447 | | | $ | 6,455,736 | |
| | | | | | | | |
Diversified Equity Fund
| | Ordinary
Income
| | | Long-Term
Capital Gains
| |
Year Ended August 31, 2022 | | $ | 21,468,568 | | | $ | 74,998,483 | |
Year Ended August 31, 2021 | | $ | 12,172,244 | | | $ | — | |
As of August 31, 2022, the components of accumulated earnings (losses) for income tax purposes were as follows:
| | | | | | | | |
| | | Core Fixed
Income
Fund
| | | Diversified
Equity Fund
| |
Cost basis of investments for federal income tax purposes | | $ | 521,337,713 | | | $ | 975,588,223 | |
| | |
|
|
| |
|
|
|
Gross tax unrealized appreciation | | $ | 605,550 | | | $ | 155,426,128 | |
Gross tax unrealized depreciation | | | (43,759,713 | ) | | | (79,654,039 | ) |
| | |
|
|
| |
|
|
|
Net tax unrealized appreciation | | $ | (43,154,163 | ) | | $ | 75,772,089 | |
| | |
|
|
| |
|
|
|
Undistributed ordinary income | | $ | 6,443,256 | | | $ | 12,064,740 | |
Undistributed long-term capital gain | | | — | | | | 12,251,579 | |
| | |
|
|
| |
|
|
|
Total distributable earnings | | $ | 6,443,256 | | | $ | 24,316,319 | |
Other accumulated loss | | | (14,488,321 | ) | | | (1,364,084 | ) |
| | |
|
|
| |
|
|
|
Total accumulated earnings | | $ | (51,199,228 | ) | | $ | 98,724,324 | |
| | |
|
|
| |
|
|
|
The difference between book-basis and tax-basis cost is attributable primarily to the tax deferral of losses on wash sale adjustments.
At August 31, 2022, the Core Fixed Income Fund deferred, on a tax basis, post-October capital losses of $14,488,321.
Additionally, GAAP requires that certain components of net assets relating to permanent differences be reclassified between financial and tax reporting. These reclassifications have no effect on net assets or net asset value per share. For the year ended August 31, 2022, no reclassifications were made between total distributable earnings and paid in capital.
The Funds had no material uncertain tax positions and have not recorded a liability for unrecognized tax benefits as of August 31, 2022. Also, the Funds recognized no interest and penalties related to uncertain tax benefits in fiscal year 2022. At August 31, 2022, the fiscal years 2019 through 2022 remain open to examination in the Funds’ major tax jurisdictions.
85
PMC FUNDS
Notes to Financial Statements, continued
August 31, 2022
The Trust has entered into an Investment Advisory Agreement (the “Agreement”), on behalf of the Funds, with the Adviser to furnish investment advisory services to the Funds. Under terms of the Agreement, the Trust, on behalf of the Funds, the Adviser is entitled to receive from the Diversified Equity Fund a management fee equal to 0.53% of the Fund’s average daily net assets and is entitled to receive from the Core Fixed Income Fund a management fee equal to 0.65% of the Fund’s average daily net assets if the Fund’s net assets are less than $2,500,000,000; 0.625% if the Fund’s net assets are greater than $2,500,000,000 but less than $5,000,000,000; and 0.60% if the Fund’s assets are greater than $5,000,000,000.
The Adviser has contractually agreed to waive its management fees and/or reimburse other expenses of the Funds’ at least through December 29, 2023 to the extent necessary to ensure that the Funds’ total annual operating expenses (excluding front-end or contingent deferred sales loads, Rule 12b-1 plan fees, shareholder servicing plan fees, taxes, leverage, interest, brokerage commissions and other transactional expenses, expenses incurred in connections with any merger or reorganizations, dividends or interest on short positions, acquired fund fees and expenses, or extraordinary expenses such as litigation) do not exceed 0.60% for the Core Fixed Income Fund and 0.73% for the Diversified Equity Fund (the “Expense Limitation Cap”) of each Fund’s average daily net assets.
Any such waiver or reimbursement is subject to later adjustment to allow the Adviser to recoup amounts waived or reimbursed to the extent actual fees and expenses for a fiscal period do not exceed the lesser of: (1) the Expense Limitation Cap in place at the time of the waiver or reimbursement or (2) the Expense Limitation Cap in place at the time of recoupment; provided, however, that the Adviser shall only be entitled to recoup such amounts over the following three year period from the date of the waiver or reimbursement.
The following table shows the remaining waived or reimbursed expenses subject to potential recovery expiring by:
| | | | | | | | |
| | | Core Fixed
Income Fund
| | | Diversified
Equity Fund
| |
August 31, 2023 | | $ | 1,245,915 | | | $ | — | |
August 31, 2024 | | $ | 1,255,760 | | | $ | — | |
August 31, 2025 | | $ | 1,309,991 | | | $ | — | |
Sub-advisory services are provided to the Core Fixed Income Fund, pursuant to an agreement between the Adviser and Neuberger Berman Investment Advisers LLC (the “Sub-Adviser”). Under the terms of the sub-advisory agreement, the Adviser compensates the Sub-Adviser based on the Fund’s average daily net assets.
The Trust has adopted a Distribution Plan pursuant to Rule 12b-1 under the 1940 Act (the “12b-1 Plan”), on behalf of the Advisor Class shares of the Funds, which authorizes the Trust to pay Foreside Fund Services, LLC (the “Distributor”), the Funds’ principal distributor, a distribution fee of 0.25% of each Fund’s average daily net assets of Advisor Class shares. During the year ended August 31, 2022, the Funds incurred fees pursuant to the 12b-1 Plan as follows:
| | | | |
Core Fixed Income Fund | | $ | 142,117 | |
Diversified Equity Fund | | $ | 338,697 | |
| (6) | | Related Party Transactions |
U.S. Bancorp Fund Services, LLC (doing business as U.S. Bank Global Fund Services (“Fund Services”)) acts as the Funds’ Administrator under an Administration Agreement. Fund Services prepares various federal and state regulatory filings, reports and returns for the Funds; prepares reports and materials to be supplied to the
86
PMC FUNDS
Notes to Financial Statements, continued
August 31, 2022
Trustees; monitors the activities of the Funds’ custodian, transfer agent and accountants; coordinates the preparation and payment of the Funds’ expenses and reviews the Funds’ expense accruals. Fees incurred for the year ended August 31, 2022, and owed as of August 31, 2022, are as follows:
| | | | | | | | |
| | | Incurred
| | | Owed
| |
Core Fixed Income Fund | | $ | 217,643 | | | $ | 35,205 | |
Diversified Equity Fund | | $ | 457,461 | | | $ | 74,421 | |
Fund Services also serves as the fund accountant and transfer agent to the Funds. U.S. Bank, N.A. (“U.S. Bank”), an affiliate of Fund Services, serves as each Fund’s custodian. Fees incurred for the year ended August 31, 2022, and owed as of August 31, 2022 are as follows:
| | | | | | | | |
Fund Accounting
| | Incurred
| | | Owed
| |
Core Fixed Income Fund | | $ | 233,920 | | | $ | 38,474 | |
Diversified Equity Fund | | $ | 271,745 | | | $ | 44,290 | |
| | | | | | | | |
Transfer Agency
| | Incurred
| | | Owed
| |
Core Fixed Income Fund | | $ | 325,485 | | | $ | 53,673 | |
Diversified Equity Fund | | $ | 442,611 | | | $ | 71,677 | |
| | | | | | | | |
Custody
| | Incurred
| | | Owed
| |
Core Fixed Income Fund | | $ | 76,691 | | | $ | 12,728 | |
Diversified Equity Fund | | $ | 109,294 | | | $ | 17,685 | |
The Funds each have an unsecured line of credit with U.S. Bank (see Note 8).
Certain officers of the Funds are also employees of Fund Services. A Trustee of the Trust is affiliated with Fund Services and U.S. Bank.
The Trust’s Chief Compliance Officer is also an employee of Fund Services. Each Fund’s allocation of the Trust’s Chief Compliance Officer fee incurred for the year ended August 31, 2022, and owed as of August 31, 2022 is as follows:
| | | | | | | | |
| | | Incurred
| | | Owed
| |
Core Fixed Income Fund | | $ | 17,500 | | | $ | 2,916 | |
Diversified Equity Fund | | $ | 12,496 | | | $ | 2,082 | |
| (7) | | Investment Transactions |
Purchases and sales of investment securities (excluding short-term instruments) for the year ended August 31, 2022 are summarized below.
| | | | | | | | |
| | | Core Fixed
Income Fund
| | | Diversified
Equity Fund
| |
Purchases: | | | | | | | | |
U.S. Government | | $ | 453,035,433 | | | $ | — | |
Other | | | 533,468,278 | | | | 638,450,179 | |
| | |
|
|
| |
|
|
|
Total Purchases | | $ | 986,503,711 | | | $ | 638,450,179 | |
Sales | | | | | | | | |
U.S. Government | | $ | 423,770,773 | | | $ | — | |
Other | | | 547,306,383 | | | | 617,613,480 | |
| | |
|
|
| |
|
|
|
Total Sales | | $ | 971,077,156 | | | $ | 617,613,480 | |
87
PMC FUNDS
Notes to Financial Statements, continued
August 31, 2022
At August 31, 2022, the Core Fixed Income Fund and Diversified Equity Fund had unsecured lines of credit in the lesser amount of $20,000,000 and $35,000,000, respectively, or 33.33% of the fair value of unencumbered assets of each Fund, as defined, which both mature August 5, 2023. These unsecured lines of credit are intended to provide short-term financing, if necessary, subject to certain restrictions, in connection with shareholder redemptions. The credit facility is with the Funds’ custodian, US Bank. Interest was scheduled to be incurred at the bank’s prime rate of 3.25% from September 1, 2021 through March 16, 2022, 3.50% from March 17, 2022 through May 4, 2022, 4.00% from May 5, 2022 through June 15, 2022, 4.75% from June 16, 2022 through July 27, 2022, and 5.50% from July 28, 2022 through August 31, 2022. The following table provides information regarding usage of the line of credit for the year ended August 31, 2022 for the Funds. The Funds did not have an outstanding balance on either line of credit as of August 31, 2022.
| | | | | | | | | | | | | | | | | | | | |
| | | Days
Utilitized
| | | Average
Amount of
Borrowing
| | | Interest
Expense*
| | | Maximum
Amount of
Borrowing
| | | Date of
Maximum
Borrowing
| |
Core Fixed Income Fund | | | 10 | | | $ | 128,800 | | | $ | 193 | | | $ | 339,000 | | | | 8/1/2022 | |
Diversified Equity Fund | | | 18 | | | $ | 2,030,667 | | | $ | 4,488 | | | $ | 4,553,000 | | | | 7/1/2022 | |
| * | | Interest expense is reported within Other Expenses on the Statements of Operations. |
Pursuant to the terms of a securities lending agreement with U.S. Bank, each Fund may lend securities from its portfolio to brokers, dealers and financial institutions in order to increase the return on its portfolio, primarily through the receipt of borrowing fees and earnings on invested collateral. Any such loan must be continuously secured by collateral in cash or cash equivalents maintained on a current basis in an amount at least equal to the market value of the securities loaned by a Fund. During the time securities are on loan, the borrower will pay the applicable Fund any accrued income on those securities, and the Fund may invest the cash collateral and earn income or receive an agreed-upon fee from a borrower that has delivered cash-equivalent collateral. In determining whether or not to lend a security to a particular broker, dealer or financial institution, the Adviser considers all relevant facts and circumstances, including the size, creditworthiness and reputation of the broker, dealer or financial institution.
Securities lending involves the risk of a default or insolvency of the borrower. In either of these cases, a Fund could experience delays in recovering securities or collateral or could lose all or part of the value of the loaned securities. A Fund also could lose money in the event of a decline in the value of the collateral provided for loaned securities. Additionally, the loaned portfolio securities may not be available to a Fund on a timely basis and that Fund may therefore lose the opportunity to sell the securities at a desirable price. Any decline in the value of a security that occurs while the security is out on loan would continue to be borne by the applicable Fund.
As of August 31, 2022, the value of the securities on loan and value of collateral received for securities lending were as follows:
| | | | | | | | | | | | |
| | | Loaned Securities
Value
| | | Value of Cash Collateral
| | | % of Net Assets
| |
Core Fixed Income Fund | | $ | 23,131,553 | | | $ | 23,745,201 | | | | 5.35 | % |
Diversified Equity Fund | | $ | 118,873,615 | | | $ | 122,945,367 | | | | 12.76 | % |
The Funds receive cash as collateral in return for securities lent as part of the securities lending program. The collateral is invested in the Mount Vernon Liquid Assets Portfolio, LLC. The Schedule of Investments for each Fund includes the particular cash collateral holding as of August 31, 2022. The remaining contractual maturity of all securities lending transactions is overnight and continuous.
88
PMC FUNDS
Notes to Financial Statements, continued
August 31, 2022
The Funds are not subject to a master netting agreement with respect to securities lending; therefore, no additional disclosures regarding netting arrangements are required.
The fee and interest income earned by the Funds on investments of cash collateral received from borrowers for the securities loaned to them are reflected in the Funds’ Statements of Operations.
| (10) | | Recent Market Events |
U.S. and international markets have experienced volatility in recent months and years due to a number of economic, political and global macro factors including the impact of the coronavirus (COVID-19) as a global pandemic, uncertainties regarding interest rates, rising inflation, trade tensions, and the threat of tariffs imposed by the U.S. and other countries. The recovery from COVID-19 is proceeding at slower than expected rates and may last for a prolonged period of time. As a result of continuing political tensions and armed conflicts, including the war between Ukraine and Russia, the U.S. and the European Union imposed sanctions on certain Russian individuals and companies, including certain financial institutions, and have limited certain exports and imports to and from Russia. The war has contributed to recent market volatility and may continue to do so. Continuing market volatility as a result of recent market conditions or other events may have an adverse effect on the performance of the Funds.
The Funds have evaluated events and transactions that have occurred subsequent to August 31, 2022 and determined there were no subsequent events that would require recognition or disclosure in financial statements.
89
REPORT OF INDEPENDENT REGISTERED PUBLIC ACCOUNTING FIRM
To the Shareholders of PMC Funds and the Board of Trustees of Trust for Professional Managers:
Opinion on the Financial Statements and Financial Highlights
We have audited the accompanying statements of assets and liabilities, including the schedules of investments, of the PMC Funds, comprising the PMC Core Fixed Income Fund and PMC Diversified Equity Fund (collectively, the “Funds”), each portfolios of the series constituting the Trust for Professional Managers, as of August 31, 2022, the related statements of operations for the year then ended, the statements of changes in net assets for each of the two years in the period then ended, the financial highlights for each of the five years in the period then ended, and the related notes. In our opinion, the financial statements and financial highlights present fairly, in all material respects, the financial position of each of the portfolios constituting the Funds as of August 31, 2022, and the results of their operations for the year then ended, the changes in their net assets for each of the two years in the period then ended, and the financial highlights for each of the five years in the period then ended in conformity with accounting principles generally accepted in the United States of America.
Basis for Opinion
These financial statements and financial highlights are the responsibility of the Funds’ management. Our responsibility is to express an opinion on the Funds’ financial statements and financial highlights based on our audits. We are a public accounting firm registered with the Public Company Accounting Oversight Board (United States) (PCAOB) and are required to be independent with respect to the Funds in accordance with the U.S. federal securities laws and the applicable rules and regulations of the Securities and Exchange Commission and the PCAOB.
We conducted our audits in accordance with the standards of the PCAOB. Those standards require that we plan and perform the audit to obtain reasonable assurance about whether the financial statements and financial highlights are free of material misstatement, whether due to error or fraud. The Funds are not required to have, nor were we engaged to perform, an audit of their internal control over financial reporting. As part of our audits we are required to obtain an understanding of internal control over financial reporting but not for the purpose of expressing an opinion on the effectiveness of the Funds’ internal control over financial reporting. Accordingly, we express no such opinion.
Our audits included performing procedures to assess the risks of material misstatement of the financial statements and financial highlights, whether due to error or fraud, and performing procedures that respond to those risks. Such procedures included examining, on a test basis, evidence regarding the amounts and disclosures in the financial statements and financial highlights. Our audits also included evaluating the accounting principles used and significant estimates made by management, as well as evaluating the overall presentation of the financial statements and financial highlights. Our procedures included confirmation of securities owned as of August 31, 2022, by correspondence with the custodian and brokers; when replies were not received from brokers, we performed other auditing procedures. We believe that our audits provide a reasonable basis for our opinion.
/s/ Deloitte & Touche LLP
Chicago, Illinois
October 27, 2022
We have served as the auditor of one or more Trust for Professional Managers’ investment companies since 2002.
90
BASIS FOR TRUSTEES’ APPROVAL OF INVESTMENT ADVISORY AGREEMENT
The Board of Trustees (the “Trustees”) of Trust for Professional Managers (the “Trust”) met on August 26, 2022 to consider the renewal of the Investment Advisory Agreement (the “Agreement”) between the Trust, on behalf of the PMC Core Fixed Income Fund and the PMC Diversified Equity Fund (each, a “Fund,” and together, the “Funds”), each a series of the Trust, and Envestnet Asset Management, Inc., the Funds’ investment adviser (the “Adviser”). The Trustees also met at a prior meeting held on June 13, 2022 (the “June 13, 2022 Meeting”) to review materials related to the renewal of the Agreement. Prior to these meetings, the Trustees requested and received materials to assist them in considering the renewal of the Agreement. The materials provided contained information with respect to the factors enumerated below, including a copy of the Agreement, a memorandum prepared by the Trust’s outside legal counsel discussing in detail the Trustees’ fiduciary obligations and the factors they should assess in considering the renewal of the Agreement, detailed comparative information relating to the Funds’ performance, as well as the management fees and other expenses of the Funds, due diligence materials relating to the Adviser (including a due diligence questionnaire completed on behalf of the Funds by the Adviser, the Adviser’s Form ADV, select financial statements of the Adviser, bibliographic information of the Adviser’s key management and compliance personnel, comparative fee information for the Funds and a summary detailing key provisions of the Adviser’s written compliance program, including its code of ethics) and other pertinent information. The Trustees also received information periodically throughout the year that was relevant to the Agreement renewal process, including performance, management fee and other expense information. Based on their evaluation of the information provided by the Adviser, in conjunction with the Funds’ other service providers, the Trustees, by a unanimous vote (including a separate vote of the Trustees who are not “interested persons,” as that term is defined in the Investment Company Act of 1940, as amended (the “Independent Trustees”)), approved the continuation of the Agreement for an additional one-year term ending August 31, 2023.
DISCUSSION OF FACTORS CONSIDERED
In considering the renewal of the Agreement and reaching their conclusions, the Trustees reviewed and analyzed various factors that they determined were relevant, including the factors enumerated below.
1. NATURE, EXTENT AND QUALITY OF SERVICES PROVIDED TO THE FUNDS
The Trustees considered the nature, extent and quality of services provided by the Adviser to the Funds and the amount of time devoted to the Funds’ operations by the Adviser’s staff. The Trustees considered the Adviser’s specific responsibilities in all aspects of day-to-day management of the Funds, including its recommendations with respect to the hiring, termination or replacement of the PMC Core Fixed Income Fund’s sub-adviser and its oversight of investment strategies implemented by the PMC Core Fixed Income Fund’s sub-adviser. The Trustees also considered the qualifications of key personnel at the Adviser involved in the day-to-day activities of the Funds, including Brandon R. Thomas, who serves as a portfolio manager to the Diversified Equity Fund and for the segment of the Core Fixed Income Fund’s assets managed by the Adviser, and Janis Zvingelis, who serves as a portfolio manager to the Diversified Equity Fund. The Trustees reviewed information provided by the Adviser in a due diligence questionnaire, including the structure of the Adviser’s compliance program and its continuing commitment to the Funds. The Trustees noted that during the course of the prior year the Adviser had participated in a Trust board meeting to discuss the Funds’ performance and outlook, along with the compliance efforts made by the Adviser. The Trustees also noted any services that extended beyond portfolio management, and they considered the brokerage practices of the Adviser. The Trustees discussed the Adviser’s handling of compliance matters, including the reports of the Trust’s chief compliance officer to the Trustees on the effectiveness of the Adviser’s compliance program and oversight of the compliance program of the PMC Core Fixed Income Fund’s sub-adviser. The Trustees also considered the Adviser’s overall financial condition, as well as the implementation and operational effectiveness of the Adviser’s business continuity plan in response to the COVID-19 pandemic. The Trustees concluded that the Adviser had sufficient quality and depth of personnel, resources, investment methods and compliance policies and procedures essential to performing its duties under the Advisory Agreement and managing the PMC Core Fixed Income Fund under the “manager of managers” structure and that the nature, overall quality and extent of the management services provided to the Funds, as well as the Adviser’s compliance program, were satisfactory and reliable.
91
2. INVESTMENT PERFORMANCE OF THE FUNDS AND THE ADVISER
The Trustees discussed the performance of the Advisor Class shares of the PMC Core Fixed Income Fund and PMC Diversified Equity Fund for the quarter, one-year, three-year, five-year, ten-year and since inception periods ended March 31, 2022. In assessing the quality of the portfolio management services delivered by the Adviser, the Trustees also compared the short-term and longer-term performance of the Advisor Class shares of the Funds on both an absolute basis and in comparison to a benchmark index (the Bloomberg U.S. Aggregate Bond Index for the PMC Core Fixed Income Fund and the MSCI World Index Net Return for the PMC Diversified Equity Fund) and in comparison to a peer group of funds as constructed using publicly-available data provided by Morningstar, Inc. and presented by Barrington Financial Group, LLC d/b/a Barrington Partners, an independent third-party benchmarking firm, through its cohort selection process (a peer group of U.S. open-end intermediate core-plus bond and intermediate core bond funds for the PMC Core Fixed Income Fund and a peer group of U.S. open-end global large-cap blend, large-cap blend and large-cap value funds for the PMC Diversified Equity Fund) (each, a “Barrington Cohort”). The Trustees noted that the Adviser did not manage any other accounts with the same or similar investment strategies as either Fund.
The Trustees noted the PMC Core Fixed Income Fund’s performance for Advisor Class shares for each of the one-year, five-year and ten-year periods ended March 31, 2022 was below the Barrington Cohort average. The Trustees further noted that for the three-year period ended March 31, 2022, the PMC Core Fixed Income Fund’s performance for Advisor Class shares was above the Barrington Cohort average. The Trustees noted that for the three-year, five-year, and since inception periods ended March 31, 2022, the Advisor Class shares of the PMC Core Fixed Income Fund had outperformed the Bloomberg U.S. Aggregate Bond Index. The Trustees noted that for the quarter, one-year, and ten-year periods ended March 31, 2022, the Advisor Class shares of the PMC Core Fixed Income Fund had underperformed the Bloomberg U.S. Aggregate Bond Index.
The Trustees noted the PMC Diversified Equity Fund’s performance for Advisor Class shares for each of the one-year, three-year, five-year, and ten-year periods ended March 31, 2022 was below the Barrington Cohort average. The Trustees noted that for the quarter, one-year, three-year, five-year, ten-year, and since inception periods ended March 31, 2022, the Advisor Class shares of the PMC Diversified Equity Fund had underperformed the MSCI World Index Net Return.
After considering all of the information, the Trustees concluded that the performance obtained by the Adviser for each Fund was satisfactory under current market conditions and that the Adviser has developed the necessary expertise and resources in selecting and managing the sub-adviser to the PMC Core Fixed Income Fund and providing investment advisory services in accordance with each Fund’s investment objective and strategies. Although past performance is not a guarantee or indication of future results, the Trustees determined that each Fund and its shareholders were likely to benefit from the Adviser’s continued management.
3. COSTS OF SERVICES PROVIDED AND PROFITS REALIZED BY THE ADVISER
The Trustees considered the cost of services and the structure of the Adviser’s fees, including a review of the expense analyses and other pertinent material with respect to the Funds. The Trustees reviewed the related statistical information and other materials provided, including the comparative expenses and Barrington Cohort comparisons. The Trustees considered the cost structure of each Fund relative to its Barrington Cohort, as well as any fee waivers, expense reimbursements and expense recoupments of the Adviser. In reviewing the PMC Core Fixed Income Fund’s fees and total expense structure, the Trustees took into account the Fund’s “manager of managers” structure, noting that the Adviser pays the Fund’s sub-advisory fees out of its own management fees, and that the Fund was not directly responsible for payment of any sub-advisory fees.
The Trustees also considered the overall profitability of the Adviser and reviewed the Adviser’s financial information and noted that the Adviser had subsidized each Fund’s operations since inception and had not yet fully recouped those subsidies for the PMC Core Fixed Income Fund. The Trustees also examined the level of profits that could be expected to accrue to the Adviser from the fees payable under the Advisory Agreement and the expense subsidizations undertaken by the Adviser, as well as the Funds’ brokerage practices, noting that the Adviser makes no effort to seek soft dollar arrangements. These considerations were based on materials requested by the Trustees and the Funds’ administrator specifically for the June 13, 2022 meeting and the August 26, 2022 meeting at which the Advisory Agreement was formally considered, as well as the reports prepared by the Adviser over the course of the year.
92
The Trustees noted that the PMC Core Fixed Income Fund’s contractual management fee of 0.65% was above the Barrington Cohort average of 0.38%. The Trustees noted that the PMC Core Fixed Income Fund was operating above its expense cap of 0.85% (including Rule 12b-1 plan fees) for Advisor Class shares. The Trustees observed that the PMC Core Fixed Income Fund’s total expense ratio (net of fee waivers and expense reimbursements and including Rule 12b-1 plan fees) of 0.85% for Advisor Class shares was above the Barrington Cohort average of 0.74%. The Trustees also compared the fees paid by the PMC Core Fixed Income Fund to the fees associated with the Adviser’s fixed-income separately-managed account portfolios.
The Trustees noted that the PMC Diversified Equity Fund’s contractual management fee of 0.53% was above the Barrington Cohort average of 0.51%. The Trustees noted that the PMC Diversified Equity Fund was operating below its expense cap of 0.98% (including Rule 12b-1 plan fees) for Advisor Class shares. The Trustees observed that the PMC Diversified Equity Fund’s total expense ratio (including expense recoupments and Rule 12b-1 plan fees) of 0.97% for Advisor Class shares was above the Barrington Cohort average of 0.84%. The Trustees also compared the fees paid by the PMC Diversified Equity Fund to the fees associated with the Adviser’s equity/balanced separately-managed account portfolios.
The Trustees concluded that the Funds’ expenses and the management fees paid to the Adviser were fair and reasonable in light of the comparative performance, expense and management fee information and, with respect to the PMC Core Fixed Income Fund, considering the Fund’s “manager-of-managers” structure. The Trustees further concluded, based on a profitability analysis prepared by the Adviser, that the Adviser’s profits from sponsoring each of the Funds were not excessive and that the Adviser maintained adequate profit levels to support the services to the Funds from the revenues of its overall investment advisory business, despite its subsidies to support the PMC Core Fixed Income Fund’s operations.
4. EXTENT OF ECONOMIES OF SCALE AS THE FUNDS GROW
The Trustees compared each Fund’s expenses relative to its peer group and discussed realized and potential economies of scale. The Trustees also reviewed the structure of each Fund’s management fee and whether each Fund was large enough to generate economies of scale for shareholders or whether economies of scale would be expected to be realized as Fund assets grow (and if so, how those economies of scale were being or would be shared with shareholders). The Trustees reviewed all fee waivers, expense reimbursements and expense recoupments by the Adviser with respect to the Funds. The Trustees noted that the PMC Core Fixed Income Fund’s management fee structure contained breakpoint reductions as the Fund’s assets grow in size, and that while the PMC Diversified Equity Fund’s did not, the feasibility of incorporating breakpoints would continue to be reviewed on a regular basis. The Trustees concluded that the Adviser’s management fee structures were reasonable and reflected a sharing of economies of scale between the Adviser and each Fund at the Fund’s current asset level.
5. BENEFITS DERIVED FROM THE RELATIONSHIP WITH THE FUNDS
The Trustees considered the direct and indirect benefits that could be received by the Adviser from its association with the Funds. The Trustees examined the brokerage practices of the Adviser with respect to the Funds and noted that the Adviser receives no soft dollar benefits with respect to its management of the Funds. The Trustees concluded that the benefits the Adviser may receive, such as greater name recognition and increased ability to attract additional investor assets, appear to be reasonable, and in many cases may benefit the Funds.
CONCLUSIONS
The Trustees considered all of the foregoing factors. In considering the renewal of the Advisory Agreement, the Trustees did not identify any one factor as all-important, but rather considered these factors collectively in light of the Fund’s surrounding circumstances. Based on this review, the Trustees, including a majority of the Independent Trustees, approved the continuation of the Advisory Agreement for an additional one-year term ending August 31, 2023 as being in the best interests of the Fund and its shareholders.
93
BASIS FOR TRUSTEES’ APPROVAL OF INVESTMENT SUB-ADVISORY AGREEMENT
The Board of Trustees (the “Trustees”) of Trust for Professional Managers (the “Trust”) met on August 26, 2022 to consider the renewal of the sub-advisory agreement (the “Sub-Advisory Agreement”) for the PMC Core Fixed Income Fund (the “Fund”), entered into between Envestnet Asset Management, Inc. (“Envestnet”), the Fund’s investment adviser and Neuberger Berman Investment Advisers LLC (“NBIA”), the Fund’s sub-adviser. The Trustees also met at a prior meeting held on June 13, 2022 (the “June 13, 2022 Meeting”) to review materials related to the renewal of the Sub-Advisory Agreement. Prior to these meetings, the Trustees requested and received materials to assist them in considering the renewal of the Sub-Advisory Agreement. The materials provided contained information with respect to the factors enumerated below, including copies of the Sub-Advisory Agreement, a memorandum prepared by the Trust’s outside legal counsel discussing in detail the Trustees’ fiduciary obligations and the factors they should assess in considering the renewal of the Sub-Advisory Agreement, due diligence materials relating to NBIA (including a due questionnaire, Form ADV, bibliographic information of key management and compliance personnel, a summary detailing key provisions of NBIA’s written compliance program, including its code of ethics) and other pertinent information. The Trustees also received information periodically throughout the year that was relevant to the Sub-Advisory Agreement renewal process, including performance information for the Fund. Based on their evaluation of the information provided by Envestnet and NBIA, in conjunction with the Fund’s other service providers, the Trustees, by a unanimous vote (including a separate vote of the Trustees who are not “interested persons,” as that term is defined in the Investment Company Act of 1940, as amended (the “Independent Trustees”), approved the continuation of the Sub-Advisory Agreement for an additional one-year term ending August 31, 2023.
DISCUSSION OF FACTORS CONSIDERED
In considering the renewal of the sub-advisory agreement between Envestnet, on behalf of the PMC Core Fixed Income Fund, and the Core Fixed Income Fund’s sub-adviser, NBIA, the Board reviewed and analyzed various factors that it determined were relevant, including the factors enumerated below.
1. NATURE, EXTENT AND QUALITY OF SERVICES PROVIDED BY NBIA
The Trustees considered the nature, extent and quality of services provided by NBIA to the Fund. The Trustees considered NBIA’s responsibilities in its management of Fund assets, as well as the qualifications, experience and responsibilities of David M. Brown, Thanos Bardas and Nathan Kush, and other key personnel at NBIA. The Trustees noted that NBIA was the sole third-party sub-adviser to the Fund and was responsible for managing approximately 87% of the Fund’s portfolio, with Envestnet managing the remaining portion of the Fund’s portfolio. The Trustees also considered information provided by NBIA at the June 13, 2022 meeting and the August 26, 2022 meeting at which the Sub-Advisory Agreement was formally considered, relating to the investment objective and strategies for the Fund, brokerage practices and compliance and risk management. The Trustees also noted any services that extended beyond portfolio management. The Trustees also considered the overall financial condition, as well as the implementation and operational effectiveness of the business continuity plan for NBIA in response to the COVID-19 pandemic. The Trustees concluded that NBIA had sufficient quality and depth of personnel, resources, investment methods and compliance programs essential to performing its duties under the Sub-Advisory Agreement and that the nature, overall quality and extent of investment management services provided by NBIA to the Fund were satisfactory.
2. INVESTMENT PERFORMANCE OF THE FUND AND NBIA
The Trustees discussed the Fund’s performance, including the performance relating specifically to the segment of the Fund’s portfolio managed by NBIA. The Trustees discussed the performance of the segment of the Fund’s portfolio managed by NBIA for the quarter, one-year, three-year, five-year, ten-year, and since inception periods ended March 31, 2022. The Trustees compared the short-term and longer-term performance of the segment of the Fund’s portfolio managed by NBIA on both an absolute basis and in comparison to a benchmark index (the Bloomberg U.S. Aggregate Bond Index) and in comparison to a separate sub-advised fund with similar investment strategies to that utilized by NBIA in managing its segment of the Fund’s portfolio. The Trustees noted that for the one-year, three-year, five-year, ten-year, and since inception periods ended March 31, 2022, the segment of the Fund’s portfolio managed by NBIA outperformed the benchmark index. The Trustees also noted that for the quarter ended March 31, 2022, the segment of the Fund’s portfolio managed by NBIA underperformed the
94
benchmark index. The Trustees noted the performance of the segment of the Fund’s portfolio managed by NBIA was generally in-line with a composite of other separately-managed accounts of NBIA that were the same or similar to the Fund in terms of investment strategies.
After considering all the information, the Trustees concluded that the performance obtained by NBIA for the Fund was satisfactory under current market conditions. Although past performance is not a guarantee or indication of future results, the Trustees determined that the Fund and its shareholders were likely to benefit from the continued management of Fund assets by NBIA.
3. COSTS OF SERVICES PROVIDED AND PROFITS REALIZED BY NBIA
The Trustees reviewed and considered the sub-advisory fees payable by Envestnet to NBIA under the Sub-Advisory Agreement. The Trustees noted that Envestnet had previously confirmed to the Trustees that the sub-advisory fees payable under the Sub-Advisory Agreement were reasonable in light of the quality of the services performed by NBIA. Since the sub-advisory fees are paid by Envestnet, the overall advisory fee paid by the Fund is not directly affected by the sub-advisory fees paid to NBIA. Consequently, the Trustees did not consider the costs of services provided by NBIA or the profitability of its relationship with the Fund to be material factors for consideration given that NBIA is not affiliated with Envestnet and, therefore, the sub-advisory fees were negotiated on an arm’s-length basis. Based on all these factors, the Trustees concluded that the sub-advisory fees paid to NBIA by Envestnet were reasonable in light of the services provided by NBIA.
4. EXTENT OF ECONOMIES OF SCALE AS THE FUND GROWS
Since the sub-advisory fees payable to NBIA are not paid by the Fund, the Trustees did not consider whether the sub-advisory fees should reflect any potential economies of scale that might be realized as the Fund’s assets increase.
5. BENEFITS DERIVED FROM THE RELATIONSHIP WITH THE FUND
The Trustees considered the direct and indirect benefits that could be received by NBIA from its association with the Fund. The Trustees concluded that the benefits that NBIA may receive, such as greater name recognition and increased ability to attract additional investor assets, appear to be reasonable, and in many cases may benefit the Fund.
CONCLUSIONS
The Trustees considered all of the foregoing factors. In considering the renewal of the Sub-Advisory Agreement, the Trustees did not identify any one factor as all-important, but rather considered these factors collectively in light of the Fund’s surrounding circumstances. Based on this review, the Trustees, including a majority of the Independent Trustees, approved the continuation of the Sub-Advisory Agreement for an additional one-year term ending August 31, 2023 as being in the best interests of the Fund and its shareholders.
95
Statement Regarding Liquidity Risk Management Program—PMC Funds
In accordance with Rule 22e-4 under the Investment Company Act of 1940, as amended, Trust for Professional Managers (the “Trust”) has adopted and implemented a liquidity risk management program (the “Trust Program”). As required under the Trust Program, Envestnet Asset Management, Inc. (“Envestnet”), the investment adviser to the PMC Core Fixed Income Fund and PMC Diversified Equity Fund (the “Funds”), each a series of the Trust, has adopted and implemented a liquidity risk management program tailored specifically to each Fund (the “Adviser Program”). The Adviser Program seeks to promote effective liquidity risk management for each Fund and to protect Fund shareholders from dilution of their interests. The Board of Trustees (the “Board”) of the Trust has approved Envestnet as the administrator for the Adviser Program (the “Program Administrator”). The Program Administrator has further delegated administration of the Adviser Program to an appointed committee of officers of Envestnet. The Program Administrator also requires the investment sub-adviser to the PMC Core Fixed Income Fund, specifically Neuberger Berman Investment Advisers, LLC, to adopt a liquidity risk management program applicable to the Fund and to provide portfolio investment classification information to the Program Administrator on a monthly basis. The Program Administrator is required to provide a written annual report to the Board and the Trust’s chief compliance officer regarding the adequacy and effectiveness of the Adviser Program, including the operation of each Fund’s highly liquid investment minimum, if applicable, and any material changes to the Adviser Program.
On April 13, 2022, the Board reviewed the Program Administrator’s written annual report for the period January 1, 2021 through December 31, 2021 (the “Report”). The Report provided an assessment of each Fund’s liquidity risk: the risk that a Fund could not meet requests to redeem shares issued by the Fund without significant dilution of the remaining investors’ interests in the Fund. The Adviser Program assesses liquidity risk under both normal and reasonably foreseeable stressed market conditions. The Program Administrator has retained ICE Data Services, Inc., a third party vendor, to provide portfolio investment classification services, and the Report noted that each Fund primarily held investments that were classified as highly liquid during the review period. The Report noted that each Fund’s portfolio is expected to continue to primarily hold highly liquid investments and the determination that each Fund be designated as a “primarily highly liquid fund” (as defined in Rule 22e-4) remains appropriate and each Fund can therefore continue to rely on the exclusion in Rule 22e-4 from the requirements to determine and review a highly liquid investment minimum for the Fund and to adopt policies and procedures for responding to a highly liquid investment minimum shortfall. The Report noted that there were no breaches of a Fund’s restriction on holding illiquid investments exceeding 15% of its net assets during the review period. The Report confirmed that each Fund’s investment strategy was appropriate for an open-end management investment company. The Report also indicated that no material changes had been made to the Adviser Program during the review period.
The Program Administrator determined that each Fund is reasonably likely to be able to meet redemption requests without adversely affecting non-redeeming Fund shareholders through significant dilution. The Program Administrator concluded that the Adviser Program was adequately designed and effectively implemented during the review period.
96
Notice of Privacy Policy & Practices
We collect non-public personal information about you from the following sources:
| | • | | information we receive about you on applications or other forms; |
| | • | | information you give us orally; and |
| | • | | information about your transactions with us or others. |
We do not disclose any non-public personal information about our shareholders or former shareholders without the shareholder’s authorization, except as permitted by law or in response to inquiries from governmental authorities. We may share information with affiliated parties and unaffiliated third parties with whom we have contracts for servicing the Funds. We will provide unaffiliated third parties with only the information necessary to carry out their assigned responsibility. All shareholder records will be disposed of in accordance with applicable law. We maintain physical, electronic and procedural safeguards to protect your non-public personal information and require third parties to treat your non-public personal information with the same high degree of confidentiality.
In the event that you hold shares of the Funds through a financial intermediary, including, but not limited to, a broker-dealer, bank or trust company, the privacy policy of your financial intermediary would govern how your non-public personal information would be shared with unaffiliated third parties.
97
PMC FUNDS
Additional Information
(Unaudited)
Tax Information
For the fiscal year ended August 31, 2022, certain dividends paid by the Funds may be subject to a maximum tax rate of 15%, as provided for by the Jobs and Growth Tax Relief Reconciliation Act of 2003. The percentage of dividends declared from ordinary income designated as qualified dividend income was as follows:
| | | | |
Core Fixed Income Fund | | | 0.00 | % |
Diversified Equity Fund | | | 100.00 | % |
For corporate shareholders, the percent of ordinary income distributions qualifying for the corporate dividends received deduction for the fiscal year ended August 31, 2022 was as follows:
| | | | |
Core Fixed Income Fund | | | 0.00 | % |
Diversified Equity Fund | | | 49.99 | % |
For the fiscal year ended August 31, 2022, taxable ordinary income distributions are designated as short-term capital gain distributions under Section 871(k)(2)(c) of the Code for the Funds as follows:
| | | | |
Core Fixed Income Fund | | | 15.90 | % |
Diversified Equity Fund | | | 0.00 | % |
Indemnification
Under the Trust’s organizational documents, its officers and Trustees are indemnified against certain liabilities arising out of the performance of their duties to the Funds. In addition, in the normal course of business, the Funds enter into contracts that provide general indemnifications to other parties. The Funds’ maximum exposure under these arrangements is unknown as this would involve future claims that may be made against the Funds that have not yet occurred. However, the Funds have not had prior claims or losses pursuant to these contracts and expect the risk of loss to be remote.
Information about Trustees
The business and affairs of the Trust are managed under the direction of the Trust’s Board of Trustees. Information pertaining to the Trustees of the Trust is set forth below. The Funds’ Statement of Additional Information includes additional information about the Trust’s Trustees and is available, without charge, upon request by calling (866) PMC-7338.
Independent Trustees
| | | | | | | | | | |
| | | | | | |
Name, Address and
Year of Birth
| | Position(s)
Held with
the Trust
| | Term of
Office and
Length of
Time Served
| | Number of
Portfolios
in the Trust
Overseen
by Trustee
| | Principal Occupation(s)
During the Past
Five Years
| | Other Directorships
Held by Trustee During
the Past Five Years
|
Michael D. Akers, Ph.D. 615 E. Michigan St. Milwaukee, WI 53202 Year of Birth: 1955 | | Trustee | | Indefinite Term; Since August 22, 2001 | | 22 | | Professor Emeritus, Department of Accounting (June 2019-present), Professor, Department of Accounting (2004-2019), Chair, Department of Accounting (2004-2017), Marquette University. | | Independent Trustee, USA MUTUALS (an open-end investment company (2001-2021). |
| | | | | |
Gary A. Drska 615 E. Michigan St. Milwaukee, WI 53202 Year of Birth: 1956 | | Trustee | | Indefinite Term; Since August 22, 2001 | | 22 | | Retired; Pilot, Frontier/Midwest Airlines, Inc. (airline company) (1986-2021). | | Independent Trustee, USA MUTUALS (an open-end investment company (2001-2021). |
98
PMC Funds
Additional Information (Continued)
(Unaudited)
| | | | | | | | | | |
| | | | | | |
Name, Address and
Year of Birth
| | Position(s)
Held with
the Trust
| | Term of
Office and
Length of
Time Served
| | Number of
Portfolios
in the Trust
Overseen
by Trustee
| | Principal Occupation(s)
During the Past
Five Years
| | Other Directorships
Held by Trustee During
the Past Five Years
|
| | | | | |
Vincent P. Lyles 615 E. Michigan St. Milwaukee, WI 53202 Year of Birth: 1961 | | Trustee | | Indefinite Term; Since April 6, 2022 | | 22 | | System Vice President of Community Relations, Advocate Aurora Health Care (health care provider) (2019-present); President and Chief Executive Officer, Boys & Girls Club of Greater Milwaukee (2012-2018). | | Independent Director, BMO Funds, Inc. (an open-end investment company) (2017–2022). |
| | | | | |
Erik K. Olstein 615 E. Michigan St. Milwaukee, WI 53202 Year of Birth: 1967 | | Trustee | | Indefinite Term; Since April 6, 2022 | | 22 | | Retired; President and Chief Operating Officer (2000-2020), Vice President of Sales and Chief Operating Officer (1995-2000), Olstein Capital Management, L.P. (asset management firm); Secretary and Assistant Treasurer, The Olstein Funds (1995-2018). | | Trustee, The Olstein Funds (an open-end investment company) (1995–2018). |
| | | | | |
Lisa Zúñiga Ramírez 615 E. Michigan St. Milwaukee, WI 53202 Year of Birth: 1969 | | Trustee | | Indefinite Term; Since April 6, 2022 | | 22 | | Retired; Principal and Senior Portfolio Manager, Segall, Bryant & Hamill, LLC (asset management firm) (2018-2020); Partner and Senior Portfolio Manager, Denver Investments LLC (asset management firm) (2009-2018). | | N/A |
| | | | | |
Gregory M. Wesley 615 E. Michigan St. Milwaukee, WI 53202 Year of Birth: 1969 | | Trustee | | Indefinite Term; Since April 6, 2022 | | 22 | | Senior Vice President of Strategic Alliances and Business Development, Medical College of Wisconsin (2016-present). | | N/A |
|
Interested Trustee and Officers |
| | | | | |
Joseph C. Neuberger* 615 E. Michigan St. Milwaukee, WI 53202 Year of Birth: 1962 | | Chairperson and Trustee | | Indefinite Term; Since August 22, 2001 | | 22 | | President (2017-present), Chief Operating Officer (2016-2020), Executive Vice President (1994-2017), U.S. Bancorp Fund Services, LLC. | | Trustee, Buffalo Funds (an open-end investment company) (2003-2017); Trustee, USA MUTUALS (an open-end investment company) (2001-2018). |
| | | | | |
John P. Buckel 615 E. Michigan St. Milwaukee, WI 53202 Year of Birth: 1957 | | President and Principal Executive Officer | | Indefinite Term; Since January 24, 2013 | | N/A | | Vice President, U.S. Bancorp Fund Services, LLC (2004-present). | | N/A |
| | | | | |
Jennifer A. Lima 615 E. Michigan St. Milwaukee, WI 53202 Year of Birth: 1974 | | Vice President, Treasurer and Principal Financial and Accounting Officer | | Indefinite Term; Since January 24, 2013 | | N/A | | Vice President, U.S. Bancorp Fund Services, LLC (2002-present). | | N/A |
| * | | Mr. Neuberger is deemed to be an “interested person” of the Trust as defined by the 1940 Act due to his position and material business relationship with the Trust. |
99
PMC Funds
Additional Information (Continued)
(Unaudited)
| | | | | | | | | | |
| | | | | | |
Name, Address and Year of Birth
| | Position(s) Held with the Trust
| | Term of Office and Length of Time Served
| | Number of Portfolios in the Trust Overseen by Trustee
| | Principal Occupation(s) During the Past Five Years
| | Other Directorships Held by Trustee During the Past Five Years
|
Deanna B. Marotz 615 E. Michigan St. Milwaukee, WI 53202 Year of Birth: 1965 | | Chief Compliance Officer, Vice President and Anti-Money Laundering Officer | | Indefinite Term; Since October 21, 2021 | | N/A | | Senior Vice President, U.S. Bancorp Fund Services, LLC (2021-present); Chief Compliance Officer of Keeley-Teton Advisors, LLC and Teton Advisors, Inc. (2017-2021); Chief Compliance Officer of Keeley Asset Management Corp. (2015-2017). | | N/A |
| | | | | |
Jay S. Fitton 615 E. Michigan St. Milwaukee, WI 53202 Year of Birth: 1970 | | Secretary | | Indefinite Term; Since July 22, 2019 | | N/A | | Assistant Vice President, U.S. Bancorp Fund Services, LLC (2019-present); Partner, Practus, LLP (2018-2019); Counsel, Drinker Biddle & Reath LLP (2016-2018). | | N/A |
| | | | | |
Kelly A. Strauss 615 E. Michigan St. Milwaukee, WI 53202 Year of Birth: 1987 | | Assistant Treasurer | | Indefinite Term; Since April 23, 2015 | | N/A | | Assistant Vice President, U.S. Bancorp Fund Services, LLC (2011-present). | | N/A |
| | | | | |
Laura Carroll 615 E. Michigan St. Milwaukee, WI 53202 Year of Birth: 1985 | | Assistant Treasurer | | Indefinite Term; Since August 20, 2018 | | N/A | | Assistant Vice President, U.S. Bancorp Fund Services, LLC (2007-present). | | N/A |
| | | | | |
Shannon Coyle 615 E. Michigan St. Milwaukee, WI 53202 Year of Birth: 1990 | | Assistant Treasurer | | Indefinite Term; Since August 26, 2022 | | N/A | | Officer, U.S. Bancorp Fund Services, LLC (2015-present). | | N/A |
100
A NOTE ON FORWARD LOOKING STATEMENTS
Except for historical information contained in this report for the Funds, the matters discussed in this report may constitute forward-looking statements made pursuant to the safe-harbor provisions of the Securities Litigation Reform Act of 1995. These include any Adviser, Sub-adviser or portfolio manager predictions, assessments, analyses or outlooks for individual securities, industries, market sectors and/or markets. These statements involve risks and uncertainties. In addition to the general risks described for the Funds in the current Prospectus, other factors bearing on this report include the accuracy of the Adviser’s, sub-adviser’s or portfolio manager’s forecasts and predictions, and the appropriateness of the investment programs designed by the Adviser, sub-adviser or portfolio manager to implement their strategies efficiently and effectively. Any one or more of these factors, as well as other risks affecting the securities markets and investment instruments generally, could cause the actual results of the Funds to differ materially as compared to benchmarks associated with the Funds.
ADDITIONAL INFORMATION
The Funds have adopted proxy voting policies and procedures that delegate to the Adviser the authority to vote proxies. A description of the Funds’ proxy voting policies and procedures is available without charge, upon request, by calling the Funds toll free at (866) PMC-7338. A description of these policies and procedures is also included in the Funds’ Statement of Additional Information, which is available on the SEC’s website at http://www.sec.gov.
The Funds’ proxy voting record for the most recent 12-month period ended June 30 is available without charge, either upon request by calling the Funds toll free at (866) PMC-7338 or by accessing the SEC’s website at http://www.sec.gov.
The Funds file their complete schedule of portfolio holdings with the SEC for the first and third quarters of each fiscal year on Part F of Form N-PORT. Shareholders may view the Funds’ filings on the SEC’s website at http://www.sec.gov.
HOUSEHOLDING
In an effort to decrease costs, the Funds intend to reduce the number of duplicate prospectuses and certain other shareholder documents you receive by sending only one copy of each to those addresses shared by two or more accounts and to shareholders we reasonably believe are from the same family or household. Once implemented, if you would like to discontinue householding for your accounts, please call toll-free at (866) PMC-7338 to request individual copies of these documents. Once the Funds receive notice to stop householding, we will begin sending individual copies 30 days after receiving your request. This policy does not apply to account statements.
PMC FUNDS
| | |
Investment Adviser | | Envestnet Asset Management, Inc. 35 E. Wacker Drive, Suite 2400 Chicago, Illinois 60601 |
| |
Legal Counsel | | Godfrey & Kahn, S.C. 833 East Michigan Street, Suite 1800 Milwaukee, Wisconsin 53202 |
| |
Independent Registered Public Accounting Firm | | Deloitte & Touche LLP 111 South Wacker Drive Chicago, Illinois 60606 |
| |
Transfer Agent, Fund Accountant and Fund Administrator | | U.S. Bancorp Fund Services, LLC 615 East Michigan Street Milwaukee, Wisconsin 53202 |
| |
Custodian | | U.S. Bank, N.A. Custody Operations 1555 North RiverCenter Drive, Suite 302 Milwaukee, Wisconsin 53212 |
| |
Distributor | | Foreside Fund Services, LLC 3 Canal Plaza, Suite 100 Portland, Maine 04101 |
This report is intended for shareholders of the Funds and may not be used as sales literature unless preceded or accompanied by a current prospectus.
(b) Not applicable.
Item 2. Code of Ethics.
The registrant has adopted a code of ethics that applies to the registrant’s principal executive officer and principal financial officer. The registrant has not made any substantive amendments to its code of ethics during the period covered by this report. The registrant has not granted any waivers from any provisions of the code of ethics during the period covered by this report. A copy of the registrant’s Code of Ethics is incorporated by reference to the Registrant’s Form N-CSR filed on November 9, 2009.
Item 3. Audit Committee Financial Expert.
The registrant’s board of Trustees has determined that there is at least one audit committee financial expert serving on its audit committee. Dr. Michael Akers is the “audit committee financial expert” and is considered to be “independent” as each term is defined in Item 3 of Form N-CSR. Dr. Akers holds a Ph.D. in accounting and is a professor Emeritus of accounting at Marquette University in Milwaukee, Wisconsin.
Item 4. Principal Accountant Fees and Services.
The registrant has engaged its principal accountant to perform audit services, audit-related services, tax services and other services during the past two fiscal years. “Audit services” refer to performing an audit of the registrant’s annual financial statements or services that are normally provided by the accountant in connection with statutory and regulatory filings or engagements for those fiscal years. “Audit-related services” refer to the assurance and related services by the principal accountant that are reasonably related to the performance of the audit. “Tax services” refer to professional services rendered by the principal accountant for tax compliance, tax advice, and tax planning. The following table details the aggregate fees billed or expected to be billed for each of the last two fiscal years for audit fees, audit-related fees, tax fees and other fees by the principal accountant.
| | | | | | | | |
| | | FYE 8/31/2022 | | | FYE 8/31/2021 | |
(a) Audit Fees | | $ | 67,900 | | | $ | 65,800 | |
(b) Audit-Related Fees | | $ | 0 | | | $ | 0 | |
(c) Tax Fees | | $ | 13,400 | | | $ | 13,000 | |
(d) All Other Fees | | $ | 0 | | | $ | 0 | |
(e)(1) The audit committee has adopted pre-approval policies and procedures that require the audit committee to pre-approve all audit and non-audit services of the registrant, including services provided to any entity affiliated with the registrant.
(e)(2) The percentage of fees billed by Deloitte & Touche LLP applicable to non-audit services pursuant to waiver of pre-approval requirement were as follows:
| | | | | | | | |
| | | FYE 8/31/2022 | | | FYE 8/31/2021 | |
Audit-Related Fees | | | 0 | % | | | 0 | % |
Tax Fees | | | 0 | % | | | 0 | % |
All Other Fees | | | 0 | % | | | 0 | % |
(f) All of the principal accountant’s hours spent on auditing the registrant’s financial statements were attributed to work performed by full-time permanent employees of the principal accountant.
(g) The following table indicates the non-audit fees billed or expected to be billed by the registrant’s accountant for services to the registrant and to the registrant’s investment adviser (and any other controlling entity, etc.—not sub-adviser) for the last two years.
| | | | | | | | |
Non-Audit Related Fees | | FYE 8/31/2022 | | | FYE 8/31/2021 | |
Registrant | | $ | 0 | | | $ | 0 | |
Registrant’s Investment Adviser | | $ | 0 | | | $ | 0 | |
(h) The audit committee of the board of trustees/directors has considered whether the provision of non-audit services that were rendered to the registrant’s investment adviser is compatible with maintaining the principal accountant’s independence and has concluded that the provision of such non-audit services by the accountant has not compromised the accountant’s independence.
(i) Not applicable.
(j) Not applicable.
Item 5. Audit Committee of Listed Registrants.
Not applicable to registrants who are not listed issuers (as defined in Rule 10A-3 under the Securities Exchange Act of 1934).
Item 6. Investments.
| (a) | Schedule of Investments is included as part of the report to shareholders filed under Item 1 of this Form. |
Item 7. Disclosure of Proxy Voting Policies and Procedures for Closed-End Management Investment Companies.
Not applicable to open-end investment companies.
Item 8. Portfolio Managers of Closed-End Management Investment Companies.
Not applicable to open-end investment companies.
Item 9. Purchases of Equity Securities by Closed-End Management Investment Company and Affiliated Purchasers.
Not applicable to open-end investment companies.
Item 10. Submission of Matters to a Vote of Security Holders.
There have been no material changes to the procedures by which shareholders may recommend nominees to the registrant’s board of trustees.
Item 11. Controls and Procedures.
| (a) | The Registrant’s President and Treasurer have reviewed the Registrant’s disclosure controls and procedures (as defined in Rule 30a-3(c) under the Investment Company Act of 1940 (the “Act”)) as of a date within 90 days of the filing of this report, as required by Rule 30a-3(b) under the Act and Rules 13a-15(b) or 15d-15(b) under the Securities Exchange Act of 1934. Based on their review, such officers have concluded that the disclosure controls and procedures are effective in ensuring that information required to be disclosed in this report is appropriately recorded, processed, summarized and reported and made known to them by others within the Registrant and by the Registrant’s service provider. |
| (b) | There were no changes in the Registrant’s internal control over financial reporting (as defined in Rule 30a-3(d) under the Act) that occurred during the last fiscal half-year covered by this report that has materially affected, or is reasonably likely to materially affect, the Registrant’s internal control over financial reporting. |
Item 12. Disclosure of Securities Lending Activities for Closed-End Management Investment Companies.
Not applicable to open-end investment companies.
Item 13. Exhibits.
(2) A separate certification for each principal executive and principal financial officer pursuant to Section 302 of the Sarbanes-Oxley Act of 2002. Filed herewith.
(3) Any written solicitation to purchase securities under Rule 23c-1 under the Act sent or given during the period covered by the report by or on behalf of the registrant to 10 or more persons. Not applicable to open-end investment companies.
(4) Change in the registrant’s independent public accountant. There was no change in the registrant’s independent public accountant for the period covered by this report.
SIGNATURES
Pursuant to the requirements of the Securities Exchange Act of 1934 and the Investment Company Act of 1940, the registrant has duly caused this report to be signed on its behalf by the undersigned, thereunto duly authorized.
| | |
| (Registrant) | | Trust for Professional Managers |
| |
| By (Signature and Title)* | | /s/ John Buckel |
| | John Buckel, President |
| |
| Date | | 10/27/2022 |
Pursuant to the requirements of the Securities Exchange Act of 1934 and the Investment Company Act of 1940, this report has been signed below by the following persons on behalf of the registrant and in the capacities and on the dates indicated.
| | |
| By (Signature and Title)* | | /s/ John Buckel |
| | John Buckel, President |
| |
| Date | | 10/27/2022 |
| |
| By (Signature and Title)* | | /s/ Jennifer Lima |
| | Jennifer Lima, Treasurer |
| |
| Date | | 10/27/2022 |
| * | Print the name and title of each signing officer under his or her signature. |