As filed with the U.S. Securities and Exchange Commission on [date]
UNITED STATES
SECURITIES AND EXCHANGE COMMISSION
Washington, D.C. 20549
FORM N-CSR
CERTIFIED SHAREHOLDER REPORT OF REGISTERED
MANAGEMENT INVESTMENT COMPANIES
Investment Company Act file number 811-10401
Trust for Professional Managers
(Exact name of registrant as specified in charter)
615 East Michigan Street
Milwaukee, WI 53202
(Address of principal executive offices) (Zip code)
Jay S. Fitton
U.S. Bancorp Fund Services, LLC
615 East Michigan Street
Milwaukee, WI 53202
(Name and address of agent for service)
(513) 629-8104
Registrant’s telephone number, including area code
Date of fiscal year end: December 31, 2021
Date of reporting period: December 31, 2021
Item 1. Reports to Stockholders.
Marketfield Fund
Annual Report

December 31, 2021
Investment Adviser
Marketfield Asset Management LLC
369 Lexington Avenue
3rd Floor
New York, New York 10017
www.marketfield.com
Table of Contents
Marketfield Fund Annual Report 2021
Chairman’s Report
Class I shares of Marketfield Fund generated a return of 8.58% for the fiscal year ended December 31, 2021, compared to a total return of 28.71% for the S&P 500 (SPX) Index. Although happy to be in comfortable positive territory for 2021, we are disappointed that our relative return has lagged a passive index allocation to this degree, particularly since our actual economic thesis of strong cyclical growth and surging inflation has proved to be quite accurate over the last 12 months.
As far as the 4th quarter is concerned, most of our long side allocations performed quite strongly. Japan was the only significant allocation to fail to do so, with the very weak Japanese Yen (JPY) wiping out gains in local terms and leading to a flat performance. We reduced our exposure to unhedged Japanese equities toward the end of the quarter, but still believe that the high cyclical weights of this market should help it make further progress in 2022. Sector performance was led by Industrials (Transportation, Machinery and Conglomerates), Energy and Consumer Discretionary (Homebuilding). We continued to add to Industrials and Energy holdings over the course of the quarter, but reduced homebuilding, selling an underperforming builder in mid-quarter.
Short allocations rose somewhat less than the overall market, but were still a drag on performance. Toward the end of the quarter there were increasing signs that the high multiple Software sector was at risk of breaking down, but the majority of the recent decline in this sector did not happen until the year had been completed.
Looking at 2021 overall, the problem that we encountered was a long period of dislocation between economic data and corporate news in the cyclical portions of the global equity market. The year started off very strongly, and also closed quite nicely, but there was a sharp mid-year drawdown for the majority of our long sided exposure, which was followed by a long, dreary consolidation for many of our holdings. Very few of our positions gave us pause for concern in absolute terms, either in terms of corporate news or actual market performance, but they clearly failed to benefit from the strong allocations made to the market leading growth sectors that dominated global performance during the second half of 2021.
This performance reflected the consensus view that the very strong performance of the durable goods economy would start to ebb as spending on consumer services started to recover, and also that the inflationary pressures of early 2021 would prove to be “transitory”. This encouraged the belief that interest rates would stay lower for longer, and that the very high valuations of growth equities could be supported. As new investor allocations continued to take growth multiples higher, the relative performance gap opened up further and encouraged yet more new capital to follow this path. This resulted in a very frustrating period for holders of cyclical portfolios such as ourselves, with most of our positions consolidating over the second half of the year.
With 2021 now complete, it is clear that both assumptions have proved to be flawed, although it will require the release of Q4 2021 earnings to really hammer home how strongly cyclical demand for goods has been in recent months. The fears that logistical constraints would restrict sales or that costs would depress margins acted to dampen investor enthusiasm, but both risks look to have been exaggerated. Meanwhile, inflation has gone from being a problem that most assumed would “fix itself” to becoming a key influence on the Federal Reserve tearing up its dovish forward guidance right at the end of 2021.
This has created a significant vulnerability for highly valued growth equities, as the very early performance in 2022 has demonstrated. We believe that the story of the upcoming months will be a protracted struggle between the Federal Reserve and the inflationary forces that they have allowed to build up in recent quarters. It seems much more likely that their efforts will disrupt the progress of the growth equity bull market than they create an effective reversal of the inflationary impulse.
1
The portfolio also suffered to some degree from its non-U.S. dollar (USD) exposure. Markets such as the United Kingdom and Australia performed quite well in local currency terms, but currency losses trimmed this effect in USD returns. Again, this reflects the strong preference for global allocations towards growth (which is dominated by USD listed stocks) over cyclical exposure. We do not believe that the USD will continue to make strong gains against its G7 peers, and may actually lose ground if the market loses confidence in the ability of the Federal Reserve to close the gap between policy yields and inflation. It remains unclear whether yields, currencies or equities will see the greatest revaluation effect from a lengthy period of high inflation, and we therefore are willing to spread our bets out quite widely at the current time, and we remain patient with our non-U.S. allocations.
January 14, 2022
Michael Shaoul
Chairman, CEO & Portfolio Manager
2
Chief Investment Officer’s Report
CRYPTONIGHT
Every credit cycle and the asset deflations that follow are similar in form but distinct in content. The specifics of each episode are without direct precedent, allowing them to escape the scrutiny of modern risk management and macroeconomic models. Policy response is inevitably late and only assumes some measure of urgency once a full-blown emergency is at hand.
The only reliable indicia of coming calamity are mostly qualitative. They point more to the usual psychological antecedents of crisis rather than any quantitative danger signs. The latter normally fall into the vague category of “wow, that is a really big number” or “I’ve never seen anything like it.” The quantitative extremes of cresting credit cycles overtax the human imagination, inducing the sort of numbness that precludes much reasoned response.
Not many observers knew what to make of the fact that in 1989, the garden of the Emperor’s Palace in central Tokyo was presumably worth more than all of the land in the California. People confronted with this proposition were mostly in the “wow” camp, and continued ordering workers’ uniforms and commissioning writers to come up with a company song in the mold of the great Japanese enterprises. The Nikkei Index crested at 40,000, and 32 years on we have only 10,000 points left to return to that level.
Real manias have important features in common. All are built around truly outstanding cores, without which a broad, convincing thesis could not arise. Japan was and remains an excellent industrial and technological venue. The much-touted potential of the Internet proposed in 1999 and 2000 was probably not optimistic enough. Tulips are actually beautiful.
A backdrop of excess liquidity and credit availability allows ordinary speculative forays to metastasize. A telltale sign is the development of secondary and tertiary derivatives of lesser quality where different but related markets begin to reflect the enthusiasm of the core narrative.
Oil’s bull market in the 1970s gave rise to a housing mania in the oil belt, the development of the Denver Stock Exchange, the growth of commodity based hedge funds that formed the basis of the modern hedge fund industry and a decade long rotation from consumer growth stocks (the Nifty Fifty) into anything vaguely related to the industrial processes involved in finding, producing and distributing oil and gas. The whole episode ended in tears as Paul Volker’s team continued tightening until rates reached 20% on the short end and 16% on the 10 year bond. The climactic sequence was the rise and fall of the Hunt Brothers who, in 1980, had the means (on paper) to buy 40% of all of the long-term bonds issued by the U.S. Treasury. Instead, they bought more silver to add to their leveraged energy bets in the true style of the Texas hedge.
Credit fueled manias persist until the supply and cost of additional monetary leverage becomes insufficient to hold up the gigantic corpus of inflated assets. It is not possible to predict the point at which monetary abundance transitions to scarcity other than by observing the constellation of effects that always mark a dying credit cycle.
The tendency among central banks is to tighten until something breaks, and then back off. This sequence usually plays out in several acts.
A first foray into tightening usually spurs some final liquidation of the deflating remnants of a previous boom. The rise in rates during early 1984 led to the final liquidation of energy assets and a collapse of the financial institutions still nursing their oil-patch loans along. The Savings & Loan (S&L) crisis joined the collapse of Continental Illinois and Penn Square to prod the Fed into reversing its tightening mode on a dime and embark on a new cycle of rate cuts that lasted for the next two years.
3
Robust economic data and booming financial markets prompted an immediate turn toward tightening policy, which persisted for a year until the stock market crash in October of 1987. In spite of the strength in the real economy, the shock of the market collapse led the Fed to quickly reverse course.
The market sequence that followed shines a light on the typical path of manic progressions.
Rate cuts meant to address some unsettling occurrence prompted by a tightening cycle only serve to hyper-stimulate any themes already in favor. The resulting bull market on top of an existing bull market convinces investors that the assets or markets in question are invulnerable and invaluable. Enthusiasm breaks free of any boundaries of valuation.
Japan was the focus of the speculative fever before and especially after the 1987 crash. The Nikkei Index, spurred by the loosening of monetary policy and still strong economic activity, quickly rose to ever-higher records. The mania and the inevitable deflation to follow was fully entrenched.
The collapse of Long-Term Capital Management (LTCM) and the final remnants of the Asian crisis led the Fed to ease into a strong economy in the middle of 1998. Technology stocks in the U.S., immune from the fallout of Emerging Market (EM) bonds and currencies, took off in a straight line and never stopped until the bubble peaked in the first quarter of 2000.
Now to the current cycle. The Fed began tightening five years ago, beginning to pare back the balance sheet and moving the funds rate near neutral levels by late 2018. In response to weakness in Europe and concern that the inflation rate might not rise to the target level of 2% (sarcasm omitted), the Board, with rare multiple dissents, began another cycle of ease during the summer of 2019. Rates were cut three times into the first quarter of 2020, despite a strong and improving economy. Stocks took off and the economy accelerated.
And then came the virus.
In two months, a panic-stricken Fed cut rates to near zero, and began Mega- QE (Quantitative Easing). The balance sheet rapidly grew by more than $2.5 trillion. This was easing without precedent, on top of an historic cycle of central bank expansion.
Populations retreated. The Treasury Department pumped massive amounts of cash directly into private bank accounts and a brief market panic quickly morphed into euphoria.
Going into early 2020, the market was led higher by the large cap technology names that formed the backbone of the digital economy and supported countless applications that fed from it. The combination of a societal lockdown, negligible interest rates and oceans of cash flowing from governments to consumers was the equivalent of a supersonic tailwind for the SAP (stay and play) theme. Investing became just one more popular video game.
In 18 months, the market capitalization of the Nasdaq 100 grew by ten trillion dollars or, in appropriate notation, $1 x 10¹³. We can assume that the staff at the Fed now includes at least one member well versed in astrophysics in order to handle the numbers being generated by current policy.
Systemic manias produce a broad array of social and financial effects beyond the primary objects of adulation. It is why the aftermaths are so destructive and far-reaching. Rembrandt lost his townhouse to foreclosure in the wake of the Dutch Tulip episode. Longhorn hood ornaments, alligator boots and ranchland were plentiful at sheriff’s sales after the collapse of the oil boom, as were $400 neckties, bespoke suits and reservations at the most expensive New York restaurants, once the junk bond universe and its Masters imploded in the early 1990s.
4
The boom of the past decade has its own interesting morphology and ornamentation.
The progenitors and stewards of the modern digital universe comprise a cohort of young men (overwhelmingly so) displaying a particular phenotype. They are, for the most part, much more comfortable in front of a screen writing code or shooting down alien ships than they are in direct, face-to-face social interaction.
The recent confluence of unlimited liquidity, soaring stock prices, supercomputers for all and a world in which the entire population is forced into social isolation has brought forth Nirvana in the metaverse. We are all socially awkward now.
Emanating from the core of the digital world is a new galaxy of different but related pastimes and amusements. These form the basis of what might be termed a “Tribeca Hedge”, in which portfolios appear to be diversified but are really extending one thematic trade into increasingly risky and illiquid derivative themes.
Sports betting, marijuana farming, gaming, streaming, virtual reality, meme stock trading, antisocial media, constant gratification by delivery, non-fungible tokens (NFTs), aka invisible status symbols and the like all constitute a single, intertwined world.
Integral to the function (or dysfunction) of this parallel universe is crypto currency, the imaginary money for the imaginary world that knows no boundaries or rules. The core block chain technology at its heart has valuable features for recordkeeping and digitizing transactions, but the notion that it constitutes a robust store of value that can be assured by the assent of a group of anonymous “miners” laboring over ever more cumbersome factoring challenges if they care to, seems like a mass delusion.
Our purpose in scrutinizing this aspect of the contemporary financial scene rather than sports betting or some other sinkhole associated with the democratization of speculation is a matter of sheer size and breadth.
The notional balance of crypto currency holdings worldwide is somewhere in the neighborhood of $2 trillion. There is almost no way to put this into any useful context, other than to point out that it is about twice the size as all retail holdings of money market funds.
Crypto currency has, by dint of its notional size, immense leverage and lack of legal framework, the ability to precipitate a meaningful, global crisis should it experience the typical deflationary cycle endemic to the most novel, speculative elements of a hypertrophic credit boom.
“Why now?” one might ask.
The short answer is that the Fed is finally looking like it will take the inflation tsunami seriously and move away from the beach. Too little too late to check the price momentum in the real economy, but likely enough tightening to undermine the most fragile, leverage dependent elements of the boom.
Several qualitative indicators available at the outset of a new year are finally flashing red. The most important of these is the Super Bowl advertising lineup, and its close cousin, the stadium naming cycle.
Both are pretty reliable correlates of corporate hubris and access to piles of easy money. The record is good.
Many of the first time advertisers over the past three decades are no longer with us. The same is true for companies signing long-term stadium naming deals. This phenomenon is particularly evident when the corporate action is part of a larger foray within its peer group. We will not name individual names, but suffice it to say that a cursory research effort will confirm the indicator’s value.
5
A more conventional timing signal comes from the actions and intentions of central banks, particularly the Federal Reserve given the status of the dollar in global finance and commerce. We had thought that this process commenced five years ago, not appreciating the depth of the pointless fears about deflation that gripped the whole, inbred family of central bankers.
Now that they have piled on another bout of quantitative easing, balance sheet expansion and wealth transfers to borrowers from savers, the inflation die is cast. Four or five or six small rate hikes will not change anything in the real economy, other than destroying the enormous stock of notional wealth that has remained on paper and in the ether.
Deflation of the imaginary universe in which so many young people around the world are stranded will have profound effect in the investment realm.
The large, profit-making core companies in the technology arena will survive, albeit at reduced valuations. The coalition of the hopeful, including all-stage venture investing, Special Purpose Acquisition Companies (SPACS), a great deal of the private equity universe and the whole imaginary money system will suffer mightily. Certain portions of the luxury markets will seize up as those desperate to exchange their crypto currencies for some item or property of estimable value will be hamstrung by dwindling liquidity.
We are expecting a substantial number of Madoff-like scandals, where client monies have simply vanished into the surf on some Caribbean Island where accounts were supposedly held.
One important feature of the risks posed by a rush for the exits in unconventional assets is the likelihood that no lender of last resort, i.e., a central bank or sovereign treasury, will step in to alleviate the panic. We have no idea how many traditional financial institutions with implicit backing from monetary and fiscal authorities have taken the plunge into the meta-money pool, but it is probably a small enough list to preclude any systemic interventions, at least in the Western World.
2022 is likely to feature alternating hearings in Congress, oscillating between the “How could you have lost so much of your customers money?” and “How could you make so much money selling machine parts?” With a President who believes that inflation is being conjured by Big Meat, Big Vegetable, Big Oil, Big Tractor, Big Wood and the like, there is little prospect of any sane response to what is likely to be a bout of double digit inflation and critical shortages.
If the technology sector continues to run into valuation, regulatory and competitive pressures, its sheer weight in the major indices makes positive equity performance at the index level unlikely. However, it is quite possible for more generally cyclical sectors to continue to advance, together with non-U.S. indexes that have little or no technology weighting. We may be entering a cycle where active management can easily outperform passive simply by steering clear of the epicenter of the asset deflation that is likely as the tightening cycle progresses.
Jan. 14, 2022
Michael C. Aronstein
President, CIO & Portfolio Manager
The foregoing represents the opinions of the Chairman, CEO & Portfolio Manager and of the President, CIO & Portfolio Manager, respectively, and are not intended to be a forecast of future events, a guarantee of future results, or investment advice.
6
Definitions:
NASDAQ-100 is an index which includes 100 of the world’s largest non-financial companies listed on the wider NASDAQ stock market based on their market capitalization.
Nikkei Index is a price-weighted index consisting of 225 prominent stocks on the Tokyo Stock Exchange.
The S&P 500® Index is a trademark of McGraw Hill Financial Inc. The S&P 500® Index is widely regarded as the standard index for measuring large-cap U.S. stock market performance. The securities holdings and volatility of the Fund differ significantly from the stocks that make up the S&P 500 Index. An investment cannot be made directly into an index.
Past performance does not guarantee future results
The Marketfield Fund is managed by Marketfield Asset Management LLC (the “Adviser”) and distributed by Quasar Distributors, LLC.
Must be preceded or accompanied by a current prospectus.
Mutual fund investing involves risk. Principal loss is possible. Before considering an investment in the Fund, you should understand that you could lose money.
The Fund regularly makes short sales of securities, which involves the risk that losses may exceed the original amount invested. The Fund may invest in derivatives, which may increase the volatility of the Fund’s NAV and may result in a loss to the Fund. The Fund may also use options and futures contracts, which have the risks of unlimited losses of the underlying holdings due to unanticipated market movements and failure to correctly predict the direction of securities prices, interest rates, and currency exchange rates. However, a mutual fund investor’s risk is limited to the amount invested in a fund. Investments in absolute return strategies are not intended to outperform stocks and bonds during strong market rallies. Investments in exchange-traded funds are subject to additional risks that do not apply to conventional mutual funds, including the risks that the market price of the shares may trade at a discount to its net asset value (“NAV”), an active secondary trading market may not develop or be maintained, or trading may be halted by the exchange in which they trade, which may impact the Fund’s ability to sell such shares.
Foreign securities are subject to interest rate, currency exchange rate, economic, and political risks. These risks may be greater for emerging markets. Investing in smaller companies involves special risks, including higher volatility and lower liquidity. Investing in mid-cap stocks may carry more risk than investing in stocks of larger, more well-established companies. This risk is usually greater for longer term debt securities. Investment by the Fund in lower rated and non-rated securities presents a greater risk of loss to principal and interest than higher-rated securities. Investments in asset-backed and mortgage-backed securities involve additional risks such as credit risk, prepayment risk, possible illiquidity and default, and increased susceptibility to adverse economic developments. Investing in the Fund involves the risk that the macroeconomic trends identified by portfolio management will not come to fruition and their advantageous duration may not last as long as portfolio management forecasts.
7
MARKETFIELD FUND
Expense Example
(Unaudited)
As a shareholder of the Fund, you incur two types of costs: (1) transaction costs, including sales charges (loads) on purchases (as applicable), and (2) ongoing costs, including management fees, distribution and/or service (12b-1) fees (as applicable), and other Fund expenses (as applicable). This example is intended to help you understand your ongoing costs (in dollars) of investing in the Fund and to compare these costs with the ongoing costs of investing in other funds. The example is based on an investment of $1,000 made at the beginning of the six-month period and held for the entire period from July 1, 2021 to December 31, 2021.
This example illustrates the Fund’s ongoing costs in two ways:
The first lines of the following tables provide information about actual account values and actual expenses. If you purchase Class A shares of the Fund you will pay an initial sales charge of up to 5.50% when you invest. A contingent deferred sales charge (“CDSC”) may be imposed on certain redemptions of Class A shares redeemed within twelve months of purchase. Class C shares are subject to a CDSC of 1.00% for shares redeemed within twelve months of purchase. In addition, you will be assessed fees for outgoing wire transfers, returned checks and stop payment orders at prevailing rates charged by U.S. Bancorp Fund Services, LLC, the Fund’s transfer agent. If you request that a redemption be made by wire transfer, currently a $15.00 fee is charged by the Fund’s transfer agent. IRA accounts will be charged a $15.00 annual maintenance fee. To the extent the Fund invests in shares of exchange-traded funds or other investment companies as part of its investment strategy, you will indirectly bear your proportionate share of any fees and expenses charged by the underlying funds in which the Fund invests in addition to the expenses of the Fund. Actual expenses of the underlying funds are expected to vary among the various underlying funds. These expenses are not included in the example. The example includes, but is not limited to, management fees, fund administration and accounting, custody and transfer agent fees. You may use the information in these lines, together with the amount you invested, to estimate the expenses that you paid over the period. Simply divide your account value by $1,000 (for example, an $8,600 account value divided by $1,000 = 8.6), then multiply the result by the number in the fourth column under the heading entitled “Expenses Paid During Period” to estimate the expenses you paid on your account during this period.
| | Hypothetical | | Example for Comparison Purposes |
The second lines of the tables below provide information about hypothetical account values and hypothetical expenses based on the Fund’s actual expense ratio and an assumed rate of return of 5% per year before expenses, which is not the Fund’s actual return. The hypothetical account values and expenses may not be used to estimate the actual ending account balances or expenses you paid for the six-month period shown. You may use this information to compare the ongoing costs of investing in the Fund with the ongoing costs of investing in other funds. To do so, compare this 5% hypothetical example with the 5% hypothetical examples that appear in the shareholder reports of other funds.
Please note that the expenses shown in the tables are meant to highlight your ongoing costs only and do not reflect any transactional costs, such as sales charges (loads). Therefore, the second lines of the tables are useful in comparing ongoing costs only and will not help you determine the relative total costs of owning different funds. In addition, if these transactional costs were included, your costs would have been higher.
8
MARKETFIELD FUND
Expense Example (continued)
(Unaudited)
| | | | | | | | | | | | |
| | | Class A
| |
| | | Beginning
Account Value
July 1, 2021
| | | Ending
Account Value
December 31, 2021
| | | Expenses Paid
During Period
July 1, 2021 -
December 31, 2021*
| |
Actual | | $ | 1,000.00 | | | $ | 1,026.10 | | | $ | 11.08 | |
Hypothetical (5% return before expenses) | | $ | 1,000.00 | | | $ | 1,014.27 | | | $ | 11.02 | |
| | * | | Expenses are equal to the Class A shares’ annualized expense ratio of 2.17%, multiplied by the average account value over the period, multiplied by 184/365 to reflect the one-half year period. |
| | | | | | | | | | | | |
| | | Class C
| |
| | | Beginning
Account Value
July 1, 2021
| | | Ending
Account Value
December 31, 2021
| | | Expenses Paid
During Period
July 1, 2021 -
December 31, 2021*
| |
Actual | | $ | 1,000.00 | | | $ | 1,021.80 | | | $ | 14.98 | |
Hypothetical (5% return before expenses) | | $ | 1,000.00 | | | $ | 1,010.38 | | | $ | 14.90 | |
| | * | | Expenses are equal to the Class C shares’ annualized expense ratio of 2.94%, multiplied by the average account value over the period, multiplied by 184/365 to reflect the one-half year period. |
| | | | | | | | | | | | |
| | | Class I
| |
| | | Beginning
Account Value
July 1, 2021
| | | Ending
Account Value
December 31, 2021
| | | Expenses Paid
During Period
July 1, 2021 -
December 31, 2021*
| |
Actual | | $ | 1,000.00 | | | $ | 1,027.00 | | | $ | 9.86 | |
Hypothetical (5% return before expenses) | | $ | 1,000.00 | | | $ | 1,015.48 | | | $ | 9.80 | |
| | * | | Expenses are equal to the Class I shares’ annualized expense ratio of 1.93%, multiplied by the average account value over the period, multiplied by 184/365 to reflect the one-half year period. |
9
MARKETFIELD FUND
Investment Highlights
(Unaudited)
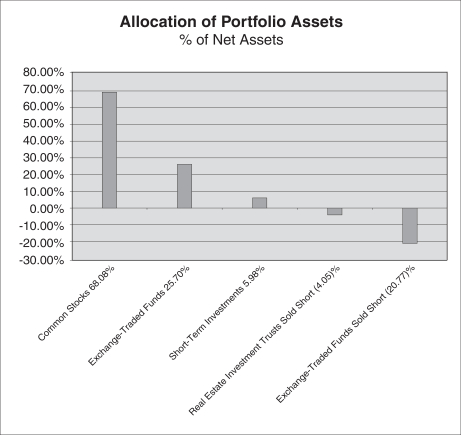
The investment objective of the Fund is capital appreciation. The Fund seeks to achieve its investment objective by allocating the Fund’s assets among investments in equity securities, fixed-income securities, and other investment companies, including exchange-traded funds (“ETFs”), in proportions consistent with Marketfield Asset Management LLC’s (the “Adviser”) evaluation of their expected risks and returns. In making these allocations, the Adviser considers various factors, including macroeconomic conditions, corporate earnings at a macroeconomic level, anticipated inflation and interest rates, consumer risk and the Adviser’s perception of the outlook of the capital markets as a whole. The Adviser may allocate the Fund’s investments between equity securities and fixed-income securities at its discretion, without limitation. The Fund may also engage in short sales of securities or other derivative type transactions. The Fund’s allocation of portfolio assets as of December 31, 2021 is shown below.
10
MARKETFIELD FUND
Investment Highlights (continued)
(Unaudited)
Average Annual Total Returns as of December 31, 2021
| | | | | | | | | | | | | | | | | | | | |
Class
| | Sales Charge
| | | | 1 Year
| | | 5 Years
| | | 10 Years
| | | Since
Inception
(7/31/2007)
| |
Class A(1) | | Maximum 5.5% Initial Sales Charge | | With sales charge | | | 2.37 | % | | | 7.51% | | | | 3.89 | % | | | 5.06 | % |
| | | | | Excluding sales charge | | | 8.32 | % | | | 8.73% | | | | 4.48 | % | | | 5.47 | % |
Class C(1) | | Maximum 1% CDSC if Redeemed within | | With sales charge | | | 6.51 | % | | | 7.91% | | | | 3.68 | % | | | 4.67 | % |
| | | One Year of Purchase | | Excluding sales charge | | | 7.51 | % | | | 7.91% | | | | 3.68 | % | | | 4.67 | % |
Class I(2) | | No Sales Charge | | | | | 8.58 | % | | | 9.00% | | | | 4.72 | % | | | 5.72 | % |
S&P 500 Index | | | | | | | 28.71 | % | | | 18.47% | | | | 16.55 | % | | | 10.84 | % |
Performance data quoted represents past performance and does not guarantee future results. The investment return and principal value of an investment will fluctuate so that an investor’s shares, when redeemed, may be worth more or less than their original cost. Current performance of the Fund may be lower or higher than the performance quoted. Performance data current to the most recent month end may be obtained by calling (800) 311-MKTD (6583) or is available in the Fund’s website at www.marketfieldfund.com.
The returns shown assume reinvestment of Fund distributions and do not reflect the deduction of taxes that a shareholder would pay on Fund distributions or the redemption of Fund shares. The following graph illustrates performance of a hypothetical investment made in the Fund and certain broad-based securities indices on the Fund’s inception date. The graph does not reflect any future performance.
The Total Annual Fund Operating Expenses in the Prospectus dated April 30, 2021 are 2.91%, 3.62% and 2.63% for Class A, Class C and Class I shares, respectively.
The S&P 500® Index is a broad-based measurement of changes in stock market conditions based on a capitalization-weighted average of 500 leading companies representing all major industries in the U.S. economy. It is not possible to invest directly in an index.
| (1) | | Performance figures for Class A and Class C shares, first offered on October 5, 2012, include the historical performance of Class I shares through October 4, 2012 and are adjusted to reflect differences in fees and expenses. Performance data for the classes varies based on differences in their fee and expense structures. The Fund commenced operations on July 31, 2007. Unadjusted, the performance for the newer classes would likely have been different. |
| (2) | | Performance figures for Class I shares prior to April 8, 2016 reflect the historical performance of the then-existing shares of the MainStay Marketfield Fund, a series of MainStay Funds Trust (the predecessor to the Fund, which was subject to a different fee structure, and for which the Adviser served as the investment sub-adviser) for periods from October 5, 2012 to April 8, 2016. The performance figures also reflect the historical performance of the then-existing shares of the predecessor fund to the MainStay Marketfield Fund (which was subject to a different fee structure, and for which a predecessor entity to the Adviser served as the investment adviser) for periods prior to October 5, 2012. |
11
MARKETFIELD FUND
Investment Highlights (continued)
(Unaudited)
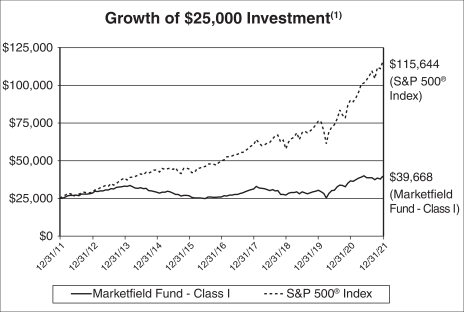
| (1) | | The minimum investment for Class I shares is $25,000 for individual investors. There is no minimum investment for Class I shares for institutional investors. The graph does not illustrate performance for a hypothetical investment made in Class A or Class C shares. If shown, the growth of the investment of Class A or Class C shares would have been lower than Class I shares to the extent those classes have lower minimum investments and sales loads. |
12
MARKETFIELD FUND
Schedule of Investments
December 31, 2021
| | | | | | | | |
| | |
| | | Shares
| | | Value
| |
| COMMON STOCKS — 68.08% | | | | | | | | |
| | |
| Auto Components — 0.22% | | | | | | | | |
Continental AG(a)(b) | | | 3,219 | | | $ | 341,232 | |
| | | | | | |
|
|
|
| Building Products — 1.11% | | | | | | | | |
TOTO Ltd.(a) | | | 37,586 | | | | 1,728,505 | |
| | | | | | |
|
|
|
| Chemicals — 2.89% | | | | | | | | |
The Sherwin-Williams Co. | | | 12,765 | | | | 4,495,322 | |
| | | | | | |
|
|
|
| Electrical Equipment — 4.33% | | | | | | | | |
Eaton Corp PLC | | | 16,680 | | | | 2,882,638 | |
Rockwell Automation, Inc. | | | 11,083 | | | | 3,866,304 | |
| | | | | | |
|
|
|
| | | | | | | | 6,748,942 | |
| | | | | | |
|
|
|
| Electronic Equipment, Instruments & Components — 3.32% | | | | | | | | |
Keyence Corp.(a) | | | 8,224 | | | | 5,167,615 | |
| | | | | | |
|
|
|
| Energy Equipment & Services — 1.97% | | | | | | | | |
Schlumberger Ltd. | | | 102,443 | | | | 3,068,168 | |
| | | | | | |
|
|
|
| Food & Staples Retailing — 2.58% | | | | | | | | |
Costco Wholesale Corp.(c) | | | 7,064 | | | | 4,010,233 | |
| | | | | | |
|
|
|
| Health Care Equipment & Supplies — 3.94% | | | | | | | | |
Intuitive Surgical, Inc.(b)(c) | | | 17,092 | | | | 6,141,156 | |
| | | | | | |
|
|
|
| Hotels, Restaurants & Leisure — 0.63% | | | | | | | | |
Dalata Hotel Group PLC(a)(b) | | | 230,917 | | | | 977,983 | |
| | | | | | |
|
|
|
| Household Durables — 6.53% | | | | | | | | |
DR Horton, Inc.(c) | | | 58,525 | | | | 6,347,036 | |
Lennar Corp. — Class A | | | 32,933 | | | | 3,825,498 | |
| | | | | | |
|
|
|
| | | | | | | | 10,172,534 | |
| | | | | | |
|
|
|
| Industrial Conglomerates — 2.46% | | | | | | | | |
Honeywell International, Inc. | | | 12,688 | | | | 2,645,575 | |
Siemens AG(a) | | | 6,813 | | | | 1,184,276 | |
| | | | | | |
|
|
|
| | | | | | | | 3,829,851 | |
| | | | | | |
|
|
|
| Machinery — 9.21% | | | | | | | | |
Caterpillar, Inc. | | | 17,593 | | | | 3,637,177 | |
Cummins, Inc. | | | 16,427 | | | | 3,583,386 | |
Deere & Co. | | | 12,516 | | | | 4,291,611 | |
The Toro Co. | | | 28,331 | | | | 2,830,550 | |
| | | | | | |
|
|
|
| | | | | | | | 14,342,724 | |
| | | | | | |
|
|
|
| Metals & Mining — 10.05% | | | | | | | | |
Barrick Gold Corp.(a)(c) | | | 151,120 | | | | 2,871,280 | |
Compania de Minas Buenaventura SAA — ADR(b) | | | 108,734 | | | | 795,933 | |
MMC Norilsk Nickel PJSC — ADR | | | 105,916 | | | | 3,275,982 | |
Newmont Corp.(c) | | | 57,768 | | | | 3,582,771 | |
Rio Tinto PLC — ADR(c) | | | 40,264 | | | | 2,695,272 | |
Vale SA — ADR | | | 172,547 | | | | 2,419,109 | |
| | | | | | |
|
|
|
| | | | | | | | 15,640,347 | |
| | | | | | |
|
|
|
The accompanying notes are an integral part of these financial statements.
13
MARKETFIELD FUND
Schedule of Investments (continued)
December 31, 2021
| | | | | | | | |
| | |
| | | Shares
| | | Value
| |
| Oil, Gas & Consumable Fuels — 8.18% | | | | | | | | |
Chevron Corp. | | | 26,293 | | | $ | 3,085,483 | |
ConocoPhillips | | | 45,389 | | | | 3,276,178 | |
Devon Energy Corp. | | | 73,831 | | | | 3,252,256 | |
EOG Resources, Inc. | | | 21,442 | | | | 1,904,693 | |
Golar LNG Ltd.(a)(b) | | | 98,478 | | | | 1,220,142 | |
| | | | | | |
|
|
|
| | | | | | | | 12,738,752 | |
| | | | | | |
|
|
|
| Real Estate Management & Development — 1.60% | | | | | | | | |
The St. Joe Co. | | | 47,721 | | | | 2,483,878 | |
| | | | | | |
|
|
|
| Road & Rail — 7.61% | | | | | | | | |
Norfolk Southern Corp.(c) | | | 22,286 | | | | 6,634,765 | |
Union Pacific Corp. | | | 20,663 | | | | 5,205,630 | |
| | | | | | |
|
|
|
| | | | | | | | 11,840,395 | |
| | | | | | |
|
|
|
| Semiconductors & Semiconductor Equipment — 1.45% | | | | | | | | |
Intel Corp. | | | 43,849 | | | | 2,258,223 | |
| | | | | | |
|
|
|
TOTAL COMMON STOCKS (Cost $56,959,162) | | | | | | | 105,985,860 | |
| | | | | | |
|
|
|
| EXCHANGE-TRADED FUNDS — 25.70% | | | | | | | | |
iShares MSCI Australia ETF(c) | | | 274,418 | | | | 6,813,799 | |
iShares MSCI Japan ETF | | | 33,250 | | | | 2,226,420 | |
iShares MSCI South Korea ETF | | | 47,791 | | | | 3,721,485 | |
iShares MSCI United Kingdom ETF(c) | | | 217,600 | | | | 7,211,264 | |
SPDR S&P Homebuilders ETF(c) | | | 60,327 | | | | 5,174,850 | |
SPDR S&P Oil & Gas Exploration & Production ETF | | | 25,280 | | | | 2,423,594 | |
VanEck Gold Miners ETF(c) | | | 141,263 | | | | 4,524,654 | |
VanEck Russia ETF | | | 81,903 | | | | 2,183,534 | |
WisdomTree Japan Hedged Equity Fund(c) | | | 91,584 | | | | 5,727,663 | |
| | | | | | |
|
|
|
TOTAL EXCHANGE-TRADED FUNDS (Cost $34,118,553) | | | | | | | 40,007,263 | |
| | | | | | |
|
|
|
| SHORT-TERM INVESTMENTS — 5.98% | | | | | | | | |
U.S. Bank Money Market Deposit Account, 0.003%(d) | | | 9,303,419 | | | | 9,303,419 | |
| | | | | | |
|
|
|
| TOTAL SHORT-TERM INVESTMENTS (Cost $9,303,419) | | | | | | | 9,303,419 | |
| | | | | | |
|
|
|
| Total Investments (Cost $100,381,134) — 99.76% | | | | | | | 155,296,542 | |
| Other Assets in Excess of Liabilities — 0.24% | | | | | | | 373,628 | |
| | | | | | |
|
|
|
| TOTAL NET ASSETS — 100.00% | | | | | | $ | 155,670,170 | |
| | | | | | |
|
|
|
| (a) | | Foreign issued security. |
| (b) | | Non-income producing security. |
| (c) | | All or a portion of this security is pledged as collateral for securities sold short with an aggregate fair value of $35,506,930 as of December 31, 2021. |
| (d) | | Seven day yield as of December 31, 2021. |
Abbreviations:
| | |
| ADR | | American Depositary Receipt |
| AG | | Aktiengesellschaft is a German term that refers to a corporation that is limited by shares, i.e. owned by shareholders. |
| Ltd. | | Limited is a term indicating a company is incorporated and shareholders have limited liability. |
| PLC | | Public Limited Company is a publicly traded company which signifies that shareholders have limited liability. |
| PJSC | | An abbreviation used by many countries to signify an open joint-stock company. |
| SA | | An abbreviation used by many countries to signify a stock company whereby shareholders have limited liability. |
The Global Industry Classification Standard (GICS®) was developed by and/or is the exclusive property of MSCI, Inc. and Standard & Poor Financial Services LLC (“S&P”). GICS is a service mark of MSCI and S&P and has been licensed for use by U.S. Bancorp Fund Services, LLC.
The accompanying notes are an integral part of these financial statements.
14
MARKETFIELD FUND
Schedule of Securities Sold Short
December 31, 2021
| | | | | | | | |
| | |
| | | Shares
| | | Value
| |
| SECURITIES SOLD SHORT — (24.82)% | | | | | | | | |
| | |
| EXCHANGE-TRADED FUNDS — (20.77)% | | | | | | | | |
Invesco QQQ Trust Series 1 | | | (38,725 | ) | | $ | (15,406,741 | ) |
iShares Expanded Tech-Software Sector ETF | | | (23,120 | ) | | | (9,193,668 | ) |
iShares Russell 2000 ETF | | | (34,760 | ) | | | (7,732,362 | ) |
| | | | | | |
|
|
|
TOTAL EXCHANGE-TRADED FUNDS (Proceeds $23,652,089) | | | | | | | (32,332,771 | ) |
| | | | | | |
|
|
|
| REAL ESTATE INVESTMENT TRUSTS — (4.05)% | | | | | | | | |
AvalonBay Communities, Inc. | | | (3,669 | ) | | | (926,753 | ) |
Boston Properties, Inc. | | | (10,476 | ) | | | (1,206,626 | ) |
Equity Residential | | | (11,007 | ) | | | (996,134 | ) |
SL Green Realty Corp. | | | (29,873 | ) | | | (2,141,894 | ) |
Vornado Realty Trust | | | (24,854 | ) | | | (1,040,388 | ) |
| | | | | | |
|
|
|
TOTAL REAL ESTATE INVESTMENT TRUSTS (Proceeds $7,476,036) | | | | | | | (6,311,795 | ) |
| | | | | | |
|
|
|
Total Securities Sold Short (Proceeds $31,128,125) | | | | | | $ | (38,644,566 | ) |
| | | | | | |
|
|
|
The accompanying notes are an integral part of these financial statements.
15
MARKETFIELD FUND
| | |
| Statement of Assets & Liabilities | | |
| |
| | | December 31, 2021 |
| | | | |
| Assets | | | | |
Investments in securities, at value (cost $100,381,134) | | $ | 155,296,542 | |
Receivables: | | | | |
Fund shares sold | | | 34,093 | |
Dividends and interest | | | 81,626 | |
Dividend tax reclaim | | | 154,487 | |
Deposits at brokers(1) | | | 39,197,005 | |
Other assets | | | 23,123 | |
| | |
|
|
|
Total Assets | | | 194,786,876 | |
| | |
|
|
|
| Liabilities | | | | |
Securities sold short, at value (proceeds received $31,128,125) | | | 38,644,566 | |
Payables: | | | | |
Fund shares redeemed | | | 56,340 | |
To affiliates | | | 53,419 | |
To distributor | | | 15,877 | |
For shareholder servicing fees | | | 16,233 | |
To adviser | | | 144,048 | |
Dividends and interest on short positions | | | 104,883 | |
Accrued expenses and other liabilities | | | 81,340 | |
| | |
|
|
|
Total Liabilities | | | 39,116,706 | |
| | |
|
|
|
| Net Assets | | $ | 155,670,170 | |
| | |
|
|
|
Net assets consist of: | | | | |
Paid-in capital | | | 480,421,121 | |
Accumulated deficit | | | (324,750,951 | ) |
| | |
|
|
|
| Net Assets | | $ | 155,670,170 | |
| | |
|
|
|
| |
| Class A | | | | |
Net assets | | | $47,708,855 | |
Shares of beneficial interest outstanding (unlimited number of shares authorized, $0.001 par value) | | | 2,206,741 | |
Net asset value, minimum offering, and redemption price per share | | | $21.62 | |
Maximum offering price per share (net asset value per share divided by 0.945)(2) | | | $22.88 | |
| |
| Class C | | | | |
Net assets | | | $17,520,902 | |
Shares of beneficial interest outstanding (unlimited number of shares authorized, $0.001 par value) | | | 867,890 | |
Net asset value, offering, and redemption price per share(3) | | | $20.19 | |
| |
| Class I | | | | |
Net assets | | | $90,440,413 | |
Shares of beneficial interest outstanding (unlimited number of shares authorized, $0.001 par value) | | | 4,104,711 | |
Net asset value, offering, and redemption price per share | | | $22.03 | |
| (1) | | Serves as collateral for securities sold short and derivative instruments including futures, swaps and options. |
| (2) | | Reflects a maximum sales charge of 5.50%. |
| (3) | | A contingent deferred sales charge (“CDSC”) of 1.00% may be charged on shares redeemed within twelve months of purchase. |
The accompanying notes are an integral part of these financial statements.
16
MARKETFIELD FUND
| | |
| Statement of Operations |
| |
| | | For the Year Ended December 31, 2021 |
| | | | |
| Investment Income | | | | |
Dividend income(1) | | $ | 3,604,312 | |
Interest income | | | 394 | |
| | |
|
|
|
Total Investment Income | | | 3,604,706 | |
| | |
|
|
|
| Expenses | | | | |
Management fees | | | 2,261,120 | |
Dividend expense | | | 627,352 | |
Broker interest expense | | | 262,296 | |
Transfer agent fees and expenses | | | 200,518 | |
Administration and accounting fees | | | 195,066 | |
Distribution fees — Class C | | | 184,329 | |
Distribution fees — Class A | | | 111,162 | |
Federal and state registration fees | | | 50,779 | |
Audit and tax fees | | | 47,826 | |
Shareholder servicing fees — Class C | | | 40,627 | |
Custody fees | | | 30,970 | |
Reports to shareholders | | | 25,351 | |
Legal fees | | | 25,164 | |
Trustees’ fees | | | 13,496 | |
Chief Compliance Officer fees | | | 11,999 | |
Insurance expense | | | 3,650 | |
Pricing fees | | | 1,723 | |
Other expenses | | | 3,737 | |
| | |
|
|
|
Total Expenses | | | 4,097,165 | |
| | |
|
|
|
Less waivers and reimbursement by Adviser (Note 4) | | | (333,102 | ) |
| | |
|
|
|
Net Expenses | | | 3,764,063 | |
| | |
|
|
|
| Net Investment Loss | | | (159,357 | ) |
| | |
|
|
|
| Realized and Unrealized Gain (Loss) on Investments and Foreign Currency | | | | |
Net realized gain (loss) on: | | | | |
Investments | | | 38,492,889 | |
Securities sold short | | | (5,494,803 | ) |
Foreign currency translations | | | (3,790 | ) |
Purchased options | | | (331,538 | ) |
| | |
|
|
|
| | | | 32,662,758 | |
| | |
|
|
|
Net change in unrealized appreciation (depreciation) on: | | | | |
Investments | | | (16,539,859 | ) |
Securities sold short | | | (3,066,252 | ) |
Foreign currency translations | | | (34,322 | ) |
| | |
|
|
|
| | | | (19,640,433 | ) |
| | |
|
|
|
| Net Realized and Unrealized Gain on Investments and Foreign Currency | | | 13,022,325 | |
| | |
|
|
|
| Net Increase in Net Assets From Operations | | $ | 12,862,968 | |
| | |
|
|
|
| (1) | | Net of $48,846 in foreign withholding taxes and issuance fees. |
The accompanying notes are an integral part of these financial statements.
17
MARKETFIELD FUND
| | | | | | | | |
| Statements of Changes in Net Assets | |
| | |
| | | Year Ended
December 31, 2021
| | | Year Ended
December 31, 2020
| |
| From Operations | | | | | | | | |
Net investment loss | | $ | (159,357 | ) | | $ | (1,523,743 | ) |
Net realized gain (loss) on: | | | | | | | | |
Investments | | | 38,492,889 | | | | 15,655,650 | |
Futures contracts | | | — | | | | (672,822 | ) |
Securities sold short | | | (5,494,803 | ) | | | (4,160,854 | ) |
Foreign currency translations | | | (3,790 | ) | | | 127,092 | |
Purchased options | | | (331,538 | ) | | | 647,908 | |
Written options | | | — | | | | (5,405 | ) |
Net change in unrealized appreciation (depreciation) on: | | | | | | | | |
Investments | | | (16,539,859 | ) | | | 12,845,267 | |
Futures contracts | | | — | | | | (63,577 | ) |
Securities sold short | | | (3,066,252 | ) | | | 2,856,674 | |
Foreign currency translations | | | (34,322 | ) | | | 27,741 | |
Purchased options | | | — | | | | 17,769 | |
Written options | | | — | | | | 41,082 | |
| | |
|
|
| |
|
|
|
Net increase in net assets from operations | | | 12,862,968 | | | | 25,792,782 | |
| | |
|
|
| |
|
|
|
| From Capital Share Transactions | | | | | | | | |
Proceeds from shares sold — Class A | | | 8,238,975 | | | | 7,888,190 | |
Payments for shares redeemed — Class A | | | (6,710,571 | ) | | | (9,859,664 | ) |
Proceeds from shares sold — Class C | | | 35,455 | | | | 87,440 | |
Payments for shares redeemed — Class C | | | (12,260,520 | ) | | | (15,551,868 | ) |
Proceeds from shares sold — Class I | | | 6,116,986 | | | | 5,056,654 | |
Payments for shares redeemed — Class I | | | (14,817,719 | ) | | | (33,458,225 | ) |
Proceeds from shares sold — Class R6(1) | | | — | | | | 44,645 | |
Payments for shares redeemed — Class R6(1) | | | — | | | | (1,887,622 | ) |
| | |
|
|
| |
|
|
|
Net decrease in net assets from capital share transactions | | | (19,397,394 | ) | | | (47,680,450 | ) |
| | |
|
|
| |
|
|
|
| Total Decrease in Net Assets | | | (6,534,426 | ) | | | (21,887,668 | ) |
| | |
| Net Assets: | | | | | | | | |
Beginning of Year | | | 162,204,596 | | | | 184,092,264 | |
| | |
|
|
| |
|
|
|
End of Year | | $ | 155,670,170 | | | $ | 162,204,596 | |
| | |
|
|
| |
|
|
|
| (1) | | Class R6 shares of the Fund were liquidated as of the close of business on November 30, 2020. See Note 1 to the financial statements. |
The accompanying notes are an integral part of these financial statements.
18
MARKETFIELD FUND — CLASS A
| | | | | | | | | | | | | | | | | | | | |
| Financial Highlights | |
|
| Per Share Data for a Share Outstanding Throughout Each Year | |
| | | | | |
| | | Year Ended
December 31,
2021
| | | Year Ended
December 31,
2020
| | | Year Ended
December 31,
2019
| | | Year Ended
December 31,
2018
| | | Year Ended
December 31,
2017
| |
| Net Asset Value, Beginning of Year | | $ | 19.96 | | | $ | 16.65 | | | $ | 14.92 | | | $ | 17.23 | | | $ | 14.26 | |
| | |
|
|
| |
|
|
| |
|
|
| |
|
|
| |
|
|
|
| Income (loss) from investment operations: | | | | | | | | | | | | | | | | | | | | |
Net investment income (loss)(1) | | | (0.02 | ) | | | (0.16 | ) | | | 0.04 | | | | (0.05 | ) | | | (0.11 | ) |
Net realized and unrealized gain (loss) on investments and foreign currency | | | 1.68 | | | | 3.47 | | | | 1.73 | | | | (2.26 | ) | | | 3.08 | |
| | |
|
|
| |
|
|
| |
|
|
| |
|
|
| |
|
|
|
Total from investment operations | | | 1.66 | | | | 3.31 | | | | 1.77 | | | | (2.31 | ) | | | 2.97 | |
| | |
|
|
| |
|
|
| |
|
|
| |
|
|
| |
|
|
|
| Less distributions paid: | | | | | | | | | | | | | | | | | | | | |
From net investment income | | | — | | | | — | | | | (0.04 | ) | | | — | | | | — | |
| | |
|
|
| |
|
|
| |
|
|
| |
|
|
| |
|
|
|
Total distributions paid | | | — | | | | — | | | | (0.04 | ) | | | — | | | | — | |
| | |
|
|
| |
|
|
| |
|
|
| |
|
|
| |
|
|
|
| Net Asset Value, End of Year | | $ | 21.62 | | | $ | 19.96 | | | $ | 16.65 | | | $ | 14.92 | | | $ | 17.23 | |
| | |
|
|
| |
|
|
| |
|
|
| |
|
|
| |
|
|
|
| Total return(2) | | | 8.32 | % | | | 19.88 | % | | | 11.87 | % | | | -13.41 | % | | | 20.83 | % |
| | |
|
|
| |
|
|
| |
|
|
| |
|
|
| |
|
|
|
| | | | | |
| Supplemental Data and Ratios: | | | | | | | | | | | | | | | | | | | | |
Net assets, end of year (000’s) | | $ | 47,709 | | | $ | 42,483 | | | $ | 37,761 | | | $ | 46,183 | | | $ | 75,929 | |
| | | | | |
Ratio of expenses to average net assets: | | | | | | | | | | | | | | | | | | | | |
Before waivers and reimbursements of expenses(3) | | | 2.58 | % | | | 2.75 | % | | | 2.94 | % | | | 2.73 | % | | | 2.72 | % |
After waivers and reimbursements of expenses(4) | | | 2.36 | % | | | 2.47 | % | | | 2.70 | % | | | 2.52 | % | | | 2.54 | % |
| | | | | |
Ratio of net investment income (loss) to average net assets:(5) | | | | | | | | | | | | | | | | | | | | |
Before waivers and reimbursements of expenses | | | (0.30 | )% | | | (1.23 | )% | | | 0.02 | % | | | (0.51 | )% | | | (0.90 | )% |
After waivers and reimbursements of expenses | | | (0.08 | )% | | | (0.95 | )% | | | 0.26 | % | | | (0.30 | )% | | | (0.72 | )% |
| | | | | |
Portfolio turnover rate(6) | | | 26 | % | | | 12 | % | | | 17 | % | | | 40 | % | | | 5 | % |
| (1) | | Per share net investment income (loss) was calculated using average shares outstanding. |
| (2) | | Total return in the table represents the rate that the investor would have earned or lost on an investment in the Fund, assuming reinvestment of dividends. Based on net asset value, which does not reflect the applicable sales charges. |
| (3) | | Expense ratios of expenses to average net assets before waivers and reimbursements of expenses excluding dividend and interest expense on short positions were 2.02%, 2.08%, 2.04%, 2.01%, and 1.98% for the years ended December 31, 2021, 2020, 2019, 2018, and 2017, respectively. |
| (4) | | Expense ratios of expenses to average net assets after waivers and reimbursements of expenses excluding dividend and interest expense on short positions were 1.80%, 1.80%, 1.80%, 1.80%, and 1.80% for the years ended December 31, 2021, 2020, 2019, 2018, and 2017, respectively. |
| (5) | | The net investment income (loss) ratios include dividend and interest expense on short positions. |
| (6) | | Consists of long-term investments only; excludes securities sold short and derivative instruments. |
The accompanying notes are an integral part of these financial statements.
19
MARKETFIELD FUND — CLASS C
| | | | | | | | | | | | | | | | | | | | |
| Financial Highlights | |
|
| Per Share Data for a Share Outstanding Throughout Each Year | |
| | | | | |
| | | Year Ended
December 31,
2021
| | | Year Ended
December 31,
2020
| | | Year Ended
December 31,
2019
| | | Year Ended
December 31,
2018
| | | Year Ended
December 31,
2017
| |
| Net Asset Value, Beginning of Year | | $ | 18.78 | | | $ | 15.79 | | | $ | 14.22 | | | $ | 16.56 | | | $ | 13.80 | |
| | |
|
|
| |
|
|
| |
|
|
| |
|
|
| |
|
|
|
| Income (loss) from investment operations: | | | | | | | | | | | | | | | | | | | | |
Net investment loss(1) | | | (0.20 | ) | | | (0.28 | ) | | | (0.08 | ) | | | (0.17 | ) | | | (0.22 | ) |
Net realized and unrealized gain (loss) on investments and foreign currency | | | 1.61 | | | | 3.27 | | | | 1.65 | | | | (2.17 | ) | | | 2.98 | |
| | |
|
|
| |
|
|
| |
|
|
| |
|
|
| |
|
|
|
Total from investment operations | | | 1.41 | | | | 2.99 | | | | 1.57 | | | | (2.34 | ) | | | 2.76 | |
| | |
|
|
| |
|
|
| |
|
|
| |
|
|
| |
|
|
|
| Net Asset Value, End of Year | | $ | 20.19 | | | $ | 18.78 | | | $ | 15.79 | | | $ | 14.22 | | | $ | 16.56 | |
| | |
|
|
| |
|
|
| |
|
|
| |
|
|
| |
|
|
|
| Total return(2) | | | 7.51 | % | | | 18.94 | % | | | 11.04 | % | | | -14.13 | % | | | 20.00 | % |
| | |
|
|
| |
|
|
| |
|
|
| |
|
|
| |
|
|
|
| | | | | |
| Supplemental Data and Ratios: | | | | | | | | | | | | | | | | | | | | |
Net assets, end of year (000’s) | | $ | 17,521 | | | $ | 28,077 | | | $ | 38,675 | | | $ | 55,958 | | | $ | 92,518 | |
| | | | | |
Ratio of expenses to average net assets: | | | | | | | | | | | | | | | | | | | | |
Before waivers and reimbursements of
expenses(3) | | | 3.23 | % | | | 3.46 | % | | | 3.69 | % | | | 3.49 | % | | | 3.48 | % |
After waivers and reimbursements of expenses(4) | | | 3.11 | % | | | 3.20 | % | | | 3.46 | % | | | 3.30 | % | | | 3.30 | % |
| | | | | |
Ratio of net investment loss to average net assets:(5) | | | | | | | | | | | | | | | | | | | | |
Before waivers and reimbursements of expenses | | | (1.12 | )% | | | (2.00 | )% | | | (0.76 | )% | | | (1.27 | )% | | | (1.67 | )% |
After waivers and reimbursements of expenses | | | (1.00 | )% | | | (1.74 | )% | | | (0.53 | )% | | | (1.08 | )% | | | (1.49 | )% |
| | | | | |
Portfolio turnover rate(6) | | | 26 | % | | | 12 | % | | | 17 | % | | | 40 | % | | | 5 | % |
| (1) | | Per share net investment loss was calculated using average shares outstanding. |
| (2) | | Total return in the table represents the rate that the investor would have earned or lost on an investment in the Fund, assuming reinvestment of dividends. Based on net asset value, which does not reflect the applicable sales charges. |
| (3) | | Expense ratios of expenses to average net assets before waivers and reimbursements of expenses excluding dividend and interest expense on short positions were 2.69%, 2.83%, 2.80%, 2.76%, and 2.75% for the years ended December 31, 2021, 2020, 2019, 2018, and 2017, respectively. |
| (4) | | Expense ratios of expenses to average net assets after waivers and reimbursements of expenses excluding dividend and interest expense on short positions were 2.57%, 2.57%, 2.57%, 2.57%, and 2.57% for the years ended December 31, 2021, 2020, 2019, 2018, and 2017, respectively. |
| (5) | | The net investment loss ratios include dividend and interest expense on short positions. |
| (6) | | Consists of long-term investments only; excludes securities sold short and derivative instruments. |
The accompanying notes are an integral part of these financial statements.
20
MARKETFIELD FUND — CLASS I
| | | | | | | | | | | | | | | | | | | | |
| Financial Highlights | |
|
| Per Share Data for a Share Outstanding Throughout Each Year | |
| | | | | |
| | | Year Ended
December 31,
2021
| | | Year Ended
December 31,
2020
| | | Year Ended
December 31,
2019
| | | Year Ended
December 31,
2018
| | | Year Ended
December 31,
2017
| |
| Net Asset Value, Beginning of Year | | $ | 20.29 | | | $ | 16.88 | | | $ | 15.14 | | | $ | 17.44 | | | $ | 14.39 | |
| | |
|
|
| |
|
|
| |
|
|
| |
|
|
| |
|
|
|
| Income (loss) from investment operations: | | | | | | | | | | | | | | | | | | | | |
Net investment income (loss)(1) | | | 0.03 | | | | (0.12 | ) | | | 0.08 | | | | (0.02 | ) | | | (0.07 | ) |
Net realized and unrealized gain (loss) on investments and foreign currency | | | 1.71 | | | | 3.53 | | | | 1.75 | | | | (2.28 | ) | | | 3.12 | |
| | |
|
|
| |
|
|
| |
|
|
| |
|
|
| |
|
|
|
Total from investment operations | | | 1.74 | | | | 3.41 | | | | 1.83 | | | | (2.30 | ) | | | 3.05 | |
| | |
|
|
| |
|
|
| |
|
|
| |
|
|
| |
|
|
|
| Less distributions paid: | | | | | | | | | | | | | | | | | | | | |
From net investment income | | | — | | | | — | | | | (0.09 | ) | | | — | | | | — | |
| | |
|
|
| |
|
|
| |
|
|
| |
|
|
| |
|
|
|
Total distributions paid | | | — | | | | — | | | | (0.09 | ) | | | — | | | | — | |
| | |
|
|
| |
|
|
| |
|
|
| |
|
|
| |
|
|
|
| Net Asset Value, End of Year | | $ | 22.03 | | | $ | 20.29 | | | $ | 16.88 | | | $ | 15.14 | | | $ | 17.44 | |
| | |
|
|
| |
|
|
| |
|
|
| |
|
|
| |
|
|
|
| Total return(2) | | | 8.58 | % | | | 20.20 | % | | | 12.13 | % | | | -13.25 | % | | | 21.20 | % |
| | |
|
|
| |
|
|
| |
|
|
| |
|
|
| |
|
|
|
| | | | | |
| Supplemental Data and Ratios: | | | | | | | | | | | | | | | | | | | | |
Net assets, end of year (000’s) | | $ | 90,440 | | | $ | 91,645 | | | $ | 105,998 | | | $ | 163,260 | | | $ | 302,439 | |
| | | | | |
Ratio of expenses to average net assets: | | | | | | | | | | | | | | | | | | | | |
Before waivers and reimbursements of expenses(3) | | | 2.33 | % | | | 2.47 | % | | | 2.68 | % | | | 2.47 | % | | | 2.48 | % |
After waivers and reimbursements of expenses(4) | | | 2.11 | % | | | 2.20 | % | | | 2.44 | % | | | 2.27 | % | | | 2.30 | % |
| | | | | |
Ratio of net investment income (loss) to average net assets:(5) | | | | | | | | | | | | | | | | | | | | |
Before waivers and reimbursements of expenses | | | (0.09 | )% | | | (0.98 | )% | | | 0.25 | % | | | (0.29 | )% | | | (0.64 | )% |
After waivers and reimbursements of expenses | | | 0.13 | % | | | (0.71 | )% | | | 0.49 | % | | | (0.09 | )% | | | (0.46 | )% |
| | | | | |
Portfolio turnover rate(6) | | | 26 | % | | | 12 | % | | | 17 | % | | | 40 | % | | | 5 | % |
| (1) | | Per share net investment income (loss) was calculated using average shares outstanding. |
| (2) | | Total return in the table represents the rate that the investor would have earned or lost on an investment in the Fund, assuming reinvestment of dividends. Based on net asset value, which does not reflect the applicable sales charges. |
| (3) | | Expense ratios of expenses to average net assets before waivers and reimbursements of expenses excluding dividend and interest expense on short positions were 1.78%, 1.83%, 1.80%, 1.76%, and 1.74% for the years ended December 31, 2021, 2020, 2019, 2018, and 2017, respectively. |
| (4) | | Expense ratios of expenses to average net assets after waivers and reimbursements of expenses excluding dividend and interest expense on short positions were 1.56%, 1.56%, 1.56%, 1.56%, and 1.56% for the years ended December 31, 2021, 2020, 2019, 2018, and 2017, respectively. |
| (5) | | The net investment income (loss) ratios include dividend and interest expense on short positions. |
| (6) | | Consists of long-term investments only; excludes securities sold short and derivative instruments. |
The accompanying notes are an integral part of these financial statements.
21
MARKETFIELD FUND
Notes to Financial Statements
December 31, 2021
Trust for Professional Managers (the “Trust”) was organized as a Delaware statutory trust under a Declaration of Trust dated May 29, 2001. The Trust is registered under the Investment Company Act of 1940, as amended (the “1940 Act”), as an open-end management investment company. The Marketfield Fund (the “Fund”) represents a distinct series with its own investment objective and policies within the Trust. The investment objective of the Fund is capital appreciation. The Trust may issue an unlimited number of shares of beneficial interest at $0.001 par value. The assets of the Fund are segregated, and a shareholder’s interest is limited to the Fund in which shares are held.
The Fund currently offers three classes of shares. Class I shares commenced operations on July 31, 2007. Class A and Class C shares commenced operations on October 5, 2012. Class R6 shares commenced operations on June 17, 2013. Class R6 shares of the Fund were liquidated as of the close of business on November 30, 2020. Class A shares are subject to an initial maximum sales charge of 5.50% imposed at the time of purchase. The sales charge declines as the amount purchased increases in accordance with the Fund’s prospectus. A contingent deferred sales charge (“CDSC”) of 1.00% may be imposed on certain redemptions of Class A shares made within 12 months of the date of purchase of Class A shares. Class C shares are offered at NAV without an initial sales charge, although a 1.00% CDSC may be imposed on redemptions made within 12 months of the date of purchase of Class C shares. Class I shares are offered at NAV and are not subject to a sales charge. In addition, you generally may elect on a voluntary basis to convert your Class A or Class C shares that are no longer subject to a CDSC into Class A or Class I shares of the Fund, subject to satisfying the eligibility requirements of Class A or Class I shares, as applicable. Class C shares of the Fund automatically convert to Class A shares after 8 years. The three classes of shares have the same voting (except for issues that relate solely to one class), dividend, liquidation and other rights, and the same terms and conditions, except that Class C shares are subject to higher distribution and/or service (Rule 12b-1) fee rates than Class A shares under a distribution plan pursuant to Rule 12b-1 under the 1940 Act. Class I shares are not subject to a distribution and/or service (Rule 12b-1) fee.
The Fund is an investment company and accordingly follows the investment accounting and reporting guidance of the Financial Accounting Standards Board (FASB) Accounting Standard Codification Topic 946 “Financial Services — Investment Companies.”
| (2) | | Significant Accounting Policies |
The following is a summary of significant accounting policies consistently followed by the Fund in the preparation of these schedules of investments. These policies are in conformity with generally accepted accounting principles in the United States of America (“GAAP”).
Each security owned by the Fund that is listed on a securities exchange, except securities listed on the NASDAQ Stock Market, LLC (“NASDAQ”), is valued at its last sale price on that exchange on the date as of which assets are valued. Swap agreements, such as credit default swaps, interest rate swaps and currency swaps, are priced by an approved independent pricing service (“Pricing Service”). Forward foreign currency contracts are valued at the mean between the bid and asked prices by a Pricing Service. Commodities futures contracts and options thereon traded on a commodities exchange or board of trade are valued at the last sale price at the close of trading.
If the security is listed on more than one exchange, the Fund will use the price of the exchange that the Fund generally considers to be the principal exchange on which the security is traded. Portfolio securities listed on NASDAQ will be valued at the NASDAQ Official Closing Price, which may not necessarily represent the last sale price. If there has been no sale on such exchange or on NASDAQ on such day, the security is valued at the mean between the most recent bid and ask prices at the close of the exchange on such day, or the
22
MARKETFIELD FUND
Notes to Financial Statements, continued
December 31, 2021
security shall be valued at the latest sales price on the “composite market” for the day such security is being valued. The composite market is defined as a consolidation of the trade information provided by national securities and foreign exchanges and over-the-counter markets as published by a Pricing Service for the day such security is being valued.
If market quotations are not readily available, any security or other asset will be valued at its fair value as determined under fair value pricing procedures approved by the Trust’s Board of Trustees. These fair value pricing procedures will also be used to price a security when corporate events, events in the securities market and/or world events cause Marketfield Asset Management, LLC (the “Adviser”) to believe that a security’s last sale price may not reflect its actual fair market value. The intended effect of using fair value pricing procedures is to ensure that the Fund’s shares are accurately priced. The Board of Trustees will regularly evaluate whether the Fund’s fair value pricing procedures continue to be appropriate in light of the specific circumstances of the Fund and the quality of prices obtained through the application of such procedures by the Trust’s valuation committee.
Redeemable securities issued by open-end, registered investment companies are valued at the NAVs of such companies for purchase and/or redemption orders placed on that day. If, on a particular day, a share of an investment company is not listed on NASDAQ, such security’s fair value will be determined as described above. All exchange-traded funds are valued at the last reported sale price on the exchange on which the security is principally traded. In the event market quotations are not readily available, such security’s fair value will be determined.
Debt securities, including short-term instruments having a maturity of 60 days or less, are valued at the mean in accordance with prices supplied by a Pricing Service. Pricing Services may use various valuation methodologies such as the mean between the bid and ask prices, matrix pricing method or other analytical pricing models as well as market transactions and dealer quotations. If a price is not available from a Pricing Service, the most recent quotation obtained from one or more broker-dealers known to follow the issue will be obtained. Quotations will be valued at the mean between the bid and the offer. Fixed income securities purchased on a delayed-delivery basis are typically marked to market daily until settlement at the forward settlement date. Any discount or premium is accreted or amortized using the constant yield method until maturity.
Money market funds, demand notes and repurchase agreements are valued at cost. If cost does not represent current market value the securities will be priced at fair value.
Exchange-traded options are valued at the composite price, using the National Best Bid and Offer quotes (“NBBO”). NBBO consists of the highest bid price and lowest ask price across any of the exchanges on which an option is quoted, thus providing a view across the entire U.S. options marketplace. Specifically, composite pricing looks at the last trades on the exchanges where the options are traded. If there are no trades for the option on a given business day, composite option pricing calculates the mean of the highest bid price and lowest ask price across the exchanges where the option is traded. Over-the-counter (“OTC”) option contracts on securities, currencies and other financial instruments with less than 180 days remaining until their expiration shall be valued at the evaluated price provided by the broker-dealer with which the option was traded. Option contracts on securities, currencies and other financial instruments traded in the OTC market with 180 days or more remaining until their expiration shall be valued at the prices provided by a recognized independent broker-dealer. Futures contracts and options thereon are valued at the last settlement price at the closing of trading on the relevant exchange or board of trade. Futures or options on futures positions for which reliable market quotations are not readily available shall be valued at a price supplied by a Pricing Service.
Swap agreements are generally traded over the counter and are valued by a Pricing Service using observable inputs. If a price provided by a Pricing Service differs from the price provided by an independent dealer by 10% or more or the Adviser otherwise believes that the price provided by the Pricing Service is inaccurately
23
MARKETFIELD FUND
Notes to Financial Statements, continued
December 31, 2021
stated, the Adviser shall price the swap using the average of two prices obtained by independent dealers. In the event the Adviser determines the price of a swap in this manner does not represent market value, the fair value of the subject swap shall be determined in accordance with the Trust’s fair value procedures.
FASB Accounting Standards Codification, “Fair Value Measurements” Topic 820 (“ASC 820”), establishes an authoritative definition of fair value and sets out a hierarchy for measuring fair value. ASC 820 requires an entity to evaluate certain factors to determine whether there has been a significant decrease in volume and level of activity for the security such that recent transactions and quoted prices may not be determinative of fair value and further analysis and adjustment may be necessary to estimate fair value. ASC 820 also requires enhanced disclosure regarding the inputs and valuation techniques used to measure fair value in those instances as well as expanded disclosure of valuation levels for major security types. These inputs are summarized in the three broad levels listed below:
Level 1 — Quoted prices in active markets for identical securities.
Level 2 — Other significant observable inputs (including quoted prices for similar securities, interest rates, prepayment speeds, credit risk, etc.).
Level 3 — Significant unobservable inputs (including the Fund’s own assumptions in determining the fair value of investments).
The inputs or methodology used for valuing securities are not necessarily an indication of the risk associated with investing in those securities. The following is a summary of the inputs used to value the Fund’s investments carried at fair value as of December 31, 2021:
| | | | | | | | | | | | | | | | |
| | | Level 1
| | | Level 2
| | | Level 3(2)
| | | Total
| |
| Assets: | | | | | | | | | | | | | | | | |
Common Stocks(1) | | $ | 105,985,860 | | | $ | — | | | $ | — | | | $ | 105,985,860 | |
Exchange-Traded Funds | | | 40,007,263 | | | | — | | | | — | | | | 40,007,263 | |
Short-Term Investments | | | 9,303,419 | | | | — | | | | — | | | | 9,303,419 | |
| | |
|
|
| |
|
|
| |
|
|
| |
|
|
|
| Total Assets | | $ | 155,296,542 | | | $ | — | | | $ | — | | | $ | 155,296,542 | |
| | |
|
|
| |
|
|
| |
|
|
| |
|
|
|
| Liabilities: | | | | | | | | | | | | | | | | |
| Securities Sold Short | | | | | | | | | | | | | | | | |
Exchange-Traded Funds | | $ | (32,332,771 | ) | | $ | — | | | $ | — | | | $ | (32,332,771 | ) |
Real Estate Investment Trusts | | | (6,311,795 | ) | | | — | | | | — | | | | (6,311,795 | ) |
| | |
|
|
| |
|
|
| |
|
|
| |
|
|
|
| Total Securities Sold Short | | | (38,644,566 | ) | | | — | | | | — | | | | (38,644,566 | ) |
| | |
|
|
| |
|
|
| |
|
|
| |
|
|
|
| Total Liabilities | | $ | (38,644,566 | ) | | $ | — | | | $ | — | | | $ | (38,644,566 | ) |
| | |
|
|
| |
|
|
| |
|
|
| |
|
|
|
| (1) | | See the Schedule of Investments for industry/geographic classifications. |
| (2) | | The Fund measures Level 3 activity as of the end of each financial reporting period. For the year ended December 31, 2021, the Fund did not have unobservable inputs (Level 3 securities) used in determining fair value. Therefore, a reconciliation of assets and liabilities in which significant unobservable inputs (Level 3 securities) were used in determining fair value is not applicable. |
| | (b) | | Foreign Securities and Currency Transactions |
Investment securities and other assets and liabilities denominated in foreign currencies are translated into U.S. dollar amounts at the date of valuation. Purchases and sales of investment securities and income and expense items denominated in foreign currencies are translated into U.S. dollar amounts on the respective dates of such transactions. The Fund does not isolate the portion of the results of operations from changes in foreign exchange rates on investments from the fluctuations arising from changes in market prices of securities held. Realized foreign exchange gains or losses arising from sales of portfolio securities and sales and maturities of short-term securities are reported within realized gain (loss) on investments. Net unrealized foreign exchange gains and losses arising from changes in the values of investments in securities from
24
MARKETFIELD FUND
Notes to Financial Statements, continued
December 31, 2021
fluctuations in exchange rates are reported within unrealized gain (loss) on investments. The realized gain or loss and unrealized appreciation or depreciation resulting from all other transactions denominated in currency other than U.S. dollars are disclosed separately.
Investments in foreign securities entail certain risks. There may be a possibility of nationalization or expropriation of assets, confiscatory taxation, political or financial instability, and diplomatic developments that could affect the value of the Fund’s investments in certain foreign countries. Since foreign securities normally are denominated and traded in foreign currencies, the value of the Fund’s assets may be affected favorably or unfavorably by currency exchange rates, currency exchange control regulations, foreign withholding taxes, and restrictions or prohibitions on the repatriation of foreign currencies. There may be less information publicly available about a foreign issuer than about a U.S. issuer, and foreign issuers are not generally subject to accounting, auditing, and financial reporting standards and practices comparable to those in the United States. The securities of some foreign issuers are less liquid and at times more volatile than securities of comparable U.S. issuers.
| | (c) | | Derivative Instruments |
GAAP requires enhanced disclosure that enables investors to understand how and why an entity uses derivatives, how derivatives are accounted for, and how derivative instruments affect an entity’s results of operations and financial position.
The Fund may invest in derivatives for hedging purposes, to maintain liquidity or to seek total return. Derivatives have a return tied to a formula based upon an interest rate, index, price of a security or other measurement. Derivatives include options, futures contracts, forward foreign currency contracts, swaps and related products. The Fund invested in derivative instruments such as purchased options, written options, forward currency contracts, swap contracts and futures contracts during the period.
There were no derivative instruments reported within the Statement of Assets and Liabilities as of December 31, 2021.
The effect of derivative instruments on the Statement of Operations for the year ended December 31, 2021 was as follows:
| | | | | | | | | | | | | | | | |
| | | Amount of Realized Gain (Loss) on Derivatives
Recognized in Income
| |
Derivatives not accounted for as hedging instruments
| | Purchased
Options
| | | Written
Options
| | | Futures
Contracts
| | | Total
| |
Equity Contracts | | $ | (331,538 | ) | | $ | — | | | $ | — | | | $ | (331,538 | ) |
| | |
|
|
| |
|
|
| |
|
|
| |
|
|
|
Total | | $ | (331,538 | ) | | $ | — | | | $ | — | | | $ | (331,538 | ) |
| | |
|
|
| |
|
|
| |
|
|
| |
|
|
|
Options
The Fund may write call and put options on securities and financial derivative instruments it owns or in which it may invest. Writing put options tends to increase the Fund’s exposure to decreases in the value of the underlying instrument. Writing covered call options tends to decrease the Fund’s exposure to the underlying instrument. Writing uncovered call options increases the Fund’s exposure to loss in the event of increase in value of the underlying instrument. When the Fund writes a call or put, an amount equal to the premium received is recorded as a liability and subsequently marked to market to reflect the current value of the option written. These liabilities are reflected as written options outstanding on the Statement of Assets and Liabilities. Premiums received from writing options which expire are treated as realized gains. Premiums received from writing options which are exercised or closed are added to the proceeds or offset against amounts paid on the underlying futures, swaps, security or currency transaction to determine the realized gain or loss. Certain options may be written with premiums to be determined on a future date. The Fund, as a writer of an option,
25
MARKETFIELD FUND
Notes to Financial Statements, continued
December 31, 2021
has no control over whether the underlying instrument may be sold (call) or purchased (put) and as a result bears the market risk of an unfavorable change in the price of the instrument underlying the written option. There is the risk the Fund may not be able to enter into a closing transaction because of an illiquid market. Writing call options involves the risk of loss in excess of the related amounts reflected in the Statement of Assets and Liabilities.
The Fund may also purchase put and call options. Purchasing call options tends to increase the Fund’s exposure to the underlying instrument. Alternatively, purchasing put options tends to decrease the Fund’s exposure to the underlying instrument. The Fund pays a premium which is included on the Fund’s Statement of Assets and Liabilities as an investment and subsequently marked to market to reflect the current value of the option. Premiums paid for purchasing options which expire are treated as realized losses. Certain options may be purchased with premiums to be determined on a future date. The premiums for these options are based upon implied volatility parameters at specified terms. The risk associated with purchasing put and call options is limited to the premium paid. Premiums paid for purchasing options which are exercised or closed are added to the amounts paid or offset against the proceeds on the underlying investment transaction to determine the realized gain or loss when the underlying transaction is sold.
The Fund may purchase or write foreign currency options. Purchasing a foreign currency option gives the Fund the right, but not the obligation, to buy or sell a specified amount of the currency at a specified rate of exchange that may be exercised on or before the option’s expiration date. Writing a foreign currency option obligates the Fund to buy or sell a specified amount of foreign currency at a specified rate of exchange, and such option may be exercised on or before the option’s expiration date in exchange for an option premium. These options may be used as a short or long hedge against possible variations in foreign exchange rates or to gain exposure to foreign currencies. The risks associated with writing a foreign currency put option is that the Fund may incur a loss if the value of the referenced foreign currency decreases and the option is exercised. The risks associated with writing a foreign currency call option is that if the value of the referenced foreign currency increases, and if the option is exercised, the Fund must either acquire the referenced foreign currency at the then higher price for delivery or, if the Fund already owns the referenced foreign currency, forego the opportunity for profit with respect to such foreign currency.
| | Futures | | and Forward Foreign Currency Contracts |
The Fund may enter into foreign currency forward exchange contracts. When entering into a forward currency contract, the Fund agrees to receive or deliver a fixed quantity of foreign currency for an agreed-upon price at a future date. The fair value of the contract fluctuates with changes in currency exchange rates. The contract is marked to market daily and the change in market value is recorded by the Fund as an unrealized gain or loss. The Fund records a realized gain or loss equal to the difference between the value of the contract at the time it was opened and the value at the time it was closed.
The Fund may enter into futures contracts traded on domestic and international exchanges, including stock index futures contracts. Upon entering into a contract, the Fund deposits and maintains as collateral such initial margin as required by the exchange on which the transaction is effected. Pursuant to the contract, the Fund agrees to receive from or pay to the broker an amount of cash equal to the daily fluctuation in value of the contract. Such receipts or payments are known as variation margin and are recorded by the Fund as unrealized gains and losses. When the contract is closed, the Fund records a realized gain or loss equal to the difference between the value of the contract at the time it was opened and the value at the time it was closed. As collateral for futures contracts, the Fund is required under the 1940 Act to maintain assets consisting of cash, cash equivalents or liquid securities. This collateral is required to be adjusted daily to reflect the market value of the obligations for futures contracts or the market value of the instrument underlying the contract.
The risks inherent in the use of futures contracts include 1) adverse changes in the value of such instruments and 2) the possible absence of a liquid secondary market for any particular instrument at any time. Futures
26
MARKETFIELD FUND
Notes to Financial Statements, continued
December 31, 2021
contracts also expose the Fund to counterparty credit risk. The Fund will not enter into these contracts unless it owns either 1) an offsetting position in the securities or 2) cash and liquid assets, with a value marked to market daily, sufficient to cover its potential obligations.
The Fund did not hold any futures contracts or forward foreign currency contracts during the period.
The Fund is subject to equity price, foreign exchange rate, credit, and volatility risk in the normal course of pursuing its investment objective. The Fund may enter into various swap transactions for investment purposes to manage these risks. These would be two-party contracts entered into primarily to exchange the returns (or differentials in rates of returns) earned or realized on particular pre-determined investments or instruments. The gross returns to be exchanged or “swapped” between parties are calculated with respect to a notional amount, i.e., the return on or increase in value of a particular dollar amount invested at a particular interest rate, in a particular foreign currency, or in a “basket” of securities representing a particular index or market segment. Changes in the value of swap agreements are recognized as unrealized gains or losses in the “marking to market” on a daily basis to reflect the value of the swap agreement at the end of each trading day. Payments received or paid at the beginning of the agreement are referred to as upfront payments. The Fund amortizes upfront payments and/or accrues for the fixed payment stream on swap agreements on a daily basis with the net amount recorded as a component of unrealized gain or loss until contracts are closed or payments are received/paid and recognized as income. A liquidation payment received or made at the termination of the swap agreement is recorded as a realized gain or loss on the Statement of Operations. The Fund segregates liquid securities having a value at least equal to the amount of its current obligation under any swap transaction. Entering into these agreements involves, to varying degrees, lack of liquidity and elements of credit, market, and counterparty risk. The Fund’s maximum risk of loss from counterparty credit risk is the discounted net value of the cash flows to be received from/paid to the counterparty over the contract’s remaining life, to the extent that amount is positive.
The Fund may enter into credit default swaps to manage its exposure to the market or certain sectors of the market, to reduce its risk exposure to defaults of corporate issuers or indexes or to create exposure to corporate issuers or indexes to which it is not otherwise exposed. In a credit default swap, the protection buyer makes a stream of payments based on a fixed percentage applied to the contract notional amount to the protection seller in exchange for the right to receive a specified return upon the occurrence of a defined credit event on the reference obligation which may be either a single security or a basket of securities issued by corporate or sovereign issuers. Although contract-specific, credit events are generally defined as bankruptcy, failure to pay, restructuring, obligation acceleration, obligation default, or repudiation/moratorium. Upon the occurrence of a defined credit event, the difference between the value of the reference obligation and the swap’s notional amount is recorded as realized gain (for protection written) or loss (for protection sold) in the Statement of Operations. In the case of credit default swaps where the Fund is selling protection, the notional amount approximates the maximum loss.
The Fund did not hold any swaps during the period.
The Fund may sell a security it does not own in anticipation of a decline in the fair value of that security. When the Fund sells a security short, it must borrow the security sold short and deliver it to the broker-dealer through which it made the short sale. A gain, limited to the price at which the Fund sold the security short, or a loss, unlimited in size, will be recognized upon the termination of a short sale.
For financial statement purposes, an amount equal to the settlement amount is included in the Statement of Assets and Liabilities as a liability. The amount of the liability is subsequently marked to market to reflect the current value of the short positions. Subsequent fluctuations in the market prices of the securities sold, but not
27
MARKETFIELD FUND
Notes to Financial Statements, continued
December 31, 2021
yet purchased, may require purchasing the securities at prices which could differ from the amount reflected in the Statement of Assets and Liabilities. The Fund is liable for any dividends or interest payable on securities while those securities are in a short position. Such amounts are recorded on the ex-dividend date as dividend or interest expense. As collateral for its short positions, the Fund is required under the 1940 Act to maintain segregated assets consisting of cash, cash equivalents or liquid securities. The segregated assets are valued consistent with Note 2a above. The amount of segregated assets is required to be adjusted daily to reflect changes in the fair value of the securities sold short.
| | (e) | | Counterparty Credit Risk |
In order to better define its contractual rights and to secure rights that will help the Fund mitigate its counterparty risk, the Fund may enter into an International Swaps and Derivatives Association, Inc. Master Agreement (“ISDA Master Agreement”) or similar agreement with its counterparties. An ISDA Master Agreement is a bilateral agreement between the Fund and a counterparty that governs certain OTC derivatives and typically contains collateral posting terms and netting provisions. Under an ISDA Master Agreement, the Fund may, under certain circumstances, offset with the counterparty certain derivative financial instruments’ payables and/or receivables with collateral held and/or posted and create one single net payment. The provisions of the ISDA Master Agreement typically permit a single net payment in the event of default including the bankruptcy or insolvency of the counterparty. Bankruptcy or insolvency laws of a particular jurisdiction may restrict or prohibit the right of offset in bankruptcy, insolvency or other events. In addition, certain ISDA Master Agreements may contain provisions for early termination of OTC derivative transactions in the event the net assets of the Fund decline below specific levels or if the Fund fails to meet the terms of its ISDA Master Agreements. The result would cause the Fund to accelerate payment of any net liability owed to the counterparty. For financial reporting purposes, the Fund does not offset derivative assets and derivative liabilities that are subject to netting arrangements, if any, in the Statement of Assets and Liabilities.
At December 31, 2021, the Fund had deposits with Bank of America Merrill Lynch, Citibank N.A., and Wells Fargo Securities, LLC (the “Brokers”), which served as collateral for derivative instruments and securities sold short. The Adviser determined, based on information available at the time, that the creditworthiness of each Broker is satisfactory. However, there is no guarantee that the Adviser’s determination is correct or will remain accurate.
The Fund intends to comply with the requirements of Subchapter M of the Internal Revenue Code of 1986, as amended, necessary to qualify as a regulated investment company and to make the requisite distributions of income and capital gains to its shareholders sufficient to relieve it from all or substantially all federal income taxes. Therefore, no federal income tax provision has been provided.
As of and during the year ended December 31, 2021, the Fund did not have a liability for any unrecognized tax benefits. The Fund recognizes interest and penalties, if any, related to unrecognized tax benefits as income tax expense in the Statement of Operations. During the year ended December 31, 2021, the Fund did not incur any interest or penalties. The Fund is not subject to examination by U.S. taxing authorities for the tax periods prior to the year ended December 31, 2018.
| | (g) | | Distributions to Shareholders |
In general, the Fund will distribute any net investment income and any net realized long- or short-term capital gains at least annually. Distributions from net realized gains for book purposes may include short-term capital gains. All short-term capital gains are included in ordinary income for tax purposes. Distributions to shareholders are recorded on the ex-dividend date. The Fund may also pay a special distribution at the end of the calendar year to comply with federal tax requirements.
28
MARKETFIELD FUND
Notes to Financial Statements, continued
December 31, 2021
Income and capital gain distributions may differ from GAAP, primarily due to timing differences in the recognition of income and gains and losses by the Fund. To the extent that these differences are attributable to permanent book and tax accounting differences, they are reclassified in the components of net assets.
The preparation of financial statements in conformity with GAAP requires management to make estimates and assumptions that affect the reported amounts of assets and liabilities and disclosure of contingent assets and liabilities at the date of the financial statements and the reported amounts of revenues and expenses during the reporting period. Actual results could differ from those estimates.
The NAV per share of the Fund is calculated by dividing the sum of the value of the securities held by the Fund, plus cash or other assets, minus all liabilities (including estimated accrued expenses) by the total number of shares outstanding for the Fund, rounded to the nearest cent. The Fund’s shares will not be priced on the days on which the New York Stock Exchange is closed for trading.
| | (j) | | Allocation of Income, Expenses and Gains/Losses |
Income, expenses (other than those deemed attributable to a specific share class), and gains and losses of the Fund are allocated daily to each class of shares based upon the ratio of net assets represented by each class as a percentage of the net assets of the Fund. Expenses deemed directly attributable to a class of shares are recorded by the specific class. Most Fund expenses are allocated by class based on relative net assets. Rule 12b-1 distribution and service fees are expensed at 0.25% of average daily net assets of the Class A shares and at 1.00% of average daily net assets of the Class C shares. Expenses associated with a specific fund in the Trust are charged to that fund. Expenses are recognized on an accrual basis. Common Trust expenses are typically allocated evenly between the funds of the Trust, or by other equitable means.
Investment transactions are recorded on the trade date. The Fund determines the gain or loss from investment transactions on the identified cost basis by comparing original cost of the security lot sold with the net sale proceeds. Dividend income and expense, less net foreign withholding tax, are recognized on the ex-dividend date and interest income and expense are recognized on an accrual basis. Withholding taxes on foreign dividends and interest, net of any reclaims, have been provided for in accordance with the Fund’s understanding of the applicable country’s tax rules and rates. Payments received on securities in default are recorded as return of capital.
The tax character of distributions paid during the years ended December 31, 2020 and 2021 were as follows:
| | | | | | | | |
| | | Ordinary
Income
| | | Long-Term
Capital Gain
| |
December 31, 2020 | | $ | — | | | $ | — | |
December 31, 2021 | | $ | — | | | $ | — | |
29
MARKETFIELD FUND
Notes to Financial Statements, continued
December 31, 2021
As of December 31, 2021, the components of accumulated earnings on a tax basis were as follows:
| | | | |
Cost basis of investments for federal income tax purposes | | $ | 100,533,071 | |
| | |
|
|
|
Gross tax unrealized appreciation | | | 60,438,855 | |
Gross tax unrealized depreciation | | | (13,191,492 | ) |
| | |
|
|
|
Net tax unrealized appreciation | | | 47,247,363 | |
| | |
|
|
|
Undistributed ordinary income | | | — | |
Undistributed long-term capital gain | | | — | |
| | |
|
|
|
Total distributable earnings | | | — | |
Other accumulated losses | | | (371,998,314 | ) |
| | |
|
|
|
Total accumulated losses | | $ | (324,750,951 | ) |
| | |
|
|
|
The difference between book-basis and tax-basis unrealized appreciation (depreciation) is primarily due to wash sale loss deferrals.
At December 31, 2021, the Fund had short-term capital losses of $371,998,314, which will be carried forward indefinitely to offset future realized capital gains. To the extent the Fund realizes future net capital gains, taxable distributions to its shareholders will be first offset by any unused capital loss carryovers from the year ended December 31, 2021.
The Fund utilized $32,625,843 of short-term capital loss carryover during the year ended December 31, 2021.
Additionally, U.S. GAAP requires that certain components of net assets relating to permanent differences be reclassified between financial and tax reporting. These reclassifications have no effect on net assets or NAV per share. For the year ended December 31, 2021, the following table shows the reclassifications made:
| | |
Accumulated Deficit
| | Paid In Capital
|
$141,126 | | $(141,126) |
The Trust, on behalf of the Fund, has an Investment Advisory Agreement (the “Agreement”) with Marketfield Asset Management LLC to furnish investment advisory services to the Fund. Under the terms of the Agreement, the Trust, on behalf of the Fund, compensates the Adviser for its investment advisory services at an annual rate of the Fund’s average daily net assets as follows: 1.40% up to $7.5 billion; 1.38% from $7.5 billion to $15 billion; and 1.36% in excess of $15 billion. For the year ended December 31, 2021, the effective management fee rate (exclusive of any applicable waivers/reimbursements) was 1.40% and the Adviser earned fees in the amount of $2,261,120 from the Fund.
The Adviser has contractually agreed to waive its management fee and/or reimburse the Fund’s other expenses (the “Expense Limitation Cap”) at least through April 30, 2023, at the discretion of the Adviser and the Board of Trustees, to the extent necessary to ensure that the Fund’s total operating expenses for each share class (exclusive of front-end or contingent deferred sales loads, taxes, leverage, interest, brokerage commissions, expenses incurred in connection with any merger or reorganization, dividends or interest expenses on short positions, acquired fund fees and expenses and extraordinary expenses such as litigation) do not exceed the Expense Limitation Cap as follows:
| | | | |
Class A
| | Class C
| | Class I
|
1.80% | | 2.57% | | 1.56% |
30
MARKETFIELD FUND
Notes to Financial Statements, continued
December 31, 2021
Any such waiver or reimbursement is subject to later adjustment to allow the Adviser to recoup amounts waived or reimbursed to the extent actual fees and expenses for a fiscal period do not exceed the lesser of: (1) the Expense Limitation Cap in place at the time of the waiver or reimbursement; or (2) the Expense Limitation Cap in place at the time of the recoupment; provided, however, that the Adviser shall only be entitled to recoup such amounts over the following three year period from the date of the waiver or reimbursement.
The following table shows the waivers per class that are subject to potential recovery expiring on:
| | | | | | | | | | | | |
| | | Class A
| | | Class C
| | | Class I
| |
December 31, 2022 | | $ | 100,616 | | | $ | 107,074 | | | $ | 309,041 | |
December 31, 2023 | | $ | 102,444 | | | $ | 80,122 | | | $ | 237,327 | |
December 31, 2024 | | $ | 101,368 | | | $ | 30,115 | | | $ | 201,619 | |
The Trust has adopted a plan pursuant to Rule 12b-1 under the 1940 Act (the “12b-1 Plan”), on behalf of the Fund, which authorizes it to pay Quasar Distributors, LLC (the “Distributor” or “Quasar”), the Fund’s distributor and principal underwriter. Pursuant to the 12b-1 Plan, the Distributor receives a distribution fee of 0.25% of the average daily net assets of the Class A shares for services to prospective Fund shareholders and distribution of Fund shares. Pursuant to the 12b-1 Plan, Class C shares pay the Distributor a distribution fee of 0.75% of the average daily net assets of the Class C shares, along with a shareholder servicing fee of 0.25% of the average daily net assets of the Class C shares, for a total 12b-1 fee of 1.00%. Class I shares are not subject to the 12b-1 Plan. As of and during the year ended December 31, 2021, the Fund accrued and owed expenses related to the 12b-1 Plan as presented in the Statement of Operations and Statement of Assets and Liabilities, respectively, as follows:
| | | | | | | | | | | | | | | | |
| | | 12b-1 Fees
| | | Shareholder Servicing Fees
| |
| | | Fees Expensed
| | | Fees Owed
| | | Fees Expensed
| | | Fees Owed
| |
Class A | | $ | 111,162 | | | $ | 3,965 | | | | N/A | | | | N/A | |
Class C | | $ | 184,329 | | | $ | 11,912 | | | $ | 40,627 | | | $ | 16,233 | |
| (6) | | Related Party Transactions |
U.S. Bancorp Fund Services, LLC, doing business as U.S. Bank Global Fund Services (“Fund Services” or the “Administrator”), acts as the Fund’s Administrator under an Administration Agreement. The Administrator prepares various federal and state regulatory filings, reports and returns for the Fund; prepares reports and materials to be supplied to the Trustees; monitors the activities of the Fund’s custodian, transfer agent and accountants; coordinates the preparation and payment of the Fund’s expenses; and reviews the Fund’s expense accruals. Fund Services also serves as the fund accountant and transfer agent to the Fund. U.S. Bank National Association (“U.S. Bank”), an affiliate of Fund Services, serves as the Fund’s custodian. The following table details the fees expensed for each service during the year ended December 31, 2021, as well as the fees owed as of December 31, 2021.
| | | | | | | | |
| | | Fees Expensed During
Fiscal Year
| | | Fees Owed as of
December 31, 2021
| |
Administration and Fund Accounting | | $ | 195,066 | | | $ | 31,397 | |
Pricing | | | 1,723 | | | | 295 | |
Custody | | | 30,970 | | | | 4,812 | |
Transfer Agent | | | 86,107 | (1) | | | 14,926 | |
| | (1) | | This amount does not include sub-transfer agency fees, and therefore it does not agree to the amount on the Statement of Operations. |
31
MARKETFIELD FUND
Notes to Financial Statements, continued
December 31, 2021
The Fund also has a line of credit with U.S. Bank (see Note 9).
Certain officers of the Fund are also employees of Fund Services. A Trustee of the Trust is affiliated with Fund Services and U.S. Bank and is deemed to be an “interested” person of the Trust as defined by the 1940 Act.
The Trust’s Chief Compliance Officer is also an employee of Fund Services. For the year ended December 31, 2021, the Fund was allocated $11,999 of the Trust’s Chief Compliance Officer fee. At December 31, 2021, the Fund owed fees of $1,989 to Fund Services for the Chief Compliance Officer’s services.
| (7) | | Capital Share Transactions |
Transactions in shares of the Fund were as follows:
| | | | | | | | |
| | | Year Ended
December 31, 2021
| | | Year Ended
December 31, 2020
| |
| Class A | | | | | | | | |
Shares sold | | | 396,711 | | | | 446,194 | |
Shares redeemed | | | (318,458 | ) | | | (586,308 | ) |
| | |
|
|
| |
|
|
|
Net increase (decrease) | | | 78,253 | | | | (140,114 | ) |
| | |
|
|
| |
|
|
|
| Class C | | | | | | | | |
Shares sold | | | 1,799 | | | | 6,121 | |
Shares redeemed | | | (628,747 | ) | | | (961,327 | ) |
| | |
|
|
| |
|
|
|
Net decrease | | | (626,948 | ) | | | (955,206 | ) |
| | |
|
|
| |
|
|
|
| Class I | | | | | | | | |
Shares sold | | | 283,056 | | | | 285,401 | |
Shares redeemed | | | (694,631 | ) | | | (2,047,576 | ) |
| | |
|
|
| |
|
|
|
Net decrease | | | (411,575 | ) | | | (1,762,175 | ) |
| | |
|
|
| |
|
|
|
| Class R6 | | | | | | | | |
Shares sold | | | — | | | | 2,683 | |
Shares redeemed | | | — | | | | (100,063 | ) |
| | |
|
|
| |
|
|
|
Net decrease | | | — | | | | (97,380 | ) |
| | |
|
|
| |
|
|
|
| | (1) | | Class R6 shares of the Fund were liquidated as of the close of business on November 30, 2020. |
| (8) | | Investment Transactions |
The aggregate purchases and sales of securities, excluding short-term investments, securities sold short and derivative instruments for the Fund for the year ended December 31, 2021 are detailed below.
| | | | |
| Purchases | | | | |
U.S. Government | | $ | 0 | |
Other | | | 37,855,927 | |
| | |
|
|
|
| | | $ | 37,855,927 | |
| | |
|
|
|
| | | | |
| Sales | | | | |
U.S. Government | | $ | 0 | |
Other | | | 72,282,830 | |
| | |
|
|
|
| | | $ | 72,282,830 | |
| | |
|
|
|
32
MARKETFIELD FUND
Notes to Financial Statements, continued
December 31, 2021
The Fund has a line of credit with maximum borrowing for the lesser of 33.33% of the fair value of unencumbered net assets of the Fund or $15,000,000, which expires on August 6, 2022. This unsecured line of credit is intended to provide short-term financing, if necessary, in connection with shareholder redemptions, and subject to certain restrictions. Interest was accrued at the prime rate of 3.25% from January 1, 2021 through December 31, 2021. The credit facility is with the Fund’s custodian, U.S. Bank. The Fund did not borrow on the line of credit during the year ended December 31, 2021.
| (10) | | Recent Market Events |
U.S. and international markets have experienced volatility in recent months and years due to a number of economic, political and global macro factors, including the impact of the coronavirus (COVID-19) global pandemic, which resulted in a public health crisis, business interruptions, growth concerns in the U.S. and overseas, travel restrictions, changed social behaviors, rising inflation and reduced consumer spending. While several countries, including the U.S., have begun to lift public health restrictions in efforts to reopen their respective economies, the outbreak of new variants have led to the renewal of health mandates by local governments and businesses, reduced hiring efforts by employers, event cancellations and additional travel restrictions, supply chain shortages, cessation of return-to-office plans and an overall economic slowdown. While U.S. and global economies are recovering from the effects of COVID-19, the recovery is proceeding at slower than expected rates and may last for a prolonged period of time. Uncertainties regarding interest rates, political events, rising government debt in the U.S. and trade tensions have also contributed to market volatility. Global economies and financial markets are increasingly interconnected, which increases the possibility that conditions in one country or region might adversely impact issuers in a different country or region. In particular, a rise in protectionist trade policies, slowing global economic growth, risks associated with epidemic and pandemic diseases, risks associated with the United Kingdom’s departure from the European Union, the risk of trade disputes, and the possibility of changes to some international trade agreements, could affect the economies of many nations, including the United States, in ways that cannot necessarily be foreseen at the present time. Continuing market volatility as a result of recent market conditions or other events may have adverse effects on your account.
The Board, at a meeting held on September 22, 2021, approved an Agreement and Plan of Reorganization (the “Plan of Reorganization”) relating to the Fund. The Plan of Reorganization provides for the reorganization of the Marketfield Fund into the Cromwell Marketfield L/S Fund, a newly created series of Total Fund Solution, an open-end registered investment management company. A notice of a special meeting of shareholders and a proxy statement seeking shareholder approval for the Plan of Reorganization was mailed on January 3, 2022 to Fund shareholders of record as of December 10, 2021.
The Fund has evaluated events and transactions that have occurred subsequent to December 31, 2021 and determined there were no subsequent events that would require recognition or disclosure in financial statements.
33
MARKETFIELD FUND
REPORT OF INDEPENDENT REGISTERED PUBLIC ACCOUNTING FIRM
To the Shareholders of Marketfield Fund and the
Board of Trustees of Trust for Professional Managers:
| Opinion | | on the Financial Statements and Financial Highlights |
We have audited the accompanying statement of assets and liabilities, including the schedule of investments, and schedule of securities sold short of the Marketfield Fund (the “Fund”), a portfolio of the diversified series constituting Trust for Professional Managers, as of December 31, 2021, the related statement of operations for the year then ended, the statements of changes in net assets for each of the two years in the period then ended, the financial highlights for each of the five years in the period then ended, and the related notes. In our opinion, the financial statements and financial highlights present fairly, in all material respects, the financial position of the Fund as of December 31, 2021, and the results of its operations for the year then ended, the changes in its net assets for each of the two years in the period then ended, and the financial highlights for each of the five years in the period then ended in conformity with accounting principles generally accepted in the United States of America.
These financial statements and financial highlights are the responsibility of the Fund’s management. Our responsibility is to express an opinion on the Fund’s financial statements and financial highlights based on our audits. We are a public accounting firm registered with the Public Company Accounting Oversight Board (United States) (PCAOB) and are required to be independent with respect to the Fund in accordance with the U.S. federal securities laws and the applicable rules and regulations of the Securities and Exchange Commission and the PCAOB.
We conducted our audits in accordance with the standards of the PCAOB. Those standards require that we plan and perform the audits to obtain reasonable assurance about whether the financial statements and financial highlights are free of material misstatement, whether due to error or fraud. The Fund is not required to have, nor were we engaged to perform, an audit of its internal control over financial reporting. As part of our audits we are required to obtain an understanding of internal control over financial reporting but not for the purpose of expressing an opinion on the effectiveness of the Fund’s internal control over financial reporting. Accordingly, we express no such opinion.
Our audits included performing procedures to assess the risks of material misstatement of the financial statements and financial highlights, whether due to error or fraud, and performing procedures that respond to those risks. Such procedures included examining, on a test basis, evidence regarding the amounts and disclosures in the financial statements and financial highlights. Our audits also included evaluating the accounting principles used and significant estimates made by management, as well as evaluating the overall presentation of the financial statements and financial highlights. Our procedures included confirmation of securities owned as of December 31, 2021, by correspondence with the custodian and brokers. We believe that our audits provide a reasonable basis for our opinion.
/s/ Deloitte & Touche LLP
Chicago, Illinois
February 28, 2022
We have served as the auditor of one or more Trust for Professional Managers’ investment companies since 2002.
34
MARKETFIELD FUND
NOTICE OF PRIVACY POLICY & PRACTICES
We collect non-public personal information about you from the following sources:
| | • | | information we receive about you on applications or other forms; |
| | • | | information you give us orally; and |
| | • | | information about your transactions with us or others. |
We do not disclose any non-public personal information about our shareholders or former shareholders without the shareholder’s authorization, except as permitted by law or in response to inquiries from governmental authorities. We may share information with affiliated parties and unaffiliated third parties with whom we have contracts for servicing the Fund. We will provide unaffiliated third parties with only the information necessary to carry out their assigned responsibility. All shareholder records will be disposed of in accordance with applicable law. We maintain physical, electronic and procedural safeguards to protect your non-public personal information and require third parties to treat your non-public personal information with the same high degree of confidentiality.
In the event that you hold shares of the Fund through a financial intermediary, including, but not limited to, a broker-dealer, bank or trust company, the privacy policy of your financial intermediary would govern how your non-public personal information would be shared with unaffiliated third parties.
35
BASIS FOR TRUSTEES’ APPROVAL OF INVESTMENT ADVISORY AGREEMENT
The Board of Trustees (the “Trustees”) of Trust for Professional Managers (the “Trust”) met on August 4, 2021 to consider the renewal of the Investment Advisory Agreement (the “Agreement”) between the Trust, on behalf of the Marketfield Fund (the “Fund”), a series of the Trust, and Marketfield Asset Management LLC (“Marketfield”), the Fund’s investment adviser. The Trustees also met at a prior meeting held on June 23, 2021 (the “June 23, 2021 Meeting”) to review materials related to the renewal of the Agreement. Prior to these meetings, the Trustees requested and received materials to assist them in considering the renewal of the Agreement. The materials provided contained information with respect to the factors enumerated below, including a copy of the Agreement, a memorandum prepared by the Trust’s outside legal counsel discussing in detail the Trustees’ fiduciary obligations and the factors they should assess in considering the renewal of the Agreement, detailed comparative information relating to the Fund’s performance, as well as the management fees and other expenses of the Fund, due diligence materials relating to the Adviser (including a due diligence questionnaire completed on behalf of the Fund by the Adviser, the Adviser’s Form ADV, select financial statements of the Adviser, biographical information of the Adviser’s key management and compliance personnel, comparative fee information for the Fund and the Adviser’s other separately-managed accounts and a summary detailing key provisions of the Adviser’s written compliance program, including its code of ethics) and other pertinent information. The Trustees also received information periodically throughout the year that was relevant to the Agreement renewal process, including performance, management fee and other expense information. Based on their evaluation of the information provided by the Adviser, in conjunction with the Fund’s other service providers, the Trustees, by a unanimous vote (including a separate vote of the Trustees who are not “interested persons,” as that term is defined in the Investment Company Act of 1940, as amended (the “Independent Trustees”)), approved the continuation of the Agreement for an additional one-year term ending August 31, 2022.
DISCUSSION OF FACTORS CONSIDERED
In considering the renewal of the Agreement and reaching their conclusions, the Trustees reviewed and analyzed various factors that they determined were relevant, including the factors enumerated below.
| | 1. | | NATURE, EXTENT AND QUALITY OF SERVICES PROVIDED TO THE FUND |
The Trustees considered the nature, extent and quality of services provided by the Adviser to the Fund and the amount of time devoted by the Adviser’s staff to the Fund’s operations. The Trustees considered the Adviser’s specific responsibilities in all aspects of day-to-day management of the Fund, as well as the qualifications, experience and responsibilities of Michael C. Aronstein and Michael Shaoul, the Fund’s portfolio managers, and other key personnel at the Adviser involved in the day-to-day activities of the Fund. The Trustees reviewed information provided by the Adviser in a due diligence questionnaire, including the structure of the Adviser’s compliance program and discussed the Adviser’s marketing activities and its continuing commitment to the Fund. The Trustees noted that during the course of the prior year the Adviser had participated in a Trust board meeting to discuss various performance, marketing and compliance issues. The Trustees also noted any services that extended beyond portfolio management, and they considered the brokerage practices of the Adviser. The Trustees discussed the Adviser’s handling of compliance matters, including the reports of the Trust’s chief compliance officer to the Trustees on the effectiveness of the Adviser’s compliance program. The Trustees also considered the Adviser’s overall financial condition, as well as the implementation and operational effectiveness of the Adviser’s business continuity plan in response to the novel coronavirus (COVID-19) pandemic and challenges to day-to-day operations. The Trustees concluded that the Adviser had sufficient quality and depth of personnel, resources, investment methods and compliance policies and procedures essential to performing its duties under the Advisory Agreement and that the nature, overall quality and extent of the management services provided to the Fund, as well as the Adviser’s compliance program, were satisfactory and reliable.
| | 2. | | INVESTMENT PERFORMANCE OF THE FUND AND THE ADVISER |
The Trustees discussed the performance of the Fund’s Class I shares for the quarter, one-year, three-year, five-year, ten-year and since inception periods ended March 31, 2021. In assessing the quality of the portfolio management services provided by the Adviser, the Trustees also compared the short-term and longer-term performance of the Class I shares of the Fund on both an absolute basis and in comparison to a benchmark index, the S&P 500® Total Return Index, and in comparison to a peer group of U.S. open-end long-short equity funds in
36
the Fund’s current Morningstar category as constructed by data presented by Morningstar Direct (the “Morningstar Peer Group”). The Trustees also noted that the Adviser manages a private investment fund with an investment strategy similar to that of the Fund.
The Trustees noted that for the quarter, one-year, three-year and five-year periods ended March 31, 2021, the Fund’s performance for Class I shares ranked above the Morningstar Peer Group median, and that for the ten-year period ended March 31, 2021 the Fund’s performance for Class I shares ranked below the Morningstar Peer Group median. The Trustees also noted that for the quarter, one-year, three-year, five-year, ten-year and since inception periods ended March 31, 2021, the Fund’s Class I shares had underperformed the S&P 500® Total Return Index. The Trustees also reviewed the Fund’s performance relative to the Adviser’s private fund with an investment strategy similar to that of the Fund, noting that the performance for relevant periods was not materially different.
After considering all of the information, the Trustees concluded that the performance obtained by the Adviser for the Fund was satisfactory under current market conditions. Although past performance is not a guarantee or indication of future results, the Trustees determined that the Fund and its shareholders were likely to benefit from the Adviser’s continued management.
| | 3. | | COSTS OF SERVICES PROVIDED AND PROFITS REALIZED BY THE ADVISER |
The Trustees considered the cost of services and the structure of the Adviser’s fees, including a review of the expense analyses and other pertinent material with respect to the Fund. The Trustees reviewed the related statistical information and other materials provided, including the comparative expenses, expense components and peer group selection. The Trustees also considered the cost structure of the Fund relative to the Morningstar Peer Group, as well as any fee waivers and expense reimbursements of the Adviser.
The Trustees also considered the overall profitability of the Adviser, reviewing the Adviser’s financial information and noted that the Adviser had subsidized the Fund’s operations in the form of management fee waivers since the Fund’s reorganization into the Trust, and had not yet recouped those subsidies. The Trustees also examined the level of profits realized by the Adviser from the fees payable under the Advisory Agreement, as well as the Fund’s brokerage practices. These considerations were based on materials requested by the Trustees and the Fund’s administrator specifically for the June 23, 2021 meeting and the August 4, 2021 meeting at which the Advisory Agreement was formally considered, as well as the reports prepared by the Adviser over the course of the year.
The Trustees noted that the Fund’s contractual management fee of 1.40% was above the Morningstar Peer Group average of 1.18%. The Trustees observed that the Fund’s total expense ratio (net of fee waivers and expense reimbursements and including dividends and interest expense on short positions) of 2.20% for Class I shares was below the Morningstar Peer Group average (which excludes Rule 12b-1 fees but includes dividends and interest expense on short positions) of 1.67%.
The Trustees concluded that the Fund’s expenses and the management fees paid to the Adviser were fair and reasonable in light of the comparative performance, expense and management fee information. The Trustees further concluded, based on a profitability analysis prepared by the Adviser, that the Fund was not profitable to the Adviser after accounting for marketing and distribution expenses, but the Adviser maintained adequate profit levels to support its services to the Fund from the revenues of its overall investment advisory business, despite its subsidies to support the Fund’s operations.
| | 4. | | EXTENT OF ECONOMIES OF SCALE AS THE FUND GROWS |
The Trustees compared the Fund’s expenses relative to the Morningstar Peer Group and discussed realized and potential economies of scale. The Trustees also reviewed the structure of the Fund’s management fee and whether the Fund was large enough to generate economies of scale for shareholders or whether economies of scale would be expected to be realized as Fund assets grow (and if so, how those economies of scale were being or would be shared with shareholders). The Trustees reviewed all fee waivers, expense reimbursements and potential recoupments by the Adviser with respect to the Fund. The Trustees noted that the Fund’s management fee structure contained breakpoint reductions as the Fund’s assets grow in size. With respect to the Adviser’s fee
37
structure, the Trustees concluded that the current fee structure was reasonable and reflected a sharing of economies of scale between the Adviser and the Fund at the Fund’s current asset level.
| | 5. | | BENEFITS DERIVED FROM THE RELATIONSHIP WITH THE FUND |
The Trustees considered the direct and indirect benefits that could be realized by the Adviser from its association with the Fund. The Trustees concluded that the benefits the Adviser may receive, such as greater name recognition or the ability to attract additional investor assets, appear to be reasonable, and in many cases may benefit the Fund.
CONCLUSIONS
The Trustees considered all of the foregoing factors. In considering the renewal of the Advisory Agreement, the Trustees did not identify any one factor as all-important, but rather considered these factors collectively in light of the Fund’s surrounding circumstances. Based on this review, the Trustees, including a majority of the Independent Trustees, approved the continuation of the Advisory Agreement for an additional term ending August 31, 2022 as being in the best interests of the Fund and its shareholders.
38
MARKETFIELD FUND
Additional Information
(Unaudited)
Indemnifications
Under the Trust’s organizational documents, its officers and Trustees are indemnified against certain liabilities arising out of the performance of their duties to the Fund. In addition, in the normal course of business, the Fund enters into contracts that provide general indemnifications to other parties. The Fund’s maximum exposure under these arrangements is unknown as this would involve future claims that may be made against the Fund that have not yet occurred. However, the Fund has not had prior claims or losses pursuant to these contracts and expects the risk of loss to be remote.
Information about Trustees
The business and affairs of the Trust are managed under the direction of the Board of Trustees. Information pertaining to the Trustees of the Trust is set forth below. The Statement of Additional Information includes additional information about the Trustees and is available, without charge, upon request by calling 1-800-311-6583.
Independent Trustees
| | | | | | | | | | |
Name,
Address and Year of Birth
| | Position(s)
Held with
the Trust
| | Term of
Office and
Length of
Time Served
| | Number of
Portfolios
in Trust
Overseen
by Trustee
| | Principal Occupation(s)
During the Past Five Years
| | Other
Directorships Held by
Trustee During the Past
Five Years
|
Michael D. Akers, Ph.D. 615 E. Michigan St. Milwaukee, WI 53202 Year of Birth: 1955 | | Trustee | | Indefinite Term; Since August 22, 2001 | | 24 | | Professor Emeritus, Department of Accounting (June 2019–Present), Professor, Department of Accounting (2004–May 2019), Chair, Department of Accounting (2004–2017), Marquette University. | | Independent Trustee, USA MUTUALS (an open-end investment company (2001-2021)). |
| | | | | |
Gary A. Drska 615 E. Michigan St. Milwaukee, WI 53202 Year of Birth: 1956 | | Trustee | | Indefinite Term; Since August 22, 2001 | | 24 | | Retired; Pilot, Frontier/Midwest Airlines, Inc. (airline company) (1986–2021). | | Independent Trustee, USA MUTUALS (an open-end investment company (2001-2021)). |
Interested Trustee and Officers
| | | | | | | | | | |
Name,
Address and Year of Birth
| | Position(s)
Held with
the Trust
| | Term of
Office and
Length of
Time Served
| | Number of
Portfolios
in Trust
Overseen
by Trustee
| | Principal Occupation(s)
During the Past Five Years
| | Other
Directorships Held by
Trustee During the Past
Five Years
|
Joseph C. Neuberger* 615 E. Michigan St. Milwaukee, WI 53202 Year of Birth: 1962 | | Chairperson and Trustee | | Indefinite Term; Since August 22, 2001 | | 24 | | President (2017–present), Chief Operating Officer (2016–2020), Executive Vice President (1994–2017), U.S. Bancorp Fund Services, LLC. | | Trustee, Buffalo Funds (an open-end investment company) (2003–2017); Trustee, USA MUTUALS (an open-end investment company) (2001–2018). |
| | | | | |
John P. Buckel 615 E. Michigan St. Milwaukee, WI 53202 Year of Birth: 1957 | | President and Principal Executive Officer | | Indefinite Term; Since January 24, 2013 | | N/A | | Vice President, U.S. Bancorp Fund Services, LLC (2004–present). | | N/A |
39
MARKETFIELD FUND
Additional Information (continued)
(Unaudited)
| | | | | | | | | | |
Name,
Address and Year of Birth
| | Position(s)
Held with
the Trust
| | Term of
Office and
Length of
Time Served
| | Number of
Portfolios
in Trust
Overseen
by Trustee
| | Principal Occupation(s)
During the Past Five Years
| | Other
Directorships Held by
Trustee During the Past
Five Years
|
| | | | | |
Jennifer A. Lima 615 E. Michigan St. Milwaukee, WI 53202 Year of Birth: 1974 | | Vice President, Treasurer and Principal Financial and Accounting Officer | | Indefinite Term; Since January 24, 2013 | | N/A | | Vice President, U.S. Bancorp Fund Services, LLC (2002–present). | | N/A |
| | | | | |
Deanna B. Marotz 615 E. Michigan St. Milwaukee, WI 53202 Year of Birth: 1965 | | Chief Compliance Officer, Vice President and Anti-Money Laundering Officer | | Indefinite Term; Since October 21, 2021 | | N/A | | Senior Vice President, U.S. Bancorp Fund Services, LLC (2021–present); Chief Compliance Officer, Keeley-Teton Advisors, LLC and Teton Advisors, Inc (2017–2021); Chief Compliance Officer, Keeley Asset Management Corp. (2015–2017). | | N/A |
| | | | | |
Jay S. Fitton 615 E. Michigan St. Milwaukee, WI 53202 Year of Birth: 1970 | | Secretary | | Indefinite Term; Since July 22, 2019 | | N/A | | Assistant Vice President, U.S. Bancorp Fund Services, LLC (2019–present); Partner, Practus, LLP (2018–2019); Counsel, Drinker Biddle & Reath (2016–2018). | | N/A |
| | | | | |
Kelly A. Strauss 615 E. Michigan St. Milwaukee, WI 53202 Year of Birth: 1987 | | Assistant Treasurer | | Indefinite Term; Since April 23, 2015 | | N/A | | Assistant Vice President, U.S. Bancorp Fund Services, LLC (2011–present). | | N/A |
| | | | | |
Melissa Aguinaga 615 E. Michigan St. Milwaukee, WI 53202 Year of Birth: 1987 | | Assistant Treasurer | | Indefinite Term; Since July 1, 2015 | | N/A | | Assistant Vice President, U.S. Bancorp Fund Services, LLC (2010–present). | | N/A |
| | | | | |
Laura A. Carroll 615 E. Michigan St. Milwaukee, WI 53202 Year of Birth: 1985 | | Assistant Treasurer | | Indefinite Term; Since August 20, 2018 | | N/A | | Assistant Vice President, U.S. Bancorp Fund Services, LLC (2007–present). | | N/A |
| * | | Mr. Neuberger is deemed to be an “interested person” of the Trust as defined by the 1940 Act due to his position and material business relationship with the Trust. |
40
A NOTE ON FORWARD LOOKING STATEMENTS (Unaudited)
Except for historical information contained in this report for the Fund, the matters discussed in this report may constitute forward-looking statements made pursuant to the safe-harbor provisions of the Private Securities Litigation Reform Act of 1995. These include any Adviser or portfolio manager predictions, assessments, analyses or outlooks for individual securities, industries, market sectors and/or markets. These statements involve risks and uncertainties. In addition to the general risks described for the Fund in the current Prospectus, other factors bearing on this report include the accuracy of the Adviser’s or portfolio manager’s forecasts and predictions, and the appropriateness of the investment programs designed by the Adviser or portfolio manager to implement their strategies efficiently and effectively. Any one or more of these factors, as well as other risks affecting the securities markets and investment instruments generally, could cause the actual results of the Fund to differ materially as compared to benchmarks associated with the Fund.
ADDITIONAL INFORMATION (Unaudited)
The Fund has adopted proxy voting policies and procedures that delegate to the Adviser the authority to vote proxies. A description of the Fund’s proxy voting policies and procedures is available without charge, upon request, by calling the Fund toll free at 1-800-311-6583. A description of these policies and procedures is also included in the Fund’s Statement of Additional Information, which is available on the SEC’s website at http://www.sec.gov.
The Fund’s proxy voting record for the most recent 12-month period ended June 30 is available without charge, upon request, by calling toll free, 1-800-311-6583, or by accessing the SEC’s website at http://www.sec.gov.
The Fund files its complete schedule of portfolio holdings with the SEC for the first and third quarters of each fiscal year on Part F of Form N-PORT. Shareholders may view the Fund’s filings on the SEC’s website at http://www.sec.gov.
HOUSEHOLDING (Unaudited)
In an effort to decrease costs, the Fund intends to reduce the number of duplicate prospectuses, supplements and certain other shareholder documents you receive by sending only one copy of each to those addresses shared by two or more accounts and to shareholders the Fund reasonably believes are from the same family or household. Once implemented, if you would like to discontinue householding for your accounts, please call the Fund toll-free at 1-800-311-6583 to request individual copies of these documents. Once the Fund receives notice to stop householding, the Fund will begin sending individual copies 30 days after receiving your request. This policy does not apply to account statements.
MARKETFIELD FUND
| | |
Investment Adviser | | Marketfield Asset Management LLC 369 Lexington Avenue
3rd Floor New York, New York 10017 |
| |
Legal Counsel | | Godfrey & Kahn, S.C. 833 East Michigan Street, Suite 1800 Milwaukee, Wisconsin 53202 |
| |
Independent Registered Public
Accounting Firm | | Deloitte & Touche LLP 111 South Wacker Drive Chicago, Illinois 60606 |
| |
Transfer Agent, Fund Accountant
and Fund Administrator | | U.S. Bancorp Fund Services, LLC 615 East Michigan Street Milwaukee, Wisconsin 53202 |
| |
Custodian | | U.S. Bank National Association Custody Operations 1555 North River Center Drive Suite 302 Milwaukee, Wisconsin 53212 |
| |
Distributor | | Quasar Distributors, LLC 111 East Kilborn Avenue Suite 2200 Milwaukee, Wisconsin 53202 |
This report is intended for shareholders of the Fund and may not be used as sales literature unless preceded or accompanied by a current prospectus.
MJ ANNUAL
Item 2. Code of Ethics.
The registrant has adopted a code of ethics that applies to the registrant’s principal executive officer and principal financial officer. The registrant has not made any substantive amendments to its code of ethics during the period covered by this report. The registrant has not granted any waivers from any provisions of the code of ethics during the period covered by this report. Incorporated by reference to the Registrant’s Form N-CSR filed on March 9, 2017.
Item 3. Audit Committee Financial Expert.
Dr. Michael Akers is the “audit committee financial expert” and is considered to be “independent” as each term is defined in Item 3 of Form N-CSR. Dr. Akers holds a Ph.D. in accountancy and is a professor Emeritus of accounting at Marquette University in Milwaukee, Wisconsin.
Item 4. Principal Accountant Fees and Services.
The registrant has engaged its principal accountant to perform audit services, audit-related services, tax services and other services during the past two fiscal years. “Audit services” refer to performing an audit of the registrant’s annual financial statements or services that are normally provided by the accountant in connection with statutory and regulatory filings or engagements for those fiscal years. “Audit-related services” refer to the assurance and related services by the principal accountant that are reasonably related to the performance of the audit. “Tax services” refer to professional services rendered by the principal accountant for tax compliance, tax advice, and tax planning. The following table details the aggregate fees billed or expected to be billed for each of the last two fiscal years for audit fees, audit-related fees, tax fees and other fees by the principal accountant.
| | | | | | | | |
| | | FYE 12/31/2021 | | | FYE 12/31/2020 | |
(a) Audit Fees | | $ | 39,700 | | | $ | 38,500 | |
(b) Audit-Related Fees | | | 0 | | | | 0 | |
(c) Tax Fees | | | 7,750 | | | | 7,525 | |
(d) All Other Fees | | | 0 | | | | 0 | |
(e)(1) The audit committee has adopted pre-approval policies and procedures that require the audit committee to pre-approve all audit and non-audit services of the registrant, including services provided to any entity affiliated with the registrant.
1
(e)(2) The percentage of fees billed by Deloitte & Touche LLP applicable to non-audit services pursuant to waiver of pre-approval requirement were as follows:
| | | | | | | | |
| | | FYE 12/31/2021 | | | FYE 12/31/2020 | |
Audit-Related Fees | | | 0 | % | | | 0 | % |
Tax Fees | | | 0 | % | | | 0 | % |
All Other Fees | | | 0 | % | | | 0 | % |
(f) All of the principal accountant’s hours spent on auditing the registrant’s financial statements were attributed to work performed by full-time permanent employees of the principal accountant.
(g) The following table indicates the non-audit fees billed or expected to be billed by the registrant’s accountant for services to the registrant and to the registrant’s investment adviser (and any other controlling entity, etc.—not sub-adviser) for the last two years.
| | | | | | | | |
Non-Audit Related Fees | | FYE 12/31/2021 | | | FYE 12/31/2020 | |
Registrant | | | 0 | | | | 0 | |
Registrant’s Investment Adviser | | | 0 | | | | 0 | |
(h) The audit committee of the board of trustees has considered whether the provision of non-audit services that were rendered to the registrant’s investment adviser is compatible with maintaining the principal accountant’s independence and has concluded that the provision of such non-audit services by the accountant has not compromised the accountant’s independence.
(i) Not applicable.
(j) Not applicable.
Item 5. Audit Committee of Listed Registrants.
Not applicable to registrants who are not listed issuers (as defined in Rule 10A-3 under the Securities Exchange Act of 1934).
Item 6. Investments.
| (a) | Schedule of Investments is included as part of the report to shareholders filed under Item 1 of this Form. |
Item 7. Disclosure of Proxy Voting Policies and Procedures for Closed-End Management Investment Companies.
Not applicable to open-end investment companies.
Item 8. Portfolio Managers of Closed-End Management Investment Companies.
Not applicable to open-end investment companies.
Item 9. Purchases of Equity Securities by Closed-End Management Investment Company and Affiliated Purchasers.
Not applicable to open-end investment companies.
2
Item 10. Submission of Matters to a Vote of Security Holders.
There have been no material changes to the procedures by which shareholders may recommend nominees to the registrant’s board of trustees.
Item 11. Controls and Procedures.
| (a) | The Registrant’s President and Treasurer have reviewed the Registrant’s disclosure controls and procedures (as defined in Rule 30a-3(c) under the Investment Company Act of 1940 (the “Act”)) as of a date within 90 days of the filing of this report, as required by Rule 30a-3(b) under the Act and Rules 13a-15(b) or 15d-15(b) under the Securities Exchange Act of 1934. Based on their review, such officers have concluded that the disclosure controls and procedures are effective in ensuring that information required to be disclosed in this report is appropriately recorded, processed, summarized and reported and made known to them by others within the Registrant and by the Registrant’s service provider. |
| (b) | There were no changes in the Registrant’s internal control over financial reporting (as defined in Rule 30a-3(d) under the Act) that occurred during the last half-year of the period covered by this report that have materially affected, or are reasonably likely to materially affect, the Registrant’s internal control over financial reporting. |
Item 12. Disclosure of Securities Lending Activities for Closed-End Management Investment Companies
Not applicable to open-end investment companies.
Item 13. Exhibits.
(2) A separate certification for each principal executive officer and principal financial officer pursuant to Section 302 of the Sarbanes-Oxley Act of 2002. Filed herewith.
(3) Any written solicitation to purchase securities under Rule 23c-1 under the Act sent or given during the period covered by the report by or on behalf of the registrant to 10 or more persons. Not applicable to open-end investment companies.
(4) Change in the registrant’s independent public accountant. There was no change in the registrant’s independent public accountant for the period covered by this report.
3
SIGNATURES
Pursuant to the requirements of the Securities Exchange Act of 1934 and the Investment Company Act of 1940, the registrant has duly caused this report to be signed on its behalf by the undersigned, thereunto duly authorized.
| | | | |
| (Registrant) | | Trust for Professional Managers | | |
| | | | |
| By (Signature and Title)* | | /s/ John Buckel | | |
| | John Buckel, President | | |
Pursuant to the requirements of the Securities Exchange Act of 1934 and the Investment Company Act of 1940, this report has been signed below by the following persons on behalf of the registrant and in the capacities and on the dates indicated.
| | | | |
| By (Signature and Title)* | | /s/ John Buckel | | |
| | John Buckel, President | | |
| | | | |
| By (Signature and Title)* | | | | |
| | /s/ Jennifer Lima | | |
| | Jennifer Lima, Treasurer | | |
| * | Print the name and title of each signing officer under his or her signature. |