Annual Report
February 28, 2022
Bright Rock Mid Cap Growth Fund
Institutional Class Shares (BQMGX)
Bright Rock Quality Large Cap Fund
Institutional Class Shares (BQLCX)
Investment Adviser
Bright Rock Capital Management LLC
288 Union Street
Rockland, Massachusetts 02370
Phone: 1-866-273-7223
TABLE OF CONTENTS
| LETTER TO SHAREHOLDERS | | 3 |
| ALLOCATION OF PORTFOLIO HOLDINGS | | 6 |
| EXPENSE EXAMPLES | | 7 |
| INVESTMENT HIGHLIGHTS | | 9 |
| SCHEDULES OF INVESTMENTS | | 11 |
| STATEMENTS OF ASSETS AND LIABILITIES | | 17 |
| STATEMENTS OF OPERATIONS | | 18 |
| STATEMENTS OF CHANGES IN NET ASSETS | | 19 |
| FINANCIAL HIGHLIGHTS | | 21 |
| NOTES TO FINANCIAL STATEMENTS | | 23 |
| REPORT OF INDEPENDENT REGISTERED | | |
| PUBLIC ACCOUNTING FIRM | | 33 |
| NOTICE OF PRIVACY POLICY & PRACTICES | | 34 |
| ADDITIONAL INFORMATION | | 35 |
Dear Shareholder:
U.S. Economic and Equity Market Overview
The period from March 1, 2021 to February 28, 2022 saw the U.S. equity market continue to appreciate extending gains from the prior year. The S&P 500 Total Return Index finished up in the last three calendar quarters of 2021, as successful rollout of COVID-19 vaccines eased fears of a lockdown scenario in the wake of new variants. Lingering effects of unprecedented fiscal and monetary stimulus, healthy consumer balance sheets, and tightening labor markets also created optimism about U.S. economic growth and helped propel stock market returns. However, in the first calendar quarter of 2022, continued inflation, central bank tapering, and the Russian invasion of Ukraine began to unnerve investors erasing some gains from the prior year.
US Real GDP increased 5.3% in the last three calendar quarters of 2021 (6.7%, 2.3%, and 6.9%, respectively). It is estimated that Q1 2022 will show moderation in GDP growth to 2% year-over-year. A big surprise to end 2021 was the continued spike in inflation as economies reopened with year-over-year CPI increasing the most since 1982 (+7%) in December. This trend has continued in early 2022, and is expected to peak by the end of the first calendar quarter as supply chain issues from uneven reopenings and inventory hoarding are slowly resolved. Rising wages and tight labor supply play a major role in the inflation story as workers that were slower to return began reentering the workforce which should help moderate wage growth. Unemployment continued to improve closer to pre-pandemic levels from 5.2% last August 2021 to 3.8% as of February 2022.
The Russian invasion of Ukraine created more near term risks to markets further exacerbating high energy and food prices, along with more supply chain disruptions. Diplomatic efforts to discuss a ceasefire have begun with no concrete answers yet. Still optimism remains that a deal can be made to stop the devastating humanitarian crisis in Europe.
Rapid labor recovery, broad inflation pressures, and geopolitical risks forced the Fed to pivot monetary policy faster than anticipated with their first rate hike of 25 bps occurring March 23, 2022. Six more rate hikes are expected this year to arrive at a more neutral setting around 2.25%. There are no shortages of risk in the economy and markets today, but for now strong household and corporate balance sheets keep the economy on solid ground.
Bright Rock Fund Overviews
Quality Large Cap Fund:
For the twelve-month period ended February 28, 2022, the Institutional Class shares of the Fund returned 15.35%, lagging the 16.39% return of the S&P 500 Total Return Index over the same period. Our overweight to Energy and Financials, and our underweight to Consumer Discretionary, which were mostly offset by our underweight to Technology and Real Estate, explains the majority of the relative underperformance between the Institutional Class shares of the Fund and the Index returns.
All eleven sectors in the S&P 500 Total Return Index produced positive returns over the past year. The Energy (+55.00%), Real Estate (+24.61%), and Consumer Staples (+23.37%) sectors led the way while Communications Services (+1.20%), and Consumer Discretionary (+8.48%) sectors were laggards. In terms of specific stocks held within the Fund, notable outperformers were EOG (+88.67%), American Express (+45.33%), United Health Group (+45.19%), and O’Reilly Automotive (+45.14%), while notable underperformers included Intel (-19.36%), Meta (-18.08%), and Ecolab (-15.05%).
Mid Cap Growth Fund:
For the twelve-month period ended February 28, 2022, the Institutional Class shares of the Fund returned 10.52%, outperforming the -4.32% return of the Russell Mid Cap Growth Total Return Index over the same period. Our bias toward more equal sector weighting explains the majority of the relative outperformance between the Institutional Class shares of the Fund and the Index returns.
The Fund’s overweight to the Energy and Financials sectors, and underweight to the Consumer Discretionary sector added value which more than offset our overweight to the Consumer Staples sector and underweight to the Producer Durables sector, which detracted from performance over the period. From a stock selection standpoint, we picked stocks well in the Healthcare, Consumer Discretionary, and Producer Durables sectors, and struggled in the Technology sector. Notable outperformers were Arista Networks (+75.43%), Cactus (+60.58%), ONEOK (+57.40%), and Brown and Brown (+48.25%), while notable underperformers included Zillow (-66.28%) and EPAM (-44.39%).
Thank you for your business and the confidence you have placed in us. We wish you a wonderful remainder of 2022.
Sincerely,
 |  |
| David B. Smith, CFA | Doug Butler |
| Chief Investment Officer | Director of Research |
| Bright Rock Capital Management | Bright Rock Capital Management |
Past performance is not a guarantee of future results.
GDP, or Gross Domestic Product, is the total monetary or market value of all the finished goods and services produced within a country’s borders in a specific time period.
CPI, the Consumer Price Index, is an inflation metric that measures prices across a basket of consumer goods and services purchased by households.
BPs, or Basis Points, is a common unit of measure for interest rates and other percentages in finance. It is equivalent to one hundredth of one percent (1/100).
The S&P 500® Total Return Index is a cap weighted index of large-cap U.S. equities. The index includes 500 leading companies and captures approximately 80% coverage of available market capitalization.
Russell Midcap Growth Total Return Index is an unmanaged index that measures the performance of those Russell Midcap companies with higher price-to-book ratios and higher forecasted growth values.
One cannot invest directly in an index.
Opinions expressed are those of Bright Rock Capital Management, LLC and are subject to change, are not guaranteed and should not be considered investment advice.
Mutual fund investing involves risk. Principal loss is possible. Investments in mid cap companies can involve additional risks such as limited liquidity and greater volatility. Investments in foreign securities can exhibit greater volatility. Additional risks include political, economic, and currency risks as well as differences in accounting methods. These risks can be greater for investments in emerging markets. The Funds will bear their share of the fees and expenses of investments in underlying funds or exchange-traded funds (“ETFs”). Shareholders will pay higher expenses than would be the case if making direct investments in underlying funds or ETFs. Because the Funds invest in ETFs, they are subject to additional risks that do not apply to conventional mutual funds, including the risks that the market price of an ETF’s shares may trade at a discount to its net asset value (“NAV”), an active secondary trading market may not develop or be maintained, or trading may be halted by the exchange on which they trade, which may impact a Fund’s ability to sell ETF shares. Derivatives, such as options and futures, involve risks different, and in certain cases, greater than the risks presented by more traditional investments. Short selling of securities may result in a Fund’s investment performance suffering if it is required to close out a short position earlier than it had intended. The prices of growth stocks may be more sensitive to changes in current or expected earnings than the prices of other stocks. Value stocks may perform differently from the market as a whole and may continue to be undervalued by the market for long periods of time.
Fund holdings and sector allocations are subject to change and should not be considered a recommendation to buy or sell any security. For a complete list of Fund holdings, please refer to the Schedule of Investments included in this report.
Must be preceded or accompanied by a prospectus.
The Bright Rock Funds are distributed by Quasar Distributors, LLC.
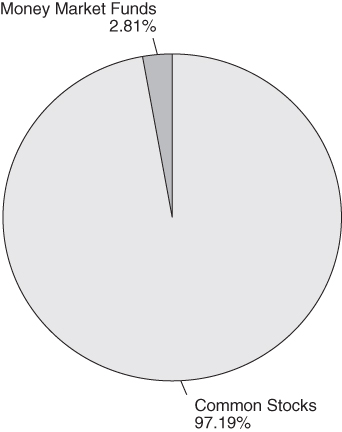
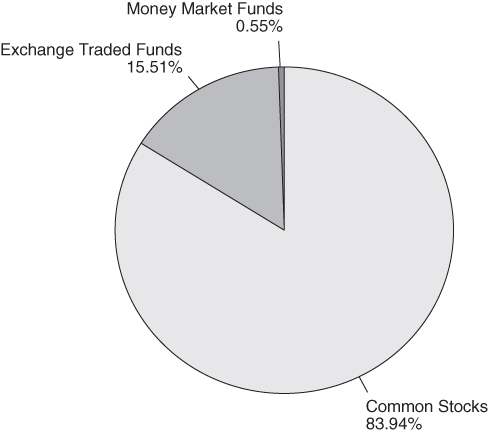
Bright Rock Funds
Allocation of Portfolio Holdings as of February 28, 2022
Bright Rock Mid Cap Growth Fund
(% of Investments)
Bright Rock Quality Large Cap Fund
(% of Investments)
Bright Rock Funds
Expense Examples (Unaudited)
As a shareholder of the Funds, you incur two types of costs: (1) transaction costs and (2) ongoing costs, including management fees and other Fund expenses. This Example is intended to help you understand your ongoing costs (in dollars) of investing in the Funds, and to compare these costs with the ongoing costs of investing in other mutual funds. The Example is based on an investment of $1,000 invested at the beginning of the period and held for the entire period (September 1, 2021 – February 28, 2022).
Actual Expenses
The first line of each of the following tables provides information about actual account values and actual expenses. Although the Funds charge no sales load, you will be assessed fees for outgoing wire transfers, returned checks and stop payment orders at prevailing rates charged by U.S. Bancorp Fund Services, LLC, the Funds’ transfer agent. If you request that a redemption be made by wire transfer, currently a $15.00 fee is charged by the Funds’ transfer agent. IRA accounts will be charged a $15.00 annual maintenance fee. To the extent the Funds invest in shares of ETFs or other investment companies as part of their investment strategies, you will indirectly bear your proportionate share of any fees and expenses charged by the underlying funds in which the Funds invest in addition to the expenses of the Funds. Actual expenses of the underlying funds are expected to vary among the various underlying funds. These expenses are not included in the Example. The Example includes, but is not limited to, management fees, fund administration and accounting, custody and transfer agent fees. You may use the information in the first line, together with the amount you invested, to estimate the expenses that you paid over the period. Simply divide your account value by $1,000 (for example, an $8,600 account value divided by $1,000 = 8.6), then multiply the result by the number in the first line under the heading entitled “Expenses Paid During Period” to estimate the expenses you paid on your account during this period.
Hypothetical Example for Comparison Purposes
The second line of each of the following tables provides information about hypothetical account values and hypothetical expenses based on the Funds’ actual expense ratios and an assumed rate of return of 5% per year before expenses, which are not the Funds’ actual returns. The hypothetical account values and expenses may not be used to estimate the actual ending account balance or expenses you paid for the period. You may use this information to compare the ongoing costs of investing in the Funds and other funds. To do so, compare this 5% hypothetical example with the 5% hypothetical examples that appear in the shareholder reports of other funds. Please note that the expenses shown in the tables are meant to highlight your ongoing costs only and do not reflect any transactional costs, such as sales charges (loads), redemption fees or exchange fees. Therefore, the second line of the table is useful in comparing ongoing costs only, and will
Bright Rock Funds
Expense Examples (Unaudited) (Continued)
not help you determine the relative total costs of owning different funds. In addition, if these transactional costs were included, your costs would have been higher.
| | Mid Cap Growth Fund – Institutional Class |
| | | | Expenses Paid |
| | Beginning | Ending | During Period |
| | Account Value | Account Value | September 1, 2021 – |
| | September 1, 2021 | February 28, 2022 | February 28, 2022* |
| Actual | $1,000.00 | $ 945.40 | $5.16 |
| Hypothetical (5% return | | | |
| before expenses) | $1,000.00 | $1,019.49 | $5.36 |
| * | Expenses are equal to the Institutional Class’ annualized expense ratio of 1.07%, multiplied by the average account value over the period, multiplied by 181/365 to reflect the one-half year period. |
| | Quality Large Cap Fund – Institutional Class |
| | | | Expenses Paid |
| | Beginning | Ending | During Period |
| | Account Value | Account Value | September 1, 2021 – |
| | September 1, 2021 | February 28, 2022 | February 28, 2022* |
| Actual | $1,000.00 | $ 973.30 | $4.01 |
| Hypothetical (5% return | | | |
| before expenses) | $1,000.00 | $1,020.73 | $4.11 |
| * | Expenses are equal to the Institutional Class’ annualized expense ratio of 0.82%, multiplied by the average account value over the period, multiplied by 181/365 to reflect the one-half year period. |
Bright Rock Mid Cap Growth Fund
Investment Highlights (Unaudited)
Average Annual Returns – For Periods Ended February 28, 2022
| | One | Three | Five | Ten |
| | Year | Years | Years | Years |
| Bright Rock Mid Cap Growth Fund | | | | |
| Institutional Class | 10.52% | 15.54% | 13.24% | 11.19% |
Russell Midcap® Growth Total Return Index | -4.32% | 14.71% | 14.86% | 13.59% |
Performance data quoted represents past performance and does not guarantee future results. The investment return and principal value of an investment will fluctuate so that an investor’s shares, when redeemed, may be worth more or less than their original cost. Current performance of the Fund may be lower or higher than the performance quoted. Performance data current to the most recent month end may be obtained by calling 1-866-273-7223.
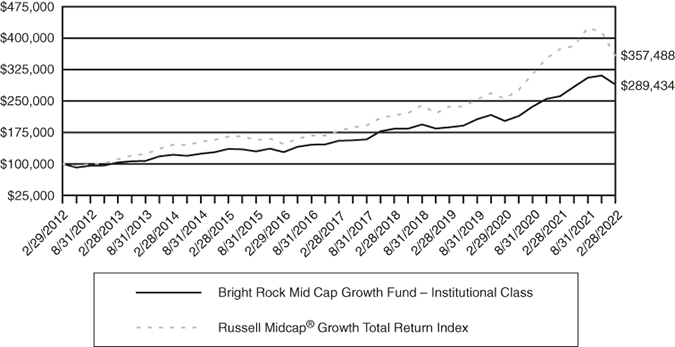
Per the Prospectus dated June 28, 2021, the Fund’s gross expense ratio is 1.11% for Institutional Class shares. Please see the Financial Highlights in this report for the most recent expense ratios. The returns shown in the table and graph assume reinvestment of Fund distributions and do not reflect the deduction of taxes that a shareholder would pay on Fund distributions or the redemption of Fund shares. The graph illustrates performance of a hypothetical investment made in the Fund and a broad-based securities index ten years ago. The graph does not reflect any future performance.
The Russell Midcap® Growth Total Return Index measures the performance of the mid-cap growth segment of the U.S. equity universe. One cannot invest directly in an index.
Bright Rock Mid Cap Growth Fund – Institutional Class
Growth of $100,000 Investment
Bright Rock Quality Large Cap Fund
Investment Highlights (Unaudited)
Average Annual Returns – For Periods Ended February 28, 2022
| | One | Three | Five | Ten |
| | Year | Years | Years | Years |
| Bright Rock Quality Large Cap Fund | | | | |
| Institutional Class | 15.35% | 15.09% | 12.08% | 11.83% |
S&P 500® Total Return Index | 16.39% | 18.24% | 15.17% | 14.59% |
Performance data quoted represents past performance and does not guarantee future results. The investment return and principal value of an investment will fluctuate so that an investor’s shares, when redeemed, may be worth more or less than their original cost. Current performance of the Fund may be lower or higher than the performance quoted. Performance data current to the most recent month end may be obtained by calling 1-866-273-7223.
Per the Prospectus dated June 28, 2021, the Fund’s gross expense ratio is 0.88% for Institutional Class shares. Please see the Financial Highlights in this report for the most recent expense ratios. The returns shown in the table and graph assume reinvestment of Fund distributions and do not reflect the deduction of taxes that a shareholder would pay on Fund distributions or the redemption of Fund shares. The graph illustrates performance of a hypothetical investment made in the Fund and a broad-based securities index ten years ago. The graph does not reflect any future performance.
The S&P 500® Total Return Index is a broad-based unmanaged index of 500 stocks, which is widely recognized as representative of the equity market in general. One cannot invest directly in an index.
Bright Rock Quality Large Cap Fund – Institutional Class
Growth of $100,000 Investment
Bright Rock Mid Cap Growth Fund
Schedule of Investments
February 28, 2022
| | | Shares | | | Value | |
| COMMON STOCKS – 98.22% | | | | | | |
| | | | | | | |
| Auto Components – 2.01% | | | | | | |
| Gentex Corp. | | | 60,000 | | | $ | 1,816,200 | |
| | | | | | | | | |
| Beverages – 4.60% | | | | | | | | |
| Brown-Forman Corp. – Class B | | | 29,500 | | | | 1,924,285 | |
| Monster Beverage Corp. (a) | | | 26,500 | | | | 2,236,600 | |
| | | | | | | | 4,160,885 | |
| Building Products – 1.02% | | | | | | | | |
| Trex Co., Inc. (a) | | | 10,000 | | | | 918,400 | |
| | | | | | | | | |
| Capital Markets – 7.59% | | | | | | | | |
| FactSet Research Systems, Inc. | | | 6,000 | | | | 2,436,540 | |
| Morningstar, Inc. | | | 10,000 | | | | 2,806,500 | |
| SEI Investments Co. | | | 27,600 | | | | 1,616,808 | |
| | | | | | | | 6,859,848 | |
| Chemicals – 1.84% | | | | | | | | |
| International Flavors & Fragrances, Inc. | | | 12,500 | | | | 1,662,500 | |
| | | | | | | | | |
| Commercial Services & Supplies – 7.39% | | | | | | | | |
| Copart, Inc. (a) | | | 41,000 | | | | 5,038,080 | |
| Rollins, Inc. | | | 50,250 | | | | 1,639,657 | |
| | | | | | | | 6,677,737 | |
| Communications Equipment – 2.04% | | | | | | | | |
| Arista Networks, Inc. (a) | | | 15,000 | | | | 1,840,950 | |
| | | | | | | | | |
| Containers & Packaging – 1.01% | | | | | | | | |
| AptarGroup, Inc. | | | 7,500 | | | | 914,100 | |
| | | | | | | | | |
| Electrical Equipment – 2.87% | | | | | | | | |
| AMETEK, Inc. | | | 20,000 | | | | 2,595,800 | |
| | | | | | | | | |
| Electronic Equipment, Instruments & Components – 6.30% | | | | | | | | |
| Amphenol Corp. – Class A | | | 34,000 | | | | 2,584,340 | |
| Cognex Corp. | | | 20,000 | | | | 1,351,200 | |
| IPG Photonics Corp. (a) | | | 13,500 | | | | 1,759,725 | |
| | | | | | | | 5,695,265 | |
The accompanying notes are an integral part of these financial statements.
Bright Rock Mid Cap Growth Fund
Schedule of Investments (Continued)
February 28, 2022
| | | Shares | | | Value | |
| Energy Equipment & Services – 1.12% | | | | | | |
| Cactus, Inc. | | | 20,000 | | | $ | 1,013,200 | |
| | | | | | | | | |
| Food Products – 4.47% | | | | | | | | |
| The Hershey Co. | | | 20,000 | | | | 4,045,200 | |
| | | | | | | | | |
| Health Care Equipment & Supplies – 11.46% | | | | | | | | |
| Edwards Lifesciences Corp. (a) | | | 25,000 | | | | 2,809,250 | |
| IDEXX Laboratories, Inc. (a) | | | 7,000 | | | | 3,726,450 | |
| ResMed, Inc. | | | 15,500 | | | | 3,824,625 | |
| | | | | | | | 10,360,325 | |
| Hotels, Restaurants & Leisure – 2.03% | | | | | | | | |
| Yum! Brands, Inc. | | | 15,000 | | | | 1,838,700 | |
| | | | | | | | | |
| Insurance – 2.24% | | | | | | | | |
| Brown & Brown, Inc. | | | 30,000 | | | | 2,028,300 | |
| | | | | | | | | |
| IT Services – 5.90% | | | | | | | | |
| EPAM Systems, Inc. (a) | | | 9,000 | | | | 1,869,750 | |
| Jack Henry & Associates, Inc. | | | 19,600 | | | | 3,465,280 | |
| | | | | | | | 5,335,030 | |
| Life Sciences Tools & Services – 2.14% | | | | | | | | |
| West Pharmaceutical Services, Inc. | | | 5,000 | | | | 1,935,400 | |
| | | | | | | | | |
| Multiline Retail – 1.10% | | | | | | | | |
| Dollar General Corp. | | | 5,000 | | | | 991,700 | |
| | | | | | | | | |
| Oil, Gas & Consumable Fuels – 5.41% | | | | | | | | |
| ONEOK, Inc. | | | 74,850 | | | | 4,887,705 | |
| | | | | | | | | |
| Real Estate Management & Development – 2.38% | | | | | | | | |
| Zillow Group, Inc. (a) | | | 37,500 | | | | 2,147,625 | |
| | | | | | | | | |
| Road & Rail – 2.36% | | | | | | | | |
| JB Hunt Transport Services, Inc. | | | 10,500 | | | | 2,130,765 | |
| | | | | | | | | |
| Semiconductors & Semiconductor Equipment – 5.27% | | | | | | | | |
| Analog Devices, Inc. | | | 15,800 | | | | 2,532,582 | |
| SolarEdge Technologies, Inc. (a) | | | 7,000 | | | | 2,235,940 | |
| | | | | | | | 4,768,522 | |
The accompanying notes are an integral part of these financial statements.
Bright Rock Mid Cap Growth Fund
Schedule of Investments (Continued)
February 28, 2022
| | | Shares | | | Value | |
| Software – 5.11% | | | | | | |
| ANSYS, Inc. (a) | | | 6,000 | | | $ | 1,945,140 | |
| Tyler Technologies, Inc. (a) | | | 6,250 | | | | 2,676,625 | |
| | | | | | | | 4,621,765 | |
| Specialty Retail – 7.67% | | | | | | | | |
| Floor & Decor Holdings, Inc. (a) | | | 31,000 | | | | 2,964,220 | |
| Tractor Supply Co. | | | 19,500 | | | | 3,973,905 | |
| | | | | | | | 6,938,125 | |
| Trading Companies & Distributors – 2.89% | | | | | | | | |
| Fastenal Co. | | | 50,800 | | | | 2,614,168 | |
| TOTAL COMMON STOCKS (Cost $44,353,846) | | | | | | | 88,798,215 | |
| | | | | | | | | |
| MONEY MARKET FUNDS – 2.84% | | | | | | | | |
| Morgan Stanley Institutional Liquidity Funds – | | | | | | | | |
| Government Portfolio, Institutional Class, 0.026% (b) | | | 2,566,347 | | | | 2,566,347 | |
| TOTAL MONEY MARKET FUNDS (Cost $2,566,347) | | | | | | | 2,566,347 | |
| Total Investments (Cost $46,920,193) – 101.06% | | | | | | | 91,364,562 | |
| Liabilities in Excess of Other Assets – (1.06%) | | | | | | | (959,741 | ) |
| TOTAL NET ASSETS – 100.00% | | | | | | $ | 90,404,821 | |
| (a) | Non-income producing security. |
| (b) | Seven day yield as of February 28, 2022. |
The Schedule of Investments incorporates the Global Industry Classification Standard (GICS®). GICS was developed by and/or is the exclusive property of MSCI, Inc. and Standard & Poor’s Financial Services LLC (“S&P”). GICS is a service mark of MSCI and S&P and has been licensed for use by U.S. Bancorp Fund Services, LLC.
The accompanying notes are an integral part of these financial statements.
Bright Rock Quality Large Cap Fund
Schedule of Investments
February 28, 2022
| | | Shares | | | Value | |
| COMMON STOCKS – 83.82% | | | | | | |
| | | | | | | |
| Banks – 2.65% | | | | | | |
| JPMorgan Chase & Co. | | | 60,000 | | | $ | 8,508,000 | |
| | | | | | | | | |
| Beverages – 3.07% | | | | | | | | |
| PepsiCo, Inc. | | | 60,000 | | | | 9,824,400 | |
| | | | | | | | | |
| Capital Markets – 4.14% | | | | | | | | |
| BlackRock, Inc. | | | 8,500 | | | | 6,323,065 | |
| T. Price Rowe Group, Inc. | | | 48,000 | | | | 6,938,880 | |
| | | | | | | | 13,261,945 | |
| Chemicals – 4.95% | | | | | | | | |
| Ecolab, Inc. | | | 28,500 | | | | 5,023,410 | |
| Linde PLC (a) | | | 37,000 | | | | 10,849,880 | |
| | | | | | | | 15,873,290 | |
| Commercial Services & Supplies – 2.03% | | | | | | | | |
| Copart, Inc. (b) | | | 53,000 | | | | 6,512,640 | |
| | | | | | | | | |
| Consumer Finance – 2.12% | | | | | | | | |
| American Express Co. | | | 35,000 | | | | 6,808,900 | |
| | | | | | | | | |
| Diversified Financial Services – 3.01% | | | | | | | | |
| Berkshire Hathaway, Inc. (b) | | | 30,000 | | | | 9,643,500 | |
| | | | | | | | | |
| Diversified Telecommunication Services – 1.66% | | | | | | | | |
| Verizon Communications, Inc. | | | 99,000 | | | | 5,313,330 | |
| | | | | | | | | |
| Electric Utilities – 2.93% | | | | | | | | |
| NextEra Energy, Inc. | | | 120,000 | | | | 9,392,400 | |
| | | | | | | | | |
| Food & Staples Retailing – 2.24% | | | | | | | | |
| Walmart, Inc. | | | 53,000 | | | | 7,163,480 | |
| | | | | | | | | |
| Food Products – 1.31% | | | | | | | | |
| McCormick & Co., Inc. | | | 44,000 | | | | 4,187,480 | |
| | | | | | | | | |
| Health Care Providers & Services – 4.15% | | | | | | | | |
| UnitedHealth Group, Inc. | | | 27,938 | | | | 13,294,856 | |
| | | | | | | | | |
| Household Products – 1.78% | | | | | | | | |
| Colgate-Palmolive Co. | | | 74,000 | | | | 5,694,300 | |
| | | | | | | | | |
| Industrial Conglomerates – 1.76% | | | | | | | | |
| 3M Co. | | | 38,000 | | | | 5,648,700 | |
The accompanying notes are an integral part of these financial statements.
Bright Rock Quality Large Cap Fund
Schedule of Investments (Continued)
February 28, 2022
| | | Shares | | | Value | |
| Insurance – 1.59% | | | | | | |
| Chubb Ltd. (a) | | | 25,000 | | | $ | 5,091,000 | |
| | | | | | | | | |
| Interactive Media & Services – 7.94% | | | | | | | | |
| Alphabet, Inc. – Class A (b) | | | 5,900 | | | | 15,936,726 | |
| Meta Platforms, Inc. (b) | | | 45,000 | | | | 9,496,350 | |
| | | | | | | | 25,433,076 | |
| IT Services – 8.35% | | | | | | | | |
| Automatic Data Processing, Inc. | | | 33,000 | | | | 6,746,520 | |
| Broadridge Financial Solutions, Inc. | | | 24,000 | | | | 3,509,040 | |
| Mastercard, Inc. – Class A | | | 20,000 | | | | 7,216,400 | |
| Visa, Inc. | | | 43,000 | | | | 9,293,160 | |
| | | | | | | | 26,765,120 | |
| Life Sciences Tools & Services – 1.61% | | | | | | | | |
| Thermo Fisher Scientific, Inc. | | | 9,500 | | | | 5,168,000 | |
| | | | | | | | | |
| Multi-Utilities – 2.47% | | | | | | | | |
| Sempra Energy | | | 55,000 | | | | 7,932,100 | |
| | | | | | | | | |
| Oil, Gas & Consumable Fuels – 0.72% | | | | | | | | |
| EOG Resources, Inc. | | | 20,000 | | | | 2,298,400 | |
| | | | | | | | | |
| Pharmaceuticals – 5.73% | | | | | | | | |
| Johnson & Johnson | | | 59,500 | | | | 9,791,915 | |
| Merck & Co, Inc. | | | 112,000 | | | | 8,576,960 | |
| | | | | | | | 18,368,875 | |
| Road & Rail – 2.57% | | | | | | | | |
| Union Pacific Corp. | | | 33,500 | | | | 8,239,325 | |
| | | | | | | | | |
| Semiconductors & Semiconductor Equipment – 0.74% | | | | | | | | |
| Intel Corp. | | | 50,000 | | | | 2,385,000 | |
| | | | | | | | | |
| Software – 5.41% | | | | | | | | |
| Microsoft Corp. | | | 58,000 | | | | 17,329,820 | |
| | | | | | | | | |
| Specialty Retail – 7.86% | | | | | | | | |
| O’Reilly Automotive, Inc. (b) | | | 15,500 | | | | 10,063,220 | |
| The Home Depot, Inc. | | | 30,000 | | | | 9,474,900 | |
| The TJX Companies, Inc. | | | 85,547 | | | | 5,654,657 | |
| | | | | | | | 25,192,777 | |
The accompanying notes are an integral part of these financial statements.
Bright Rock Quality Large Cap Fund
Schedule of Investments (Continued)
February 28, 2022
| | | Shares | | | Value | |
| Technology Hardware, Storage & Peripherals – 1.03% | | | | | | |
| Apple, Inc. | | | 20,000 | | | $ | 3,302,400 | |
| TOTAL COMMON STOCKS (Cost $170,814,809) | | | | | | | 268,633,114 | |
| | | | | | | | | |
| EXCHANGE TRADED FUNDS – 15.49% | | | | | | | | |
| Health Care Select Sector SPDR Fund | | | 66,000 | | | | 8,577,360 | |
| Invesco KBW Bank ETF | | | 165,000 | | | | 11,391,600 | |
| iShares U.S. Energy ETF | | | 300,000 | | | | 11,277,000 | |
| Technology Select Sector SPDR Fund | | | 55,000 | | | | 8,473,850 | |
| VanEck Oil Services ETF | | | 40,000 | | | | 9,926,000 | |
| TOTAL EXCHANGE TRADED FUNDS (Cost $27,905,941) | | | | | | | 49,645,810 | |
| | | | | | | | | |
| MONEY MARKET FUNDS – 0.55% | | | | | | | | |
| Morgan Stanley Institutional Liquidity Funds – | | | | | | | | |
| Government Portfolio, Institutional Class, 0.026% (c) | | | 1,762,901 | | | | 1,762,901 | |
| TOTAL MONEY MARKET FUNDS (Cost $1,762,901) | | | | | | | 1,762,901 | |
| Total Investments (Cost $200,483,651) – 99.86% | | | | | | | 320,041,825 | |
| Other Assets in Excess of Liabilities – 0.14% | | | | | | | 448,900 | |
| TOTAL NET ASSETS – 100.00% | | | | | | $ | 320,490,725 | |
| (a) | Foreign issued security. |
| (b) | Non-income producing security. |
| (c) | Seven day yield as of February 28, 2022. |
Abbreviations:
PLC Public Limited Company.
The Schedule of Investments incorporates the Global Industry Classification Standard (GICS®). GICS was developed by and/or is the exclusive property of MSCI, Inc. and Standard & Poor’s Financial Services LLC (“S&P”). GICS is a service mark of MSCI and S&P and has been licensed for use by U.S. Bancorp Fund Services, LLC.
The accompanying notes are an integral part of these financial statements.
Bright Rock Funds
Statements of Assets and Liabilities
February 28, 2022
| | | Mid Cap | | | Quality Large | |
| | | Growth Fund | | | Cap Fund | |
| ASSETS | | | | | | |
| Investments, at value: | | | | | | |
| (Cost $46,920,193 and $200,483,651) | | $ | 91,364,562 | | | $ | 320,041,825 | |
| Receivable for Fund shares sold | | | 139,942 | | | | 634,605 | |
| Dividends and interest receivable | | | 91,000 | | | | 284,597 | |
| Other assets | | | 3,921 | | | | 7,827 | |
| TOTAL ASSETS | | | 91,599,425 | | | | 320,968,854 | |
| | | | | | | | | |
| LIABILITIES | | | | | | | | |
| Payable for Fund shares redeemed | | | 13,682 | | | | 115,129 | |
| Payable for investments purchased | | | 1,027,412 | | | | — | |
| Payable to affiliates | | | 66,792 | | | | 166,215 | |
| Payable to Adviser | | | 51,373 | | | | 161,297 | |
| Payable to auditor | | | 32,600 | | | | 32,517 | |
| Accrued expenses and other liabilities | | | 2,745 | | | | 2,971 | |
| TOTAL LIABILITIES | | | 1,194,604 | | | | 478,129 | |
| NET ASSETS | | $ | 90,404,821 | | | $ | 320,490,725 | |
| | | | | | | | | |
| Net assets consist of: | | | | | | | | |
| Paid-in capital | | $ | 41,148,334 | | | $ | 184,162,787 | |
| Total distributable earnings | | | 49,256,487 | | | | 136,327,938 | |
| NET ASSETS | | $ | 90,404,821 | | | $ | 320,490,725 | |
| | | | | | | | | |
| INSTITUTIONAL CLASS SHARES | | | | | | | | |
| Net assets | | $ | 90,404,821 | | | $ | 320,490,725 | |
| Shares of beneficial interest outstanding (unlimited | | | | | | | | |
| number of shares authorized, $0.001 par value) | | | 3,871,211 | | | | 15,201,437 | |
| Net asset value, redemption price | | | | | | | | |
| and offering price per share | | $ | 23.35 | | | $ | 21.08 | |
The accompanying notes are an integral part of these financial statements.
Bright Rock Funds
Statements of Operations
For the Year Ended February 28, 2022
| | | Mid Cap | | | Quality Large | |
| | | Growth Fund | | | Cap Fund | |
| INVESTMENT INCOME | | | | | | |
| Dividend income | | $ | 728,642 | | | $ | 5,562,362 | |
| Interest income | | | 625 | | | | 893 | |
| TOTAL INVESTMENT INCOME | | | 729,267 | | | | 5,563,255 | |
| | | | | | | | | |
| EXPENSES | | | | | | | | |
| Management fees | | | 693,564 | | | | 2,125,054 | |
| Administration fees | | | 106,280 | | | | 294,263 | |
| Fund accounting fees | | | 43,072 | | | | 117,779 | |
| Audit and tax fees | | | 32,664 | | | | 33,124 | |
| Transfer agent fees and expenses | | | 26,078 | | | | 39,057 | |
| Federal and state registration fees | | | 21,696 | | | | 24,086 | |
| Legal fees | | | 13,139 | | | | 18,687 | |
| Reports to shareholders | | | 12,591 | | | | 6,899 | |
| Chief Compliance Officer fees | | | 12,512 | | | | 12,512 | |
| Custody fees | | | 9,995 | | | | 34,391 | |
| Trustees’ fees | | | 7,851 | | | | 7,851 | |
| Insurance expense | | | 5,347 | | | | 3,630 | |
| Interest expenses | | | 141 | | | | 545 | |
| Other expenses | | | 1,893 | | | | 3,086 | |
| TOTAL EXPENSES | | | 986,823 | | | | 2,720,964 | |
| NET INVESTMENT INCOME (LOSS) | | | (257,556 | ) | | | 2,842,291 | |
| | | | | | | | | |
| REALIZED AND UNREALIZED | | | | | | | | |
| GAIN (LOSS) ON INVESTMENTS | | | | | | | | |
| Net realized gain on investments | | | 10,168,052 | | | | 40,051,726 | |
| Net change in unrealized appreciation | | | | | | | | |
| (depreciation) on investments | | | (1,044,333 | ) | | | 1,727,748 | |
| NET REALIZED AND UNREALIZED | | | | | | | | |
| GAIN ON INVESTMENTS | | | 9,123,719 | | | | 41,779,474 | |
| NET INCREASE IN NET ASSETS | | | | | | | | |
| FROM OPERATIONS | | $ | 8,866,163 | | | $ | 44,621,765 | |
The accompanying notes are an integral part of these financial statements.
Bright Rock Mid Cap Growth Fund
Statements of Changes in Net Assets
| | | Year Ended | | | Year Ended | |
| | | February 28, 2022 | | | February 28, 2021 | |
| FROM OPERATIONS | | | | | | |
| Net investment loss | | $ | (257,556 | ) | | $ | (236,206 | ) |
| Net realized gain on investments | | | 10,168,052 | | | | 3,640,248 | |
| Net change in unrealized appreciation | | | | | | | | |
| (depreciation) on investments | | | (1,044,333 | ) | | | 17,326,419 | |
| Net increase in net assets from operations | | | 8,866,163 | | | | 20,730,461 | |
| | | | | | | | | |
| FROM DISTRIBUTIONS | | | | | | | | |
| Net dividends and distributions – | | | | | | | | |
| Institutional Class | | | (7,470,363 | ) | | | (4,232,779 | ) |
| Net decrease in net assets | | | | | | | | |
| resulting from distributions paid | | | (7,470,363 | ) | | | (4,232,779 | ) |
| | | | | | | | | |
| FROM CAPITAL SHARE TRANSACTIONS | | | | | | | | |
| Proceeds from shares sold – | | | | | | | | |
| Institutional Class | | | 11,337,101 | | | | 11,143,156 | |
| Payments for shares redeemed – | | | | | | | | |
| Institutional Class | | | (12,626,285 | ) | | | (16,128,613 | ) |
| Net asset value of shares issued in | | | | | | | | |
| reinvestment of distributions to | | | | | | | | |
| shareholders – Institutional Class | | | 7,435,720 | | | | 4,208,022 | |
| Net increase (decrease) in net assets | | | | | | | | |
| from capital share transactions | | | 6,146,536 | | | | (777,435 | ) |
| TOTAL INCREASE IN NET ASSETS | | | 7,542,336 | | | | 15,720,247 | |
| NET ASSETS | | | | | | | | |
| Beginning of Year | | | 82,862,485 | | | | 67,142,238 | |
| End of Year | | $ | 90,404,821 | | | $ | 82,862,485 | |
The accompanying notes are an integral part of these financial statements.
Bright Rock Quality Large Cap Fund
Statements of Changes in Net Assets
| | | Year Ended | | | Year Ended | |
| | | February 28, 2022 | | | February 28, 2021 | |
| FROM OPERATIONS | | | | | | |
| Net investment income | | $ | 2,842,291 | | | $ | 3,353,974 | |
| Net realized gain on investments | | | 40,051,726 | | | | 557,845 | |
| Net change in unrealized | | | | | | | | |
| appreciation on investments | | | 1,727,748 | | | | 58,033,136 | |
| Net increase in net assets from operations | | | 44,621,765 | | | | 61,944,955 | |
| | | | | | | | | |
| FROM DISTRIBUTIONS | | | | | | | | |
| Net dividends and distributions – | | | | | | | | |
| Institutional Class | | | (27,127,266 | ) | | | (9,860,591 | ) |
| Net decrease in net assets resulting | | | | | | | | |
| from distributions paid | | | (27,127,266 | ) | | | (9,860,591 | ) |
| | | | | | | | | |
| FROM CAPITAL SHARE TRANSACTIONS | | | | | | | | |
| Proceeds from shares sold – | | | | | | | | |
| Institutional Class | | | 41,775,958 | | | | 39,570,299 | |
| Payments for shares redeemed – | | | | | | | | |
| Institutional Class | | | (53,465,969 | ) | | | (45,091,817 | ) |
| Net asset value of shares issued in | | | | | | | | |
| reinvestment of distributions to | | | | | | | | |
| shareholders – Institutional Class | | | 23,893,278 | | | | 6,496,452 | |
| Net increase in net assets | | | | | | | | |
| from capital share transactions | | | 12,203,267 | | | | 974,934 | |
| TOTAL INCREASE IN NET ASSETS | | | 29,697,766 | | | | 53,059,298 | |
| NET ASSETS | | | | | | | | |
| Beginning of Year | | | 290,792,959 | | | | 237,733,661 | |
| End of Year | | $ | 320,490,725 | | | $ | 290,792,959 | |
The accompanying notes are an integral part of these financial statements.
Bright Rock Mid Cap Growth Fund – Institutional Class
Financial Highlights
Per Share Data for a Share Outstanding Throughout Each Year
| | | | | | | | | Year | | | | | | | |
| | | | | | | | | Ended | | | | | | | |
| | | Year Ended | | | February | | | Year Ended | |
| | | February 28, | | | 29, | | | February 28, | |
| | | 2022 | | | 2021 | | | 2020 | | | | 2019 | | | | 2018 | |
| Net Asset Value, Beginning of Year | | $ | 22.90 | | | $ | 18.67 | | | $ | 17.89 | | | $ | 17.56 | | | $ | 14.83 | |
| | | | | | | | | | | | | | | | | | | | | |
| Income (loss) from investment operations: | | | | | | | | | | | | | | | | | | | | |
Net investment income (loss)(1) | | | (0.07 | ) | | | (0.06 | ) | | | (0.07 | ) | | | 0.02 | | | | (0.01 | ) |
| Net realized and unrealized | | | | | | | | | | | | | | | | | | | | |
| gain on investments | | | 2.65 | | | | 5.52 | | | | 1.56 | | | | 0.31 | | | | 2.75 | |
| Total from investment operations | | | 2.58 | | | | 5.46 | | | | 1.49 | | | | 0.33 | | | | 2.74 | |
| | | | | | | | | | | | | | | | | | | | | |
| Less distributions paid: | | | | | | | | | | | | | | | | | | | | |
| From investment income | | | — | | | | — | | | | (0.02 | ) | | | — | | | | (0.01 | ) |
| From net realized gain on investments | | | (2.13 | ) | | | (1.23 | ) | | | (0.69 | ) | | | — | | | | — | |
| Total distributions paid | | | (2.13 | ) | | | (1.23 | ) | | | (0.71 | ) | | | — | | | | (0.01 | ) |
| Net Asset Value, End of Year | | $ | 23.35 | | | $ | 22.90 | | | $ | 18.67 | | | $ | 17.89 | | | $ | 17.56 | |
| Total Return | | | 10.52 | % | | | 29.12 | % | | | 8.07 | % | | | 1.88 | % | | | 18.50 | % |
| | | | | | | | | | | | | | | | | | | | | |
| Supplemental Data and Ratios: | | | | | | | | | | | | | | | | | | | | |
| Net Assets, end of year (000’s omitted) | | $ | 90,405 | | | $ | 82,862 | | | $ | 67,142 | | | $ | 63,918 | | | $ | 66,052 | |
| Ratio of expenses to average net assets | | | 1.07 | % | | | 1.11 | % | | | 1.14 | % | | | 1.18 | % | | | 1.21 | % |
| Ratio of net investment income | | | | | | | | | | | | | | | | | | | | |
| (loss) to average net assets | | | (0.28 | )% | | | (0.31 | )% | | | (0.34 | )% | | | 0.14 | % | | | (0.03 | )% |
| Portfolio turnover rate | | | 20.1 | % | | | 14.1 | % | | | 29.1 | % | | | 10.6 | % | | | 15.3 | % |
| (1) | Per share net investment income (loss) was calculated using average shares outstanding. |
The accompanying notes are an integral part of these financial statements.
Bright Rock Quality Large Cap Fund – Institutional Class
Financial Highlights
Per Share Data for a Share Outstanding Throughout Each Year
| | | | | | | | | Year | | | | | | | |
| | | | | | | | | Ended | | | | | | | |
| | | Year Ended | | | February | | | Year Ended | |
| | | February 28, | | | 29, | | | February 28, | |
| | | 2022 | | | 2021 | | | 2020 | | | | 2019 | | | | 2018 | |
| Net Asset Value, Beginning of Year | | $ | 19.87 | | | $ | 16.58 | | | $ | 16.42 | | | $ | 16.26 | | | $ | 15.26 | |
| | | | | | | | | | | | | | | | | | | | | |
| Income from investment operations: | | | | | | | | | | | | | | | | | | | | |
Net investment income(1) | | | 0.20 | | | | 0.22 | | | | 0.23 | | | | 0.25 | | | | 0.20 | |
| Net realized and unrealized | | | | | | | | | | | | | | | | | | | | |
| gain on investments | | | 2.94 | | | | 3.75 | | | | 0.87 | | | | 0.67 | | | | 1.25 | |
| Total from investment operations | | | 3.14 | | | | 3.97 | | | | 1.10 | | | | 0.92 | | | | 1.45 | |
| | | | | | | | | | | | | | | | | | | | | |
| Less distributions paid: | | | | | | | | | | | | | | | | | | | | |
| From investment income | | | (0.23 | ) | | | (0.23 | ) | | | (0.23 | ) | | | (0.25 | ) | | | (0.19 | ) |
| From net realized gain on investments | | | (1.70 | ) | | | (0.45 | ) | | | (0.71 | ) | | | (0.51 | ) | | | (0.26 | ) |
| Total distributions paid | | | (1.93 | ) | | | (0.68 | ) | | | (0.94 | ) | | | (0.76 | ) | | | (0.45 | ) |
| Net Asset Value, End of Year | | $ | 21.08 | | | $ | 19.87 | | | $ | 16.58 | | | $ | 16.42 | | | $ | 16.26 | |
| Total Return | | | 15.35 | % | | | 24.40 | % | | | 6.24 | % | | | 5.92 | % | | | 9.54 | % |
| | | | | | | | | | | | | | | | | | | | | |
| Supplemental Data and Ratios: | | | | | | | | | | | | | | | | | | | | |
| Net Assets, end of year (000’s omitted) | | $ | 320,491 | | | $ | 290,793 | | | $ | 237,734 | | | $ | 231,862 | | | $ | 232,472 | |
| Ratio of expenses to average net assets | | | 0.83 | % | | | 0.86 | % | | | 0.87 | % | | | 0.88 | % | | | 0.89 | % |
| Ratio of net investment income | | | | | | | | | | | | | | | | | | | | |
| to average net assets | | | 0.87 | % | | | 1.27 | % | | | 1.28 | % | | | 1.53 | % | | | 1.28 | % |
| Portfolio turnover rate | | | 30.4 | % | | | 30.7 | % | | | 28.3 | % | | | 42.6 | % | | | 30.9 | % |
| (1) | Per share net investment income was calculated using average shares outstanding. |
The accompanying notes are an integral part of these financial statements.
Bright Rock Funds
Notes to Financial Statements
February 28, 2022
| (1) | Organization |
| | |
| | Trust for Professional Managers (the “Trust”) was organized as a Delaware statutory trust under a Declaration of Trust dated May 29, 2001. The Trust is registered under the Investment Company Act of 1940, as amended (the “1940 Act”), as an open-end management investment company. The Bright Rock Funds (the “Funds”) are comprised of the Bright Rock Mid Cap Growth Fund (“Mid Cap Growth Fund”) and the Bright Rock Quality Large Cap Fund (“Quality Large Cap Fund”), each representing a distinct series with its own investment objective and policies within the Trust. The investment objective of both Funds is long-term capital appreciation. The Trust may issue an unlimited number of shares of beneficial interest at $0.001 par value. The assets of the Funds are segregated, and a shareholder’s interest is limited to the Fund in which shares are held. Each Fund is a series of an investment company and accordingly follows the investment company accounting and reporting guidance of the Financial Accounting Standards Board (FASB) Accounting Standard Codification Topic 946 “Financial Services—Investment Companies”. Each Fund currently offers Institutional Class shares. The Institutional Class shares of each Fund commenced operations on May 26, 2010. Bright Rock Capital Management, LLC (the “Adviser”) serves as the Funds’ investment adviser. |
| | |
| (2) | Significant Accounting Policies |
| | |
| | The following is a summary of significant accounting policies consistently followed by the Funds in the preparation of the financial statements. These policies are in conformity with accounting principles generally accepted in the United States of America (“GAAP”). |
| | (a) | Investment Valuation |
| | | Each equity security owned by a Fund that is listed on a securities exchange, except for securities listed on the NASDAQ Stock Market, LLC (“NASDAQ”), is valued at its last sale price on that exchange on the date as of which assets are valued. Forward currency contracts are valued at the mean between the bid and asked prices by an approved independent pricing service (“Pricing Service”). Commodities futures contracts and options thereon traded on a commodities exchange or board of trade are valued at the last sale price at the close of trading. Rights and warrants are valued at the last sale price at the close of the exchange on which the security is primarily traded. |
| | | |
| | | If the security is listed on more than one exchange, a Fund will use the price of the exchange that the Fund generally considers to be the principal exchange on which the security is traded. Portfolio securities listed on NASDAQ will be valued at the NASDAQ Official Closing Price, which may not necessarily represent the last sale price. If there has been no sale on such exchange or on |
Bright Rock Funds
Notes to Financial Statements (Continued)
February 28, 2022
| | | NASDAQ on such day, the security is valued at the mean between the most recent quoted bid and asked prices at the close of the exchange on such day or the security shall be valued at the latest sales price on the “composite market” for the day such security is being valued. The composite market is defined as a consolidation of the trade information provided by national securities and foreign exchanges and over-the-counter markets as published by a Pricing Service. |
| | | |
| | | Foreign securities will be priced in their local currencies as of the close of their primary exchange or market or as of the time each Fund calculates its net asset value (“NAV”), whichever is earlier. Foreign securities, currencies and other assets denominated in foreign currencies are then translated into U.S. dollars at the exchange rate of such currencies against the U.S. dollar, as provided by a Pricing Service or reporting agency. All assets denominated in foreign currencies will be converted into U.S. dollars using the applicable currency exchange rates as of the close of the New York Stock Exchange (“NYSE”), generally 4:00 p.m. Eastern Time. |
| | | |
| | | Debt securities, including short-term debt instruments having a maturity of 60 days or less, are valued at the mean in accordance with prices supplied by a Pricing Service. Pricing Services may use various valuation methodologies such as the mean between the bid and the asked prices, matrix pricing and other analytical pricing models as well as market transactions and dealer quotations. If a price is not available from a Pricing Service, the most recent quotation obtained from one or more broker-dealers known to follow the issue will be obtained. Quotations will be valued at the mean between the bid and the offer. In the absence of available quotations, the securities will be priced at fair value. Any discount or premium is accreted or amortized using the constant yield to maturity method. |
| | | |
| | | Money market funds, demand notes and repurchase agreements are valued at cost. If cost does not represent current market value the securities will be priced at fair value. |
| | | |
| | | Redeemable securities issued by open-end, registered investment companies are valued at the NAVs of such companies for purchase and/or redemption orders placed on that day. If, on a particular day, a share of an investment company is not listed on NASDAQ, such security’s fair value will be determined. All exchange-traded funds are valued at the last reported sale price on the exchange on which the security is principally traded. In the event market quotations are not readily available, such security will be valued at its fair value. |
| | | |
| | | If market quotations are not readily available, a security or other asset will be valued at its fair value as determined under fair value pricing procedures approved by the Board of Trustees. These fair value pricing procedures will also |
Bright Rock Funds
Notes to Financial Statements (Continued)
February 28, 2022
| | | be used to price a security when corporate events, events in the securities market and/or world events cause the Adviser to believe that a security’s last sale price may not reflect its actual fair market value. The intended effect of using fair value pricing procedures is to ensure that the Funds are accurately priced. The Board of Trustees will regularly evaluate whether the Funds’ fair value pricing procedures continue to be appropriate in light of the specific circumstances of the Funds and the quality of prices obtained through the application of such procedures by the Trust’s valuation committee. |
| | | |
| | | FASB Accounting Standards Codification, “Fair Value Measurement” Topic 820 (“ASC 820”), establishes an authoritative definition of fair value and sets out a hierarchy for measuring fair value. ASC 820 requires an entity to evaluate certain factors to determine whether there has been a significant decrease in volume and level of activity for the security such that recent transactions and quoted prices may not be determinative of fair value and further analysis and adjustment may be necessary to estimate fair value. ASC 820 also requires enhanced disclosure regarding the inputs and valuation techniques used to measure fair value in those instances as well as expanded disclosure of valuation levels for major security types. These inputs are summarized in the three broad levels listed below: |
| | | Level 1— | Quoted prices in active markets for identical securities. |
| | | | |
| | | Level 2— | Other significant observable inputs (including quoted prices for similar securities, interest rates, prepayment speeds, credit risk, etc.). |
| | | | |
| | | Level 3— | Significant unobservable inputs (including the Funds’ own assumptions in determining the fair value of investments). |
| | | The inputs or methodology used for valuing securities are not necessarily an indication of the risk associated with investing in those securities. The following is a summary of the inputs used to value the Funds’ investments carried at fair value as of February 28, 2022: |
| | Mid Cap Growth Fund | | | | | | | | | | | | |
| | | | Level 1 | | | Level 2 | | | Level 3(2) | | | Total | |
| | Equity | | | | | | | | | | | | |
| | Common Stocks(1) | | $ | 88,798,215 | | | $ | — | | | $ | — | | | $ | 88,798,215 | |
| | Money Market Funds | | | 2,566,347 | | | | — | | | | — | | | | 2,566,347 | |
| | Total Investments | | | | | | | | | | | | | | | | |
| | in Securities | | $ | 91,364,562 | | | $ | — | | | $ | — | | | $ | 91,364,562 | |
Bright Rock Funds
Notes to Financial Statements (Continued)
February 28, 2022
| | Quality Large Cap Fund | | | | | | | | | | | | |
| | | | Level 1 | | | Level 2 | | | Level 3(2) | | | Total | |
| | Equity | | | | | | | | | | | | |
| | Common Stocks(1) | | $ | 268,633,114 | | | $ | — | | | $ | — | | | $ | 268,633,114 | |
| | Exchange Traded Funds | | | 49,645,810 | | | | — | | | | — | | | | 49,645,810 | |
| | Money Market Funds | | | 1,762,901 | | | | — | | | | — | | | | 1,762,901 | |
| | Total Investments | | | | | | | | | | | | | | | | |
| | in Securities | | $ | 320,041,825 | | | $ | — | | | $ | — | | | $ | 320,041,825 | |
| | (1) | See the Schedule of Investments for industry classifications. |
| | (2) | The Funds measure Level 3 activity as of the end of each financial reporting period. For the year ended February 28, 2022, the Funds did not have unobservable inputs (Level 3 securities) used in determining fair value. Therefore, a reconciliation of assets and liabilities in which significant unobservable inputs (Level 3 securities) were used in determining fair value is not applicable. |
| | | The Funds did not hold financial derivative instruments during the period presented. |
| | | |
| | (b) | Federal Income Taxes |
| | | |
| | | The Funds comply with the requirements of Subchapter M of the Internal Revenue Code necessary to qualify as a regulated investment company and make the requisite distributions of income and capital gains to their shareholders sufficient to relieve them from all or substantially all federal income taxes. Therefore, no federal income tax provision has been provided. |
| | | |
| | (c) | Distributions to Shareholders |
| | | |
| | | The Mid Cap Growth Fund will make distributions of net investment income and net capital gain, if any, at least annually. The Quality Large Cap Fund will make distributions of net investment income, if any, at least quarterly, and net capital gain, if any, at least annually. Distributions from net realized gains for book purposes may include short-term capital gains. All short-term capital gains are included in ordinary income for tax purposes. Distributions to shareholders are recorded on the ex-dividend date. The Funds may also pay a special distribution at the end of the calendar year to comply with federal tax requirements. |
| | | |
| | | The amount of the dividends from net investment income and distributions from net realized gains are determined in accordance with federal income tax regulations, which may differ from GAAP. These differences are either temporary or permanent in nature. To the extent these differences are permanent in nature, such amounts are reclassified within the composition of net assets based on their federal tax-basis treatment. |
Bright Rock Funds
Notes to Financial Statements (Continued)
February 28, 2022
| | (d) | Use of Estimates |
| | | |
| | | The preparation of financial statements in conformity with GAAP requires management to make estimates and assumptions that affect the reported amounts of assets and liabilities and disclosure of contingent assets and liabilities at the date of the financial statements and the reported amounts of revenues and expenses during the reporting period. Actual results could differ from those estimates. |
| | | |
| | (e) | Share Valuation |
| | | |
| | | The NAV per share of each Fund is calculated by dividing the sum of the value of the securities held by each Fund, plus cash or other assets, minus all liabilities (including estimated accrued expenses) by the total number of shares outstanding for each Fund, rounded to the nearest cent. The Funds’ shares will not be priced on the days on which the NYSE is closed for trading. The offering and redemption price per share for each Fund is equal to the Fund’s NAV per share. |
| | | |
| | (f) | Allocation of Income, Expenses and Gains/Losses |
| | | |
| | | Income, expenses (other than those deemed attributable to a specific share class), and gains and losses of the Funds are allocated daily to each class of shares based upon the ratio of net assets represented by each class as a percentage of the net assets of each Fund. Expenses deemed directly attributable to a class of shares are recorded by the specific class. Most Fund expenses are allocated by class based on relative net assets. Expenses associated with a specific fund in the Trust are charged to that fund. Common Trust expenses are typically allocated evenly between the funds of the Trust, or by other equitable means. |
| | | |
| | (g) | Other |
| | | |
| | | Investment transactions are recorded on the trade date. The Funds determine the gain or loss from investment transactions using the best tax relief order. Dividend income is recognized on the ex-dividend date and interest income is recognized on an accrual basis. |
| (3) | Federal Tax Matters |
| | |
| | The tax character of distributions paid to shareholders for the years ended February 28, 2021 and February 28, 2022 was as follows: |
| | | | Ordinary | | | Long-Term | |
| | | | Income | | | Capital Gain | |
| | Mid Cap Growth Fund | | | | | | |
| | Year ended February 28, 2021 | | $ | — | | | $ | 4,232,779 | |
| | Year ended February 28, 2022 | | $ | — | | | $ | 7,470,363 | |
Bright Rock Funds
Notes to Financial Statements (Continued)
February 28, 2022
| | | | Ordinary | | | Long-Term | |
| | | | Income | | | Capital Gain | |
| | Quality Large Cap Fund | | | | | | |
| | Year ended February 28, 2021 | | $ | 3,396,501 | | | $ | 6,464,090 | |
| | Year ended February 28, 2022 | | $ | 3,227,833 | | | $ | 23,899,433 | |
| | As of February 28, 2022, the components of accumulated earnings (losses) on a tax basis were as follows: |
| | | | Mid Cap | | | Quality Large | |
| | | | Growth Fund | | | Cap Fund | |
| | Cost basis of investments for | | | | | | |
| | federal income tax purposes | | $ | 46,934,483 | | | $ | 200,560,355 | |
| | Gross tax unrealized appreciation | | $ | 46,191,158 | | | $ | 121,684,384 | |
| | Gross tax unrealized depreciation | | | (1,761,079 | ) | | | (2,202,913 | ) |
| | Net tax unrealized appreciation | | $ | 44,430,079 | | | $ | 119,481,471 | |
| | Undistributed ordinary income | | $ | — | | | $ | 136,856 | |
| | Undistributed long-term capital gain | | | 4,842,728 | | | | 16,709,611 | |
| | Total accumulated earnings | | $ | 4,842,728 | | | $ | 16,846,467 | |
| | Other accumulated loss | | | (16,320 | ) | | | — | |
| | Total distributable earnings | | $ | 49,256,487 | | | $ | 136,327,938 | |
| | The difference between book-basis and tax-basis cost of investments is attributable to the tax deferral of wash sale losses. |
| | |
| | At February 28, 2022 the following Funds deferred, on a tax basis, late year ordinary losses of: |
| | Mid Cap Growth Fund | $16,320 | |
| | Quality Large Cap Fund | — | |
| | GAAP requires that certain components of net assets relating to permanent differences be reclassified between financial and tax reporting. These reclassifications have no effect on net assets or net asset value per share. For the fiscal year ended February 28, 2022, the following reclassifications were made for permanent tax differences on the Statements of Assets and Liabilities: |
| | | Total Distributable Earnings | | | Paid-in Capital | |
| | Mid Cap Growth Fund | | $ | 308,476 | | | | $ | (308,476 | ) |
| | Quality Large Cap Fund | | | — | | | | | — | |
| | The Funds had no material uncertain tax positions and had not recorded a liability for unrecognized tax benefits as of February 28, 2022. Also, the Funds recognized no interest and penalties related to uncertain tax benefits in fiscal year 2022. At February 28, 2022, the fiscal years 2019 through 2022 remained open to examination in the Funds’ major tax jurisdictions. |
Bright Rock Funds
Notes to Financial Statements (Continued)
February 28, 2022
| (4) | Investment Adviser |
| | |
| | The Trust has entered into an Investment Advisory Agreement (the “Agreement”) with the Adviser to furnish investment advisory services to the Funds. Under the terms of the Agreement, the Trust, on behalf of the Mid Cap Growth Fund, compensates the Adviser for its management services at the annual rate of 0.75% of the Fund’s average daily net assets. The Trust, on behalf of the Quality Large Cap Fund, compensates the Adviser for its management services at the annual rate of 0.65% of the Fund’s average daily net assets. |
| | |
| | The Adviser has contractually agreed to waive its management fee and/or reimburse each Fund’s other expenses at least through June 28, 2023, at the discretion of the Adviser and the Board of Trustees, to the extent necessary to ensure that each Fund’s total operating expenses (exclusive of front-end or contingent deferred sales loads, Rule 12b-1 fees, shareholder servicing plan fees, taxes, leverage expenses, interest, brokerage commissions, expenses incurred in connection with any merger or reorganization, dividends or interest on short positions, acquired fund fees and expenses and extraordinary expenses such as litigation) do not exceed 1.25% of each Fund’s average daily net assets. Any such waiver or reimbursement is subject to later adjustment to allow the Adviser to recoup amounts waived or reimbursed within three years from the date such amount was waived or reimbursed, subject to the operating expense limitation agreement, if such reimbursements will not cause a Fund to exceed the lesser of: (1) the expense limitation in place at the time of the waiver and/or expense payment; or (2) the expense limitation in place at the time of the recoupment. The Funds did not have any previously waived expenses subject to potential recoupment at the period end. |
| | |
| (5) | Related Party Transactions |
| | |
| | U.S. Bancorp Fund Services, LLC (doing business as U.S. Bank Global Fund Services) (“Fund Services”) acts as the Funds’ administrator under an Administration Agreement. Fund Services prepares various federal and state regulatory filings, reports and returns for the Funds; prepares reports and materials to be supplied to the Trustees; monitors the activities of the Funds’ custodian, transfer agent and accountants; and coordinates the preparation and payment of the Funds’ expenses and reviews the Funds’ expense accruals. Fund Services also serves as the fund accountant and transfer agent to the Funds. U.S. Bank, N.A. (“U.S. Bank”), an affiliate of Fund Services, serves as each Fund’s custodian. Fees and expenses incurred for the year ended February 28, 2022, and owed as of February 28, 2022 are as follows: |
| | Administration | Incurred | Owed |
| | Mid Cap Growth Fund | $106,280 | $36,265 |
| | Quality Large Cap Fund | $294,263 | $99,473 |
Bright Rock Funds
Notes to Financial Statements (Continued)
February 28, 2022
| | Fund Accounting | Incurred | Owed |
| | Mid Cap Growth Fund | $ 43,072 | $14,486 |
| | Quality Large Cap Fund | $117,779 | $39,028 |
| | | | |
| | Transfer Agency | Incurred* | Owed |
| | Mid Cap Growth Fund | $ 25,348 | $ 8,468 |
| | Quality Large Cap Fund | $ 36,319 | $12,011 |
| | | | |
| | Custody | Incurred | Owed |
| | Mid Cap Growth Fund | $ 9,995 | $ 3,394 |
| | Quality Large Cap Fund | $ 34,391 | $11,522 |
| | * | These amounts do not include sub-transfer agency fees, therefore may not agree to the Statements of Operations. |
| | The Funds each have a line of credit with U.S. Bank (see Note 8). |
| | |
| | Certain officers of the Funds are also employees of Fund Services. A Trustee of the Trust is affiliated with Fund Services and U.S. Bank. |
| | |
| | The Trust’s Chief Compliance Officer (“CCO”) is also an employee of Fund Services. Each Fund’s allocation of the Trust’s Chief Compliance Officer fee incurred for the year ended February 28, 2022, and owed as of February 28, 2022, is as follows: |
| | CCO | Incurred | Owed |
| | Mid Cap Growth Fund | $ 12,512 | $ 4,179 |
| | Quality Large Cap Fund | $ 12,512 | $ 4,181 |
| (6) | Capital Share Transactions |
| | | | | | | | |
| | | | Year Ended | | | Year Ended | |
| | Mid Cap Growth Fund – Institutional Class | | February 28, 2022 | | | February 28, 2021 | |
| | Shares Sold | | | 449,570 | | | | 612,225 | |
| | Shares Issued to Holders in | | | | | | | | |
| | Reinvestment of Distributions | | | 293,322 | | | | 180,835 | |
| | Shares Redeemed | | | (489,826 | ) | | | (771,784 | ) |
| | Net Increase | | | 253,066 | | | | 21,276 | |
| | | | | | | | | | |
| | | | Year Ended | | | Year Ended | |
| | Quality Large Cap Fund – Institutional Class | | February 28, 2022 | | | February 28, 2021 | |
| | Shares Sold | | | 1,853,908 | | | | 2,494,866 | |
| | Shares Issued to Holders in | | | | | | | | |
| | Reinvestment of Distributions | | | 1,072,437 | | | | 335,732 | |
| | Shares Redeemed | | | (2,359,958 | ) | | | (2,530,525 | ) |
| | Net Increase | | | 566,387 | | | | 300,073 | |
Bright Rock Funds
Notes to Financial Statements (Continued)
February 28, 2022
| (7) | Investment Transactions |
| | |
| | The aggregate purchases and sales of securities, excluding short-term investments, for the Funds for the year ended February 28, 2022 are summarized below. There were no purchases or sales of U.S. government securities for the Funds. |
| | | Mid Cap Growth Fund | Quality Large Cap Fund |
| | Purchases | $18,055,009 | $ 97,334,526 |
| | Sales | $20,795,308 | $108,438,011 |
| (8) | Line of Credit |
| | |
| | The Funds each have lines of credit, maturing August 6, 2022, of the lesser of 33.33% of the fair value of unencumbered net assets of a Fund or the amount of $3,500,000 and $25,000,000 for the Mid Cap Growth Fund and Quality Large Cap Fund, respectively. These unsecured lines of credit are intended to provide short-term financing, if necessary, and subject to certain restrictions, in connection with shareholder redemptions. The credit facility is with the Funds’ custodian, U.S. Bank. Interest was accrued at the prime rate of 3.25%. |
| | | | Average | | Maximum | Date of |
| | | Days | Amount of | Interest | Amount of | Maximum |
| | | Utilized | Borrowing | Expense* | Borrowing | Borrowing |
| | Mid Cap Growth Fund | 13 | $ 120,462 | $141 | $ 307,000 | 8/19/2021 |
| | Quality Large Cap Fund | 4 | $1,508,500 | $545 | $1,523,000 | 7/23/2021 |
| | * Interest expense is reported on the Statements of Operations. |
| (9) | Subsequent Event |
| | |
| | On March 15, 2022, the Quality Large Cap Fund declared and paid a distribution of $501,161 to the shareholders of record on March 14, 2022. |
| | |
| (10) | Recent Market Events |
| | |
| | U.S. and international markets have experienced significant periods of volatility in recent years and months due to a number of economic, political and global macro factors including the impact of COVID-19 as a global pandemic and related public health crisis, growth concerns in the U.S. and overseas, uncertainties regarding interest rates, rising inflation, trade tensions, and the threat of tariffs imposed by the U.S. and other countries. In particular, the global spread of COVID-19 has resulted in disruptions to business operations and supply chains, stress on the global healthcare system, growth concerns in the U.S. and overseas, staffing shortages and the inability to meet consumer demand, and widespread concern and uncertainty. The global recovery from COVID-19 is proceeding at slower than expected rates due to the emergence of variant strains and may last for an extended period of time. Health |
Bright Rock Funds
Notes to Financial Statements (Continued)
February 28, 2022
| | crises and related political, social and economic disruptions caused by the spread of COVID-19 may also exacerbate other pre-existing political, social and economic risks in certain countries. As a result of continuing political tensions and armed conflicts, including the war between Ukraine and Russia, the U.S. and the European Union imposed sanctions on certain Russian individuals and companies, including certain financial institutions, and have limited certain exports and imports to and from Russia. The war has contributed to recent market volatility and may continue to do so. These developments, as well as other events, could result in further market volatility and negatively affect financial asset prices, the liquidity of certain securities and the normal operations of securities exchanges and other markets, despite government efforts to address market disruptions. Continuing market volatility as a result of recent market conditions or other events may have adverse effects on your account. |
Bright Rock Funds
Report of Independent Registered Public Accounting Firm
To the Shareholders of Bright Rock Funds and Board of Trustees of Trust for Professional Managers:
Opinion on the Financial Statements and Financial Highlights
We have audited the accompanying statements of assets and liabilities, including the schedules of investments, of the Bright Rock Funds, comprising Bright Rock Mid Cap Growth Fund and Bright Rock Quality Large Cap Fund (collectively, the “Funds”), each portfolios of the diversified series constituting Trust for Professional Managers, as of February 28, 2022, the related statements of operations for the year then ended, the statements of changes in net assets for each of the two years in the period then ended, the financial highlights for each of the five years in the period then ended, and the related notes. In our opinion, the financial statements and financial highlights present fairly, in all material respects, the financial position of each of the portfolios constituting the Bright Rock Funds as of February 28, 2022, the results of their operations for the year then ended, the changes in their net assets for each of the two years in the period then ended, and the financial highlights for each of the five years in the period then ended in conformity with accounting principles generally accepted in the United States of America.
Basis for Opinion
These financial statements and financial highlights are the responsibility of the Funds’ management. Our responsibility is to express an opinion on the Funds’ financial statements and financial highlights based on our audits. We are a public accounting firm registered with the Public Company Accounting Oversight Board (United States) (PCAOB) and are required to be independent with respect to the Funds in accordance with the U.S. federal securities laws and the applicable rules and regulations of the Securities and Exchange Commission and the PCAOB.
We conducted our audits in accordance with the standards of the PCAOB. Those standards require that we plan and perform the audits to obtain reasonable assurance about whether the financial statements and financial highlights are free of material misstatement, whether due to error or fraud. The Funds are not required to have, nor were we engaged to perform, an audit of their internal control over financial reporting. As part of our audits we are required to obtain an understanding of internal control over financial reporting but not for the purpose of expressing an opinion on the effectiveness of the Funds’ internal control over financial reporting. Accordingly, we express no such opinion.
Our audits included performing procedures to assess the risks of material misstatement of the financial statements and financial highlights, whether due to error or fraud, and performing procedures that respond to those risks. Such procedures included examining, on a test basis, evidence regarding the amounts and disclosures in the financial statements and financial highlights. Our audits also included evaluating the accounting principles used and significant estimates made by management, as well as evaluating the overall presentation of the financial statements and financial highlights. Our procedures included confirmation of securities owned as of February 28, 2022, by correspondence with the custodian and brokers. We believe that our audits provide a reasonable basis for our opinion.
/s/ Deloitte & Touche LLP
Chicago, Illinois
April 28, 2022
We have served as the auditor of one or more Trust for Professional Managers’ investment companies since 2002.
Bright Rock Funds
Notice of Privacy Policy & Practices
We collect non-public personal information about you from the following sources:
• information we receive about you on applications or other forms;
• information you give us orally; and
• information about your transactions with us or others.
We do not disclose any non-public personal information about our shareholders or former shareholders without the shareholder’s authorization, except as permitted by law or in response to inquiries from governmental authorities. We may share information with affiliated parties and unaffiliated third parties with whom we have contracts for servicing the Funds. We will provide unaffiliated third parties with only the information necessary to carry out their assigned responsibility. All shareholder records will be disposed of in accordance with applicable law. We maintain physical, electronic and procedural safeguards to protect your non-public personal information and require third parties to treat your non-public personal information with the same high degree of confidentiality.
In the event that you hold shares of the Funds through a financial intermediary, including, but not limited to, a broker-dealer, bank or trust company, the privacy policy of your financial intermediary would govern how your non-public personal information would be shared with unaffiliated third parties.
Bright Rock Funds
Additional Information
(Unaudited)
Results of Shareholder Meeting
A Special Joint Meeting of Shareholders (the “Meeting”) took place on April 6, 2022. The Meeting was held for all series in the Trust. All Trust shareholders of record, in the aggregate across all series of the Trust, were entitled to attend or submit proxies. As of the record date, February 7, 2022, the Trust had 534,673,511 shares outstanding. The results of the voting for the proposals were as follows:
Proposal 1: To approve the election of four Trustees to the Board of Trustees of the Trust to serve until his or her successor is elected and qualified.
| | For Votes | Votes Withheld | Broker Non-Vote |
| Vincent P. Lyles | 465,453,094 | 2,962,687 | 15,025,189 |
| Erik K. Olstein | 465,703,874 | 2,711,906 | 15,025,189 |
| Lisa Zúñiga Ramírez | 465,728,682 | 2,662,552 | 15,025,189 |
| Gregory M. Wesley | 465,394,219 | 2,984,741 | 15,025,189 |
Accordingly, effective April 6, 2022, the Board of Trustees of Trust for Professional Managers consists of the following individuals, each of whom have been elected by shareholders:
Michael D. Akers, Independent Trustee
Gary A. Drska, Independent Trustee
Vincent P. Lyles, Independent Trustee
Erik K. Olstein, Independent Trustee
Lisa Zúñiga Ramírez, Independent Trustee
Gregory M. Wesley, Independent Trustee
Joseph C. Neuberger, Interested Trustee
Proposal 2: To approve one or more adjournments of the Special Meeting to a later date to solicit additional proxies.
| | For Votes | Votes Against | Votes Abstained |
| | 476,848,750 | 2,932,139 | 3,647,484 |
Tax Information
For the fiscal year ended February 28, 2022, certain dividends paid by the Funds may be subject to a maximum tax rate of 20%, as provided for by the Jobs and Growth Tax Relief Reconciliation Act of 2003. The percentage of dividends declared from ordinary income designated as qualified dividend income was as follows:
| | Quality Large Cap | 100.00% | |
| | Mid Cap Growth | 0.00% | |
Bright Rock Funds
Additional Information (Continued)
(Unaudited)
For corporate shareholders, the percent of ordinary income distributions qualifying for the corporate dividends received deduction for the fiscal year ended February 28, 2022, was as follows:
| | Quality Large Cap | 100.00% | |
| | Mid Cap Growth | 0.00% | |
Indemnification
Under the Trust’s organizational documents, its officers and Trustees are indemnified against certain liabilities arising out of the performance of their duties to the Funds. In addition, in the normal course of business, the Funds enter into contracts that provide general indemnifications to other parties. The Funds’ maximum exposure under these arrangements is unknown, as this would involve future claims that may be made against the Funds that have not yet occurred. However, the Funds have not had prior claims or losses pursuant to these contracts and expect the risk of loss to be remote.
Information about Trustees
The business and affairs of the Trust are managed under the direction of the Trust’s Board of Trustees. Information pertaining to the Trustees of the Trust is set forth below. The Funds’ Statement of Additional Information includes additional information about the Trustees and is available, without charge, upon request by calling 1-866-273-7223.
Independent Trustees
| | | | Number of | | Other |
| | | Term of | Portfolios | Principal | Directorships |
| Name, | Position(s) | Office and | in the Trust | Occupation(s) | Held by Trustee |
| Address and | Held with | Length of | Overseen | During the | During the |
Year of Birth | the Trust | Time Served | by Trustee | Past Five Years | Past Five Years |
| | | | | | |
| Michael D. Akers, Ph.D. | Trustee | Indefinite | 24 | Professor Emeritus, | Independent |
| 615 E. Michigan St. | | Term; Since | | Department of | Trustee, USA |
| Milwaukee, WI 53202 | | August 22, | | Accounting (June | MUTUALS |
| Year of Birth: 1955 | | 2001 | | 2019–present); | (an open-end |
| | | | | Professor, | investment |
| | | | | Department of | company) |
| | | | | Accounting | (2001–2021). |
| | | | | (2004–2019); | |
| | | | | Chair, Department | |
| | | | | of Accounting | |
| | | | | (2004–2017), | |
| | | | | Marquette University. | |
Bright Rock Funds
Additional Information (Continued)
(Unaudited)
| | | | Number of | | Other |
| | | Term of | Portfolios | Principal | Directorships |
| Name, | Position(s) | Office and | in the Trust | Occupation(s) | Held by Trustee |
| Address and | Held with | Length of | Overseen | During the | During the |
Year of Birth | the Trust | Time Served | by Trustee | Past Five Years | Past Five Years |
| | | | | | |
| Gary A. Drska | Trustee | Indefinite | 24 | Retired; Pilot, | Independent |
| 615 E. Michigan St. | | Term; Since | | Frontier/Midwest | Trustee, USA |
| Milwaukee, WI 53202 | | August 22, | | Airlines, Inc. | MUTUALS |
| Year of Birth: 1956 | | 2001 | | (airline company) | (an open-end |
| | | | | (1986–2021). | investment |
| | | | | | company) |
| | | | | | (2001–2021). |
| | | | | | |
| Interested Trustee and Officers | | | | | |
| | | | | | |
| Joseph C. Neuberger* | Chairperson | Indefinite | 24 | President (2017– | Trustee, USA |
| 615 E. Michigan St. | and | Term; Since | | present), Chief | MUTUALS |
| Milwaukee, WI 53202 | Trustee | August 22, | | Operating Officer | (an open-end |
| Year of Birth: 1962 | | 2001 | | (2016–2020), | investment |
| | | | | Executive Vice | company) |
| | | | | President (1994– | (2001–2018); |
| | | | | 2017), U.S. | Trustee, Buffalo |
| | | | | Bancorp Fund | Funds (an open- |
| | | | | Services, LLC. | end investment |
| | | | | | company) |
| | | | | | (2003–2017). |
| | | | | | |
| John P. Buckel | President | Indefinite | N/A | Vice President, | N/A |
| 615 E. Michigan St. | and | Term; Since | | U.S. Bancorp Fund | |
| Milwaukee, WI 53202 | Principal | January 24, | | Services, LLC | |
| Year of Birth: 1957 | Executive | 2013 | | (2004–present). | |
| | Officer | | | | |
| | | | | | |
| Jennifer A. Lima | Vice | Indefinite | N/A | Vice President, | N/A |
| 615 E. Michigan St. | President, | Term; Since | | U.S. Bancorp Fund | |
| Milwaukee, WI 53202 | Treasurer | January 24, | | Services, LLC | |
| Year of Birth: 1974 | and | 2013 | | (2002–present). | |
| | Principal | | | | |
| | Financial | | | | |
| | and | | | | |
| | Accounting | | | | |
| | Officer | | | | |
| * | Mr. Neuberger is deemed to be an “interested person” of the Trust as defined by the 1940 Act due to his position and material business relationship with the Trust. |
Bright Rock Funds
Additional Information (Continued)
(Unaudited)
| | | | Number of | | Other |
| | | Term of | Portfolios | Principal | Directorships |
| Name, | Position(s) | Office and | in the Trust | Occupation(s) | Held by Trustee |
| Address and | Held with | Length of | Overseen | During the | During the |
Year of Birth | the Trust | Time Served | by Trustee | Past Five Years | Past Five Years |
| | | | | | |
| Deanna B. Marotz | Chief | Indefinite | N/A | Senior Vice President, | N/A |
| 615 E. Michigan St. | Compliance | Term; Since | | U.S. Bancorp Fund | |
| Milwaukee, WI 53202 | Officer, | October 21, | | Services, LLC | |
| Year of Birth: 1965 | Senior | 2021 | | 2021–present); Chief | |
| | Vice | | | Compliance Officer, | |
| | President | | | Keeley-Teton Advisors, | |
| | and | | | LLC and Teton Advisors, | |
| | Anti-Money | | | Inc (2017–2021); Chief | |
| | Laundering | | | Compliance Officer, | |
| | Officer | | | Keeley Asset Management | |
| | | | | Corp. (2015–2017). | |
| | | | | | |
| Jay S. Fitton | Secretary | Indefinite | N/A | Assistant Vice President, | N/A |
| 615 E. Michigan St. | | Term; Since | | U.S. Bancorp Fund | |
| Milwaukee, WI 53202 | | July 22, | | Services, LLC | |
| Year of Birth: 1970 | | 2019 | | (2019–present); Partner, | |
| | | | | Practus, LLP (2018– | |
| | | | | 2019); Counsel, | |
| | | | | Drinker Biddle & | |
| | | | | Reath, LLP (2016–2018). | |
| | | | | | |
| Kelly A. Strauss | Assistant | Indefinite | N/A | Assistant Vice President, | N/A |
| 615 E. Michigan St. | Treasurer | Term; Since | | U.S. Bancorp Fund | |
| Milwaukee, WI 53202 | | April 23, | | Services, LLC | |
| Year of Birth: 1987 | | 2015 | | (2011–present). | |
| | | | | | |
| Melissa Aguinaga | Assistant | Indefinite | N/A | Assistant Vice President, | N/A |
| 615 E. Michigan St. | Treasurer | Term; Since | | U.S. Bancorp Fund | |
| Milwaukee, WI 53202 | | July 1, | | Services, LLC | |
| Year of Birth: 1987 | | 2015 | | (2010–present). | |
| | | | | | |
| Laura A. Carroll | Assistant | Indefinite | N/A | Assistant Vice President, | N/A |
| 615 E. Michigan St. | Treasurer | Term; Since | | U.S. Bancorp Fund | |
| Milwaukee, WI 53202 | | August 20, | | Services, LLC | |
| Year of Birth: 1985 | | 2018 | | (2007–present). | |
A NOTE ON FORWARD LOOKING STATEMENTS (Unaudited)
The matters discussed in this report may constitute forward-looking statements made pursuant to the safe-harbor provisions of the Securities Litigation Reform Act of 1995. These include any Adviser or portfolio manager predictions, assessments, analyses or outlooks for individual securities, industries, market sectors and/or markets. These statements involve risks and uncertainties. In addition to the general risks described for the Funds in the current Prospectus, other factors bearing on this report include the accuracy of the Adviser’s or portfolio managers’ forecasts and predictions, and the appropriateness of the investment programs designed by the Adviser or portfolio managers to implement their strategies efficiently and effectively. Any one or more of these factors, as well as other risks affecting the securities markets and investment instruments generally, could cause the actual results of the Funds to differ materially as compared to benchmarks associated with the Funds.
PROXY VOTING POLICIES AND PROCEDURES (Unaudited)
The Funds have adopted proxy voting policies and procedures that delegate to the Adviser the authority to vote proxies. A description of the Funds’ proxy voting policies and procedures is available without charge, upon request, by calling the Funds toll free at 1-866-273-7223. A description of these policies and procedures is also included in the Funds’ Statement of Additional Information, which is available on the SEC’s website at http://www.sec.gov.
The Funds’ proxy voting record for the most recent 12-month period ended June 30 is available without charge, upon request, by calling 1-866-273-7223, or by accessing the SEC’s website at http://www.sec.gov.
PORTFOLIO HOLDINGS (Unaudited)
The Funds file their complete schedule of portfolio holdings with the SEC for the first and third quarters of each fiscal year on Part F of Form N-PORT. Shareholders may view the Funds’ filings on the SEC’s website at www.sec.gov.
HOUSEHOLDING (Unaudited)
In an effort to decrease costs, the Funds intend to reduce the number of duplicate prospectuses and certain other shareholder documents you receive by sending only one copy of each to those addresses shared by two or more accounts and to shareholders we reasonably believe are from the same family or household. If you would like to discontinue householding for your accounts, please call toll-free at 1-866-273-7223 to request individual copies of these documents. Once the Funds receive notice to stop householding, we will begin sending individual copies 30 days after receiving your request. This policy does not apply to account statements.
Bright Rock Funds
Investment Adviser
Bright Rock Capital Management, LLC
288 Union Street
Rockland, Massachusetts 02370
Legal Counsel
Godfrey & Kahn, S.C.
833 East Michigan Street
Suite 1800
Milwaukee, Wisconsin 53202
Independent Registered Public Accounting Firm
Deloitte & Touche LLP
111 South Wacker Drive
Chicago, Illinois 60606-4301
Transfer Agent, Fund Accountant and Fund Administrator
U.S. Bancorp Fund Services, LLC
615 East Michigan Street
Milwaukee, Wisconsin 53202
Custodian
U.S. Bank, N.A.
Custody Operations
1555 North River Center Drive
Suite 302
Milwaukee, Wisconsin 53212
Distributor
Quasar Distributors, LLC
111 East Kilbourn Avenue, Suite 2200
Milwaukee, Wisconsin 53202
This report is intended for shareholders of the Funds and may not be used as sales literature unless preceded or accompanied by a current prospectus.
BB-ANNUAL
Item 2. Code of Ethics.
The registrant has adopted a code of ethics that applies to the registrant’s principal executive officer and principal financial officer. The registrant has not made any amendments to its code of ethics during the period covered by this report. The registrant has not granted any waivers from any provisions of the code of ethics during the period covered by this report. A copy of the registrant’s Code of Ethics is incorporated by reference to the Registrant’s Form N-CSR filed on May 9, 2011.
Item 3. Audit Committee Financial Expert.
The registrant’s board of trustees has determined that there is at least one audit committee financial expert serving on its audit committee. Dr. Michael Akers is the “audit committee financial expert” and is considered to be “independent” as each term is defined in Item 3 of Form N‑CSR. Dr. Akers holds a Ph.D. in accountancy and is a professor Emeritus of accounting at Marquette University in Milwaukee, Wisconsin.
Item 4. Principal Accountant Fees and Services.
The registrant has engaged its principal accountant to perform audit services, audit-related services, tax services and other services during the past two fiscal years. “Audit services” refer to performing an audit of the registrant's annual financial statements or services that are normally provided by the accountant in connection with statutory and regulatory filings or engagements for those fiscal years. “Audit-related services” refer to the assurance and related services by the principal accountant that are reasonably related to the performance of the audit. “Tax services” refer to professional services rendered by the principal accountant for tax compliance, tax advice, and tax planning. The following table details the aggregate fees billed or expected to be billed for each of the last two fiscal years for audit fees, audit-related fees, tax fees and other fees by the principal accountant.
| | FYE 2/28/2022 | FYE 2/28/2021 |
(a) Audit Fees | $54,400 | $52,800 |
(b) Audit-Related Fees | $0 | $0 |
(c) Tax Fees | $12,700 | $12,300 |
(d) All Other Fees | $0 | $0 |
(e)(1) The audit committee has adopted pre-approval policies and procedures that require the audit committee to pre‑approve all audit and non‑audit services of the registrant, including services provided to any entity affiliated with the registrant.
(e)(2) The percentage of fees billed by Deloitte & Touche applicable to non-audit services pursuant to waiver of pre-approval requirement were as follows:
| | FYE 2/28/2022 | FYE 2/28/2021 |
Audit-Related Fees | 0% | 0% |
Tax Fees | 0% | 0% |
All Other Fees | 0% | 0% |
(f) All of the principal accountant’s hours spent on auditing the registrant’s financial statements were attributed to work performed by full‑time permanent employees of the principal accountant.
(g) The following table indicates the non-audit fees billed or expected to be billed by the registrant’s accountant for services to the registrant and to the registrant’s investment adviser (and any other controlling entity, etc.—not sub-adviser) for the last two years.
Non-Audit Related Fees | FYE 2/28/2022 | FYE 2/28/2021 |
Registrant | $0 | $0 |
Registrant’s Investment Adviser | $195,000 | $198,000 |
(h) The audit committee of the board of trustees has considered whether the provision of non-audit services that were rendered to the registrant's investment adviser is compatible with maintaining the principal accountant's independence and has concluded that the provision of such non-audit services by the accountant has not compromised the accountant’s independence.
(i) Not applicable
(j) Not applicable
Item 5. Audit Committee of Listed Registrants.
Not applicable to registrants who are not listed issuers (as defined in Rule 10A-3 under the Securities Exchange Act of 1934).
Item 6. Investments.
(a) | Schedule of Investments is included as part of the report to shareholders filed under Item 1 of this Form. |
Item 7. Disclosure of Proxy Voting Policies and Procedures for Closed-End Management Investment Companies.
Not applicable to open-end investment companies.
Item 8. Portfolio Managers of Closed-End Management Investment Companies.
Not applicable to open-end investment companies.
Item 9. Purchases of Equity Securities by Closed‑End Management Investment Company and Affiliated Purchasers.
Not applicable to open-end investment companies.
Item 10. Submission of Matters to a Vote of Security Holders.
There have been no material changes to the procedures by which shareholders may recommend nominees to the registrant’s board of trustees.
Item 11. Controls and Procedures.
(a) | The Registrant’s President and Treasurer have reviewed the Registrant's disclosure controls and procedures (as defined in Rule 30a-3(c) under the Investment Company Act of 1940 (the “Act”)) as of a date within 90 days of the filing of this report, as required by Rule 30a-3(b) under the Act and Rules 13a-15(b) or 15d‑15(b) under the Securities Exchange Act of 1934. Based on their review, such officers have concluded that the disclosure controls and procedures are effective in ensuring that information required to be disclosed in this report is appropriately recorded, processed, summarized and reported and made known to them by others within the Registrant and by the Registrant’s service provider. |
(b) | There were no changes in the Registrant's internal control over financial reporting (as defined in Rule 30a-3(d) under the Act) that occurred during the last fiscal half-year of the period covered by this report that has materially affected, or is reasonably likely to materially affect, the Registrant's internal control over financial reporting. |
Item 12. Disclosure of Securities Lending Activities for Closed-End Management Investment Companies
Not applicable to open-end investment companies.
Item 13. Exhibits.
(3) Any written solicitation to purchase securities under Rule 23c‑1 under the Act sent or given during the period covered by the report by or on behalf of the registrant to 10 or more persons. Not applicable to open-end investment companies.
(4) Change in the registrant’s independent public accountant. There was no change in the registrant’s independent public accountant for the period covered by this report.
SIGNATURES
Pursuant to the requirements of the Securities Exchange Act of 1934 and the Investment Company Act of 1940, the registrant has duly caused this report to be signed on its behalf by the undersigned, thereunto duly authorized.
(Registrant) Trust for Professional Managers
By (Signature and Title)* /s/John Buckel
John Buckel, President
Date 4/28/22
Pursuant to the requirements of the Securities Exchange Act of 1934 and the Investment Company Act of 1940, this report has been signed below by the following persons on behalf of the registrant and in the capacities and on the dates indicated.
By (Signature and Title)* /s/John Buckel
John Buckel, President
Date 4/28/22
By (Signature and Title)*
/s/Jennifer LimaJennifer Lima, Treasurer
Date 4/28/22
* Print the name and title of each signing officer under his or her signature.