UNITED STATES
SECURITIES AND EXCHANGE COMMISSION
Washington, D.C. 20549
SECURITIES AND EXCHANGE COMMISSION
Washington, D.C. 20549
FORM N-CSR
CERTIFIED SHAREHOLDER REPORT OF REGISTERED
MANAGEMENT INVESTMENT COMPANIES
Investment Company Act file number 811-10401
Trust for Professional Managers
(Exact name of registrant as specified in charter)
(Exact name of registrant as specified in charter)
615 East Michigan Street
Milwaukee, WI 53202
(Address of principal executive offices) (Zip code)
(Address of principal executive offices) (Zip code)
Jay S. Fitton
U.S. Bancorp Fund Services, LLC
615 East Michigan Street
Milwaukee, WI 53202
(Name and address of agent for service)
(Name and address of agent for service)
(513)-629-8104
Registrant's telephone number, including area code
Date of fiscal year end: November 30, 2023
Date of reporting period: November 30, 2023
Item 1. Reports to Stockholders.
(a)
Rockefeller Climate Solutions Fund
Rockefeller US Small Cap Core Fund
Annual Report
November 30, 2023
Investment Adviser
Rockefeller & Co. LLC
45 Rockefeller Plaza, 5th Floor
New York, New York 10111
Table of Contents
LETTER TO SHAREHOLDERS | 3 | ||
EXPENSE EXAMPLES | 8 | ||
INVESTMENT HIGHLIGHTS | 10 | ||
SCHEDULES OF INVESTMENTS | 15 | ||
STATEMENTS OF ASSETS AND LIABILITIES | 21 | ||
STATEMENTS OF OPERATIONS | 22 | ||
STATEMENTS OF CHANGES IN NET ASSETS | 23 | ||
FINANCIAL HIGHLIGHTS | 25 | ||
NOTES TO FINANCIAL STATEMENTS | 29 | ||
REPORT OF INDEPENDENT | |||
REGISTERED PUBLIC ACCOUNTING FIRM | 39 | ||
BASIS FOR TRUSTEES’ APPROVAL OF | |||
INVESTMENT ADVISORY AGREEMENTS | 41 | ||
NOTICE OF PRIVACY POLICY & PRACTICES | 48 | ||
ADDITIONAL INFORMATION | 49 |
Dear Rockefeller Climate Solutions Fund Shareholder:
The MSCI All-Country World Index (net dividends) (“MSCI ACWI”) increased 12.01% during the period 12/1/2022 through 11/30/2023. Volatility abounded in another rollercoaster year for equity markets. Investors faced persistently high inflation, albeit with some recent softening, stubbornly tight US and global labor markets, rising US and global interest rates, a banking system mini-crisis, and an artificial intelligence (AI) boom.
Also fueling market volatility was expectations of a recession early in the year, which later pivoted towards expectations of ongoing growth. Layer on broadening concerns of US and other developed market rising deficits, fear of a US government shutdown, possible US Treasury defaults, and rising geopolitical tensions, and there was much to drive markets throughout the year.
In the final months of 2023, investors became increasingly optimistic about the likelihood of a soft landing and rate cuts in early 2024, which widened the breadth of the equity market rally. Heading into the final weeks of the year, the data suggests further inflation moderation and some initial signs of cooling in labor markets.
Global Economy
Shifting to global market factors, growth in Europe and developed markets is likely to be a bit more muted in 2024 than 2023. Growth expectations for the EU for 2024 are roughly 1%, following 2023 when the Eurozone experienced sluggish real GDP growth of 0.5% as weak consumer spending was positively offset by large declines in energy cost. Natural Gas (Netherlands TTF) prices have dropped two-thirds and Germany whole baseload spot prices are half of last year’s average price which likely saved the Eurozone from falling into a recession. In Japan, a breakout in inflation, weakening Yen, and positive domestic consumption data has led to strong equity returns. The Japanese Yen has averaged 140/$, about 6% weaker year-over-year (“YoY”) (20% weaker than pre-pandemic levels) which has benefitted an economy that is export oriented. Domestically, retail sales have grown mid-single digits YoY and tourists visiting Japan have finally reached pre-pandemic levels in October.
China’s slowdown and geopolitical risks impacted markets in 2023, a trend we anticipate will persist in 2024. Despite early signs of expansionary activity early in the year, “post-COVID” Chinese growth stalled as consumer prices fell, the property crisis deepened, the Chinese yuan fell to its lowest level in 16 years, local government debt soared, and unemployment rose significantly enough among youth that the data is no longer published. Given these mounting headwinds, the People’s Bank of China intervened by cutting rates and seeking to incrementally help the property market and consumer businesses. However, the measures thus far seem insufficient and merely a stopgap rather than a broad stimulus. Another key factor investors are closely monitoring is China’s reduction of US Treasuries. This could pressure the US rates market if there is a continued reduction of a large global participant in US rates.
Rockefeller Climate Solutions Fund
For the fiscal year from 12/1/2022 through 11/30/2023, the Institutional Class shares of the Rockefeller Climate Solutions Fund (the “Fund”) returned 3.87% (net) versus the MSCI ACWI (net dividends) return of 12.01% over the same period. The Fund underperformed the benchmark during the period largely due to the technology rally, which the Fund did not participate in given its pure play climate focus. The Fund’s overweight to Utilities also hurt performance, given the sector’s sensitivity to higher interest rates. Darling Ingredients, Inc. which collects and recycles animal processing by-products and used restaurant cooking oil, was the top single-name detractor. Despite growth in demand for
3
Darling’s products, the stocks of biofuel producers in general fell because of excess supply pressuring margins. We still believe the company to be undervalued relative to continued expansion of earnings profile and rock-solid position in waste acquisition and utilization. Maxar Technologies was the largest contributor during the period, as it was acquired by private equity firm Advent International for $53 per share, a 129% premium to the prior close.
Looking Forward
During the last few years, supply chain fears prompted companies to conservatively maintain inventory across several areas, including industrial and consumer products. Now that these fears have subsided and inventory levels have been worked down, our view is that 2024 promises a more normalized environment, creating opportunities for proper planning and the ability to reap the benefits of greater economic growth. Second, we are seeing a more visible implementation of some of the economic stimulus packages in the US, particularly green spending. Despite delays in rolling out the Inflation Reduction Act (“IRA”), CHIPS Act, and Infrastructure Investment and Jobs Act (“IIJA”), we believe that this government spending will have a solid presence in demand profiles in 2024.
Finally, we are expecting negative headlines surrounding the climate transition. Roughly two-thirds of the world is set to hold elections in the coming year, and an easy campaign target is green spending. Despite acknowledgement that green spending is a necessary step in fighting climate change, it can be perceived as inflationary and, therefore, is likely to shape some political platforms. 2023 is the hottest year on record, which drastically increased the number of costly weather events. Our view is that the world will have no choice but to address energy and food security issues, and these issues will be necessary to resolve regardless of politics.
Dear Rockefeller US Small Cap Core Fund Shareholder:
The Russell 2000 Total Return Index fell 9.15% from 7/31/2023 through 11/30/2023. Volatility abounded during the reporting period as the economic narrative shifted markedly in November, driving a ‘risk on’ posture within equity markets following a period of significant market weakness. Fears of a recession on the back of persistently high inflation, weakening consumer confidence, and decelerating growth early in the period gave way to expectations for a soft landing as recent commentary from the Fed was generally ‘dovish.’ Central banks around the globe have also shifted to a more neutral policy stance as higher rates have done their job and brought inflation to more manageable levels. Of note, the yields on the US 10-year Treasury have fallen substantially, which have clearly aided equity market performance and in particular long-tailed growth companies due to the implications of lower discount rates. The market is anticipating significant rate cuts in 2024, though the timing of the first cut remains uncertain. Interestingly, the near-term headwinds to growth have not dissipated, though we believe they are fully priced into multiples at this point and the market is increasingly looking toward an acceleration in corporate earnings growth in 2024.
US Economy
2023 GDP growth expectations surprised to the upside rising from 0.3% to 2.4% over the course of this year, despite the steady rise in Federal Funds Rate. We anticipate the effects of elevated interest rates to be more impactful to global economies in 2024 due to
4
the lag affect. The US 10-year Treasury yield approached 5% in October, a level last seen in 2007, but has since retraced towards 4.00%. In the near term, higher rates will disadvantage indebted companies, acting to reduce the multiples of long duration equities, and potentially thwart excessive capital decisions, which effectively dampens the outlook for equities.
The current US unemployment rate remains below 4% but has been gradually moving higher in recent months as companies begin to implement hiring freezes and staff reductions. Despite full employment rates, the University of Michigan Consumer Sentiment Index remains sluggish. In addition, credit card net charge off rates suggest deteriorating financial conditions ahead for middle class to sub-prime households, as they have largely consumed their savings accumulated during the pandemic.
Rockefeller US Small Cap Core Fund
For the fiscal period from 7/31/2023 (commencement of operations) through 11/30/2023, the Class I shares of the Rockefeller US Small Cap Core Fund (the “Fund”) returned -4.30% versus the Russell 2000 Total Return Index’s -9.15% return for the same period. As expected, the Fund provided strong downside management during a period of pronounced market weakness given its focus on high quality businesses with ‘company specific’ drivers of fundamental performance. Strong stock selection drove the majority of relative outperformance and was most pronounced within the Financials sector, where the Fund saw broad-based contributions across several holdings. The Fund also benefited from positive selection within Information Technology, Consumer Discretionary, and Industrials. On the negative side, stock selection was weak within Health Care, Consumer Staples and Utilities, and lack of exposure to Energy also detracted. Stride, Inc., an education technology company, was the top single-name contributor to performance. Omnicell, Inc., an integrated suite of clinical infrastructure and workflow automation solutions for healthcare facilities, was the largest single-name detractor.
Looking Forward
Several things are top of mind for us as small cap investors as we move through 2024. First, we believe in an acceleration in earnings growth for smaller companies. We believe that the third quarter earnings season represented the ‘bottom’ and growth should accelerate steadily from here and moving through 2024. We believe the market will begin to increasingly price in this acceleration in growth, and arguably already has begun given the recent strength of the asset class.
Second, we believe the Fed has ended its rate tightening campaign. When the Fed will begin to lower rates is up for debate. Regardless, the end of the tightening cycle has historically provided an environment for small cap outperformance versus mid-caps and large-caps, as it is typically accompanied by an improving macro backdrop and comes on the heels of small cap underperformance. Third, we believe inflation to remain somewhat ‘sticky.’ History has shown that small caps outperform in high-but-declining inflationary environments, which we believe to be the case for some time. Finally, we anticipate an acceleration of Merger & Acquisition (“M&A”) activity, which has historically served to buoy valuation multiples for smaller companies.
While we believe financial conditions will improve in 2024, we believe the go-forward macro environment will remain much different than the one that characterized the post-Global Financial Crisis world (i.e., low inflation and low interest rates). The biggest opportunity for us as small cap managers will be investing in quality companies that are able to withstand higher interest rates with strong balance sheets and robust cash flow generation, and withstand higher inflation with flexible cost structures and pricing power. The inflationary
5
and interest rate shock of the past several years has shone a light on the importance of ‘quality’ investing to preserve client capital in challenging times, as well as compound returns through a full cycle. In our view, quality companies that made decisions in 2023 to gain market share or invest in their businesses will outperform their competitors who are struggling with leverage and being defensive. We believe the decisions made today will benefit the companies in the coming three to five years. As always, we will seek to adhere to our tried-and-true philosophy of investing in high quality businesses with company-specific drivers of outperformance that have not yet been priced in by the market.
Disclosures: Opinions expressed are those of Rockefeller Asset Management as of the date of this report above and are subject to change, are not guaranteed and should not be considered investment advice. Rockefeller Asset Management is a division of Rockefeller & Co. LLC, the investment adviser to the Rockefeller Funds.
Must be preceded or accompanied by a current prospectus.
Past performance is no guarantee of future results.
Mutual fund investing involves risk. The value of your investment in the Funds could go down as well as up. You may lose money investing in the Funds, including the loss of principal.
Rockefeller Climate Solutions Fund: Investing in the Fund is subject to certain risks, including general market risk; management risk; climate solutions risk; the risks of investing in equity securities, MLPs, REITS, other investment companies and exchange traded funds and other types of securities. Investments in large capitalization companies may be unable to respond quickly to new competitive challenges such as changes in consumer tastes or innovative smaller competitors. Large cap companies are sometimes unable to attain the high growth rates of successful, smaller companies, especially during extended periods of economic expansion. Investments in small- and medium-capitalization companies tend to have limited liquidity and greater price volatility than large-capitalization companies. Investments in non-U.S. securities may be more sensitive to currency fluctuations, political and economic instability, differing government regulations and liquidity risks. These risks are greater in emerging markets. Commodity-linked investments may subject the Fund to greater risks and volatility as commodity prices may be influenced by a variety of factors including unfavorable weather, environmental factors, and changes in government regulations. The Fund’s focus on environmental criteria will limit the number of investment opportunities available to the Fund as compared to other mutual funds with broader investment objectives, and as a result, the Fund may underperform funds that are not subject to similar investment considerations. Portfolio companies may be significantly affected by environmental considerations, taxation, government regulation (including the increased cost of compliance), inflation, increases in interest rates, price and supply fluctuations, increases in the cost of raw materials and other operating costs, technological advances, and competition from new market entrants. In addition, companies may share common characteristics and be subject to similar business risks and regulatory burdens. A downturn in the demand for climate change mitigation and adaptation products and services is likely to have a significant negative impact on the value of the Fund’s investments. As a result of these and other factors, the Fund’s portfolio investments are expected to be volatile, which may result in significant investment losses to the Fund.
6
Rockefeller US Small Cap Core Fund: Investing in the Fund is subject to certain risks, including general market risk; management risk; the risks of investing in equity securities, REITS, other investment companies and exchange traded funds and other types of securities. Investments in small capitalization companies tend to have limited liquidity and greater price volatility than large-capitalization companies. Investments in non-U.S. securities may be more sensitive to currency fluctuations, political and economic instability, differing government regulations and liquidity risks. These risks are greater in emerging markets. As a result of these and other factors, the Fund’s portfolio investments are expected to be volatile, which may result in significant investment losses to the Fund. The Fund is a newly registered mutual fund and does not have operating history as a mutual fund.
The MSCI ACWI total return indices reinvest dividends after the deduction of withholding taxes, using (for international indices) a tax rate applicable to non-resident institutional investors who do not benefit from double taxation treaties. The MSCI ACWI total return index is a stock index designed to track broad global equity-market performance. You cannot invest directly in an index.
The Russell 2000® Total Return Index measures the performance of the small-cap segment of the US equity universe. It includes approximately 2,000 of the smallest securities based on a combination of their market cap and current index membership. The Russell 2000 is constructed to provide a comprehensive and unbiased small-cap barometer and is completely reconstituted annually to ensure larger stocks do not distort the performance and characteristics of the true small-cap opportunity set. You cannot invest directly in an index.
Cash flow means cash from operations from the cash flow statement.
Gross domestic product (GDP) is the total monetary or market value of all the finished goods and services produced within a country’s borders in a specific time period. As a broad measure of overall domestic production, it functions as a comprehensive scorecard of a given country’s economic health.
Netherlands TTF is a virtual trading point for natural gas in the Netherlands.
The University of Michigan Consumer Sentiment Index is a consumer confidence index published monthly by the University of Michigan. The index is normalized to have a value of 100 in the first quarter of 1966. Each month at least 500 telephone interviews are conducted of a contiguous United States sample. Fifty core questions are asked.
Fund holdings and sector allocations are subject to change and are not recommendations to buy or sell any security. Please refer to the schedule of investments included in this report for additional portfolio information.
Rockefeller Capital Management is the marketing name of Rockefeller & Co. LLC, the investment adviser to the Funds. The Rockefeller Funds are distributed by Quasar Distributors, LLC.
7
Rockefeller Funds
Expense Examples
November 30, 2023 (Unaudited)
As a shareholder of the Funds, you incur two types of costs: (1) transaction costs, including sales charges (loads) on purchase payments (Class A shares only), and (2) ongoing costs, including management fees, distribution and service (12b-1) fees (Class A shares only) and other Fund expenses. These Examples are intended to help you understand your ongoing costs (in dollars) of investing in the Funds, and to compare these costs with the ongoing costs of investing in other mutual funds. The Examples are based on an investment of $1,000 invested at the beginning of the period and held for the period (6/1/23 – 11/30/23) for the Rockefeller Climate Solutions Fund and the period (7/31/23 – 11/30/23) for the Rockefeller US Small Cap Core Fund.
Actual Expenses
The first line of the following tables provides information about actual account values and actual expenses. If you purchase Class A shares of the Funds you will pay an initial sales charge of 5.25% when you invest. Class A shares are also subject to a contingent defered sales charge of 1.00% for purchases made at the $500,000 breakpoint and redeemed within twelve months of purchase. In addition, you will be assessed fees for outgoing wire transfers, returned checks and stop payment orders at prevailing rates charged by U.S. Bancorp Fund Services, LLC, the Funds’ transfer agent. If you request that a redemption be made by wire transfer, currently a $15.00 fee is charged by the Funds’ transfer agent. Individual Retirement Accounts will be charged a $15.00 annual maintenance fee. To the extent the Funds invest in shares of exchange-traded funds or other investment companies as part of its investment strategy, you will indirectly bear your proportionate share of any fees and expenses charged by the underlying funds in which the Funds invest in addition to the expenses of the Funds. Actual expenses of the underlying funds are expected to vary among the various underlying funds. These expenses are not included in the Example. The Example includes, but is not limited to, management fees, fund administration fees and accounting, custody and transfer agent fees. You may use the information in this first line, together with the amount you invested, to estimate the expenses that you paid over the period. Simply divide your account value by $1,000 (for example, an $8,600 account value divided by $1,000 = 8.6), then multiply the result by the number in the first line under the heading entitled “Expenses Paid During Period” to estimate the expenses you paid on your account during this period.
Hypothetical Example for Comparison Purposes
The second line of the following tables provides information about hypothetical account values and hypothetical expenses based on the Funds’ actual expense ratios and an assumed rate of return of 5% per year before expenses, which is not the Funds’ actual return. The hypothetical account values and expenses may not be used to estimate the actual ending account balance or expenses you paid for the period. You may use this information to compare the ongoing costs of investing in the Funds and other funds. To do so, compare this 5% hypothetical example with the 5% hypothetical examples that appear in the shareholder reports of other funds. Please note that the expenses shown in the tables are meant to highlight your ongoing costs only and do not reflect any transactional costs, such as sales charges (loads), redemption fees or exchange fees. Therefore, the second line of each table is useful in comparing ongoing costs only, and will not help you determine the relative total costs of owning different funds. In addition, if these transactional costs were included, your costs would have been higher.
8
Rockefeller Funds
Expense Examples (Continued)
November 30, 2023 (Unaudited)
Rockefeller Climate Solutions Fund
| Beginning | Ending | Expenses Paid | |
| Account Value | Account Value | During Period | |
6/01/23 | 11/30/23 | 6/01/23 – 11/30/23* | |
| Institutional Class | |||
| Actual | $1,000.00 | $ 991.60 | $4.99 |
| Hypothetical (5% return | |||
| before expenses) | $1,000.00 | $1,020.05 | $5.06 |
| Class A | |||
| Actual | $1,000.00 | $ 990.40 | $6.24 |
| Hypothetical (5% return | |||
| before expenses) | $1,000.00 | $1,018.80 | $6.33 |
| * | Expenses are equal to the Fund’s annualized net expense ratio of 1.24% and 0.99% for Class A and Institutional Class, respectively, multiplied by the average account value over the period, multiplied by 183/365 (to reflect the period). |
Rockefeller US Small Cap Core Fund
| Beginning | Ending | Expenses Paid | |
| Account Value | Account Value | During Period | |
7/31/23 | 11/30/23 | 7/31/23 – 11/30/23* | |
| Class I | |||
| Actual | $1,000.00 | $ 957.00 | $3.11 |
| Hypothetical (5% return | |||
| before expenses) | $1,000.00 | $1,013.54 | $3.20 |
| Class A | |||
| Actual | $1,000.00 | $ 956.00 | $3.89 |
| Hypothetical (5% return | |||
| before expenses) | $1,000.00 | $1,012.73 | $4.00 |
| * | Expenses are equal to the Fund’s annualized net expense ratio of 1.20% and 0.95% for Class A and Class I, respectively, multiplied by the average account value over the period, multiplied by 122/365 (to reflect the period). |
9
Rockefeller Climate Solutions Fund
Investment Highlights
November 30, 2023 (Unaudited)
The Fund seeks long-term growth of capital principally through equity investments in global companies across the market capitalization spectrum offering on climate change mitigation or adaptation products and services. Rockefeller & Co., LLC (the “Adviser”) typically considers a company to be focused on climate mitigation or adaptation solutions where it generates revenue by delivering products or services related to water infrastructure and technologies, waste management and technologies, energy efficiency, food, agriculture and forestry, renewable and alternative energy, healthcare, pollution control, and/or climate support systems (“Climate Solution Activities”). While the Fund may invest in companies operating in any industry or sector, due to its focus on Climate Solutions Activities, the Fund is expected to have more meaningful exposure to companies operating in the Industrials sector, and to a lesser extent, to companies operating in the Consumer Discretionary, Communication Services, traditional Energy, and Financials sectors. The Adviser believes that companies positioned alongside environmental sectors have the potential to significantly outperform the broader equity market over the long-term.
Allocation of Portfolio Holdings as of November 30, 2023*
(% of Investments)
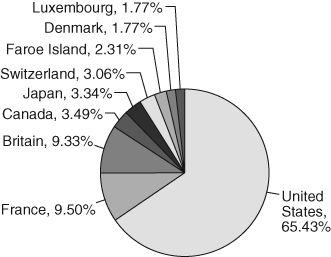
| * | For additional details on allocation of portfolio holdings by country, please see the Schedule of Investments. |
Average Annual Returns as of November 30, 2023
| MSCI All Country | ||
| World Index | ||
Class A(1) | (Net Dividends) | |
| 1 Year | 3.61% | 12.01% |
| Since Inception | -4.93% | 0.18% |
(1) | Fund commenced operations on July 21, 2021. |
10
Rockefeller Climate Solutions Fund
Investment Highlights (Continued)
November 30, 2023 (Unaudited)
Average Annual Returns as of November 30, 2023
| MSCI All Country | ||
| Institutional | World Index | |
Class(1) | (Net Dividends) | |
| 1 Year | 3.87% | 12.01% |
| 5 Years | 7.97% | 9.07% |
| 10 Years | 6.85% | 7.60% |
| Since Inception | 8.89% | 9.69% |
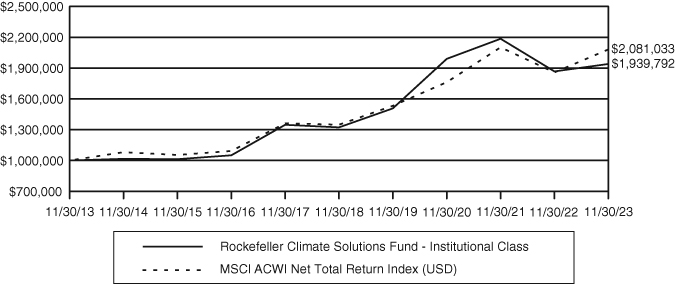
(1) | Performance shown prior to July 21, 2021 is that of the Rockefeller Climate Solutions Fund, L.P. (the "Predecessor Fund"). The Predecessor Fund commenced operations on June 1, 2012. The Predecessor Fund was reorganized into the Fund on July 21, 2021 in exchange for Institutional Class shares of the Fund. |
Performance data quoted represents past performance and does not guarantee future results. The investment return and principal value of an investment will fluctuate so that an investor’s shares, when redeemed, may be worth more or less than their original cost. Current performance of the Fund may be lower or higher than the performance quoted. Performance data current to the most recent month-end may be obtained by calling 855-369-6209.
Short-term performance, in particular, is not a good indication of the Fund’s future performance, and an investment should not be made based solely on historical returns.
Investment performance reflects fee waivers in effect. In the absence of such waivers, total return would be reduced.
The returns shown assume reinvestment of Fund distributions and do not reflect the deduction of taxes that a shareholder would pay on Fund distributions or the redemption of Fund shares. The following chart illustrates performance of a hypothetical investment made in the Fund and a broad-based securities index on the Fund’s inception date. The graph does not reflect any future performance.
The MSCI All Country World Index (Net Dividends) (“MSCI ACWI”) is a free float-adjusted market capitalization weighted index that measures the equity performance of global developed and emerging markets. The MSCI returns reflect the reinvestment of dividends after the deduction of withholding taxes, using (for international indices) a tax rate applicable to non-resident institutional investors who do not benefit from double taxation treaties.
Continued
11
Rockefeller Climate Solutions Fund
Investment Highlights (Continued)
November 30, 2023 (Unaudited)
Growth of $1,000,000 Investment
Growth of $10,000 Investment
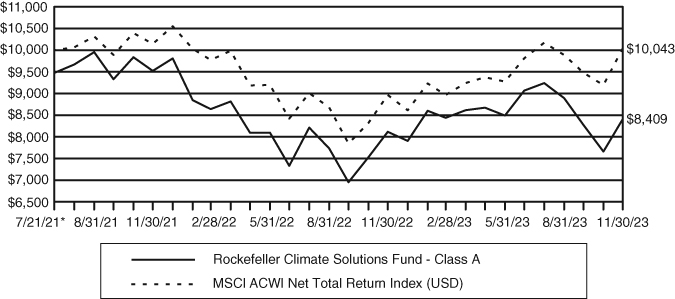
* Inception Date
Continued
12
Rockefeller US Small Cap Core Fund
Investment Highlights
November 30, 2023 (Unaudited)
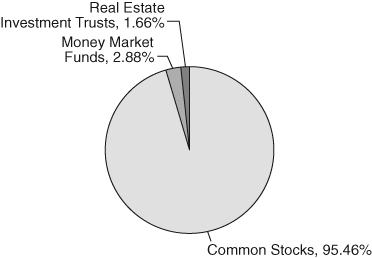
The Fund seeks long-term capital appreciation principally through equity investments in U.S. small capitalization companies. Rockefeller & Co., LLC (the “Adviser”) considers equity securities to include common stocks, preferred stocks, rights, depositary receipts such as American Depositary Receipts and Global Depositary Receipts. The Adviser considers its investable universe to be any company within or outside the Russell 2000® Index.
Allocation of Portfolio Holdings as of November 30, 2023
(% of Investments)
Average Annual Returns as of November 30, 2023
| Russell 2000 | |||
| Total Return | |||
Class A(1) | Class I(1) | Index | |
| Since Inception | -4.40% | -4.30% | -9.15% |
(1) | The Class A and Class I shares commenced operations on July 31, 2023. |
Performance data quoted represents past performance and does not guarantee future results. The investment return and principal value of an investment will fluctuate so that an investor’s shares, when redeemed, may be worth more or less than their original cost. Current performance of the Fund may be lower or higher than the performance quoted. Performance data current to the most recent month-end may be obtained by calling 855-369-6209.
Short-term performance, in particular, is not a good indication of the Fund’s future performance, and an investment should not be made based solely on historical returns.
Investment performance reflects fee waivers in effect. In the absence of such waivers, total return would be reduced.
The returns shown assume reinvestment of Fund distributions and do not reflect the deduction of taxes that a shareholder would pay on Fund distributions or the redemption of Fund shares. The following chart illustrates performance of a hypothetical investment made in the Fund and a broad-based securities index on the Fund’s inception date. The graph does not reflect any future performance.
The Russell 2000® Total Return Index measures the performance of the small-cap segment of the U.S. equity universe. The Russell 2000® Total Return Index is a subset of the Russell 3000® Total Return Index.
13
Rockefeller US Small Cap Core Fund
Investment Highlights (Continued)
November 30, 2023 (Unaudited)
Growth of $1,000,000 Investment
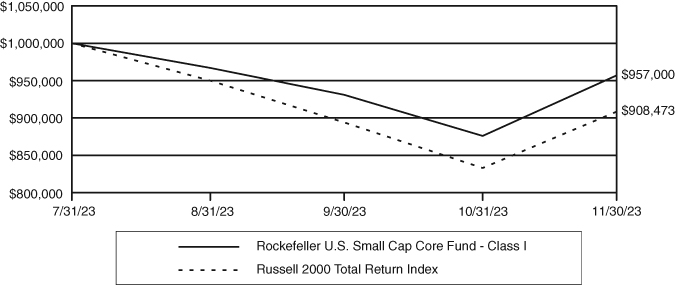
Growth of $10,000 Investment
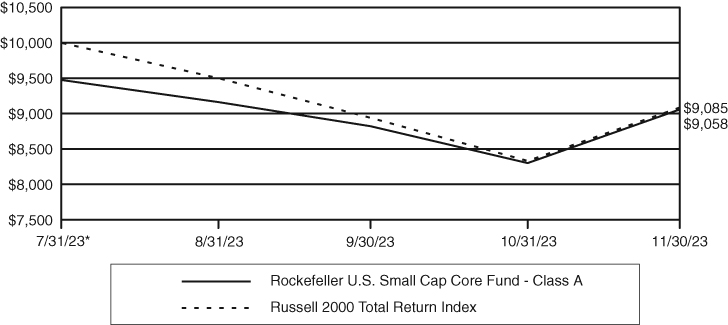
* Inception Date
Continued
14
Rockefeller Climate Solutions Fund
| Schedule of Investments |
November 30, 2023
| Shares | Value | |||||||
| COMMON STOCKS – 95.96% | ||||||||
| Building Products – 9.67% | ||||||||
| A. O. Smith Corp. | 27,740 | $ | 2,090,486 | |||||
| AAON, Inc. | 13,914 | 871,016 | ||||||
| AZEK Co., Inc. (a) | 41,303 | 1,424,541 | ||||||
| Cie de Saint-Gobain | 39,238 | 2,558,146 | ||||||
| Geberit AG | 2,135 | 1,197,765 | ||||||
8,141,954 | ||||||||
| Capital Markets – 2.15% | ||||||||
| StoneX Group, Inc. (a) | 29,538 | 1,805,658 | ||||||
| Chemicals – 4.44% | ||||||||
| Air Products and Chemicals, Inc. | 8,719 | 2,358,925 | ||||||
| DSM-Firmenich AG | 14,587 | 1,378,372 | ||||||
3,737,297 | ||||||||
| Commercial Services & Supplies – 5.49% | ||||||||
| Rentokil Initial PLC | 317,126 | 1,722,148 | ||||||
| Tetra Tech, Inc. | 10,850 | 1,715,927 | ||||||
| Veralto Corp. (a) | 15,303 | 1,182,157 | ||||||
4,620,232 | ||||||||
| Construction & Engineering – 2.67% | ||||||||
| MasTec, Inc. (a) | 15,347 | 930,642 | ||||||
| Stantec, Inc. | 17,711 | 1,319,825 | ||||||
2,250,467 | ||||||||
| Diversified Telecommunication Services – 1.37% | ||||||||
| Iridium Communications, Inc. | 30,255 | 1,152,716 | ||||||
| Electric Utilities – 3.44% | ||||||||
| SSE PLC | 124,943 | 2,894,991 | ||||||
| Electrical Equipment – 7.78% | ||||||||
| Array Technologies, Inc. (a) | 38,121 | 589,732 | ||||||
| Atkore, Inc. (a) | 13,488 | 1,752,091 | ||||||
| Schneider Electric SE | 14,774 | 2,719,181 | ||||||
| Vestas Wind Systems AS (a) | 53,918 | 1,490,868 | ||||||
6,551,872 | ||||||||
| Electronic Equipment, Instruments & Components – 11.46% | ||||||||
| Badger Meter, Inc. | 16,581 | 2,443,542 | ||||||
| Halma PLC | 64,638 | 1,744,427 | ||||||
| TE Connectivity Ltd. | 10,727 | 1,405,237 | ||||||
| Teledyne Technologies, Inc. (a) | 4,276 | 1,723,057 | ||||||
| Trimble, Inc. (a) | 50,269 | 2,332,482 | ||||||
9,648,745 | ||||||||
The accompanying notes are an integral part of these financial statements.
15
Rockefeller Climate Solutions Fund
| Schedule of Investments (Continued) |
November 30, 2023
| Shares | Value | |||||||
| Food Products – 4.99% | ||||||||
| Bakkafrost P/F | 40,244 | $ | 1,940,343 | |||||
| Darling Ingredients, Inc. (a) | 51,444 | 2,256,848 | ||||||
4,197,191 | ||||||||
| Hotels, Restaurants & Leisure – 0.72% | ||||||||
| Sweetgreen, Inc. – Class A (a) | 64,217 | 604,282 | ||||||
| Independent Power & Renewable Electricity Producers – 2.39% | ||||||||
| Brookfield Renewable Corp. – Class A | 31,939 | 847,661 | ||||||
| Sunnova Energy International, Inc. (a) | 100,016 | 1,160,186 | ||||||
2,007,847 | ||||||||
| Industrial Conglomerates – 1.73% | ||||||||
| Hitachi Ltd. | 20,900 | 1,453,204 | ||||||
| Life Sciences Tools & Services – 8.23% | ||||||||
| Agilent Technologies, Inc. | 17,628 | 2,252,858 | ||||||
| Danaher Corp. | 14,254 | 3,183,061 | ||||||
| Eurofins Scientific SE (a) | 25,599 | 1,489,198 | ||||||
6,925,117 | ||||||||
| Machinery – 14.49% | ||||||||
| ATS Corp. (a) | 41,203 | 1,621,764 | ||||||
| Kubota Corp. | 94,200 | 1,352,970 | ||||||
| Mueller Industries, Inc. | 76,604 | 3,181,364 | ||||||
| Mueller Water Products, Inc. – Class A | 96,653 | 1,284,518 | ||||||
| Pentair PLC | 23,032 | 1,486,485 | ||||||
| Timken Co. | 24,067 | 1,742,451 | ||||||
| Xylem, Inc./NY | 14,517 | 1,526,172 | ||||||
12,195,724 | ||||||||
| Multi-Utilities – 1.69% | ||||||||
| WEC Energy Group, Inc. | 16,990 | 1,420,704 | ||||||
| Professional Services – 6.13% | ||||||||
| Bureau Veritas SA | 112,111 | 2,714,294 | ||||||
| Verisk Analytics, Inc. | 10,113 | 2,441,582 | ||||||
5,155,876 | ||||||||
| Semiconductors & Semiconductor Equipment – 0.73% | ||||||||
| Enphase Energy, Inc. (a) | 6,118 | 618,040 | ||||||
| Software – 5.11% | ||||||||
| ANSYS, Inc. (a) | 5,562 | 1,631,668 | ||||||
| Bentley Systems, Inc. – Class B | 25,412 | 1,322,949 | ||||||
| Roper Technologies, Inc. | 2,504 | 1,347,778 | ||||||
4,302,395 | ||||||||
The accompanying notes are an integral part of these financial statements.
16
Rockefeller Climate Solutions Fund
| Schedule of Investments (Continued) |
November 30, 2023
| Shares | Value | |||||||
| Water Utilities – 1.28% | ||||||||
| American Water Works Co., Inc. | 8,194 | $ | 1,080,297 | |||||
| Total Common Stocks (Cost $84,216,128) | 80,764,609 | |||||||
| REAL ESTATE INVESTMENT TRUSTS – 1.10% | ||||||||
| Mortgage Real Estate Investment Trusts (REITs) – 1.10% | ||||||||
| Hannon Armstrong Sustainable Infrastructure Capital, Inc. | 38,367 | 928,865 | ||||||
| Total Real Estate Investment Trusts (Cost $1,723,144) | 928,865 | |||||||
| MONEY MARKET FUNDS – 2.90% | ||||||||
| Invesco Government & Agency Portfolio – | ||||||||
| Institutional Class, 5.282% (b) | 2,437,456 | 2,437,456 | ||||||
| Total Money Market Funds (Cost $2,437,456) | 2,437,456 | |||||||
| Total Investments (Cost $88,376,728) – 99.96% | 84,130,930 | |||||||
| Other Assets in Excess of Liabilities – 0.04% | 36,777 | |||||||
| Total Net Assets – 100.00% | $ | 84,167,707 | ||||||
Percentages are stated as a percent of net assets.
| AG | Aktiengesellschaft is a German term that refers to a corporation that is limited by shares, i.e. owned by shareholders. |
| PLC | Public Limited Company |
| SA | An abbreviation used by many countries to signify a stock company whereby shareholders have limited liability. |
| SE | Societas Europaea is a term for a European Public Liability Company. |
| (a) | Non-income producing security. |
| (b) | The rate shown represents the seven-day yield as of November 30, 2023. |
The Global Industry Classification Standard (GICS®) was developed by and/or is the exclusive property of MSCI, Inc. (“MSCI”) and Standard & Poor’s Financial Services LLC (“S&P”). GICS is a service mark of MSCI and S&P and has been licensed for use by U.S. Bancorp Fund Services, LLC.
The accompanying notes are an integral part of these financial statements.
17
Rockefeller US Small Cap Core Fund
| Schedule of Investments |
November 30, 2023
| Shares | Value | |||||||
| COMMON STOCKS – 95.88% | ||||||||
| Automobile Components – 4.36% | ||||||||
| Gentherm, Inc. (a) | 35,919 | $ | 1,649,400 | |||||
| XPEL, Inc. (a) | 22,754 | 1,039,858 | ||||||
2,689,258 | ||||||||
| Banks – 2.20% | ||||||||
| First Bancorp. | 43,233 | 1,354,922 | ||||||
| Building Products – 4.50% | ||||||||
| AAON, Inc. | 19,341 | 1,210,747 | ||||||
| AZEK Co., Inc. (a) | 45,346 | 1,563,983 | ||||||
2,774,730 | ||||||||
| Capital Markets – 9.37% | ||||||||
| Donnelley Financial Solutions, Inc. (a) | 37,446 | 2,210,063 | ||||||
| PJT Partners, Inc. – Class A | 21,477 | 1,934,219 | ||||||
| StoneX Group, Inc. (a) | 26,817 | 1,639,323 | ||||||
5,783,605 | ||||||||
| Communications Equipment – 1.54% | ||||||||
| Calix, Inc. (a) | 24,542 | 947,076 | ||||||
| Consumer Finance – 3.47% | ||||||||
| FirstCash Holdings, Inc. | 19,125 | 2,142,000 | ||||||
| Diversified Consumer Services – 4.12% | ||||||||
| Stride, Inc. (a) | 41,906 | 2,538,665 | ||||||
| Electrical Equipment – 3.29% | ||||||||
| Atkore, Inc. (a) | 15,603 | 2,026,830 | ||||||
| Electronic Equipment, Instruments & Components – 7.07% | ||||||||
| Badger Meter, Inc. | 8,289 | 1,221,550 | ||||||
| CTS Corp. | 32,018 | 1,240,698 | ||||||
| Insight Enterprises, Inc. (a) | 12,514 | 1,894,869 | ||||||
4,357,117 | ||||||||
| Financial Services – 3.89% | ||||||||
| AvidXchange Holdings, Inc. (a) | 18,070 | 192,807 | ||||||
| International Money Express, Inc. (a) | 53,473 | 1,114,912 | ||||||
| Walker & Dunlop, Inc. | 12,943 | 1,087,471 | ||||||
2,395,190 | ||||||||
The accompanying notes are an integral part of these financial statements.
18
Rockefeller US Small Cap Core Fund
| Schedule of Investments (Continued) |
November 30, 2023
| Shares | Value | |||||||
| Food Products – 2.01% | ||||||||
| SunOpta, Inc. (a) | 250,299 | $ | 1,236,477 | |||||
| Gas Utilities – 2.27% | ||||||||
| ONE Gas, Inc. | 24,298 | 1,400,294 | ||||||
| Ground Transportation – 1.82% | ||||||||
| ArcBest Corp. | 9,426 | 1,123,485 | ||||||
| Health Care Equipment & Supplies – 5.61% | ||||||||
| Merit Medical Systems, Inc. (a) | 34,131 | 2,442,415 | ||||||
| Omnicell, Inc. (a) | 30,393 | 1,013,910 | ||||||
3,456,325 | ||||||||
| Health Care Providers & Services – 7.92% | ||||||||
| Progyny, Inc. (a) | 66,800 | 2,295,248 | ||||||
| RadNet, Inc. (a) | 33,644 | 1,117,990 | ||||||
| US Physical Therapy, Inc. | 17,390 | 1,478,672 | ||||||
4,891,910 | ||||||||
| Insurance – 3.94% | ||||||||
| BRP Group, Inc. – Class A (a) | 43,970 | 769,035 | ||||||
| Stewart Information Services Corp. | 35,106 | 1,658,759 | ||||||
2,427,794 | ||||||||
| IT Services – 2.56% | ||||||||
| Perficient, Inc. (a) | 25,517 | 1,578,992 | ||||||
| Machinery – 9.36% | ||||||||
| ATS Corp. (a) | 48,272 | 1,895,159 | ||||||
| Enpro Industries, Inc. | 13,165 | 1,690,781 | ||||||
| Mueller Industries, Inc. | 52,604 | 2,184,644 | ||||||
5,770,584 | ||||||||
| Media – 2.51% | ||||||||
| TechTarget, Inc. (a) | 52,335 | 1,549,116 | ||||||
| Professional Services – 5.03% | ||||||||
| Huron Consulting Group, Inc. (a) | 12,189 | 1,269,728 | ||||||
| Korn Ferry | 19,016 | 983,888 | ||||||
| Paycor HCM, Inc. (a) | 39,820 | 844,582 | ||||||
3,098,198 | ||||||||
| �� | ||||||||
| Semiconductors & Semiconductor Equipment – 1.00% | ||||||||
| Onto Innovation, Inc. (a) | 4,388 | 618,752 | ||||||
The accompanying notes are an integral part of these financial statements.
19
Rockefeller US Small Cap Core Fund
| Schedule of Investments (Continued) |
November 30, 2023
| Shares | Value | |||||||
| Software – 4.74% | ||||||||
| PROS Holdings, Inc. (a) | 79,931 | $ | 2,921,478 | |||||
| Textiles, Apparel & Luxury Goods – 1.82% | ||||||||
| Carter’s, Inc. | 16,415 | 1,119,339 | ||||||
| Trading Companies & Distributors – 1.48% | ||||||||
| Applied Industrial Technologies, Inc. | 5,689 | 910,638 | ||||||
| Total Common Stocks (Cost $61,470,039) | 59,112,775 | |||||||
| REAL ESTATE INVESTMENT TRUSTS – 1.67% | ||||||||
| Mortgage Real Estate Investment Trusts (REITs) – 1.67% | ||||||||
| Hannon Armstrong Sustainable Infrastructure Capital, Inc. | 42,420 | 1,026,988 | ||||||
| Total Real Estate Investment Trusts (Cost $1,017,388) | 1,026,988 | |||||||
| MONEY MARKET FUNDS – 2.89% | ||||||||
| Invesco Government & Agency Portfolio – | ||||||||
| Institutional Class, 5.282% (b) | 1,781,212 | 1,781,212 | ||||||
| Total Money Market Funds (Cost $1,781,212) | 1,781,212 | |||||||
| Total Investments (Cost $64,268,639) – 100.44% | 61,920,975 | |||||||
| Liabilities in Excess of Other Assets – (0.44)% | (270,694 | ) | ||||||
| Total Net Assets – 100.00% | $ | 61,650,281 | ||||||
Percentages are stated as a percent of net assets.
| (a) | Non-income producing security. |
| (b) | The rate shown represents the seven-day yield as of November 30, 2023. |
The Global Industry Classification Standard (GICS®) was developed by and/or is the exclusive property of MSCI, Inc. (“MSCI”) and Standard & Poor’s Financial Services LLC (“S&P”). GICS is a service mark of MSCI and S&P and has been licensed for use by U.S. Bancorp Fund Services, LLC.
The accompanying notes are an integral part of these financial statements.
20
Rockefeller Funds
| Statements of Assets and Liabilities |
November 30, 2023
| Rockefeller | Rockefeller | |||||||
| Climate | US Small Cap | |||||||
| Solutions Fund | Core Fund | |||||||
| Assets | ||||||||
Investments, at value (cost $88,376,728 and | ||||||||
64,268,639 respectively) | $ | 84,130,930 | $ | 61,920,975 | ||||
Dividends and interest receivable | 145,580 | 60,805 | ||||||
Receivable for capital shares sold | 11,109 | 121,780 | ||||||
Other assets | 24,735 | 36,990 | ||||||
| Total Assets | 84,312,354 | 62,140,550 | ||||||
| Liabilities | ||||||||
Payable to affiliates | 55,696 | 39,836 | ||||||
Payable to adviser | 41,795 | 14,434 | ||||||
Audit fees payable | 37,050 | 37,050 | ||||||
Payable for fund shares redeemed | 7,244 | 120,625 | ||||||
Payable for 12b-1 fees – Class A | 82 | 76 | ||||||
Payable for investments purchased | — | 265,740 | ||||||
Accrued expenses and other liabilities | 2,780 | 12,508 | ||||||
| Total Liabilities | 144,647 | 490,269 | ||||||
| Net Assets | $ | 84,167,707 | $ | 61,650,281 | ||||
| Net Assets Consist of: | ||||||||
Paid-in capital | $ | 73,312,342 | $ | 64,226,914 | ||||
Total distributable earnings (accumulated losses) | 10,855,365 | (2,576,633 | ) | |||||
| Net Assets | $ | 84,167,707 | $ | 61,650,281 | ||||
| Institutional Class | ||||||||
| Net assets | $ | 83,943,703 | $ | — | ||||
| Shares of beneficial interest outstanding | ||||||||
| (unlimited shares authorized, $0.001 par value) | 9,455,655 | — | ||||||
| Net asset value, redemption price and | ||||||||
| offering price per share | $ | 8.88 | $ | — | ||||
| Class A | ||||||||
| Net assets | $ | 224,004 | $ | 101,878 | ||||
| Shares of beneficial interest outstanding | ||||||||
| (unlimited shares authorized, $0.001 par value) | 25,344 | 10,654 | ||||||
| Net asset value, redemption price and | ||||||||
| offering price per share | $ | 8.84 | $ | 9.56 | ||||
| Class I | ||||||||
| Net assets | $ | — | $ | 61,548,403 | ||||
| Shares of beneficial interest outstanding | ||||||||
| (unlimited shares authorized, $0.001 par value) | — | 6,433,464 | ||||||
| Net asset value, redemption price and | ||||||||
| offering price per share | $ | — | $ | 9.57 | ||||
The accompanying notes are an integral part of these financial statements.
21
Rockefeller Funds
| Statements of Operations |
Year/Period Ended November 30, 2023
| Rockefeller | Rockefeller | |||||||
| Climate | US Small Cap | |||||||
| Solutions Fund | Core Fund(1) | |||||||
| Investment Income | ||||||||
Dividend income | $ | 1,238,210 | $ | 177,386 | ||||
Less: Foreign withholding taxes and issuance fees | (104,481 | ) | — | |||||
Interest income | 86,871 | 36,917 | ||||||
| Total Investment Income | 1,220,600 | 214,303 | ||||||
| Expenses | ||||||||
Management fees | 714,998 | 162,223 | ||||||
Administration and accounting fees | 126,794 | 30,968 | ||||||
Transfer agent fees and expenses | 66,093 | 19,555 | ||||||
Audit and tax fees | 37,368 | 37,050 | ||||||
Federal & state registration fees | 32,415 | 24,663 | ||||||
Trustees' fees | 27,921 | 4,498 | ||||||
Custody fees | 24,476 | 4,235 | ||||||
Legal fees | 24,386 | 4,536 | ||||||
Chief Compliance Officer fees | 14,924 | 4,792 | ||||||
Pricing fees | 6,215 | 452 | ||||||
Insurance expense | 4,920 | 1,579 | ||||||
Reports to shareholders | 1,635 | 547 | ||||||
12b-1 fees – Class A | 715 | 76 | ||||||
Other expenses | 15,984 | 2,178 | ||||||
Total expenses | 1,098,844 | 297,352 | ||||||
Expense Waiver by Adviser (Note 4) | (260,048 | ) | (115,968 | ) | ||||
| Net expenses | 838,796 | 181,384 | ||||||
| Net Investment Income | 381,804 | 32,919 | ||||||
| Realized and Unrealized Gain (Loss) on Investments | ||||||||
Net realized gain/(loss) from: | ||||||||
| Investments | (4,088,403 | ) | (261,888 | ) | ||||
| Foreign currency | (19,018 | ) | — | |||||
Net change in unrealized appreciation/(depreciation) on: | ||||||||
| Investments | 6,966,766 | (2,347,664 | ) | |||||
| Foreign currency | 452 | — | ||||||
| Net Realized and Unrealized Gain (Loss) on Investments | 2,859,797 | (2,609,552 | ) | |||||
| Net Increase (Decrease) in Net Assets from Operations | $ | 3,241,601 | $ | (2,576,633 | ) | |||
(1) | The Fund commenced operations on July 31, 2023. |
The accompanying notes are an integral part of these financial statements.
22
Rockefeller Climate Solutions Fund
| Statements of Changes in Net Assets |
| Year Ended | Year Ended | |||||||
| November 30, 2023 | November 30, 2022 | |||||||
| From Operations | ||||||||
| Net investment income | $ | 381,804 | $ | 296,953 | ||||
| Net realized loss from investments | ||||||||
| and foreign currency translation | (4,107,421 | ) | (5,955,240 | ) | ||||
| Net change in unrealized | ||||||||
| appreciation/(depreciation) on | ||||||||
| investment and foreign currency translation | 6,967,218 | (11,855,364 | ) | |||||
Net increase/(decrease) in | ||||||||
net assets from operations | 3,241,601 | (17,513,651 | ) | |||||
| From Distributions | ||||||||
| Net dividends and distributions | (123,855 | ) | (491,300 | ) | ||||
Net decrease in net assets resulting | ||||||||
from distributions paid | (123,855 | ) | (491,300 | ) | ||||
| From Capital Share Transactions | ||||||||
| Proceeds from shares sold – Class A | 9,550 | 726,666 | ||||||
| Proceeds from shares sold – Institutional Class | 13,096,439 | 8,695,113 | ||||||
| Reinvestments – Class A | — | 3,754 | ||||||
| Reinvestments – Institutional Class | 43,627 | 333,438 | ||||||
| Cost of shares redeemed – Class A | (923,590 | ) | (276,404 | ) | ||||
| Cost of shares redeemed – Institutional Class | (23,262,950 | ) | (13,512,820 | ) | ||||
Net decrease in net assets | ||||||||
from capital share transactions | (11,036,924 | ) | (4,030,253 | ) | ||||
| Total decrease in Net Assets | (7,919,178 | ) | (22,035,204 | ) | ||||
| Net Assets | ||||||||
| Beginning of Year | 92,086,885 | 114,122,089 | ||||||
| End of Year | $ | 84,167,707 | $ | 92,086,885 | ||||
The accompanying notes are an integral part of these financial statements.
23
Rockefeller US Small Cap Core Fund
| Statement of Changes in Net Assets |
| Period From | ||||
July 31, 2023(1) to | ||||
| November 30, 2023 | ||||
| From Operations | ||||
| Net investment income | $ | 32,919 | ||
| Net realized loss from investments | (261,888 | ) | ||
| Change in net unrealized depreciation from investments | (2,347,664 | ) | ||
Net decrease in net assets from operations | (2,576,633 | ) | ||
| From Capital Share Transactions | ||||
| Proceeds from shares sold – Class A | 105,000 | |||
| Proceeds from shares sold – Class I | 65,584,204 | |||
| Cost of shares redeemed – Class I | (1,462,290 | ) | ||
Net increase in net assets from capital share transactions | 64,226,914 | |||
| Total Increase in Net Assets | 61,650,281 | |||
| Net Assets | ||||
| Beginning of Year | — | |||
| End of Year | $ | 61,650,281 | ||
(1) | The Fund commenced operations on July 31, 2023. |
The accompanying notes are an integral part of these financial statements.
24
Rockefeller Climate Solutions Fund – Institutional Class
| Financial Highlights |
Per Share Data for a Share Outstanding Throughout Each Period
| Year Ended | Year Ended | Period Ended | ||||||||||
| November 30, | November 30, | November 30, | ||||||||||
| 2023 | 2022 | 2021(1) | ||||||||||
| Net Asset Value, Beginning of Period | $ | 8.56 | $ | 10.06 | $ | 10.00 | ||||||
| Income from investment operations: | ||||||||||||
Net investment income/(loss)(2) | 0.04 | 0.03 | (0.01 | ) | ||||||||
| Net realized and unrealized gain/(loss) | 0.29 | (1.49 | ) | 0.07 | ||||||||
Total from investment operations | 0.33 | (1.46 | ) | 0.06 | ||||||||
| Paid from net investment income | (0.01 | ) | — | — | ||||||||
| Paid from realized gains | — | (0.04 | ) | — | ||||||||
Total distributions paid | (0.01 | ) | (0.04 | ) | — | |||||||
| Net Asset Value, End of Period | $ | 8.88 | $ | 8.56 | $ | 10.06 | ||||||
| Total return | 3.87 | % | -14.55 | % | 0.58 | %(3) | ||||||
| Supplemental Data and Ratios: | ||||||||||||
Net assets at end of period (000’s) | $ | 83,944 | $ | 90,942 | $ | 113,235 | ||||||
Ratio of expenses to average net assets: | ||||||||||||
| Before waiver, expense reimbursement | 1.30 | % | 1.26 | % | 1.25 | %(4) | ||||||
| After waiver, expense reimbursement | 0.99 | % | 0.99 | % | 0.99 | %(4) | ||||||
Ratio of net investment income/(loss) | ||||||||||||
to average net assets: | ||||||||||||
| Before waiver, expense reimbursement | 0.15 | % | 0.04 | % | (0.69 | )%(4) | ||||||
| After waiver, expense reimbursement | 0.46 | % | 0.31 | % | (0.43 | )%(4) | ||||||
Portfolio turnover rate | 38.13 | % | 16.93 | % | 13.14 | %(5) | ||||||
(1) | Fund commenced operations on July 21, 2021. |
(2) | Net investment income per share has been calculated using the daily average shares method. |
(3) | Not annualized for periods less than one year. |
(4) | Annualized for periods less than one year. |
(5) | Portfolio turnover rate is not annualized and excludes the value of portfolio securities received as a result of in-kind subscriptions. |
The accompanying notes are an integral part of these financial statements.
25
Rockefeller Climate Solutions Fund – Class A
| Financial Highlights |
Per Share Data for a Share Outstanding Throughout Each Period
| Year Ended | Year Ended | Period Ended | ||||||||||
| November 30, | November 30, | November 30, | ||||||||||
| 2023 | 2022 | 2021(1) | ||||||||||
| Net Asset Value, Beginning of Period | $ | 8.53 | $ | 10.05 | $ | 10.00 | ||||||
| Income from investment operations: | ||||||||||||
Net investment income/(loss)(2) | 0.02 | 0.01 | (0.03 | ) | ||||||||
| Net realized and unrealized gain/(loss) | 0.29 | (1.49 | ) | 0.08 | ||||||||
Total from investment operations | 0.31 | (1.48 | ) | 0.05 | ||||||||
| Paid from net investment income | — | — | — | |||||||||
| Paid from realized gains | — | (0.04 | ) | — | ||||||||
Total distributions paid | — | (0.04 | ) | — | ||||||||
| Net Asset Value, End of Period | $ | 8.84 | $ | 8.53 | $ | 10.05 | ||||||
| Total return | 3.61 | % | -14.76 | % | 0.50 | %(3) | ||||||
| Supplemental Data and Ratios: | ||||||||||||
Net assets at end of period (000’s) | $ | 224 | $ | 1,145 | $ | 887 | ||||||
Ratio of expenses to average net assets: | ||||||||||||
| Before waiver, expense reimbursement | 1.55 | % | 1.53 | % | 1.56 | %(4) | ||||||
| After waiver, expense reimbursement | 1.24 | % | 1.24 | % | 1.24 | %(4) | ||||||
Ratio of net investment income/(loss) | ||||||||||||
to average net assets: | ||||||||||||
| Before waiver, expense reimbursement | (0.08 | )% | (0.19 | )% | (1.21 | )%(4) | ||||||
| After waiver, expense reimbursement | 0.23 | % | 0.08 | % | (0.89 | )%(4) | ||||||
Portfolio turnover rate | 38.13 | % | 16.93 | % | 13.14 | %(5) | ||||||
(1) | Fund commenced operations on July 21, 2021. |
(2) | Net investment income per share has been calculated using the daily average shares method. |
(3) | Not annualized for periods less than one year. |
(4) | Annualized for periods less than one year. |
(5) | Portfolio turnover rate is not annualized and excludes the value of portfolio securities received as a result of in-kind subscriptions. |
The accompanying notes are an integral part of these financial statements.
26
Rockefeller US Small Cap Core Fund – Class I
| Financial Highlights |
Per Share Data for a Share Outstanding Throughout the Period
| Period Ended | ||||
| November 30, | ||||
2023(1) | ||||
| Net Asset Value, Beginning of Period | $ | 10.00 | ||
| Income from investment operations: | ||||
Net investment income(2) | 0.01 | |||
| Net realized and unrealized gain/(loss) | (0.44 | ) | ||
Total from investment operations | (0.43 | ) | ||
| Net Asset Value, End of Period | $ | 9.57 | ||
Total Return(3) | -4.30 | % | ||
| Supplemental Data and Ratios: | ||||
Net assets at end of period (000’s) | $ | 61,548 | ||
Ratio of expenses to average net assets: | ||||
Before waiver, expense reimbursement(4) | 1.55 | % | ||
After waiver, expense reimbursement(4) | 0.95 | % | ||
Ratio of net investment income/(loss) to average net assets: | ||||
Before waiver, expense reimbursement(4) | (0.43 | )% | ||
After waiver, expense reimbursement(4) | 0.17 | % | ||
Portfolio turnover rate(5) | 19.77 | % | ||
(1) | Fund commenced operations on July 31, 2023. |
(2) | Net investment income per share has been calculated using the daily average shares method. |
(3) | Not annualized for periods less than one year. |
(4) | Annualized for periods less than one year. |
(5) | Portfolio turnover rate is not annualized and excludes the value of portfolio securities received as a result of in-kind subscriptions. |
The accompanying notes are an integral part of these financial statements.
27
Rockefeller US Small Cap Core Fund – Class A
| Financial Highlights |
Per Share Data for a Share Outstanding Throughout the Period
| Period Ended | ||||
| November 30, | ||||
2023(1) | ||||
| Net Asset Value, Beginning of Period | $ | 10.00 | ||
| Income from investment operations: | ||||
Net investment income(2) | — | |||
| Net realized and unrealized gain/(loss) | (0.44 | ) | ||
Total from investment operations | (0.44 | ) | ||
| Net Asset Value, End of Period | $ | 9.56 | ||
Total Return(3) | -4.40 | % | ||
| Supplemental Data and Ratios: | ||||
Net assets at end of period (000's) | $ | 102 | ||
Ratio of expenses to average net assets: | ||||
Before waiver, expense reimbursement(4) | 3.98 | % | ||
After waiver, expense reimbursement(4) | 1.20 | % | ||
Ratio of net investment income/(loss) to average net assets: | ||||
Before waiver, expense reimbursement(4) | (2.89 | )% | ||
After waiver, expense reimbursement(4) | (0.11 | )% | ||
Portfolio turnover rate(5) | 19.77 | % | ||
(1) | Fund commenced operations on July 31, 2023. |
(2) | Net investment income per share has been calculated using the daily average shares method. |
(3) | Not annualized for periods less than one year. |
(4) | Annualized for periods less than one year. |
(5) | Portfolio turnover rate is not annualized and excludes the value of portfolio securities received as a result of in-kind subscriptions. |
The accompanying notes are an integral part of these financial statements.
28
Rockefeller Funds
Notes to Financial Statements
November 30, 2023
| (1) | Organization |
| Trust for Professional Managers (the “Trust”) was organized as a Delaware statutory trust under a Declaration of Trust dated May 29, 2001. The Trust is registered under the Investment Company Act of 1940, as amended (the “1940 Act”), as an open-end management investment company. The Rockefeller Funds (the “Funds”) are comprised of the Rockefeller Climate Solutions Fund that commenced operations on July 21, 2021, and the Rockefeller US Small Cap Core Fund that commenced operations July 31, 2023. Each represents a distinct diversified series with its own investment objective and policies within the Trust. | |
| Effective July 21, 2021, the Rockefeller Climate Solutions Fund, L.P. (formerly, the Rockefeller Ocean Fund, L.P.) (the “Predecessor Fund”) was reorganized into the Rockefeller Climate Solutions Fund, a series of the Trust, by transferring all of the Predecessor Fund’s assets to the Fund in exchange solely for Institutional Class shares of the Fund. The Fund’s investment adviser, portfolio managers, investment objective, strategies, policies, guidelines and restrictions are, in all material respects, the same as those of the Predecessor Fund. | |
| The investment objective of the Rockefeller Climate Solutions Fund is to seek long-term growth of capital principally through equity investments in public companies across the market capitalization spectrum offering climate change mitigation or adaptation products and services. The investment objective of the Rockefeller US Small Cap Core Fund is to seek long-term capital appreciation principally through equity investments in U.S. small capitalization companies. The Trust may issue an unlimited number of shares of beneficial interest at $0.001 par value. Costs incurred by the Funds in connection with the organization, registration and initial public offering of shares were borne by the Adviser. | |
| (2) | Significant Accounting Policies |
| The following is a summary of significant accounting policies consistently followed by the Funds in the preparation of the financial statements. These policies are in conformity with accounting principles generally accepted in the United States of America (“GAAP”). | |
| The Funds are investment companies and accordingly follow the investment company accounting reporting guidance of the Financial Accounting Standards Board (FASB) Accounting Standard Codification Topic 946 “Financial Services-Investment Companies”. |
| (a) | Investment Valuation |
| Each equity security owned by the Funds that is listed on a securities exchange, except for securities listed on the NASDAQ Stock Market LLC (“NASDAQ”), is valued at its last sale price at the close of that exchange on the date as of which assets are valued. If a security is listed on more than one exchange, the Funds will use the price on the exchange that the Funds generally consider to be the principal exchange on which the security is traded. | |
| Fund securities, including common stocks, preferred stocks and exchange traded funds, listed on NASDAQ will be valued at the NASDAQ Official Closing Price, which |
29
Rockefeller Funds
Notes to Financial Statements (Continued)
November 30, 2023
| may not necessarily represent the last sale price. If, on a particular day, an exchange-listed or NASDAQ security does not trade, then: (i) the security is valued at the mean between the most recent quoted bid and asked prices at the close of the exchange on such day; or (ii) the security is valued at the latest sales price on the Composite Market for the day such security is being valued. “Composite Market” means a consolidation of the trade information provided by national securities and foreign exchanges and the over-the-counter markets as published by an approved independent pricing service (“Pricing Service”). | |
| Foreign securities will be priced in their local currencies as of the close of their primary exchange or market or as of the time each Fund calculates its NAV, whichever is earlier. Foreign securities, currencies and other assets denominated in foreign currencies are then translated into U.S. dollars at the exchange rate of such currencies against the U.S. dollar using the applicable currency exchange rates as of the close of the New York Stock Exchange (“NYSE”), generally 4:00 p.m. Eastern Time. | |
| Foreign securities are traded on foreign exchanges which typically close before the close of business on each day on which the NYSE is open. Each security trading on these exchanges may be valued utilizing a systematic fair valuation model provided by a pricing service. The valuation of each security that meets certain criteria in relation to the valuation model is systematically adjusted to reflect the impact of movement in the U.S. market after the foreign markets close and are classified as Level 2 securities. Securities that do not meet the criteria, or that are principally traded in other foreign markets, are valued as of the last reported sale price at the time the respective Fund determines its NAV, or when reliable market prices or quotations are not readily available, at the mean between the most recent bid and asked quotations as of the close of the appropriate exchange or other designated time. | |
| Debt securities, including short-term debt instruments having a maturity of 60 days or less, are generally valued at the mean in accordance with prices provided by a Pricing Service. Pricing Services may use various valuation methodologies such as the mean between the bid and the asked prices, matrix pricing and other analytical pricing models as well as market transactions and dealer quotations. If a price is not available from a Pricing Service, the most recent quotation obtained from one or more brokerdealers known to follow the issue will be obtained. Quotations will be valued at the mean between the bid and the offer. In the absence of available quotations, the securities will be priced at fair value, as described below. | |
| When market quotations are not readily available, any security or other asset is valued at its fair value in accordance with Rule 2a-5 of the 1940 Act as determined under the Adviser's fair value pricing procedures, subject to oversight by the Board of Trustees. These fair value pricing procedures will also be used to price a security when corporate events, events in the securities market and/or world events cause the Adviser to believe that a security’s last sale price may not reflect its actual fair market value. The intended effect of using fair value pricing procedures is to ensure that the Funds are accurately priced. The Adviser will regularly evaluate whether the Funds’ fair value pricing procedures continue to be appropriate in light of the specific circumstances of the Funds and the quality of prices obtained through the application of such procedures. |
30
Rockefeller Funds
Notes to Financial Statements (Continued)
November 30, 2023
| The Funds have adopted Statement of Financial Accounting Standards, “Fair Value Measurements and Disclosures,” which requires each Fund to classify its securities based on a valuation method. These inputs are summarized in the three broad levels listed below: |
| Level 1— | Quoted prices in active markets for identical securities. | ||
| Level 2— | Other significant observable inputs (including quoted prices for similar securities, interest rates, prepayment speeds, credit risk, etc.). | ||
| Level 3— | Significant unobservable inputs (including the Funds’ own assumptions in determining the fair value of investments). |
| The inputs or methodology used for valuing securities are not necessarily an indication of the risk associated with investing in those securities. The following is a summary of the inputs used to value the Funds’ investments carried at fair value as of November 30, 2023: |
| Rockefeller Climate Solutions Fund | |||||||||||||||||
| Level 1 | Level 2 | Level 3 | Total | ||||||||||||||
Assets(1): | |||||||||||||||||
| Equities: | |||||||||||||||||
Common Stocks | $ | 56,108,703 | $ | 24,655,906 | $ | — | $ | 80,764,609 | |||||||||
Real Estate Investment Trusts | 928,865 | — | — | 928,865 | |||||||||||||
| Total Equity Securities | 57,037,568 | 24,655,906 | — | 81,693,474 | |||||||||||||
| Money Market Funds | 2,437,456 | — | — | 2,437,456 | |||||||||||||
| Total Investments in Securities | $ | 59,475,024 | $ | 24,655,906 | $ | — | $ | 84,130,930 | |||||||||
| Rockefeller US Small Cap Core Fund | |||||||||||||||||
| Level 1 | Level 2 | Level 3 | Total | ||||||||||||||
Assets(1): | |||||||||||||||||
| Equities: | |||||||||||||||||
Common Stocks | $ | 59,112,775 | $ | — | $ | — | $ | 59,112,775 | |||||||||
Real Estate Investment Trusts | 1,026,988 | — | — | 1,026,988 | |||||||||||||
| Total Equity Securities | 60,139,763 | — | — | 60,139,763 | |||||||||||||
| Money Market Funds | 1,781,212 | — | — | 1,781,212 | |||||||||||||
| Total Investments in Securities | $ | 61,920,975 | $ | — | $ | — | $ | 61,920,975 | |||||||||
(1) | See the Schedule of Investments for industry classifications. |
| The Funds held no Level 3 securities during the year ended November 30, 2023. | |
| The Funds did not invest in derivative securities or engage in hedging activities during the year ended November 30, 2023. |
| (b) | Federal Income Taxes |
| The Funds comply with the requirements of Subchapter M of the Internal Revenue Code of 1986, as amended the (“Code”), necessary to qualify as a regulated investment company and make the requisite distributions of income and capital gains to shareholders sufficient to relieve them from all or substantially all federal income taxes. Therefore, no federal income tax provision has been provided. |
31
Rockefeller Funds
Notes to Financial Statements (Continued)
November 30, 2023
| (c) | Distributions to Shareholders | |
| The Funds will distribute net investment income (less operation expenses) and net capital gains at least annually. Distributions from net realized gains for book purposes may include short-term capital gains. All short-term capital gains are included in ordinary income for tax purposes. Distributions to shareholders are recorded on the ex-dividend date. The Funds may also pay a special distribution at the end of the calendar year to comply with federal tax requirements. | ||
| The amounts of dividends from net investment income and distributions from net realized gains are determined in accordance with federal income tax regulations, which may differ from GAAP. These differences are either temporary or permanent in nature. To the extent these differences are permanent in nature, such amounts are reclassified within the composition of net assets based on their federal tax-basis treatment. | ||
| (d) | Use of Estimates | |
| The preparation of financial statements in conformity with GAAP requires management to make estimates and assumptions that affect the reported amounts of assets and liabilities and disclosure of contingent assets and liabilities at the date of the financial statements and the reported amounts of revenues and expenses during the reporting period. Actual results could differ from those estimates. | ||
| (e) | Share Valuation | |
| The NAV per share of each Fund is calculated by dividing the sum of the value of the securities held by the Fund, plus cash or other assets, minus all liabilities (including estimated accrued expenses) by the total number of shares outstanding, rounded to the nearest cent. The Funds’ shares will not be priced on the days on which the NYSE is closed for trading. The offering and redemption price per share for the Funds is equal to each Fund’s NAV per share. | ||
| (f) | Expenses | |
| Expenses associated with a specific fund in the Trust are charged to that fund. Expenses are recognized on an accrual basis. Common expenses are typically allocated evenly between the series of the Trust, or by other equitable means. | ||
| (g) | Other | |
| Investment transactions are recorded on the trade date. The Funds determine the gain or loss from investment transactions on a high amortized cost basis. Dividend income is recognized on the ex-dividend date and interest income is recognized on an accrual basis. Distributions received from the Funds’ investments in REITs are comprised of ordinary income, capital gains and return of capital, as applicable. For financial statement purposes, the Funds use estimates to characterize these distributions received as return of capital, capital gain or ordinary income. Such estimates are based on historical information available from each REIT and other industry sources. These estimates may subsequently be revised based on information received for the security after the tax reporting periods are concluded, as the actual | ||
32
Rockefeller Funds
Notes to Financial Statements (Continued)
November 30, 2023
| character of these distributions is not known until after the fiscal year end of the Funds. Changes to estimates will be recorded in the period they are known. The distributions received from REIT securities that have been classified as income and capital gains are included in dividend income and net realized gain on investments, respectively, on the Statement of Operations. The distributions received that are classified as return of capital reduced the cost of investments on the Statement of Assets and Liabilities. Any discount or premium is accreted or amortized using the constant yield method until maturity, or where applicable, the first call date of the security. Constant yield amortization takes into account the income that is produced on a debt security. This accretion/amortization type utilizes the discount rate used in computing the present value of all future principal and interest payments made by a debt instrument and produces an amount equal to the cost of the debt instrument. | |
| (3) | Federal Tax Matters |
| The tax character of distributions paid during the year ended November 30, 2023 was as follows: |
| Rockefeller | Rockefeller | ||||||||
| Climate | US Small Cap | ||||||||
| Solutions Fund | Core Fund | ||||||||
| Distributions paid from: | |||||||||
| Ordinary Income | $ | 123,855 | $ | — | |||||
| Long-Term Capital Gains | — | — | |||||||
| Total Distributions Paid | $ | 123,855 | $ | — | |||||
| As of November 30, 2023, the components of accumulated earnings (losses) for income tax purposes were as follows: |
| Rockefeller | Rockefeller | ||||||||
| Climate | US Small Cap | ||||||||
| Solutions Fund | Core Fund | ||||||||
| Cost basis of investments for | |||||||||
| federal income tax purposes | $ | 71,725,460 | $ | 64,315,359 | |||||
| Gross tax unrealized appreciation | 24,725,027 | 2,911,863 | |||||||
| Gross tax unrealized depreciation | (12,319,739 | ) | (5,306,247 | ) | |||||
| Net tax unrealized appreciation | 12,405,288 | (2,394,384 | ) | ||||||
| Undistributed ordinary income | 373,054 | 32,919 | |||||||
| Undistributed capital gains | — | — | |||||||
| Total other accumulated loss | (1,922,977 | ) | (215,168 | ) | |||||
| Total distributable earnings | $ | 10,855,365 | $ | (2,576,633 | ) | ||||
| The difference between cost amounts for financial statement and federal income tax purposes is due to wash sale and partnership adjustments and timing differences in recognizing certain gains and losses in security transactions. | |
| At November 30, 2023, the Funds had capital loss carryovers as follows: |
| Short-Term | Long-Term | ||||||||
| Rockefeller Climate Solutions Fund | 1,922,977 | — | |||||||
| Rockefeller US Small Cap Core Fund | 215,168 | — | |||||||
33
Rockefeller Funds
Notes to Financial Statements (Continued)
November 30, 2023
| As of November 30, 2023, the tax years that remain open to examination by major tax jurisdictions include tax years ended November 30, 2021 through November 30, 2023 (Rockefeller Climate Solutions Fund) and November 30, 2023 (Rockefeller US Small Cap Core Fund). The Funds are also not aware of any tax positions for which it is reasonably possible that the total amounts of unrecognized tax benefits will significantly change in the next year. The Funds recognize interest and penalties, if any, related to unrecognized tax benefits as income tax expense in the Statement of Operations. During the period, the Funds did not incur any interest or penalties, nor were any accrued as of November 30, 2023. | |
| GAAP requires that certain components of net assets relating to permanent differences be reclassified between financial and tax reporting. These reclassifications have no effect on net assets or NAV per share. For the year ended November 30, 2023, the following reclassifications were made for permanent tax differences on the Statement of Assets and Liabilities. |
| Rockefeller | Rockefeller | ||||||||
| Climate | US Small Cap | ||||||||
| Solutions Fund | Core Fund | ||||||||
| Total Distributable Earnings/(Losses) | $ | — | $ | — | |||||
| Paid-In Capital | — | — | |||||||
| (4) | Investment Adviser |
| The Trust has an Investment Advisory Agreement (the “Agreement”) with the Adviser to furnish investment advisory services to the Funds. Under the terms of the Agreement, the Funds compensate the Adviser for its management services at the annual rate of 0.85% of the average daily net assets of each Fund. | |
| The Adviser has contractually agreed to waive its management fee and/or reimburse a Fund’s other expenses through the expiration date listed below to the extent necessary to ensure that such Fund’s total annual operating expenses do not exceed the Fund’s Expense Limitation Cap, listed below, of the Fund’s average daily net assets. |
| Expense | Expiration | ||
Limitation Cap | Date | ||
| Rockefeller Climate Solutions Fund | 0.99% | March 31, 2025 | |
| Rockefeller US Small Cap Core Fund | 0.95% | July 31, 2024* |
| * | Beginning August 1, 2024, the Fund’s expense limitation cap will be 1.05% until March 31, 2025. |
| Any such waiver or reimbursement is subject to later adjustment to allow the Adviser to recover amounts waived or reimbursed to the extent actual fees and expenses for a fiscal period do not exceed the lesser of: (1) the Expense Limitation Cap in place at the time of the waiver and/or reimbursement; or (2) the Expense Limitation Cap in place at the time of recovery; provided, however, that the Adviser shall only be entitled to recover such amounts for a period of up to three years from the date such amount was waived or reimbursed. |
34
Rockefeller Funds
Notes to Financial Statements (Continued)
November 30, 2023
| The following table shows the remaining waived or reimbursed expenses subject to potential recovery expiring by: |
| Rockefeller | Rockefeller | ||||||||
| Climate | US Small Cap | ||||||||
| Solutions Fund | Core Fund | ||||||||
| November 30, 2024 | $ | 100,316 | $ | — | |||||
| November 30, 2025 | $ | 261,030 | $ | — | |||||
| November 30, 2026 | $ | 260,048 | $ | 115,968 | |||||
| (5) | Related Party Transactions |
| U.S. Bancorp Fund Services, LLC, doing business as U.S. Bank Global Fund Services (“Fund Services” or the “Administrator”), acts as the Funds’ Administrator under an Administration Agreement. The Administrator prepares various federal and state regulatory filings, reports and returns for the Funds; prepares reports and materials to be supplied to the Trustees; monitors the activities of the Funds’ custodian, transfer agent and accountants; coordinates the preparation and payment of the Fund's expenses; and reviews the Fund's expense accruals. Fund Services also serves as the fund accountant and transfer agent to the Fund. U.S. Bank National Association (“US Bank”), an affiliate of Fund Services, serves as the Fund’s custodian. The Trust’s Chief Compliance Officer is also an employee of Fund Services. Fees and expenses incurred for the period ended November 30, 2023, and owed as of November 30, 2023, are as follows: |
Administration & Accounting | Incurred | Owed | |||||||
| Rockefeller Climate Solutions Fund | $ | 126,794 | $ | 30,778 | |||||
| Rockefeller US Small Cap Core Fund | $ | 30,968 | $ | 21,937 | |||||
Pricing | Incurred | Owed | |||||||
| Rockefeller Climate Solutions Fund | $ | 6,215 | $ | 994 | |||||
| Rockefeller US Small Cap Core Fund | $ | 452 | $ | 332 | |||||
Transfer Agency | Incurred | Owed | |||||||
| Rockefeller Climate Solutions Fund | $ | 66,093 | $ | 15,906 | |||||
| Rockefeller US Small Cap Core Fund | $ | 19,555 | $ | 11,372 | |||||
Custody | Incurred | Owed | |||||||
| Rockefeller Climate Solutions Fund | $ | 24,476 | $ | 4,136 | |||||
| Rockefeller US Small Cap Core Fund | $ | 4,235 | $ | 2,445 | |||||
Chief Compliance Officer | Incurred | Owed | |||||||
| Rockefeller Climate Solutions Fund | $ | 14,924 | $ | 3,882 | |||||
| Rockefeller US Small Cap Core Fund | $ | 4,792 | $ | 3,750 | |||||
| The Rockefeller Climate Solutions Fund has a line of credit with US Bank (see Note 9). | |
| Certain officers of the Funds are also employees of Fund Services. | |
| (6) | Distribution Plan |
| The Trust has adopted a Distribution Plan pursuant to Rule 12b-1 under the 1940 Act (the “12b-1 Plan”), on behalf of the Class A shares of the Funds which authorizes the |
35
Rockefeller Funds
Notes to Financial Statements (Continued)
November 30, 2023
| Trust to pay Quasar Distributors, LLC (the “Distributor”), the Funds’ principal distributor, a distribution fee of 0.25% of the Funds’ average daily net assets of each Fund’s Class A shares. During the period ended November 30, 2023, the Class A shares incurred fees pursuant to the 12b-1 Plan of $715 for the Rockefeller Climate Solutions Fund and $76 for the Rockefeller US Small Cap Core Fund. | |
| (7) | Capital Share Transactions |
| Transactions in the shares of the Funds were as follows: |
| Rockefeller Climate Solutions Fund | |||||||||
| Year Ended | Year Ended | ||||||||
| November 30, 2023 | November 30, 2022 | ||||||||
| Class A | |||||||||
| Shares Sold | 1,025 | 79,448 | |||||||
| Shares Reinvested | — | 366 | |||||||
| Shares Redeemed | (109,844 | ) | (33,956 | ) | |||||
| Net increase (decrease) | (108,819 | ) | 45,858 | ||||||
| Year Ended | Year Ended | ||||||||
| November 30, 2023 | November 30, 2022 | ||||||||
| Institutional Class | |||||||||
| Shares Sold | 1,443,347 | 968,830 | |||||||
| Shares Reinvested | 5,256 | 32,467 | |||||||
| Shares Redeemed | (2,617,709 | ) | (1,635,005 | ) | |||||
| Net decrease | (1,169,106 | ) | (633,708 | ) | |||||
| Rockefeller US Small Cap Core Fund | ||||||
| Period Ended | ||||||
| November 30, 2023 | ||||||
| Class A | ||||||
| Shares Sold | 10,654 | |||||
| Shares Reinvested | — | |||||
| Shares Redeemed | — | |||||
| Net increase | 10,654 | |||||
| Period Ended | ||||||
| November 30, 2023 | ||||||
| Class I | ||||||
| Shares Sold | 6,591,654 | |||||
| Shares Reinvested | — | |||||
| Shares Redeemed | (158,190 | ) | ||||
| Net increase | 6,433,464 | |||||
36
Rockefeller Funds
Notes to Financial Statements (Continued)
November 30, 2023
| (8) | Investment Transactions |
| The aggregate securities transactions, excluding short-term investments and amounts transferred in-kind noted below, for the Funds for the period ended November 30, 2023 are listed below. |
| U.S. | U.S. | ||||||||||||||||
| Government | Government | ||||||||||||||||
| Securities | Securities | ||||||||||||||||
| Purchases | Sales | Purchases | Sales | ||||||||||||||
| Rockefeller Climate | |||||||||||||||||
| Solutions Fund | $ | 31,516,210 | $ | 42,420,436 | $ | — | $ | — | |||||||||
| Rockefeller US Small | |||||||||||||||||
| Cap Core Fund | $ | 74,194,882 | $ | 11,434,542 | $ | — | $ | — | |||||||||
| (9) | Line of Credit |
| As of November 30, 2023, the Rockefeller Climate Solutions Fund had a line of credit in the amount of $10,000,000, which will mature on August 3, 2024. This secured line of credit is intended to provide short-term financing, if necessary, and subject to certain restrictions, in connection with shareholder redemptions. The credit facility is with the Funds’ custodian, US Bank. Interest will accrue at the prime rate. The following table provides information regarding usage of the line of credit for the year ended November 30, 2023. The Fund did not have an outstanding balance on the line of credit as of November 30, 2023. |
| Average | Maximum | Date of | ||||
| Days | Amount of | Interest | Amount of | Maximum | ||
Utilized | Borrowing | Expense | Borrowing | Borrowing | ||
Rockefeller Climate | ||||||
Solutions Fund | 11 | $2,125,455 | $5,319 | $4,276,000 | 03/21/2023 |
| (10) | Recent Market Events |
| U.S. and international markets have experienced and may continue to experience significant periods of volatility in recent years and months due to a number of economic, political and global macro factors including uncertainty regarding inflation and central banks’ interest rate increases, the possibility of a national or global recession, trade tensions, political events, the war between Russia and Ukraine, significant conflict between Israel and Hamas in the Middle East, and the impact of the coronavirus (COVID-19) global pandemic. The impact of COVID-19 may last for an extended period of time. As a result of continuing political tensions and armed conflicts, including the war between Ukraine and Russia, the U.S. and the European Union imposed sanctions on certain Russian individuals and companies, including certain financial institutions, and have limited certain exports and imports to and from Russia. The war has contributed to recent market volatility and may continue to do so. These developments, as well as other events, could result in further market volatility and negatively affect financial asset prices, the liquidity of certain securities and the |
37
Rockefeller Funds
Notes to Financial Statements (Continued)
November 30, 2023
| normal operations of securities exchanges and other markets, despite government efforts to address market disruptions. Continuing market volatility as a result of recent market conditions or other events may have adverse effects on your account. | |
| (11) | Subsequent Events |
| The Funds have evaluated events and transactions that have occurred subsequent to November 30, 2023 and determined there were no subsequent events that would require recognition or disclosure within the financial statements other than as described below. | |
| On December 20, 2023, the Funds declared and paid distributions from ordinary income to shareholders of record as of December 19, 2023 as follows: |
| Ordinary | Short-Term | Long-Term | |||||||||||
| Income | Capital Gains | Capital Gains | |||||||||||
Rockefeller Climate Solutions Fund – | |||||||||||||
Class A | $ | 430 | $ | — | $ | — | |||||||
Rockefeller Climate Solutions Fund – | |||||||||||||
Institutional Class | 381,592 | — | — | ||||||||||
Rockefeller US Small Cap Core Fund – | |||||||||||||
Class A | — | — | — | ||||||||||
Rockefeller US Small Cap Core Fund – | |||||||||||||
Class I | 46,262 | — | — | ||||||||||
38
Rockefeller Funds
Report of Independent Registered Public Accounting Firm
To the Shareholders of the Rockefeller Funds and the
Board of Trustees of Trust for Professional Managers:
Opinion on the Financial Statements and Financial Highlights
We have audited the accompanying statement of assets and liabilities, including the schedules of investments, of the Rockefeller Funds, comprising of the Rockefeller Climate Solutions Fund and Rockefeller US Small Cap Core Fund (the “Funds”), each portfolios of the series constituting the Trust for Professional Managers, as of November 30, 2023; the related statement of operations for the year then ended, the statements of changes in net assets for each of the two years in the period then ended and the financial highlights for each of the two years in the period then ended and for the period from July 21, 2021 (commencement of operations) through November 30, 2021 for the Rockefeller Climate Solutions Fund; the related statements of operations, changes in net assets, and financial highlights for the period from July 31, 2023 (commencement of operations) through November 30, 2023, for the Rockefeller US Small Cap Core Fund; and the related notes. In our opinion, the financial statements and financial highlights present fairly, in all material respects, the financial position of the Rockefeller Climate Solutions Fund as of November 30, 2023; the results of its operations for the year then ended, the changes in its net assets for each of the two years in the period then ended, and the financial highlights for each of the two years in the period then ended and for the period from July 21, 2021 (commencement of operations) through November 30, 2021. Also in our opinion, the financial statements and financial highlights present fairly, in all material respects, the financial position of Rockefeller US Small Cap Core Fund as of November 30, 2023; and the results of its operations, changes in its net assets, and financial highlights for the period from July 31, 2023 (commencement of operations) through November 30, 2023 in conformity with accounting principles generally accepted in the United States of America.
Basis for Opinion
The financial statements and financial highlights are the responsibility of the Funds’ management. Our responsibility is to express an opinion on the Funds’ financial statements and financial highlights based on our audits. We are a public accounting firm registered with the Public Company Accounting Oversight Board (United States) (PCAOB) and are required to be independent with respect to the Funds in accordance with the U.S. federal securities laws and the applicable rules and regulations of the Securities and Exchange Commission and the PCAOB.
We conducted our audits in accordance with the standards of the PCAOB. Those standards require that we plan and perform the audit to obtain reasonable assurance about whether the financial statements and financial highlights are free of material misstatement, whether due to error or fraud. The Funds are not required to have, nor were we engaged to perform, an audit of their internal control over financial reporting. As part of our audits, we are required to obtain an understanding of internal control over financial reporting but not for the purpose of expressing an opinion on the effectiveness of the Funds’ internal control over financial reporting. Accordingly, we express no such opinion.
39
Rockefeller Funds
Report of Independent Registered Public Accounting Firm
(Continued)
Our audits included performing procedures to assess the risks of material misstatement of the financial statements and financial highlights, whether due to error or fraud, and performing procedures that respond to those risks. Such procedures included examining, on a test basis, evidence regarding the amounts and disclosures in the financial statements and financial highlights. Our audits also included evaluating the accounting principles used and significant estimates made by management, as well as evaluating the overall presentation of the financial statements and financial highlights. Our procedures included confirmation of securities owned as of November 30, 2023, by correspondence with the custodian and brokers; when replies were not received from brokers, we performed other auditing procedures. We believe that our audits provide a reasonable basis for our opinion.
/s/ Deloitte & Touche LLP
Chicago, Illinois
January 25, 2024
We have served as the auditor of one or more Trust for Professional Managers’ investment companies since 2002.
40
Rockefeller Climate Solutions Fund
Basis for Trustees’ Approval of Investment Advisory Agreement
(Unaudited)
The Board of Trustees (the “Trustees”) of Trust for Professional Managers (the “Trust”) met on August 17, 2023 to consider the renewal of the Investment Advisory Agreement (the “Agreement”) between the Trust, on behalf of the Rockefeller Climate Solutions Fund (the “Fund”), a series of the Trust, and Rockefeller & Co. LLC (“Rockefeller”), the Fund’s investment adviser (the “Adviser”). The Trustees also met at a prior meeting held on June 22, 2023 (the “June 22, 2023 meeting”) to review materials related to the renewal of the Agreement. Prior to these meetings, the Trustees requested and received materials to assist them in considering the renewal of the Agreement. The materials provided contained information with respect to the factors enumerated below, including a copy of the Agreement, a memorandum prepared by the Trust’s outside legal counsel discussing in detail the Trustees’ fiduciary obligations and the factors they should assess in considering the renewal of the Agreement, detailed comparative information relating to the Fund’s performance, as well as the management fees and other expenses of the Fund, due diligence materials relating to the Adviser (including a due diligence questionnaire completed on behalf of the Fund by the Adviser, the Adviser’s Form ADV, select financial statements of the Adviser, bibliographic information of the Adviser’s key management and compliance personnel, comparative fee information for the Fund and the Adviser’s other separately-managed accounts and a summary detailing key provisions of the Adviser’s written compliance program, including its code of ethics) and other pertinent information. The Trustees also received information periodically throughout the year that was relevant to the Agreement renewal process, including performance, management fee and other expense information. Based on their evaluation of the information provided by the Adviser, in conjunction with the Fund’s other service providers, the Trustees, by a unanimous vote (including a separate vote of the Trustees who are not “interested persons,” as that term is defined in the Investment Company Act of 1940, as amended (the “Independent Trustees”)), approved the continuation of the Agreement for an additional one-year term ending August 31, 2024.
DISCUSSION OF FACTORS CONSIDERED
In considering the renewal of the Agreement and reaching their conclusions, the Trustees reviewed and analyzed various factors that they determined were relevant, including the factors enumerated below.
| 1. | NATURE, EXTENT AND QUALITY OF SERVICES PROVIDED TO THE FUND |
The Trustees considered the nature, extent and quality of services provided by the Adviser to the Fund and the amount of time devoted to the Fund’s operation by the Adviser’s staff. The Trustees considered the Adviser’s specific responsibilities in all aspects of day-to-day management of the Fund, including the investment strategies implemented by the Adviser, as well as the qualifications, experience and responsibilities of Rolando F. Morillo and Jose Garza, the Fund’s portfolio managers, and other key personnel at the Adviser involved in the day-to-day activities of the Fund. The Trustees reviewed information provided by the Adviser in a due diligence questionnaire, including the structure of the Adviser’s compliance program and its continuing commitment to the Fund. The Trustees noted that during the course of the prior year the Adviser had participated in a Trust board meeting to discuss the Fund’s performance and outlook, along with the compliance efforts made by the Adviser, including reports provided by the Adviser in its role as the Fund’s
41
Rockefeller Climate Solutions Fund
Basis for Trustees’ Approval of Investment Advisory Agreement
(Unaudited) (Continued)
valuation designee. The Trustees also noted any services that extended beyond portfolio management, and they considered the brokerage practices of the Adviser. The Trustees discussed the Adviser’s handling of compliance matters, including the reports of the Trust’s chief compliance officer to the Trustees on the effectiveness of the Adviser’s compliance program. The Trustees also considered the Adviser’s overall financial condition, as well as the implementation and operational effectiveness of the Adviser’s business continuity plan. The Trustees concluded that the Adviser had sufficient quality and depth of personnel, resources, investment methods and compliance policies and procedures essential to performing its duties under the Advisory Agreement and that the nature, overall quality and extent of the management services provided to the Fund, as well as the Adviser’s compliance program, were satisfactory and reliable.
| 2. | INVESTMENT PERFORMANCE OF THE FUND AND THE ADVISER |
The Trustees discussed the performance of the Fund for the quarter, one-year and since inception periods ended March 31, 2023. In assessing the quality of the portfolio management services delivered by the Adviser, the Trustees also compared the short-term and longer-term performance of the Fund on both an absolute basis and in comparison to a benchmark index (the MSCI All Country World Index) and in comparison to a peer group of funds as constructed using publicly-available data provided by Morningstar, Inc. and presented by Barrington Financial Group, LLC d/b/a Barrington Partners, an independent third-party benchmarking firm, through its cohort selection process (a peer group of U.S. open-end global small/mid-cap stock, global large-cap stock blend, global large-cap stock growth, small-cap blend and equity energy funds) (the “Barrington Cohort”). The Trustees also reviewed information on the historical performance of other separately-managed accounts of the Adviser with the same or similar investment strategies as the Fund.
The Trustees noted the Fund’s Institutional Class shares performance for the one-year period ended March 31, 2023 was above the Barrington Cohort average. The Trustees noted that for the quarter and since inception period ended March 31, 2023, the Fund’s Institutional Class shares had underperformed the MSCI All Country World Index. The Trustees noted that for the one-year period ended March 31, 2023, the Fund’s Institutional Class shares had outperformed the MSCI All Country World Index. The Trustees further noted that the Adviser considered the performance dispersion between the performance of the Fund’s Institutional Class shares and the performance of the comparable separately-managed account composite to be within an acceptable range during the relevant time periods.
After considering all of the information, the Trustees concluded that the performance obtained by the Adviser for the Fund was satisfactory under current market conditions. Although past performance is not a guarantee or indication of future results, the Trustees determined that the Fund and its shareholders were likely to benefit from the Adviser’s continued management.
| 3. | COSTS OF SERVICES PROVIDED AND PROFITS REALIZED BY THE ADVISER |
The Trustees considered the cost of services and the structure of the Adviser’s fees, including a review of the expense analyses and other pertinent material with respect to the
42
Rockefeller Climate Solutions Fund
Basis for Trustees’ Approval of Investment Advisory Agreement
(Unaudited) (Continued)
Fund. The Trustees reviewed the related statistical information and other materials provided, including the comparative expenses and Barrington Cohort comparisons. The Trustees considered the cost structure of the Fund relative to the Barrington Cohort and the Adviser’s separately-managed accounts with the same or similar investment strategies as the Fund, as well as any fee waivers and expense reimbursements of the Adviser.
The Trustees also considered the overall profitability of the Adviser and reviewed the Adviser’s financial information and noted that the Adviser has subsidized the Fund’s operations since the Fund’s inception. The Trustees also examined the level of profits that could be expected to accrue to the Adviser from the fees payable under the Advisory Agreement, as well as the Fund’s brokerage practices and use of soft dollars by the Adviser. These considerations were based on materials requested by the Trustees and the Fund’s administrator specifically for the June 22, 2023 meeting and the August 17, 2023 meeting at which the Advisory Agreement was formally considered, as well as the reports prepared by the Adviser over the course of the year.
The Trustees noted that the Fund’s contractual management fee of 0.85% was above the Barrington Cohort average of 0.79%. The Trustees noted that the Fund was operating above its expense cap of 0.99% for Institutional Class shares. The Trustees observed that the Fund’s total expense ratio (net of fee waivers and expense reimbursements) of 0.99% was equal to the Barrington Cohort average of 0.99%. The Trustees also compared the fees paid by the Fund to the fees paid by separately-managed accounts of the Adviser that are managed by the Adviser with similar investment strategies.
The Trustees concluded that the Fund’s expenses and the management fees paid to the Adviser were fair and reasonable in light of the comparative performance, expense and management fee information. The Trustees noted, based on a profitability analysis prepared by the Adviser, that the Adviser’s profits from sponsoring the Fund were not excessive, and the Trustees further concluded that the Adviser maintained adequate profit levels to support its services to the Fund from the revenues of its overall investment advisory business, despite subsidizing the Fund’s operations.
| 4. | EXTENT OF ECONOMIES OF SCALE AS THE FUND GROWS |
The Trustees compared the Fund’s expenses relative to its peer group and discussed realized and potential economies of scale. The Trustees also reviewed the structure of the Fund’s management fee and whether the Fund was large enough to generate economies of scale for shareholders or whether economies of scale would be expected to be realized as Fund assets grow (and if so, how those economies of scale were being or would be shared with shareholders). The Trustees reviewed all fee waivers, expense reimbursements and potential recoupments by the Adviser with respect to the Fund. The Trustees noted that the Fund’s management fee structure did not contain any breakpoint reductions as the Fund’s assets grow in size, but that the feasibility of incorporating breakpoints would continue to be reviewed on a regular basis. With respect to the Adviser’s fee structure, the Trustees concluded that the current fee structure was reasonable and reflected a sharing of economies of scale between the Adviser and the Fund at the Fund’s current asset level.
43
Rockefeller Climate Solutions Fund
Basis for Trustees’ Approval of Investment Advisory Agreement
(Unaudited) (Continued)
| 5. | BENEFITS DERIVED FROM THE RELATIONSHIP WITH THE FUND |
The Trustees considered the direct and indirect benefits that could be received by the Adviser from its association with the Fund. The Trustees examined the brokerage practices of the Adviser with respect to the Fund. The Trustees concluded that the benefits the Adviser may receive, such as greater name recognition and increased ability to obtain research or brokerage services or to attract additional investor assets, appear to be reasonable, and in many cases may benefit the Fund.
CONCLUSIONS
The Trustees considered all of the foregoing factors. In considering the renewal of the Advisory Agreement, the Trustees did not identify any one factor as all-important, but rather considered these factors collectively in light of the Fund’s surrounding circumstances. Based on this review, the Trustees, including a majority of the Independent Trustees, approved the continuation of the Advisory Agreement for an additional one-year term ending August 31, 2024 as being in the best interests of the Fund and its shareholders.
44
Rockefeller US Small Cap Core Fund
Basis for Trustees’ Approval of Investment Advisory Agreement
(Unaudited)
The Board of Trustees (the “Trustees”) of Trust for Professional Managers (the “Trust”) met on June 22, 2023 to consider the initial approval of the Investment Advisory Agreement (the “Agreement”) between the Trust, on behalf of the Rockefeller US Small Cap Core Fund (the “Fund”), a series of the Trust, and Rockefeller & Co. LLC, the Fund’s investment adviser (the “Adviser”). In advance of the meeting, the Trustees requested and received materials to assist them in considering the approval of the Agreement, including a memorandum provided by the Fund’s legal counsel, which outlined the Trustees’ responsibilities in considering the Agreement. The materials provided contained information with respect to the factors enumerated below, including a copy of the Agreement, detailed comparative information relating to the Fund’s performance, as well as the management fees and other expenses of the Fund, due diligence materials relating to the Adviser (including a due diligence questionnaire completed on behalf of the Fund by the Adviser, the Adviser’s Form ADV, select financial statements of the Adviser, bibliographic information of the Adviser’s key management and compliance personnel, comparative fee information for the Fund and a summary detailing key provisions of the Adviser’s written compliance program, including its code of ethics) and other pertinent information. In considering approval of the Agreement, the Trustees also reviewed the Trust’s post effective amendment to its Form N-1A registration statement, including the prospectus and statement of additional information included therein, relating to the initial registration of the Fund.
Based on their evaluation of the information provided by the Adviser, in conjunction with the Fund’s other service providers, the Trustees, by a unanimous vote (including a separate vote of the Trustees who are not “interested persons,” as that term is defined in the Investment Company Act of 1940, as amended (the “Independent Trustees”)), approved the Agreement for an initial term ending two years following the Fund’s commencement of operations pursuant to an effective registration statement.
| 1. | NATURE, EXTENT AND QUALITY OF SERVICES TO BE PROVIDED TO THE FUND |
The Trustees considered the nature, extent and quality of services that would be provided by the Adviser to the Fund and the amount of time devoted by the Adviser’s staff to the Fund’s operations. The Trustees considered the Adviser’s specific responsibilities in all aspects of day-to-day management of the Fund, as well as the qualifications, experience and responsibilities of Jason Kotik, Portfolio Manager, who will serve as portfolio manager for the Fund, and other key personnel at the Adviser involved in the day-to-day activities of the Fund. The Trustees reviewed information provided by the Adviser in a due diligence questionnaire, including the structure of the Adviser’s compliance program and discussed the Adviser’s marketing activities and its commitment to the Fund. The Trustees also noted any services that extended beyond portfolio management, and they considered the brokerage practices of the Adviser. The Trustees discussed the Adviser’s handling of compliance matters, including the reports of the Trust’s chief compliance officer to the Trustees on the effectiveness of the Adviser’s compliance program. The Trustees also considered the Adviser’s overall financial condition, as well as the implementation and operational effectiveness of the Adviser’s business continuity plan. The Trustees concluded that the Adviser had sufficient quality and depth of personnel, resources,
45
Rockefeller US Small Cap Core Fund
Basis for Trustees’ Approval of Investment Advisory Agreement
(Unaudited) (Continued)
investment methods and compliance policies and procedures essential to performing its duties under the Advisory Agreement and that the nature, overall quality and extent of the management services provided to the Fund, as well as the Adviser’s compliance program, were satisfactory and reliable.
| 2. | INVESTMENT PERFORMANCE OF THE FUND AND THE ADVISER |
The Trustees noted that the Fund had not yet commenced operations and, therefore, the performance of the Fund was not a relevant factor for consideration. In assessing the portfolio management services to be provided by the Adviser, the Trustees considered the investment management experience of Mr. Kotik, who will serve as portfolio manager for the Fund. The Trustees noted that the Adviser did not manage any other accounts with the same or similar investment strategies as the Fund. After considering all of the information, the Trustees determined that the Fund and its shareholders were likely to benefit from the Adviser’s management.
| 3. | COSTS OF SERVICES PROVIDED AND PROFITS TO BE REALIZED BY THE ADVISER |
The Trustees considered the cost of services and the structure of the Adviser’s proposed management fee, including a review of the expense analyses and other pertinent material with respect to the Fund. The Trustees reviewed the related statistical information and other materials provided, including the comparative expenses, expense components and peer group selection. The Trustees considered the cost structure of the Fund relative to a peer group of funds as constructed using publicly-available data provided by Morningstar, Inc. and presented by Barrington Financial Group, LLC d/b/a Barrington Partners, an independent third-party benchmarking firm, through its cohort selection process (a peer group of U.S. small blend funds (the “Barrington Cohort”)). The Trustees also noted that the management fee to be paid by the Fund was the same as the management fee charged by the Adviser to the other series of the Trust managed by the Adviser.
The Trustees noted that the Fund’s proposed contractual management fee of 0.85% was higher than the Barrington Cohort average of 0.80%. The Trustees further noted that the Fund’s total expense ratio for Class I shares (net of fee waivers and expense reimbursements) of 0.95% was below the Barrington Cohort average of 0.97%.
The Trustees noted that the Adviser has agreed to waive its management fees and/or reimburse expenses of the Fund for a period of two years from commencement of operations to ensure that the total amount of the Fund’s operating expenses (exclusive of front-end or contingent deferred loads, Rule 12b-1 plan fees, shareholder servicing plan fees, taxes, leverage expenses (i.e., any expenses incurred in connection with borrowings made by the Fund), interest (including interest incurred in connection with bank and custody overdrafts), brokerage commissions and other transactional expenses, expenses incurred in connection with any merger or reorganization, dividends or interest on short positions, acquired fund fees and expenses or extraordinary expenses such as litigation) does not exceed 0.95% of the average daily net assets of the Fund through July 31, 2024 and 1.05% of the Fund’s average daily net assets beginning August 1, 2024 through at least July 31, 2025.
46
Rockefeller US Small Cap Core Fund
Basis for Trustees’ Approval of Investment Advisory Agreement
(Unaudited) (Continued)
The Trustees also considered the overall profitability that may result from the Adviser’s management of the Fund and reviewed the Adviser’s financial information. The Trustees also examined the level of profits that could be realized by the Adviser from the fees payable under the Agreement based on a pro forma profitability analysis provided by the Adviser.
The Trustees concluded that the Fund’s estimated expenses and the proposed management fee to be paid to the Adviser were fair and reasonable in light of the comparative expense and management fee information and the investment management services to be provided to the Fund by the Adviser. The Trustees further concluded, based on a pro forma profitability analysis prepared by the Adviser, that the Adviser’s anticipated profit from sponsoring the Fund would not be excessive and that the Adviser maintained adequate profit levels to support its services to the Fund.
| 4. | EXTENT OF ECONOMIES OF SCALE AS THE FUND GROWS |
The Trustees compared the Fund’s estimated expenses relative to its Barrington Cohort and discussed economies of scale. With respect to the Fund, the Trustees noted that the Fund’s proposed management fee structure did not contain any breakpoint reductions as the Fund’s assets grow in size, but that the feasibility of incorporating breakpoints would be reviewed on a regular basis. With respect to the Adviser’s fee structure, the Trustees concluded that the potential economies of scale with respect to the Fund was acceptable.
| 5. | BENEFITS TO BE DERIVED FROM THE RELATIONSHIP WITH THE FUND |
The Trustees considered the direct and indirect benefits that could be realized by the Adviser from its association with the Fund. The Trustees concluded that the benefits the Adviser may receive, such as greater name recognition, an increased ability to obtain research or brokerage services, or the ability to attract additional investor assets, appear to be reasonable, and in many cases may benefit the Fund.
CONCLUSIONS
The Trustees considered all of the foregoing factors. In considering the approval of the Advisory Agreement, the Trustees did not identify any one factor as all-important, but rather considered these factors collectively in light of the Fund’s surrounding circumstances. Based on this review, the Trustees, including a majority of the Independent Trustees, approved the proposed Advisory Agreement for an initial two-year term as being in the best interests of the Fund and its shareholders.
47
Rockefeller Funds
Notice of Privacy Policy & Practices
(Unaudited)
We collect non-public personal information about you from the following sources:
| • | information we receive about you on applications or other forms; | |
| • | information you give us orally; and | |
| • | information about your transactions with us or others. |
The types of non-public personal information we collect and share can include:
| • | social security numbers; | |
| • | account balances; | |
| • | account transactions; | |
| • | transaction history; | |
| • | wire transfer instructions; and | |
| • | checking account information. |
What Information We Disclose
We do not disclose any non-public personal information about our shareholders or former shareholders without the shareholder’s authorization, except as permitted by law or in response to inquiries from governmental authorities.We may share information with affiliated parties and unaffiliated third parties with whom we have contracts for servicing the Funds. We will provide unaffiliated third parties with only the information necessary to carry out their assigned responsibility.
How We Protect Your Information
All shareholder records will be disposed of in accordance with applicable law. We maintain physical, electronic and procedural safeguards to protect your non-public personal information and require third parties to treat your non-public personal information with the same high degree of confidentiality.
In the event that you hold shares of the Funds through a financial intermediary, including, but not limited to, a broker-dealer, bank or trust company, the privacy policy of your financial intermediary would govern how your non-public personal information would be shared with unaffiliated third parties.
48
Rockefeller Funds
Additional Information
(Unaudited)
Tax Information
For the year ended November 30, 2023, certain dividends paid by the Funds may be subject to a maximum tax rate of 23.8%, as provided for by the Jobs and Growth Tax Relief Reconciliation Act of 2003. The percentage of dividends declared from ordinary income designated as qualified dividend income was as follows:
| Rockefeller Climate Solutions Fund | 100.00 | % | ||
| Rockefeller US Small Cap Core Fund | 0.00 | % |
For corporate shareholders, the percent of ordinary income distributions qualifying for the corporate dividends received deduction for the fiscal year ended November 30, 2023, was as follows:
| Rockefeller Climate Solutions Fund | 100.00 | % | ||
| Rockefeller US Small Cap Core Fund | 0.00 | % |
For the year ended November 30, 2023, the percentage of taxable ordinary income distributions designated as short-term capital gain distributions under Section 871(k)(2)(c) of the Code for the Funds was as follows:
| Rockefeller Climate Solutions Fund | 0.00 | % | ||
| Rockefeller US Small Cap Core Fund | 0.00 | % |
Indemnifications
Under the Trust’s organizational documents, its officers and Trustees are indemnified against certain liabilities arising out of the performance of their duties to the Funds. In addition, in the normal course of business, the Funds enter into contracts that provide general indemnifications to other parties. The Fund’s maximum exposure under these arrangements is unknown as this would involve future claims that may be made against the Funds that have not yet occurred. However, the Funds have not had prior claims or losses pursuant to these contracts and expect the risk of loss to be remote.
49
Rockefeller Funds
Additional Information (Continued)
(Unaudited)
Information about Trustees
The business and affairs of the Trust are managed under the direction of the Board of Trustees. Information pertaining to the Trustees of the Trust is set forth below. The Statement of Additional Information includes additional information about the Trustees and is available, without charge, upon request by calling 855-369-6209.
| Other | |||||
| Directorships | |||||
| Term of | Number of | Principal | Held by | ||
| Office and | Portfolios | Occupation(s) | Trustee | ||
| Position(s) | Length | in Trust | During the | During the | |
| Name, Address | Held with | of Time | Overseen | Past Five | Past Five |
and Year of Birth | the Trust | Served | by Trustee | Years | Years |
| Independent Trustees | |||||
Michael D. Akers, Ph.D. | Trustee | Indefinite | 27 | Professor Emeritus | Independent |
615 E. Michigan St. | Term; Since | Department of | Trustee, USA | ||
Milwaukee, WI 53202 | August 22, | Accounting | MUTUALS | ||
Year of Birth: 1955 | 2001 | (June 2019– | (an open-end | ||
present), Professor | investment | ||||
Department | company) | ||||
of Accounting | (2001–2021). | ||||
(2004–May | |||||
2019) Marquette | |||||
University. | |||||
Gary A. Drska | Trustee | Indefinite | 27 | Retired; Former | Independent |
615 E. Michigan St. | Term; Since | Pilot, Frontier/ | Trustee, USA | ||
Milwaukee, WI 53202 | August 22, | Midwest Airlines, | MUTUALS | ||
Year of Birth: 1956 | 2001 | Inc. (airline | (an open-end | ||
company) | investment | ||||
(1986–2021). | company) | ||||
(2001–2021). | |||||
Vincent P. Lyles | Trustee | Indefinite | 27 | Executive Director, | Independent |
615 E. Michigan St. | Term; Since | Milwaukee Succeeds | Director, BMO | ||
Milwaukee, WI 53202 | April 6, 2022 | (education advocacy | Funds, Inc. | ||
Year of Birth: 1961 | organization) (2023– | (an open-end | |||
present); System | investment | ||||
Vice President of | company) | ||||
Community | (2017–2022). | ||||
Relations, Advocate | |||||
Aurora Health Care | |||||
(health care provider) | |||||
(2019–2022); | |||||
President and Chief | |||||
Executive Officer, | |||||
Boys & Girls Club of | |||||
Greater Milwaukee | |||||
(2012–2018). |
50
Rockefeller Funds
Additional Information (Continued)
(Unaudited)
| Other | |||||
| Directorships | |||||
| Term of | Number of | Principal | Held by | ||
| Office and | Portfolios | Occupation(s) | Trustee | ||
| Position(s) | Length | in Trust | During the | During the | |
| Name, Address | Held with | of Time | Overseen | Past Five | Past Five |
and Year of Birth | the Trust | Served | by Trustee | Years | Years |
Erik K. Olstein | Trustee | Indefinite | 27 | Retired; President | Trustee, The |
615 E. Michigan St. | Term; Since | and Chief Operating | Olstein Funds | ||
Milwaukee, WI 53202 | April 6, 2022 | Officer (2000–2020), | (an open-end | ||
Year of Birth: 1967 | Vice President of | investment | |||
Sales and Chief | company) | ||||
Operating Officer | (1995–2018). | ||||
(1995–2000), | |||||
Olstein Capital | |||||
Management, L.P. | |||||
(asset management | |||||
firm); Secretary and | |||||
Assistant Treasurer, | |||||
The Olstein Funds | |||||
(1995–2018). | |||||
Lisa Zúñiga Ramírez | Trustee | Indefinite | 27 | Retired; Principal | Director, |
615 E. Michigan St. | Term; Since | and Senior Portfolio | Peoples | ||
Milwaukee, WI 53202 | April 6, 2022 | Manager, Segall, | Financial | ||
Year of Birth: 1969 | Bryan & Hamill, LLC | Services Corp. | |||
(asset management | (a publicly- | ||||
firm) (2018–2020); | traded bank | ||||
Partner and Senior | holding | ||||
Portfolio Manager, | company) | ||||
Denver Investments | (2022–present). | ||||
LLC (asset | |||||
management firm) | |||||
(2009–2018). | |||||
Gregory M. Wesley | Trustee | Indefinite | 27 | Senior Vice President | N/A |
615 E. Michigan St. | Term; Since | of Strategic Alliances | |||
Milwaukee, WI 53202 | April 6, 2022 | and Business | |||
Year of Birth: 1969 | Development, | ||||
Medical College | |||||
of Wisconsin | |||||
(2016–present). |
51
Rockefeller Funds
Additional Information (Continued)
(Unaudited)
| Other | |||||
| Directorships | |||||
| Term of | Number of | Principal | Held by | ||
| Office and | Portfolios | Occupation(s) | Trustee | ||
| Position(s) | Length | in Trust | During the | During the | |
| Name, Address | Held with | of Time | Overseen | Past Five | Past Five |
and Year of Birth | the Trust | Served | by Trustee | Years | Years |
| Interested Trustee and Officers | |||||
John P. Buckel* | Chairperson, | Indefinite | 27 | Vice President | N/A |
615 E. Michigan St. | Trustee, | Term; | U.S. Bancorp Fund | ||
Milwaukee, WI 53202 | President | Chairperson | Services, LLC | ||
Year of Birth: 1957 | and | and Trustee | (2004–present). | ||
Principal | (Since | ||||
Executive | January 19, | ||||
Officer | 2023); | ||||
President | |||||
and Principal | |||||
Executive | |||||
Officer | |||||
(Since | |||||
January 24, | |||||
2013) | |||||
Jennifer A. Lima | Vice | Indefinite | N/A | Vice President | N/A |
615 E. Michigan St. | President, | Term; Since | U.S. Bancorp Fund | ||
Milwaukee, WI 53202 | Treasurer | January 24, | Services, LLC | ||
Year of Birth: 1974 | and | 2013 | (2002–present). | ||
Principal | |||||
Financial | |||||
and | |||||
Accounting | |||||
Officer | |||||
Deanna B. Marotz | Chief | Indefinite | N/A | Senior Vice President, | N/A |
615 E. Michigan St. | Compliance | Term; Since | U.S. Bancorp Fund | ||
Milwaukee, WI 53202 | Officer, Vice | October 21, | Services, LLC | ||
Year of Birth: 1965 | President | 2021 | (2021–present); Chief | ||
and Anti- | Compliance Officer of | ||||
Money | Keeley-Teton Advisors, | ||||
Laundering | LLC and Teton | ||||
Officer | Advisors, Inc. | ||||
(2017–2021). | |||||
Jay S. Fitton | Secretary | Indefinite | N/A | Assistant Vice | N/A |
615 E. Michigan St. | Term; Since | President, | |||
Milwaukee, WI 53202 | July 22, | U.S. Bancorp Fund | |||
Year of Birth: 1970 | 2019 | Services, LLC | |||
(2019–present); | |||||
Partner, Practus, LLP | |||||
(2018–2019); Counsel, | |||||
Drinker Biddle & Reath | |||||
LLP (2016–2018). |
52
Rockefeller Funds
Additional Information (Continued)
(Unaudited)
| Other | |||||
| Directorships | |||||
| Term of | Number of | Principal | Held by | ||
| Office and | Portfolios | Occupation(s) | Trustee | ||
| Position(s) | Length | in Trust | During the | During the | |
| Name, Address | Held with | of Time | Overseen | Past Five | Past Five |
and Year of Birth | the Trust | Served | by Trustee | Years | Years |
Kelly A. Strauss | Assistant | Indefinite | N/A | Assistant Vice | N/A |
615 E. Michigan St. | Treasurer | Term; Since | President, | ||
Milwaukee, WI 53202 | April 23, | U.S. Bancorp Fund | |||
Year of Birth: 1987 | 2015 | Services, LLC | |||
(2011–present). | |||||
Shannon Coyle | Assistant | Indefinite | N/A | Officer, U.S. Bancorp | N/A |
615 E. Michigan St. | Treasurer | Term; Since | Fund Services, LLC | ||
Milwaukee, WI 53202 | August 26, | (2015–present). | |||
Year of Birth: 1990 | 2022 | ||||
Laura A. Carroll | Assistant | Indefinite | N/A | Assistant Vice | N/A |
615 E. Michigan St. | Treasurer | Term; | President, | ||
Milwaukee, WI 53202 | Since | U.S. Bancorp Fund | |||
Year of Birth: 1985 | August 20, | Services, LLC | |||
2018 | (2007–present). |
| * | Mr. Buckel is deemed to be an “interested person” of the Trust as defined by the 1940 Act due to his position and material business relationship with the Trust. |
53
(This Page Intentionally Left Blank.)
A NOTE ON FORWARD LOOKING STATEMENTS (Unaudited)
Except for historical information contained in this report for the Funds, the matters discussed in this report may constitute forward-looking statements made pursuant to the safe-harbor provisions of the Private Securities Litigation Reform Act of 1995. These include any adviser or portfolio manager predictions, assessments, analyses or outlooks for individual securities, industries, market sectors and/or markets. These statements involve risks and uncertainties. In addition to the general risks described for the Funds in the current Prospectus, other factors bearing on this report include the accuracy of the Adviser’s or portfolio managers’ forecasts and predictions, and the appropriateness of the investment programs designed by the Adviser or portfolio managers to implement their strategies efficiently and effectively. Any one or more of these factors, as well as other risks affecting the securities markets and investment instruments generally, could cause the actual results of the Funds to differ materially as compared to benchmarks associated with the Funds.
ADDITIONAL INFORMATION (Unaudited)
The Funds adopted proxy voting policies and procedures that delegate to the Adviser the authority to vote proxies. A description of the Fund’s proxy voting policies and procedures is available without charge, upon request, by calling the Funds toll free at 855-369-6209. A description of these policies and procedures is also included in the Fund’s Statement of Additional Information, which is available on the SEC’s website at http://www.sec.gov.
The Fund’s proxy voting records for the most recent 12-month period ended June 30 are available without charge, either upon request by calling the Funds toll free at 855-369-6209 or by accessing the SEC’s website at http://www.sec.gov.
The Funds file their complete schedule of portfolio holdings with the SEC for the first and third quarters of each fiscal year on Part F of Form N-PORT. Shareholders may view the Part F of Form N-PORT reports, on the SEC’s website at http://www.sec.gov.
HOUSEHOLDING (Unaudited)
In an effort to decrease costs, the Funds intend to reduce the number of duplicate prospectuses and certain other shareholder documents you receive by sending only one copy of each to those addresses shared by two or more accounts and to shareholders the Funds reasonably believes are from the same family or household. Once implemented, if you would like to discontinue householding for your accounts, please call toll-free at 855-369-6209 to request individual copies of these documents. Once the Funds receive notice to stop householding, the Funds will begin sending individual copies 30 days after receiving your request. This policy does not apply to account statements.
ROCKEFELLER FUNDS
| Investment Adviser | Rockefeller & Co. LLC |
| 45 Rockefeller Plaza, 5th Floor | |
| New York, New York 10111 | |
| Legal Counsel | Godfrey & Kahn, S.C. |
| 833 East Michigan Street | |
| Suite 1800 | |
| Milwaukee, Wisconsin 53202 | |
| Independent Registered Public | Deloitte & Touche LLP |
| Accounting Firm | 111 South Wacker Drive |
| Chicago, Illinois 60606 | |
| Transfer Agent, Fund Accountant and | U.S. Bancorp Fund Services, LLC |
| Fund Administrator | 615 East Michigan Street |
| Milwaukee, Wisconsin 53202 | |
| Custodian | U.S. Bank National Association |
| Custody Operations | |
| 1555 North River Center Drive | |
| Suite 302 | |
| Milwaukee, Wisconsin 53212 | |
| Distributor | Quasar Distributors, LLC |
| 111 East Kilbourn Avenue | |
| Suite 2200 | |
| Milwaukee, Wisconsin 53202 | |
This report is intended for shareholders of the Funds and may not be used as sales literature unless preceded or accompanied by a current prospectus.
(b) Not Applicable.
Item 2. Code of Ethics.
The registrant has adopted a code of ethics that applies to the registrant’s principal executive officer and principal financial officer. The registrant has not made any amendments to its code of ethics during the period covered by this report. The registrant has not granted any waivers from any provisions of the code of ethics during the period covered by this report. Incorporated by reference to the Registrant’s Form N-CSR filed on February 6, 2019.
Item 3. Audit Committee Financial Expert.
The registrant’s board of trustees has determined that there is at least one audit committee financial expert serving on its audit committee. Dr. Michael Akers is the “audit committee financial expert” and is considered to be “independent” as each term is defined in Item 3 of Form N‑CSR. Dr. Akers holds a Ph.D. in accountancy and is a professor of accounting at Marquette University in Milwaukee, Wisconsin.
Item 4. Principal Accountant Fees and Services.
The registrant has engaged its principal accountant to perform audit services, audit-related services, tax services and other services during the past two fiscal years. “Audit services” refer to performing an audit of the registrant's annual financial statements or services that are normally provided by the accountant in connection with statutory and regulatory filings or engagements for those fiscal years. “Audit-related services” refer to the assurance and related services by the principal accountant that are reasonably related to the performance of the audit. “Tax services” refer to professional services rendered by the principal accountant for tax compliance, tax advice, and tax planning. The following table details the aggregate fees billed or expected to be billed for each of the last two fiscal years for audit fees, audit-related fees, tax fees and other fees by the principal accountant.
| FYE 11/30/2023 | FYE 11/30/2022 | |
Audit Fees | $60,700 | $28,900 |
Audit-Related Fees | 0 | 0 |
Tax Fees | $13,400 | $6,375 |
All Other Fees | 0 | 0 |
(e)(1) The audit committee has adopted pre-approval policies and procedures that require the audit committee to pre‑approve all audit and non‑audit services of the registrant, including services provided to any entity affiliated with the registrant.
(e)(2) The percentage of fees billed by Deloitte & Touche LLP applicable to non-audit services pursuant to waiver of pre-approval requirement were as follows:
| FYE 11/30/2023 | FYE 11/30/2022 | |
Audit-Related Fees | 0% | 0% |
Tax Fees | 0% | 0% |
All Other Fees | 0% | 0% |
(f) All of the principal accountant’s hours spent on auditing the registrant’s financial statements were attributed to work performed by full‑time permanent employees of the principal accountant.
(g) The following table indicates the non-audit fees billed or expected to be billed by the registrant’s accountant for services to the registrant and to the registrant’s investment adviser (and any other controlling entity, etc.—not sub-adviser) for the last two years.
Non-Audit Related Fees | FYE 11/30/2023 | FYE 11/30/2022 |
Registrant | $0 | $0 |
Registrant’s Investment Adviser | $145,000 | $613,700 |
(h) The audit committee of the board of trustees has considered whether the provision of non-audit services that were rendered to the registrant's investment adviser is compatible with maintaining the principal accountant's independence and has concluded that the provision of such non-audit services by the accountant has not compromised the accountant’s independence.
(i) Not applicable.
(j) Not applicable.
Item 5. Audit Committee of Listed Registrants.
Not applicable to registrants who are not listed issuers (as defined in Rule 10A-3 under the Securities Exchange Act of 1934).
Item 6. Investments.
| (a) | Schedule of Investments is included as part of the report to shareholders filed under Item 1 of this Form. |
| (b) | Not Applicable. |
Item 7. Disclosure of Proxy Voting Policies and Procedures for Closed-End Management Investment Companies.
Not applicable to open-end investment companies.
Item 8. Portfolio Managers of Closed-End Management Investment Companies.
Not applicable to open-end investment companies.
Item 9. Purchases of Equity Securities by Closed‑End Management Investment Company and Affiliated Purchasers.
Not applicable to open-end investment companies.
Item 10. Submission of Matters to a Vote of Security Holders.
There have been no material changes to the procedures by which shareholders may recommend nominees to the registrant’s board of trustees.
Item 11. Controls and Procedures.
| (a) | The Registrant’s President and Treasurer have reviewed the Registrant's disclosure controls and procedures (as defined in Rule 30a-3(c) under the Investment Company Act of 1940 (the “Act”)) as of a date within 90 days of the filing of this report, as required by Rule 30a-3(b) under the Act and Rules 13a-15(b) or 15d‑15(b) under the Securities Exchange Act of 1934. Based on their review, such officers have concluded that the disclosure controls and procedures are effective in ensuring that information required to be disclosed in this report is appropriately recorded, processed, summarized and reported and made known to them by others within the Registrant and by the Registrant’s service provider. |
| (b) | There were no changes in the Registrant's internal control over financial reporting (as defined in Rule 30a-3(d) under the Act) that occurred during the period covered by this report that has materially affected, or is reasonably likely to materially affect, the Registrant's internal control over financial reporting. |
Item 12. Disclosure of Securities Lending Activities for Closed-End Management Investment Companies
Not applicable to open-end investment companies.
Item 13. Exhibits.
(3) Any written solicitation to purchase securities under Rule 23c‑1 under the Act sent or given during the period covered by the report by or on behalf of the registrant to 10 or more persons. Not applicable to open-end investment companies.
(4) Change in the registrant’s independent public accountant. There was no change in the registrant’s independent public accountant for the period covered by this report.
SIGNATURES
Pursuant to the requirements of the Securities Exchange Act of 1934 and the Investment Company Act of 1940, the registrant has duly caused this report to be signed on its behalf by the undersigned, thereunto duly authorized.
(Registrant) Trust for Professional Managers
By (Signature and Title /s/ John Buckel
John Buckel, President
Date 1/31/2024
Pursuant to the requirements of the Securities Exchange Act of 1934 and the Investment Company Act of 1940, this report has been signed below by the following persons on behalf of the registrant and in the capacities and on the dates indicated.
By (Signature and Title)* /s/ John Buckel
John Buckel, President
Date 1/31/2024
By (Signature and Title)* /s/ Jennifer Lima
Jennifer Lima, Treasurer
Date 1/31/2024
* Print the name and title of each signing officer under his or her signature.