Annual Report
Dearborn Partners Rising Dividend Fund
Class A Shares
DRDAX
Class C Shares
DRDCX
Class I Shares
DRDIX
February 29, 2024
Investment Adviser
Dearborn Partners, L.L.C.
200 West Madison Street
Suite 1950
Chicago, IL 60606
Phone: (888) 983-3380
Table of Contents
| LETTER TO SHAREHOLDERS | | 3 |
| EXPENSE EXAMPLE | | 5 |
| INVESTMENT HIGHLIGHTS | | 7 |
| SCHEDULE OF INVESTMENTS | | 9 |
| STATEMENT OF ASSETS AND LIABILITIES | | 13 |
| STATEMENT OF OPERATIONS | | 14 |
| STATEMENTS OF CHANGES IN NET ASSETS | | 15 |
| FINANCIAL HIGHLIGHTS | | 16 |
| NOTES TO FINANCIAL STATEMENTS | | 19 |
| REPORT OF INDEPENDENT REGISTERED | | |
| PUBLIC ACCOUNTING FIRM | | 28 |
| NOTICE OF PRIVACY POLICY & PRACTICES | | 29 |
| ADDITIONAL INFORMATION | | 30 |
Greetings from Dearborn Partners, LLC,
Adviser to the Dearborn Partners Rising Dividend Fund (the “Fund”).
On April 10, 2013 the Dearborn Partners Rising Dividend Fund was launched to provide investors with a relatively defensive equity investment diversified across a multitude of sectors in companies that are anticipated to consistently increase their dividends over time. Patient investors looking to outpace inflation should benefit from participating in what we believe is the long-term wealth-building potential offered by what we consider to be great businesses, while receiving an income stream with potential growth over time.
For the year ended February 29, 2024 (the Dearborn Partners Rising Dividend Fund’s fiscal year), the total returns of our Fund’s Class I shares and the S&P 500 Index benchmark were 17.13% and 30.45%, respectively. The broad equity market was primarily driven by a handful of companies that do not pay dividends, and thus do not meet our investment criteria.
Our Fund outperformed the benchmark in five of the eleven sectors into which Standard & Poor’s divides the marketplace. Our most notable outperformance versus the S&P 500 Index occurred in Consumer Staples, Healthcare, and Real Estate. We continue to maintain the valuation and stock selection disciplines that formed the basis of our strategy, as we believe that over time, such disciplines can offer attractive total return potential when equity market risk is considered.
A few specific companies in our Fund stand out as worth mentioning for their contributions to the returns of the period. Some of our best performing stocks were Apple Inc. (AAPL), Microsoft Corporation (MSFT), and Intuit Inc. (INTU). Apple continued to benefit from strong demand for its many market-leading products and services and capital return program. Microsoft benefited from its leading position in artificial intelligence and continued strength in its cloud platform, Azure. Intuit saw strong growth in its Small Business & Self-Employed business segment as more entrepreneurs choose Intuit solutions to manage workflows. The three poorest contributors to performance for the period were Glacier Bancorp, Inc. (GBCI), Dollar General (DG), and American Water Works Company, Inc. (AWK). Glacier Bancorp sold off due to fears of a systemic banking crisis and the potential that rapid and significant increases in the Federal Funds Rate would weigh on profitability as funding costs rise while lending declines. We sold GBCI shares as we do not anticipate the company will be raising its dividend meaningfully and consistently for the foreseeable future. Dollar General’s stock declined for several reasons that lowered margins and profitability. We ultimately sold DG shares as we did not anticipate a resolution to these concerns in the foreseeable future. In fact, on March 14, 2024, Dollar General announced a dividend of $0.59 per share for the fifth consecutive quarter. We like to include in the Fund’s portfolios companies that increase their dividend after four quarters each year. Shares of American Water Works Company were pressured from a variety of factors: higher interest rates increased their cost of capital and made its yield relatively less attractive versus government bonds. In addition, uncertainty on regulators’ willingness to grant favorable rates weighed on shares. We continue to view AWK shares as an attractive long-term holding because its earnings power and dividend growth potential remain intact, in our opinion.
We continue to believe that the companies in our Dearborn Partners Rising Dividend Fund are generally financially strong, well-managed, defensive businesses with products or services that people patronize regardless of the economic or financial environment. As portfolio managers, we strive to be not only active but proactive in terms of analyzing each company’s ability to pay and increase dividends consistently over time. History has shown that rising dividends have tended to cushion the fall of stock prices in challenging markets.
A primary goal of our strategy is to help investors keep ahead of the rising costs of living by providing a portfolio of companies that we believe are capable of increasing their annual dividends. We maintain our conviction that a path to long-term wealth building can be accomplished through properly diversified portfolios of stocks of companies that offer the potential to increase dividends consistently over time. We believe our Fund exemplifies those characteristics and, over the long term, offers the potential to provide attractive returns with modified risk.
During the year, 47 out of 49 companies in our Fund announced 50 dividend increases. The average of these dividend increases was about 8.6% more than these companies paid as dividends a year earlier. Through January 2024, the average annual rate of core inflation as measured by the Consumer Price Index for all Urban Consumers Less Food and Energy was 3.9%. In other words, the dividends announced by the companies in this portfolio have increased on average at more than twice the rate of inflation during this period. No companies in our fund reduced or suspended their dividends during these six months.
Thank you for your continued interest in the Dearborn Partners Rising Dividend Fund. Please feel free to contact us at any time.
Sincerely,
| Carol M. Lippman, CFA | Michael B. Andelman |
| Portfolio Manager | Portfolio Manager |
Past performance does not guarantee future results.
Opinions expressed are those of Dearborn Partners, LLC and are subject to change, are not guaranteed, and should not be considered investment advice.
Mutual fund investing involves risk. Principal loss is possible. The Fund’s strategy of investing in dividend-paying stocks involves the risk that such stocks may fall out of favor with investors and underperform the market. In addition, there is the possibility that such companies could reduce or eliminate the payment of dividends in the future or the anticipated acceleration of dividends could not occur. The Fund may invest in foreign securities and ADRs, which involve political, economic and currency risks, greater volatility and differences in accounting methods. Medium- and small-capitalization companies tend to have limited liquidity and greater price volatility than large-capitalization companies. Investments in REIT securities involve risks such as declines in the value of real estate and increased susceptibility to adverse economic regulatory expenses. The Fund may invest in MLPs, which can be negatively influenced when interest rates rise. These investments also entail many of the general tax risks of investing in a partnership. There is always the risk that an MLP will fail to qualify for favorable tax treatments.
Diversification does not guarantee a profit or protect from loss in a declining market.
The S&P 500 Total Return Index is a stock market index based on the market capitalizations of 500 leading companies publicly traded in the U.S. stock market, as determined by Standard & Poor’s. It is not possible to invest directly in an index.
The Consumer Price Index for All Urban Consumers: All Items Less Food & Energy is an aggregate of prices paid by urban consumers for a typical basket of goods, excluding food and energy. This measurement, known as “Core CPI,” is widely used by economists because food and energy have very volatile prices. The Bureau of Labor Statistics defines and measures the official CPI.
Fund holdings and sector allocations are subject to change and should not be considered a recommendation to buy or sell any security. For a complete list of Fund holdings please refer to the Schedule of Investments included in this report.
This report is intended for shareholders in the Dearborn Partners Rising Dividend Fund and may not be used as literature unless preceded or accompanied by the Fund’s current Prospectus.
Dearborn Partners, LLC is the adviser of the Dearborn Partners Rising Dividend Fund, which is distributed by Quasar Distributors, LLC.
Dearborn Partners Rising Dividend Fund
Expense Example
(Unaudited)
As a shareholder of the Fund, you incur two types of costs: (1) transaction costs, including sales charges (loads) on purchase payments (Class A and Class C shares only) and (2) ongoing costs, including management fees, distribution (12b-1) and service fees (Class A and Class C shares only) and other Fund expenses. This Example is intended to help you understand your ongoing costs (in dollars) of investing in the Fund, and to compare these costs with the ongoing costs of investing in other mutual funds. The Example is based on an investment of $1,000 invested at the beginning of the period and held for the entire period (September 1, 2023 – February 29, 2024).
Actual Expenses
The first lines of the following tables provide information about actual account values and actual expenses. If you purchase Class A shares of the Fund you will pay an initial sales charge of up to 5.00% when you invest. Class A shares are also subject to a 1.00% contingent deferred sales charge for purchases made at the $500,000 breakpoint which are redeemed within twelve months of purchase. A 1.00% contingent deferred sales charge is imposed on Class C shares redeemed within twelve months of purchase. In addition, you will be assessed fees for outgoing wire transfers, returned checks and stop payment for all share classes, at prevailing rates charged by U.S. Bancorp Fund Services, LLC, the Fund’s transfer agent (“Transfer Agent”). If you request that a redemption be made by wire transfer, currently a $15.00 fee is charged by the Transfer Agent. Individual retirement accounts (“IRAs”) will be charged a $15.00 annual maintenance fee. To the extent the Fund invests in shares of exchange-traded funds (“ETFs”) or other investment companies as part of its investment strategy, you will indirectly bear your proportionate share of any fees and expenses charged by the underlying funds in which the Fund invests in addition to the direct expenses of the Fund. Actual expenses of the underlying funds are expected to vary among the various underlying funds. These expenses are not included in the Example. The Example includes, but is not limited to, management fees, fund administration and accounting, custody and transfer agent fees. You may use the information in this line, together with the amount you invested, to estimate the expenses that you paid over the period. Simply divide your account value by $1,000 (for example, an $8,600 account value divided by $1,000 = 8.6), then multiply the result by the number in the first line under the heading titled “Expenses Paid During Period” to estimate the expenses you paid on your account during this period.
Hypothetical Example for Comparison Purposes
The second lines of the following tables provide information about hypothetical account values and hypothetical expenses based on the Fund’s actual expense ratio and an assumed rate of return of 5% per year before expenses, which is not the Fund’s actual return. The hypothetical account values and expenses may not be used to estimate the actual ending account balance or expenses you paid for the period. You may use this information to compare the ongoing costs of investing in the Fund and other funds. To do so, compare this 5% hypothetical example with the 5% hypothetical examples that appear
Dearborn Partners Rising Dividend Fund
Expense Example (Continued)
(Unaudited)
in the shareholder reports of other funds. Please note that the expenses shown in the tables are meant to highlight your ongoing costs only and do not reflect any transactional costs, such as sales charges (loads), redemption fees or exchange fees. Therefore, the second lines of the tables are useful in comparing ongoing costs only, and will not help you determine the relative total costs of owning different funds. In addition, if these transactional costs were included, your costs would have been higher.
| | Class A |
| | | | Expenses Paid |
| | Beginning | Ending | During Period |
| | Account Value | Account Value | September 1, 2023 - |
| | September 1, 2023 | February 29, 2024 | February 29, 2024* |
| Actual | $1,000.00 | $1,085.40 | $6.22 |
| Hypothetical (5% return | | | |
| before expenses) | $1,000.00 | $1,018.90 | $6.02 |
| * | Expenses are equal to the Fund’s annualized expense ratio of 1.20%, multiplied by the average account value over the period, multiplied by 182/366 (to reflect the one-half year period). |
| | Class C |
| | | | Expenses Paid |
| | Beginning | Ending | During Period |
| | Account Value | Account Value | September 1, 2023 - |
| | September 1, 2023 | February 29, 2024 | February 29, 2024* |
| Actual | $1,000.00 | $1,081.40 | $10.09 |
| Hypothetical (5% return | | | |
| before expenses) | $1,000.00 | $1,015.17 | $ 9.77 |
| * | Expenses are equal to the Fund’s annualized expense ratio of 1.95%, multiplied by the average account value over the period, multiplied by 182/366 (to reflect the one-half year period). |
| | Class I |
| | | | Expenses Paid |
| | Beginning | Ending | During Period |
| | Account Value | Account Value | September 1, 2023 - |
| | September 1, 2023 | February 29, 2024 | February 29, 2024* |
| Actual | $1,000.00 | $1,086.70 | $4.93 |
| Hypothetical (5% return | | | |
| before expenses) | $1,000.00 | $1,020.14 | $4.77 |
| * | Expenses are equal to the Fund’s annualized expense ratio of 0.95%, multiplied by the average account value over the period, multiplied by 182/366 (to reflect the one-half year period). |
Dearborn Partners Rising Dividend Fund
Investment Highlights
(Unaudited)
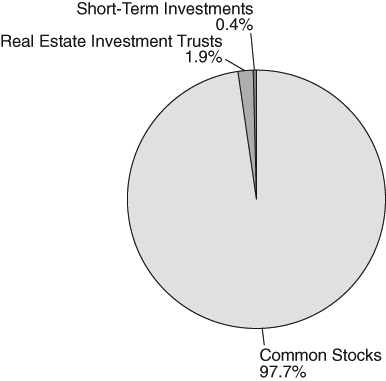
The Fund seeks current income, rising income over time, and long-term capital appreciation. Under normal market conditions, the Fund invests at least 80% of its net assets in the equity securities of companies that pay current dividends and that the Fund’s portfolio managers believe have the potential to increase their dividends with regularity. The Fund’s allocation of portfolio holdings as of February 29, 2024 was as follows:
Portfolio Allocation
(% of Investments)
Average Annual Returns as of February 29, 2024(1)
| | One | Five | Ten |
| | Year | Year | Year |
| Dearborn Partners Rising Dividend Fund | | | |
| Class A (with sales charge) | 11.03% | 9.44% | 9.20% |
| Class A (without sales charge) | 16.87% | 10.57% | 9.76% |
| Class C (with sales charge) | 14.97% | 9.75% | 8.94% |
| Class C (without sales charge) | 15.97% | 9.75% | 8.94% |
| Class I | 17.13% | 10.85% | 10.04% |
| S&P 500 Total Return Index | 30.45% | 14.76% | 12.70% |
(1) | With sales charge returns reflect the deduction of the current maximum initial sales charge of 5.00% for Class A and the applicable contingent deferred sales charge for Class C. Returns without sales charges do not reflect the current maximum sales charges. Had the sales charges been included, the returns would have been lower. |
Performance data quoted represents past performance and does not guarantee future results. The investment return and principal value of an investment will fluctuate so that an investor’s shares, when redeemed, may be worth more or less
Continued
Dearborn Partners Rising Dividend Fund
Investment Highlights (Continued)
(Unaudited)
than their original cost. Current performance of the Fund may be lower or higher than the performance quoted. Performance data current to the most recent month end may be obtained by calling (888) 983-3380.
Investment performance reflects fee waivers in effect. In the absence of such waivers, total returns would be reduced.
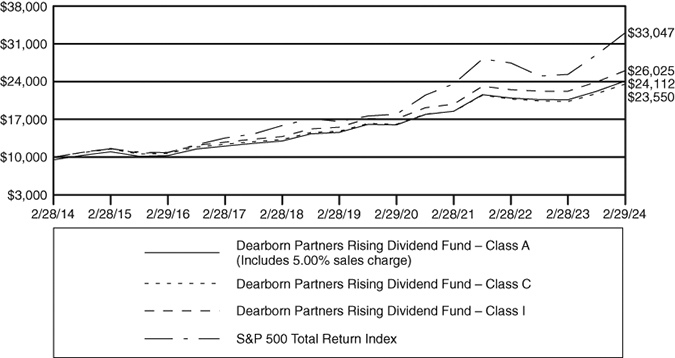
The returns shown assume reinvestment of Fund distributions and do not reflect the deduction of taxes that a shareholder would pay on Fund distributions or the redemption of Fund shares. The following graph illustrates performance of a hypothetical investment made in the Fund and a broad-based securities index 10 years ago. The graph does not reflect any future performance.
The S&P 500 Total Return Index is a stock market index based on the market capitalization of 500 leading companies publicly traded in the U.S. stock market, as determined by Standard & Poor’s. You cannot invest directly in an index.
Growth of $10,000 Investment(1)
(1) The minimum investment for Class I is $500,000.
Dearborn Partners Rising Dividend Fund
February 29, 2024
| | | Shares | | | Value | |
| COMMON STOCKS – 97.6% | | | | | | |
| | | | | | | |
| Air Freight & Logistics – 1.3% | | | | | | |
| United Parcel Service, Inc. – Class B | | | 46,240 | | | $ | 6,855,542 | |
| | | | | | | | | |
| Biotechnology – 3.4% | | | | | | | | |
| AbbVie, Inc. | | | 65,100 | | | | 11,460,855 | |
| Gilead Sciences, Inc. | | | 92,000 | | | | 6,633,200 | |
| | | | | | | | 18,094,055 | |
| Building Products – 2.2% | | | | | | | | |
| Carrier Global Corp. | | | 215,200 | | | | 11,960,816 | |
| | | | | | | | | |
| Capital Markets – 5.5% | | | | | | | | |
| BlackRock, Inc. | | | 13,800 | | | | 11,196,492 | |
| Nasdaq, Inc. | | | 137,490 | | | | 7,726,938 | |
| S&P Global, Inc. | | | 24,688 | | | | 10,575,846 | |
| | | | | | | | 29,499,276 | |
| Chemicals – 3.6% | | | | | | | | |
| Air Products and Chemicals, Inc. | | | 29,786 | | | | 6,971,116 | |
| The Sherwin-Williams Co. | | | 37,500 | | | | 12,451,125 | |
| | | | | | | | 19,422,241 | |
| Commercial Services & Supplies – 4.2% | | | | | | | | |
| Cintas Corp. | | | 17,965 | | | | 11,292,979 | |
| Republic Services, Inc. | | | 61,730 | | | | 11,333,628 | |
| | | | | | | | 22,626,607 | |
| Consumer Staples Distribution & Retail – 5.1% | | | | | | | | |
| Casey’s General Stores, Inc. | | | 45,500 | | | | 13,854,295 | |
| Costco Wholesale Corp. | | | 18,450 | | | | 13,724,771 | |
| | | | | | | | 27,579,066 | |
| Distributors – 1.7% | | | | | | | | |
| Pool Corp. | | | 22,800 | | | | 9,077,136 | |
| | | | | | | | | |
| Diversified Telecommunication Services – 0.9% | | | | | | | | |
| Verizon Communications, Inc. | | | 117,100 | | | | 4,686,342 | |
| | | | | | | | | |
| Financial Services – 4.0% | | | | | | | | |
| Jack Henry & Associates, Inc. | | | 50,195 | | | | 8,722,385 | |
| Mastercard, Inc. – Class A | | | 26,510 | | | | 12,585,888 | |
| | | | | | | | 21,308,273 | |
The accompanying notes are an integral part of these financial statements.
Dearborn Partners Rising Dividend Fund
| Schedule of Investments (Continued) |
February 29, 2024
| | | Shares | | | Value | |
| Food Products – 3.0% | | | | | | |
| McCormick & Co., Inc./MD | | | 84,419 | | | $ | 5,813,092 | |
| Mondelez International, Inc. – Class A | | | 141,000 | | | | 10,302,870 | |
| | | | | | | | 16,115,962 | |
| Gas Utilities – 2.1% | | | | | | | | |
| Atmos Energy Corp. | | | 102,300 | | | | 11,550,693 | |
| | | | | | | | | |
| Health Care Equipment & Supplies – 6.2% | | | | | | | | |
| Abbott Laboratories | | | 72,500 | | | | 8,601,400 | |
| Becton Dickinson & Co. | | | 26,708 | | | | 6,291,069 | |
| STERIS PLC | | | 48,327 | | | | 11,255,842 | |
| Stryker Corp. | | | 21,200 | | | | 7,400,284 | |
| | | | | | | | 33,548,595 | |
| Health Care Providers & Services – 2.0% | | | | | | | | |
| Elevance Health, Inc. | | | 21,785 | | | | 10,919,731 | |
| | | | | | | | | |
| Hotels, Restaurants & Leisure – 2.1% | | | | | | | | |
| McDonald’s Corp. | | | 39,643 | | | | 11,586,856 | |
| | | | | | | | | |
| Insurance – 3.4% | | | | | | | | |
| Arthur J Gallagher & Co. | | | 74,470 | | | | 18,165,467 | |
| | | | | | | | | |
| IT Services – 2.1% | | | | | | | | |
| Accenture PLC – Class A | | | 30,454 | | | | 11,413,550 | |
| | | | | | | | | |
| Machinery – 4.1% | | | | | | | | |
| Illinois Tool Works, Inc. | | | 37,598 | | | | 9,856,316 | |
| Snap-on, Inc. | | | 43,510 | | | | 11,993,966 | |
| | | | | | | | 21,850,282 | |
| Multi-Utilities – 1.7% | | | | | | | | |
| WEC Energy Group, Inc. | | | 120,457 | | | | 9,454,670 | |
| | | | | | | | | |
| Oil, Gas & Consumable Fuels – 4.0% | | | | | | | | |
| EOG Resources, Inc. | | | 77,230 | | | | 8,839,746 | |
| Exxon Mobil Corp. | | | 123,356 | | | | 12,893,169 | |
| | | | | | | | 21,732,915 | |
| Pharmaceuticals – 3.9% | | | | | | | | |
| Merck & Co., Inc. | | | 77,920 | | | | 9,907,528 | |
| Zoetis, Inc. | | | 55,019 | | | | 10,911,918 | |
| | | | | | | | 20,819,446 | |
The accompanying notes are an integral part of these financial statements.
Dearborn Partners Rising Dividend Fund
| Schedule of Investments (Continued) |
February 29, 2024
| | | Shares | | | Value | |
| Professional Services – 2.3% | | | | | | |
| Automatic Data Processing, Inc. | | | 48,500 | | | $ | 12,179,805 | |
| | | | | | | | | |
| Semiconductors & Semiconductor Equipment – 5.7% | | | | | | | | |
| Analog Devices, Inc. | | | 46,249 | | | | 8,871,483 | |
| QUALCOMM, Inc. | | | 79,909 | | | | 12,608,841 | |
| Texas Instruments, Inc. | | | 55,380 | | | | 9,266,736 | |
| | | | | | | | 30,747,060 | |
| Software – 5.3% | | | | | | | | |
| Intuit, Inc. | | | 21,500 | | | | 14,252,135 | |
| Microsoft Corp. | | | 34,700 | | | | 14,353,308 | |
| | | | | | | | 28,605,443 | |
| Specialty Retail – 4.6% | | | | | | | | |
| The Home Depot, Inc. | | | 30,000 | | | | 11,418,300 | |
| Tractor Supply Co. | | | 53,000 | | | | 13,478,960 | |
| | | | | | | | 24,897,260 | |
| Technology Hardware, Storage & Peripherals – 5.3% | | | | | | | | |
| Apple, Inc. | | | 156,888 | | | | 28,357,506 | |
| | | | | | | | | |
| Trading Companies & Distributors – 4.4% | | | | | | | | |
| Fastenal Co. | | | 188,270 | | | | 13,745,593 | |
| Watsco, Inc. | | | 25,200 | | | | 9,931,824 | |
| | | | | | | | 23,677,417 | |
| Water Utilities – 1.6% | | | | | | | | |
| American Water Works Co., Inc. | | | 71,460 | | | | 8,470,868 | |
| | | | | | | | | |
| Wireless Telecommunication Services – 1.9% | | | | | | | | |
| T-Mobile US, Inc. | | | 63,000 | | | | 10,287,900 | |
| TOTAL COMMON STOCKS (Cost $313,502,314) | | | | | | | 525,490,780 | |
| | | | | | | | | |
| REAL ESTATE INVESTMENT TRUSTS – 1.9% | | | | | | | | |
| Equinix, Inc. | | | 11,460 | | | | 10,185,877 | |
| TOTAL REAL ESTATE INVESTMENT TRUSTS (Cost $9,230,374) | | | | | | | 10,185,877 | |
The accompanying notes are an integral part of these financial statements.
Dearborn Partners Rising Dividend Fund
| Schedule of Investments (Continued) |
February 29, 2024
| | | Shares | | | Value | |
| SHORT-TERM INVESTMENTS – 0.4% | | | | | | |
| | | | | | | |
| Money Market Funds – 0.4% | | | | | | |
| Fidelity Government Portfolio – Class Institutional, 5.20% (a) | | | 2,266,495 | | | $ | 2,266,495 | |
| TOTAL SHORT-TERM INVESTMENTS (Cost $2,266,495) | | | | | | | 2,266,495 | |
| TOTAL INVESTMENTS – 99.9% (Cost $324,999,183) | | | | | | | 537,943,152 | |
| Other Assets in Excess of Liabilities – 0.1% | | | | | | | 746,793 | |
| TOTAL NET ASSETS – 100.0% | | | | | | $ | 538,689,945 | |
Percentages are stated as a percent of net assets.
The Global Industry Classification Standard (GICS®) was developed by and/or is the exclusive property of MSCI, Inc. and Standard & Poor’s Financial Services LLC (“S&P”). GICS is a service mark of MSCI, Inc. and S&P and has been licensed for use by U.S. Bank Global Fund Services.
PLC – Public Limited Company
| (a) | The rate shown represents the 7-day effective yield as of February 29, 2024. |
The accompanying notes are an integral part of these financial statements.
Dearborn Partners Rising Dividend Fund
| Statement of Assets and Liabilities |
February 29, 2024
| Assets | | | |
| Investments, at value (cost $324,999,183) | | $ | 537,943,152 | |
| Dividends, interest and reclaim receivable | | | 964,903 | |
| Receivable for Fund shares sold | | | 612,857 | |
| Other assets | | | 27,380 | |
| Total assets | | | 539,548,292 | |
| Liabilities | | | | |
| Payable to Adviser | | | 285,637 | |
| Payable for distribution fees | | | 119,631 | |
| Payable to affiliates | | | 129,731 | |
| Payable for Fund shares redeemed | | | 289,590 | |
| Accrued expenses and other liabilities | | | 33,758 | |
| Total liabilities | | | 858,347 | |
| Net Assets | | $ | 538,689,945 | |
| Net assets consist of: | | | | |
| Paid-in capital | | $ | 312,370,838 | |
| Total distributable earnings | | | 226,319,107 | |
| Net assets | | $ | 538,689,945 | |
| Class A Shares: | | | | |
| Net assets | | $ | 205,651,854 | |
| Shares of beneficial interest issued and outstanding | | | | |
| (unlimited number of shares authorized $0.001 par value) | | | 8,543,151 | |
Net asset value and redemption price per share(1) | | $ | 24.07 | |
Maximum offering price per share ($24.07/0.95)(2) | | $ | 25.34 | |
| Class C Shares: | | | | |
| Net assets | | $ | 87,548,345 | |
| Shares of beneficial interest issued and outstanding | | | | |
| (unlimited number of shares authorized $0.001 par value) | | | 3,680,104 | |
Net asset value, offering price and redemption price per share(1) | | $ | 23.79 | |
| Class I Shares: | | | | |
| Net assets | | $ | 245,489,746 | |
| Shares of beneficial interest issued and outstanding | | | | |
| (unlimited number of shares authorized $0.001 par value) | | | 10,174,042 | |
| Net asset value, offering price and redemption price per share | | $ | 24.13 | |
(1) | A contingent deferred sales charge (“CDSC”) of 1.00% may be charged on shares redeemed within one year of purchase. The CDSC on Class A shares is applied only to purchases of $500,000 or more that are redeemed within 12 months of purchase. Redemption price per share is equal to net asset value less any redemption or CDSC fees. |
(2) | Reflects a maximum sales charge of 5.00%. |
The accompanying notes are an integral part of these financial statements.
Dearborn Partners Rising Dividend Fund
For the Year Ended February 29, 2024
| Investment Income | | | |
| Dividend income | | $ | 10,274,103 | |
| Interest income | | | 598,864 | |
| Total Investment Income | | | 10,872,967 | |
| | | | | |
| Expenses | | | | |
| Management fees | | | 4,198,856 | |
| Distribution fees – Class C | | | 883,581 | |
| Distribution fees – Class A | | | 459,292 | |
| Administration fees | | | 424,619 | |
| Transfer agent fees and expenses | | | 227,139 | |
| Federal and state registration fees | | | 56,125 | |
| Custody fees | | | 52,713 | |
| Legal fees | | | 28,693 | |
| Trustees’ fees and related expenses | | | 27,497 | |
| Reports to shareholders | | | 26,837 | |
| Audit and tax fees | | | 18,049 | |
| Chief Compliance Officer fees | | | 17,629 | |
| Insurance expense | | | 5,373 | |
| Pricing fees | | | 2,742 | |
| Other expenses | | | 12,123 | |
| Total Expenses | | | 6,441,268 | |
| Less: Waivers by Adviser (Note 4) | | | (405,556 | ) |
| Net Expenses | | | 6,035,712 | |
| | | | | |
| Net Investment Income | | | 4,837,255 | |
| | | | | |
| Realized and Unrealized Gain on Investments | | | | |
| Net realized gain on: | | | | |
| Investments | | | 11,534,469 | |
| Net change in unrealized appreciation on: | | | | |
| Investments | | | 61,448,690 | |
| | | | | |
| Net Realized and Unrealized Gain on Investments | | | 72,983,159 | |
| Net Increase in Net Assets from Operations | | $ | 77,820,414 | |
The accompanying notes are an integral part of these financial statements.
Dearborn Partners Rising Dividend Fund
| Statements of Changes in Net Assets |
| | | Year Ended | | | Year Ended | |
| | | February 29, 2024 | | | February 28, 2023 | |
| From Operations | | | | | | |
| Net investment income | | $ | 4,837,255 | | | $ | 4,164,080 | |
| Net realized gain (loss) on: | | | | | | | | |
| Investments | | | 11,534,469 | | | | (470,990 | ) |
| Net change in unrealized | | | | | | | | |
| appreciation (depreciation) on: | | | | | | | | |
| Investments | | | 61,448,690 | | | | (10,784,966 | ) |
| Net increase (decrease) in | | | | | | | | |
| net assets from operations | | | 77,820,414 | | | | (7,091,876 | ) |
| | | | | | | | | |
| From Dividend and Distributions to Shareholders | | | | | | | | |
| Net dividend and distributions – Class A | | | (1,154,924 | ) | | | (2,652,019 | ) |
| Net dividend and distributions – Class C | | | (73,884 | ) | | | (984,199 | ) |
| Net dividend and distributions – Class I | | | (1,888,809 | ) | | | (3,842,270 | ) |
| Net decrease in net assets resulting | | | | | | | | |
| from dividend and distributions paid | | | (3,117,617 | ) | | | (7,478,488 | ) |
| | | | | | | | | |
| From Capital Share Transactions | | | | | | | | |
| Proceeds from shares sold – Class A | | | 32,303,696 | | | | 34,619,876 | |
| Proceeds from shares sold – Class C | | | 6,813,359 | | | | 10,270,308 | |
| Proceeds from shares sold – Class I | | | 47,370,475 | | | | 44,302,633 | |
| Net asset value of shares issued to shareholders | | | | | | | | |
| in payment of distributions declared – Class A | | | 1,053,890 | | | | 2,487,927 | |
| Net asset value of shares issued to shareholders | | | | | | | | |
| in payment of distributions declared – Class C | | | 69,989 | | | | 946,200 | |
| Net asset value of shares issued to shareholders | | | | | | | | |
| in payment of distributions declared – Class I | | | 1,718,881 | | | | 3,579,655 | |
| Payments for shares redeemed – Class A | | | (21,251,505 | ) | | | (17,011,108 | ) |
| Payments for shares redeemed – Class C | | | (24,994,744 | ) | | | (24,596,221 | ) |
| Payments for shares redeemed – Class I | | | (43,720,451 | ) | | | (43,312,809 | ) |
| Net increase (decrease) in net assets | | | | | | | | |
| from capital share transactions | | | (636,410 | ) | | | 11,286,461 | |
| Total Increase (Decrease) in Net Assets | | | 74,066,387 | | | | (3,283,903 | ) |
| | | | | | | | | |
| Net Assets | | | | | | | | |
| Beginning of year | | $ | 464,623,558 | | | $ | 467,907,461 | |
| End of year | | $ | 538,689,945 | | | $ | 464,623,558 | |
The accompanying notes are an integral part of these financial statements.
Dearborn Partners Rising Dividend Fund – Class A
Per share Data for a Share Outstanding Throughout Each Year
| | | Year | | | Year | | | Year | | | Year | | | Year | |
| | | Ended | | | Ended | | | Ended | | | Ended | | | Ended | |
| | | February | | | February | | | February | | | February | | | February | |
| | | 29, | | | 28, | | | 28, | | | 28, | | | 29, | |
| | | 2024 | | | 2023 | | | 2022 | | | 2021 | | | 2020 | |
| Net Asset Value, Beginning of Year | | $ | 20.73 | | | $ | 21.40 | | | $ | 19.35 | | | $ | 16.91 | | | $ | 15.63 | |
| Income from investment operations: | | | | | | | | | | | | | | | | | | | | |
Net investment income(1) | | | 0.22 | | | | 0.20 | | | | 0.12 | | | | 0.16 | | | | 0.13 | |
| Net realized and unrealized | | | | | | | | | | | | | | | | | | | | |
gain (loss) on investments(2) | | | 3.26 | | | | (0.52 | ) | | | 2.46 | | | | 2.48 | | | | 1.38 | |
| Total from investment operations | | | 3.48 | | | | (0.32 | ) | | | 2.58 | | | | 2.64 | | | | 1.51 | |
| Less distributions paid: | | | | | | | | | | | | | | | | | | | | |
| From net investment income | | | (0.14 | ) | | | (0.17 | ) | | | (0.20 | ) | | | (0.10 | ) | | | (0.13 | ) |
| From net realized | | | | | | | | | | | | | | | | | | | | |
| gain on investments | | | — | | | | (0.18 | ) | | | (0.33 | ) | | | (0.10 | ) | | | (0.10 | ) |
| Total distributions paid | | | (0.14 | ) | | | (0.35 | ) | | | (0.53 | ) | | | (0.20 | ) | | | (0.23 | ) |
| Net Asset Value, End of Year | | $ | 24.07 | | | $ | 20.73 | | | $ | 21.40 | | | $ | 19.35 | | | $ | 16.91 | |
Total Return(3) | | | 16.87 | % | | | -1.49 | % | | | 13.18 | % | | | 15.73 | % | | | 9.58 | % |
| Supplemental Data and Ratios: | | | | | | | | | | | | | | | | | | | | |
| Net assets, end of year (000’s) | | $ | 205,652 | | | $ | 165,616 | | | $ | 150,440 | | | $ | 112,208 | | | $ | 88,097 | |
| Ratio of expenses to average net assets: | | | | | | | | | | | | | | | | | | | | |
| Before waivers and | | | | | | | | | | | | | | | | | | | | |
| reimbursements of expenses | | | 1.28 | % | | | 1.27 | % | | | 1.27 | % | | | 1.30 | % | | | 1.31 | % |
| After waivers and | | | | | | | | | | | | | | | | | | | | |
| reimbursements of expenses | | | 1.20 | % | | | 1.20 | % | | | 1.22 | %(5) | | | 1.25 | % | | | 1.27 | %(4) |
| Ratio of net investment income | | | | | | | | | | | | | | | | | | | | |
| to average net assets: | | | | | | | | | | | | | | | | | | | | |
| Before waivers and | | | | | | | | | | | | | | | | | | | | |
| reimbursements of expenses | | | 0.92 | % | | | 0.87 | % | | | 0.50 | % | | | 0.84 | % | | | 0.70 | % |
| After waivers and | | | | | | | | | | | | | | | | | | | | |
| reimbursements of expenses | | | 1.00 | % | | | 0.94 | % | | | 0.55 | %(5) | | | 0.89 | % | | | 0.74 | %(4) |
| Portfolio turnover rate | | | 17.53 | % | | | 12.32 | % | | | 9.03 | % | | | 14.46 | % | | | 4.13 | % |
(1) | Per share net investment income was calculated using average shares outstanding method. |
(2) | Realized and unrealized gain (loss) per share in this caption are balancing amounts necessary to reconcile the change in net asset value per share for the period, and may not reconcile with the aggregate gains and losses in the Statements of Operations due to share transactions for the period. |
(3) | Total return in the table represents the rate that the investor would have earned or lost on an investment in the Fund, assuming reinvestment of dividends. Excludes the effect of applicable sales charges. |
(4) | Effective June 28, 2019 the expense cap for Class A shares was decreased from 1.10% to 1.00% excluding Rule 12b-1 fees of 0.25%. |
(5) | Effective June 28, 2021 the expense cap for Class A shares was decreased from 1.00% to 0.95% excluding Rule 12b-1 fees of 0.25%. |
The accompanying notes are an integral part of these financial statements.
Dearborn Partners Rising Dividend Fund – Class C
Per share Data for a Share Outstanding Throughout Each Year
| | | Year | | | Year | | | Year | | | Year | | | Year | |
| | | Ended | | | Ended | | | Ended | | | Ended | | | Ended | |
| | | February | | | February | | | February | | | February | | | February | |
| | | 29, | | | 28, | | | 28, | | | 28, | | | 29, | |
| | | 2024 | | | 2023 | | | 2022 | | | 2021 | | | 2020 | |
| Net Asset Value, Beginning of Year | | $ | 20.53 | | | $ | 21.21 | | | $ | 19.17 | | | $ | 16.82 | | | $ | 15.56 | |
| Income from investment operations: | | | | | | | | | | | | | | | | | | | | |
Net investment income (loss)(1) | | | 0.06 | | | | 0.04 | | | | (0.04 | ) | | | 0.03 | | | | (0.00 | )(6) |
| Net realized and unrealized | | | | | | | | | | | | | | | | | | | | |
gain (loss) on investments(2) | | | 3.22 | | | | (0.50 | ) | | | 2.43 | | | | 2.46 | | | | 1.38 | |
| Total from investment operations | | | 3.28 | | | | (0.46 | ) | | | 2.39 | | | | 2.49 | | | | 1.38 | |
| Less distributions paid: | | | | | | | | | | | | | | | | | | | | |
| From net investment income | | | (0.02 | ) | | | (0.04 | ) | | | (0.02 | ) | | | (0.04 | ) | | | (0.02 | ) |
| From net realized | | | | | | | | | | | | | | | | | | | | |
| gain on investments | | | — | | | | (0.18 | ) | | | (0.33 | ) | | | (0.10 | ) | | | (0.10 | ) |
| Total distributions paid | | | (0.02 | ) | | | (0.22 | ) | | | (0.35 | ) | | | (0.14 | ) | | | (0.12 | ) |
| Net Asset Value, End of Year | | $ | 23.79 | | | $ | 20.53 | | | $ | 21.21 | | | $ | 19.17 | | | $ | 16.82 | |
Total Return(3) | | | 15.97 | % | | | -2.20 | % | | | 12.31 | % | | | 14.85 | % | | | 8.81 | % |
| Supplemental Data and Ratios: | | | | | | | | | | | | | | | | | | | | |
| Net assets, end of year (000’s) | | $ | 87,548 | | | $ | 92,624 | | | $ | 109,239 | | | $ | 110,863 | | | $ | 96,800 | |
| Ratio of expenses to average net assets: | | | | | | | | | | | | | | | | | | | | |
| Before waivers and | | | | | | | | | | | | | | | | | | | | |
| reimbursements of expenses | | | 2.03 | % | | | 2.02 | % | | | 2.02 | % | | | 2.05 | % | | | 2.06 | % |
| After waivers and | | | | | | | | | | | | | | | | | | | | |
| reimbursements of expenses | | | 1.95 | % | | | 1.95 | % | | | 1.97 | %(5) | | | 2.00 | % | | | 2.02 | %(4) |
| Ratio of net investment income (loss) | | | | | | | | | | | | | | | | | | | | |
| to average net assets: | | | | | | | | | | | | | | | | | | | | |
| Before waivers and | | | | | | | | | | | | | | | | | | | | |
| reimbursements of expenses | | | 0.17 | % | | | 0.12 | % | | | (0.24 | %) | | | 0.09 | % | | | (0.05 | %) |
| After waivers and | | | | | | | | | | | | | | | | | | | | |
| reimbursements of expenses | | | 0.25 | % | | | 0.19 | % | | | (0.19 | %)(5) | | | 0.14 | % | | | (0.01 | %)(4) |
| Portfolio turnover rate | | | 17.53 | % | | | 12.32 | % | | | 9.03 | % | | | 14.46 | % | | | 4.13 | % |
(1) | Per share net investment income (loss) was calculated using average shares outstanding method. |
(2) | Realized and unrealized gain (loss) per share in this caption are balancing amounts necessary to reconcile the change in net asset value per share for the period, and may not reconcile with the aggregate gains and losses in the Statements of Operations due to share transactions for the period. |
(3) | Total return in the table represents the rate that the investor would have earned or lost on an investment in the Fund, assuming reinvestment of dividends. Excludes the effect of applicable sales charges. |
(4) | Effective June 28, 2019 the expense cap for Class C shares was decreased from 1.10% to 1.00% excluding Rule 12b-1 fees of 1.00%. |
(5) | Effective June 28, 2021 the expense cap for Class C shares was decreased from 1.00% to 0.95% excluding Rule 12b-1 fees of 1.00%. |
(6) | Amount is between $(0.005) and $0.00. |
The accompanying notes are an integral part of these financial statements.
Dearborn Partners Rising Dividend Fund – Class I
Per share Data for a Share Outstanding Throughout Each Year
| | | Year | | | Year | | | Year | | | Year | | | Year | |
| | | Ended | | | Ended | | | Ended | | | Ended | | | Ended | |
| | | February | | | February | | | February | | | February | | | February | |
| | | 29, | | | 28, | | | 28, | | | 28, | | | 29, | |
| | | 2024 | | | 2023 | | | 2022 | | | 2021 | | | 2020 | |
| Net Asset Value, Beginning of Year | | $ | 20.78 | | | $ | 21.44 | | | $ | 19.39 | | | $ | 16.94 | | | $ | 15.65 | |
| Income from investment operations: | | | | | | | | | | | | | | | | | | | | |
Net investment income(1) | | | 0.28 | | | | 0.25 | | | | 0.18 | | | | 0.21 | | | | 0.17 | |
| Net realized and unrealized | | | | | | | | | | | | | | | | | | | | |
gain (loss) on investments(2) | | | 3.26 | | | | (0.52 | ) | | | 2.46 | | | | 2.48 | | | | 1.38 | |
| Total from investment operations | | | 3.54 | | | | (0.27 | ) | | | 2.64 | | | | 2.69 | | | | 1.55 | |
| Less distributions paid: | | | | | | | | | | | | | | | | | | | | |
| From net investment income | | | (0.19 | ) | | | (0.21 | ) | | | (0.26 | ) | | | (0.14 | ) | | | (0.16 | ) |
| From net realized | | | | | | | | | | | | | | | | | | | | |
| gain on investments | | | — | | | | (0.18 | ) | | | (0.33 | ) | | | (0.10 | ) | | | (0.10 | ) |
| Total distributions paid | | | (0.19 | ) | | | (0.39 | ) | | | (0.59 | ) | | | (0.24 | ) | | | (0.26 | ) |
| Net Asset Value, End of Year | | $ | 24.13 | | | $ | 20.78 | | | $ | 21.44 | | | $ | 19.39 | | | $ | 16.94 | |
Total Return(3) | | | 17.13 | % | | | -1.23 | % | | | 13.49 | % | | | 16.00 | % | | | 9.89 | % |
| Supplemental Data and Ratios: | | | | | | | | | | | | | | | | | | | | |
| Net assets, end of year (000’s) | | $ | 245,490 | | | $ | 206,384 | | | $ | 208,228 | | | $ | 165,995 | | | $ | 118,700 | |
| Ratio of expenses to average net assets: | | | | | | | | | | | | | | | | | | | | |
| Before waivers and | | | | | | | | | | | | | | | | | | | | |
| reimbursements of expenses | | | 1.03 | % | | | 1.02 | % | | | 1.02 | % | | | 1.05 | % | | | 1.06 | % |
| After waivers and | | | | | | | | | | | | | | | | | | | | |
| reimbursements of expenses | | | 0.95 | % | | | 0.95 | % | | | 0.97 | %(5) | | | 1.00 | % | | | 1.02 | %(4) |
| Ratio of net investment income | | | | | | | | | | | | | | | | | | | | |
| to average net assets: | | | | | | | | | | | | | | | | | | | | |
| Before waivers and | | | | | | | | | | | | | | | | | | | | |
| reimbursements of expenses | | | 1.17 | % | | | 1.12 | % | | | 0.75 | % | | | 1.08 | % | | | 0.96 | % |
| After waivers and | | | | | | | | | | | | | | | | | | | | |
| reimbursements of expenses | | | 1.25 | % | | | 1.19 | % | | | 0.80 | %(5) | | | 1.13 | % | | | 1.00 | %(4) |
| Portfolio turnover rate | | | 17.53 | % | | | 12.32 | % | | | 9.03 | % | | | 14.46 | % | | | 4.13 | % |
(1) | Per share net investment income was calculated using average shares outstanding method. |
(2) | Realized and unrealized gain (loss) per share in this caption are balancing amounts necessary to reconcile the change in net asset value per share for the period, and may not reconcile with the aggregate gains and losses in the Statements of Operations due to share transactions for the period. |
(3) | Total return in the table represents the rate that the investor would have earned or lost on an investment in the Fund, assuming reinvestment of dividends. |
(4) | Effective June 28, 2019 the expense cap for Class I shares was decreased from 1.10% to 1.00%. |
(5) | Effective June 28, 2021 the expense cap for Class I shares was decreased from 1.00% to 0.95%. |
The accompanying notes are an integral part of these financial statements.
Dearborn Partners Rising Dividend Fund
Notes to Financial Statements
February 29, 2024
| (1) | Organization |
| | |
| | Trust for Professional Managers (the “Trust”) was organized as a Delaware statutory trust under a Declaration of Trust dated May 29, 2001. The Trust is registered under the Investment Company Act of 1940, as amended (the “1940 Act”), as an open-end management investment company. The Dearborn Partners Rising Dividend Fund (the “Fund”) represents a distinct, diversified series with its own investment objective and policies within the Trust. The investment objective of the Fund is to seek current income, rising income over time, and long-term capital appreciation. The Trust may issue an unlimited number of shares of beneficial interest at $0.001 par value. The assets of the Fund are segregated, and a shareholder’s interest is limited to the class in which shares are held. The Fund currently offers three classes of shares, Class A, Class C and Class I. Each class of shares has identical rights and privileges except with respect to class-specific expenses and voting rights on matters affecting a single class of shares. The classes differ principally in their respective expenses. Class A shares are subject to an initial maximum sales charge of 5.00% imposed at the time of purchase. The sales charge declines as the amount purchased increases in accordance with the Fund’s prospectus. Class A shares are subject to a contingent deferred sales charge of 1.00% for purchases made at the $500,000 breakpoint that are redeemed within twelve months of purchase. Class C shares are subject to a 1.00% contingent deferred sales charge for redemptions made within twelve months of purchase, in accordance with the Fund’s prospectus. The contingent deferred sales charge for Class C Shares is 1.00% of the lesser of the original cost or the current market value of shares being redeemed. Class I shares are no-load shares. Class A and Class C shares are subject to a 0.25% and 1.00% distribution and service (Rule 12b-1) fee, respectively. The Fund is an investment company and accordingly follows the investment company accounting and reporting guidance of the Financial Accounting Standards Board (“FASB”) Accounting Standards Codification Topic 946 “Financial Services — Investment Companies”. The Fund commenced operations on April 10, 2013. Dearborn Partners, L.L.C. (the “Adviser”) serves on the Fund’s investment adviser. |
| | |
| (2) | Significant Accounting Policies |
| | |
| | The following is a summary of significant accounting policies consistently followed by the Fund in the preparation of the financial statements. These policies are in conformity with generally accepted accounting principles in the United States of America (“GAAP”). |
| | |
| | (a) Investment Valuation |
| | |
| | Each security owned by the Fund that is listed on a securities exchange is valued at its last sale price on that exchange on the date as of which assets are valued. When the security is listed on more than one exchange, the Fund will use the price of the exchange that the Fund generally considers to be the principal exchange on which the security is traded. |
| | |
| | Portfolio securities listed on the NASDAQ Stock Market, Inc. (“NASDAQ”) will be valued at the NASDAQ Official Closing Price (“NOCP”), which may not necessarily represent the last sale price. If there has been no sale on such exchange or on |
Dearborn Partners Rising Dividend Fund
Notes to Financial Statements (Continued)
February 29, 2024
| | NASDAQ on such day, the security is valued at the mean between the most recent bid and asked prices on such day or the security shall be valued at the latest sales price on the “composite market” for the day such security is being valued. The composite market is defined as a consolidation of the trade information provided by national securities and foreign exchanges and over-the-counter markets as published by an approved pricing service (“Pricing Service”). |
| | |
| | Debt securities, including short-term debt instruments having a maturity of 60 days or less, are valued at the mean in accordance with prices supplied by an approved Pricing Service. Pricing Services may use various valuation methodologies such as the mean between the bid and the asked prices, matrix pricing and other analytical pricing models as well as market transactions and dealer quotations. If a price is not available from a Pricing Service, the most recent quotation obtained from one or more broker-dealers known to follow the issue will be obtained. Quotations will be valued at the mean between the bid and the offer. Any discount or premium is accreted or amortized using the constant yield to maturity method. Constant yield amortization takes into account the income that is produced on a debt security. This accretion/amortization type utilizes the discount rate used in computing the present value of all future principal and interest payments made by a debt instrument and produces an amount equal to the cost of the debt instrument. |
| | |
| | Demand notes and repurchase agreements are valued at cost. If cost does not represent current market value the securities will be priced at fair value. |
| | |
| | Redeemable securities issued by open-end, registered investment companies, including money market funds, are valued at the net asset values (“NAVs”) of such companies for purchase and/or redemption orders placed on that day. All ETFs are valued at the last reported sale price on the exchange on which the security is principally traded. |
| | |
| | Foreign securities will be priced in their local currencies as of the close of their primary exchange or market or as of the time the Fund calculates its NAV, whichever is earlier. Foreign securities, currencies and other assets denominated in foreign currencies are then translated into U.S. dollars at the exchange rate of such currencies against the U.S. dollar, as provided by an approved Pricing Service or reporting agency. All assets denominated in foreign currencies will be converted into U.S. dollars using the applicable currency exchange rates as of the close of the NYSE, generally 4:00 p.m. Eastern Time. |
| | |
| | If market quotations are not readily available, a security or other asset will be valued at its fair value in accordance with Rule 2a-5 of the 1940 Act as determined under the Adviser’s fair value pricing procedures, subject to oversight by the Board of Trustees. These fair value pricing procedures will also be used to price a security when corporate events, events in the securities market and/or world events cause the Adviser to believe that a security’s last sale price may not reflect its actual fair value. The intended effect of using fair value pricing procedures is to ensure that the Fund is accurately priced. The Adviser will regularly evaluate whether the Fund’s fair value pricing procedures continue to be appropriate in light of the specific circumstances of the Fund and the quality of prices obtained through the application of such procedures. |
Dearborn Partners Rising Dividend Fund
Notes to Financial Statements (Continued)
February 29, 2024
| | FASB Accounting Standards Codification, “Fair Value Measurement” Topic 820 (“ASC 820”), establishes an authoritative definition of fair value and sets out a hierarchy for measuring fair value. ASC 820 requires an entity to evaluate certain factors to determine whether there has been a significant decrease in volume and level of activity for the security such that recent transactions and quoted prices may not be determinative of fair value and further analysis and adjustment may be necessary to estimate fair value. ASC 820 also requires enhanced disclosures regarding the inputs and valuation techniques used to measure fair value in those instances as well as expanded disclosure of valuation levels for each class of investments. These inputs are summarized in the three broad levels listed below: |
| | Level 1— | Quoted prices in active markets for identical securities. |
| | | |
| | Level 2— | Other significant observable inputs (including quoted prices for similar securities, interest rates, prepayment speeds, credit risk, etc.). |
| | | |
| | Level 3— | Significant unobservable inputs (including the Fund’s own assumptions in determining the fair value of investments). |
| | The inputs or methodology used for valuing securities are not necessarily an indication of the risk associated with investing in those securities. The following is a summary of the inputs used to value the Fund’s investments carried at fair value as of February 29, 2024: |
| | | | Level 1 | | | Level 2 | | | Level 3 | | | Total | |
| | Assets | | | | | | | | | | | | |
| | Common Stocks(1) | | $ | 525,490,780 | | | $ | — | | | $ | — | | | $ | 525,490,780 | |
| | Real Estate | | | | | | | | | | | | | | | | |
| | Investment Trusts | | | 10,185,877 | | | | — | | | | — | | | | 10,185,877 | |
| | Money Market Funds | | | 2,266,495 | | | | — | | | | — | | | | 2,266,495 | |
| | Total Assets | | $ | 537,943,152 | | | $ | — | | | $ | — | | | $ | 537,943,152 | |
| | (1) | See the Schedule of Investments for industry classifications. |
| | The Fund measures Level 3 activity as of the end of the period. For the year ended February 29, 2024, the Fund did not hold any Level 3 securities. |
| | |
| | The Fund did not hold financial derivative instruments during the reporting period. |
| | |
| | (b) Federal Income Taxes |
| | |
| | The Fund complies with the requirements of Subchapter M of the Internal Revenue Code of 1986, as amended (the “Code”), necessary to qualify as a regulated investment company and makes the requisite distributions of income and capital gains to its shareholders sufficient to relieve it of all or substantially all federal income taxes. Therefore, no federal income tax provision has been provided. |
| | |
| | As of and during the year ended February 29, 2024, the Fund did not have a liability for any unrecognized tax benefits. The Fund recognizes interest and penalties, if any, related to unrecognized tax benefits as income tax expense in the Statement of Operations. During the year ended February 29, 2024, the Fund did not incur any interest or penalties. At February 29, 2024, the fiscal years 2021 through 2024 remained open to examination in the Fund’s major tax jurisdictions. |
Dearborn Partners Rising Dividend Fund
Notes to Financial Statements (Continued)
February 29, 2024
| | (c) Distributions to Shareholders |
| | |
| | The Fund will distribute any net investment income and any net realized long- or short-term capital gains at least annually, and as frequently as quarterly. Distributions from net realized gains for book purposes may include short-term capital gains. All short-term capital gains are included in ordinary income for tax purposes. Distributions to shareholders are recorded on the ex-dividend date. The Fund may also pay a special distribution at the end of the calendar year to comply with federal tax requirements. Income and capital gains distributions may differ from GAAP, primarily due to timing differences in the recognition of income, gains and losses by the Fund. GAAP requires that certain components of net assets relating to permanent differences be reclassified between the components of net assets. These reclassifications have no effect on net assets or NAV per share. |
| | |
| | (d) Use of Estimates |
| | |
| | The preparation of financial statements in conformity with GAAP requires management to make estimates and assumptions that affect the reported amounts of assets and liabilities and disclosure of contingent assets and liabilities at the date of the financial statements and the reported amounts of revenues and expenses during the reporting period. Actual results could differ from those estimates. |
| | |
| | (e) Share Valuation |
| | |
| | The NAV per share of the Fund is calculated by dividing the sum of the value of the securities held by the Fund, plus cash or other assets, minus all liabilities (including estimated accrued expenses) by the total number of shares outstanding for the Fund, rounded to the nearest cent. The Fund’s shares will not be priced on the days on which the NYSE is closed for trading. |
| | |
| | (f) Allocation of Income, Expenses and Gains/Losses |
| | |
| | Income, expenses (other than those deemed attributable to a specific share class), and gains and losses of the Fund are allocated daily to each class of shares based upon the ratio of net assets represented by each class as a percentage of the net assets of the Fund. Expenses deemed directly attributable to a class of shares are recorded by the specific class. Most Fund expenses are allocated by class based on relative net assets. Distribution and service (Rule 12b-1) fees are expensed at 0.25% and 1.00% of average daily net assets of the Class A and Class C shares, respectively. Expenses associated with a specific fund in the Trust are charged to that fund. Common Trust expenses are typically allocated evenly between the funds of the Trust, or by other equitable means. |
| | |
| | (g) Other |
| | |
| | Investment transactions are recorded on the trade date. The Fund determines the gain or loss from investment transactions on the identified cost basis by comparing the original cost of the security lot sold with the net sale proceeds. Dividend income, less foreign withholding tax, is recognized on the ex-dividend date and interest income is recognized on an accrual basis. Withholding taxes on foreign dividends have been provided for in accordance with the Fund’s understanding of the applicable country’s tax rules and rates. Distributions received from the Fund’s investments in |
Dearborn Partners Rising Dividend Fund
Notes to Financial Statements (Continued)
February 29, 2024
| | Master Limited Partnerships (“MLPs”) and Real Estate Investment Trusts (“REITs”) are comprised of ordinary income, capital gains and return of capital, as applicable. For financial statement purposes, the Fund uses estimates to characterize these distributions received as return of capital, capital gains or ordinary income. Such estimates are based on historical information available from each MLP or REIT and other industry sources. These estimates may subsequently be revised based on information received for the security after its tax reporting periods are concluded, as the actual character of these distributions is not known until after the fiscal year end of the Fund. Changes to estimates will be recorded in the period they are known. The distributions received from MLP and REIT securities that have been classified as income and capital gains are included in dividend income and net realized gain on investments, respectively, on the Statement of Operations. The distributions received that are classified as return of capital reduced the cost of investments on the Statement of Assets and Liabilities. |
| | |
| (3) | Federal Tax Matters |
| | |
| | The tax character of distributions paid during the years ended February 29, 2024 and February 28, 2023 is as follows: |
| | | | February 29, 2024 | | | February 28, 2023 | |
| | Ordinary Income | | $ | 3,117,617 | | | $ | 3,572,059 | |
| | Long-Term Capital Gain | | $ | — | | | $ | 3,906,429 | |
| | The Fund designated as long-term capital gain dividend, pursuant to Section 852(b)(3) of the Code, the amount necessary to reduce the earnings and profits of the Fund related to net capital gain to zero for the tax year ended February 29, 2024. |
| | |
| | As of February 29, 2024, the components of accumulated earnings on a tax basis were as follows: |
| | Cost basis of investments for federal income tax purposes | | $ | 324,999,183 | |
| | Gross tax unrealized appreciation | | $ | 218,080,052 | |
| | Gross tax unrealized depreciation | | | (5,136,083 | ) |
| | Net tax unrealized appreciation | | | 212,943,969 | |
| | Undistributed ordinary income | | | 2,311,659 | |
| | Undistributed long-term capital gain | | | 11,063,479 | |
| | Distributable earnings | | | 13,375,138 | |
| | Other accumulated losses | | | — | |
| | Total distributable earnings | | $ | 226,319,107 | |
| | As of February 29, 2024, the Fund had no capital loss carryovers to be carried forward to offset future realized capital gains. During the fiscal year ended February 29, 2024, the Fund utilized $470,990 in capital loss carryovers. |
| | |
| | GAAP requires that certain components of net assets relating to permanent differences be reclassified between financial and tax reporting. These reclassifications have no effect on net assets or net asset value per share. As of February 29, 2024, no permanent tax adjustments were required to be made between Paid-in capital and Total distributable earnings on the Statement of Assets and Liabilities. |
Dearborn Partners Rising Dividend Fund
Notes to Financial Statements (Continued)
February 29, 2024
| (4) | Investment Adviser |
| | |
| | The Trust has an Investment Advisory Agreement (the “Agreement”) with the Adviser to furnish investment advisory services to the Fund. Under the terms of the Agreement, the Fund compensates the Adviser for its management services at the annual rate of 0.85% of the Fund’s average daily net assets. |
| | |
| | The Adviser has contractually agreed to waive its management fee and/or reimburse the Fund’s other expenses at least through June 28, 2025, at the discretion of the Adviser and the Board of Trustees, to the extent necessary to ensure that the Fund’s operating expenses (exclusive of front-end or contingent deferred sales loads, Rule 12b-1 plan fees, shareholder servicing plan fees, taxes, leverage (i.e., any expenses incurred in connection with borrowings made by the Fund), interest (including interest incurred in connection with borrowings made by the Fund), brokerage commissions and other transactional expenses, acquired fund fees and expenses, dividends or interest expense on short positions, expenses incurred in connection with any merger or reorganization or extraordinary expenses such as litigation, collectively “Excluded Expenses”) do not exceed 0.95% (the “Expense Limitation Cap”) of the Fund’s average daily net assets. Any such waiver or reimbursement is subject to later adjustment to allow the Adviser to recoup amounts waived or reimbursed within three years from the date such amount was waived or reimbursed, subject to the operating expense limitation agreement, if such recoupments will not cause the Fund to exceed the lesser of: (1) the expense limitation in place at the time of the waiver; or (2) the expense limitation in place at the time of the recoupment. The following table shows the remaining waived or reimbursed expenses subject to potential recovery expiring during the period ending: |
| | | | Class A | | | Class C | | | Class I | |
| | February 28, 2025 | | $ | 75,044 | | | $ | 62,655 | | | $ | 111,262 | |
| | February 28, 2026 | | $ | 114,051 | | | $ | 71,378 | | | $ | 147,760 | |
| | February 28, 2027 | | $ | 151,345 | | | $ | 71,950 | | | $ | 182,261 | |
| (5) | Distribution Plan |
| | |
| | The Trust has adopted a plan pursuant to Rule 12b-1 (the “12b-1 Plan”), on behalf of the Fund, which authorizes it to pay Quasar Distributors, LLC (the “Distributor” or “Quasar”) a distribution fee of 0.25% and 1.00% of the Fund’s average daily net assets of Class A and Class C shares, respectively for services to prospective Fund shareholders and distribution of Fund shares. The following table details the fees earned pursuant to the 12b-1 Plan during the year ended February 29, 2024, as well as the fees owed as of February 29, 2024. |
| | | | Fees Earned | | | Fees Owed as of | |
| | | | During Period | | | February 29, 2024 | |
| | Class A | | $ | 459,292 | | | $ | 38,403 | |
| | Class C | | $ | 883,581 | | | $ | 81,228 | |
| | The Distributor acts as the Fund’s principal underwriter in a continuous public offering of the Fund’s shares. |
Dearborn Partners Rising Dividend Fund
Notes to Financial Statements (Continued)
February 29, 2024
| (6) | Related Party Transactions |
| | |
| | Fund Services acts as the Fund’s administrator and fund accountant under an Administration Agreement. Fund Services prepares various federal and state regulatory filings, reports and returns for the Fund; prepares reports and materials to be supplied to the Trustees; monitors the activities of the Fund’s custodian, transfer agent and accountants; coordinates the preparation and payment of the Fund’s expenses; and reviews the Fund’s expense accruals. Fund Services also serves as the transfer agent to the Fund. U.S. Bank, N.A. (“U.S. Bank”), an affiliate of Fund Services, serves as the Fund’s custodian. The Trust’s Chief Compliance Officer is also an employee of Fund Services. The following table details the fees earned for each service during the year ended February 29, 2024, as well as the fees owed as of February 29, 2024. |
| | | | Fees Earned | | | Fees Owed as of | |
| | | | During Period | | | February 29, 2024 | |
| | Administration/Accounting and Pricing | | $ | 427,361 | | | $ | 78,697 | |
| | Custody | | $ | 52,713 | | | $ | 8,882 | |
| | Transfer agent | | $ | 219,451 | (1) | | $ | 38,888 | |
| | Chief Compliance Officer | | $ | 17,629 | | | $ | 3,264 | |
| | (1) | This amount does not include sub-transfer agency fees, therefore it does not agree to the amount on the Statement of Operations. |
| | The Fund also has a line of credit with U.S. Bank (see Note 10). |
| | |
| | Certain officers of the Fund are also employees of Fund Services. A Trustee of the Trust is affiliated with Fund Services and U.S. Bank. |
| | |
| (7) | Capital Share Transactions |
| | | | Year Ended | | | Year Ended | |
| | | | February 29, 2024 | | | February 28, 2023 | |
| | Class A | | | | | | |
| | Shares sold | | | 1,473,129 | | | | 1,638,797 | |
| | Shares redeemed | | | (966,448 | ) | | | (801,268 | ) |
| | Shares issued in | | | | | | | | |
| | reinvestment of dividends | | | 48,995 | | | | 120,666 | |
| | Net increase | | | 555,676 | | | | 958,195 | |
| | | | | | | | | | |
| | Class C | | | | | | | | |
| | Shares sold | | | 315,910 | | | | 490,968 | |
| | Shares redeemed | | | (1,151,094 | ) | | | (1,174,715 | ) |
| | Shares issued in | | | | | | | | |
| | reinvestment of dividends | | | 3,240 | | | | 45,895 | |
| | Net decrease | | | (831,944 | ) | | | (637,852 | ) |
| | | | | | | | | | |
| | Class I | | | | | | | | |
| | Shares sold | | | 2,131,727 | | | | 2,090,281 | |
| | Shares redeemed | | | (1,970,659 | ) | | | (2,044,033 | ) |
| | Shares issued in | | | | | | | | |
| | reinvestment of dividends | | | 79,544 | | | | 173,566 | |
| | Net increase | | | 240,612 | | | | 219,814 | |
Dearborn Partners Rising Dividend Fund
Notes to Financial Statements (Continued)
February 29, 2024
| (8) | Investment Transactions |
| | |
| | The aggregate purchases and sales of securities, excluding short-term investments, for the Fund for the year ended February 29, 2024, were $94,386,557 and $84,926,153, respectively. There were no purchases or sales of U.S. government securities for the Fund. |
| | |
| (9) | Beneficial Ownership |
| | |
| | The beneficial ownership, either directly or indirectly, of more than 25% of the voting securities of a fund creates a presumption of control of the fund, under Section 2(a)(9) of the 1940 Act. At February 29, 2024, Charles Schwab & Co., Inc. held 43.43% of the Fund’s shares outstanding for the benefit of its customers. |
| | |
| (10) | Line of Credit |
| | |
| | At February 29, 2024, the Fund had a line of credit in the amount of the lesser of $20,000,000, or 33.33% of the fair value of unencumbered assets, which matures on August 3, 2024. This secured line of credit is intended to provide short-term financing, if necessary, subject to certain restrictions, in connection with shareholder redemptions. The credit facility is with the Fund’s custodian, U.S. Bank (the “Lender”). As collateral, the Lender receives a first priority security interest in securities of the Fund in an amount of at least 300% of any draw on the line of credit by the Fund. Interest accrues at the Lender’s Prime Rate, which as of February 29, 2024 was 8.50%. During the year ended February 29, 2024, the Fund did not utilize the line of credit. |
| | |
| (11) | Subsequent Events |
| | |
| | In preparing these financial statements, the Fund has evaluated events and transactions for potential recognition or disclosure through the date the financial statements were issued. |
| | |
| | On March 28, 2024, the Fund declared and paid a distribution from ordinary income to shareholders of record on March 27, 2024 of $1,006,777 and $1,481,417 for Class A and Class I shares, respectively. Class C shares did not distribute any income on March 28, 2024. |
| | |
| (12) | Recent Market Events |
| | |
| | U.S. and international markets have experienced and may continue to experience significant periods of volatility in recent years and months due to a number of economic, political and global macro factors including uncertainty regarding inflation and central banks’ interest rate increases, the possibility of a national or global recession, trade tensions, political events, the war between Russia and Ukraine, significant conflict between Israel and Hamas in the Middle East, and the impact of the coronavirus (COVID-19) global pandemic. The impact of COVID-19 may last for an extended period of time. As a result of continuing political tensions and armed conflicts, including the war between Ukraine and Russia, the U.S. and the European Union imposed sanctions on certain Russian individuals and companies, including |
Dearborn Partners Rising Dividend Fund
Notes to Financial Statements (Continued)
February 29, 2024
| | certain financial institutions, and have limited certain exports and imports to and from Russia. The war has contributed to recent market volatility and may continue to do so. These developments, as well as other events, could result in further market volatility and negatively affect financial asset prices, the liquidity of certain securities and the normal operations of securities exchanges and other markets, despite government efforts to address market disruptions. Continuing market volatility as a result of recent market conditions or other events may have adverse effects on your account. |
Dearborn Partners Rising Dividend Fund
Report of Independent Registered Public Accounting Firm
To the Shareholders of Dearborn Partners Rising Dividend Fund and
Board of Trustees of Trust for Professional Managers
Opinion on the Financial Statements
We have audited the accompanying statement of assets and liabilities, including the schedule of investments, of Dearborn Partners Rising Dividend Fund (the “Fund”), a series of Trust for Professional Managers, as of February 29, 2024, the related statement of operations for the year then ended, the statements of changes in net assets for each of the two years in the period then ended, the financial highlights for each of the five years in the period then ended, and the related notes (collectively referred to as the “financial statements”). In our opinion, the financial statements present fairly, in all material respects, the financial position of the Fund as of February 29, 2024, the results of its operations for the year then ended, the changes in net assets for each of the two years in the period then ended, and the financial highlights for each of the five years in the period then ended, in conformity with accounting principles generally accepted in the United States of America.
Basis for Opinion
These financial statements are the responsibility of the Fund’s management. Our responsibility is to express an opinion on the Fund’s financial statements based on our audits. We are a public accounting firm registered with the Public Company Accounting Oversight Board (United States) (“PCAOB”) and are required to be independent with respect to the Fund in accordance with the U.S. federal securities laws and the applicable rules and regulations of the Securities and Exchange Commission and the PCAOB.
We conducted our audits in accordance with the standards of the PCAOB. Those standards require that we plan and perform the audit to obtain reasonable assurance about whether the financial statements are free of material misstatement whether due to error or fraud.
Our audits included performing procedures to assess the risks of material misstatement of the financial statements, whether due to error or fraud, and performing procedures that respond to those risks. Such procedures included examining, on a test basis, evidence regarding the amounts and disclosures in the financial statements. Our procedures included confirmation of securities owned as of February 29, 2024, by correspondence with the custodian. Our audits also included evaluating the accounting principles used and significant estimates made by management, as well as evaluating the overall presentation of the financial statements. We believe that our audits provide a reasonable basis for our opinion.
We have served as the Fund’s auditor since 2013.
COHEN & COMPANY, LTD.
Milwaukee, Wisconsin
April 25, 2024
Dearborn Partners Rising Dividend Fund
Notice of Privacy Policy & Practices
(Unaudited)
We collect non-public personal information about you from the following sources:
• information we receive about you on applications or other forms;
• information you give us orally; and
• information about your transactions with us or others.
The types of non-public personal information we collect and share can include:
• social security numbers;
• account balances;
• account transactions;
• transaction history;
• wire transfer instructions; and
• checking account information.
What Information We Disclose
We do not disclose any non-public personal information about our shareholders or former shareholders without the shareholder’s authorization, except as permitted by law or in response to inquiries from governmental authorities. We may share information with affiliated parties and unaffiliated third parties with whom we have contracts for servicing the Fund. We will provide unaffiliated third parties with only the information necessary to carry out their assigned responsibility.
How We Protect Your Information
All shareholder records will be disposed of in accordance with applicable law. We maintain physical, electronic and procedural safeguards to protect your non-public personal information and require third parties to treat your non-public personal information with the same high degree of confidentiality.
In the event that you hold shares of the Fund through a financial intermediary, including, but not limited to, a broker-dealer, bank or trust company, the privacy policy of your financial intermediary would govern how your non-public personal information would be shared with unaffiliated third parties.
Dearborn Partners Rising Dividend Fund
Additional Information
(Unaudited)
Tax Information
For the fiscal year ended February 29, 2024, certain dividends paid by the Fund may be subject to a maximum tax rate of 23.8%, as provided for by the Jobs and Growth Tax Relief Reconciliation Act of 2003. The percentage of dividends declared from ordinary income designated as qualified dividend income was 100%.
For corporate shareholders, the percent of ordinary income distributions qualifying for the corporate dividends received deduction for the fiscal year ended February 29, 2024 was 100%.
Indemnifications
Under the Trust’s organizational documents, its officers and trustees are indemnified against certain liabilities arising out of the performance of their duties to the Fund. In addition, in the normal course of business, the Fund enters into contracts that provide general indemnifications to other parties. The Fund’s maximum exposure under these arrangements is unknown as this would involve future claims that may be made against the Fund that have not yet occurred. However, the Fund has not had prior claims or losses pursuant to these contracts and expects the risk of loss to be remote.
Information about Trustees
The business and affairs of the Trust are managed under the direction of the Board of Trustees. Information pertaining to the Trustees of the Trust is set forth below. The Statement of Additional Information includes additional information about the Trustees and is available, without charge, upon request by calling (888) 983-3380.
| | | | | | Other |
| | | Term of | Number of | | Directorships |
| | | Office and | Portfolios | Principal | Held by |
| Name, | Position(s) | Length | in Trust | Occupation(s) | Trustee |
| Address and | Held with | of Time | Overseen | During the | During the |
Year of Birth | the Trust | Served | by Trustee | Past Five Years | Past Five Years |
| Independent Trustees | | | | | |
| | | | | | |
| Michael D. | Trustee | Indefinite | 31 | Professor | Independent |
| Akers, Ph.D. | | Term; Since | | Emeritus, | Trustee, USA |
| 615 E. Michigan St. | | August 22, | | Department of | MUTUALS |
| Milwaukee, WI 53202 | | 2001 | | Accounting (June | (an open-end |
| Year of Birth: 1955 | | | | 2019–Present), | investment |
| | | | | Professor, | company) |
| | | | | Department | (2001–2021). |
| | | | | of Accounting | |
| | | | | (2004–2019), | |
| | | | | Marquette | |
| | | | | University. | |
Dearborn Partners Rising Dividend Fund
Additional Information (Continued)
(Unaudited)
| | | | | | Other |
| | | Term of | Number of | | Directorships |
| | | Office and | Portfolios | Principal | Held by |
| Name, | Position(s) | Length | in Trust | Occupation(s) | Trustee |
| Address and | Held with | of Time | Overseen | During the | During the |
Year of Birth | the Trust | Served | by Trustee | Past Five Years | Past Five Years |
| Gary A. Drska | Trustee | Indefinite | 31 | Retired; | Independent |
| 615 E. Michigan St. | | Term; Since | | Former Pilot, | Trustee, USA |
| Milwaukee, WI 53202 | | August 22, | | Frontier/Midwest | MUTUALS |
| Year of Birth: 1956 | | 2001 | | Airlines, Inc. | (an open-end |
| | | | | (airline company) | investment |
| | | | | (1986–2021). | company) |
| | | | | | (2001–2021). |
| | | | | | |
| Vincent P. Lyles | Trustee | Indefinite | 31 | Executive Director, | Independent |
| 615 E. Michigan St. | | Term; Since | | Milwaukee | Director, BMO |
| Milwaukee, WI 53202 | | April 6, | | Succeeds | Funds, Inc. |
| Year of Birth: 1961 | | 2022 | | (education | (an open-end |
| | | | | advocacy | investment |
| | | | | organization) | company) |
| | | | | (2023–present); | (2017–2022). |
| | | | | System Vice | |
| | | | | President of | |
| | | | | Community | |
| | | | | Relations, Advocate | |
| | | | | Aurora Health Care | |
| | | | | (health care | |
| | | | | provider) (2019– | |
| | | | | 2022). | |
| | | | | | |
| Erik K. Olstein | Trustee | Indefinite | 31 | Retired; President | N/A |
| 615 E. Michigan St. | | Term; Since | | and Chief | |
| Milwaukee, WI 53202 | | April 6, | | Operating Officer | |
| Year of Birth: 1967 | | 2022 | | (2000–2020), | |
| | | | | Olstein Capital | |
| | | | | Management, L.P. | |
| | | | | (asset management | |
| | | | | firm). | |
| | | | | | |
| Lisa Zúñiga Ramírez | Trustee | Indefinite | 31 | Retired; Principal | Director, Peoples |
| 615 E. Michigan St. | | Term; Since | | and Senior | Financial |
| Milwaukee, WI 53202 | | April 6, | | Portfolio Manager, | Services Corp. |
| Year of Birth: 1969 | | 2022 | | Segall, Bryant & | (a publicly-traded |
| | | | | Hamill, LLC (asset | bank holding |
| | | | | management firm) | company) |
| | | | | (2018–2020). | (2022–present); |
| | | | | | Independent |
| | | | | | Director, Century |
| | | | | | Communities, |
| | | | | | Inc. (a publicly- |
| | | | | | traded |
| | | | | | homebuilding |
| | | | | | company) |
| | | | | | (October |
| | | | | | 2023–present). |
Dearborn Partners Rising Dividend Fund
Additional Information (Continued)
(Unaudited)
| | | | | | Other |
| | | Term of | Number of | | Directorships |
| | | Office and | Portfolios | Principal | Held by |
| Name, | Position(s) | Length | in Trust | Occupation(s) | Trustee |
| Address and | Held with | of Time | Overseen | During the | During the |
Year of Birth | the Trust | Served | by Trustee | Past Five Years | Past Five Years |
| Gregory M. Wesley | Trustee | Indefinite | 31 | Senior Vice | N/A |
| 615 E. Michigan St. | | Term; Since | | President of | |
| Milwaukee, WI 53202 | | April 6, | | Strategic Alliances | |
| Year of Birth: 1969 | | 2022 | | and Business | |
| | | | | Development, | |
| | | | | Medical College of | |
| | | | | Wisconsin (2016– | |
| | | | | present). | |
| | | | | | |
| Interested Trustee and Officers | | | | | |
| | | | | | |
| John P. Buckel* | Chair- | Indefinite | 31 | Vice President, | N/A |
| 615 E. Michigan St. | person, | Term; | | U.S. Bancorp | |
| Milwaukee, WI 53202 | Trustee, | Chairperson | | Fund Services, | |
| Year of Birth: 1957 | President | and Trustee | | LLC (2004– | |
| | and | (since January | | present). | |
| | Principal | 19, 2023); | | | |
| | Executive | President | | | |
| | Officer | and Principal | | | |
| | | Executive | | | |
| | | Officer (since | | | |
| | | January 24, | | | |
| | | 2013) | | | |
| | | | | | |
| Jennifer A. Lima | Vice | Indefinite | N/A | Vice President, | N/A |
| 615 E. Michigan St. | President, | Term; Since | | U.S. Bancorp | |
| Milwaukee, WI 53202 | Treasurer | January 24, | | Fund Services, | |
| Year of Birth: 1974 | and | 2013 | | LLC (2002– | |
| | Principal | | | present). | |
| | Financial | | | | |
| | and | | | | |
| | Accounting | | | | |
| | Officer | | | | |
| | | | | | |
| Deanna B. Marotz | Chief | Indefinite | N/A | Senior Vice | N/A |
| 615 E. Michigan St. | Compliance | Term; Since | | President, U.S. | |
| Milwaukee, WI 53202 | Officer, | October 21, | | Bancorp Fund | |
| Year of Birth: 1965 | Senior Vice | 2021 | | Services, LLC | |
| | President | | | (2021–present); | |
| | and | | | Chief Compliance | |
| | Anti-Money | | | Officer, | |
| | Laundering | | | Keeley-Teton | |
| | Officer | | | Advisors, LLC and | |
| | | | | Teton Advisors, Inc | |
| | | | | (2017–2021). | |
| * | Mr. Buckel is deemed to be an “interested person” of the Trust as defined by the 1940 Act due to his position and material business relationship with the Trust. |
Dearborn Partners Rising Dividend Fund
Additional Information (Continued)
(Unaudited)
| | | | | | Other |
| | | Term of | Number of | | Directorships |
| | | Office and | Portfolios | Principal | Held by |
| Name, | Position(s) | Length | in Trust | Occupation(s) | Trustee |
| Address and | Held with | of Time | Overseen | During the | During the |
Year of Birth | the Trust | Served | by Trustee | Past Five Years | Past Five Years |
| Jay S. Fitton | Secretary | Indefinite | N/A | Assistant Vice | N/A |
| 615 E. Michigan St. | | Term; Since | | President, U.S. | |
| Milwaukee, WI 53202 | | July 22, | | Bancorp Fund | |
| Year of Birth: 1970 | | 2019 | | Services, LLC | |
| | | | | (2019–present); | |
| | | | | Partner, Practus, | |
| | | | | LLP (2018–2019). | |
| | | | | | |
| Kelly A. Strauss | Assistant | Indefinite | N/A | Assistant Vice | N/A |
| 615 E. Michigan St. | Treasurer | Term; Since | | President, U.S. | |
| Milwaukee, WI 53202 | | April 23, | | Bancorp Fund | |
| Year of Birth: 1987 | | 2015 | | Services, LLC | |
| | | | | (2011–present). | |
| | | | | | |
| Laura A. Carroll | Assistant | Indefinite | N/A | Assistant Vice | N/A |
| 615 E. Michigan St. | Treasurer | Term; Since | | President, U.S. | |
| Milwaukee, WI 53202 | | August 20, | | Bancorp Fund | |
| Year of Birth: 1985 | | 2018 | | Services, LLC | |
| | | | | (2007–present). | |
| | | | | | |
| Shannon Coyle | Assistant | Indefinite | N/A | Officer, U.S. | N/A |
| 615 E. Michigan St. | Treasurer | Term; Since | | Bancorp Fund | |
| Milwaukee, WI 53202 | | August 26, | | Services, LLC | |
| Year of Birth: 1990 | | 2022 | | (2015–present). | |
| | | | | | |
| Marissa Pawlinski | Assistant | Indefinite | N/A | Assistant Vice | N/A |
| 615 E. Michigan St. | Secretary | Term; Since | | President, U.S. | |
| Milwaukee, WI 53202 | | January | | Bancorp Fund | |
| Year of Birth: 1996 | | 2024 | | Services, LLC | |
| | | | | (since 2023); | |
| | | | | Regulatory | |
| | | | | Administration | |
| | | | | Attorney, U.S. | |
| | | | | Bancorp Fund | |
| | | | | Services, LLC | |
| | | | | (since 2022); | |
| | | | | Judicial Law Clerk, | |
| | | | | Milwaukee County | |
| | | | | Circuit Court | |
| | | | | (2021–2022); | |
| | | | | Legal Intern, City | |
| | | | | of Brookfield | |
| | | | | (2020–2021); | |
| | | | | Student, Marquette | |
| | | | | University Law | |
| | | | | School (2019–2021). | |
(This Page Intentionally Left Blank.)
A NOTE ON FORWARD LOOKING STATEMENTS (Unaudited)
Except for historical information contained in this report for the Fund, the matters discussed in this report may constitute forward-looking statements made pursuant to the safe-harbor provisions of the Private Securities Litigation Reform Act of 1995. These include any adviser or portfolio manager predictions, assessments, analyses or outlooks for individual securities, industries, market sectors and/or markets. These statements involve risks and uncertainties. In addition to the general risks described for the Fund in the current Prospectus, other factors bearing on this report include the accuracy of the Adviser’s or portfolio managers’ forecasts and predictions, and the appropriateness of the investment programs designed by the Adviser or portfolio managers to implement their strategies efficiently and effectively. Any one or more of these factors, as well as other risks affecting the securities markets and investment instruments generally, could cause the actual results of the Fund to differ materially as compared to benchmarks associated with the Fund.
ADDITIONAL INFORMATION (Unaudited)
The Fund has adopted proxy voting policies and procedures that delegate to the Adviser the authority to vote proxies. A description of the Fund’s proxy voting policies and procedures is available without charge, upon request, by calling the Fund toll-free at (888) 983-3380. A description of these policies and procedures is also included in the Fund’s Statement of Additional Information, which is available on the SEC’s website at http://www.sec.gov.
The Fund’s proxy voting record for the most recent 12-month period ended June 30 is available without charge, upon request, by calling, toll-free, (888) 983-3380, or by accessing the SEC’s website at http://www.sec.gov.
The Fund files its complete schedule of portfolio holdings with the SEC for the first and third quarters of each fiscal year on Part F of Form N-PORT. Shareholders may view the Fund’s Form N-PORT on the SEC’s website at www.sec.gov.
HOUSEHOLDING (Unaudited)
In an effort to decrease costs, the Fund intends to reduce the number of duplicate prospectuses and certain other shareholder documents you receive by sending only one copy of each to those addresses shared by two or more accounts and to shareholders the Fund reasonably believes are from the same family or household. Once implemented, if you would like to discontinue householding for your accounts, please call toll-free at (888) 983-3380 to request individual copies of these documents. Once the Fund receives notice to stop householding, the Fund will begin sending individual copies 30 days after receiving your request. This policy does not apply to account statements.
Dearborn Partners Rising Dividend Fund
| Investment Adviser | Dearborn Partners, L.L.C. |
| | 200 West Madison Street |
| | Suite 1950 |
| | Chicago, Illinois 60606 |
| | |
| Legal Counsel | Godfrey & Kahn, S.C. |
| | 833 East Michigan Street |
| | Suite 1800 |
| | Milwaukee, Wisconsin 53202 |
| | |
| Independent Registered Public | Cohen & Company, Ltd. |
| Accounting Firm | 342 North Water Street |
| | Suite 830 |
| | Milwaukee, Wisconsin 53202 |
| | |
| Transfer Agent, Fund Accountant and | U.S. Bancorp Fund Services, LLC |
| Fund Administrator | 615 East Michigan Street |
| | Milwaukee, Wisconsin 53202 |
| | |
| Custodian | U.S. Bank, N.A. |
| | Custody Operations |
| | 1555 North River Center Drive |
| | Milwaukee, Wisconsin 53212 |
| | |
| Distributor | Quasar Distributors, LLC |
| | Three Canal Plaza |
| | Suite 100 |
| | Portland, Maine 04101 |
This report is intended for shareholders of the Fund and may not be used as sales literature unless preceded or accompanied by a current prospectus.
DP-ANNUAL
(b) Not applicable.
Item 2. Code of Ethics.
The registrant has adopted a code of ethics that applies to the registrant’s principal executive officer and principal financial officer. The registrant has not made any amendments to its code of ethics during the period covered by this report. The registrant has not granted any waivers from any provisions of the code of ethics during the period covered by this report. A copy of the registrant’s Code of Ethics is incorporated by reference to the Registrant’s Form N-CSR filed May 5, 2014.
Item 3. Audit Committee Financial Expert.
The registrant’s board of trustees has determined that there is at least one audit committee financial expert serving on its audit committee. Dr. Michael Akers is the “audit committee financial expert” and is considered to be “independent” as each term is defined in Item 3 of Form N‑CSR. Dr. Akers holds a Ph.D. in accountancy and is a professor Emeritus of accounting at Marquette University in Milwaukee, Wisconsin.
Item 4. Principal Accountant Fees and Services.
The registrant has engaged its principal accountant to perform audit services, audit-related services, tax services and other services during the past two fiscal years. “Audit services” refer to performing an audit of the registrant's annual financial statements or services that are normally provided by the accountant in connection with statutory and regulatory filings or engagements for those fiscal years. “Audit-related services” refer to the assurance and related services by the principal accountant that are reasonably related to the performance of the audit. “Tax services” refer to professional services rendered by the principal accountant for tax compliance, tax advice, and tax planning. The following table details the aggregate fees billed or expected to be billed for each of the last two fiscal years for audit fees, audit-related fees, tax fees and other fees by the principal accountant.
| | FYE 2/29/2024 | FYE 2/28/2023 |
(a) Audit Fees | $15,000 | $15,000 |
(b) Audit-Related Fees | 0 | 0 |
(c) Tax Fees | 3,000 | 3,000 |
(d) All Other Fees | 0 | 0 |
(e)(1) The audit committee has adopted pre-approval policies and procedures that require the audit committee to pre‑approve all audit and non‑audit services of the registrant, including services provided to any entity affiliated with the registrant.
(e)(2) The percentage of fees billed by Cohen & Company, Ltd. applicable to non-audit services pursuant to waiver of pre-approval requirement were as follows:
| | FYE 2/29/2024 | FYE 2/28/2023 |
Audit-Related Fees | 0% | 0% |
Tax Fees | 0% | 0% |
All Other Fees | 0% | 0% |
(f) All of the principal accountant’s hours spent on auditing the registrant’s financial statements were attributed to work performed by full‑time permanent employees of the principal accountant.
(g) The following table indicates the non-audit fees billed or expected to be billed by the registrant’s accountant for services to the registrant and to the registrant’s investment adviser (and any other controlling entity, etc.—not sub-adviser) for the last two years.
Non-Audit Related Fees | FYE 2/29/2024 | FYE 2/28/2023 |
Registrant | $0 | $0 |
Registrant’s Investment Adviser | $0 | $0 |
(h) The audit committee of the board of trustees has considered whether the provision of non-audit services that were rendered to the registrant's investment adviser is compatible with maintaining the principal accountant's independence and has concluded that the provision of such non-audit services by the accountant has not compromised the accountant’s independence.
(i) Not applicable.
(j) Not applicable.
Item 5. Audit Committee of Listed Registrants.
Not applicable to registrants who are not listed issuers (as defined in Rule 10A-3 under the Securities Exchange Act of 1934).
Item 6. Investments.
| (a) | Schedule of Investments is included as part of the report to shareholders filed under Item 1 of this Form. |
Item 7. Disclosure of Proxy Voting Policies and Procedures for Closed-End Management Investment Companies.
Not applicable to open-end investment companies.
Item 8. Portfolio Managers of Closed-End Management Investment Companies.
Not applicable to open-end investment companies.
Item 9. Purchases of Equity Securities by Closed‑End Management Investment Company and Affiliated Purchasers.
Not applicable to open-end investment companies.
Item 10. Submission of Matters to a Vote of Security Holders.
There have been no material changes to the procedures by which shareholders may recommend nominees to the registrant’s board of trustees.
Item 11. Controls and Procedures.
| (a) | The Registrant’s Principal Executive Officer and Principal Financial Officer have reviewed the Registrant's disclosure controls and procedures (as defined in Rule 30a-3(c) under the Investment Company Act of 1940 (the “Act”)) as of a date within 90 days of the filing of this report, as required by Rule 30a-3(b) under the Act and Rules 13a-15(b) or 15d‑15(b) under the Securities Exchange Act of 1934. Based on their review, such officers have concluded that the disclosure controls and procedures are effective in ensuring that information required to be disclosed in this report is appropriately recorded, processed, summarized and reported and made known to them by others within the Registrant and by the Registrant’s service provider. |
| (b) | There were no changes in the Registrant's internal control over financial reporting (as defined in Rule 30a-3(d) under the Act) that occurred during the last fiscal half-year of the period covered by this report that has materially affected, or is reasonably likely to materially affect, the Registrant's internal control over financial reporting. |
Item 12. Disclosure of Securities Lending Activities for Closed-End Management Investment Companies
Not applicable to open-end investment companies.
Item 13. Exhibits.
(3) Any written solicitation to purchase securities under Rule 23c‑1 under the Act sent or given during the period covered by the report by or on behalf of the registrant to 10 or more persons. Not applicable to open-end investment companies.
(4) Change in the registrant’s independent public accountant. There was no change in the registrant’s independent public accountant for the period covered by this report.
SIGNATURES
Pursuant to the requirements of the Securities Exchange Act of 1934 and the Investment Company Act of 1940, the registrant has duly caused this report to be signed on its behalf by the undersigned, thereunto duly authorized.
(Registrant) Trust for Professional Managers
By (Signature and Title)* /s/John Buckel
John Buckel, Principal Executive Officer
Date: 4/29/2024
Pursuant to the requirements of the Securities Exchange Act of 1934 and the Investment Company Act of 1940, this report has been signed below by the following persons on behalf of the registrant and in the capacities and on the dates indicated.
By (Signature and Title)* /s/John Buckel
John Buckel, Principal Executive Officer
Date: 4/29/2024
By (Signature and Title)* /s/Jennifer Lima
Jennifer Lima, Principal Financial Officer
Date: 4/29/2024
* Print the name and title of each signing officer under his or her signature.